
Causal modelling in randomised trials: applications and ... slides... · Causal modelling in...
55
Causal modelling in randomised trials: applications and extensions of finite mixture models Dr Richard Emsley Centre for Biostatistics, Institute of Population Health, The University of Manchester, Manchester Academic Health Science Centre MRC North West Hub for Trials Methodology Research Visiting Lecturer, Institute of Psychiatry, Psychology and Neuroscience, KCL http://www.population-health.manchester.ac.uk/staff/RichardEmsley/ [email protected] Victorian Centre for Biostatistics, Melbourne Thursday 26 th November 2015
Transcript of Causal modelling in randomised trials: applications and ... slides... · Causal modelling in...

Causal modelling in randomised trials: applications and extensions of finite
mixture models
Dr Richard Emsley
Centre for Biostatistics, Institute of Population Health,
The University of Manchester, Manchester Academic Health Science Centre
MRC North West Hub for Trials Methodology Research
Visiting Lecturer, Institute of Psychiatry, Psychology and Neuroscience, KCL
http://www.population-health.manchester.ac.uk/staff/RichardEmsley/
Victorian Centre for Biostatistics, Melbourne
Thursday 26th November 2015

Research Programme: Efficacy and Mechanisms Evaluation
Joint work with Graham Dunn, Ian White, Andrew Pickles and Sabine Landau.
Funded by Medical Research Council Methodology Research Programmes:
• Design and methods of explanatory (causal) analysis for randomised trials of complex interventions in mental health (2006-2009)
Graham Dunn (PI), Richard Emsley, et al
• Estimation of causal effects of complex interventions in longitudinal studies with intermediate variables (2009-2012)
Richard Emsley (PI), Graham Dunn.
• MRC Early Career Centenary Award (2012-13)
• Designs and analysis for the evaluation and validation of social and psychological markers in randomised trials of complex interventions in mental health (2010-12)
Graham Dunn (PI), Richard Emsley, et al.
• Developing methods for understanding mechanism in complex interventions (2013-16)
Sabine Landau (PI), Richard Emsley, et al.
• MRC NorthWest Hub for Trials Methodology Research (2013-2018)
Paula Williamson (PI), Richard Emsley, et al.

1. Does it work?
Efficacy analysis
2. How does it work?
Mediation analysis
3. Who does it work for?
Stratified/personalised medicine
4. What factors make it work better?
Process evaluation
The four key questions about treatments

• Dunn G, Emsley RA, Liu H, Landau S, Green J, White I and Pickles A. (2015). Evaluation and validation of social and psychological markers in randomised trials of complex interventions in mental health. Health Technology Assessment 19 (93).
• Non-technical introduction and summary of our work on analysing complex interventions:
Introduction to CI
Mediation analysis
Process evaluation
Longitudinal extensions
Stratified medicine
Guidance and tips for trialists
Methodology report

Contents
1. Motivating example and analysis
2. An alternative approach: principal stratification
3. Issues in finite mixture modelling
4. New longitudinal extension: principal trajectories
5. Conclusions

Motivating example: therapeutic alliance
• In psychotherapy, the therapeutic alliance is a term for a variety of therapist-client interactional and relational factors operating in the delivery of treatment, containing two factors:
the interpersonal relationship
task-related factor based on the factors of treatment.
• Clinicians and psychologists believe that therapeutic alliance is important in the context of therapy, and that a better alliance will lead to a better outcome.
This might be true but it is often wrongly used to infer that the treatment is effective or part of how treatment works.
• The big problem is that often the alliance can only be measured in the treatment arm e.g. if the control group receive no active control.

Treatment effects on outcome
• Consider a randomised controlled trial with two arms: treatment (Z=1) versus control (Z=0) and a continuous outcome Y
• Prior to randomisation to one of two competing treatment arms we can envisage two potential outcomes for each participant in the trial:
the outcome after receiving treatment, Y(Z=1)=Y(1)
the outcome after receiving the control, Y(Z=0)=Y(0)
• For a given individual, the effect of treatment is the difference:
ITE(Y)=Y(1)-Y(0)
• The average treatment effect ATE(Y) is:
E[ITE(Y)] = E[Y(1)-Y(0)]=E[Y|Z=1] – E[Y|Z=0]

• Quality of therapeutic relationship in psychotherapy
• How do we evaluate its influence on the effects of therapy?
We assume that a good alliance will lead to a good outcome; a poor alliance to a relatively poor outcome.
• But the word ’outcome’ is ambiguous.
How do we distinguish prognosis from the causal effects of therapy (treatment)?
• Does the individual treatment effect, Y(1)-Y(0), increase in magnitude with increasing alliance?
• More realistically, in a population of clients given psychotherapy, is the ATE correlated with the therapeutic alliance?
Does the therapeutic alliance influence the treatment effect?

• Ignore the control group (if there is one) and anyone else who has not received treatment.
• Ask if there is a correlation between alliance score and outcome.
• Infer that this correlation (if found) tells us something reliable about the relationship between the strength of the therapeutic alliance and the effect of therapy.
• The problem arises from ambiguity of ‘treatment outcome’. They are looking at the correlation between alliance score and Y(1).
• A client with a good prognosis is likely to be the one who is capable of developing a strong therapeutic alliance
Y(0) and alliance are likely to be correlated.
Association between Y(1) and alliance is confounded.
What question do people usually attempt to answer?

Why not predict treatment-outcome?
• Given an additive treatment effect, the outcome of treatment is:
Y(1)=Y(0) + ITE(Y)
• Now let's introduce a baseline marker, X.
• Correlate X with treatment outcome Y(1):
Corr(X,Y(1))=Corr(X,Y(0) + ITE(Y))
• A correlation can arise from two sources:
Y(0) is correlated with X (prognosis), or
ITE(Y) is correlated with X (prediction)
• If X is prognostic then you can get a correlation between Y(1) and X even when the ITE(Y) is ZERO for everyone in the study.

• Target mediators:
Some treatments target a particular intermediate variable in order to bring about change in a clinical outcome.
An explanatory analysis of a trial would seek to establish that this is indeed the case; i.e. assess the mediated path.
• Nuisance (or non-target) mediators:
Sometimes treatments are intended to improve clinical outcome in more than one way.
It is then of interest to show that there is an effect on outcome that does not operate via changing a specific intermediate variable; i.e. assess the non-mediated path.
An intermediate variable that transmits the effect but is not of interest is referred to as a “nuisance” mediator.
Mediators

• What makes these variables ‘mediators’?
We are interested in all three pathways in the diagram, and the effect decomposition:
• Requirements for mediation:
1. Aim is to estimate the size of the indirect effect, and
2. The mediator is measured in both arms.
Mediators
Random allocation to CBT
Belief flexibility
Psychosis symptoms

• Aspects involved in process of therapy that might explain differential treatment effects/effect heterogeneity.
• Therapeutic dose
Number of sessions/non-compliance
• Fidelity of therapy
How close is the therapy to that described in the treatment manual?
• Quality of therapeutic relationship
What is the strength of the therapeutic alliance?
Is there an empathic relationship?
Process variables: characteristics of therapy

• It is plausible that these may only be measured in the therapy arm of a randomised trial. For example, if the control arm has some form of treatment as usual which doesn’t contain an active ‘therapy’ on which they can be measured.
Process variables: characteristics of therapy
Treatment group
Patient engagement
in therapy
OUTCOME
Therapeutic alliance
Therapeutic empathy
Control group (TAU)
OUTCOME
Number of sessions

• Why do we say these aren’t true or nuisance mediators?
Generally interested in some other causal question, such as how do they account for heterogeneity?
Are they post-randomisation effect modifiers?
Process variables as post-randomisation effect modifiers
Random allocation
Therapeutic alliance
Outcomes

Process variables: dose response relationship
• What is the relevant question for treatment received, or number of therapy sessions?
Random allocation
Number of Sessions
Outcomes
U
U – unmeasured confounders
a b
c’=0

Contents
1. Motivating example and analysis
2. An alternative approach: principal stratification
3. Issues in finite mixture modelling
4. New longitudinal extension: principal trajectories
5. Conclusions

An alternative approach based on comparison
• Instead of using the observed value of the alliance, we consider the potential value if an individual were allocated to active treatment,
observed in the treatment arm
unobserved in the control arm.
• Known as principal stratification in the causal inference literature
• Generally, it involves classifying subjects into classes which are defined by their joint potential responses of the intermediate variable to all possible random allocations.
• These classes are known as principal strata
that they are independent of treatment allocation and can be handled in the analysis in an analogous way to pre-randomisation variables.
Frangakis C & Rubin D, Biometrics (2002); Jo B, Psych. Methods (2008).

Principal strata – compliance example
• ATE = pc*ITTc + pnc*ITTnc
• ITTnc assumed to be zero – exclusion restriction
• ITTc=ATE / pc
Treatment group
Control group
Compliers Non-compliers
Compliers Non-compliers
Class specific
ITT effects

Principal strata – therapeutic alliance example
Treatment group
Control group
High alliance class
Low alliance class
?? ??

Treatment group
Control group
High alliance class
Low alliance class
High alliance class
Low alliance class
Class specific
ITT effects
Principal strata – therapeutic alliance example

Principal stratification as a finite mixture model
• Formally this is the principal stratum direct effect, a class specific ITT effect
PSDE = E[Y(1)–Y(0)|C=c]
• We need baseline data that will strongly predict class membership, and use this to predict class membership for the control group.
This can be fitted using ML as a finite mixture model.
The treatment effect is captured by a regression of the outcome on random allocation, and is allowed to vary across latent classes C. Latent class membership is
predicted as a function of baseline covariates X.
C is categorical latent class; the interpretation of the C-Y path is that the intercept of Y can vary across classes
Example: SoCRATES summary
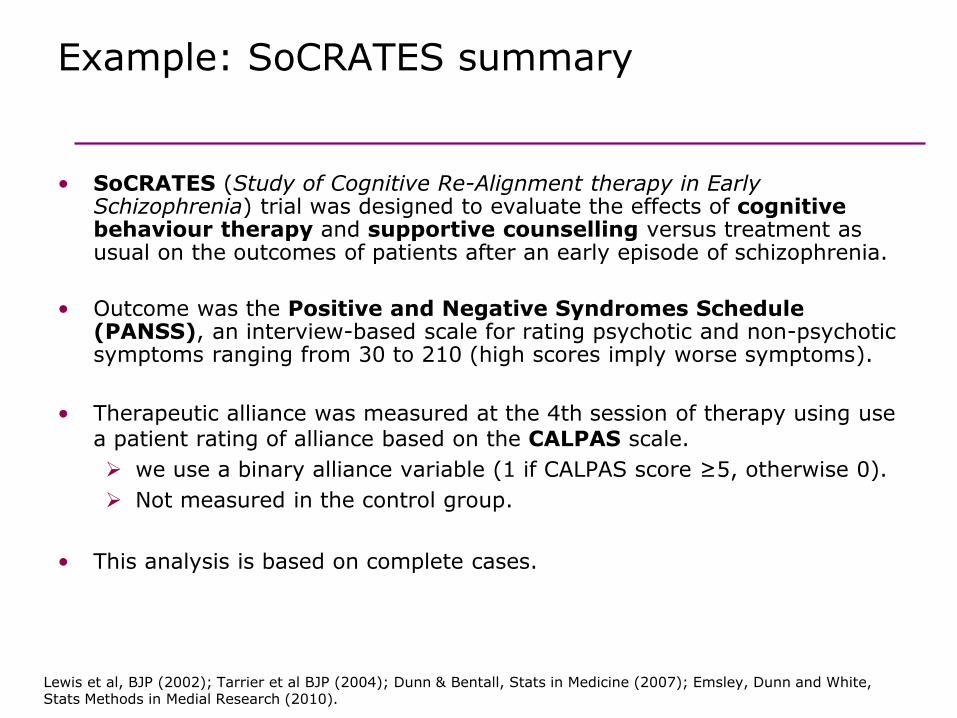
• SoCRATES (Study of Cognitive Re-Alignment therapy in Early Schizophrenia) trial was designed to evaluate the effects of cognitive behaviour therapy and supportive counselling versus treatment as usual on the outcomes of patients after an early episode of schizophrenia.
• Outcome was the Positive and Negative Syndromes Schedule (PANSS), an interview-based scale for rating psychotic and non-psychotic symptoms ranging from 30 to 210 (high scores imply worse symptoms).
• Therapeutic alliance was measured at the 4th session of therapy using use a patient rating of alliance based on the CALPAS scale.
we use a binary alliance variable (1 if CALPAS score ≥5, otherwise 0).
Not measured in the control group.
• This analysis is based on complete cases.
Lewis et al, BJP (2002); Tarrier et al BJP (2004); Dunn & Bentall, Stats in Medicine (2007); Emsley, Dunn and White, Stats Methods in Medial Research (2010).

Example: SoCRATES analysis in Mplus v6.12
• We simultaneously fit the following models using ML with the EM algorithm:
Principal strata membership on covariates • log of duration of untreated psychosis, centre, years of
education, baseline symptoms.
Outcome on randomisation and baseline outcome, allowing effect of randomisation to vary by class.
• Bootstrap the procedure to obtain valid standard error estimates.
• Missing data under MAR allowed for outcomes.
Can extend to allow missing data to depend on class membership
Known as Latent Ignorability.

Example: SoCRATES results
Estimated ITT effect on 18 month PANSS scores (high is worse)
Low alliance High alliance
Missing data ignorable (MAR) +7.50 (8.18) -15.46 (4.60)
Missing data ignorable (MAR) 0 (*) -12.73 (4.75)
Missing data latently ignorable (LI) +6.49 (7.26) -16.97 (5.95)
Missing data latently ignorable (LI) 0 (**) -13.50 (5.31)
* Zero ITT constraint in low alliance group (exclusion restriction)
** Compound exclusion restriction i.e. no ITT effect on PANSS or probability of missing value
Emsley, Dunn and White, Stats Methods in Medial Research (2010).

Example - PRP Trial: Was treatment as intended?
• We consider patient engagement in therapy procedures as a potential post randomisation effect modifier.
• Examination of recordings of therapy sessions using the
Cognitive Therapy for Psychosis Adherence Scale (CTPAS) and Cognitive Therapy Scales (CTS).
• CTPAS/CTS classification for observed data in the CBT arm:
No dose (21) Medium dose (39) Full dose (42)
• Dose not defined (missing) in TAU arm.
• A few dose assessments missing in CBT arm.
Dunn et al. (2012). The effective elements of CBT for psychosis. Psychological Medicine.

PRP Trial: PANSS outcome at 12m & 24m
PANSS 0m PANSS 12m PANSS 24m
No dose 63.0 56.4 52.3 Medium dose 66.2 60.1 58.9 Full dose 63.5 56.0 56.3 Controls 65.0 58.5 58.5 A high PANSS score implies a worse symptom outcome. This is still not very promising – high dose worse than no
dose! * Note that only about 50% of the No dose group provide outcome
data.
Dunn et al. (2012). The effective elements of CBT for psychosis. Psychological Medicine.

PRP Trial: Principal stratification
Defined as before in terms of potential response to randomisation • Statum 1: a group of participants who receive little or no therapy
whatever their treatment allocation.
• Stratum 2: a group of participants who would receive no therapy if allocated to the control condition but a medium dose of CBT if allocated to the treatment group.
• Stratum 3: a group who would receive no therapy if allocated to the control condition but a full dose of CBT if allocated to the treatment group.
• Membership of one of these three classes (the Principal Strata) is directly observable in the CBT arm but remains latent (hidden) under TAU.
• Principal stratum membership is independent of treatment allocation.
• Potentially, we can stratify by stratum membership and evaluate the ITT effects of treatment allocation within these strata.
Dunn et al. (2012). The effective elements of CBT for psychosis. Psychological Medicine.

PRP Trial: marginal ITT estimates over 12m and 24m (Mplus v6.1) Joint analysis of PANSS 12m & 24m to get common ITT estimates.
No Medium Full
Estimate 0* +5.2 (3.2) -12.7 (4.1)
Estimate 0* 0* -12.2 (4.8)
* Exclusion restriction (constraint)
With bootstrap standard errors
This assumes a Missing at Random missing data mechanism.
Dunn et al. (2012). The effective elements of CBT for psychosis. Psychological Medicine.

• Principal stratification involves classifying participants into classes which are defined by their joint potential responses of a single intermediate variable to all possible random allocations.
Usually applied with a single outcome.
• In practice, we will have repeated measures of:
Multiple outcomes
Process measure (e.g. alliance at every therapy session)
• For repeated measures of outcome, our ITT analysis might involve a random effects model for the repeated measures.
We can fit these random effects models within strata.
• For repeated measures of process measure, we extend this idea to generate principal trajectories (see later).
Further analysis models within principal strata
Frangakis and Rubin (2002), Muthén, B & Brown, H (2009).

Example: SoCRATES trial
• Instead of simply analysing the 18 month outcomes, we use the fact that the PANSS was administered
at baseline (time score 0)
6 weeks (1.94591)
3 months (2.5649493)
9 months (3.6109178)
18 months (4.3694477)
• In the analyses we log transformed the timescale measured in weeks, and exploring each trajectory suggests a quadratic trajectory slope.
Emsley, Dunn and White (2010). Pickles and Croudace (2010). Stats Methods in Medial Research

Mixture modelling
• Mixture modeling refers to modeling with categorical latent variables that represent subpopulations where population membership is not known but is inferred from the data – such as principal strata.
• The simplest longitudinal mixture model is latent class growth analysis (LCGA). In LCGA, the mixture corresponds to different latent trajectory classes. No variation across individuals is allowed within classes.
• Another longitudinal mixture model is the growth mixture model (GMM). In GMM, within class variation of individuals is allowed for the latent trajectory classes. The within-class variation is represented by random effects, that is, continuous latent variables, as in regular growth modeling.
Muthen and Muthen (2008). MPlus User’s Guide

Extension for repeated outcome measures: growth mixture model
The ε represent measurement error and time specific variation
The treatment effect is captured by a regression of the linear and quadratic slopes on random allocation, and is allowed to vary across latent classes
All random effect means are specified as varying across latent classes
I – zero time score for the slope growth factor at t=1 defines the intercept growth factor as an initial status factor
Latent class membership is predicted as a function of baseline covariates

Example: SoCRATES analysis
• Effect of Randomisation on slope by class
• Random Effect Means/Intercepts
Class Coeff SE P-value
Low (n=63) 1.808 1.644 0.271
High (n=138) -2.843 1.136 0.012
Class Factor Coeff SE
Low Intercept 90.444 3.441
Slope -17.118 2.697
Quadratic 2.269 0.460
High Intercept 87.844 1.954
Slope -11.558 1.763
Quadratic 1.784 0.309

Key assumptions and problems
• The key is finding good predictors of the process variable in therapy group:
How to select from a set of baseline covariates?
Missing data is still an issue
• The latent class membership could change depending on:
Covariates used for prediction
Final outcomes being analysed
Model being used for the analysis
• This seems unsatisfactory…
Why should alliance class depend on the analysis model?

Contents
1. Motivating example and analysis
2. An alternative approach: principal stratification
3. Issues in finite mixture modelling
4. New longitudinal extension: principal trajectories
5. Conclusions

Mixture modelling
• In mixture modelling, indicator variables are used to identify an underlying latent categorical variable.
• In practical applications we want to use the latent categorical variable for further analysis and exploring the relationship between that variable and other observed variables.
• The standard way to conduct such an analysis is to combine the latent class model and the latent class regression model or the distal outcome model into a joint model which can be estimated with the maximum-likelihood estimator.
This is the 1-step method.
• This can be flawed because the secondary model may affect the latent class formation and the latent class variable may lose its meaning as the latent variable measured by the indicator variables.

Disadvantages of the 1-step approach
1. Potentially impractical with large numbers of covariates
selection of different covariates requires re-estimation every time.
2. Model building problems
number of classes, and should this be decided before or after covariates are included.
3. Assumes classification model is built at the same stage of the study as the outcome model.
No requirement for this in our alliance examples.
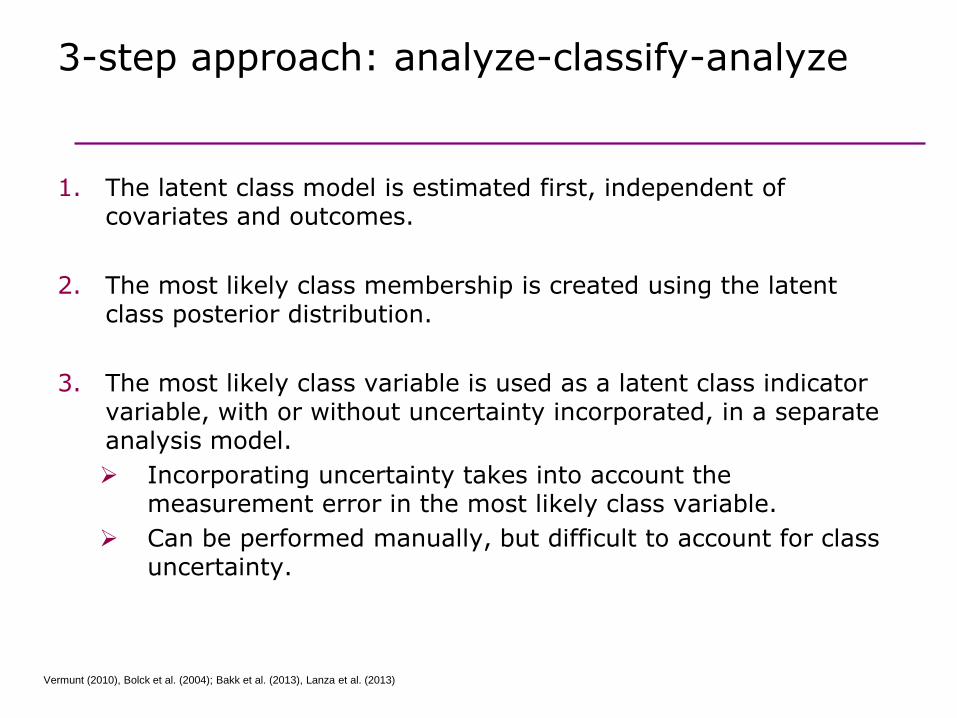
3-step approach: analyze-classify-analyze
1. The latent class model is estimated first, independent of covariates and outcomes.
2. The most likely class membership is created using the latent class posterior distribution.
3. The most likely class variable is used as a latent class indicator variable, with or without uncertainty incorporated, in a separate analysis model.
Incorporating uncertainty takes into account the measurement error in the most likely class variable.
Can be performed manually, but difficult to account for class uncertainty.
Vermunt (2010), Bolck et al. (2004); Bakk et al. (2013), Lanza et al. (2013)

3-step approach
• Previously this had to be performed manually, which was complicated.
• It has been incorporated into the latest version of Mplus (v7).
• If the class separation is good (entropy>0.6), the 3-step approach has been shown in simulation to have the same efficiency as the 1-step approach.
• Rule of thumb – based on simulations in Asparouhov and Muthen (2014)
Entropy < 0.6; use 1-step
0.6<Entropy<0.8; use 3 step
Entropy > 0.8; most likely class is fine for point estimate/SE

Example: 3-step versus 1-step in SoCRATES
Alliance class Single outcome Multiple outcomes
1-step 3-step 1-step 3-step
Low 60 36 51 50
High 110 138 150 157
Entropy 0.700 0.626 0.639 0.580
• In the model with just a final PANSS score at 18 months, there is a difference in the numbers allocated.
• There is not much difference between the 1- or 3- step in the multiple outcomes model.
• Further work needed to explore which covariates might be driving this difference in the single outcome model.

Contents
1. Motivating example and analysis
2. An alternative approach: principal stratification
3. Issues in finite mixture modelling
4. New longitudinal extension: principal trajectories
5. Conclusions

Extension for repeated process measures: principal trajectories
• We have measures of the process variable at every session of therapy attended in the treatment group.
• How can we use this extra information?
10
15
20
25
30
10
15
20
25
30
10
15
20
25
30
10
15
20
25
30
0 5 10 15 20
0 5 10 15 20 0 5 10 15 20 0 5 10 15 20
2 3 4 5
6 8 10 11
12 13 14 15
16 18 19
em
p
sessionGraphs by clientnumber

Principal trajectories
• Provided there is sufficient between-participant variability in the process measure over sessions, we could use latent class analysis to attempt to classify participants into discrete classes based on their observed trajectories.
Alliance
Sessions of therapy
Alliance
Sessions of therapy
Class 1
Class 2

Principal trajectories
• These classes are formed for the treatment group only.
• If we have baseline predictors of class membership again, we can fit a model for class membership in the treatment group, and apply this to the control group (by randomisation).
• This predicts which class the control group participants would have been in had they been in the treatment group – similar to principal stratification.
• We can then examine treatment effects within each class.

Principal trajectories
All random effect means are specified as varying across latent classes
The treatment effect is captured by a regression of the outcome on random allocation, and is allowed to vary across latent classes
Latent class membership is predicted as a function of baseline covariates

Principal trajectories: method of analysis
1. For the repeated process measures in the intervention group, examine the shape of the trajectories and assess if there is between-person variability.
2. Fit latent class models using maximum likelihood to find latent trajectory classes.
3. Assign participants in the intervention group to the most likely latent class using estimated posterior probabilities.
4. Examine predictors of class membership from baseline variables using logistic regression model.
5. Use this model to assign the control group participants to the latent class they would have been in, had they been randomised to the intervention group.
6. Examine the effect of randomisation on outcome within each class separately. An exclusion restriction can be imposed to aid identification.

PRP Example: applying principal trajectories
1. A linear mixed model (random slope and intercept) fits the observed shape of trajectories in the CBT group;
2. Forming these into latent classes indicated two distinct groups: an “always high” class, and an “improving” class. These are shown below for the first 20 sessions in the CBT group
3. 76 CBT clients were assigned to class 1 (always high), 16 assigned to class 2 (improving);

PRP Example: applying principal trajectories
4. Baseline predictors were: carer involved in treatment (yes/no), centre, depression outcome (BDI), gender, outpatient status (yes/no).
5. Total of 176 clients assigned to class 1 (always high), 46 assigned to class 2 (entropy=0.71).
6. Compare BDI scores at 12 and 24 months between CBT vs. TAU (a negative effect indicates CBT improves BDI).
Strata/class Coeff SE 95% CI
Always high 1.71 1.74 -1.70, 5.13
Improving -10.12 5.84 -21.57, 1.33

Contents
1. Motivating example and analysis
2. An alternative approach: principal stratification
3. Issues in finite mixture modelling
4. New longitudinal extension: principal trajectories
5. Conclusions

Changes in therapy delivery: Example of AVATAR therapy
• Wellcome Trust funded AVATAR trial
• Therapy is delivered through a computer interface after the client creates an AVATAR
• Open questions:
Alliance with the therapist
How does the interaction through computer influence the alliance?
Active control (supportive listening)

Better designs for psychotherapy trial: Innocuous vaccines (Follman 2008)
Outcomes
Outcomes
Treatment group
Control group
Process measure
Baseline correlate
Baseline correlate
Process measure

Conclusions
• The analysis of process measures is more complex than currently performed in the literature.
• We can use finite mixture models to appropriately answer questions about alliance and treatment effects, as an application of principal stratification.
Improper subgroups?
• We use the counterfactual notation to motivate and interpret the analysis, but the estimation is not dependent on these.
• We have taken existing methods from latent variable modelling to present extensions for repeated measures of outcome and process measures, in particular principal trajectories.
• The new 3-step procedure is conceptually more appealing in this context.

References
• Dunn G, Emsley RA, Liu H, Landau S, Green J, White I and Pickles A. (2015). Evaluation and validation of social and psychological markers in randomised trials of complex interventions in mental health. Health Technology Assessment 19(93).
• Dunn G & Bentall R. (2007), "Modelling treatment-effect heterogeneity in randomized controlled trials of complex interventions (psychological treatments)", Statistics in Medicine, vol. 26, no. 26, pp. 4719-4745.
• Emsley RA & Dunn G. (2012) Evaluation of potential mediators in randomized trials of complex interventions (psychotherapies). In: Causal Inference: Statistical perspectives and applications. Eds: Berzuini C, Dawid P & Bernardinelli, L. Wiley.
• Emsley RA, Dunn G & White IR. (2010), "Mediation and moderation of treatment effects in randomised controlled trials of complex interventions", Statistical Methods in Medical Research, vol. 19, no. 3, pp. 237-270.
• Frangakis CE & Rubin DB. (2002), "Principal stratification in causal inference", Biometrics, vol. 58, no. 1, pp. 21-29.
• Muthén, B & Brown, H (2009). Estimating drug effects in the presence of placebo response: Causal inference using growth mixture modeling. Statistics in Medicine, 28, 3363-3385.
• Pickles, A & Croudace, T (2010) Latent Mixture Models for Multivariate and Longitudinal Outcomes. Statistical Methods in Medical Research 19(3), pp271-290.

THANK YOU!


![Strategies to improve recruitment to randomised controlled trials · 2019-09-27 · [Methodology Review] Strategies to improve recruitment to randomised controlled trials Shaun Treweek1,](https://static.fdocuments.net/doc/165x107/5f9d2372a116c11b182cec9f/strategies-to-improve-recruitment-to-randomised-controlled-trials-2019-09-27-methodology.jpg)


