Simple spinels: crystallographic parameters, cation radii, lattice

Cation distribution in some natural spinels from X-ray diffraction and M6ssbauer spectroscopy
SUSANNA CARBONIN
Dipartimento di Mineralogia e Petrologia, Universith di Padova, Corso Garibaldi 37, 35122 Padua, Italy
UMBERTO RUSSO
Dipartimeuto di Chimica Inorganica, Metallorganica e Analitica, Universit~ di Padova, Via Loredan 4, 35131 Padua, Italy
AND
ANTONIO DELLA GIUSTA
Dipartimento di Mineralogia e Petrologia, Universith di Padova, Corso Garibaldi 37, 35122 Padua, Italy
Abstract
Three natural spinels of different places of occurrence and compositions were investigated by means of microprobe chemical analysis, single crystal X-ray diffraction and MOssbauer spectroscopy. All cation distributions between T and M sites were calculated from microprobe and XRD experimental data, by means of a mathematical model with appropriate assumptions. Fe 2§ and Fe 3§ assignments calculated in this way were compared with those observed in MOssbauer spectra. The satisfactory agreement found proves, at least in the samples studied, the reliability of the model and the assumptions used. In the spinels examined, such results show Fe 2§ and Fe 3§ virtually ordered in T and M sites respectively. M6ssbauer data also revealed Fe 2§ in different tetrahedral sites due to the next-nearest neighbour effect, probably as a consequence of spinel genetic conditions.
KEYWORDS: spinel, cation distribution, Mtssbauer spectroscopy, X-ray diffraction.
Introduction
CATION distribution in synthetic spinels has been investigated by several techniques: the use of conductivity in tandem with Seebeck effect in ferrospinel solid solutions enabled complete characterization of up to four cations distributed between T and M sites (Mason, 1987; Nell et al., 1989); 27A1 and 170 magic-angle spinning NMR allowed study of the temperature-dependent disorder of MgAl204 up to 1400~ (Millard et al., 1992); M6ssbauer sl~ectroscopy has been applied to determine Fe z+ and Fe 3§ distribution and the Fe3+/FetoL ratio (Bancroft et al., 1983); powder X-ray or neutron diffraction structural refinement, alone or associated with M~issbauer spectroscopy again, has been used by several
authors to determine cation distribution (e.g. O'Neill et al., 1991; Roelofsen et al., 1992; Peterson et al., 1991; O'Neill et al., 1992; Waerenborgh et al., 1994).
Comparatively little attention has been given to natural spinels, in spite of the useful information potentially supplied by their temperature-dependent intracrystalline distribution (O'Neill and Navrotsky, 1984; Ottonello, 1986). This is mainly because of difficulties in assigning major cations (e.g. Mg, A1, Fe 2§ Fe 3§ present to both tetrahedral and octahedral sites of the lattice. A further problem with natural spinels is the accurate determination of Fe 3+, which is crucial, at least in very sensitive cases (e.g. oxygen fugacity calculation; Wood and Virgo, 1989). Cation distribution determination therefore requires the combination of several complementary methods, as already done for orthopyroxenes (Skogby et al., 1992).
Mineralogical Magazine, April 1996, Vol. 60, pp. 355-368 (~) Copyright the Mineralogical Society

356 S. CARBONIN ET AL.
In this work, electron microprobe analysis, single crystal X-ray diffraction and Mrssbauer spectroscopy were all used to obtain information on cation distribution in three natural spinels.
Samples
The analysed spinels represent common composi- tions found in a large variety of rocks. Sample VASA is a greyish light-blue spinel from Kalkbro, Sweden (now in the Collezione del Museo di Mineralogia, Universita di Padua). In the Kalkbro limestone it reaches 0.5 cm in size and is associated with abundant yellowish mica, chondrodite, pale amphi- bole, and rare pyroxene and anorthite (Lindqvist, personal communication). CR5 is a chromite from the Rustemberg mine, Cape Kamari, Bushveld Complex (Toffanin, 1989). TS2 comes from a suite of websteritic dykes crossing a peridotite of mainly lherzolitic composition in the lvrea-Verbano area, Italian Western Alps (Pizzolon, 1991). This suite, named 'Al-augite suite' (Comin-Chiaramonti et al., 1982) contains spinel with low Cr content, Cr/(Cr + A1) generally being < 0.04. Very slow cooling during uplift allowed strong exsolution phenomena to take place in the associated pyroxene, so that a highly ordered distribution is to be expected in these spinels.
Electron microprobe analysis
All spinel analyses were obtained on the Cameca/ Camebax electron microprobe at the Dept. of Mineralogy and Petrology of the University of Padua, at 15 kV and 15 nA beam current, using WDS spectrometers. Synthetic oxide standards were used, and results were monitored against the standards themselves. Analyses were carried out after a check to guarantee that lm.jl~,d = 1.00 + 0.01 for each element, where Ix~.ra is the intensity of the analysed standard and Istd is the intensity of the same standard monitored after each element calibration. X- ray counts were converted into oxide weight percentages using the PAP correction program provided by Cameca. Analyses for major elements were typically accurate within 1% of the amount present and within 5% for minor elements. Results are reported in Table 1.
In order to gain understanding of sample homogeneity, analyses were performed on as many spinel crystals as possible.
From the VASA sample 13 crystals were extracted, from which a total of 67 spots were analysed. The sample showed good homogeneity, both within single grains and between grains. Composition was close to the spinel end-member, with Fe2+-Mg as the only appreciable substitution.
On the basis of stoichiometry, the amount of Fe 3§ calculated from the average of 67 analyses (0.008 a.f.u.) was virtually zero, being about equal to its standard deviation. The Fe3+/Fetot. ratio, (reported in Table 1 only for the sake of uniformity) has equally little value.
Five to ten analyses were performed on each of the twelve grains of chromite CR5, yielding a total of 71 points analysed. Homogeneity was less than that shown by VASA, mainly as far as Cr and Fe contents were concerned. In sample TS2 nearly 100 randomly chosen points were analysed on one thin section, without any bias as regards colour or size. Single grains were quite homogeneous, while the overall average composition showed quite high standard deviations for Cr203 and A1203 contents, even in the small area investigated ( ~ 2 cm2). Also the Fe3+/Fetot~ ratio, calculated from stoichiometry, ranged extensively from one point to another.
Single crystal X-ray diffraction
Experimental
Several crystals were examined for single-crystal structural refinement. Dozens of crystals from sample TS2 had to be examined to find some suitable for single-crystal data collection. Since they presented relatively larger cell parameter variations, three of them (TS2A1, TS2E1, TS2F1) were chosen as representative of these variations. As shown below, all of them have Cr content lower than that reported in Table 1, obtained from a different chip of the same hand specimen. Only one crystal was investigated in each of the other two samples (VASA1, CR5A1).
Unit cell parameters were obtained with one of the standard programs of the single-crystal STOE AED4 diffractometer with monochromatized Mo-K~ radia- tion. Twenty-two reflections in the range 8 ~ < 0 < 20 ~ were accurately centred, a step-scan through each reflection was made at positive 20 and co, and the centre of gravity was calculated. The reflection was then scanned at negative 20 and o~, and again the centre was determined. The mean of the co centres was taken as the true 0 value. Continual calibrations were performed by means of a quartz crystal and a ruby supplied by the Organizing Committee of the XII Congress of the IUC. Diffraction data were collected on a STOE AED4 diffractometer up to 20
100 ~ The o~-20 scan mode was used with peak- base widths of 20 = 2 ~ 45-step integration, 0.6 s per step counting time. Six equivalent reflections were measured and corrected for absorption and back- ground, following North et al. (1968) and Blessing et al. (1972) respectively. After correction for Lorentz and polarization effects and isotropic secondary extinction, a set of more than 170 observed structural

CATION DISTRIBUTION IN SPINELS 357
TABLE l. Microprobe data of spinels (bulk compositions) and formulae on the basis of 3 cations and 4 oxygens
VASA CR5 TS2 avg. 67 pts. St.Dev. avg. 71 pts. St.Dev. avg. 102 pts. St.Dev.
A1203 69.97 0.25 14.40 0.20 62.43 1.31 FeO 4.05 0.15 25.89 0.40 14.96 0.79 MgO 25.52 0.25 9.87 0.21 19.81 0.57 MnO 0.11 0.04 0.27 0.09 0.05 0.04 SiOz 0.04 0.02 0.04 0.02 0.10 0.04 ZnO 0.36 0.09 0.10 0.07 n.a. n.a. Cr203 0.02 0.02 48.50 0.48 2.48 1.12 NiO 0.02 0.03 0.11 0.05 0.34 0.06 TiO2 0.01 0.01 0.61 0.09 0.03 0.03
Total 100.09 99.79 100.20
A1 1.990 0.007 0.550 0.007 1.870 0.026 Fe z+ 0.074 0.006 0.527 0.010 0.244 0.016 Fe 3§ 0.008 0.007 0.175 0.009 0.074 0.009 Mg 0.918 0.007 0.477 0.009 0.751 0.016 Mn 0.002 0.001 0.007 0.002 0.001 0.001 Si 0.001 0�9 0.001 0.001 0.002 0.001 Zn 0.006 0.002 0.002 0.002 n.a. n.a. Cr 0.000 0.000 1.243 0.012 0.050 0.023 Ni 0.000 0.001 0.003 0.001 0.007 0.001 Ti 0.000 0.000 0.015 0.002 0.001 0.001
Total 3.000 3.000 3.000
Fe3+/Fetot.avg. 0.092 0.079 0.249 0.011 0.232 0.026 Fe3+/Fetot.min. 0.1300 0.217 0.164 Fe3§ 0.28l 0.272 0.293
Ratios in bottom rows calculated directly from microprobe data, with more decimal figures than shown above.
factors FOhkl w a s obtained from each crystal (Table 2).
Crystal structure refinement
Structural refinements were performed in the Fd3m space group, since no evidence of different symmetry appeared, The refined parameters were: scale factor, secondary extinction coefficient (Ext. coeff.), oxygen coordinate u, tetrahedral and octahedral site occu- pancies, displacement parameters U. Two scattering curves, Mg vs. Fe in the T site and A1 vs. Cr or Fe (for CR5 and TS2, respectively) in the M site, were assigned to sites involved in isomorphous replace- ments, with the constraint of full site occupancy and equal displacement parameters. No constraint from chemical analyses was imposed.
Calculations executed against Foh~ turned out to be rather unstable, and dependent on the r threshold used. Consequently, structural refinements were performed
�9 2 against Fo~kt using the SHELX-93 program (Sheldrick, 1993)�9 Recovering all information from the relatively large number of weak reflections, stable refinements were obtained and all correlations involving site occupancies disappeared, allowing simultaneous mini- mization of all structural parameters. Site occupancies only depended slightly on the ionization level of the oxygen scattering curve, while the cation ionization level was irrelevant except in sample CR5A 1, in which it showed a sfight influence�9
Refinements of all crystals were repeated system- atically, changing the scattering curves to obtain the best values of all conventional agreement factors over all sin0/~, intervals.
The best results were obtained with neutral cations and 0 -14 in samples VASAI and TS2, although CR5AI, with large amounts of Fe and Cr, required fully ionized cations and 0 -1"6 . The best result in VASA1 was obtained by assigning only A1 to the M site and by changing its occupancy factor.
358 S. CARBONIN ET AL.
TABLE 2. Crystallographic data of spinels
VASA1 CR5A1 TS2A1 TS2E1 TS2F1
a (,~) 8.0930(3) 8.3017(5) 8.1104(5) 8.1081(5) 8.1122(4) u* 0.26353(6) 0 . 2 6 2 7 4 ( 1 2 ) 0 . 2 6 3 6 2 ( 7 ) 0 . 2 6 3 6 3 ( 5 ) 0.26359(6) 20 max.(~ 106 100 104 105 105 Raa 0.0288 0.0305 0.0301 0.0203 0.0292 Rat t 0.0326 0.0346 0.0318 0.0230 0.0300 N4a(N,u) 169(184) 153(174) 172(180) 168(181) 173(182) Ext. coeff. 0.01994 0.02991 0.00916 0.00403 0.01188 UII(OX) 0.00694(14) 0 . 0 0 9 6 4 ( 3 1 ) 0 . 0 0 8 6 5 ( 1 6 ) 0 . 0 0 7 5 4 ( 1 2 ) 0.00915(15) U~z(Ox) -0.00016(10) -0.00082(22) -0.00035(12) -0.00033(10) -0.00024(11) Ueq(Ox) 0.00694(14) 0 . 0 0 9 6 4 ( 3 1 ) 0 , 0 0 8 6 5 ( 1 6 ) 0 . 0 0 7 5 4 ( 1 2 ) 0.00915(15) U~l(M) 0.00607(13) 0 . 0 0 7 7 5 ( 1 6 ) 0 . 0 0 7 3 5 ( 1 6 ) 0 . 0 0 6 2 2 ( 1 3 ) 0.00757(16) U~2(M) -0.00040(7) -0.00038(7) -0,00034(8) -0.00026(6) -0.00041(7) Ueq(M ) 0.00607(13) 0 . 0 0 7 7 5 ( 1 6 ) 0 . 0 0 7 3 5 ( 1 6 ) 0 . 0 0 6 2 2 ( 1 3 ) 0.00757(16) Uj 1 (T) 0.00714(22) 0 . 0 1 0 0 6 ( 2 7 ) 0 . 0 0 8 5 8 ( 2 1 ) 0.00763(16) 0.00883 (20) Occ.(M) 0.998(4) 0.268(18) 0.971 (4) 0.972(3) 0.966(4) e(M) 12.97(5) 21.05(37) 13.38(6) 13.36(4) 13.43(6) Occ.(T) 0.909(7) 0.485(16) 0.767(8) 0.764(6) 0.767(8) e(T) 13.28(9) 19.21 (32) 15.26(14) 15.31 (10) 15.27(12) 2.e(M) + e(T) 39.22 61.31 42.02 42.03 42.13
* u oxygen positional parameter referred to origin at point 3m R4a; residual index for reflections > 4t~; R,n: residual index for all reflections; N4o: reflections > 4(~; Nail: total number of observed reflections; Uij: displacement parameters; Ueq: equivalent isotropic displacement parameter; Occ.(M), Occ.(T): occupancies in octahedral and tetrahedral sites, respectively (see text); e(M), e(T): electrons in octahedral and tetrahedral sites, respectively.
Table 2 shows crystallographic data obtained. Residual R factors are calculated using FOhk l instead of 2 FOhkl, for comparison with conventional refinements.
Microprobe analysis on XRD crystals
After data collection, as many analyses as possible were performed on the polished surface of the same single crystal used for the XRD study, in order to obtain the best representative composition of the whole crystal volume. Results are shown in Table 3.
It is noteworthy that, as no chemical constraint from the microprobe data was used during refine- ments, the agreement between electrons from microprobe and X-ray structure refinement (Tables 2 and 3) was very satisfactory, the difference always being ~0.15.
Concerning TS2, the three crystals selected show that the variability of this sample is still wider than reported in Table 1. However, the differences outlined by microprobe are fully consistent with cell edge variations, that is, a greater a value is related to the relatively higher content of cations of
larger size (Fe 2+ and Cr). The three crystals examined also show a significant difference in the Fe3+/Fetot. ratio, confirming the variability previously found.
Cation distribution from microprobe and XRD data
Cation distribution between T and M sites was obtained through a minimization program taking into account both X-ray diffraction data and microp- robe analyses.
Spinel structure is defined by only two cation-to- oxygen distances, T - O and M-O, which are related to cell parameter a and to oxygen coordinate u by equations:
8 [5(T-O)+~/33(M-O)2-8(T-O)2] (1)
0.75R - 2 + ~ / ~ / t - O . 5 T -
6(R- i)
where R = (M-O)21(T-O) 2 (Hafner, 1960).
(2)

CATION DISTRIBUTION IN SP1NELS 359
0
o
.o
m
O~
C~
0 0 ~ 0 0 0 0 0 0 0 ~ 0 0 0 0 0 0 0 0
~eeeeeeee
~de, l d d ~ d d ~ d r , . - . ; d d d d d d d ~ d ~ dt- , i
�9 o o 0 o 0 o 0 o 0 d d o d d d d o d d
~ ~ ~ 0 ~ 0 0
o ~ o o ~ o o o ~ ~oooooo~oo ~
0000~00~ ~ ~+ ~+ "~
o~ ~y -
~.)
0
0
".~, 0
~S
360 S. CARBONIN ET AL.
Assuming a linear contribution of each cation in a site to the relative bond distance, T - O and M - O can be expressed a s ~ i X i R T or M, i where X i and RT or M, i
are cation fractions and bond distances respectively. So substitution of these expressions in Equations 1 and 2 gives a and u as functions of Xi, once the sizes of the cations involved are known.
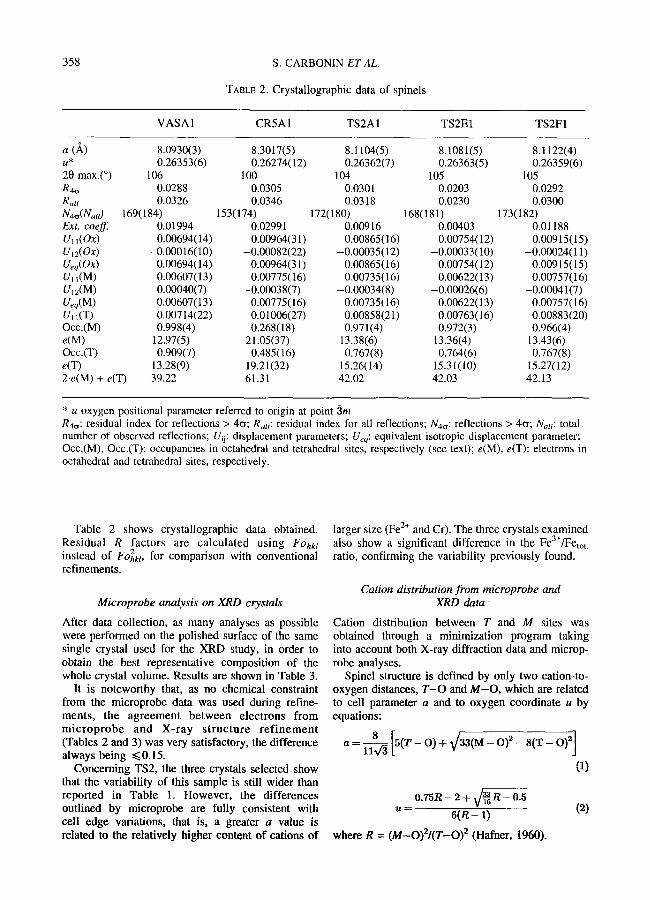
The values of RT, i and RM, i used are reported in Table 4. These values were obtained by the best fit of about 100 lattice parameters of spinels containing the quoted cations (Della Giusta et al., 1996). The following assumptions were made about cation distribution in our spinels: (a) Mg, A1, Fe 2§ Fe 3+ can occupy both T and M sites; (b) Cr occupies only the M site; (c) minor cations are assigned only to one site on the basis of their general site preference (i.e. Si n+, Mn 2+ and Zn to the T site; Ni 2+ and Ti 4+ to the M site).
Minimization was performed by means of the MINUIT program (Cern Computer Centre, Geneva) which finds the values of parameters corresponding to the minimum of a specific function. The minimized function was:
j = l O'j )
where Oj is a quantity observed, Cj(Xi) the same quantity calculated by means of parameters Xi and crj the standard deviation of the observed quantity. The 18 quantities were: a, u, e(M), e(T), number of cations both per formula unit and in T and M sites (3, 1 and 2 respectively), number of charges for the balance, atomic proportions from microprobe analysis. The Xi parameters chosen were the 14 cation fractions in the two sites.
In the minimization: (a) all parameters were allowed to vary; (b) the starting value was set at 1/2 cation fraction per formula unit in each site, for species possibly in both T and M sites (i.e. disordered), and equal to the cation fraction, for species assigned only to one site; (c) the starting step was set at the starting value or at 2'standard deviations, depending on whether cations were distributed in both sites or only in one; (d) no constraints were imposed for minima and maxima.
Typical runs gave an error sum of squares (ESS) of ~ 1, each difference between Oj and Cs(Xi) being ~0.2.~j.
For minimization, the average between point analyses was used for VASA1, CR5AI, TS2A1 and TS2F1. Using the average gave unsatisfactory results for TS2E1. This was attributed to a higher Fe3+/Fetot. ratio (0.25) in comparison with both the M6ssbauer measurements and the overall average of the probed sample. This anomalous ratio was probably due to the zoned bands optically evident in the polished surface of the crystal, which may have influenced the average composition in unknown proportions. For this reason, the lower Fe3+/Fetot. point analysis was tentatively chosen as the best representative of the whole crystal.
Table 5 shows the cation distribution obtained. Not surprisingly, the sum of the residuals was lower in CR5A1 and TS2F1, whose compositions, averaged on many point analyses, are therefore truly representative of the whole crystal volume consid- ered in the XRD study. VASA1 showed highly ordered cation distribution, with almost all divalent iron (Fe 3§ is virtually absent) in the T site. The number of electrons observed in the M site (12.97) had already indicated little Fe. Mg and A1 were also highly ordered, with ~0.12 Mg atoms in the M site and an equal amount of A1 in the T site. CR5AI also showed good ordering, with Fe 2§ and Fe 3§ in T and M sites respectively, and AI only in M site. This suggests that Mg and A1 too, if present only in moderate quantities, reside dominantly in T and M sites respectively. A similar distribution of Fe atoms had already been found in chromites from the Bushveld complex (Osborne et al., 1981). TS2 crystals also show good ordering in the distribution, Fe 2§ being in the T site, Fe 3§ in the M site, and A1 and Mg as in VASA1.
The minimum of function (3) is very sharp in VASA1 and CR5A1, but rather flat in TS2. This is because, in the former samples, there is one more constraint about cations involved in intracrystalline exchange (Fe 3+ ~ 0 in VASA1 and A1 confined to the M site in CR5A1). So just one configuration is strongly preferred. Instead, in TS2 all four major cations can occupy both sites and different distribu- tions can give similar values for function (3). In this case, moreover, the set of distances used is crucial:
TABLE 4. Radii RT and RM (A) used in this work
Mg Fe 2+ Fe 3+ A1 Mn Si Zn Cr Ni Ti
T site 1.965 1.996 1.891 1.767 2.040 1.652 1.966 M site 2.095 2.138 2.020 1.909 1.996 2.076 1.985

,...,
O .=
.~=
,.d t~
C A T I O N D I S T R I B U T I O N IN SPINELS
( ~ e,I
o o
0 0 0 0
o o d d o d d d d o o d d d d
o ~
o. o o o .
o o o
0 0 ~ o. o o o . 0
Q 0 0 0 0 o. o o o .
0 0 0
�9 o o ~ . o
�9 o o ~ .
o ~
361

362 S. CARBONIN ET AL.
O'Neill and Navrotsky's set (1983), for example, would predict Fe 3+ completely in the T site. So the calculated Fe 3+ distribution, i f confirmed by M6ssbauer spectroscopy, allows us to discriminate between different sets of bond lengths.
M 6 s s b a u e r s p e c t r o s c o p y
Sample preparation
Sample VASA did not require particular separation because of the quite large size of its crystals. Sample CR5 at our disposal was already a highly purified concentrate. TS2 spinels were prepared by crushing about 10 g of websterite and retaining two size fractions, one > 125 and < 180, the other > 90 and < 125 lam. Spinels were initially concentrated by passing them twice through a Frantz magnetic separator, and further concentration was achieved by heavy liquid separation. Next, spinels were hand- picked to yield 70 mg of maximum purity concentrates. All three samples were finally crushed and sieved until they passed through a 90-I, tm aperture sieve. CR5 and TS2 separates were examined by powder X-ray diffraction and no other phases were detected.
Experimental
Materials were suspended in vaseline, wrapped in thin plastic foil, and inserted in a variable- temperature helium cryostat. About 80 mg of the VASA spinel were used in the absorber preparation, 70 for TS2 and 45 for CR5. According to the analytical results, these quantities correspond to 2.5 mg of total iron in the VASA sample and 12 mg in both TS2 and CR5. All spectra were obtained at room temperature (R.T.) and at 80.0 K in a conventional constant acceleration spectrometer using a rhodium matrix cobalt-57 source (nominal strength 50 mCi) at R.T. The spectrometer was calibrated using natural iron foil at R.T.. Mirror-symmetric spectra were accumulated in a 512 channel analyser, folded, and fitted to pure Lorentzian shapes with the aid of a least-squares fitting program. Peak areas and widths for each quadrupole split doublet were constrained to remain equal, as no preferred orientation is expected for spinels. Computer fits were evaluated by internal consistency across each set of measurements, 22 , and MISFIT parameters (Ruby, 1973).
The three spinels showed M6ssbauer spectra which were rather different from each other and strongly dependent on temperature. They were fi t ted following a few simple hypotheses. It is well known that, on lowering the temperature, the �9 3+ isomer shift values for both Fe 2+ and Fe increase slightly as a consequence of the second-order
Doppler shift. However, while quadrupole splitting of Fe 3+ compounds (mainly due to the lattice component) remains virtually constant, it increases - sometimes quite strongly - in Fe 2+ components because of the progressive localization of the '6th' d electron on low-lying orbitals. Moreover, a nested doublet configuration, in which the various compo- nents have similar ~5 and different AEQ values, is always preferred, as it produces fits with reasonable values, in every case failing in the expected ranges.
The VASA spinel gave by far the simplest spectra (Fig. 1), which could easily be fitted to two components due to two different Fe z+ species. Spectra at intermediate temperatures were collected to clarify the unexpected temperature dependence of the isomer shift and area ratio�9
CR5 spinel produced spectra (Fig. 2) similar to those already reported for lherzolite and Cr-bearing spinels (Wood and Virgo, 1989; Mitra et al., 1991; Osborne et al., 1981). In the R.T. spectrum, three well-resolved absorption peaks were evident; more- over, the high-velocity peak clearly derived from the overlap of two smaller ones. However, a fit to only two Fe z+ components produced unrealistic results. In any case the microprobe data require the presence of an Fe 3+ component. At this point, it was straightfor- ward to fit the spectrum to three components, with satisfactory values for the 22 and MISFIT para- meters. The low-temperature spectrum was some- what clearer and easier to interpret. As a result of the displacement of the two peaks of each Fe z+ doublet toward higher and lower velocities, the high-velocity component of the Fe 3+ quadrupole split doublet was almost completely resolved. The spectrum was thus satisfactorily fitted to an Fe 3+ doublet with the same AEQ as in the R.T. spectrum and to two nested Fe z+ doublets with ~5 values slightly increased due to second-order Doppler effects and much larger AEQ.
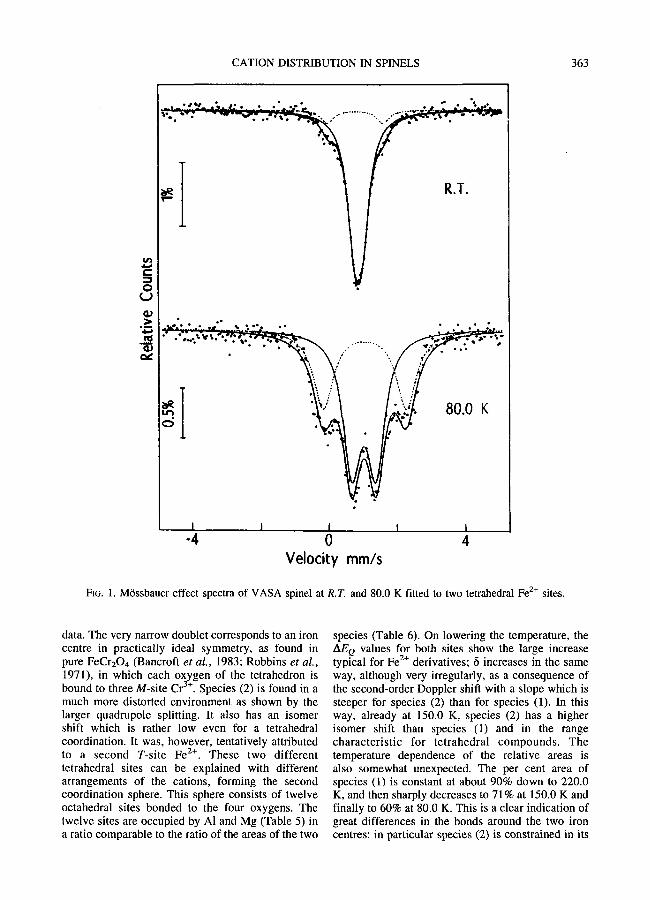
The TS2 spectra were much more intriguing (Fig. 3). Five different peaks were evident in the 80.0 K spectrum, which also showed a shoulder to the left of the high-velocity peak, while the R.T. spectrum showed three broad absorptions. Attempts to obtain good fits with one Fe 3+ and two Fe z+ doublets as in the CR5 case failed, giving too high residuals. As a consequence, a third Fe 2+ component was added and reasonable parameters were thus obtained for both spectra. Results are reported in Table 6.
Results and discussion
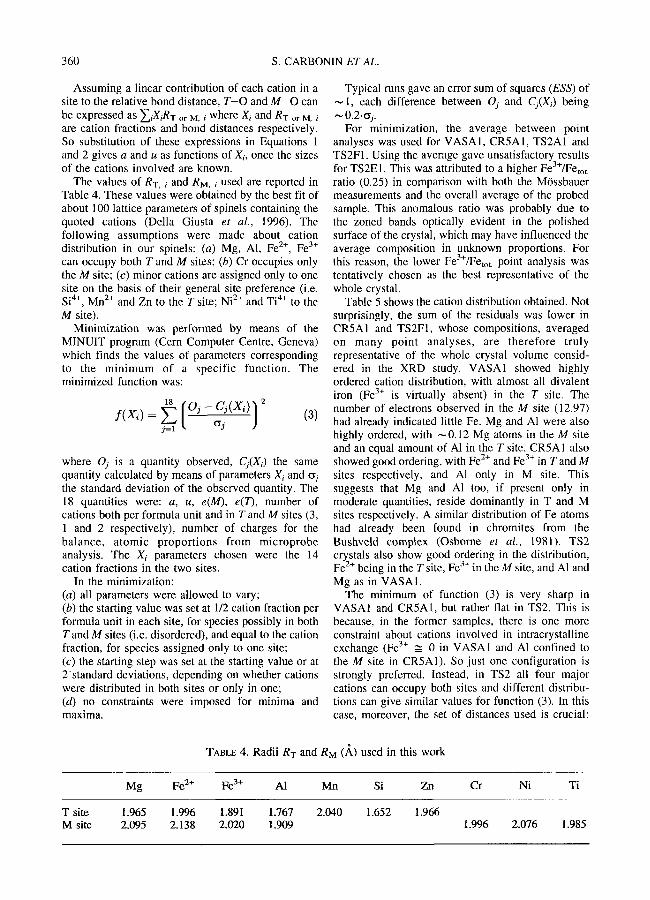
The R.T. spectrum of the VASA sample shows two different F e 2+ species. Species (1), which dominates the spectral area, is attributable to an Fe z+ component in a tetrahedral coordination geometry, in good agreement with the value given by the XRD
CATION DISTRIBUTION IN SPINELS 363
R.T.
*e �9 ~176 �9 �9 �9 �9 �9
I I I I I -4 0 4
Velocity mm/s
FIG. 1. Mtissbauer effect spectra of VASA spinel at R.T. and 80.0 K fitted to two tetrahedral Fe 2+ sites.
data. The very narrow doublet corresponds to an iron centre in practically ideal symmetry, as found in pure FeCr204 (Bancroft et al., 1983; Robbins et al., 1971), in which each oxygen of the tetrahedron is
3+ bound to three M-site Cr . Species (2) is found in a much more distorted environment as shown by the larger quadrupole splitting. It also has an isomer shift which is rather low even for a tetrahedral coordination. It was, however, tentatively attributed to a second T-site Fe E+. These two different tetrahedral sites can be explained with different arrangements of the cations, forming the second coordination sphere. This sphere consists of twelve octahedral sites bonded to the four oxygens. The twelve sites are occupied by Al and Mg (Table 5) in a ratio comparable to the ratio of the areas of the two
species (Table 6). On lowering the temperature, the AEQ values for both sites show the large increase
2+ typical for Fe derivatives; 15 increases in the same way, although very irregularly, as a consequence of the second-order Doppler shift with a slope which is steeper for species (2) than for species (1). In this way, already at 150.0 K, species (2) has a higher isomer shift than species (1) and in the range characteristic for tetrahedral compounds. The temperature dependence of the relative areas i s also somewhat unexpected. The per cent area of species (1) is constant at about 90% down to 220.0 K, and then sharply decreases to 71% at 150.0 K and finally to 60% at 80.0 K. This is a clear indication of great differences in the bonds around the two iron centres: in particular species (2) is constrained in its

364 S. CARBONIN ET AL.
3 a,)
�9 , ~ ~ s � 9 * �9 �9
�9 .--~, ~-: ". . " : . " . �9 �9 �9 ...
�9 " -:'~..* ..o s. ~...... . . . . �9 ................. .... �9 . . . . .
1 I I I _ 1
-4 0 4 Velocity mm/s
FIG. 2. M6ssbauer effect spectra of CR5 spinel at R.T. and 80.0 K fitted to one octahedral Fe 3+ site and two tetrahedral Fe z+ sites.
position much less rigidly than that species (1). The bonds around the iron centre probably become longer with increasing temperature: in this way, the strange decrease of both relative area and isomer shift is explained.
The fitted spectra of both TS2 and CR5 include a single Fe 3+ doublet, with the high-velocity peak partly resolved in the 80.0 K spectra. The isomer shift value of this peak was too high to be considered a singlet, and so a second peak must be hidden inside the low-veloci ty absorpt ion to give rise to a symmetric doublet; the narrow linewidth of this doublet excludes the presence of other Fe 3+ species. The fi value for this doublet was indicative of octahedral coordination, and any attempt to fit this c o m p o n e n t to te t rahedra l values failed. The
remaining part of the spectrum is much more complex and ambiguous, and only a tentat ive interpretation can be given.
The CR5 spectra can reasonably be fitted to two doublets due to Fe z+ species with tetrahedral coordination geometry. These two sites, present in an approximate 2:1 ratio, show different distortion, most probably due to the next-nearest neighbour effect, The oxygens of the tetrahedra are probably surrounded by different cations in amounts propor- tional to their molar fractions. In this way, while the Fe 3§ octahedral site seems to be surrounded by essentially similar octahedra and tetrahedra, the second coordination sphere of the Fe 2§ tetrahedral sites is more disordered, as at least a second metal seems to be present.

CATION DISTRIBUTION IN SPINELS 365
r
0
el)
.=
r R.I.
. . . . .
1 I I I. I
-4 0 4 Velocity mm/s
FIG. 3. M6ssbauer effect spectra of TS2 spinel at R.T, and 80.0 K fitted to one octahedral Fe 3+ site and three tetrahedral Fe z+ sites.
As the TS2 spectra cannot be fitted to only two Fe z+ components, a third species is required. This species, absent in the CR5 spectrum, is characterized by very small quadmpole splitting, 0.50 mm/s, and may be attributed to an iron atom in a nearly cubic symmetry that requires the presence of only one type of atoms - - AI in this case - - in the second coordination sphere. This situation is not possible in the CR5 spinel, because of its different composition, As a consequence, the parameters obtained for the three Fe z+ species are less reliable than expected, especially the relative areas. In any case, tetrahedral coordination geometry for all of them is strongly suggested. The environment of the Fe 3+ site is much
more disordered than in the case of CR5, as indicated by the higher AEQ values. This is consistent with a larger number of possible cation distributions in the second coordination sphere of Fe 3+, composed of six T and six M sites. In this case, the T site contains three cations in large amounts (see Table 5), while only two are present in CR5.
D i s c u s s i o n
In order to compare the results obtained by means of the three techniques adopted in this work, it should be recalled that M6ssbauer spectroscopy requires large amounts of separated crystals and XRD only a

366 S. CARBONIN ET AL.
TABLE 6. M6ssbauer effect spectral parameters
Sample T ~ AEQ I" A Assignment K mm/s mm/s mm/s %
VASA R.T. 0.89 0.22 0,53 90 Fe2+(T) (1) 0.79 1.65 0,42 10 Fe2+(T) (2)
220.0 0.89 0.27 0.67 89 Fe2+(T) (1) 0.86 1.93 0.40 11 Fe2+(T) (2)
150.0 0.92 0.46 0.61 71 Fe2+(T) (1) 0.94 2.07 0.70 29 Fe2+(T) (2)
80.0 1.03 0.71 0.63 60 FeZ+(T) (1) 1.06 2.44 0.72 40 Fe2+(T) (2)
CR5 R.T. 0.38 0.50 0.25 25 Fe3+(M) 0.94 1.00 0.50 50 Fe2+(T) (1) 0.90 1.76 0.36 25 FeZ§ (2)
80.0 0.45 0.49 0.32 26 Fe3§ 0.99 2.23 0.62 46 FeZ§ (1) 1.01 2,80 0.29 28 Fe2+(T) (2)
TS2 R.T. 0.34 0.85 0.24 17 Fe3+(M) 0.89 0,50 0.35 25 Fe2+(T) (1) 0.91 1.03 0.47 41 Fe2+(T) (2) 0.92 1,64 0.42 17 Fe2+(T) (3)
80.0 0.37 0.87 0.35 18 Fe3+(M) 1.01 1.11 0.52 19 Fe2+(T) (1) 1.04 1.96 0.47 34 FeZ+(T) (2) 1.00 2.70 0.32 29 Fe/+(T) (3)
single fragment, while microprobe analyses can be performed on many crystals and many spots of a single crystal. In the case of significant sample heterogeneity, as in ours, it is essential to exert great caution in ascertaining which analysis can best represent the sample.
The quantities to be compared are: (a) the Fe3+/Fetot. ratio, observed in M6ssbauer spectra and calculated from microprobe analyses averaged on many crystals; (b) the Fe z+, Fe 3+ site populations measured in M6ssbauer and calculated from XRD plus microprobe data on a single crystal.
Comparison (a) can be done by looking at Tables 1 (bottom rows) and 6. If the ratios are considered together with their errors, the agreement in CR5 sample is very close; in VASA and TS2 it is quite satisfactory, bearing the previous observations in mind. Fe 3+ calculated by stoichiometry from microp- robe analyses seems to be slightly overestimated. This, at least in part in sample TS2, is due to the presence of a few hematite lamellae (< 1 p.m thick) in some fragments. This presence is not detectable either by XRD or M6ssbauer, but is apparent under the microscope and is responsible for contamination of the spinel sample, leading to an excess of iron atoms.
Such results therefore suggest that, unlike Wood and Virgo (1989) and Dyar et al. (1989), sufficient accuracy can also be achieved by means of micro- probe, provided that analyses are performed on adequate populations and carefully prepared grain mounts after suitable calibration.
Comparison (b) is summarized in Table 7, in which data from R.T. MOssbauer spectra are reported because percent areas of Fe 3+ and total Fe z+ are not significantly affected by temperature. M6ssbauer results were corrected taking into account the ratio between the recoil-free fractions of T and M sites. Various values for this ratio have been published with the aim of taking into account the different bonds in the two cases. All of them are slightly lower than 1 at R.T. and do not affect the results significantly. The value used here was 0.94 (Sawatzky et al., 1969). The agreement between experimental evidence and calculated distributions for Fe z+, Fe 3§ shows the substantial correctness of the model used in the minimization process, particularly for the set of bond distances employed, and consequently of the overall site populations. Moreover, both M6ssbauer and XRD indicate strong ordering of Fe z+ in the T site and Fe 3+ in the M site in these samples. It is noteworthy that there is

CATION DISTRIBUTION IN SPINELS 367
TABLE 7. Comparison of Fe percent distribution between Mtissbauer spectroscopy, taking into account recoil-free fraction differences of T and M sites (see text), at R.T. (observed) and XRD plus microprobe results (calculated), relative to Fetot.
Fe2+(T) Fe2+(M) Fe3+(T) Fe3+(M) Fe3+(T+M)
VASA obs. 100 0 0 0 0 VASA1 calc. 95.9 1.7 0.0 2.4 2.4
CR5 obs. 73 0 0 27 27 CR5A1 calc. 71.5 1.9 0.6 26.0 26.6
TS2 obs. 82 0 0 18 18 TS2A 1 calc. 78.2 1.1 0.0 20.6 20.6
TS2E1 calc. 80.2 0.0 0.4 19.4 19.8 TS2F1 calc. 78.9 0.8 0.0 20.3 20.3
better agreement here between Fe3+/Femt. ratios than in comparison (a). In the case of TS2, this is probably due to the fewer inclusions or hematite lamellae in the crystals chosen for the XRD study than in the bulk analyses.
M6ssbauer spectroscopy is extremely sensitive to small variations in electron density at the iron nucleus, due to different electronic and structural environments. It does not average the various situations, as in the case of XRD, but it does sum the various contributions that can be extracted from the overall spectrum. In this way it is possible, for these spinels at least, to detect the presence of different coordination tetrahedI:a around the Fe z+ centres, attributable to the next-nearest neighbour effect. The existence of various iron sites may well be the consequence of the conditions in which these materials formed. Thus, relatively slow cooling and the presence of a large variety of cations with similar solubility should favour the formation of numerous coordinat ion geometries, clearly detected in Mtissbauer spectra.
Acknowledgements
The authors have greatly benefited by advice and comments of Piergiorgio Jobstraibizer, Pietro Frizzo, and Enzo M. Piccirillo during the preparation of this work. Thanks are due to Gabriella Demarchi and Piero Comin-Chiaramonti for providing TS2 sample. Bengt Lindqvist (Swedish Museum of Natural History) kindly informed us of place of origin of VASA sample. S. C. thanks in particular her husband for great help. Raoul Carampin kindly assisted in the microanalysis. The authors also gratefully acknowl- edge the financial support of the Italian Consiglio
Nazionale delle Ricerche (CNR Centro di Studio per la Geodinamica Alpina, Padova) and the Ministero del l 'Univers i t~ e della Ricerca Scientifica e Tecnologica.
References
Bancroft, G.M., Osborne, M.D. and Fleet, M.E. (1983) Next-nearest neighbour effects in the M~Sssbauer spectra of Cr-spinels: an application of partial quadrupole splittings. Solid State Comm., 47, 623-5.
Blessing, R.H., Coppens, P. and Becker, P. (1972) Computer analysis of step-scanned X-ray data. J. Appl. CrystaUogr., 7, 488-92.
Comin-Chiaramonti, P., Demarchi, G., Siena, F. and Sinigoi, S. (1982) Relazioni tra fusione e deforma- zione nella peridotite di Balmuccia (Ivrea-Verbano). Rend. Soc. ltaL Mineral. Petrol., 38, 685-700.
Della Giusta, A., Carbonin, S. and Ottonello, G. (1996) Temperature-dependent disorder in natural Mg-AI- Fe2§ 3+ spinel. Mineral. Mag., in press.
Dyar, M.D., McGuire, A.V. and Ziegler, R.D. (1989) Redox equilibria and crystal chemistry of coexisting minerals from spinel lherzolite mantle xenoliths. Amer. Mineral., 74, 969-80.
Hafner, S. (1960) Metalloxyde mit Spinellstruktur. Schweiz. Mineral. Petrol. Mitt., 40, 208-40.
Mason, T.O. (1987) Cation intersite distributions in iron- bearing minerals via electrical conductivity/Seebeck effect. Phys. Chem. Minerals, 14, 156-62.
Millard, R.L., Peterson, R.C. and Hunter, B.K. (1992) Temperature dependence of cation disorder in MgA1204 spinel using 27A1 and 170 magic-angle spinning NMR. Amer. Mineral., 77, 44-52.
Mitra, S., Pal, T. and Pal, T. (1991) Petrogenetic implication of the M6ssbauer hyperfine parameters
368 S. CARBONIN ET AL.
of Fe3+-chromites from Sukinda (India). Mineral. Mag., 55, 535-42.
Nell, J., Wood, B.J. and Mason, T.O. (1989) High temperature cation distributions in Fe3Oa-MgA1204- MgFe2Oa-FeAI204 spinels from thermopower and conductivity measurements. Amer. Mineral., 74, 339-51.
North, A.C.T., Phillips, D.C. and Scott-Mattews, F. (1968) A semi-empirical method of absorption correction, Acta Crystallogr., A24, 351-2.
O'Neill, H.St.C. and Navrotsky, A. (1983) Simple spinels: crystallographic parameters, cation radii, lattice energies, and cation distribution. Amer. Mineral., 68, 181-94.
O'Neill, H.St.C. and Navrotsky, A. (1984) Cation distributions and thermodynamic properties of binary spinel solid solutions. Amer. Mineral., 69, 733-53.
O'Neill, H.St.C., Dollase, W.A. and Ross, C.R.II (1991) Temperature dependence of the cation distribution in Nickel Aluminate (NiAlzO4) spinel: a powder XRD study. Phys. Chem. Minerals, 18, 302-19.
O'Neill, H.St.C., Annersten, H. and Virgo, D. (1992) The temperature dependence of the cation distribu- tion in magnesioferrite (MgFe204) from powder XRD structural refinements and M6ssbauer spectroscopy. Amer. Mineral., 77, 725-40.
Osborne, M.D., Fleet, M.E. and Bancroft, G.M. (1981) Fe 2+ -Fe 3§ ordering in chromite and Cr-bearing spinels. Contrib. Mineral. Petrol., 77, 251-5.
Ottonello, G. (1986) Energetics of multiple oxides with spinel structure. Phys. Chem. Minerals, 13, 79-90.
Peterson, R.C., Lager, G.A. and Hitterman, R.L. (1991) A time-of-flight neutron powder diffraction study of MgAI204 at temperatures up to 1273 K. Amer. Mineral., 76, 1455-8.
Pizzolon, M. (1991) Cristallochimica e Modellizzazione di Spinelli di Mg-AI-Fe-Cr. Thesis, University of Padova, Padua, Italy.
Robbins, M., Wertheim, G.K., Sherwood, R.C. and Buchanan, D.N.E. (1971) Magnetic properties and site distribution in the system FeCr204 - Fe304. J. Phys. Chem. Solids, 32, 717-29.
Roelofsen, J.N., Peterson, R.C. and Raudsepp, M. (1992) Structural variation in nickel aluminate spinel (NiA1204). Amer. Mineral., 77, 522-8.
Ruby, S.L. (1973) Why MISFIT when you already have 22? M6ssbauer Effect Methodology, 8, 263-76.
Sawatzky, G.A., van der Wonde, F. and Morrish, A.H. (1969) Recoiless-fraction ratios for 57Fe in octahe- dral and tetrahedral sites of a spinel and a garnet. Phys. Rev., 183, 383-6.
Sheldrick, G.M. (1993) SHELX-93. Program for crystal structure refinement, University of G6ttingen, Germany.
Skogby, H., Annersten, H., Domeneghetti, M.C., Molin, G.M. and Tazzoli, V. (1992) Iron distribution in orthopyroxene: a comparison of M6ssbauer spectro- scopy and X-ray refinement results. Eur. J. Mineral., 4, 441-52.
Toffanin, N. (1989) Studio Cristallochimico di Cromiti in Complessi Stratiformi ed Ofiolitici. Thesis, University of Padova, Padua, Italy.
Waerenborgh, J.C., Figueiredo, M.O., Cabral, J.M.P. and Pereira, I.C.J. (1994) Powder XRD structure refinements and 57Fe M6ssbauer effect study of synthetic Znl_xFexA1204 (0 < x ~< 1) spinels annealed at different temperatures. Phys. Chem. Minerals, 21, 460-8.
Wood, B.J. and Virgo, D. (1989) Upper mantle oxidation state: ferric iron contents of lherzolite spinels by 57Fe M6ssbauer spectroscopy and resultant oxygen fugacities. Geochim. Cosmochim. Acta, 53, 1277-91.
[Manuscript received 4 January 1995: revised 18 April 1995]