“Great World Orchestras” Cycle: Gustavo Dudamel conducts ...
Beliefs, Practices, Experiences, and Attitudes
By Mark M. Gray and Mary L. GautierThe Center for Applied Research in the Apostolate
CATHOLIC WOMEN
IN THE UNITED STATES
A study commissioned by
CARA is a national, non-profit, Georgetown University affiliated research center that conducts social scientific studies about the Catholic Church. Founded in 1964, CARA has three major dimensions to its mission: to increase the Church's self-understanding, to serve the applied research needs of Church decision-makers, to advance scholarly research on religion, particularly Catholicism. CARA’s longstanding policy is to let research findings stand on their own and never take an advocacy position or go into areas outside its social science competence.
CARA Researchers Thomas P. Gaunt, SJ, Ph.D., CARA Executive Director Mary L. Gautier, Ph.D., Editor, The CARA Report, Senior Research Associate Mark M. Gray, Ph.D., Director, CARA Catholic Polls (CCP), Senior Research Associate Jonathon L. Wiggins, Ph.D., Director, CARA Parish Surveys, Research Associate Michal Kramarek, Ph.D., Research Associate
Affiliated Research Associates Sr. Mary E. Bendyna, OP, Ph.D. Sr. Thu T. Do, LHC Sr. Florence Emurayeveya, EHJ Rev. Stephen Joseph Fichter, Ph.D. Mary Ellen Fise, J.D. Jonathon C. Holland, M.A.
C. Joseph O’Hara, Ph.D.Sr. Bibiana M. Ngundo, LSOSF, Ph.D.Paul M. Perl, Ph.D.Sr. Patricia Wittberg, SC, Ph.D.
©2018 The Center for Applied Research in the Apostolate (CARA) and America Magazine. No portion may be duplicated or copied without expressed written consent. For more information contact CARA at: 2300 Wisconsin Ave, NW, Suite 400, Washington, DC 20007; (202) 687-8080; or [email protected]
America Media is the leading provider of editorial content for thinking Catholics and those who want to know what Catholics are thinking. America Media leads the conversation about faith and culture by producing excellent, unique, relevant and accessible content across multiple platforms. Our contributors are the principal figures in the American church, the decision-makers and opinion leaders who lead the ecclesial and civic debate about religion, society, politics and the arts. Our flagship magazine, America, has been published continuously since 1909, making it one of the oldest periodicals in the United States today.
1
The survey of Catholic Women was conducted by the Center for Applied Research in the Apostolate (CARA) with The GfK Group (GfK, formerly Knowledge Networks) for America Magazine. GfK has recruited the first online research panel that is representative of the entire United States population. Panel members are randomly recruited through probability-based sampling, and households are provided with access to the Internet and hardware if needed. For this study, GfK sampled households from its KnowledgePanel to conduct a survey between August 3, 2017 and August 24, 2017. A total of 1,508 women self-identifying as Catholic in the United States completed the survey (in English or Spanish). The margin of sampling error for the overall sample is ±2.5 percentage points. Using survey and Census data, CARA estimates that there are 37.3 million Catholic females in the United States at the time of the survey. Of this population, 28.8 million are adults.
Religious Belief, Religious Practice, and Parish Life
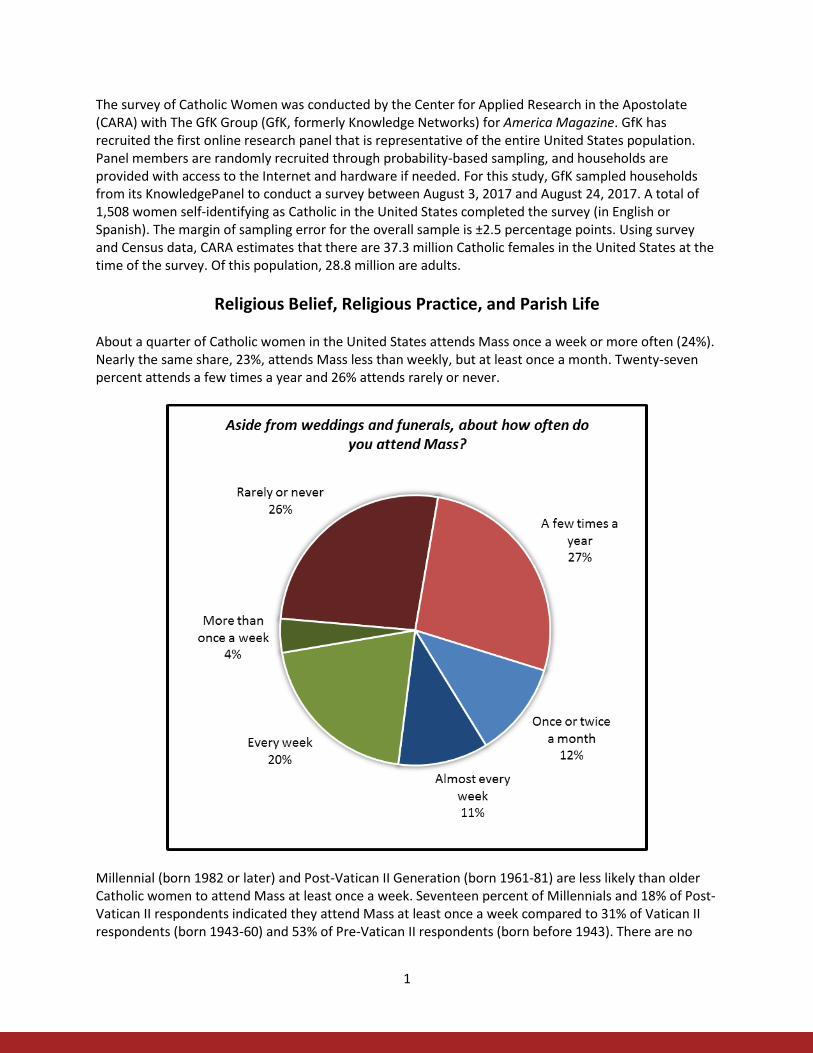
About a quarter of Catholic women in the United States attends Mass once a week or more often (24%). Nearly the same share, 23%, attends Mass less than weekly, but at least once a month. Twenty-seven percent attends a few times a year and 26% attends rarely or never.
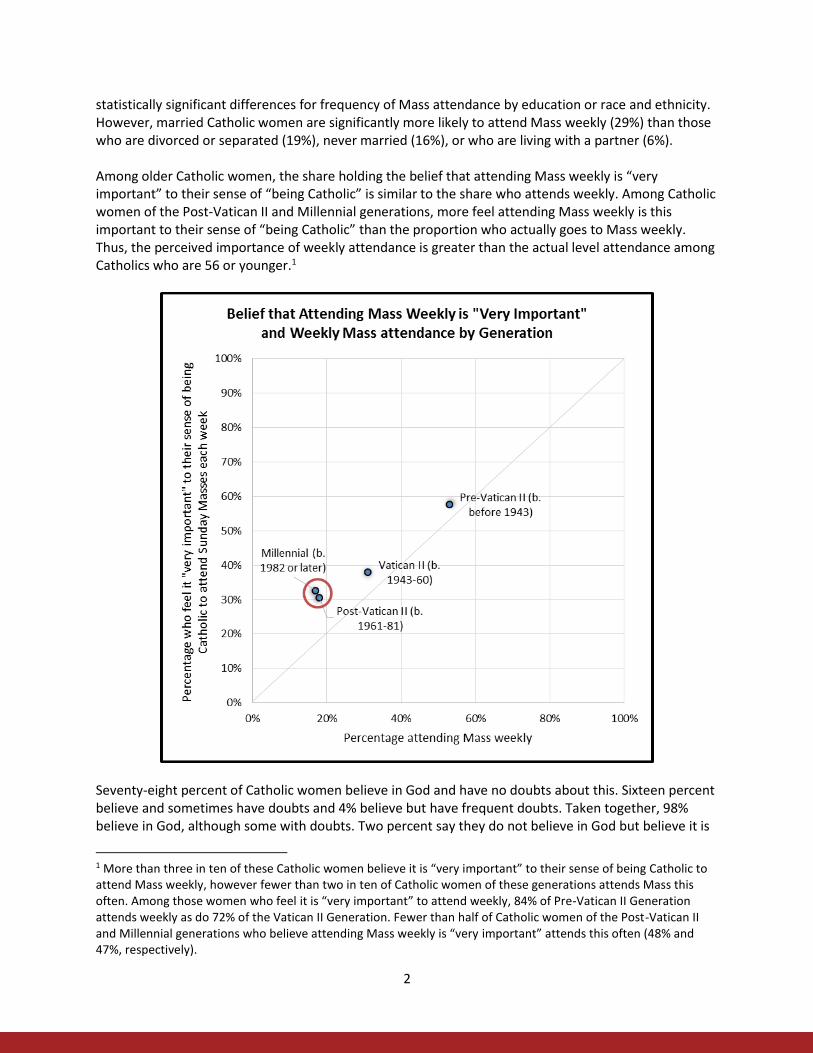
Millennial (born 1982 or later) and Post-Vatican II Generation (born 1961-81) are less likely than older Catholic women to attend Mass at least once a week. Seventeen percent of Millennials and 18% of Post-Vatican II respondents indicated they attend Mass at least once a week compared to 31% of Vatican II respondents (born 1943-60) and 53% of Pre-Vatican II respondents (born before 1943). There are no
2
statistically significant differences for frequency of Mass attendance by education or race and ethnicity. However, married Catholic women are significantly more likely to attend Mass weekly (29%) than those who are divorced or separated (19%), never married (16%), or who are living with a partner (6%). Among older Catholic women, the share holding the belief that attending Mass weekly is “very important” to their sense of “being Catholic” is similar to the share who attends weekly. Among Catholic women of the Post-Vatican II and Millennial generations, more feel attending Mass weekly is this important to their sense of “being Catholic” than the proportion who actually goes to Mass weekly. Thus, the perceived importance of weekly attendance is greater than the actual level attendance among Catholics who are 56 or younger.1
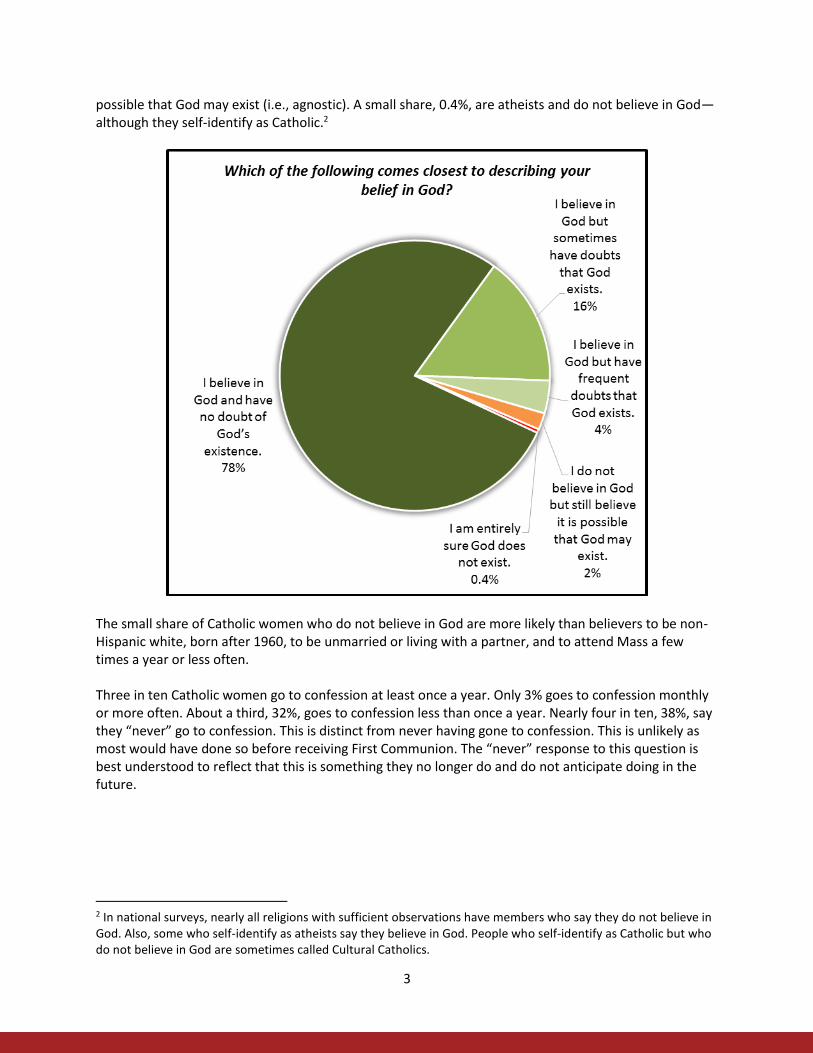
Seventy-eight percent of Catholic women believe in God and have no doubts about this. Sixteen percent believe and sometimes have doubts and 4% believe but have frequent doubts. Taken together, 98% believe in God, although some with doubts. Two percent say they do not believe in God but believe it is
1 More than three in ten of these Catholic women believe it is “very important” to their sense of being Catholic to attend Mass weekly, however fewer than two in ten of Catholic women of these generations attends Mass this often. Among those women who feel it is “very important” to attend weekly, 84% of Pre-Vatican II Generation attends weekly as do 72% of the Vatican II Generation. Fewer than half of Catholic women of the Post-Vatican II and Millennial generations who believe attending Mass weekly is “very important” attends this often (48% and 47%, respectively).
3
possible that God may exist (i.e., agnostic). A small share, 0.4%, are atheists and do not believe in God—although they self-identify as Catholic.2
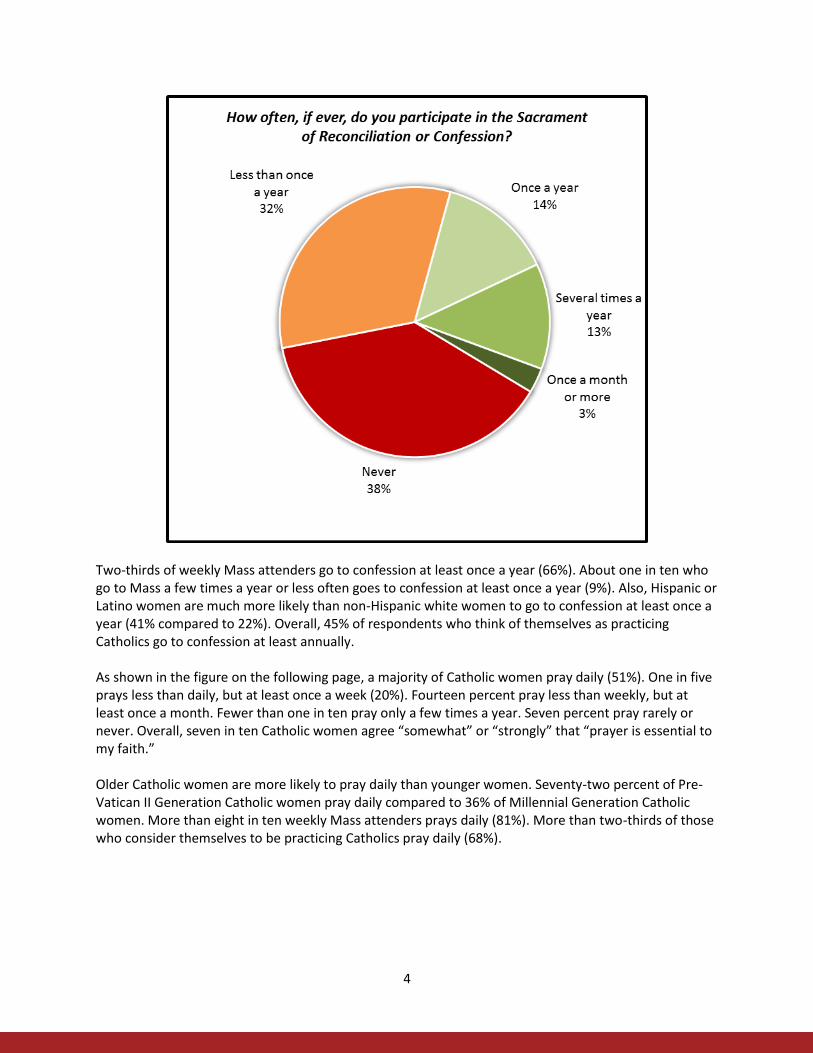
The small share of Catholic women who do not believe in God are more likely than believers to be non-Hispanic white, born after 1960, to be unmarried or living with a partner, and to attend Mass a few times a year or less often. Three in ten Catholic women go to confession at least once a year. Only 3% goes to confession monthly or more often. About a third, 32%, goes to confession less than once a year. Nearly four in ten, 38%, say they “never” go to confession. This is distinct from never having gone to confession. This is unlikely as most would have done so before receiving First Communion. The “never” response to this question is best understood to reflect that this is something they no longer do and do not anticipate doing in the future.
2 In national surveys, nearly all religions with sufficient observations have members who say they do not believe in God. Also, some who self-identify as atheists say they believe in God. People who self-identify as Catholic but who do not believe in God are sometimes called Cultural Catholics.
4
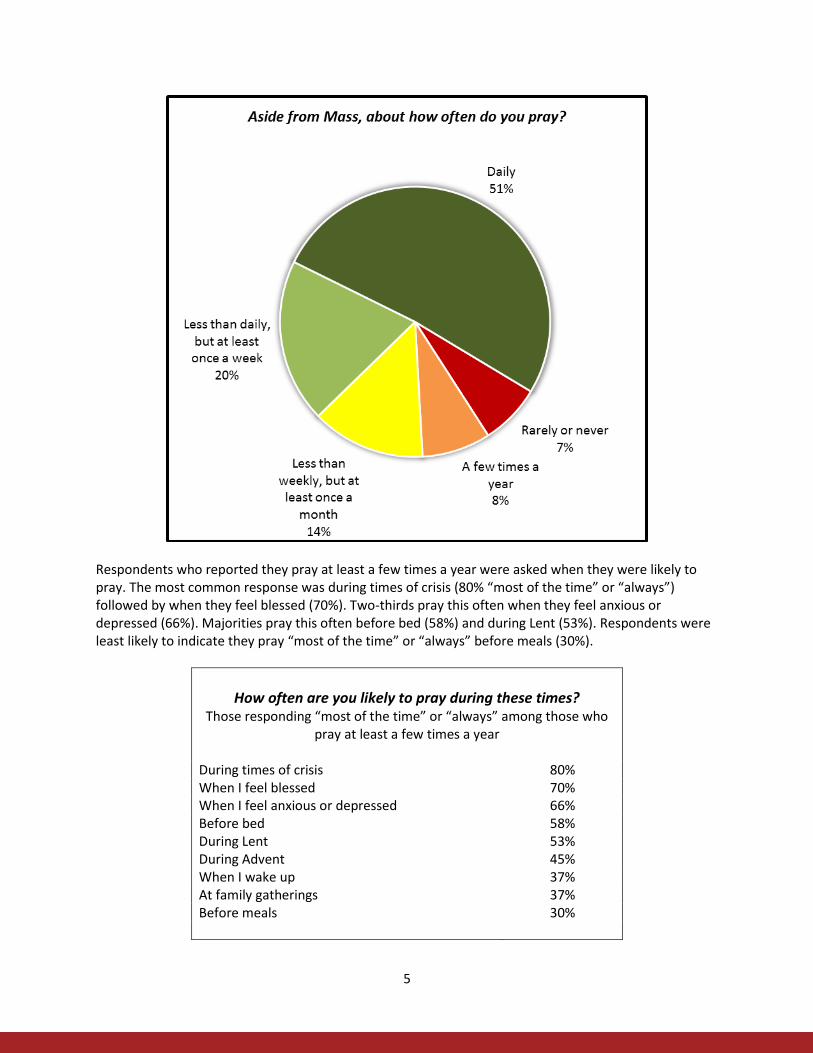
Two-thirds of weekly Mass attenders go to confession at least once a year (66%). About one in ten who go to Mass a few times a year or less often goes to confession at least once a year (9%). Also, Hispanic or Latino women are much more likely than non-Hispanic white women to go to confession at least once a year (41% compared to 22%). Overall, 45% of respondents who think of themselves as practicing Catholics go to confession at least annually. As shown in the figure on the following page, a majority of Catholic women pray daily (51%). One in five prays less than daily, but at least once a week (20%). Fourteen percent pray less than weekly, but at least once a month. Fewer than one in ten pray only a few times a year. Seven percent pray rarely or never. Overall, seven in ten Catholic women agree “somewhat” or “strongly” that “prayer is essential to my faith.” Older Catholic women are more likely to pray daily than younger women. Seventy-two percent of Pre-Vatican II Generation Catholic women pray daily compared to 36% of Millennial Generation Catholic women. More than eight in ten weekly Mass attenders prays daily (81%). More than two-thirds of those who consider themselves to be practicing Catholics pray daily (68%).
5
Respondents who reported they pray at least a few times a year were asked when they were likely to pray. The most common response was during times of crisis (80% “most of the time” or “always”) followed by when they feel blessed (70%). Two-thirds pray this often when they feel anxious or depressed (66%). Majorities pray this often before bed (58%) and during Lent (53%). Respondents were least likely to indicate they pray “most of the time” or “always” before meals (30%).
How often are you likely to pray during these times?
Those responding “most of the time” or “always” among those who pray at least a few times a year
During times of crisis 80% When I feel blessed 70% When I feel anxious or depressed 66% Before bed 58% During Lent 53% During Advent 45% When I wake up 37% At family gatherings 37% Before meals 30%
6
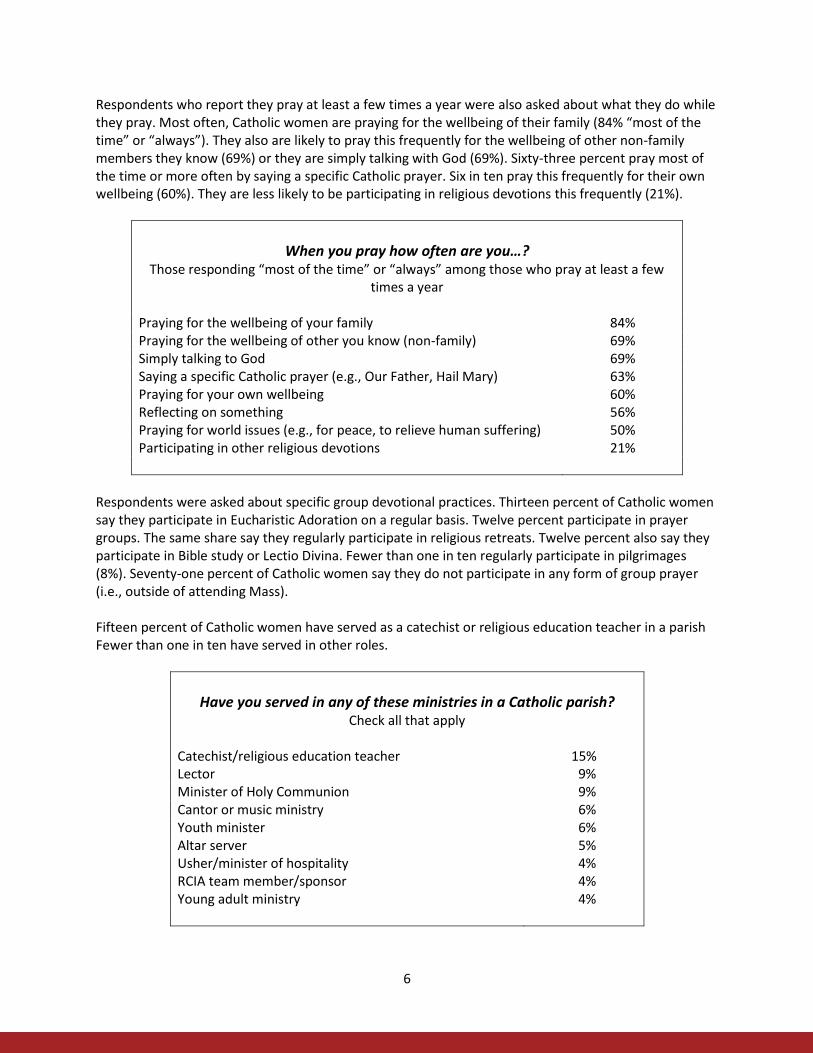
Respondents who report they pray at least a few times a year were also asked about what they do while they pray. Most often, Catholic women are praying for the wellbeing of their family (84% “most of the time” or “always”). They also are likely to pray this frequently for the wellbeing of other non-family members they know (69%) or they are simply talking with God (69%). Sixty-three percent pray most of the time or more often by saying a specific Catholic prayer. Six in ten pray this frequently for their own wellbeing (60%). They are less likely to be participating in religious devotions this frequently (21%).
When you pray how often are you…?
Those responding “most of the time” or “always” among those who pray at least a few times a year
Praying for the wellbeing of your family 84% Praying for the wellbeing of other you know (non-family) 69% Simply talking to God 69% Saying a specific Catholic prayer (e.g., Our Father, Hail Mary) 63% Praying for your own wellbeing 60% Reflecting on something 56% Praying for world issues (e.g., for peace, to relieve human suffering) 50% Participating in other religious devotions 21%
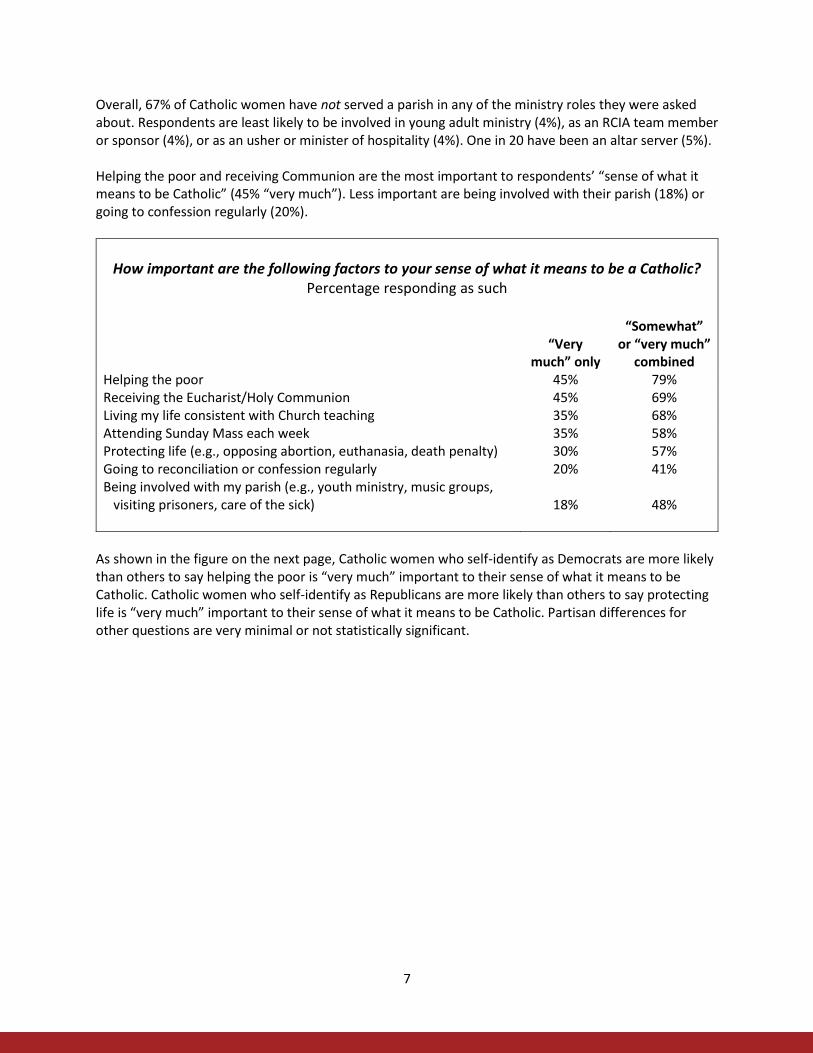
Respondents were asked about specific group devotional practices. Thirteen percent of Catholic women say they participate in Eucharistic Adoration on a regular basis. Twelve percent participate in prayer groups. The same share say they regularly participate in religious retreats. Twelve percent also say they participate in Bible study or Lectio Divina. Fewer than one in ten regularly participate in pilgrimages (8%). Seventy-one percent of Catholic women say they do not participate in any form of group prayer (i.e., outside of attending Mass). Fifteen percent of Catholic women have served as a catechist or religious education teacher in a parish Fewer than one in ten have served in other roles.
Have you served in any of these ministries in a Catholic parish?
Check all that apply
Catechist/religious education teacher 15% Lector 9% Minister of Holy Communion 9% Cantor or music ministry 6% Youth minister 6% Altar server 5% Usher/minister of hospitality 4% RCIA team member/sponsor 4% Young adult ministry 4%
7
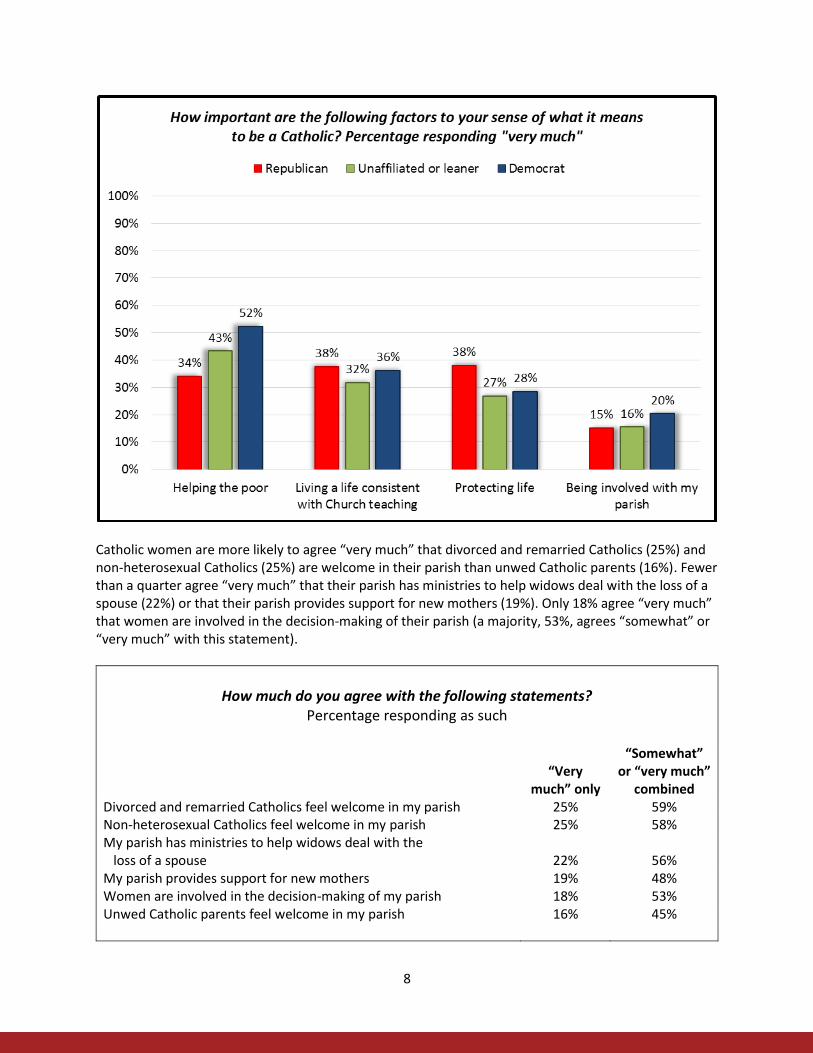
Overall, 67% of Catholic women have not served a parish in any of the ministry roles they were asked about. Respondents are least likely to be involved in young adult ministry (4%), as an RCIA team member or sponsor (4%), or as an usher or minister of hospitality (4%). One in 20 have been an altar server (5%). Helping the poor and receiving Communion are the most important to respondents’ “sense of what it means to be Catholic” (45% “very much”). Less important are being involved with their parish (18%) or going to confession regularly (20%).
How important are the following factors to your sense of what it means to be a Catholic?
Percentage responding as such
“Very
much” only
“Somewhat” or “very much”
combined Helping the poor 45% 79% Receiving the Eucharist/Holy Communion 45% 69% Living my life consistent with Church teaching 35% 68% Attending Sunday Mass each week 35% 58% Protecting life (e.g., opposing abortion, euthanasia, death penalty) 30% 57% Going to reconciliation or confession regularly 20% 41% Being involved with my parish (e.g., youth ministry, music groups, visiting prisoners, care of the sick)
18%
48%
As shown in the figure on the next page, Catholic women who self-identify as Democrats are more likely than others to say helping the poor is “very much” important to their sense of what it means to be Catholic. Catholic women who self-identify as Republicans are more likely than others to say protecting life is “very much” important to their sense of what it means to be Catholic. Partisan differences for other questions are very minimal or not statistically significant.
8
Catholic women are more likely to agree “very much” that divorced and remarried Catholics (25%) and non-heterosexual Catholics (25%) are welcome in their parish than unwed Catholic parents (16%). Fewer than a quarter agree “very much” that their parish has ministries to help widows deal with the loss of a spouse (22%) or that their parish provides support for new mothers (19%). Only 18% agree “very much” that women are involved in the decision-making of their parish (a majority, 53%, agrees “somewhat” or “very much” with this statement).
How much do you agree with the following statements?
Percentage responding as such
“Very
much” only
“Somewhat” or “very much”
combined Divorced and remarried Catholics feel welcome in my parish 25% 59% Non-heterosexual Catholics feel welcome in my parish 25% 58% My parish has ministries to help widows deal with the loss of a spouse
22%
56%
My parish provides support for new mothers 19% 48% Women are involved in the decision-making of my parish 18% 53% Unwed Catholic parents feel welcome in my parish 16% 45%
9
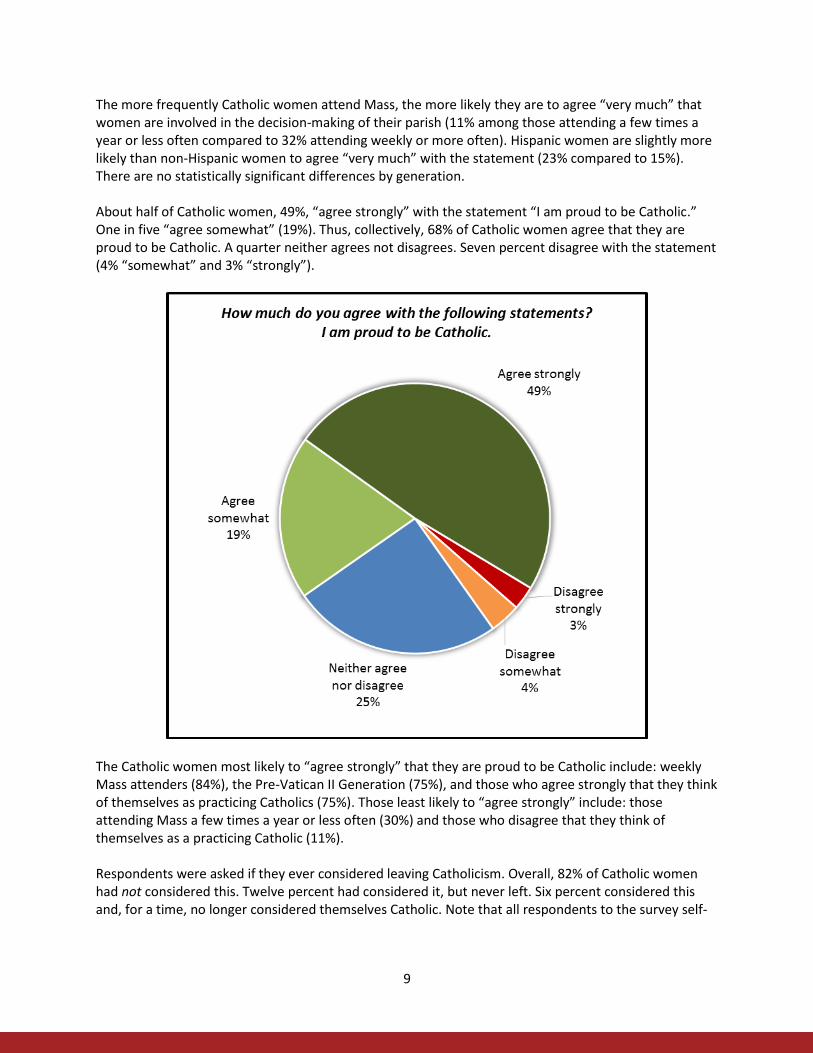
The more frequently Catholic women attend Mass, the more likely they are to agree “very much” that women are involved in the decision-making of their parish (11% among those attending a few times a year or less often compared to 32% attending weekly or more often). Hispanic women are slightly more likely than non-Hispanic women to agree “very much” with the statement (23% compared to 15%). There are no statistically significant differences by generation. About half of Catholic women, 49%, “agree strongly” with the statement “I am proud to be Catholic.” One in five “agree somewhat” (19%). Thus, collectively, 68% of Catholic women agree that they are proud to be Catholic. A quarter neither agrees not disagrees. Seven percent disagree with the statement (4% “somewhat” and 3% “strongly”).
The Catholic women most likely to “agree strongly” that they are proud to be Catholic include: weekly Mass attenders (84%), the Pre-Vatican II Generation (75%), and those who agree strongly that they think of themselves as practicing Catholics (75%). Those least likely to “agree strongly” include: those attending Mass a few times a year or less often (30%) and those who disagree that they think of themselves as a practicing Catholic (11%). Respondents were asked if they ever considered leaving Catholicism. Overall, 82% of Catholic women had not considered this. Twelve percent had considered it, but never left. Six percent considered this and, for a time, no longer considered themselves Catholic. Note that all respondents to the survey self-

10
identified as Catholic in the first question.3 Thus, all consider themselves as Catholics today. However, an open-ended question about the reasons why they had left revealed that some have only made a partial return—considering themselves Catholic but not feeling that they have “come back to the Church.”
When asked “briefly indicate why you left,” respondents who had considered leaving were able to describe, in their own words, their reasons. These responses were categorized, coded, and counted. The most common reasons were related to some disagreement with the Catholic Church’s stance on a particular issue (39%) followed by being attracted to another faith or religion (23%). Fifteen percent cited an issue with their local parish, 9% cited “hypocrisy” of the Church or its members, and 7% cited the clergy sex abuse scandal. One in five (21%) provided a reason that did not fit these categories or that could be combined with other similar responses.4 Some representative examples of these reasons are provided below:
Disagreement with the Church
Because of their stance on many social issues.
Church's teaching. I didn't leave the Church—the Church left me.
Didn't agree with the preaching from the priests.
Disagree with beliefs. I believe in women's rights, same sex marriage, abortion.
3 Nine in ten Catholic women were baptized as an infant. One in ten became Catholic later in life. 4 Note that a single response can include multiple reasons.

11
Disbelief and questioning many teachings while trying to understand there are many views.
Felt the religion was too restrictive. I disagree with their stances on abortion and gay marriage.
I am gay.
I didn't believe in all of the Catholic teachings.
I didn't believe the teaching in regarding various social issues and that was a barrier.
I'm a lesbian and do not feel welcomed.
Issues like birth control, issues like science, but I love the new Pope and could return because of him.
Married someone who had been married before.
Shaming done to children who question the "science" behind the Church's teachings/Bible. Attracted to another faith or religion
Attended a non denominational church.
Did not attend church at all for 4 years and when I decided to return to church, I attended a Methodist church for 8 years.
I was a practicing Quaker for several years.
I followed my young daughter’s path to her Christian Church where she was going to Bible Study classes.
I had a hard time after a parent passed away and was angry and decided to look into other beliefs.
I liked the lively Assembly of God Church and felt warmth and caring from the people there.
Spouse another religion.
Was going to a non-denominational church and liked their teachings directly from the Bible.
Was not sure if I believed in God and wanted to explore different religions.
Well I was a teenager when my mom decide to convert to Christianity and she dragged my siblings and me to her new church.
Issues with the local parish
Did not like the pastor.
Lacked sense of community.
Family problems and little emotional support from the church.
No moral support when I needed it the most.
Parish was so unwelcoming. Very disappointed in church.
The pastor at my church was very degrading and rude. In addition, his homily was just a "recap" of the Gospel. I just heard the readings. I want to hear something that may relate to the readings but that I can take with me when I leave Mass and use it in my daily life to be a better person. I felt worse when I left Mass. It shouldn't be that way.
Hypocrisy
As a teenager, I thought it was all crap because of the contradictions between what people said they believed and how they acted.
Church seemed to be hypocritical in their teachings.
I believe people that attending any church judge you according to their beliefs and feel superior. Not many practice what is taught in the church.
I feel that many people believe they are "religious" because they attend church but don't follow the teachings of the church in their day to day lives. This hypocrisy is discouraging to me.

12
I am also appalled that many priests take the vow of poverty, obedience and chastity but many of them have purchased summer homes and fathered children. Again, this is hypocritical in my view. How can you expect your parishioners to follow what you say when you yourself do not practice what you preach or the vow taken? And....why can't priests marry? It is almost a proven fact that Jesus did and the Jews have had rabbis who have served both God and family for thousands of years. If the Jews can do it successfully, why can't the Catholics try it? So very frustrating!
Much hypocrisy, little tolerance! Clergy sex abuse scandal
Because of what the priests were doing to young boys.
Because of the pedophile priests and the fetuses found in convents.
For all the pedophilia.
I think the Catholic Church is hypocritical with its handling of the pedophile priests in many regions. They espoused one teaching but turned a blind eye to what its own clergy was doing.
Too much abuse going on. Other reasons
A deep feeling of emptiness.
Death of my husband.
Felt God had abandoned me.
I felt like church is business.
I got a divorce and didn't feel like I deserved God.
I grew up confused. My father was an atheist. My mom was Catholic, but stopped going to church regularly when she married my dad. After leaving Catholic school when moving from Chicago to California, nobody took me to church. At age 14, I returned to go alone...no family members went with me. Then in college, I dropped out again. I married a man who wouldn't sign papers saying our kids would be raised Catholic which you had to do so to be married in the Church at that time. At this point, I was doubting the Church again, so didn't marry in the Church or go to church for the next 14 years of my marriage to him. Nor did I raise my kids Catholic.
It was a personal thing that happened to me.
Just stopped going to church or having interest in the Church.
Never really went to church anyways.
Was in a bad way at that time in my life. Following the open-ended question about reasons for considering leaving, a series of closed-ended questions asked about the importance of some specific reasons. Respondents who had considered leaving were most likely to cite disagreement with Church teachings (38%) and the status of women in the Church (23%) as being “very much” important to their thinking. They were least likely to be attracted to another religion (9%).
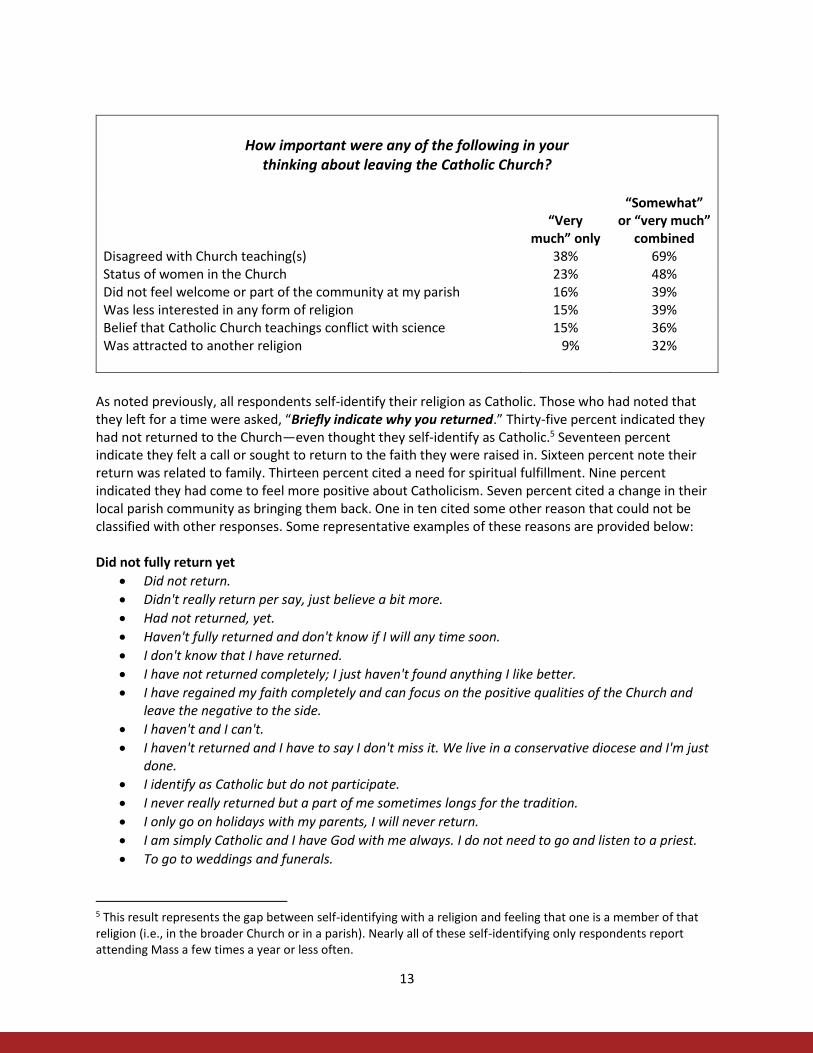
13
How important were any of the following in your
thinking about leaving the Catholic Church?
“Very
much” only
“Somewhat” or “very much”
combined Disagreed with Church teaching(s) 38% 69% Status of women in the Church 23% 48% Did not feel welcome or part of the community at my parish 16% 39% Was less interested in any form of religion 15% 39% Belief that Catholic Church teachings conflict with science 15% 36% Was attracted to another religion 9% 32%
As noted previously, all respondents self-identify their religion as Catholic. Those who had noted that they left for a time were asked, “Briefly indicate why you returned.” Thirty-five percent indicated they had not returned to the Church—even thought they self-identify as Catholic.5 Seventeen percent indicate they felt a call or sought to return to the faith they were raised in. Sixteen percent note their return was related to family. Thirteen percent cited a need for spiritual fulfillment. Nine percent indicated they had come to feel more positive about Catholicism. Seven percent cited a change in their local parish community as bringing them back. One in ten cited some other reason that could not be classified with other responses. Some representative examples of these reasons are provided below: Did not fully return yet
Did not return.
Didn't really return per say, just believe a bit more.
Had not returned, yet.
Haven't fully returned and don't know if I will any time soon.
I don't know that I have returned.
I have not returned completely; I just haven't found anything I like better.
I have regained my faith completely and can focus on the positive qualities of the Church and leave the negative to the side.
I haven't and I can't.
I haven't returned and I have to say I don't miss it. We live in a conservative diocese and I'm just done.
I identify as Catholic but do not participate.
I never really returned but a part of me sometimes longs for the tradition.
I only go on holidays with my parents, I will never return.
I am simply Catholic and I have God with me always. I do not need to go and listen to a priest.
To go to weddings and funerals.
5 This result represents the gap between self-identifying with a religion and feeling that one is a member of that religion (i.e., in the broader Church or in a parish). Nearly all of these self-identifying only respondents report attending Mass a few times a year or less often.

14
Called back
After participating in a Catholic wedding, I decided to return.
Because I truly am Catholic in many ways!
Came back as an adult having a relationship with God.
Grew up Catholic. Went back to roots.
Habit.
I felt like a part of my identity was missing.
I have regained my faith completely and can focus on the positive qualities of the Church and leave the negative to the side.
I miss Mass and what I was brought up believing.
I was raised with that religion.
It is what I know and how my family chose to raise me and closest to what I believe.
When I grew up I returned to the Catholic Church. Family
Family.
Family pressure.
Feel part of a family group!
It is what I know and how my family chose to raise me and closest to what I believe.
My husband and that the other beliefs I was researching all connected back to the Church.
My husband got me to go back and try it again.
My husband was raised Catholic.
Because it is unfortunately the family tradition.
The birth of my daughter
Wanted children to have a religion. Spiritual needs or fulfillment
Decided it was important to have a kind of anchor in my life.
I found an urge to return to God in a profound way.
I miss the reverence.
Life and death slammed me right to my heart. I needed Him and His help to get me through it.
Something was missing in my life and I realized it was God and the Church. More positive about Catholicism
I did not like what I saw in the Christian church. The way they expect women to behave is a lot more traditional than the Catholic Church. I guess in some aspects the Catholic Church is less oppressive to women than the Christian church.
My brother [name] died suddenly and I felt unsupported at the Christian church while I was working through my grief and helping to support my brothers family. Thus I left this nondenominational Christian church and was welcomed back into the fold of the Catholic Church.
There is a certain peace I find being inside a Catholic Church that I could not find in other churches - I didn't feel that I had a personal relationship with my God or that He actually existed!
Local parish community
Changed pastor.
15
Different priest. He considered the circumstances and my side of things.
I got a divorce and when I remarried, it was to a Catholic. We married in the Church and started going to Mass again.
I was drawn to belief in God and sought out a spiritual community. I was in [place] and found a warm, welcoming, progressive parish.
I'm remarried and even though don't believe in all the Church's teachings, I enjoy the sense of community.
Other reasons
Didn't find an alternative.
I am in a trial period.
I wanted to.
Just because situations in my life.
Need to listen to doctrine.
No comment.
16
Women in the Church Respondents were asked, “Where do you get your ideas/models of being a woman in the Catholic Church from?” They could respond in their own words. The most common role models were family, parents, or friends (38%) followed by religious education in the Church (33%) and by the Bible, saints, God, scripture, and other readings (19%). Fewer note the influence of women religious (9%), no one in particular (9%), their own religious beliefs (8%), or simply being raised Catholic (5%). Seven percent noted some “other” influence that could not be combined with other categories. Some representative examples of these ideas or models are provided below:
Family, parents, or friends
Ancestors.
Aunt, mother in law.
Beliefs from my parents.
Brought up in a strict Catholic family who was a dedicated member of our church. It was in the 50's and 60's and that's how it was.
Catholic school and family upbringing.
Close family friends and grandmothers.
Family, and people that I have known.
Friends.
From other women that attend church; my grandmother goes to church weekly.
From the beliefs of my family.
Godmother and confirmation sponsor.
Grandmother.
I had five aunts in the convent who were influences. Primarily though my mother.
I blame my parents.
Mom and sisters.
My parents.
My second cousin.
Women in my family and parish. Religious education in the Church
12 years of Catholic school.
Attending an all woman Catholic university.
As a teenager who never knew a Catholic, I was sent to a convent girl's school and learned about the Church, about life in general, God, etc. and received caring and love from the nuns who were my teachers, etc. After a year, I decided to become a Catholic and after graduating from high school, did so and have been ever since and always will be.
By going to church every week as I was taught to do and taking Communion.
Catechism.
Catholic doctrine.
Catholic high school.
Church and childhood catechism classes and parents and going to Catholic School.
Church sermons.
Education and examples.
From grandparents and parents teaching.

17
From my childhood catechism classes
From professors at [university], women religious that I am friendly with.
Going to church weekly.
Growing up in the Catholic church/parents.
Growing up in the church.
I attended CCD as a child.
I had a strict Catholic upbringing and many teachings from school and church are ingrained in me.
I was raised Catholic and attended elementary school (1-8) Catholic education, and I read books about my faith and occasionally attend seminars about my faith.
Mass and literature.
Religion classes.
Religious magazines and my priest. Bible, saints, God, scripture, and other readings
Bible and Church homily.
Blessed Mother.
Books.
By reading articles to get information.
Catholic teaching.
Church teachings, Mary, the Mother of Jesus, Pope Francis.
Dorothy Day and several Ursuline sisters I know.
Family, Catechism, attending Mass, Bible.
Female saints.
From books, religious articles.
From reading about women saints, the Blessed Virgin.
From saints, other women I know, spiritual advisors.
From the early teachings of the Church, the first 300 years where women had more of a role as deacons and founders of the Church. Also, today from examples of others in the Catholic Church; spiritual directors; readings from people who disagree with the Catholic Church.
From the teachings and sermons.
From the Ten Commandments.
Jesus' first disciple, His mother and our spiritual mother, Mary.
Literature about various saints and Mother Mary.
Love God and neighbor.
Mary, obviously, but also Joan of Arc, Elizabeth of Hungary, and Mother Teresa of Calcutta.
Mary Magdalene.
Mother Teresa.
Reading and caring for my soul.
Reading Catholic newspaper, the Bible.
Religious magazines.
St. Clare
The female saints.
Through the teachings of the Catholic Bible.
Women in the Gospel.
Writings of St. John Paul II on the Dignity of Women
18
Women religious
9 years in the convent.
Actually my aunt who when I was young was a nun.
All women in the Catholic Church (either as mothers or a nun).
Catholic news letter talking about the Sisters of Hawthorn NY and the care they give to the terminally sick patients.
Have a relative through marriage that is a nun
I could see myself as a nun.
My aunt who was a nun.
My sister who is a nun.
Nuns.
Observing the sisters or volunteers.
Seeing nuns. Being around them sometimes when I was younger.
Strong women who chose to be nuns.
Women religious that I am friendly with. No one in particular
?
Don’t have a model.
Don’t have any.
Don’t know.
Hard to say. I don't feel we have much for role models for women in the Catholic Church.
I do not have any special model.
I only became Catholic a few years ago, so I never got models about women from the church when I was younger.
NA
Never thought about it.
No.
None.
Not sure.
Nowhere. Own religious beliefs
A personal opinion between my Creator and myself.
After all the years I am my own person and believe in God and feel I can talk to him at any time right here.
Belief in God that that a women is equal in the church.
Church teachings, own conscience.
From my own ideas and feelings
From my own self.
Of the teaching of the Church and own ideas.
Of my knowledge.
My experiences.
My own personal feelings.
My thoughts.

19
Well I take them from my ancestors and beliefs in the supreme being.
Within my heart and soul. Being raised Catholic
Born and raised Catholic.
Brought up Catholic.
From my faith and upbringing.
Growing up Catholic.
Was raised Catholic!
Other
Admiring the charity works of others.
Bloggers.
By living my life and seeing everyone around me.
Catholic radio, volunteering with women in the Church.
From being out in the working world. From women I admire.
From contemporary role models.
History.
Mainly TV and movies.
My generation.
Sister Act.
Twelve percent of respondents indicate that they have considered becoming a religious sister or nun. This is equivalent to 3.5 million adult women who self-identify as Catholic in the United States today.
20
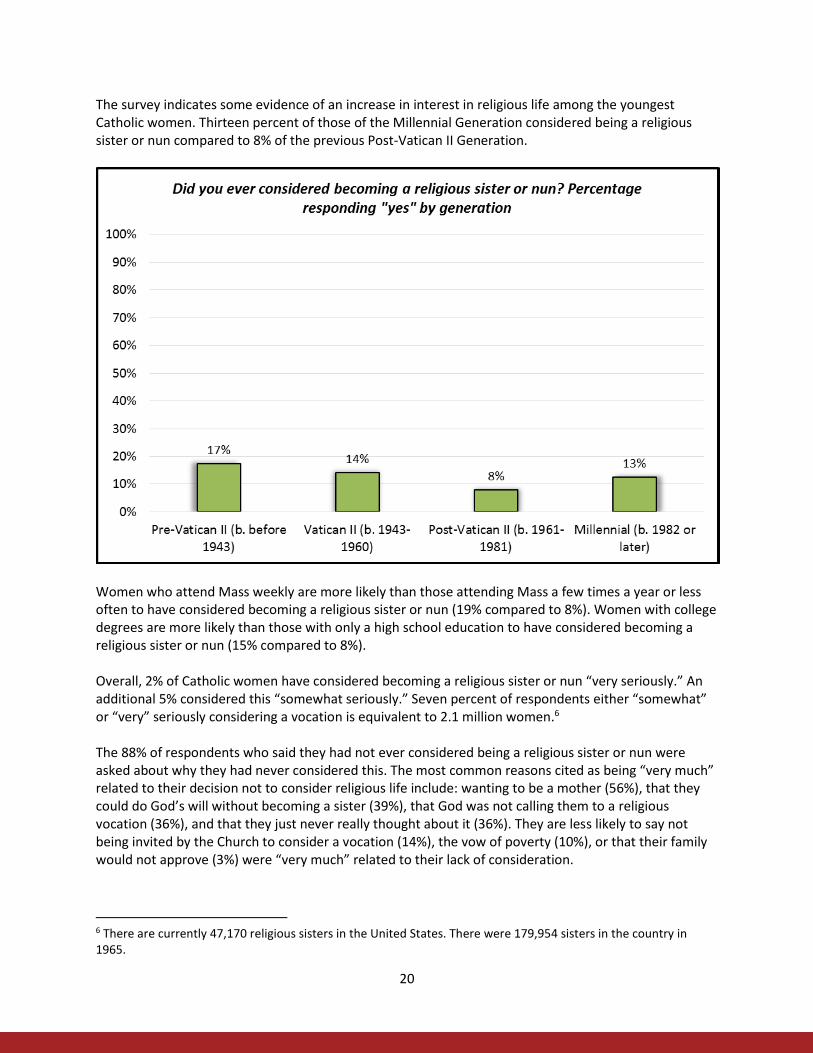
The survey indicates some evidence of an increase in interest in religious life among the youngest Catholic women. Thirteen percent of those of the Millennial Generation considered being a religious sister or nun compared to 8% of the previous Post-Vatican II Generation.
Women who attend Mass weekly are more likely than those attending Mass a few times a year or less often to have considered becoming a religious sister or nun (19% compared to 8%). Women with college degrees are more likely than those with only a high school education to have considered becoming a religious sister or nun (15% compared to 8%). Overall, 2% of Catholic women have considered becoming a religious sister or nun “very seriously.” An additional 5% considered this “somewhat seriously.” Seven percent of respondents either “somewhat” or “very” seriously considering a vocation is equivalent to 2.1 million women.6 The 88% of respondents who said they had not ever considered being a religious sister or nun were asked about why they had never considered this. The most common reasons cited as being “very much” related to their decision not to consider religious life include: wanting to be a mother (56%), that they could do God’s will without becoming a sister (39%), that God was not calling them to a religious vocation (36%), and that they just never really thought about it (36%). They are less likely to say not being invited by the Church to consider a vocation (14%), the vow of poverty (10%), or that their family would not approve (3%) were “very much” related to their lack of consideration.
6 There are currently 47,170 religious sisters in the United States. There were 179,954 sisters in the country in 1965.
21
Previously you indicated that you never considered becoming a religious sister or nun.
How much, if at all, were the reasons listed below related to this?
“Very much” only
“Somewhat” or “very much”
combined I wanted to be a mother 56% 71% I could do God’s will without becoming a religious sister 39% 67% God is not calling me to a religious vocation 36% 52% I’ve just never really thought about it 36% 51% The celibacy requirement (i.e., vow of chastity) 22% 38% I am not very religious 15% 38% Vow of obedience 15% 32% Never felt invited by the Catholic Church to consider a religious vocation
14%
25%
Vow of poverty 10% 25% My family would not approve 3% 10% Other 9% 15%
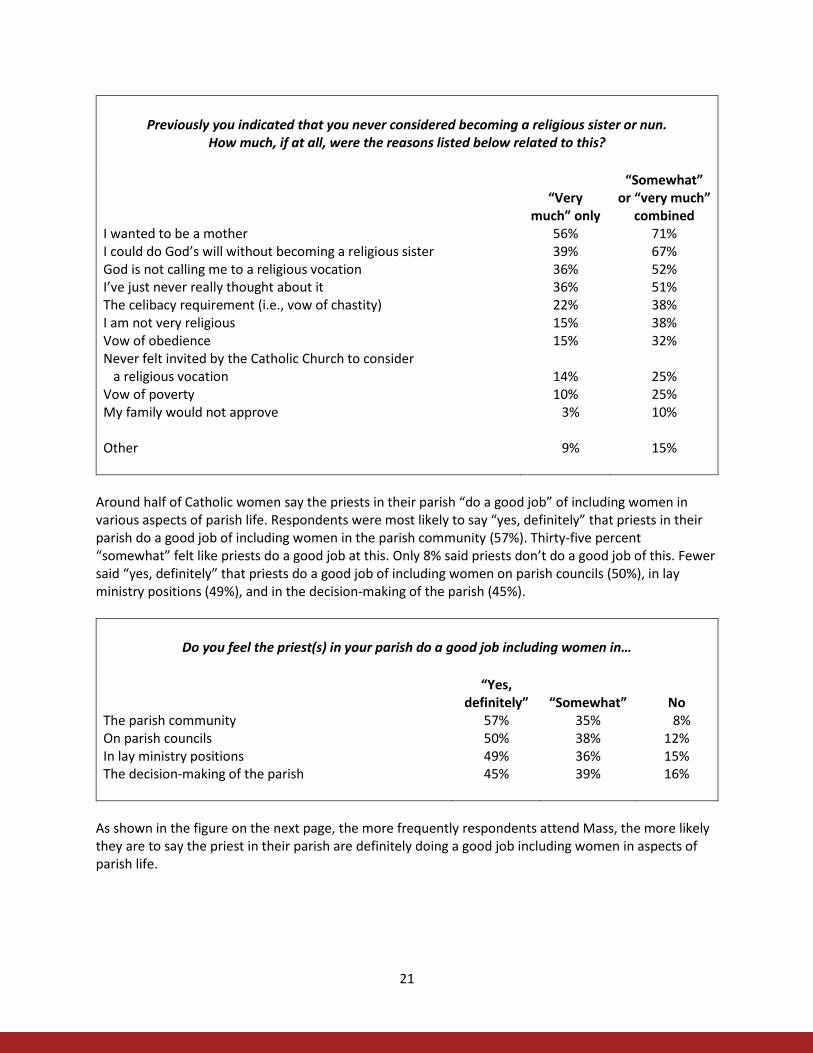
Around half of Catholic women say the priests in their parish “do a good job” of including women in various aspects of parish life. Respondents were most likely to say “yes, definitely” that priests in their parish do a good job of including women in the parish community (57%). Thirty-five percent “somewhat” felt like priests do a good job at this. Only 8% said priests don’t do a good job of this. Fewer said “yes, definitely” that priests do a good job of including women on parish councils (50%), in lay ministry positions (49%), and in the decision-making of the parish (45%).
Do you feel the priest(s) in your parish do a good job including women in…
“Yes,
definitely”
“Somewhat”
No The parish community 57% 35% 8% On parish councils 50% 38% 12% In lay ministry positions 49% 36% 15% The decision-making of the parish 45% 39% 16%
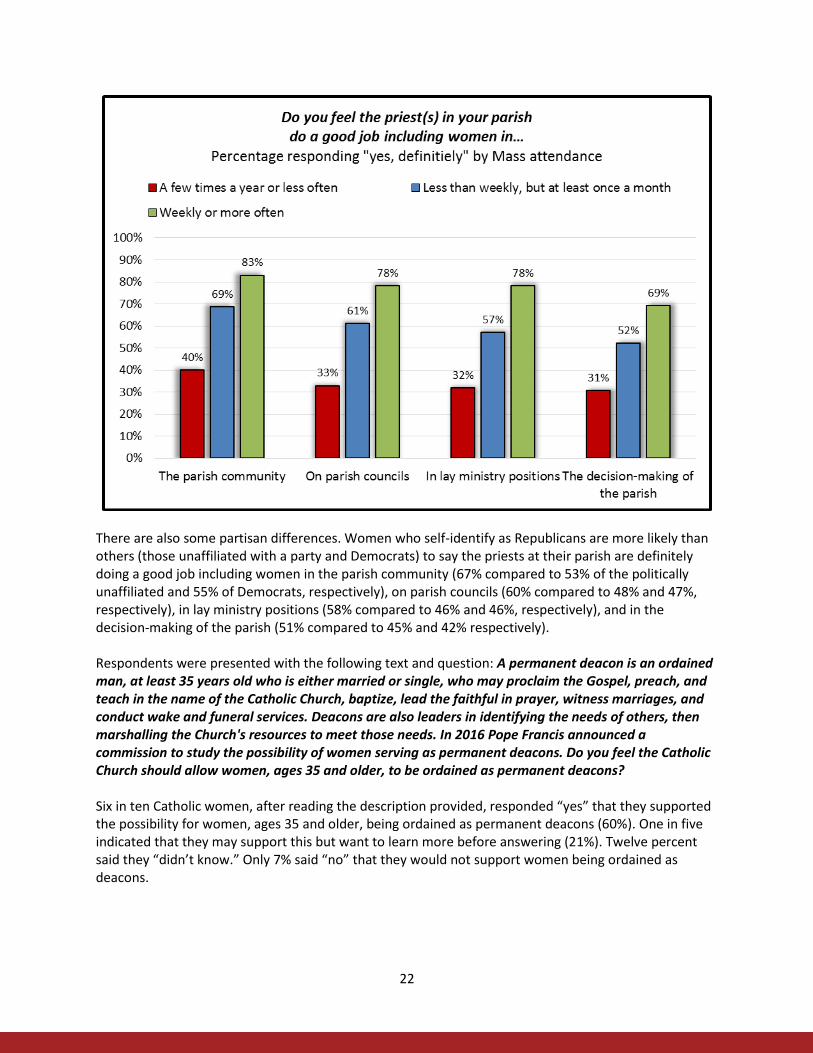
As shown in the figure on the next page, the more frequently respondents attend Mass, the more likely they are to say the priest in their parish are definitely doing a good job including women in aspects of parish life.
22
There are also some partisan differences. Women who self-identify as Republicans are more likely than others (those unaffiliated with a party and Democrats) to say the priests at their parish are definitely doing a good job including women in the parish community (67% compared to 53% of the politically unaffiliated and 55% of Democrats, respectively), on parish councils (60% compared to 48% and 47%, respectively), in lay ministry positions (58% compared to 46% and 46%, respectively), and in the decision-making of the parish (51% compared to 45% and 42% respectively). Respondents were presented with the following text and question: A permanent deacon is an ordained man, at least 35 years old who is either married or single, who may proclaim the Gospel, preach, and teach in the name of the Catholic Church, baptize, lead the faithful in prayer, witness marriages, and conduct wake and funeral services. Deacons are also leaders in identifying the needs of others, then marshalling the Church's resources to meet those needs. In 2016 Pope Francis announced a commission to study the possibility of women serving as permanent deacons. Do you feel the Catholic Church should allow women, ages 35 and older, to be ordained as permanent deacons? Six in ten Catholic women, after reading the description provided, responded “yes” that they supported the possibility for women, ages 35 and older, being ordained as permanent deacons (60%). One in five indicated that they may support this but want to learn more before answering (21%). Twelve percent said they “didn’t know.” Only 7% said “no” that they would not support women being ordained as deacons.

23

24
The oldest and the youngest Catholic women are less likely than those of the Vatican II and Post-Vatican II generations to respond, “yes” to the question about female deacons. There is not much difference in the proportions responding “no” across generations.7 However, there is an increase in “don’t know” responses among younger Catholic women. Weekly Mass attenders are less likely than those attending Mass less often to respond, “yes” and more likely to respond “no” to the idea of female deacons.
Women who self-identify as Democrats are more likely than Republicans or the politically unaffiliated to say, “yes” they support female deacons (65% compared to 57% of the unaffiliated and 55% of Republicans). Non-Hispanic white women are more likely than those self-identifying as Hispanic or Latino to support women being able to be ordained as deacons (66% compared to 50%). Catholic women with more education are more likely than those with less education to support women being able to become deacons. Seventy percent of those with a college degree responded “yes” they support female deacons compared to 63% of those with some college, 57% of those with a high school degree, and 39% of those with less than a high school degree. Respondents were asked if they had ever personally experienced sexism within the Catholic Church. One in ten said “yes” they had and nine in ten responded “no” to this question. Among sub-groups, the following are more likely than all Catholic women to say they have personally experienced sexism in the Church: those who attended a Catholic college or university (25%), those who considered becoming a religious sister or nun (23%), those who attended a Catholic high school (16%), and those who have
7 Vatican II Generation women would have been coming of age in the Church when the permanent diaconate was restored. They may be more familiar with the role of deacons than women of other generations.

25
served in a parish ministry role (15%). Among those who say they have personally experienced sexism within the Church, 44% say they have seriously thought about leaving the Church at some point.
Those who responded “yes” were instructed, “If you wish to do so, please describe your experience.” The most common responses relate to women feeling like they were perceived as inferior in the Church and not being allowed to serve in ministry—especially as altar servers. Some representative examples of these experiences are provided below:
Active involvement in the church restricted to teaching Sunday school, choir, sodality, raising funds for church and school. Never allowed to be an altar server.
All of the translations of the Bible, and the texts of the Liturgy of the Mass are not inclusive of women! We are supposed to believe that when the priest says "men" that includes me. I wonder if Father would then not mind my using the "men's room"? Technically, women are not welcome in the sanctuary of the Church—except to clean it, of course! So there are parishes that do not allow girls as altar servers or readers.
As a girl, I could not be an altar server.
Dress code for girls at Catholic school.
Every Catholic woman who attends church is viewed as “less than” simply because they have been denied participation in the sacrament of ordination.
Everything about the Catholic Church is sexist. How can a woman not be exposed to sexism as a member of the Church? Just pick up the Bible and start reading. Ugh.

26
Felt inferior when priest said husband is in charge.
Growing up girls were not permitted to assist during Mass
I went to Catholic school and actually started altar girls in my parish in 1978—the nuns did not like this at all! It was our deacon at the time that helped bring girls to serve on the altar. Truly a neat time for me and three other girls in my seventh grade class. The nuns acted differently towards me after this event—they bullied me a bit. It is so strange to look back at now—I was only 12 or 13 at the time.
In my youth, priests were waited upon by nuns or other women in the parish. Women were treated as sweet dears but not as equals. Men met and ruled and did not include women in making policy or consider family needs. Homilies do not include same sex partners’ life problems, as if this doesn't exist. Homilies do not include a singe person's needs, as if there is only one life track.
In religion classes in Catholic school, motherhood was always presented as a superior vocation when compared to professional pursuits. The teachings regarding birth control and abortion were very regressive
Just considered to do menial jobs around the church such as washing dishes at a Church supper.
Just their outlook and attitude about women has affected me—it feels sometimes like they are still in the "dark ages."
Many priests, not all, have a fear of single women, or women religious or women period. Many priests have big egos and are more concerned about how they look or work less than actually minister to the people of the parish.
My input was disregarded by priests.
My priest was belittling to me in discussing career aspirations. This was over 30 years ago and had a big effect on me. Again at the Catholic college that I worked at over 25 years ago. Experienced by this behavior had me question my affiliation and experience with religion.
Not allowing women to become deacons.
One example is that I know that male youth ministers in our Diocese being paid much more than the women in the same positions. Also, a male admin assistant in our church was paid more than the female predecessor and it was said that “he has a lot of expenses going to college.”
Only male priests.
Pastor preferred men to women and children who attended the Catholic school to the children who went to public school and hence had religious education classes.
Priests deferentially speaking to my husband instead of me, bishops being surprised that I was in an executive position at a young age and looking younger, my work with the church attorney to get my first marriage annulled, and women can't be priests or deacons. Disgust with the male hierarchy of the Church covering up child abuse for decades. Priests who participated in abusing children moved into my Diocese and quietly sheltered for decades, being given administrative roles with no public contact, and then found out later.
Routinely as a child, I would ask questions about why I was not permitted to do things classmates and peers were invited to do, and the simple answer was “You're a girl. Girls don't do that.” Further inquiry as to why girls “couldn't” do something as basic as taking up the collection, even, was met with “girls don't.”
The Church is a patriarchy, after all.
The Church's official teachings on matter of choice, birth control and ordination are sexist and affect all Catholic women.
Usually from the men in the church who feel women should stay in the kitchen and run fundraisers.

27
We have had priests that refused to do the washing of feet. When the Pope included women, he would not wash a woman’s feet.
When a priest treated my like my opinion didn't count mainly because I am a woman.
When I joined my current church, the priest wouldn't talk to me, even though my husband is not Catholic. And, at the baptism class for one of my children, he indicated that the father was the most important person in a child's life. “That's just the way it is” he said.
When I was in Catholic elementary school, I was always taught that females should not have a voice in their marriage, politics, or decision-making. I clashed with the nuns all the time because I tried to voice my opinions and was always put down. I couldn't wait until my parents allowed me to go to public school to get away from the wrath of the nuns and the Church's doctrines.
You experience it in every occasion. Men are the hierarchy of the Church and women are just there to assist the men and are told to listen to the man's ideas. It is a world of suppression.
Five responses, representing 0.3% of women surveyed, referenced accusations of inappropriate behavior.8
A priest in confession, years ago, asked improper questions.
Accused of being promiscuous as a teenager during confession, even though I was not interested in boys at all. Just because I was a teenage girl. That is when I quit going to confession.
As a little girl, we had some pervert priests, but at the time, we didn't know that. They would hug you close, too close I thought. We would hear stories, but again, I was little, didn't hardly know what they meant back then.
Had a priest kiss me on the mouth, which was a shock. He hugged me and I turned my head, he grabbed my face and forcibly kissed me. He also insisted I confess all my sexual experiences to him, he wanted all the details, when I told him I was a virgin he did not believe me.
There was a priest that was troubled and he tried to be friendly with us grade school girls. He was an alcoholic. He did not succeed.
8 CARA does not know the identity of respondents nor did any respondents name individuals in the comments made.

28
Sixty-three percent of Catholic women are married (46% are married to a Catholic spouse and 17% to a non-Catholic spouse). Six percent are widowed. One in ten are separated or divorced. Six percent live with a partner. Fifteen percent have never married.
Never-married Catholic women were asked if it is important for them to marry a Catholic and how important it is to them to be married in the Catholic Church.
Marriage Questions for the Never-married
“Very much”
only
“Somewhat” or “very much”
combined
Do not plan to marry
How important is it to you that you marry a Catholic? 18% 38% 12% How important is it to you to be married in the Catholic Church?
32%
56%
1%
Only 18% of never-married Catholic women say it is “very much” important to them to marry someone who is Catholic. Twelve percent said they don’t plan to marry (2% of all adult Catholic women). About a
29
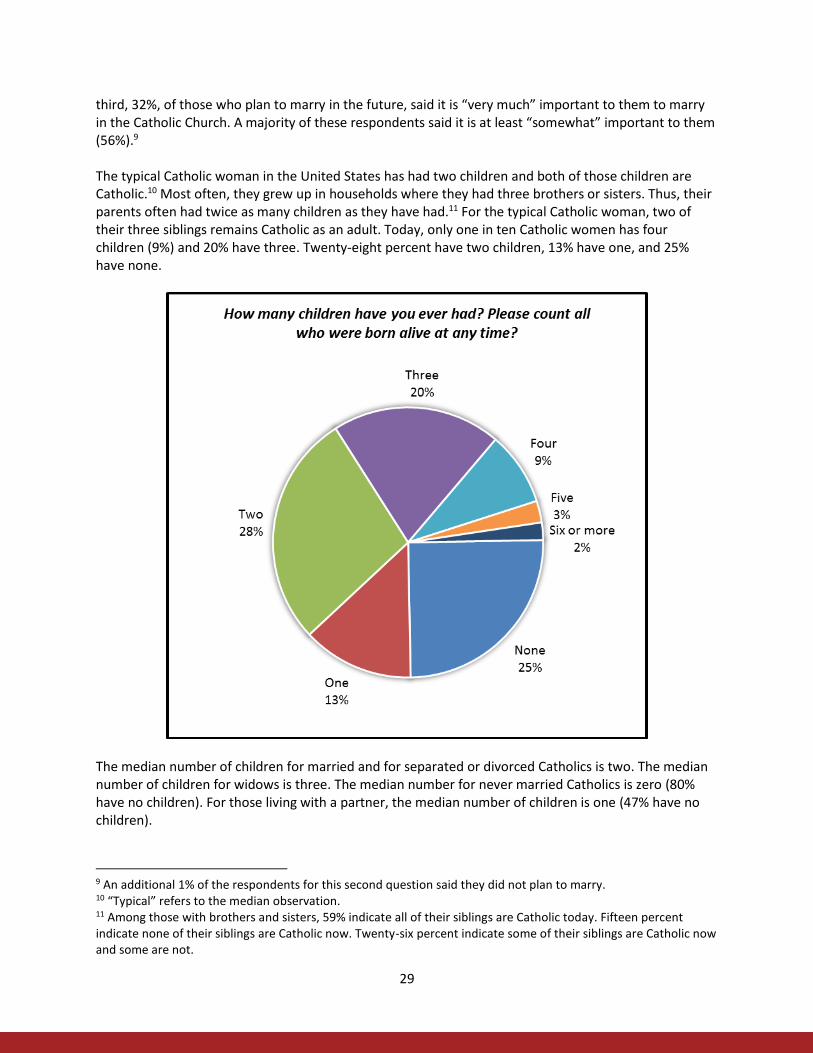
third, 32%, of those who plan to marry in the future, said it is “very much” important to them to marry in the Catholic Church. A majority of these respondents said it is at least “somewhat” important to them (56%).9 The typical Catholic woman in the United States has had two children and both of those children are Catholic.10 Most often, they grew up in households where they had three brothers or sisters. Thus, their parents often had twice as many children as they have had.11 For the typical Catholic woman, two of their three siblings remains Catholic as an adult. Today, only one in ten Catholic women has four children (9%) and 20% have three. Twenty-eight percent have two children, 13% have one, and 25% have none.
The median number of children for married and for separated or divorced Catholics is two. The median number of children for widows is three. The median number for never married Catholics is zero (80% have no children). For those living with a partner, the median number of children is one (47% have no children).
9 An additional 1% of the respondents for this second question said they did not plan to marry. 10 “Typical” refers to the median observation. 11 Among those with brothers and sisters, 59% indicate all of their siblings are Catholic today. Fifteen percent indicate none of their siblings are Catholic now. Twenty-six percent indicate some of their siblings are Catholic now and some are not.
30
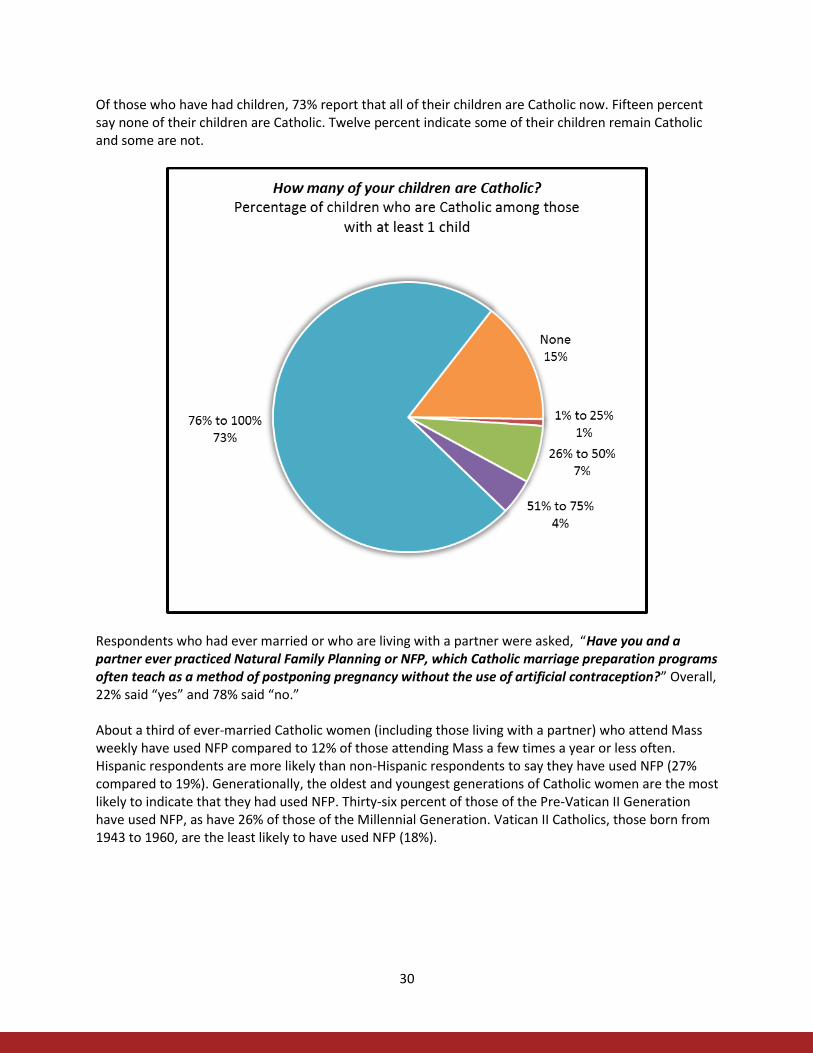
Of those who have had children, 73% report that all of their children are Catholic now. Fifteen percent say none of their children are Catholic. Twelve percent indicate some of their children remain Catholic and some are not.
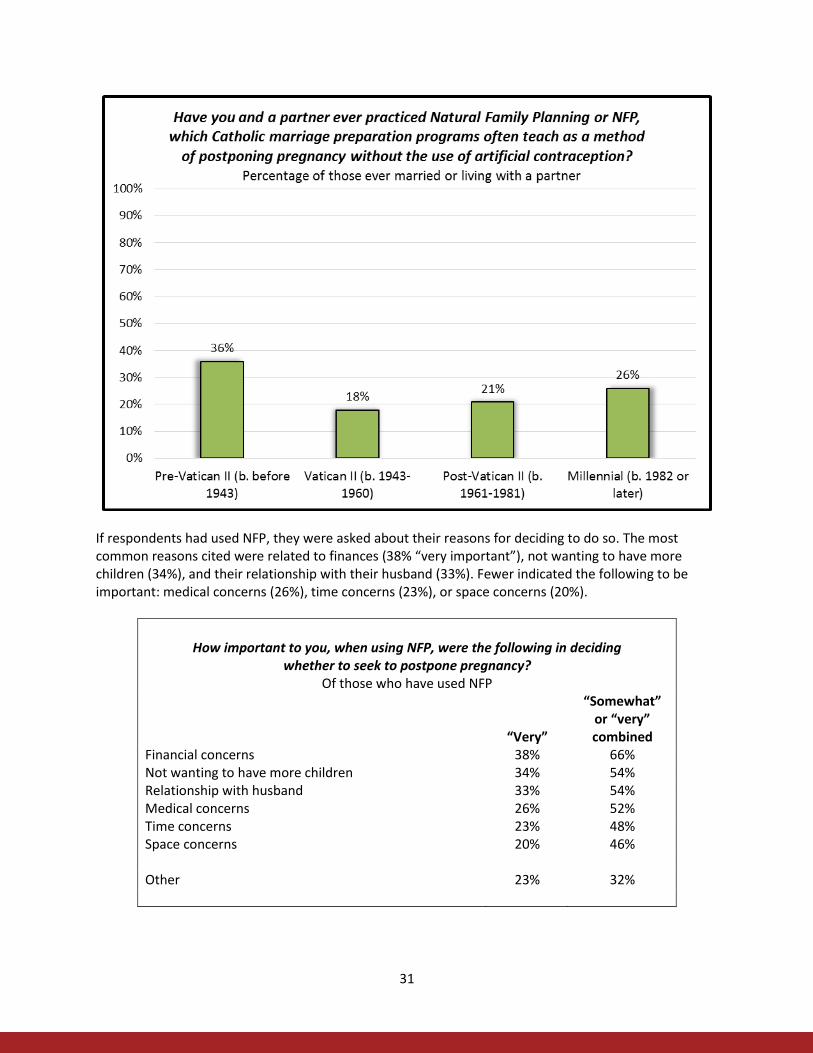
Respondents who had ever married or who are living with a partner were asked, “Have you and a partner ever practiced Natural Family Planning or NFP, which Catholic marriage preparation programs often teach as a method of postponing pregnancy without the use of artificial contraception?” Overall, 22% said “yes” and 78% said “no.” About a third of ever-married Catholic women (including those living with a partner) who attend Mass weekly have used NFP compared to 12% of those attending Mass a few times a year or less often. Hispanic respondents are more likely than non-Hispanic respondents to say they have used NFP (27% compared to 19%). Generationally, the oldest and youngest generations of Catholic women are the most likely to indicate that they had used NFP. Thirty-six percent of those of the Pre-Vatican II Generation have used NFP, as have 26% of those of the Millennial Generation. Vatican II Catholics, those born from 1943 to 1960, are the least likely to have used NFP (18%).
31
If respondents had used NFP, they were asked about their reasons for deciding to do so. The most common reasons cited were related to finances (38% “very important”), not wanting to have more children (34%), and their relationship with their husband (33%). Fewer indicated the following to be important: medical concerns (26%), time concerns (23%), or space concerns (20%).
How important to you, when using NFP, were the following in deciding
whether to seek to postpone pregnancy? Of those who have used NFP
“Very”
“Somewhat” or “very” combined
Financial concerns 38% 66% Not wanting to have more children 34% 54% Relationship with husband 33% 54% Medical concerns 26% 52% Time concerns 23% 48% Space concerns 20% 46% Other 23% 32%

32
Political and Social Issues GfK collects information on respondents’ political party affiliation as part of its demographic and background profile for the panel.12 Forty-one percent of adult Catholic women in the United States are Democrats (excluding “leaners,” 59% including leaners). Twenty-four percent of adult Catholic women in the United States are Republicans (excluding “leaners,” 38% including leaners). Thirty-five percent are undecided or party leaners (3% are unaffiliated if “leaners” are excluded).
As shown in the table on the next page, Republicans are more likely than Democrats to say they intend to vote in November 2018 (87% compared to 79%). However, given the larger number of Democrats, this segment would still outnumber Republicans at the polls if vote intentions reflect actual turnout. Only 59% of the undecided or party leaners say they intend to vote in 2018. Overall, the poll estimates 74% of Catholic women intend to vote in next year’s election. There are an estimated 25.3 million Catholic female adults who are eligible to vote.13 If 74% of this population were to turnout to vote at the midterms this would be equivalent to an 18.7 million voters. Vote intentions do not always translate into voter turnout. Since 2002, between 36% and 41% of the voting eligible population has voted in midterm elections. If 40% of eligible Catholic women were to vote in November 2018 this would be equivalent to a voting bloc of 10.1 million. In 2014, a total of 83.3 million votes were cast in the midterm elections.
12 The survey did not include a question about partisanship. 13 Those who are at least 18 years old and U.S. citizens.
33
Do you intend to vote in Congressional elections in November 2018?
Yes No
Republican 87% 13%
Democrat 79% 21%
All Catholic women 74% 26%
Unaffiliated or leaner 59% 41%
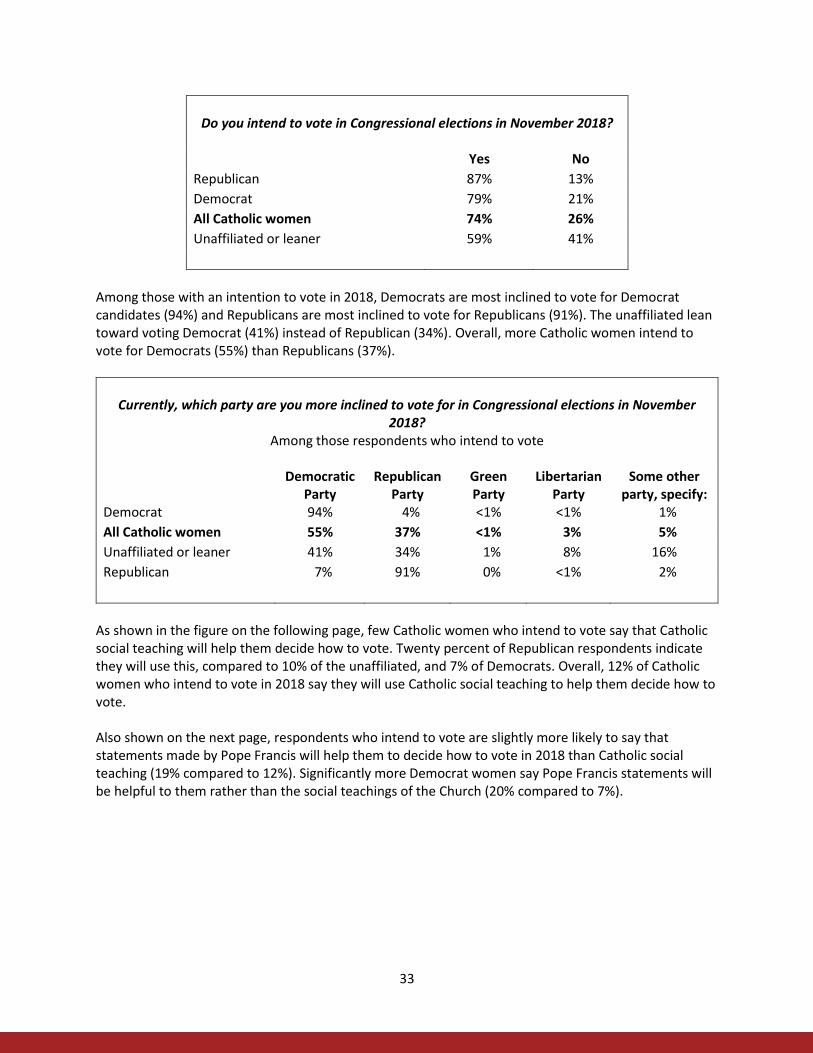
Among those with an intention to vote in 2018, Democrats are most inclined to vote for Democrat candidates (94%) and Republicans are most inclined to vote for Republicans (91%). The unaffiliated lean toward voting Democrat (41%) instead of Republican (34%). Overall, more Catholic women intend to vote for Democrats (55%) than Republicans (37%).
Currently, which party are you more inclined to vote for in Congressional elections in November
2018? Among those respondents who intend to vote
Democratic
Party Republican
Party Green Party
Libertarian Party
Some other party, specify:
Democrat 94% 4% <1% <1% 1%
All Catholic women 55% 37% <1% 3% 5%
Unaffiliated or leaner 41% 34% 1% 8% 16%
Republican 7% 91% 0% <1% 2%
As shown in the figure on the following page, few Catholic women who intend to vote say that Catholic social teaching will help them decide how to vote. Twenty percent of Republican respondents indicate they will use this, compared to 10% of the unaffiliated, and 7% of Democrats. Overall, 12% of Catholic women who intend to vote in 2018 say they will use Catholic social teaching to help them decide how to vote. Also shown on the next page, respondents who intend to vote are slightly more likely to say that statements made by Pope Francis will help them to decide how to vote in 2018 than Catholic social teaching (19% compared to 12%). Significantly more Democrat women say Pope Francis statements will be helpful to them rather than the social teachings of the Church (20% compared to 7%).

34
Only about 7% of respondents who intend to vote say the statements of the U.S. bishops or their pastor/parish priest will be helpful to them in deciding how to vote. In both cases, Republicans are more likely than Democrats to say the statements of the bishops (12% compared to 4%) and their pastor/parish priest (9% compared to 5%) will be helpful to them.

35
Overall, 73% of Catholic women who intend to vote say that the social teachings of the Church as well as statements by Pope Francis, the U.S. bishops, and their pastor will not be helpful to them in deciding how to vote in 2018 elections. The table below shows results for questions about the importance of Church teachings and their potential use by respondents in deciding how to vote in elections. First, the share who say any of these teachings are at least “a little” important to them is shown. Next, shown is the share who said the teaching affects how they vote “somewhat” or “very much” (i.e., among those who said these teachings were at least “a little” important to them).
How important to you are the Catholic Church’s teachings on the following issues? How much do the
Catholic Church’s teachings on these issues affect how you vote in elections? Percentages saying the teaching is “a little,” “somewhat,” or “very much” important to them and among these respondents, the percentage saying these are “somewhat” or “very much”
likely to affect how they vote in elections
All Catholic women
Democrat
Unaffiliated or leaner
Republican
Care for environment At least “a little” important 83% 86% 79% 82% Affects voting “somewhat”/“very much” 52% 55% 49% 50% Abortion At least “a little” important 76% 75% 72% 81% Affects voting “somewhat”/“very much” 55% 51% 54% 63% Migration, refugees At least “a little” important 77% 83% 74% 72% Affects voting “somewhat”/“very much” 52% 53% 50% 52% Death Penalty At least “a little” important 76% 79% 73% 75% Affects voting “somewhat”/“very much” 51% 52% 50% 52% Physician-assisted suicide At least “a little” important 71% 72% 67% 76% Affects voting “somewhat”/“very much” 50% 49% 50% 49% Same-sex marriage At least “a little” important 63% 62% 59% 71% Affects voting “somewhat”/“very much” 52% 51% 52% 55% Artificial birth control At least “a little” important 63% 64% 60% 63% Affects voting “somewhat”/“very much” 49% 50% 47% 49%
Thus, respondents were asked to rate the importance of Church teachings and to report how much these teachings might impact their voting. Among these seven issues, each share of importance is multiplied by the share saying the teachings affect their voting. The items in the table are listed in rank order of their effective impact on voting by Catholic women.
36
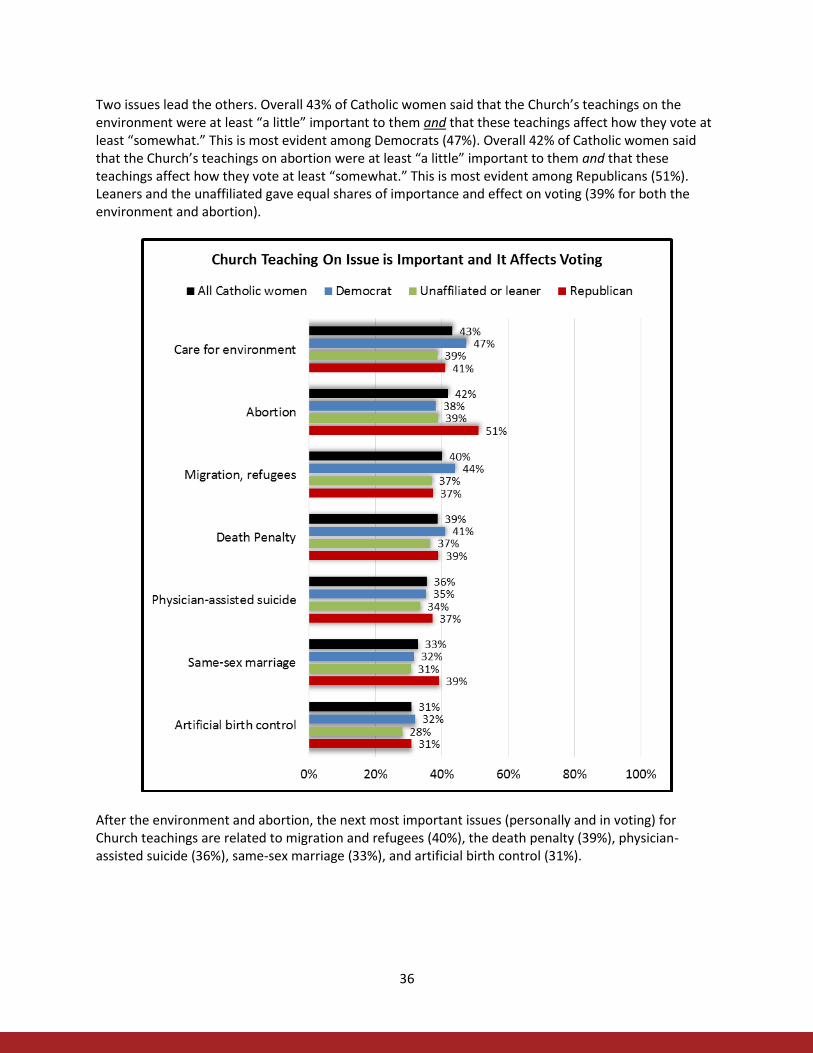
Two issues lead the others. Overall 43% of Catholic women said that the Church’s teachings on the environment were at least “a little” important to them and that these teachings affect how they vote at least “somewhat.” This is most evident among Democrats (47%). Overall 42% of Catholic women said that the Church’s teachings on abortion were at least “a little” important to them and that these teachings affect how they vote at least “somewhat.” This is most evident among Republicans (51%). Leaners and the unaffiliated gave equal shares of importance and effect on voting (39% for both the environment and abortion).
After the environment and abortion, the next most important issues (personally and in voting) for Church teachings are related to migration and refugees (40%), the death penalty (39%), physician-assisted suicide (36%), same-sex marriage (33%), and artificial birth control (31%).
37
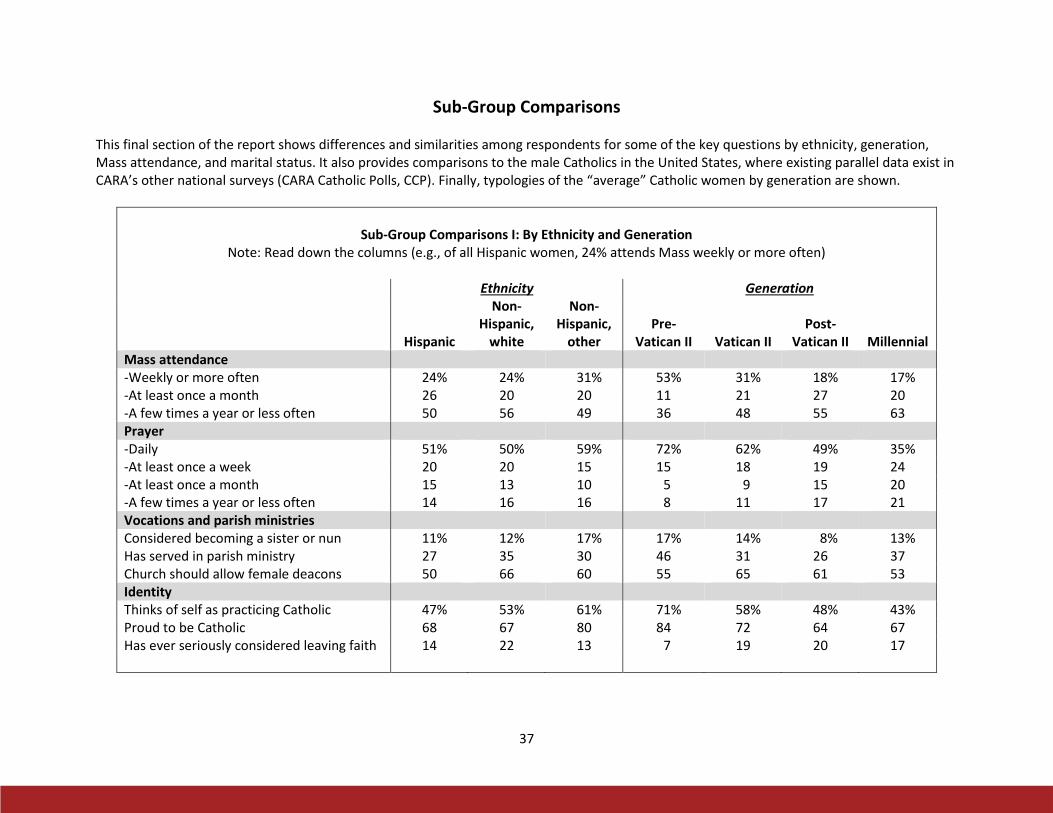
Sub-Group Comparisons
This final section of the report shows differences and similarities among respondents for some of the key questions by ethnicity, generation, Mass attendance, and marital status. It also provides comparisons to the male Catholics in the United States, where existing parallel data exist in CARA’s other national surveys (CARA Catholic Polls, CCP). Finally, typologies of the “average” Catholic women by generation are shown.
Sub-Group Comparisons I: By Ethnicity and Generation Note: Read down the columns (e.g., of all Hispanic women, 24% attends Mass weekly or more often)
Ethnicity Generation
Hispanic
Non-Hispanic,
white
Non-Hispanic,
other Pre-
Vatican II Vatican II Post-
Vatican II Millennial Mass attendance -Weekly or more often 24% 24% 31% 53% 31% 18% 17% -At least once a month 26 20 20 11 21 27 20 -A few times a year or less often 50 56 49 36 48 55 63 Prayer-Daily 51% 50% 59% 72% 62% 49% 35% -At least once a week 20 20 15 15 18 19 24 -At least once a month 15 13 10 5 9 15 20 -A few times a year or less often 14 16 16 8 11 17 21 Vocations and parish ministriesConsidered becoming a sister or nun 11% 12% 17% 17% 14% 8% 13% Has served in parish ministry 27 35 30 46 31 26 37 Church should allow female deacons 50 66 60 55 65 61 53 IdentityThinks of self as practicing Catholic 47% 53% 61% 71% 58% 48% 43% Proud to be Catholic 68 67 80 84 72 64 67 Has ever seriously considered leaving faith 14 22 13 7 19 20 17

38
Sub-Group Comparisons II: By Ethnicity and Generation Note: Read down the columns (e.g., of all Hispanic women, 47% say teachings on abortion are “very important” to them)
Ethnicity Generation
Hispanic
Non-Hispanic,
white
Non-Hispanic,
other Pre-
Vatican II Vatican II Post-
Vatican II Millennial Church teachings “very important” to R Abortion 47% 34% 34% 56% 37% 39% 34% Care for the environment 47 18 33 46 37 40 32 Migration and refugees 47 18 33 28 27 35 26 Physician-assisted suicide 42 21 17 37 28 29 23 Death penalty 40 21 26 40 26 30 25 Divorce and remarriage 38 21 29 26 26 28 28 Same-sex marriage 32 21 29 38 28 25 21 Artificial birth control 30 14 18 21 18 22 20 Women’s ordination 26 18 28 22 23 22 19 Party identification -Republican 8% 35% 10% 38% 27% 23% 16% -Unaffiliated, 3rd party, or “leaner” 34 35 36 30 32 36 38 -Democrat 58 30 54 32 41 41 46 2018 ElectionIntends to vote 60% 84% 66% 95% 90% 66% 60% Use for voting: Catholic social teaching 7 14 8 21 12 6 15 Use for voting: Pope Francis statements 19 18 25 20 18 16 25 Use for voting: Pastor/priest advice 6 7 7 10 5 6 9

39
Sub-Group Comparisons III: By Ethnicity and Generation Note: Read down the columns (e.g., of all Hispanic women, 65% are married or widowed)
Ethnicity Generation
Hispanic
Non-Hispanic,
white
Non-Hispanic,
other Pre-
Vatican II Vatican II Post-
Vatican II Millennial Marital status -Married or widowed 65% 72% 63% 83% 80% 74% 43% -Divorced or separated 11 10 6 13 12 12 2 -Never married 16 13 27 4 7 8 41 -Living with a partner 8 5 4 0 1 6 14 If ever married or living with partner:Has used NFP 27% 19% 22% 36% 18% 21% 26% Highest education-High school or less 63% 35% 23% 63% 48% 42% 34% -Some college 21 31 24 21 28 25 32 -Bachelor’s degree or more 16 34 53 16 24 33 34 Employment status-Currently working 53% 59% 71% 8% 40% 74% 71% -Not working, layoff or looking for work 13 3 5 2 2 7 13 -Not working, retired or disability 17 31 18 88 51 6 2 -Not working, other 17 7 6 2 7 13 14 Number of children-None 19% 28% 27% 10% 16% 14% 58% -One or two 34 45 48 24 52 48 22 -Three or more 47 27 25 66 32 38 20

40
Sub-Group Comparisons IV: By Mass Attendance and Marital Status
Note: Read down the columns (e.g., of all weekly attenders, 34% are Hispanic)
Mass Attendance Marital Status Weekly or
more often
At least once a month
A few times a
year or less
Married or
widowed
Divorced or
separated
Never
married
Living with a
partner Ethnicity -Hispanic 34% 41% 32% 32% 39% 37% 47% -Non-Hispanic, white 56 52 60 60 56 48 47 -Non-Hispanic, other race/ethnicity 10 8 8 8 5 15 6 Prayer -Daily 81% 57% 35% 55% 56% 41% 35% -At least once a week 12 26 21 21 14 20 12 -At least once a month 6 12 18 12 12 17 21 -A few times a year or less often 1 5 26 12 18 22 32 Vocations and parish ministries Considered becoming a sister or nun 19% 14% 8% 12% 12% 11% 12% Has served in parish ministry 61 34 18 34 22 27 31 Church should allow female deacons 53 59 63 61 60 55 53 Identity Thinks of self as practicing Catholic 91% 75% 24% 56% 43% 41% 45% Proud to be Catholic 93 79 53 70 63 65 70 Has ever seriously considered leaving faith 9 15 24 18 19 19 24

41
Sub-Group Comparisons V: By Mass Attendance and Marital Status Note: Read down the columns (e.g., of all weekly attenders, 62% say teachings on abortion are “very important” to them)
Mass Attendance Marital Status Weekly or
more often
At least once a month
A few times a
year or less
Married or
widowed
Divorced or
separated Never
married
Living with a
partner Church teachings “very important” to R Abortion 62% 46% 25% 42% 34% 26% 38% Care for the environment 54 40 28 39 31 35 33 Migration and refugees 45 35 20 32 25 21 29 Physician-assisted suicide 48 31 17 30 30 18 24 Death penalty 47 32 18 30 26 23 23 Divorce and remarriage 43 30 19 28 28 21 31 Same-sex marriage 48 27 15 29 22 18 18 Artificial birth control 33 20 14 22 19 14 19 Women’s ordination 41 19 14 23 19 17 21 Party identification -Republican 29% 22% 22% 27% 17% 16% 14% -Unaffiliated, 3rd party, or “leaner” 29 35 38 34 34 37 41 -Democrat 42 43 40 39 49 47 45 2018 ElectionIntends to vote 83% 73% 70% 76% 77% 72% 56% Use for voting: Catholic social teaching 27 13 3 12 12 13 6 Use for voting: Pope Francis statements 27 22 13 18 15 26 24 Use for voting: Pastor/priest advice 15 7 2 6 3 9 10
42
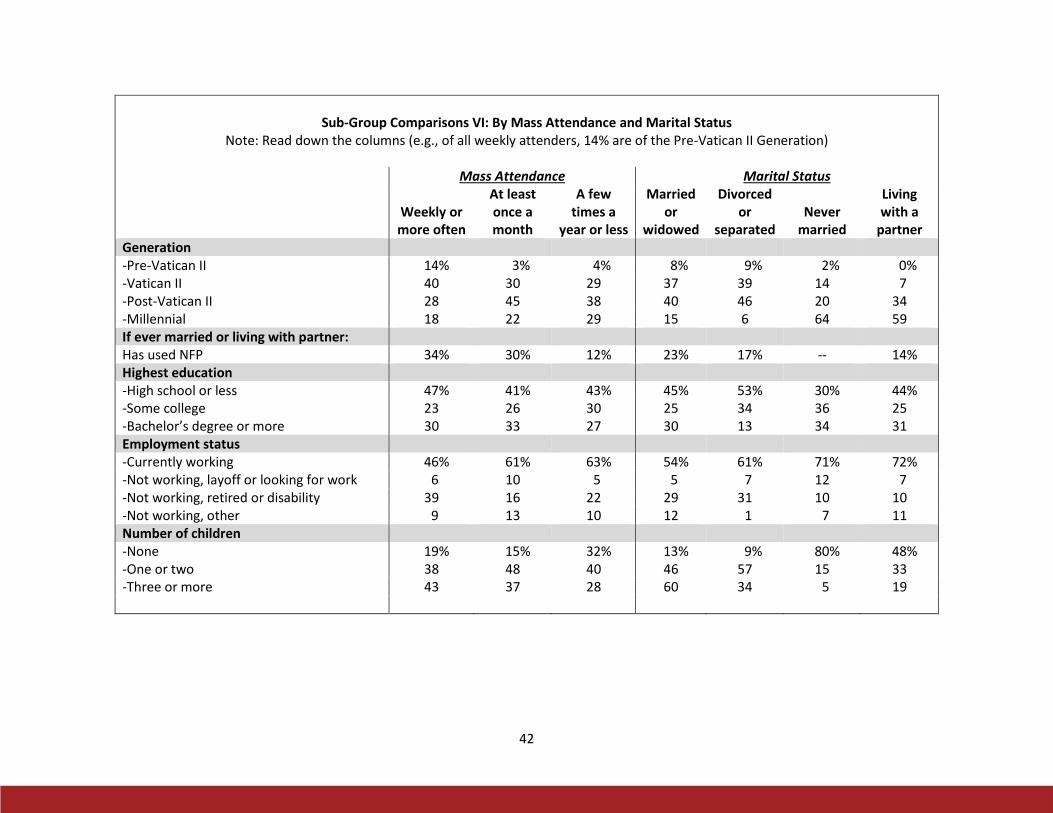
Sub-Group Comparisons VI: By Mass Attendance and Marital Status
Note: Read down the columns (e.g., of all weekly attenders, 14% are of the Pre-Vatican II Generation)
Mass Attendance Marital Status
Weekly or more often
At least once a month
A few times a
year or less
Married or
widowed
Divorced or
separated
Never
married
Living with a
partner Generation -Pre-Vatican II 14% 3% 4% 8% 9% 2% 0% -Vatican II 40 30 29 37 39 14 7 -Post-Vatican II 28 45 38 40 46 20 34 -Millennial 18 22 29 15 6 64 59 If ever married or living with partner: Has used NFP 34% 30% 12% 23% 17% -- 14% Highest education -High school or less 47% 41% 43% 45% 53% 30% 44% -Some college 23 26 30 25 34 36 25 -Bachelor’s degree or more 30 33 27 30 13 34 31 Employment status -Currently working 46% 61% 63% 54% 61% 71% 72% -Not working, layoff or looking for work 6 10 5 5 7 12 7 -Not working, retired or disability 39 16 22 29 31 10 10 -Not working, other 9 13 10 12 1 7 11 Number of children -None 19% 15% 32% 13% 9% 80% 48% -One or two 38 48 40 46 57 15 33 -Three or more 43 37 28 60 34 5 19

43
The table below compares responses from the poll of Catholic women to responses from Catholic men in recent CARA Catholic Polls (CCP) where a parallel question was asked. Catholic women are more likely than Catholic men to attend Mass weekly (24% compared to 19%), pray daily (55% compared to 33%), and to self-identify as Democrats (41% compared to 32%). There is less variation by gender in the strength of belief in God or in the frequency of going to confession.
Sub-Group Comparisons VII: By Gender, Using Other CARA Surveys Note: Read down the columns (e.g., Of women, 24% are weekly Mass attenders)
Women Men Mass attendance -Weekly or more often 24% 19% -At least once a month 23 27 -A few times a year or less often 53 54 Prayer-Daily 51% 33% -Weekly 20 17 -Less often 29 50 Belief in God-Believes without doubt 78% 73% -Believes with some doubt at times 20 21 -Does not believe, but still believe it is possible God may exist 2 5 -Does not believe in God and is entirely sure God does not exist <1 1 Sacrament of Reconciliation-Once a month or more often 3% 3% -At least once a year 27 24 -Less often 70 73 Party Identification-Republican 24% 27% -Unaffiliated, 3rd party, or “leaner” 35 41 -Democrat 41 32
The “Average” Catholic Woman, by Generation Below, we provide narratives for an “average” Catholic woman in the United States, by generation, as gleaned from the survey data. These are grounded in the statistical analysis but are meant to reflect an individual.
Pre-Vatican II: Mary The “average” Pre-Vatican II Catholic woman is 79 today (born in 1938) and lives in Western Pennsylvania.14 The most common name for female children born at this time was Mary. She is non-Hispanic white, a Republican, and is married (her husband is Catholic). She had three children in her lifetime and likely has about six grandchildren. She never considered becoming a sister or nun because she wanted to be a mother. She went to Catholic elementary and middle school but then attended a
14 Twenty-eight percent of Pre-Vatican II women reside in the Midwest. The same share live in the Northeast.
44
public high school. She attends Mass at least once a week, every week, and prays daily. When praying she is often saying a specific Catholic prayer and praying for the wellbeing of family and friends. At some point in her life she has served in parish ministry. She thinks of herself as a practicing Catholic and is proud to be a member of her faith. She never seriously considered leaving it at any point in her life. The Church’s teachings on abortion are very important to her. She did not attend college and is currently retired.
Vatican II: Patricia The “average” Vatican II Catholic woman is 64 today (born in 1953) and lives in the state of New York. She was also born during a time when her name was still most likely to be Mary but her parents, like some others, may have preferred another popular option for this period—like Patricia. She is non-Hispanic white, a Democrat, and is married (her husband is Catholic). She had two children in her lifetime and likely has about four grandchildren. She never considered becoming a sister or nun because she wanted to be a mother and also felt she could do God’s will without pursuing a religious vocation. She went to Catholic elementary and middle school but attended a public high school. She attends Mass a few times a year and prays daily. When praying, she is often praying for the wellbeing of family and friends and isn’t likely to be saying a specific Catholic prayer. She thinks of herself as a practicing Catholic and is proud of her religion. She never seriously considered leaving it at any point in her life. The Church’s teachings on abortion and care for the environment are more important to her than other teachings. She has attended college and is either in her last years of work or currently retired.
Post-Vatican II: Michelle The “average” Post-Vatican II Catholic woman is 46 today (born in 1971) and lives in California. She was born during a time when the name Mary was much less common and her parents might have selected Michelle, one of the most popular names at the time. She is non-Hispanic white, a Democrat, and is married (her husband is Catholic). She has had two children. She never considered becoming a sister or nun because she just never really thought about it. If she had, the desire to be a mother would have also been a factor making her unlikely to seek a vocation. She never attended a Catholic school. She attends Mass a few times a year. When she prays a few times a week she is often doing so for the wellbeing of family and isn’t likely to be saying a specific Catholic prayer. Sometimes when she prays she is simply “talking to God.” She is conflicted about thinking of herself as a practicing Catholic—sometimes she feels that she is and at other times not. At the same time she is proud to be Catholic. She never seriously considered leaving at any point in her life but some of her childhood Catholic friends did and now have different religious affiliations. The Church’s teachings on care for the environment are more important to her than most other teachings. She has attended college, has a degree, and is working.
Millennial: Alicia The “average” Millennial Catholic woman is 27 today (born in 1990) and lives in Texas. She is Hispanic and her parents named her Alicia, a popular choice at the time of her birth. She is engaged to be married.15 Her fiancé is Catholic. They have one child together. She is a Democrat but does not consider herself to be very involved in politics. She is more likely than older Catholic Hispanic women and other non-Hispanic white Catholic women her age to have considered becoming a sister or nun. She never attended a Catholic school. She tries to attend Mass at least once a month but doesn’t always make it that often. When she prays a few times a week she is often doing so for the wellbeing of family. She also
15 Ethnicity has such a strong impact on many of the responses to the survey that this profile specifically takes into account the responses of Millennial Catholic women who self-identify as Hispanic. Millennials who are non-Hispanic white, as noted above, have a different profile.
45
says specific Catholic prayers. She is much more likely than non-Hispanic white Catholic women her age to have participated in Eucharistic Adoration, prayer groups, retreats, and Bible study. One of the biggest differences between Catholic Hispanic women and Catholic non-Hispanic white women of this generation is in their beliefs about the importance of receiving Holy Communion for their sense of being Catholic. A majority of Hispanic women surveyed said this was “very important” to them (54%) when only about a quarter of non-Hispanic white women indicated this (27%). She is also conflicted about thinking of herself as a practicing Catholic—sometimes she feels that she is and at other times not. She is proud to be Catholic—more so than non-Hispanic white Catholic women her age. She has never seriously considered leaving Catholicism. Living a life consistent with Church teachings is much more important to her sense of being Catholic than among non-Hispanic white Catholic women her age. At the same time, Church teachings are most likely to be only “somewhat’ important to her on a variety of issues rather than “very important.” She has attended some college but does not have a degree at this time. She is currently working.

46
Appendix: Questions and Topline Responses
Survey Language
N Percent English version 1213 80.4
Spanish version 295 19.6
Total 1508 100.0
Primary Language
N Percent English Proficient 90 6.0
Bilingual 272 18.1
Spanish Proficient 160 10.6
Non-Hispanics, not asked 986 65.4
Total 1508 100.0
What is your religious preference? Is it…
N Percent Catholic (Roman Catholic) 1508 100.0
[Death Penalty] Next, how important to you are the Catholic Church’s teachings on the following issues?
N Percent Not at all 356 23.9
A little 276 18.5
Somewhat 441 29.6
Very much 418 28.0
Total 1492 100.0
Missing Refused 16
Total 1508
[Migration/refugees] Next, how important to you are the Catholic Church’s teachings on the following issues?
N Percent Not at all 337 22.7
A little 282 19.0
Somewhat 427 28.8
Very much 438 29.5
Total 1484 100.0
Missing Refused 24
Total 1508
47
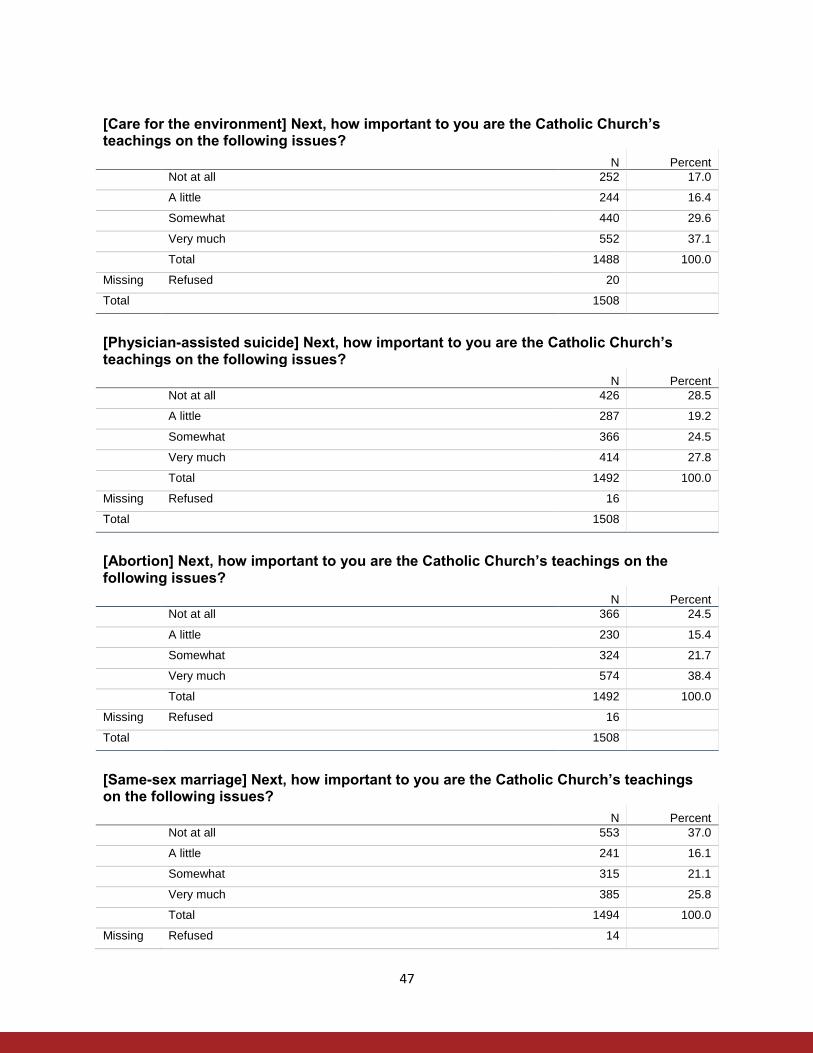
[Care for the environment] Next, how important to you are the Catholic Church’s teachings on the following issues?
N Percent Not at all 252 17.0
A little 244 16.4
Somewhat 440 29.6
Very much 552 37.1
Total 1488 100.0
Missing Refused 20
Total 1508
[Physician-assisted suicide] Next, how important to you are the Catholic Church’s teachings on the following issues?
N Percent Not at all 426 28.5
A little 287 19.2
Somewhat 366 24.5
Very much 414 27.8
Total 1492 100.0
Missing Refused 16
Total 1508
[Abortion] Next, how important to you are the Catholic Church’s teachings on the following issues?
N Percent Not at all 366 24.5
A little 230 15.4
Somewhat 324 21.7
Very much 574 38.4
Total 1492 100.0
Missing Refused 16
Total 1508
[Same-sex marriage] Next, how important to you are the Catholic Church’s teachings on the following issues?
N Percent Not at all 553 37.0
A little 241 16.1
Somewhat 315 21.1
Very much 385 25.8
Total 1494 100.0
Missing Refused 14
48
Total 1508
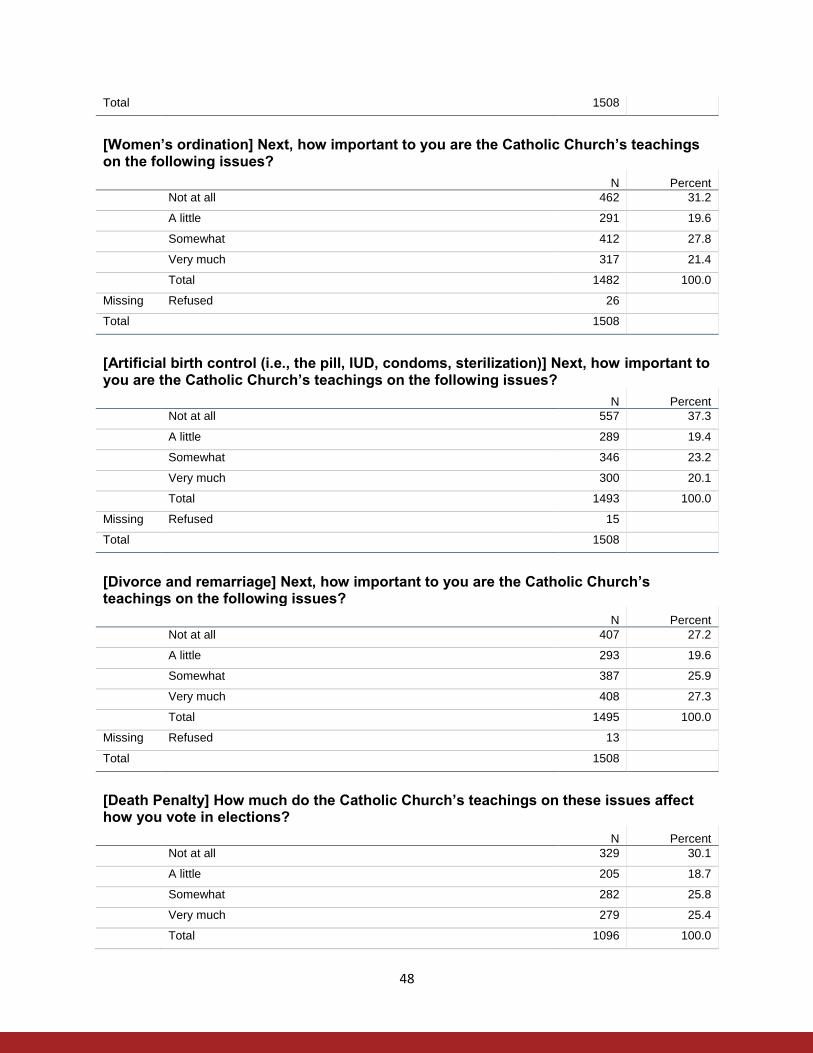
[Women’s ordination] Next, how important to you are the Catholic Church’s teachings on the following issues?
N Percent Not at all 462 31.2
A little 291 19.6
Somewhat 412 27.8
Very much 317 21.4
Total 1482 100.0
Missing Refused 26
Total 1508
[Artificial birth control (i.e., the pill, IUD, condoms, sterilization)] Next, how important to you are the Catholic Church’s teachings on the following issues?
N Percent Not at all 557 37.3
A little 289 19.4
Somewhat 346 23.2
Very much 300 20.1
Total 1493 100.0
Missing Refused 15
Total 1508
[Divorce and remarriage] Next, how important to you are the Catholic Church’s teachings on the following issues?
N Percent Not at all 407 27.2
A little 293 19.6
Somewhat 387 25.9
Very much 408 27.3
Total 1495 100.0
Missing Refused 13
Total 1508
[Death Penalty] How much do the Catholic Church’s teachings on these issues affect how you vote in elections?
N Percent Not at all 329 30.1
A little 205 18.7
Somewhat 282 25.8
Very much 279 25.4
Total 1096 100.0
49
Missing Refused 40
System 372
Total 412
Total 1508
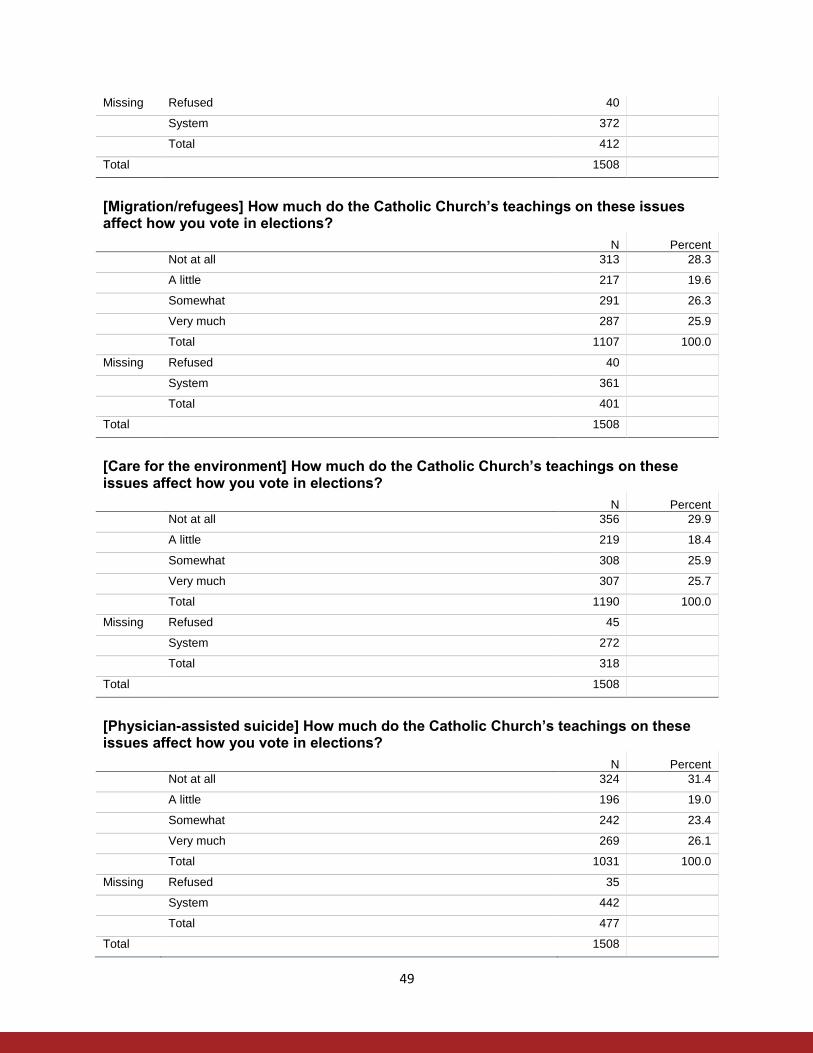
[Migration/refugees] How much do the Catholic Church’s teachings on these issues affect how you vote in elections?
N Percent Not at all 313 28.3
A little 217 19.6
Somewhat 291 26.3
Very much 287 25.9
Total 1107 100.0
Missing Refused 40
System 361
Total 401
Total 1508
[Care for the environment] How much do the Catholic Church’s teachings on these issues affect how you vote in elections?
N Percent Not at all 356 29.9
A little 219 18.4
Somewhat 308 25.9
Very much 307 25.7
Total 1190 100.0
Missing Refused 45
System 272
Total 318
Total 1508
[Physician-assisted suicide] How much do the Catholic Church’s teachings on these issues affect how you vote in elections?
N Percent Not at all 324 31.4
A little 196 19.0
Somewhat 242 23.4
Very much 269 26.1
Total 1031 100.0
Missing Refused 35
System 442
Total 477
Total 1508

50
[Abortion] How much do the Catholic Church’s teachings on these issues affect how you vote in elections?
N Percent Not at all 313 28.7
A little 179 16.4
Somewhat 224 20.6
Very much 374 34.3
Total 1090 100.0
Missing Refused 37
System 381
Total 418
Total 1508
[Same-sex marriage] How much do the Catholic Church’s teachings on these issues affect how you vote in elections?
N Percent Not at all 274 30.2
A little 161 17.7
Somewhat 240 26.4
Very much 234 25.8
Total 909 100.0
Missing Refused 32
System 567
Total 599
Total 1508
[Artificial birth control (i.e., the pill, IUD, condoms, sterilization)] How much do the Catholic Church’s teachings on these issues affect how you vote in elections?
N Percent Not at all 282 31.1
A little 185 20.4
Somewhat 257 28.3
Very much 184 20.3
Total 907 100.0
Missing Refused 28
System 572
Total 601
Total 1508
Aside from weddings and funerals, about how often do you attend Mass?
N Percent Rarely or never 396 26.3
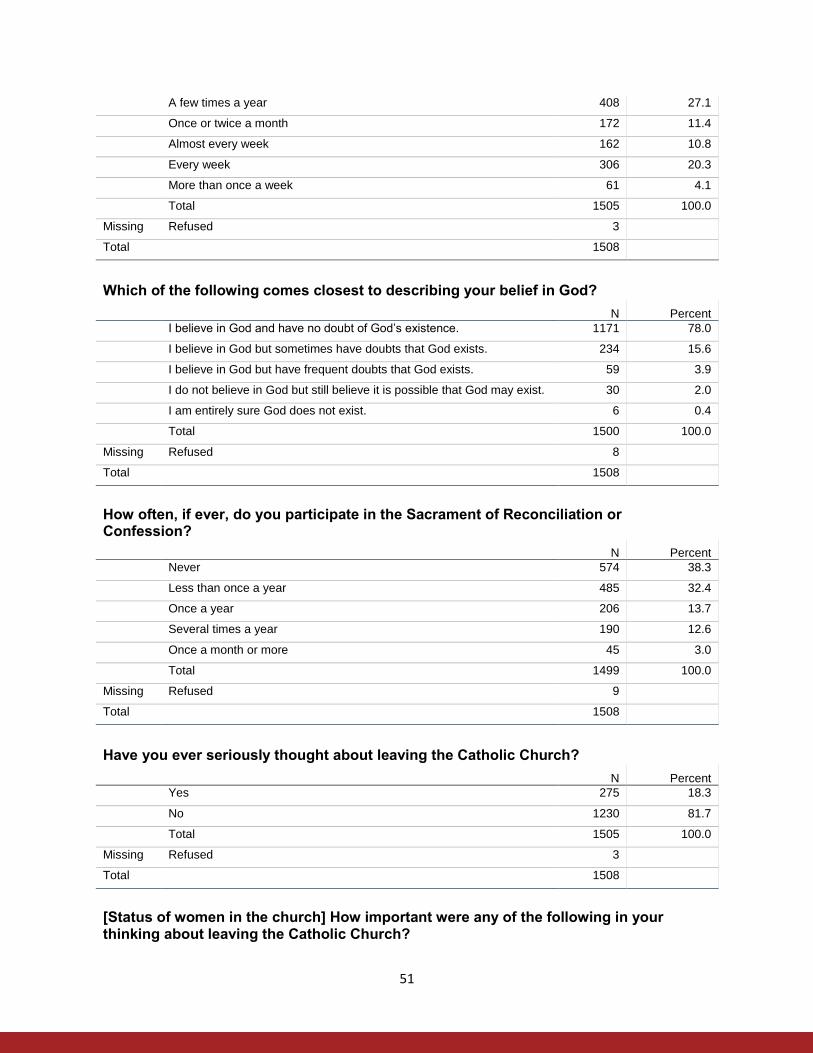
51
A few times a year 408 27.1
Once or twice a month 172 11.4
Almost every week 162 10.8
Every week 306 20.3
More than once a week 61 4.1
Total 1505 100.0
Missing Refused 3
Total 1508
Which of the following comes closest to describing your belief in God?
N Percent I believe in God and have no doubt of God’s existence. 1171 78.0
I believe in God but sometimes have doubts that God exists. 234 15.6
I believe in God but have frequent doubts that God exists. 59 3.9
I do not believe in God but still believe it is possible that God may exist. 30 2.0
I am entirely sure God does not exist. 6 0.4
Total 1500 100.0
Missing Refused 8
Total 1508
How often, if ever, do you participate in the Sacrament of Reconciliation or Confession?
N Percent Never 574 38.3
Less than once a year 485 32.4
Once a year 206 13.7
Several times a year 190 12.6
Once a month or more 45 3.0
Total 1499 100.0
Missing Refused 9
Total 1508
Have you ever seriously thought about leaving the Catholic Church?
N Percent Yes 275 18.3
No 1230 81.7
Total 1505 100.0
Missing Refused 3
Total 1508
[Status of women in the church] How important were any of the following in your thinking about leaving the Catholic Church?

52
N Percent Not at all 98 35.7
A little 44 16.2
Somewhat 70 25.6
Very much 62 22.5
Total 274 100.0
Missing Refused 1
System 1233
Total 1234
Total 1508
[Was attracted to another religion] How important were any of the following in your thinking about leaving the Catholic Church?
N Percent Not at all 132 48.0
A little 56 20.3
Somewhat 63 23.1
Very much 23 8.5
Total 274 100.0
Missing Refused 1
System 1233
Total 1234
Total 1508
[Was less interested in any form of religion] How important were any of the following in your thinking about leaving the Catholic Church?
N Percent Not at all 96 35.1
A little 72 26.3
Somewhat 66 24.2
Very much 40 14.5
Total 273 100.0
Missing Refused 1
System 1233
Total 1235
Total 1508
[Disagreed with church teaching(s)] How important were any of the following in your thinking about leaving the Catholic Church?
N Percent Not at all 35 12.7
A little 51 18.4
Somewhat 86 31.1

53
Very much 104 37.8
Total 275 100.0
Missing System 1233
Total 1508
[Belief that Catholic Church teachings conflict with science] How important were any of the following in your thinking about leaving the Catholic Church?
N Percent Not at all 119 43.7
A little 55 20.1
Somewhat 58 21.1
Very much 41 15.1
Total 273 100.0
Missing Refused 2
System 1233
Total 1235
Total 1508
[Did not feel welcome or part of the community at my parish] How important were any of the following in your thinking about leaving the Catholic Church?
N Percent Not at all 123 44.9
A little 43 15.8
Somewhat 65 23.8
Very much 42 15.5
Total 274 100.0
Missing Refused 1
System 1233
Total 1234
Total 1508
Did you ever leave the Catholic Church, no longer considering yourself Catholic, for a time in your life?
N Percent Yes 86 31.4
No 188 68.6
Total 274 100.0
Missing Refused 1
System 1233
Total 1234
Total 1508
[Text] Briefly indicate why you left:
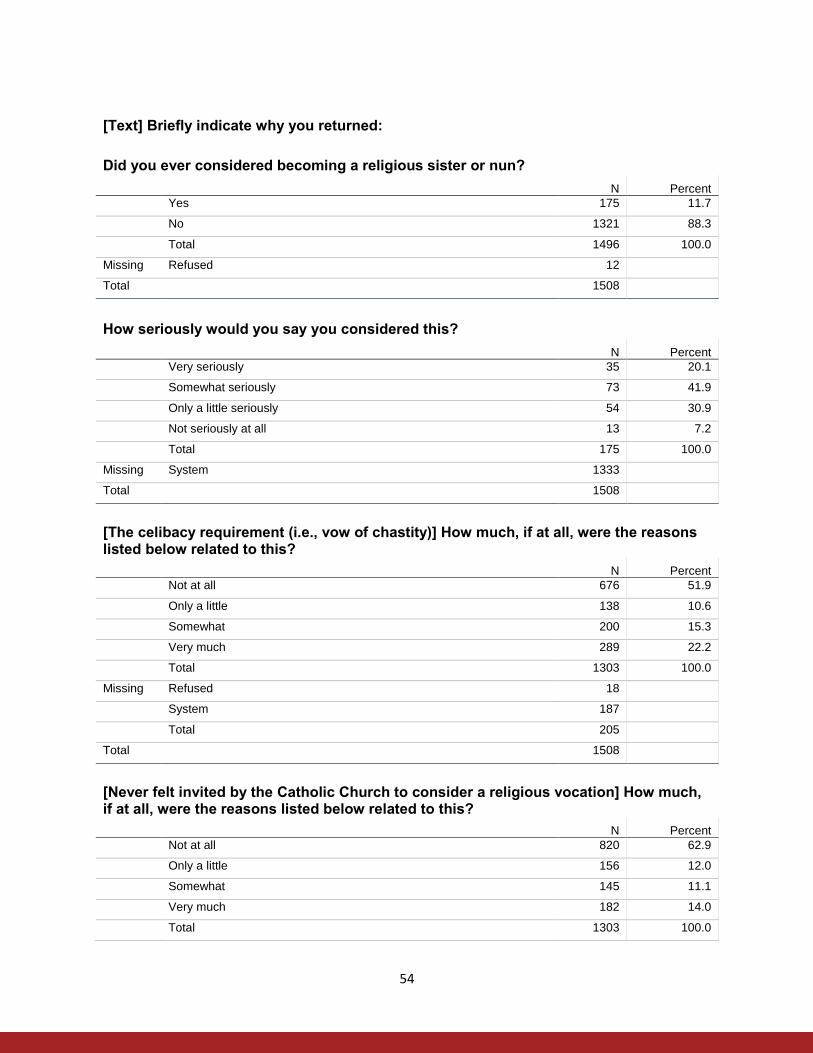
54
[Text] Briefly indicate why you returned:
Did you ever considered becoming a religious sister or nun?
N Percent Yes 175 11.7
No 1321 88.3
Total 1496 100.0
Missing Refused 12
Total 1508
How seriously would you say you considered this?
N Percent Very seriously 35 20.1
Somewhat seriously 73 41.9
Only a little seriously 54 30.9
Not seriously at all 13 7.2
Total 175 100.0
Missing System 1333
Total 1508
[The celibacy requirement (i.e., vow of chastity)] How much, if at all, were the reasons listed below related to this?
N Percent Not at all 676 51.9
Only a little 138 10.6
Somewhat 200 15.3
Very much 289 22.2
Total 1303 100.0
Missing Refused 18
System 187
Total 205
Total 1508
[Never felt invited by the Catholic Church to consider a religious vocation] How much, if at all, were the reasons listed below related to this?
N Percent Not at all 820 62.9
Only a little 156 12.0
Somewhat 145 11.1
Very much 182 14.0
Total 1303 100.0
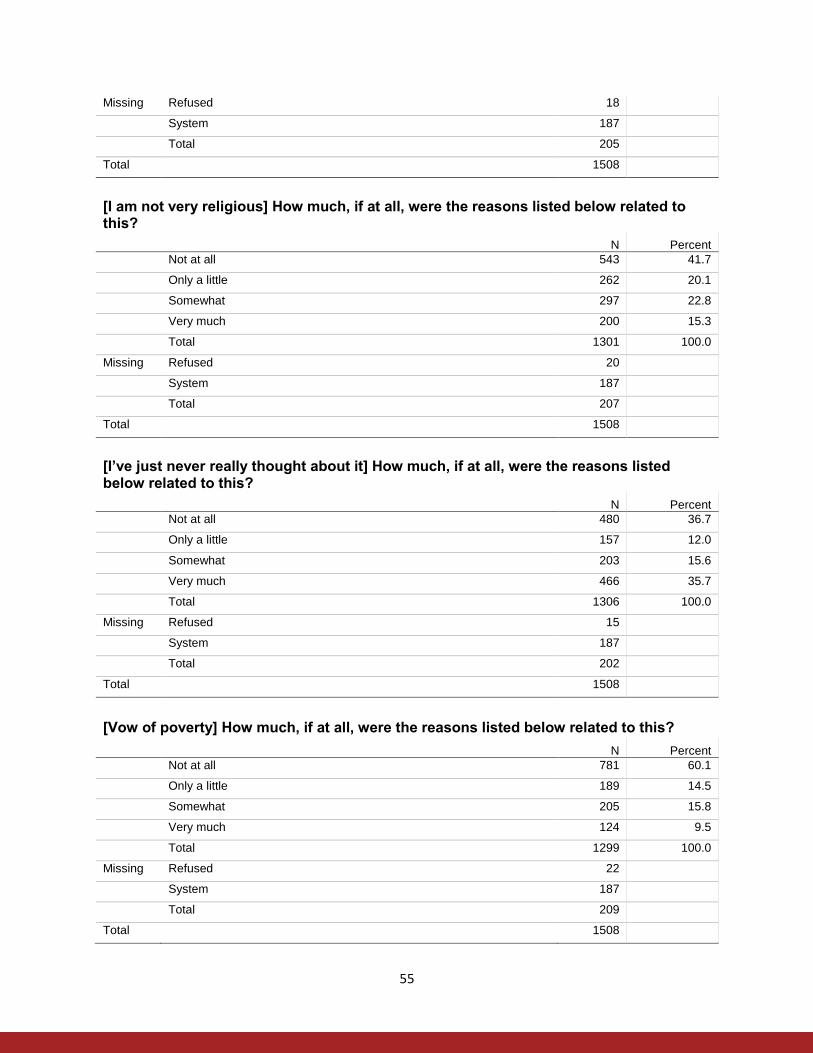
55
Missing Refused 18
System 187
Total 205
Total 1508
[I am not very religious] How much, if at all, were the reasons listed below related to this?
N Percent Not at all 543 41.7
Only a little 262 20.1
Somewhat 297 22.8
Very much 200 15.3
Total 1301 100.0
Missing Refused 20
System 187
Total 207
Total 1508
[I’ve just never really thought about it] How much, if at all, were the reasons listed below related to this?
N Percent Not at all 480 36.7
Only a little 157 12.0
Somewhat 203 15.6
Very much 466 35.7
Total 1306 100.0
Missing Refused 15
System 187
Total 202
Total 1508
[Vow of poverty] How much, if at all, were the reasons listed below related to this?
N Percent Not at all 781 60.1
Only a little 189 14.5
Somewhat 205 15.8
Very much 124 9.5
Total 1299 100.0
Missing Refused 22
System 187
Total 209
Total 1508
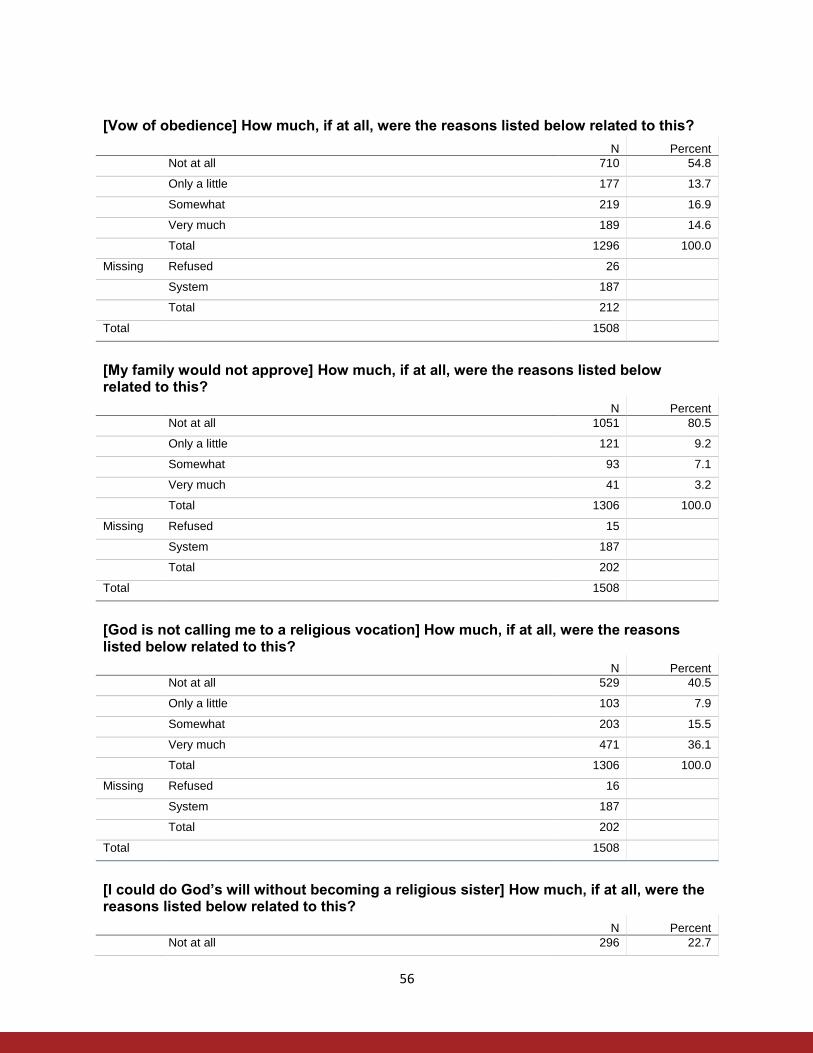
56
[Vow of obedience] How much, if at all, were the reasons listed below related to this?
N Percent Not at all 710 54.8
Only a little 177 13.7
Somewhat 219 16.9
Very much 189 14.6
Total 1296 100.0
Missing Refused 26
System 187
Total 212
Total 1508
[My family would not approve] How much, if at all, were the reasons listed below related to this?
N Percent Not at all 1051 80.5
Only a little 121 9.2
Somewhat 93 7.1
Very much 41 3.2
Total 1306 100.0
Missing Refused 15
System 187
Total 202
Total 1508
[God is not calling me to a religious vocation] How much, if at all, were the reasons listed below related to this?
N Percent Not at all 529 40.5
Only a little 103 7.9
Somewhat 203 15.5
Very much 471 36.1
Total 1306 100.0
Missing Refused 16
System 187
Total 202
Total 1508
[I could do God’s will without becoming a religious sister] How much, if at all, were the reasons listed below related to this?
N Percent Not at all 296 22.7
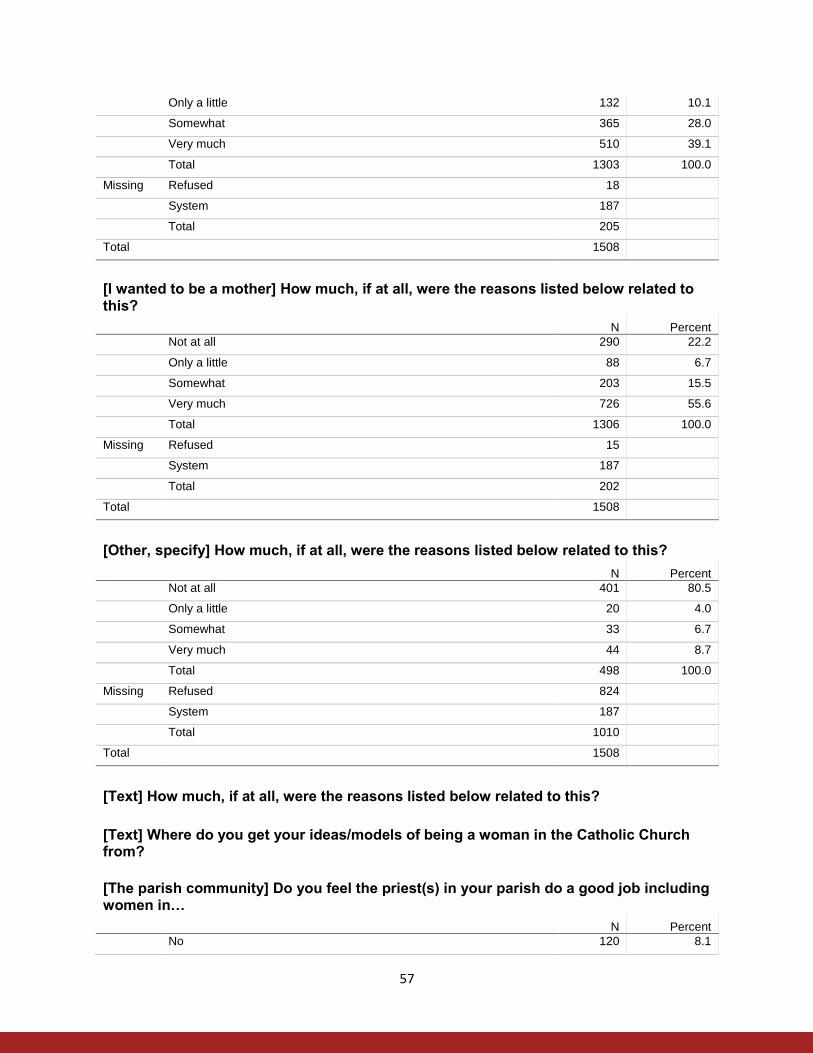
57
Only a little 132 10.1
Somewhat 365 28.0
Very much 510 39.1
Total 1303 100.0
Missing Refused 18
System 187
Total 205
Total 1508
[I wanted to be a mother] How much, if at all, were the reasons listed below related to this?
N Percent Not at all 290 22.2
Only a little 88 6.7
Somewhat 203 15.5
Very much 726 55.6
Total 1306 100.0
Missing Refused 15
System 187
Total 202
Total 1508
[Other, specify] How much, if at all, were the reasons listed below related to this?
N Percent Not at all 401 80.5
Only a little 20 4.0
Somewhat 33 6.7
Very much 44 8.7
Total 498 100.0
Missing Refused 824
System 187
Total 1010
Total 1508
[Text] How much, if at all, were the reasons listed below related to this?
[Text] Where do you get your ideas/models of being a woman in the Catholic Church from?
[The parish community] Do you feel the priest(s) in your parish do a good job including women in…
N Percent No 120 8.1

58
Somewhat 512 34.7
Yes, definitely 843 57.2
Total 1475 100.0
Missing Refused 33
Total 1508
[On parish councils] Do you feel the priest(s) in your parish do a good job including women in…
N Percent No 170 11.6
Somewhat 557 37.9
Yes, definitely 742 50.5
Total 1470 100.0
Missing Refused 38
Total 1508
[In lay ministry positions] Do you feel the priest(s) in your parish do a good job including women in…
N Percent No 212 14.4
Somewhat 534 36.4
Yes, definitely 722 49.2
Total 1468 100.0
Missing Refused 40
Total 1508
[The decision-making of the parish] Do you feel the priest(s) in your parish do a good job including women in…
N Percent No 234 15.9
Somewhat 575 39.1
Yes, definitely 662 45.0
Total 1470 100.0
Missing Refused 38
Total 1508
Do you feel the Catholic Church should allow women, ages 35 and older, to be ordained as permanent deacons?
N Percent Yes 894 59.8
Maybe, but I’d want to learn more before answering 319 21.3
No 105 7.1
Don’t know 176 11.8
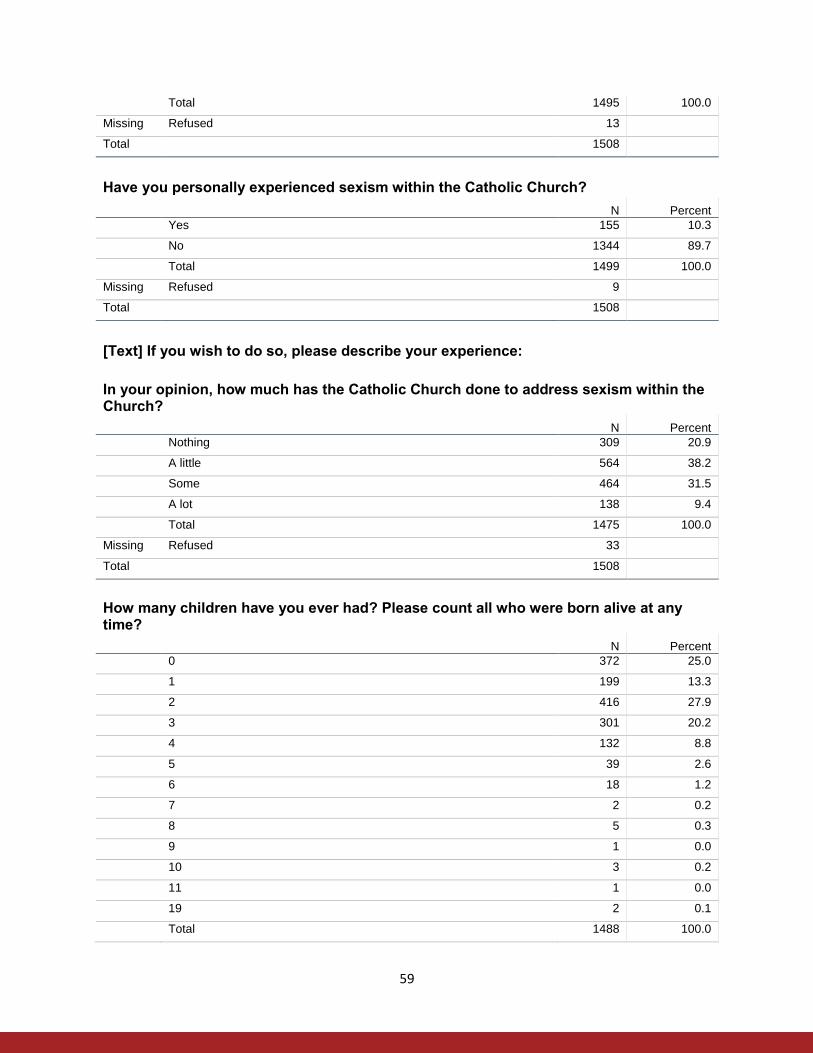
59
Total 1495 100.0
Missing Refused 13
Total 1508
Have you personally experienced sexism within the Catholic Church?
N Percent Yes 155 10.3
No 1344 89.7
Total 1499 100.0
Missing Refused 9
Total 1508
[Text] If you wish to do so, please describe your experience:
In your opinion, how much has the Catholic Church done to address sexism within the Church?
N Percent Nothing 309 20.9
A little 564 38.2
Some 464 31.5
A lot 138 9.4
Total 1475 100.0
Missing Refused 33
Total 1508
How many children have you ever had? Please count all who were born alive at any time?
N Percent 0 372 25.0
1 199 13.3
2 416 27.9
3 301 20.2
4 132 8.8
5 39 2.6
6 18 1.2
7 2 0.2
8 5 0.3
9 1 0.0
10 3 0.2
11 1 0.0
19 2 0.1
Total 1488 100.0

60
Missing Refused 20
Total 1508
How many of your children are Catholic?
N Percent 0 163 14.7
1 222 20.1
2 336 30.5
3 249 22.6
4 97 8.8
5 21 1.9
6 6 0.6
7 2 0.2
8 2 0.2
9 1 0.1
10 3 0.3
19 2 0.1
Total 1104 100.0
Missing Refused 4
System 400
Total 404
Total 1508
[My pastor or parish priest] How likely would you be to turn to any of the following people for spiritual guidance or in times of hardship?
N Percent Not at all 377 25.9
A little 320 22.0
Somewhat 360 24.8
Very much 397 27.3
Total 1454 100.0
Missing Refused 54
Total 1508
[A religious sister or nun] How likely would you be to turn to any of the following people for spiritual guidance or in times of hardship?
N Percent Not at all 471 32.6
A little 359 24.9
Somewhat 355 24.6
Very much 259 18.0
Total 1444 100.0
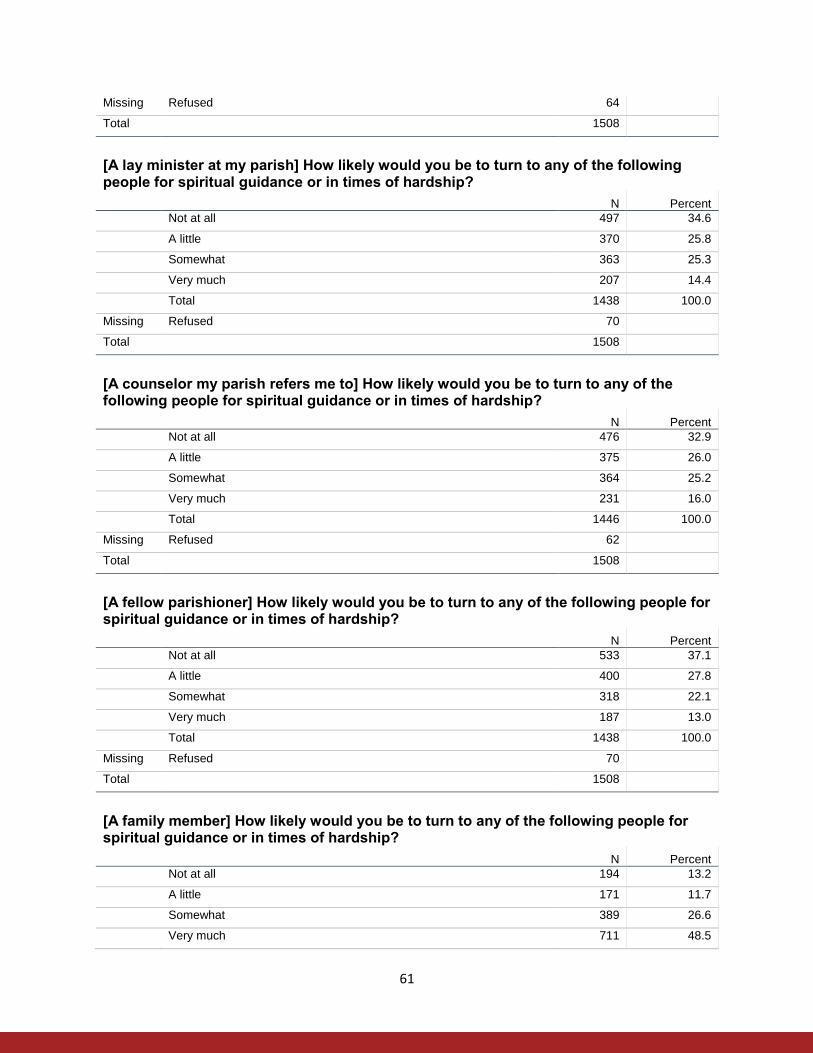
61
Missing Refused 64
Total 1508
[A lay minister at my parish] How likely would you be to turn to any of the following people for spiritual guidance or in times of hardship?
N Percent Not at all 497 34.6
A little 370 25.8
Somewhat 363 25.3
Very much 207 14.4
Total 1438 100.0
Missing Refused 70
Total 1508
[A counselor my parish refers me to] How likely would you be to turn to any of the following people for spiritual guidance or in times of hardship?
N Percent Not at all 476 32.9
A little 375 26.0
Somewhat 364 25.2
Very much 231 16.0
Total 1446 100.0
Missing Refused 62
Total 1508
[A fellow parishioner] How likely would you be to turn to any of the following people for spiritual guidance or in times of hardship?
N Percent Not at all 533 37.1
A little 400 27.8
Somewhat 318 22.1
Very much 187 13.0
Total 1438 100.0
Missing Refused 70
Total 1508
[A family member] How likely would you be to turn to any of the following people for spiritual guidance or in times of hardship?
N Percent Not at all 194 13.2
A little 171 11.7
Somewhat 389 26.6
Very much 711 48.5
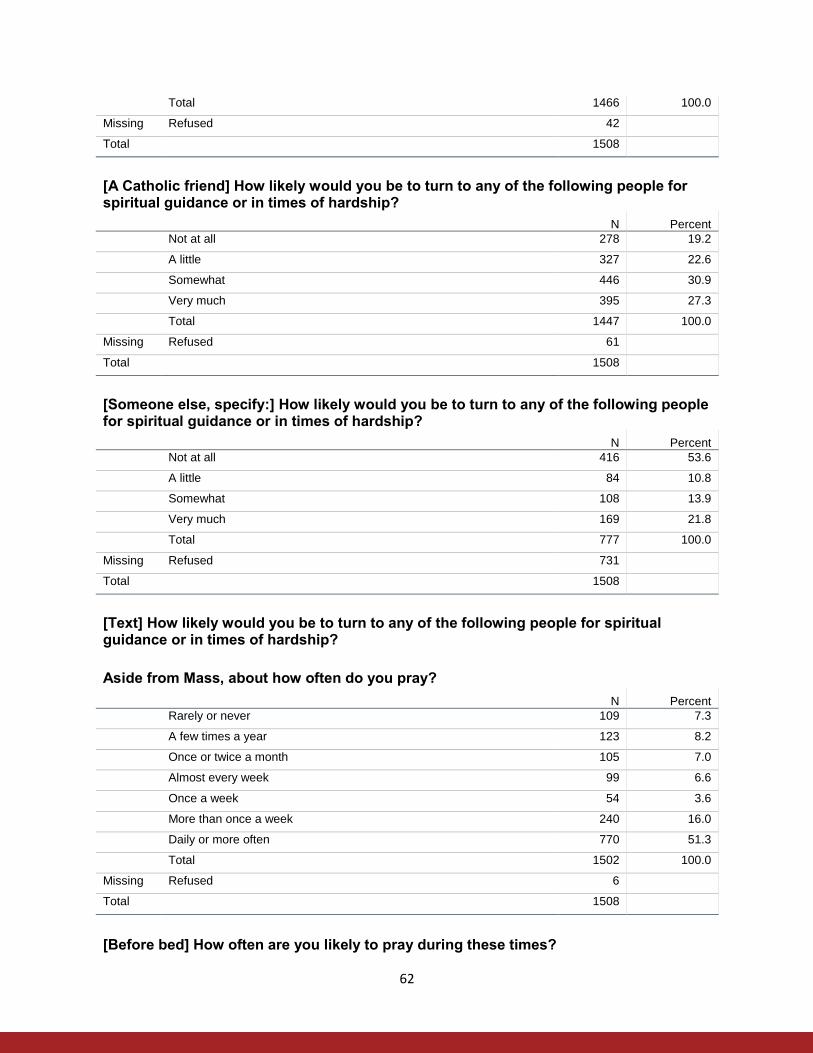
62
Total 1466 100.0
Missing Refused 42
Total 1508
[A Catholic friend] How likely would you be to turn to any of the following people for spiritual guidance or in times of hardship?
N Percent Not at all 278 19.2
A little 327 22.6
Somewhat 446 30.9
Very much 395 27.3
Total 1447 100.0
Missing Refused 61
Total 1508
[Someone else, specify:] How likely would you be to turn to any of the following people for spiritual guidance or in times of hardship?
N Percent Not at all 416 53.6
A little 84 10.8
Somewhat 108 13.9
Very much 169 21.8
Total 777 100.0
Missing Refused 731
Total 1508
[Text] How likely would you be to turn to any of the following people for spiritual guidance or in times of hardship?
Aside from Mass, about how often do you pray?
N Percent Rarely or never 109 7.3
A few times a year 123 8.2
Once or twice a month 105 7.0
Almost every week 99 6.6
Once a week 54 3.6
More than once a week 240 16.0
Daily or more often 770 51.3
Total 1502 100.0
Missing Refused 6
Total 1508
[Before bed] How often are you likely to pray during these times?
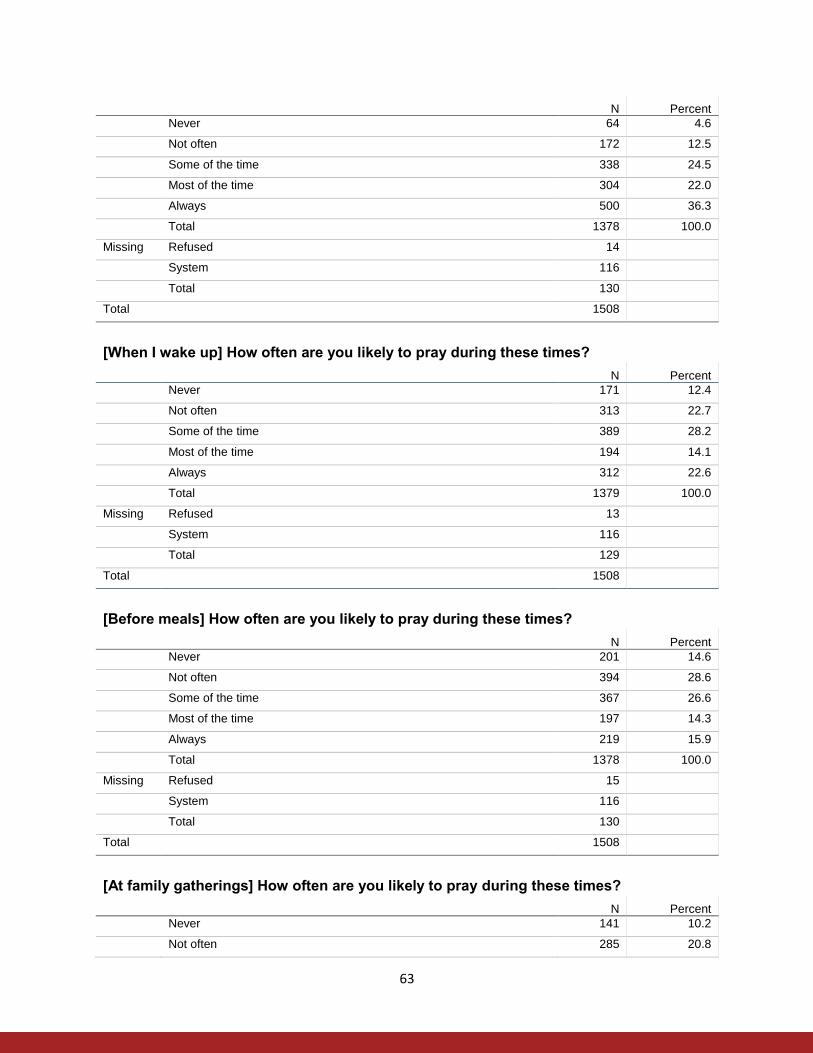
63
N Percent Never 64 4.6
Not often 172 12.5
Some of the time 338 24.5
Most of the time 304 22.0
Always 500 36.3
Total 1378 100.0
Missing Refused 14
System 116
Total 130
Total 1508
[When I wake up] How often are you likely to pray during these times?
N Percent Never 171 12.4
Not often 313 22.7
Some of the time 389 28.2
Most of the time 194 14.1
Always 312 22.6
Total 1379 100.0
Missing Refused 13
System 116
Total 129
Total 1508
[Before meals] How often are you likely to pray during these times?
N Percent Never 201 14.6
Not often 394 28.6
Some of the time 367 26.6
Most of the time 197 14.3
Always 219 15.9
Total 1378 100.0
Missing Refused 15
System 116
Total 130
Total 1508
[At family gatherings] How often are you likely to pray during these times?
N Percent Never 141 10.2
Not often 285 20.8
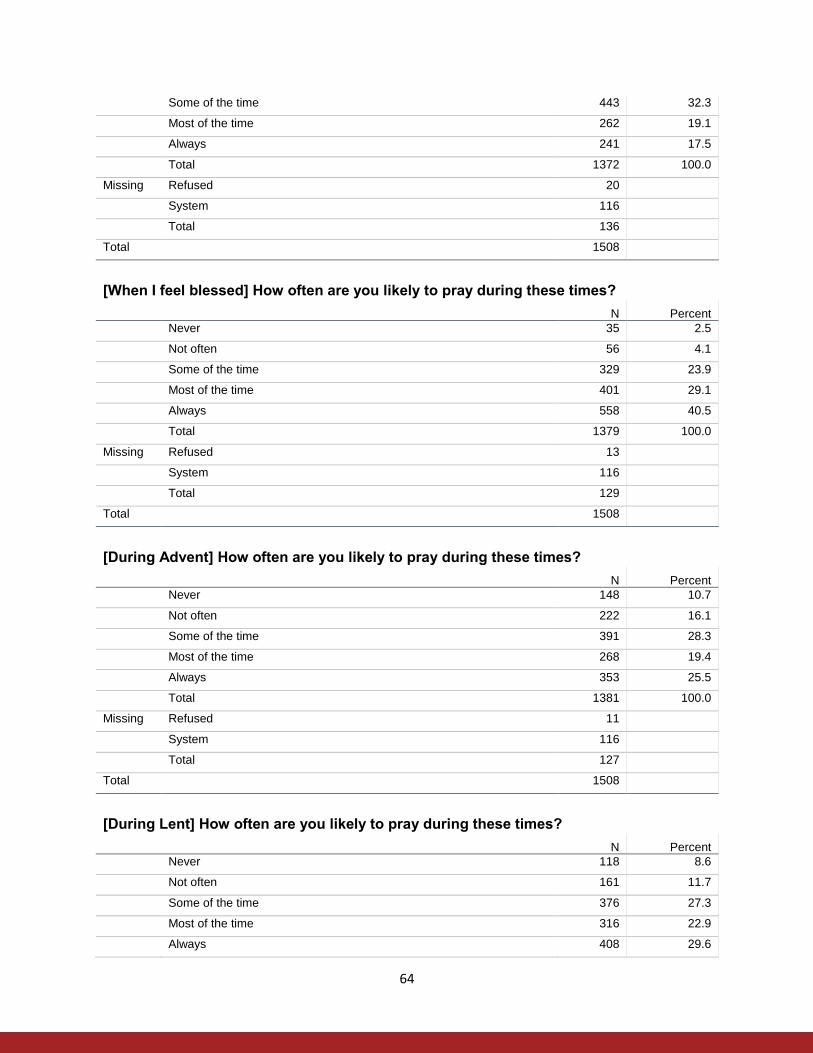
64
Some of the time 443 32.3
Most of the time 262 19.1
Always 241 17.5
Total 1372 100.0
Missing Refused 20
System 116
Total 136
Total 1508
[When I feel blessed] How often are you likely to pray during these times?
N Percent Never 35 2.5
Not often 56 4.1
Some of the time 329 23.9
Most of the time 401 29.1
Always 558 40.5
Total 1379 100.0
Missing Refused 13
System 116
Total 129
Total 1508
[During Advent] How often are you likely to pray during these times?
N Percent Never 148 10.7
Not often 222 16.1
Some of the time 391 28.3
Most of the time 268 19.4
Always 353 25.5
Total 1381 100.0
Missing Refused 11
System 116
Total 127
Total 1508
[During Lent] How often are you likely to pray during these times?
N Percent Never 118 8.6
Not often 161 11.7
Some of the time 376 27.3
Most of the time 316 22.9
Always 408 29.6
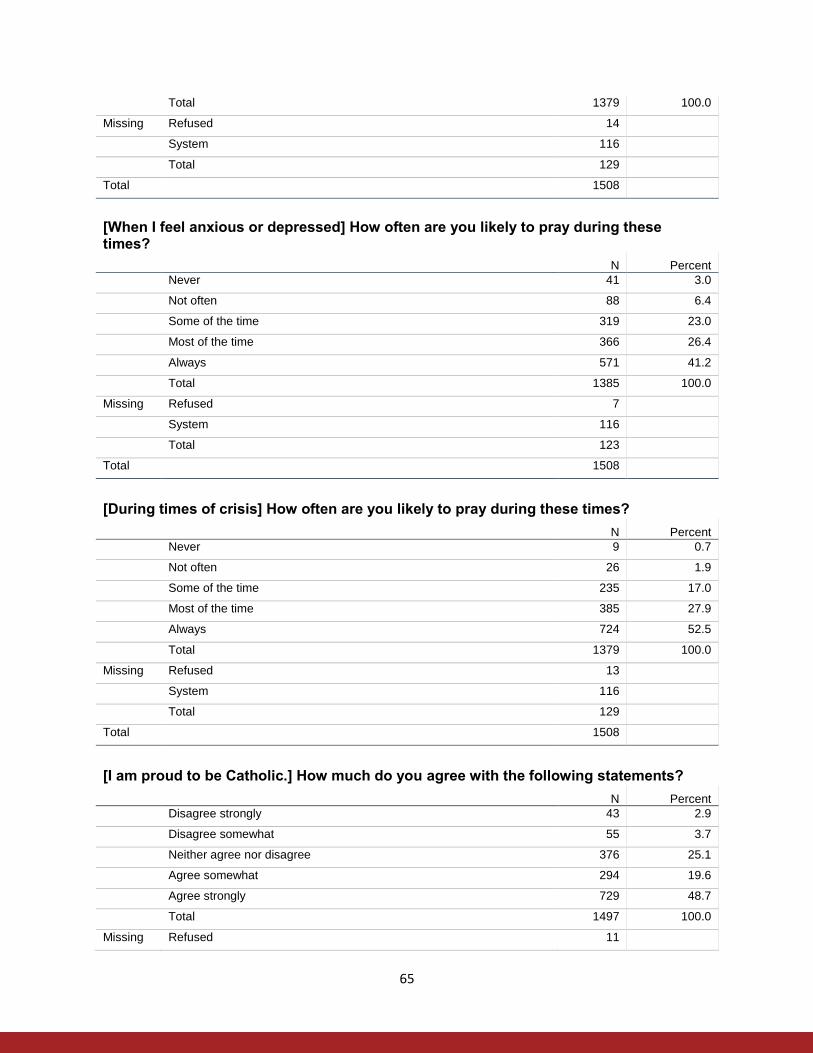
65
Total 1379 100.0
Missing Refused 14
System 116
Total 129
Total 1508
[When I feel anxious or depressed] How often are you likely to pray during these times?
N Percent Never 41 3.0
Not often 88 6.4
Some of the time 319 23.0
Most of the time 366 26.4
Always 571 41.2
Total 1385 100.0
Missing Refused 7
System 116
Total 123
Total 1508
[During times of crisis] How often are you likely to pray during these times?
N Percent Never 9 0.7
Not often 26 1.9
Some of the time 235 17.0
Most of the time 385 27.9
Always 724 52.5
Total 1379 100.0
Missing Refused 13
System 116
Total 129
Total 1508
[I am proud to be Catholic.] How much do you agree with the following statements?
N Percent Disagree strongly 43 2.9
Disagree somewhat 55 3.7
Neither agree nor disagree 376 25.1
Agree somewhat 294 19.6
Agree strongly 729 48.7
Total 1497 100.0
Missing Refused 11

66
Total 1508
[I think of myself as a practicing Catholic.] How much do you agree with the following statements?
N Percent Disagree strongly 188 12.5
Disagree somewhat 167 11.1
Neither agree nor disagree 370 24.7
Agree somewhat 328 21.8
Agree strongly 448 29.9
Total 1500 100.0
Missing Refused 8
Total 1508
[Prayer is essential to my faith.] How much do you agree with the following statements?
N Percent Disagree strongly 79 5.3
Disagree somewhat 88 5.8
Neither agree nor disagree 286 19.1
Agree somewhat 293 19.5
Agree strongly 756 50.3
Total 1502 100.0
Missing Refused 6
Total 1508
[Praying for your own wellbeing] When you pray how often are you…?
N Percent Never 17 1.2
Not often 124 9.0
Some of the time 415 30.1
Most of the time 373 27.1
Always 451 32.7
Total 1380 100.0
Missing Refused 12
System 116
Total 128
Total 1508
[Praying for the wellbeing of your family] When you pray how often are you…?
N Percent Never 6 0.4
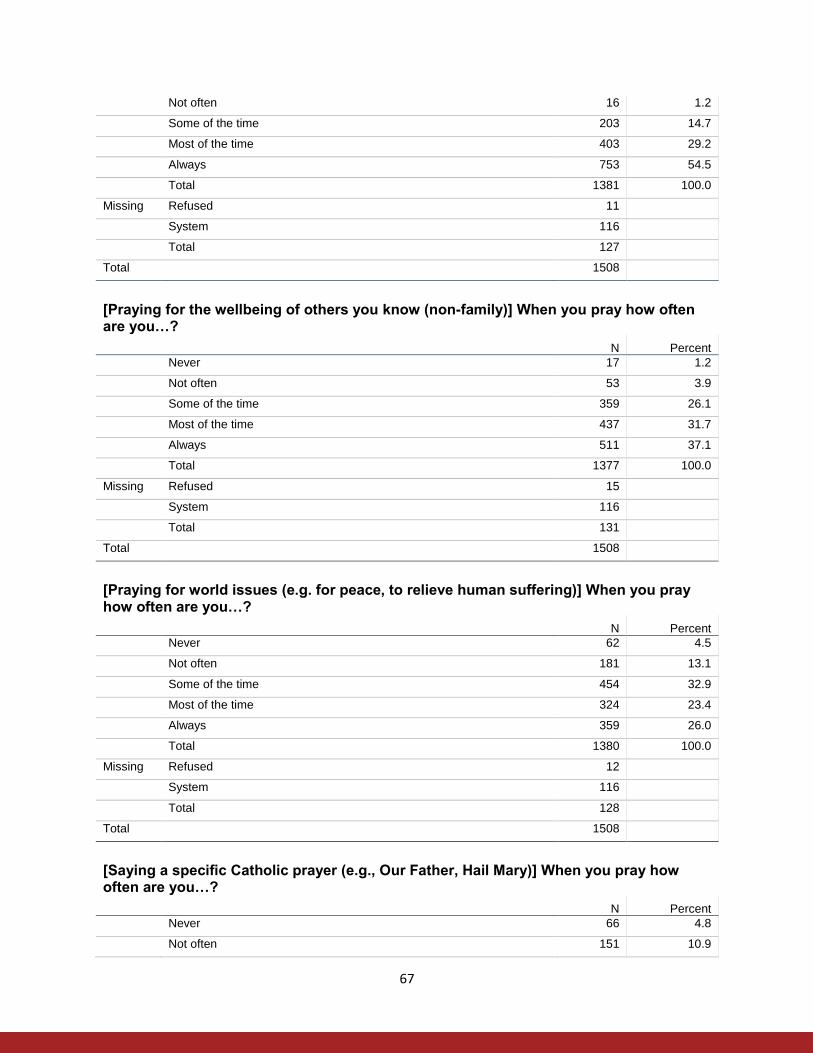
67
Not often 16 1.2
Some of the time 203 14.7
Most of the time 403 29.2
Always 753 54.5
Total 1381 100.0
Missing Refused 11
System 116
Total 127
Total 1508
[Praying for the wellbeing of others you know (non-family)] When you pray how often are you…?
N Percent Never 17 1.2
Not often 53 3.9
Some of the time 359 26.1
Most of the time 437 31.7
Always 511 37.1
Total 1377 100.0
Missing Refused 15
System 116
Total 131
Total 1508
[Praying for world issues (e.g. for peace, to relieve human suffering)] When you pray how often are you…?
N Percent Never 62 4.5
Not often 181 13.1
Some of the time 454 32.9
Most of the time 324 23.4
Always 359 26.0
Total 1380 100.0
Missing Refused 12
System 116
Total 128
Total 1508
[Saying a specific Catholic prayer (e.g., Our Father, Hail Mary)] When you pray how often are you…?
N Percent Never 66 4.8
Not often 151 10.9
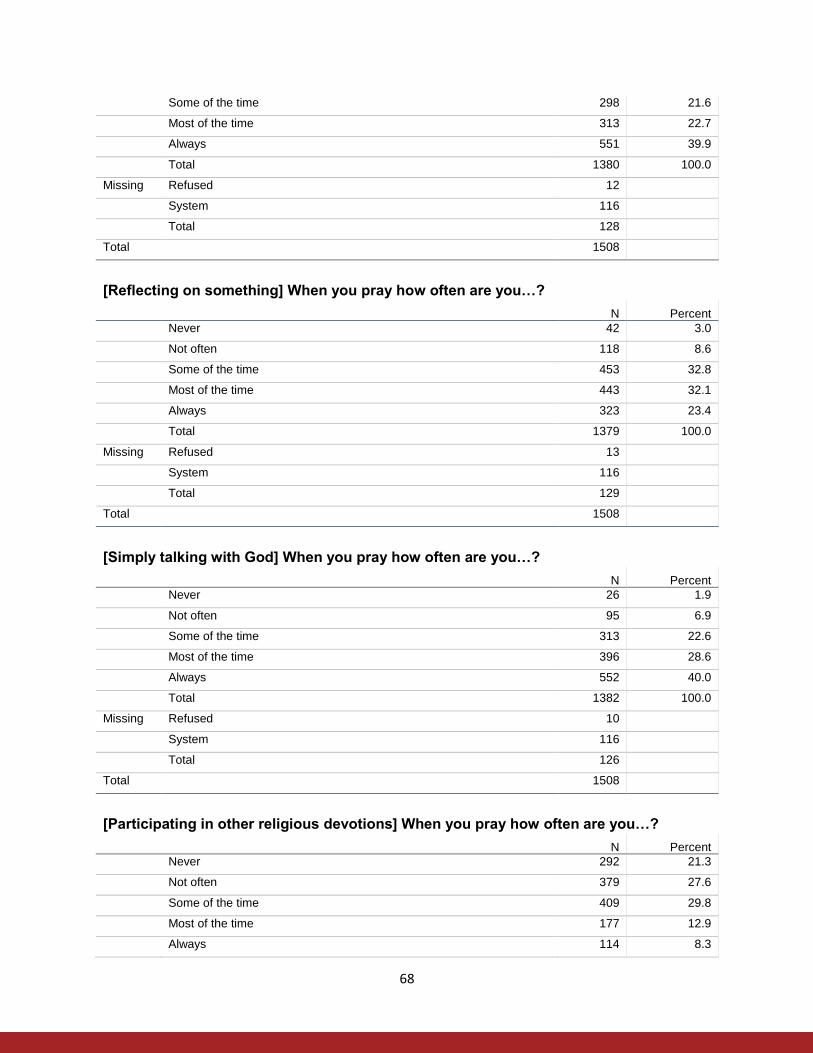
68
Some of the time 298 21.6
Most of the time 313 22.7
Always 551 39.9
Total 1380 100.0
Missing Refused 12
System 116
Total 128
Total 1508
[Reflecting on something] When you pray how often are you…?
N Percent Never 42 3.0
Not often 118 8.6
Some of the time 453 32.8
Most of the time 443 32.1
Always 323 23.4
Total 1379 100.0
Missing Refused 13
System 116
Total 129
Total 1508
[Simply talking with God] When you pray how often are you…?
N Percent Never 26 1.9
Not often 95 6.9
Some of the time 313 22.6
Most of the time 396 28.6
Always 552 40.0
Total 1382 100.0
Missing Refused 10
System 116
Total 126
Total 1508
[Participating in other religious devotions] When you pray how often are you…?
N Percent Never 292 21.3
Not often 379 27.6
Some of the time 409 29.8
Most of the time 177 12.9
Always 114 8.3

69
Total 1371 100.0
Missing Refused 21
System 116
Total 137
Total 1508
[Eucharistic Adoration] Do you ever participate in any of these prayer practices or groups on a regular basis?
N Percent No 1310 86.9
Yes 198 13.1
Total 1508 100.0
[Prayer group] Do you ever participate in any of these prayer practices or groups on a regular basis?
N Percent No 1324 87.8
Yes 184 12.2
Total 1508 100.0
[Religious retreats] Do you ever participate in any of these prayer practices or groups on a regular basis?
N Percent No 1322 87.6
Yes 186 12.4
Total 1508 100.0
[Bible study/Lectio Divina] Do you ever participate in any of these prayer practices or groups on a regular basis?
N Percent No 1335 88.5
Yes 173 11.5
Total 1508 100.0
[Pilgrimage] Do you ever participate in any of these prayer practices or groups on a regular basis?
N Percent No 1384 91.8
Yes 124 8.2
Total 1508 100.0
[None of these] Do you ever participate in any of these prayer practices or groups on a regular basis?
N Percent
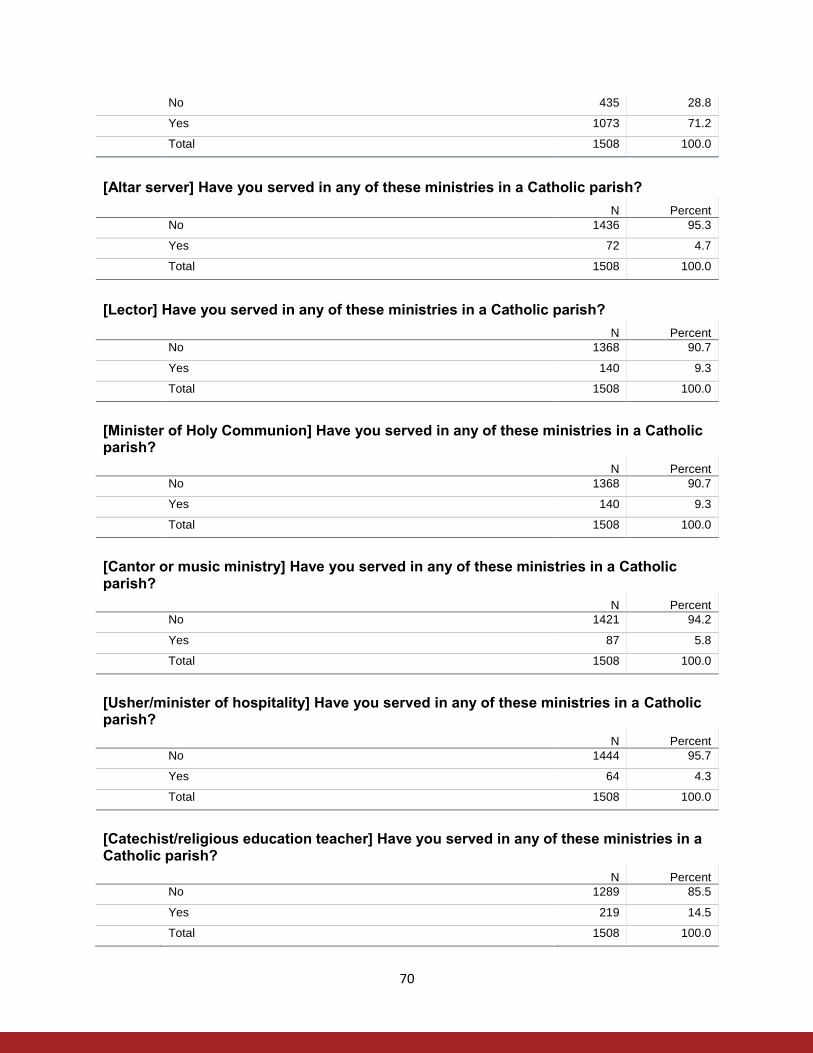
70
No 435 28.8
Yes 1073 71.2
Total 1508 100.0
[Altar server] Have you served in any of these ministries in a Catholic parish?
N Percent No 1436 95.3
Yes 72 4.7
Total 1508 100.0
[Lector] Have you served in any of these ministries in a Catholic parish?
N Percent No 1368 90.7
Yes 140 9.3
Total 1508 100.0
[Minister of Holy Communion] Have you served in any of these ministries in a Catholic parish?
N Percent No 1368 90.7
Yes 140 9.3
Total 1508 100.0
[Cantor or music ministry] Have you served in any of these ministries in a Catholic parish?
N Percent No 1421 94.2
Yes 87 5.8
Total 1508 100.0
[Usher/minister of hospitality] Have you served in any of these ministries in a Catholic parish?
N Percent No 1444 95.7
Yes 64 4.3
Total 1508 100.0
[Catechist/religious education teacher] Have you served in any of these ministries in a Catholic parish?
N Percent No 1289 85.5
Yes 219 14.5
Total 1508 100.0
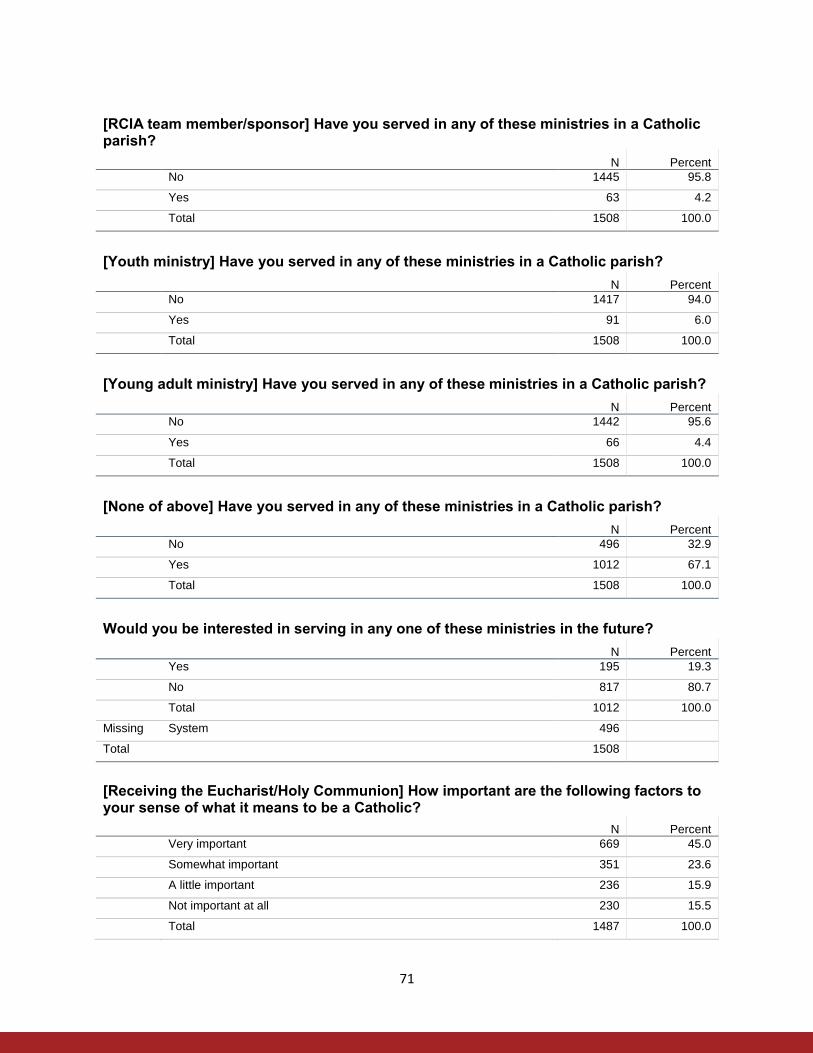
71
[RCIA team member/sponsor] Have you served in any of these ministries in a Catholic parish?
N Percent No 1445 95.8
Yes 63 4.2
Total 1508 100.0
[Youth ministry] Have you served in any of these ministries in a Catholic parish?
N Percent No 1417 94.0
Yes 91 6.0
Total 1508 100.0
[Young adult ministry] Have you served in any of these ministries in a Catholic parish?
N Percent No 1442 95.6
Yes 66 4.4
Total 1508 100.0
[None of above] Have you served in any of these ministries in a Catholic parish?
N Percent No 496 32.9
Yes 1012 67.1
Total 1508 100.0
Would you be interested in serving in any one of these ministries in the future?
N Percent Yes 195 19.3
No 817 80.7
Total 1012 100.0
Missing System 496
Total 1508
[Receiving the Eucharist/Holy Communion] How important are the following factors to your sense of what it means to be a Catholic?
N Percent Very important 669 45.0
Somewhat important 351 23.6
A little important 236 15.9
Not important at all 230 15.5
Total 1487 100.0
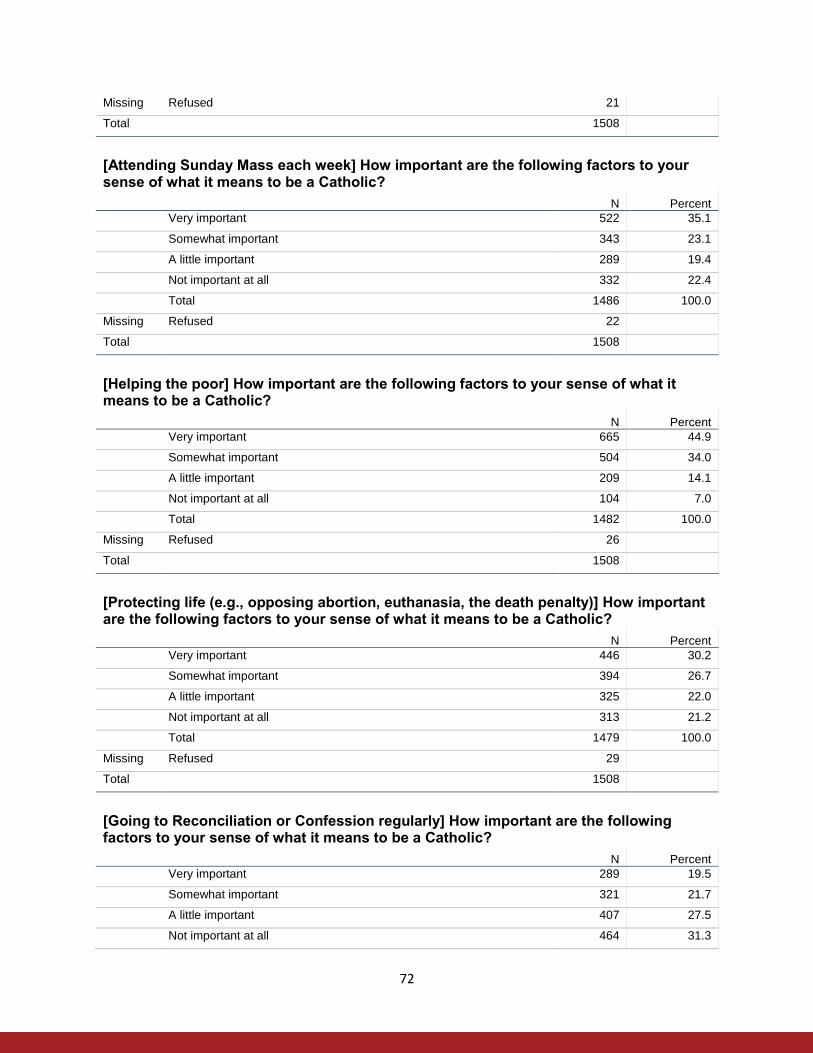
72
Missing Refused 21
Total 1508
[Attending Sunday Mass each week] How important are the following factors to your sense of what it means to be a Catholic?
N Percent Very important 522 35.1
Somewhat important 343 23.1
A little important 289 19.4
Not important at all 332 22.4
Total 1486 100.0
Missing Refused 22
Total 1508
[Helping the poor] How important are the following factors to your sense of what it means to be a Catholic?
N Percent Very important 665 44.9
Somewhat important 504 34.0
A little important 209 14.1
Not important at all 104 7.0
Total 1482 100.0
Missing Refused 26
Total 1508
[Protecting life (e.g., opposing abortion, euthanasia, the death penalty)] How important are the following factors to your sense of what it means to be a Catholic?
N Percent Very important 446 30.2
Somewhat important 394 26.7
A little important 325 22.0
Not important at all 313 21.2
Total 1479 100.0
Missing Refused 29
Total 1508
[Going to Reconciliation or Confession regularly] How important are the following factors to your sense of what it means to be a Catholic?
N Percent Very important 289 19.5
Somewhat important 321 21.7
A little important 407 27.5
Not important at all 464 31.3

73
Total 1481 100.0
Missing Refused 27
Total 1508
[Living my life consistent with Church teaching] How important are the following factors to your sense of what it means to be a Catholic?
N Percent Very important 518 34.9
Somewhat important 489 32.9
A little important 286 19.3
Not important at all 192 12.9
Total 1484 100.0
Missing Refused 24
Total 1508
[Being involved with my parish (e.g., youth ministry, music groups, visiting prisoners, care of the sick)] How important are the following factors to your sense of what it means to be a Catholic?
N Percent Very important 260 17.5
Somewhat important 445 30.0
A little important 419 28.2
Not important at all 361 24.3
Total 1485 100.0
Missing Refused 23
Total 1508
[Facebook] Do you have a profile on any of the following social networking sites:
N Percent Yes 1112 74.6
No 378 25.4
Total 1490 100.0
Missing Refused 18
Total 1508
[Twitter] Do you have a profile on any of the following social networking sites:
N Percent Yes 333 24.9
No 1004 75.1
Total 1338 100.0
Missing Refused 170
Total 1508
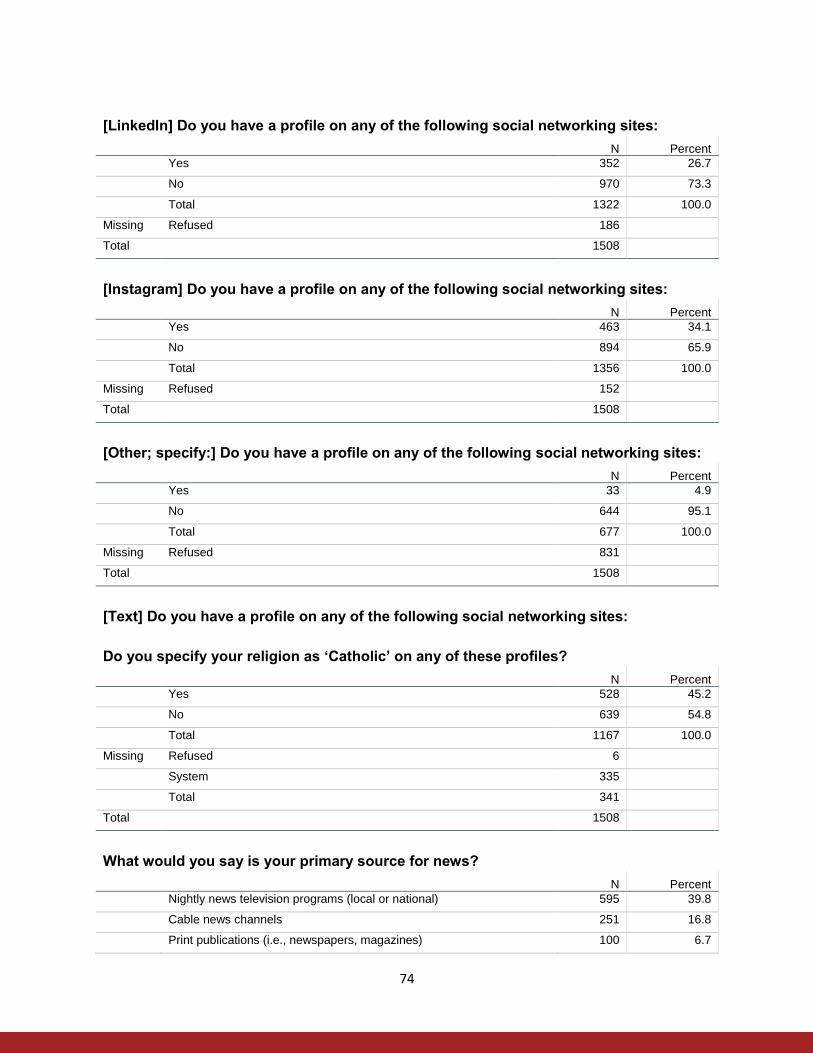
74
[LinkedIn] Do you have a profile on any of the following social networking sites:
N Percent Yes 352 26.7
No 970 73.3
Total 1322 100.0
Missing Refused 186
Total 1508
[Instagram] Do you have a profile on any of the following social networking sites:
N Percent Yes 463 34.1
No 894 65.9
Total 1356 100.0
Missing Refused 152
Total 1508
[Other; specify:] Do you have a profile on any of the following social networking sites:
N Percent Yes 33 4.9
No 644 95.1
Total 677 100.0
Missing Refused 831
Total 1508
[Text] Do you have a profile on any of the following social networking sites:
Do you specify your religion as ‘Catholic’ on any of these profiles?
N Percent Yes 528 45.2
No 639 54.8
Total 1167 100.0
Missing Refused 6
System 335
Total 341
Total 1508
What would you say is your primary source for news?
N Percent Nightly news television programs (local or national) 595 39.8
Cable news channels 251 16.8
Print publications (i.e., newspapers, magazines) 100 6.7
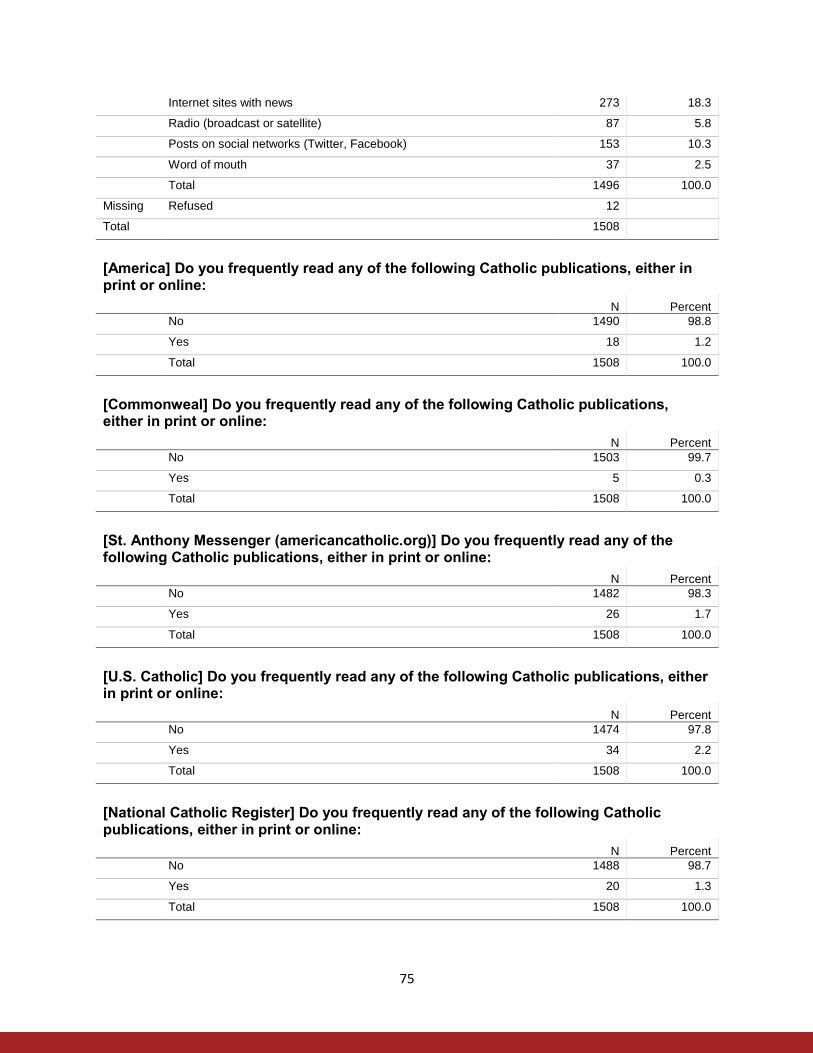
75
Internet sites with news 273 18.3
Radio (broadcast or satellite) 87 5.8
Posts on social networks (Twitter, Facebook) 153 10.3
Word of mouth 37 2.5
Total 1496 100.0
Missing Refused 12
Total 1508
[America] Do you frequently read any of the following Catholic publications, either in print or online:
N Percent No 1490 98.8
Yes 18 1.2
Total 1508 100.0
[Commonweal] Do you frequently read any of the following Catholic publications, either in print or online:
N Percent No 1503 99.7
Yes 5 0.3
Total 1508 100.0
[St. Anthony Messenger (americancatholic.org)] Do you frequently read any of the following Catholic publications, either in print or online:
N Percent No 1482 98.3
Yes 26 1.7
Total 1508 100.0
[U.S. Catholic] Do you frequently read any of the following Catholic publications, either in print or online:
N Percent No 1474 97.8
Yes 34 2.2
Total 1508 100.0
[National Catholic Register] Do you frequently read any of the following Catholic publications, either in print or online:
N Percent No 1488 98.7
Yes 20 1.3
Total 1508 100.0
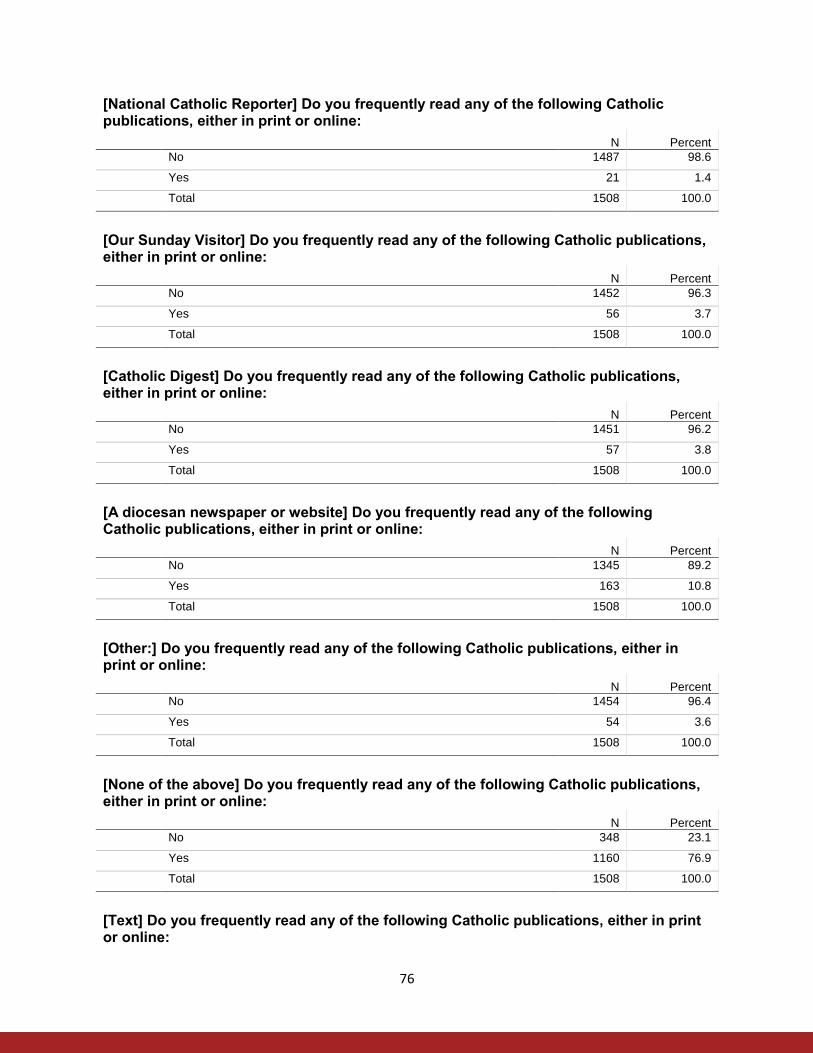
76
[National Catholic Reporter] Do you frequently read any of the following Catholic publications, either in print or online:
N Percent No 1487 98.6
Yes 21 1.4
Total 1508 100.0
[Our Sunday Visitor] Do you frequently read any of the following Catholic publications, either in print or online:
N Percent No 1452 96.3
Yes 56 3.7
Total 1508 100.0
[Catholic Digest] Do you frequently read any of the following Catholic publications, either in print or online:
N Percent No 1451 96.2
Yes 57 3.8
Total 1508 100.0
[A diocesan newspaper or website] Do you frequently read any of the following Catholic publications, either in print or online:
N Percent No 1345 89.2
Yes 163 10.8
Total 1508 100.0
[Other:] Do you frequently read any of the following Catholic publications, either in print or online:
N Percent No 1454 96.4
Yes 54 3.6
Total 1508 100.0
[None of the above] Do you frequently read any of the following Catholic publications, either in print or online:
N Percent No 348 23.1
Yes 1160 76.9
Total 1508 100.0
[Text] Do you frequently read any of the following Catholic publications, either in print or online:

77
[Women are involved in the decision-making of my parish.] How much do you agree with the following statements?
N Percent Not at all 304 22.1
A little 338 24.6
Somewhat 484 35.2
Very much 248 18.1
Total 1374 100.0
Missing Refused 134
Total 1508
[My parish has ministries to help widows deal with the loss of a spouse.] How much do you agree with the following statements?
N Percent Not at all 287 20.9
A little 315 22.9
Somewhat 464 33.8
Very much 308 22.4
Total 1374 100.0
Missing Refused 134
Total 1508
[My parish provides support for new mothers.] How much do you agree with the following statements?
N Percent Not at all 325 23.6
A little 391 28.3
Somewhat 408 29.5
Very much 257 18.6
Total 1380 100.0
Missing Refused 128
Total 1508
[My parish helps our community with childcare.] How much do you agree with the following statements?
N Percent Not at all 382 27.7
A little 377 27.3
Somewhat 399 28.9
Very much 222 16.1
Total 1380 100.0
Missing Refused 128

78
Total 1508
[Unwed Catholic parents feel welcome in my parish.] How much do you agree with the following statements?
N Percent Not at all 247 17.9
A little 321 23.3
Somewhat 467 33.9
Very much 343 24.9
Total 1379 100.0
Missing Refused 129
Total 1508
[Divorced and remarried Catholics feel welcome in my parish.] How much do you agree with the following statements?
N Percent Not at all 246 17.8
A little 337 24.3
Somewhat 453 32.7
Very much 348 25.2
Total 1383 100.0
Missing Refused 125
Total 1508
[Non-heterosexual Catholics feel welcome in my parish.] How much do you agree with the following statements?
N Percent Not at all 297 21.6
A little 381 27.7
Somewhat 422 30.6
Very much 277 20.1
Total 1377 100.0
Missing Refused 131
Total 1508
How important is it to you that you marry a Catholic?
N Percent Not important 83 36.3
A little important 31 13.3
Somewhat important 47 20.4
Very important 41 17.9
I do not plan to marry 28 12.2
Total 230 100.0
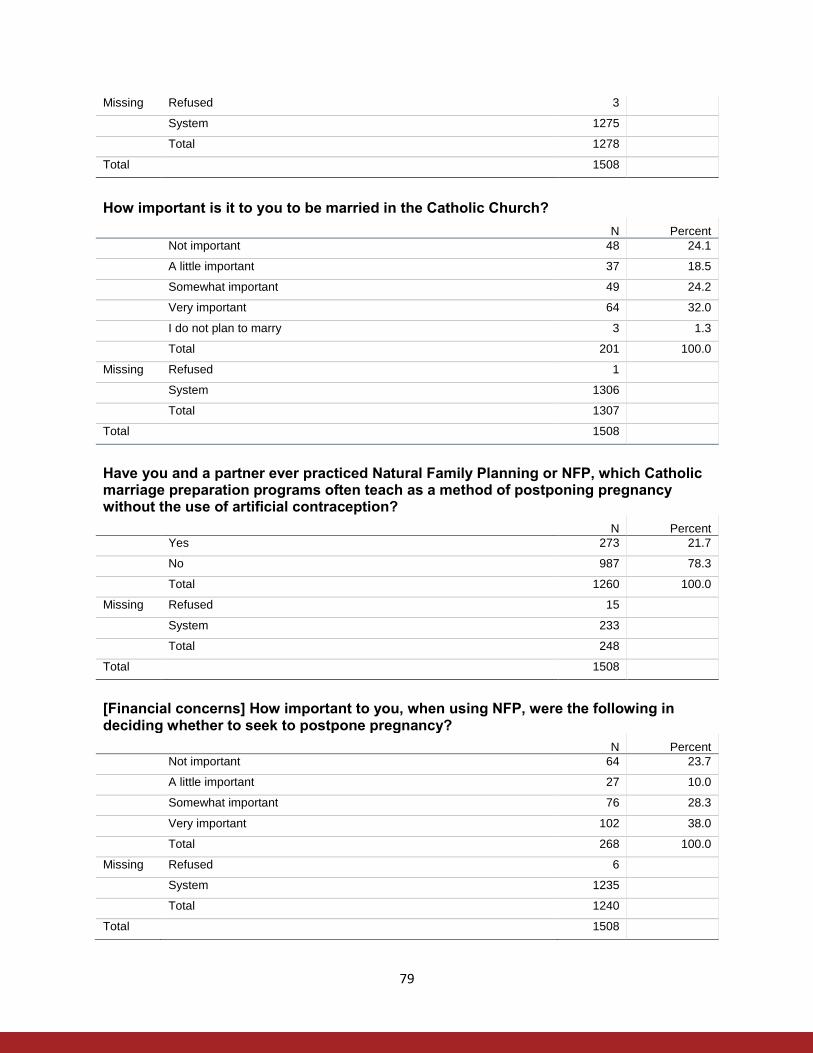
79
Missing Refused 3
System 1275
Total 1278
Total 1508
How important is it to you to be married in the Catholic Church?
N Percent Not important 48 24.1
A little important 37 18.5
Somewhat important 49 24.2
Very important 64 32.0
I do not plan to marry 3 1.3
Total 201 100.0
Missing Refused 1
System 1306
Total 1307
Total 1508
Have you and a partner ever practiced Natural Family Planning or NFP, which Catholic marriage preparation programs often teach as a method of postponing pregnancy without the use of artificial contraception?
N Percent Yes 273 21.7
No 987 78.3
Total 1260 100.0
Missing Refused 15
System 233
Total 248
Total 1508
[Financial concerns] How important to you, when using NFP, were the following in deciding whether to seek to postpone pregnancy?
N Percent Not important 64 23.7
A little important 27 10.0
Somewhat important 76 28.3
Very important 102 38.0
Total 268 100.0
Missing Refused 6
System 1235
Total 1240
Total 1508
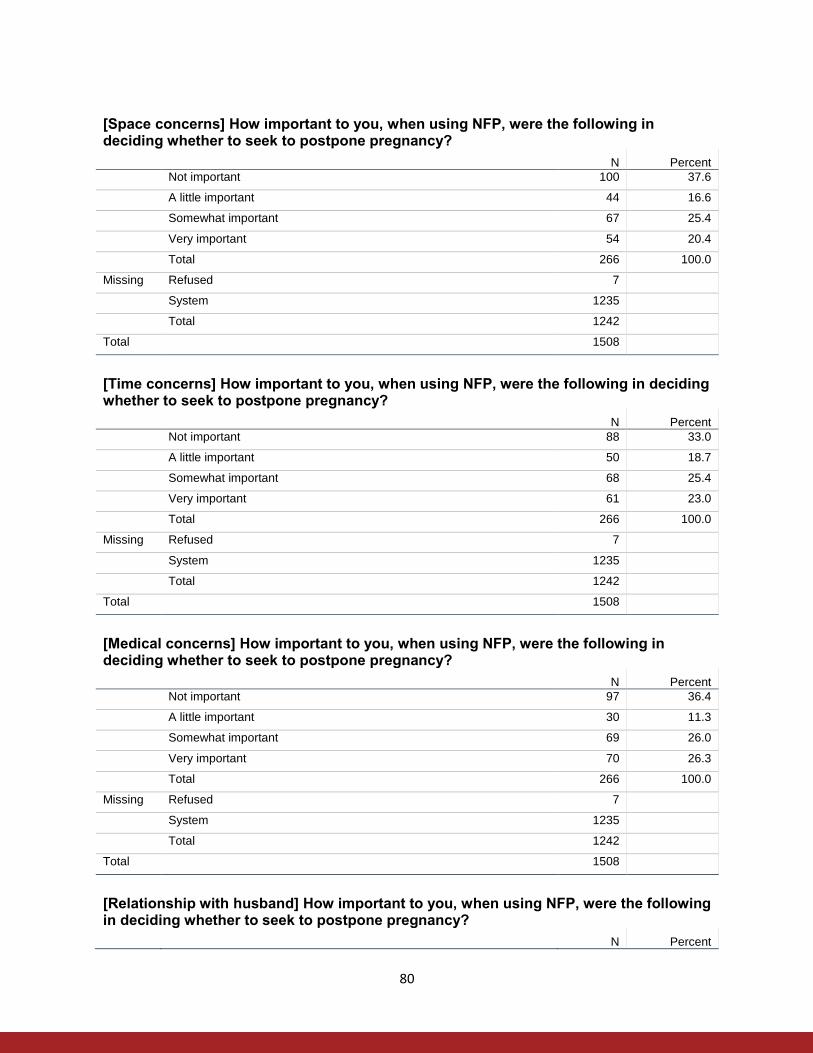
80
[Space concerns] How important to you, when using NFP, were the following in deciding whether to seek to postpone pregnancy?
N Percent Not important 100 37.6
A little important 44 16.6
Somewhat important 67 25.4
Very important 54 20.4
Total 266 100.0
Missing Refused 7
System 1235
Total 1242
Total 1508
[Time concerns] How important to you, when using NFP, were the following in deciding whether to seek to postpone pregnancy?
N Percent Not important 88 33.0
A little important 50 18.7
Somewhat important 68 25.4
Very important 61 23.0
Total 266 100.0
Missing Refused 7
System 1235
Total 1242
Total 1508
[Medical concerns] How important to you, when using NFP, were the following in deciding whether to seek to postpone pregnancy?
N Percent Not important 97 36.4
A little important 30 11.3
Somewhat important 69 26.0
Very important 70 26.3
Total 266 100.0
Missing Refused 7
System 1235
Total 1242
Total 1508
[Relationship with husband] How important to you, when using NFP, were the following in deciding whether to seek to postpone pregnancy?
N Percent
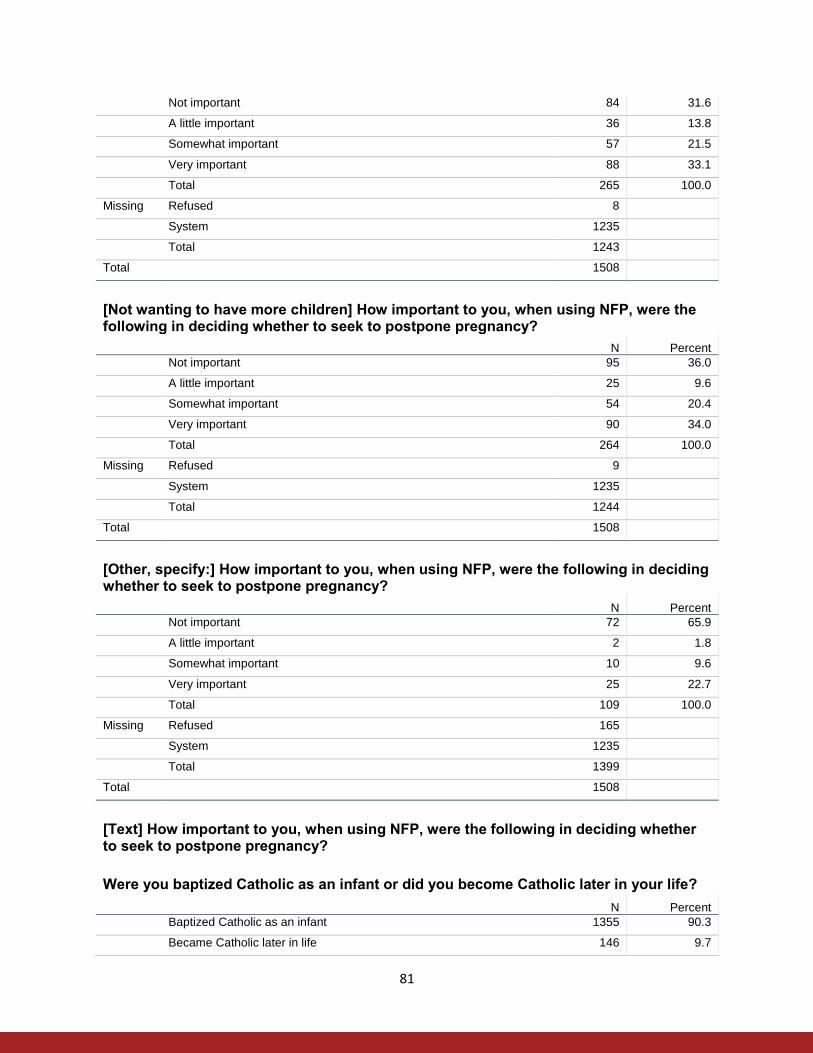
81
Not important 84 31.6
A little important 36 13.8
Somewhat important 57 21.5
Very important 88 33.1
Total 265 100.0
Missing Refused 8
System 1235
Total 1243
Total 1508
[Not wanting to have more children] How important to you, when using NFP, were the following in deciding whether to seek to postpone pregnancy?
N Percent Not important 95 36.0
A little important 25 9.6
Somewhat important 54 20.4
Very important 90 34.0
Total 264 100.0
Missing Refused 9
System 1235
Total 1244
Total 1508
[Other, specify:] How important to you, when using NFP, were the following in deciding whether to seek to postpone pregnancy?
N Percent Not important 72 65.9
A little important 2 1.8
Somewhat important 10 9.6
Very important 25 22.7
Total 109 100.0
Missing Refused 165
System 1235
Total 1399
Total 1508
[Text] How important to you, when using NFP, were the following in deciding whether to seek to postpone pregnancy?
Were you baptized Catholic as an infant or did you become Catholic later in your life?
N Percent Baptized Catholic as an infant 1355 90.3
Became Catholic later in life 146 9.7
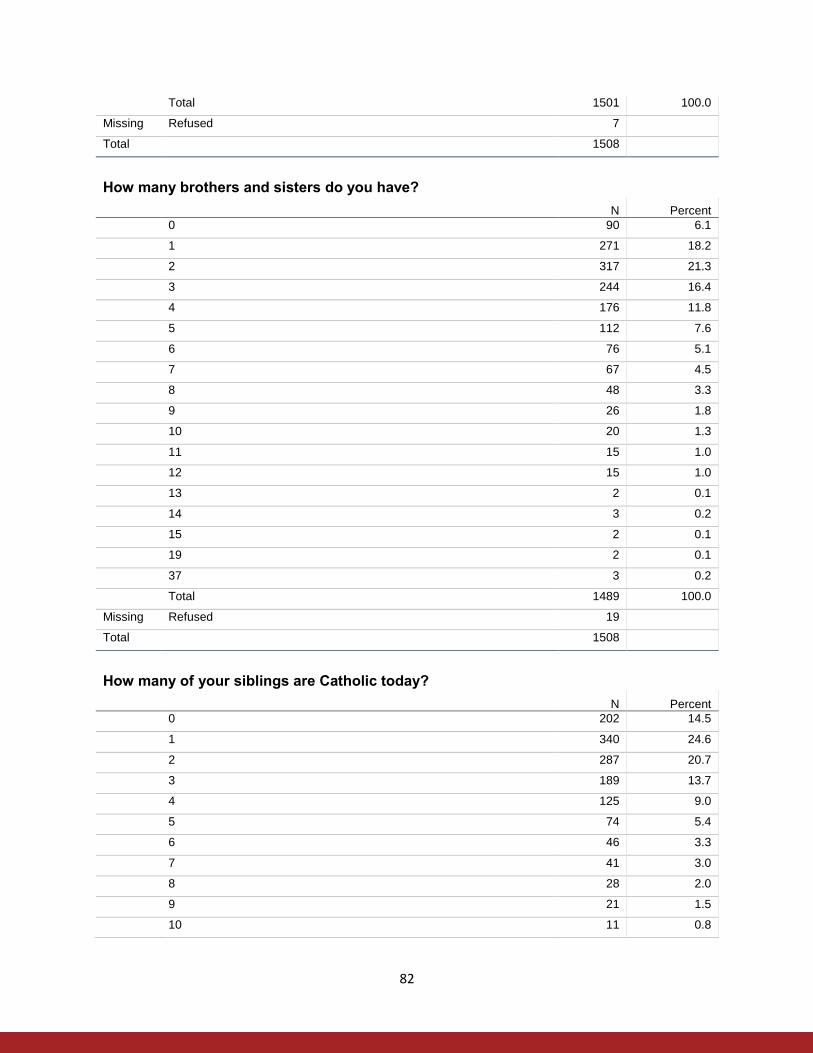
82
Total 1501 100.0
Missing Refused 7
Total 1508
How many brothers and sisters do you have?
N Percent 0 90 6.1
1 271 18.2
2 317 21.3
3 244 16.4
4 176 11.8
5 112 7.6
6 76 5.1
7 67 4.5
8 48 3.3
9 26 1.8
10 20 1.3
11 15 1.0
12 15 1.0
13 2 0.1
14 3 0.2
15 2 0.1
19 2 0.1
37 3 0.2
Total 1489 100.0
Missing Refused 19
Total 1508
How many of your siblings are Catholic today?
N Percent 0 202 14.5
1 340 24.6
2 287 20.7
3 189 13.7
4 125 9.0
5 74 5.4
6 46 3.3
7 41 3.0
8 28 2.0
9 21 1.5
10 11 0.8
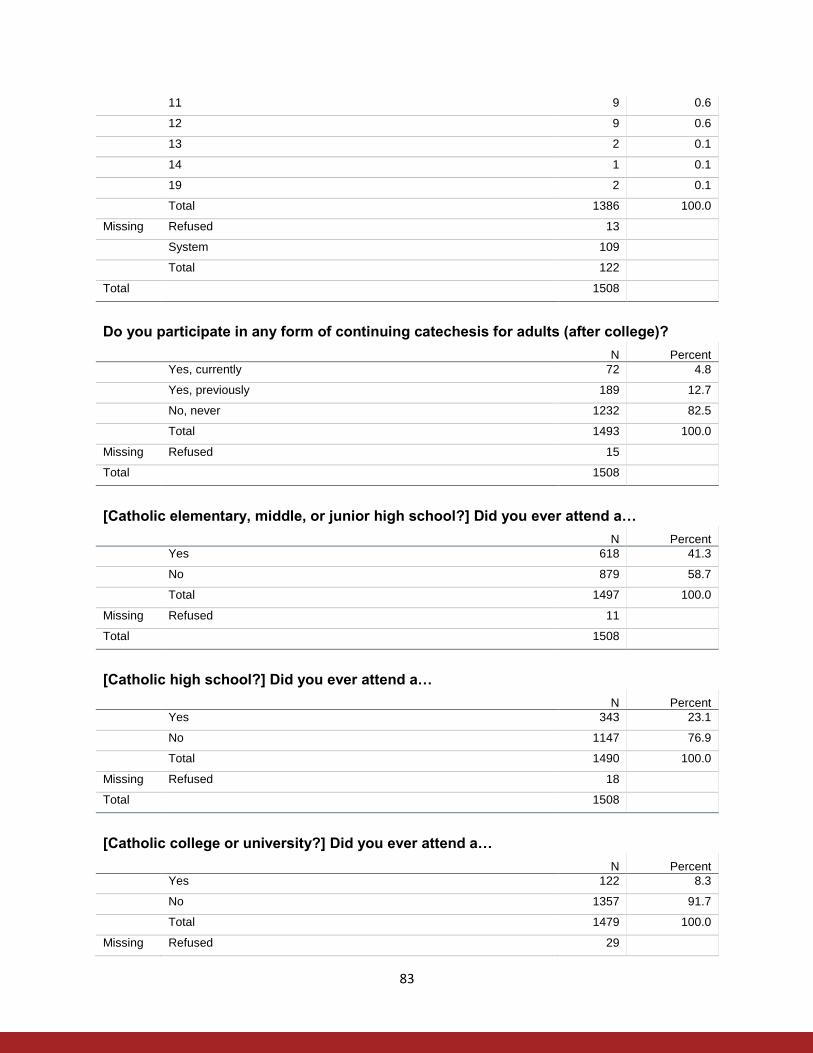
83
11 9 0.6
12 9 0.6
13 2 0.1
14 1 0.1
19 2 0.1
Total 1386 100.0
Missing Refused 13
System 109
Total 122
Total 1508
Do you participate in any form of continuing catechesis for adults (after college)?
N Percent Yes, currently 72 4.8
Yes, previously 189 12.7
No, never 1232 82.5
Total 1493 100.0
Missing Refused 15
Total 1508
[Catholic elementary, middle, or junior high school?] Did you ever attend a…
N Percent Yes 618 41.3
No 879 58.7
Total 1497 100.0
Missing Refused 11
Total 1508
[Catholic high school?] Did you ever attend a…
N Percent Yes 343 23.1
No 1147 76.9
Total 1490 100.0
Missing Refused 18
Total 1508
[Catholic college or university?] Did you ever attend a…
N Percent Yes 122 8.3
No 1357 91.7
Total 1479 100.0
Missing Refused 29

84
Total 1508
Is your spouse Catholic?
N Percent Yes 713 72.9
No 265 27.1
Total 978 100.0
Missing Refused 3
System 527
Total 530
Total 1508
Do you intend to vote in Congressional elections in November 2018?
N Percent Yes 1105 74.0
No 389 26.0
Total 1495 100.0
Missing Refused 13
Total 1508
Political Party Affiliation
N Percent Strong Republican 201 13.4
Not Strong Republican 153 10.2
Leans Republican 207 13.7
Undecided/Independent/Other 46 3.0
Leans Democrat 273 18.1
Not Strong Democrat 277 18.4
Strong Democrat 350 23.2
Total 1508 100.0
Currently, which party are you more inclined to vote for in Congressional elections in November 2018?
N Percent Democratic Party 594 54.7
Republican Party 400 36.8
Green Party 5 0.4
Libertarian Party 29 2.7
Some other party, specify: 57 5.3
Total 1085 100.0
Missing Refused 20
System 403

85
Total 423
Total 1508
[Text] Currently, which party are you more inclined to vote for in Congressional elections in November 2018?
[Catholic social teaching] Will any of the following help you decide how to vote in 2018?
N Percent No 977 88.4
Yes 129 11.6
Total 1105 100.0
Missing System 403
Total 1508
[Statements made by Pope Francis] Will any of the following help you decide how to vote in 2018?
N Percent No 897 81.1
Yes 209 18.9
Total 1105 100.0
Missing System 403
Total 1508
[Statements made by the U.S. bishops] Will any of the following help you decide how to vote in 2018?
N Percent No 1034 93.5
Yes 72 6.5
Total 1105 100.0
Missing System 403
Total 1508
[Advice from a pastor or parish priest] Will any of the following help you decide how to vote in 2018?
N Percent No 1035 93.6
Yes 71 6.4
Total 1105 100.0
Missing System 403
Total 1508
[None of these] Will any of the following help you decide how to vote in 2018?
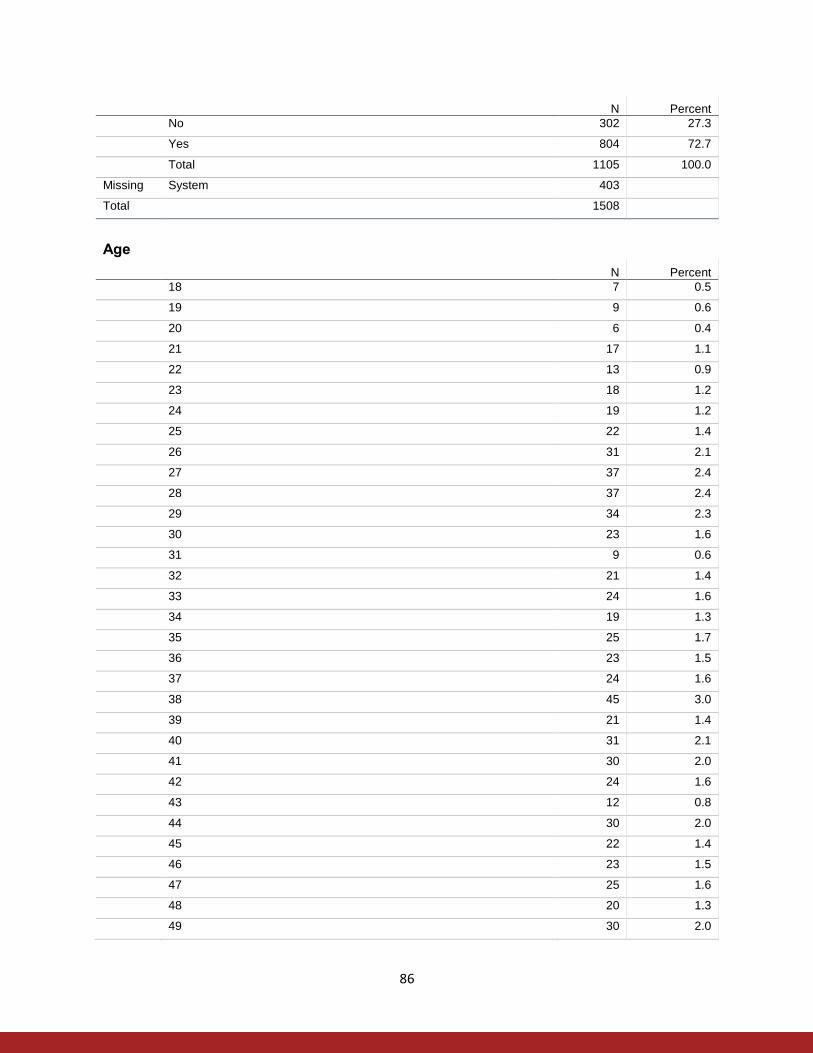
86
N Percent No 302 27.3
Yes 804 72.7
Total 1105 100.0
Missing System 403
Total 1508
Age
N Percent 18 7 0.5
19 9 0.6
20 6 0.4
21 17 1.1
22 13 0.9
23 18 1.2
24 19 1.2
25 22 1.4
26 31 2.1
27 37 2.4
28 37 2.4
29 34 2.3
30 23 1.6
31 9 0.6
32 21 1.4
33 24 1.6
34 19 1.3
35 25 1.7
36 23 1.5
37 24 1.6
38 45 3.0
39 21 1.4
40 31 2.1
41 30 2.0
42 24 1.6
43 12 0.8
44 30 2.0
45 22 1.4
46 23 1.5
47 25 1.6
48 20 1.3
49 30 2.0
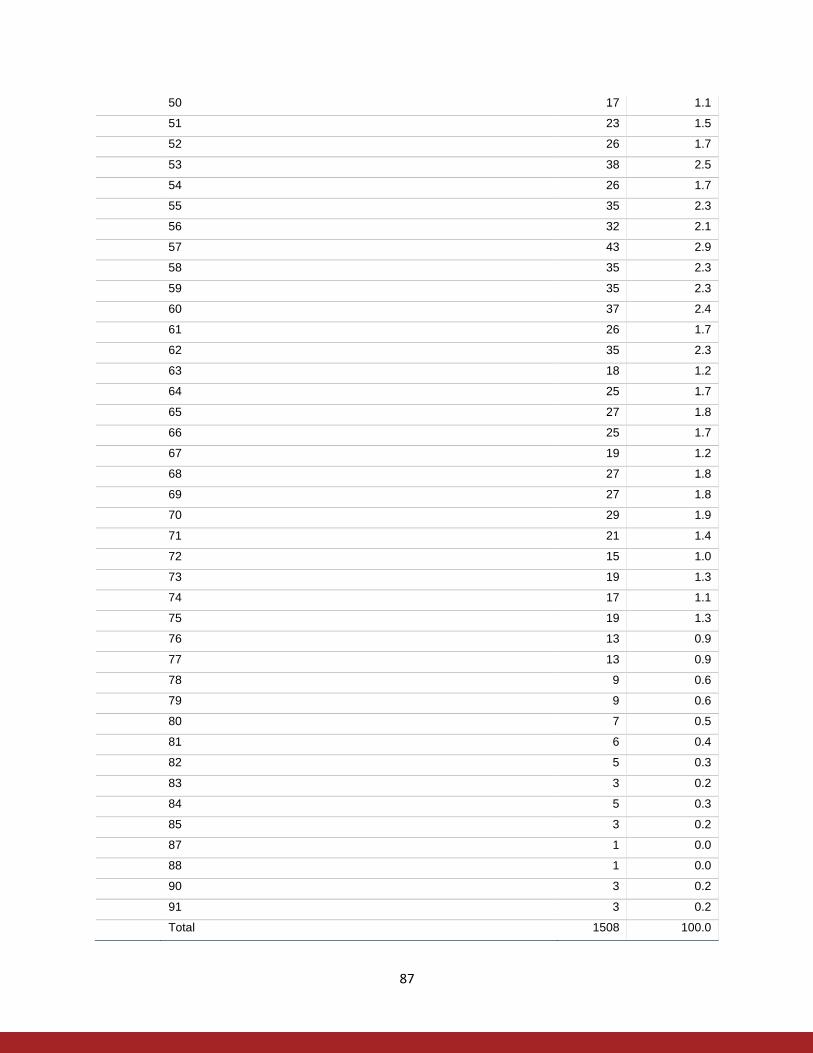
87
50 17 1.1
51 23 1.5
52 26 1.7
53 38 2.5
54 26 1.7
55 35 2.3
56 32 2.1
57 43 2.9
58 35 2.3
59 35 2.3
60 37 2.4
61 26 1.7
62 35 2.3
63 18 1.2
64 25 1.7
65 27 1.8
66 25 1.7
67 19 1.2
68 27 1.8
69 27 1.8
70 29 1.9
71 21 1.4
72 15 1.0
73 19 1.3
74 17 1.1
75 19 1.3
76 13 0.9
77 13 0.9
78 9 0.6
79 9 0.6
80 7 0.5
81 6 0.4
82 5 0.3
83 3 0.2
84 5 0.3
85 3 0.2
87 1 0.0
88 1 0.0
90 3 0.2
91 3 0.2
Total 1508 100.0

88
Age - 7 Categories
N Percent 18-24 90 6.0
25-34 257 17.1
35-44 266 17.6
45-54 250 16.6
55-64 321 21.3
65-74 225 14.9
75+ 99 6.5
Total 1508 100.0
Age - 4 Categories
N Percent 18-29 250 16.6
30-44 363 24.1
45-59 431 28.6
60+ 464 30.8
Total 1508 100.0
Education (Highest Degree Received)
N Percent No formal education 15 1.0
1st, 2nd, 3rd, or 4th grade 10 0.7
5th or 6th grade 21 1.4
7th or 8th grade 35 2.4
9th grade 43 2.8
10th grade 27 1.8
11th grade 39 2.6
12th grade NO DIPLOMA 26 1.7
HIGH SCHOOL GRADUATE - high school DIPLOMA or the equivalent (GED)
441 29.2
Some college, no degree 263 17.5
Associate degree 149 9.9
Bachelors degree 251 16.6
Masters degree 126 8.4
Professional or Doctorate degree 62 4.1
Total 1508 100.0
Education (Categorical)
N Percent Less than high school 216 14.3
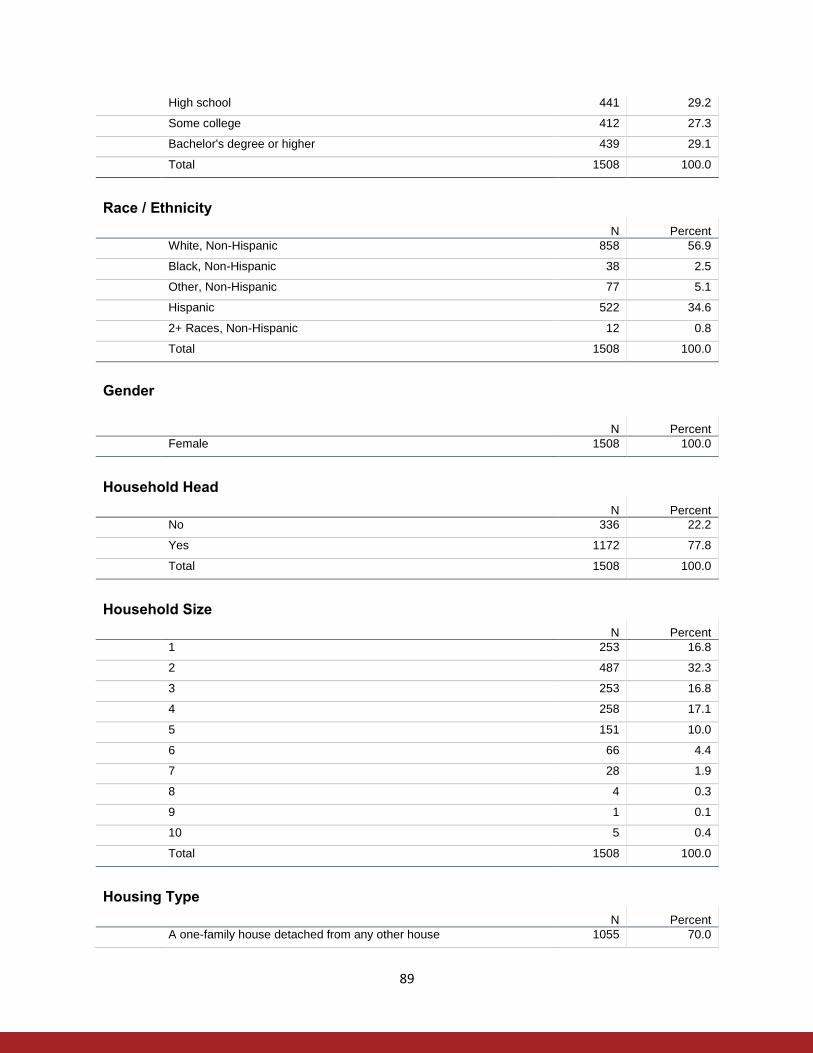
89
High school 441 29.2
Some college 412 27.3
Bachelor's degree or higher 439 29.1
Total 1508 100.0
Race / Ethnicity
N Percent White, Non-Hispanic 858 56.9
Black, Non-Hispanic 38 2.5
Other, Non-Hispanic 77 5.1
Hispanic 522 34.6
2+ Races, Non-Hispanic 12 0.8
Total 1508 100.0
Gender
N Percent Female 1508 100.0
Household Head
N Percent No 336 22.2
Yes 1172 77.8
Total 1508 100.0
Household Size
N Percent 1 253 16.8
2 487 32.3
3 253 16.8
4 258 17.1
5 151 10.0
6 66 4.4
7 28 1.9
8 4 0.3
9 1 0.1
10 5 0.4
Total 1508 100.0
Housing Type
N Percent A one-family house detached from any other house 1055 70.0
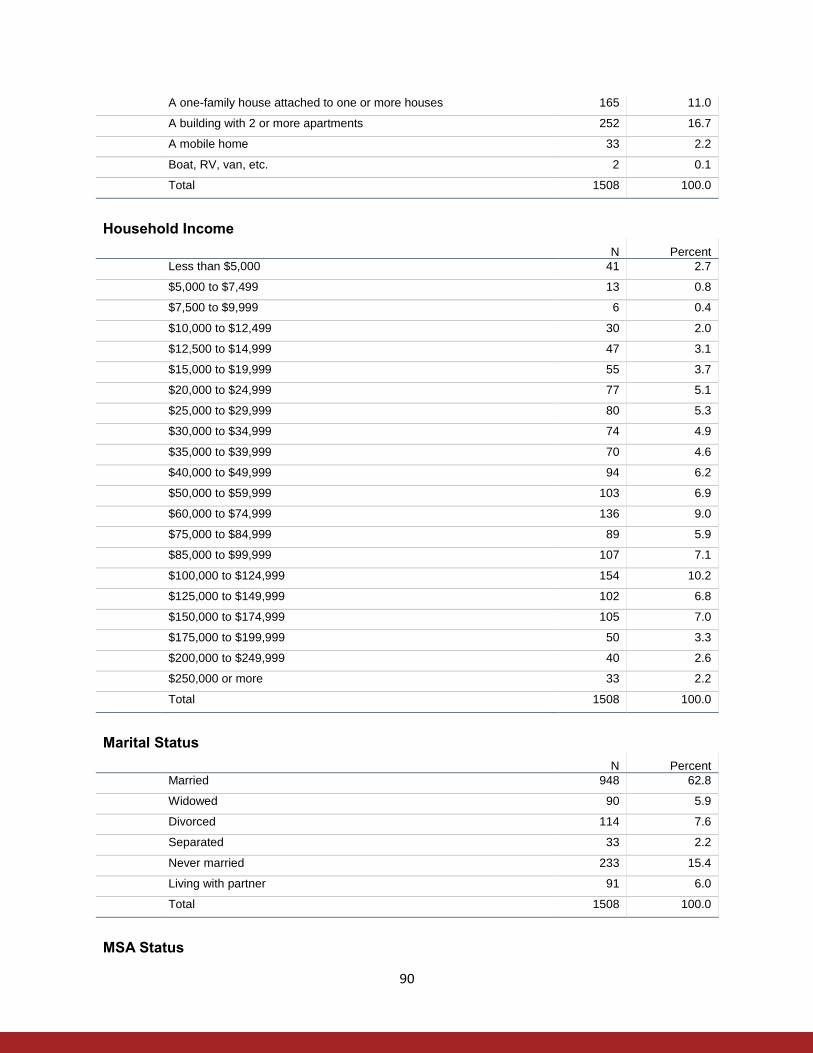
90
A one-family house attached to one or more houses 165 11.0
A building with 2 or more apartments 252 16.7
A mobile home 33 2.2
Boat, RV, van, etc. 2 0.1
Total 1508 100.0
Household Income
N Percent Less than $5,000 41 2.7
$5,000 to $7,499 13 0.8
$7,500 to $9,999 6 0.4
$10,000 to $12,499 30 2.0
$12,500 to $14,999 47 3.1
$15,000 to $19,999 55 3.7
$20,000 to $24,999 77 5.1
$25,000 to $29,999 80 5.3
$30,000 to $34,999 74 4.9
$35,000 to $39,999 70 4.6
$40,000 to $49,999 94 6.2
$50,000 to $59,999 103 6.9
$60,000 to $74,999 136 9.0
$75,000 to $84,999 89 5.9
$85,000 to $99,999 107 7.1
$100,000 to $124,999 154 10.2
$125,000 to $149,999 102 6.8
$150,000 to $174,999 105 7.0
$175,000 to $199,999 50 3.3
$200,000 to $249,999 40 2.6
$250,000 or more 33 2.2
Total 1508 100.0
Marital Status
N Percent Married 948 62.8
Widowed 90 5.9
Divorced 114 7.6
Separated 33 2.2
Never married 233 15.4
Living with partner 91 6.0
Total 1508 100.0
MSA Status
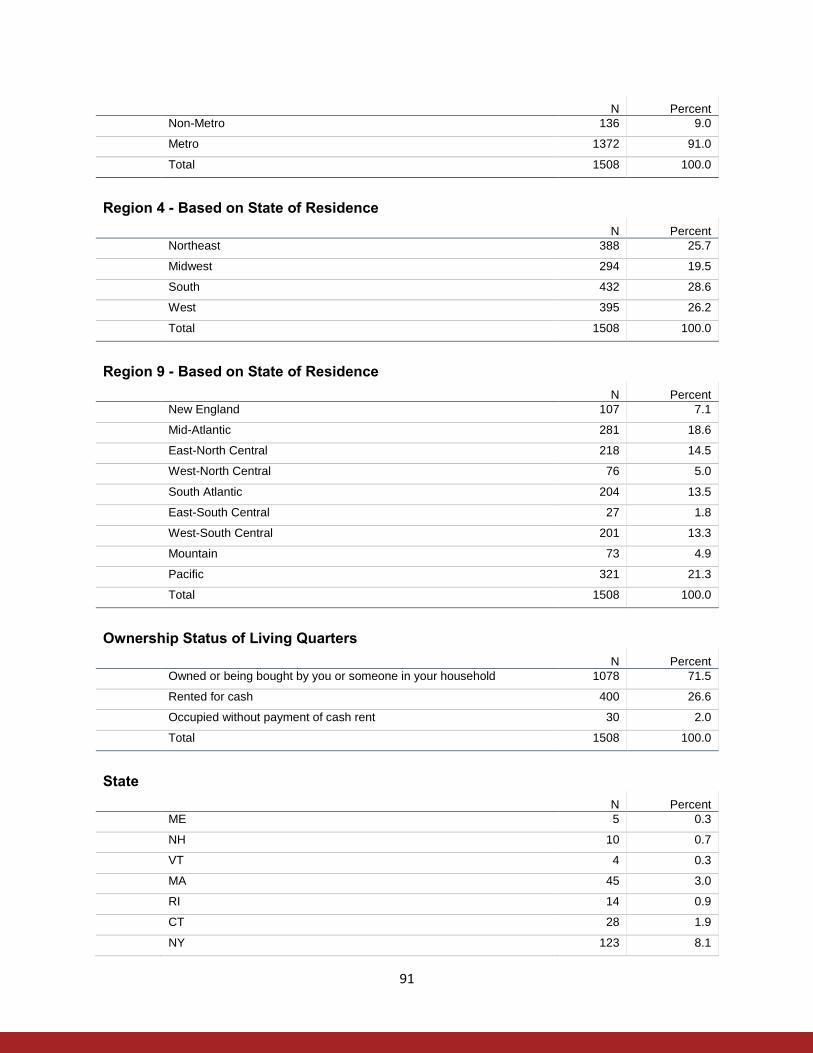
91
N Percent Non-Metro 136 9.0
Metro 1372 91.0
Total 1508 100.0
Region 4 - Based on State of Residence
N Percent Northeast 388 25.7
Midwest 294 19.5
South 432 28.6
West 395 26.2
Total 1508 100.0
Region 9 - Based on State of Residence
N Percent New England 107 7.1
Mid-Atlantic 281 18.6
East-North Central 218 14.5
West-North Central 76 5.0
South Atlantic 204 13.5
East-South Central 27 1.8
West-South Central 201 13.3
Mountain 73 4.9
Pacific 321 21.3
Total 1508 100.0
Ownership Status of Living Quarters
N Percent Owned or being bought by you or someone in your household 1078 71.5
Rented for cash 400 26.6
Occupied without payment of cash rent 30 2.0
Total 1508 100.0
State
N Percent ME 5 0.3
NH 10 0.7
VT 4 0.3
MA 45 3.0
RI 14 0.9
CT 28 1.9
NY 123 8.1
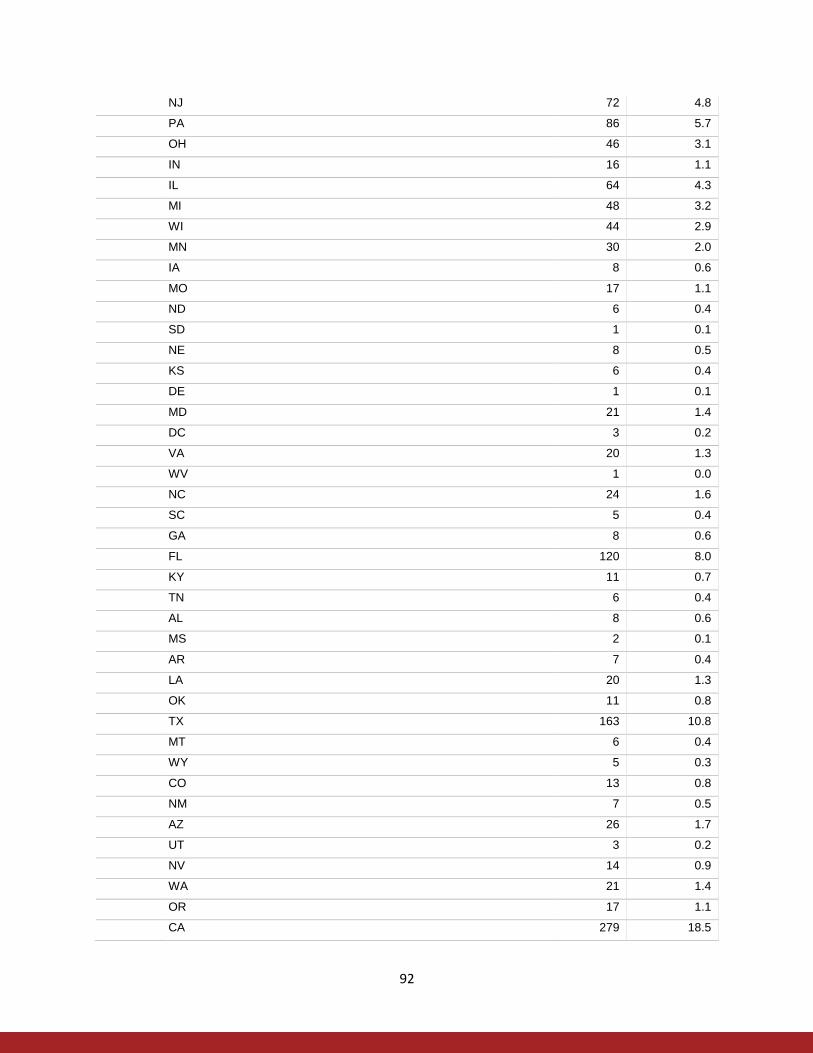
92
NJ 72 4.8
PA 86 5.7
OH 46 3.1
IN 16 1.1
IL 64 4.3
MI 48 3.2
WI 44 2.9
MN 30 2.0
IA 8 0.6
MO 17 1.1
ND 6 0.4
SD 1 0.1
NE 8 0.5
KS 6 0.4
DE 1 0.1
MD 21 1.4
DC 3 0.2
VA 20 1.3
WV 1 0.0
NC 24 1.6
SC 5 0.4
GA 8 0.6
FL 120 8.0
KY 11 0.7
TN 6 0.4
AL 8 0.6
MS 2 0.1
AR 7 0.4
LA 20 1.3
OK 11 0.8
TX 163 10.8
MT 6 0.4
WY 5 0.3
CO 13 0.8
NM 7 0.5
AZ 26 1.7
UT 3 0.2
NV 14 0.9
WA 21 1.4
OR 17 1.1
CA 279 18.5

93
AK 1 0.0
HI 3 0.2
Total 1508 100.0
Presence of Household Members - Children 0-1
N Percent 0 1432 95.0
1 74 4.9
2 2 0.1
Total 1508 100.0
Presence of Household Members - Children 2-5
N Percent 0 1328 88.0
1 144 9.6
2 34 2.3
3 2 0.1
Total 1508 100.0
Presence of Household Members - Children 6-12
N Percent 0 1220 80.9
1 190 12.6
2 79 5.2
3 16 1.1
4 3 0.2
Total 1508 100.0
Presence of Household Members - Children 13-17
N Percent 0 1254 83.2
1 198 13.1
2 51 3.4
3 5 0.4
Total 1508 100.0
Presence of Household Members - Adults 18+
N Percent 1 288 19.1
2 759 50.3
3 278 18.4
4 135 8.9
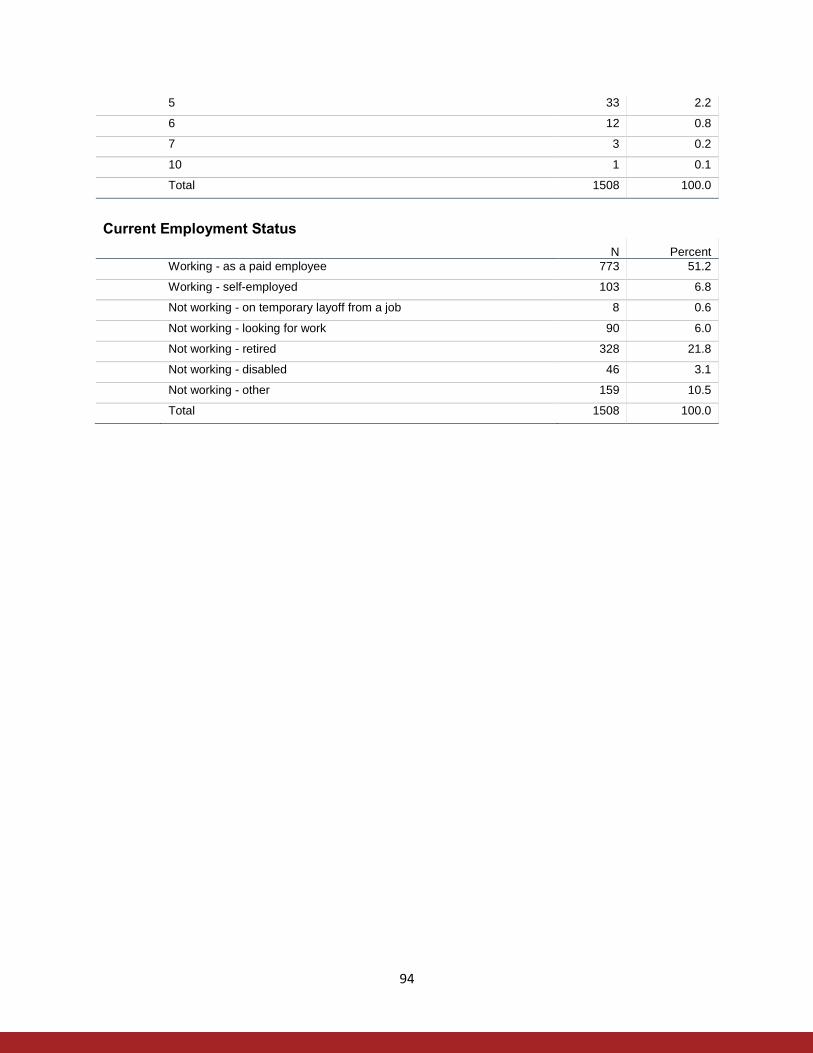
94
5 33 2.2
6 12 0.8
7 3 0.2
10 1 0.1
Total 1508 100.0
Current Employment Status
N Percent Working - as a paid employee 773 51.2
Working - self-employed 103 6.8
Not working - on temporary layoff from a job 8 0.6
Not working - looking for work 90 6.0
Not working - retired 328 21.8
Not working - disabled 46 3.1
Not working - other 159 10.5
Total 1508 100.0