Catenary Mooring Chain Eigen Modes and the Effects on ... · Catenary Mooring Chain Eigen Modes and...
18
Catenary Mooring Chain Eigen Modes and the Effects on Fatigue Life Tor Anders Nygaard and Jacobus de Vaal, IFE Morten Hviid Madsen and Håkon Andersen, Dr.techn Olav Olsen AS Jorge Altuzarra, Vicinay Marine Innovacion
Transcript of Catenary Mooring Chain Eigen Modes and the Effects on ... · Catenary Mooring Chain Eigen Modes and...
Catenary Mooring Chain Eigen Modes and the Effects on Fatigue Life
Tor Anders Nygaard and Jacobus de Vaal, IFE Morten Hviid Madsen and Håkon Andersen, Dr.techn Olav Olsen AS
Jorge Altuzarra, Vicinay Marine Innovacion

Catenary Mooring • Soft station-keeping, keep platform within envelope for
current, drift forces and mean rotor thrust • Should ideally not restrict platform first order wave
motions. Platform inertia is averaging wave force peaks • Restoring force by geometric stiffness of the catenary
shape • Possible conflict with maximum deflection of power cable
Animation: Taut vs. Catenary Mooring
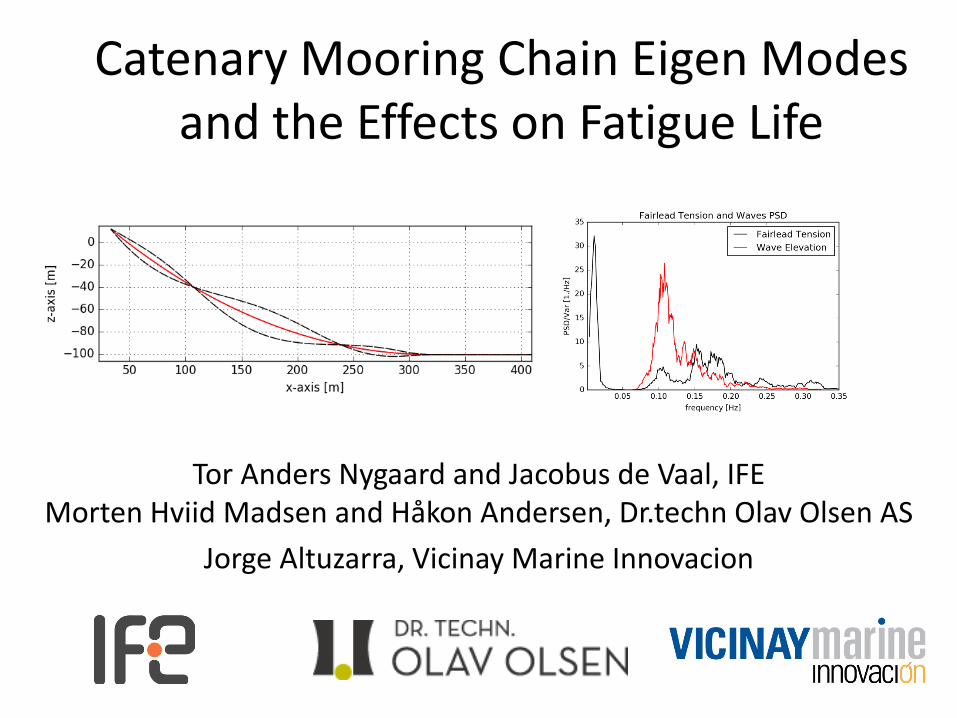
Effects of Water Depth
Decreasing water depth gives decreasing catenary effect and increasing force amplitudes for given floater motions Sharp rise in force when the entire chain is lifted off the seafloor

Baseline Fatigue Case
• OO-Star Wind Floater with 6MW rotor
• 100m water depth, anchor radius 750m
• 147mm chain with marine growth and hydrodynamic coefficients according to DNV-GL recommendations
• Wind (16 m/s), waves (Hs 3.7m) and current (0.15m/s) aligned with upstream mooring line
OO-Star Wind Floater with 6MW rotor, baseline FLS case, 3DFloat Animation

Typical Results for Fatigue
• First order wave excitation between 0.05 and 0.3Hz • Fairlead Motions (not shown in figure) closely follow first order wave
excitation + surge eigen mode • Fairlead tension response is shifted towards higher frequencies • The response above 0.12 Hz accounts for a significant part of the fatigue
damage • Aim for work in progress: Understand the response , and make sure we
compute this correctly.

Contributions to fatigue, Rainflow Counting, 1
• Identify turning points • Split in full- and half cycles • Each cycle has a stress range, that together with the S-N curve and Miner
rule correspons to fatigue damage • Each stress cycle also has a frequency • We have binned the stress cycles accoording to stress range and frequency,
and can then sort out the contributions from different frequencies and stress ranges

Contributions to fatigue, Rainflow Counting, 2
Important contributions to fatigue from frequencies up to 0.3Hz Important stress ranges 2 – 10 MPa Frequencies above 0.12Hz contribute to about 40% of the fatigue damage These low stress ranges are commonly ignored on dry land. The standard does not recommend a cut-off in sea-water

Models • 3DFloat(IFE), SIMA(Sintef Ocean) and
OrcaFlex(Orcina) • Morison’s equation on relative form. • Nonlinearities: Co-rotated in 3DFloat and SIMA,
direct specification of element matrices in global frame in OrcaFlex
• Chain eigen modes by linearization and eigen analysis in SIMA, and by bandpass-filtering of time-domain motions in 3DFloat

Single Line, Fixed Fairlead, Waves Only
• Standard deviation of stress is around 0.2MPa, compared to 2MPa for FLS with floater, waves, current and wind.
• Stress due to direct wave loading on line is therefore not important compared to floater motions
• This case is useful for identifying possible eigen frequencies

Eigen Modes Identification • Single mooring line similar to baseline, but with constant
properties. The results are simular, but the eigen frequencies change somewhat
• Pre-tension by positioning of fairlead to obtain 2000kN tension at fairlead.
• Apply irregular waves as in baseline case. • Compare peaks in PSD plots with eigen analysis and forced
fairlead motion results. • Visualization of motions

Animation of mooring line mode, 3DFloat

Forced Motion Sweep 0.15 – 0.6 Hz 3DFloat
Single mooring line, pre-tension 2000kN Harmonic inline horizontal motion of fairlead, increasing frequency slowly from 0.10Hz to 0.6Hz (shown from 0.15Hz due to initial transient) Amplitude is decreased with increasing frequency to keep peak acceleration of fairlead constant Peaks at approx. 0.19Hz, 0.33Hz and 0.42Hz This corresponds relatively well with the waves only case shown in the previous slide
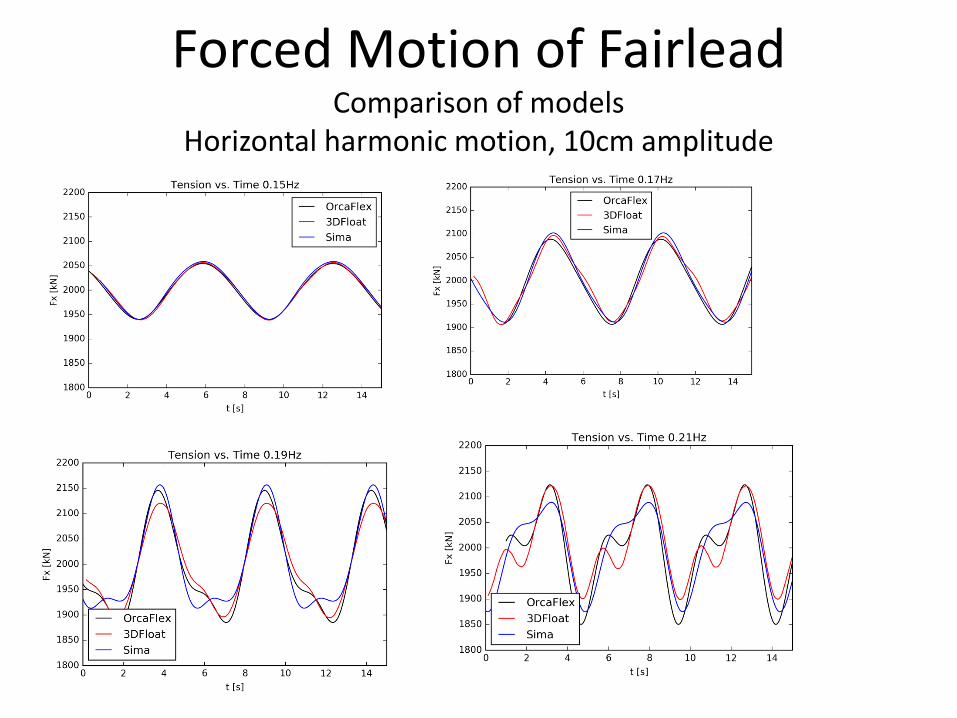
Forced Motion of Fairlead Comparison of models
Horizontal harmonic motion, 10cm amplitude

Forced Motion of Fairlead, 2 Horizontal harmonic motion, 10cm amplitude
• Good agreement for 0.15 and 0.17Hz • 0.19 and 0.21Hz are close to eigen frequency at 0.2Hz, some differences
and sensitivity to model parameters • Some differences at 0.23 and 0.25Hz, increased influence of inertial
loads. • At 0.2Hz, the dynamic response compared to the quasi-static response
correspond to an ‘amplification factor’ of 10
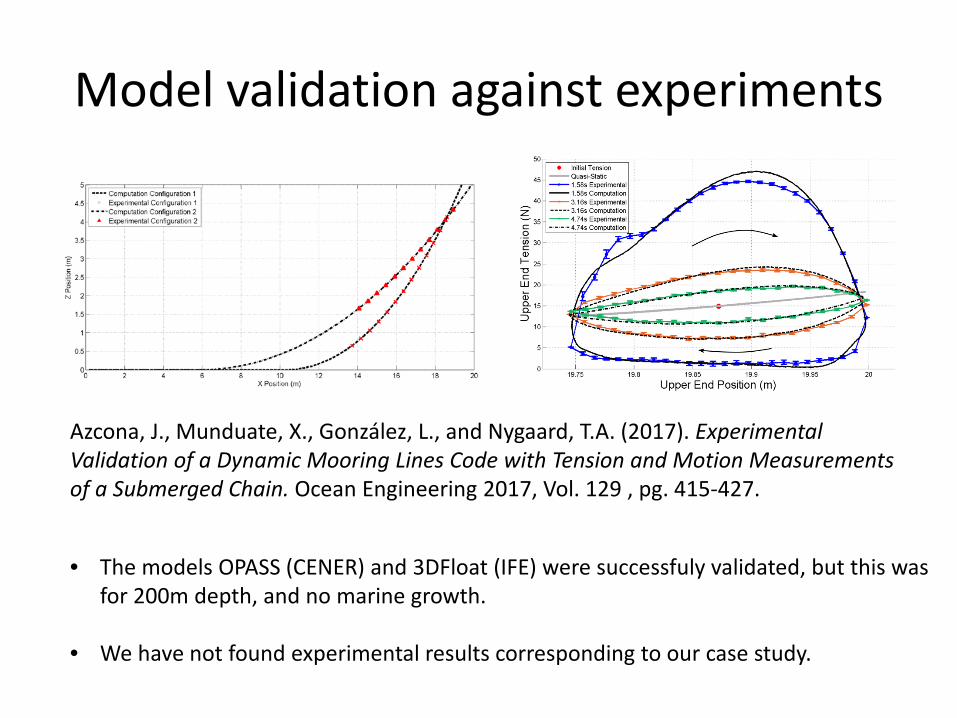
Model validation against experiments
Azcona, J., Munduate, X., González, L., and Nygaard, T.A. (2017). Experimental Validation of a Dynamic Mooring Lines Code with Tension and Motion Measurements of a Submerged Chain. Ocean Engineering 2017, Vol. 129 , pg. 415-427.
• The models OPASS (CENER) and 3DFloat (IFE) were successfuly validated, but this was for 200m depth, and no marine growth.
• We have not found experimental results corresponding to our case study.
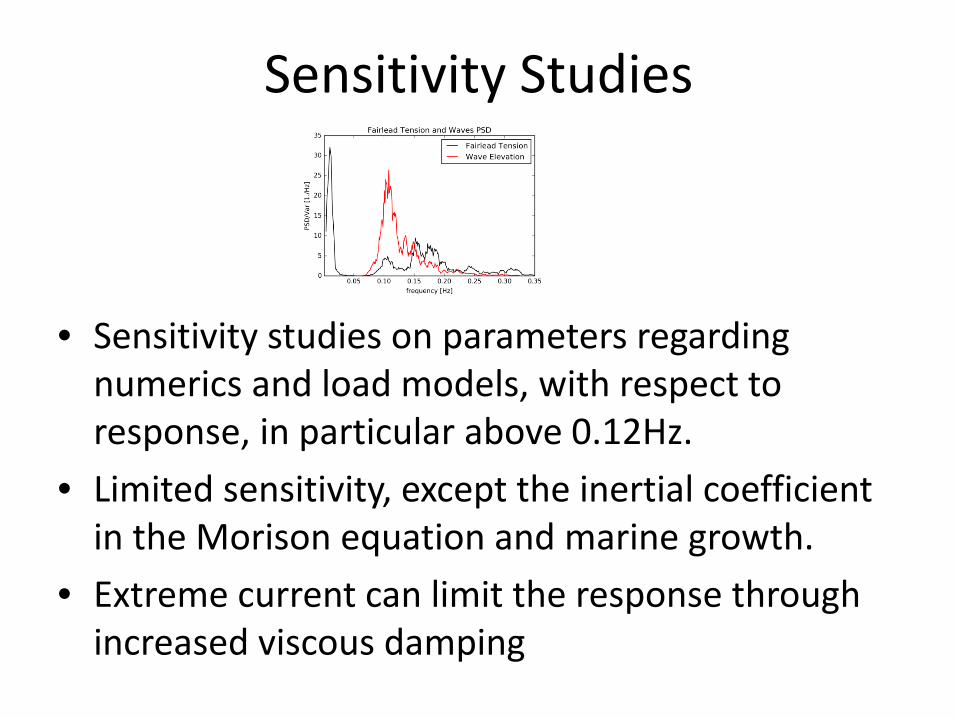
Sensitivity Studies
• Sensitivity studies on parameters regarding numerics and load models, with respect to response, in particular above 0.12Hz.
• Limited sensitivity, except the inertial coefficient in the Morison equation and marine growth.
• Extreme current can limit the response through increased viscous damping

Conclusions
• Computations of fatigue in a catenary mooring system applied at intermediate water depth with three state-of-the art integrated models show similar results, that are very different from quasi-static mooring line characteristics
• A mode with three half-waves between fairlead and touch-down shifts the response to higher frequencies than what is expected from the wave spectrum
• Important contributions to fatige are from stress ranges 2 – 10 MPa and frequencies up to 0.3Hz
• More experimental results are needed for model validation; previous succeesful validation was at a water depth corresponding to 200m, and with different influence of inertial forces relative to gravity and drag forces.

Acknowledgements - Innovative mooring systems
• Scope: Innovative Solutions for Shallow Water Mooring Systems • RCN project under ENERGIX, project number: 256364 • Project Responsible: Dr.techn. Olav Olsen • Partners: IFE, Statoil, Rolls Royce, Vicinay, OTS, Aibel, Servi • External advisors: DNV-GL, NGI, FMGC