Catalyzing Climate and Disaster Resilience
338
Processes for Identifying Tangible and Economically Robust Strategies Catalyzing Climate and Disaster Resilience The Risk to Resilience Study Team INDIA: NEPAL: PAKISTAN FINAL REPORT OF THE RISK TO RESILIENCE STUDY P f Id tif i T ibl d Cataly in Climate and
-
Upload
merant-de-vera -
Category
Documents
-
view
87 -
download
7
description
Catalyzing Climate and Disaster ResilienceProcesses for Identifying Tangible and Economically Robust Strategies INDIA: NEPAL: PAKISTANFINAL REPORT OF THE RISK TO RESILIENCE STUDYThe Risk to Resilience Study TeamPIEDARCatalyzing Climate and Disaster ResilienceProcesses for Identifying Tangible and Economically Robust Strategies INDIA: NEPAL: PAKISTANFINAL REPORT OF THE RISK TO RESILIENCE STUDYThe Risk to Resilience Study Team March 2009Please use the following reference for thi
Transcript of Catalyzing Climate and Disaster Resilience
Processes for Identifying Tangible andEconomically Robust Strategies
Catalyzing Climate andDisaster Resilience
The Risk to Resilience Study Team
INDIA: NEPAL: PAKISTAN
FINAL REPORT OF THE RISK TO RESILIENCE STUDYP
fId
tifi
Tibl
dCataly
inClim
ateand

Processes for Identifying Tangible andEconomically Robust Strategies
Catalyzing Climate andDisaster Resilience
The Risk to Resilience Study Team
INDIA: NEPAL: PAKISTAN
FINAL REPORT OF THE RISK TO RESILIENCE STUDY
The Risk to Resilience Study TeamMarch 2009
PIEDAR
© Copyright, 2009
Institute for Social and Environmental Transition &Institute for Social and Environmental Transition-Nepal.
This publication is made possible by the support of United Kingdom's Department forInternational Development (DFID). The research programme is supported through DFID grantnumber OHM0837, NOAA award number NA06OAR4310081 and the Canadian InternationalDevelopment Research Centre (IDRC) Centre file 103232-001. Views and opinions expressedwithin do not necessarily reflect the positions of DFID, NOAA and IDRC. The findings,interpretations and conclusions expressed in this paper are those of the authors alone.
Any part of this publication may be cited, copied, translated into other languages or adapted tomeet local needs without prior permission from ISET or ISET-Nepal provided that the source isclearly stated.
First Edition: 1000March 2009
ISBN: 978-9937-2-12748
Editors: Marcus Moench, Elizabeth Fajber, Ajaya Dixit, Elisabeth Caspari & Anil Pokhrel
Published by: Institute for Social and Environmental Transition & Institute for Social andEnvironmental Transition-Nepal.
Cover: Temporary bamboo bridge south of Gaur in Nepal Tarai used during non-rainy season.The Bairgania embankment with a dysfunctional sluice is seen in background.Photo by Ram Adhar Yadav.
DESIGN AND TYPESETTINGDigiscan Pre-press, Kathmandu, Nepal.
PRINTED ATFormat Printing Press, Kathmandu, Nepal.
Please use the following reference for this report:The Risk to Resilience Study Team (2009): Catalyzing Climate and Disaster Resilience: Processesfor Identifying Tangible and Economically Robust Strategies: Final Report of the Risk toResilience Study, eds. Moench, M., Fajber, E., Dixit, A., Caspari, E., & Anil Pokhrel, ISET, ISET-Nepal,Kathmandu, Nepal, 328 pp.
THE RISK TO RESILIENCE STUDY TEAM & THEIR INSTITUTIONS
Institute for Social and Environmental Transition (ISET), USAMarcus Moench
Sarah Opitz-Stapleton
ISET Associates-PakistanFawad Khan
Atta-ur Rehman
ISET Associates-IndiaSara AhmedEva Saroch
International Institute of Applied Systems Analysis (IIASA), AustriaReinhard Mechler
Daniel KullStefan Hochrainer
Joanne Linnerooth-BayerUnmesh Patnaik
King’s College London, UKDaanish Mustafa
NEPAL
Institute for Social and Environmental Transition-Nepal (ISET-N), NepalAjaya DixitAnil Pokhrel
Nepal Water Conservation Foundation (NWCF), NepalMadhukar Upadhya
Kanchan Dixit
PAKISTAN
Pakistan Institute for Environment-Development Action Research (PIEDAR), PakistanSyed Ayub Qutub
INDIA
Winrock International India (WII), IndiaShashikant Chopde
Praveen SinghSunandan TiwariMamta BorgoyarySharmistha Bose
Gorakhpur Environmental Action Group (GEAG), IndiaShiraz A. Wajih
Abhilash SrivastavGyaneshwar Singh
iv
Title
The Cost-Benefit Analysis Methodology
Pinning Down Vulnerability: FromNarratives to Numbers
Downscaling: Potential Climate ChangeImpacts in the Rohini Basin, Nepal andIndia
Evaluating Costs and Benefits of FloodReduction Under Changing ClimaticConditions:Case of the Rohini River Basin, India
Uttar Pradesh Drought Cost-BenefitAnalysis, India
Costs and Benefits of Flood Mitigation inthe Lower Bagmati Basin: Case of NepalTarai and North Bihar, India
Pakistan Case Study: Evaluating theCosts and Benefits of Disaster RiskReduction under Changing ClimaticConditions
Moving from Concepts to Practice: AProcess and Methodology Summary forIdentifying Effective Avenues for RiskManagement Under Changing ClimaticConditions
Understanding the Costs and Benefits ofDisaster Risk Reduction under ChangingClimatic Conditions
Lead Authors
Reinhard Mechler (IIASA)
Daanish Mustafa (KCL); Sara Ahmed, Eva Saroch(ISET-India)
Sarah Opitz-Stapleton (ISET);Subhrendu Gangopadhyay (University ofColorado, Boulder)
Daniel Kull (IIASA); Praveen Singh,Shashikant Chopde (WII); Shiraz A. Wajih (GEAG)
Reinhard Mechler, Stefan Hochrainer, Daniel Kull(IIASA); Praveen Singh, Shashikant Chopde(WII); Shiraz A. Wajih (GEAG)
Ajaya Dixit, Anil Pokhrel (ISET-Nepal);Marcus Moench (ISET)
Fawad Khan (ISET-Pakistan); Daanish Mustafa(KCL); Daniel Kull (IIASA)
Marcus Moench (ISET); Sara Ahmed (ISET-India);Reinhard Mechler (IIASA); Daanish Mustafa (KCL);Ajaya Dixit (ISET-Nepal); Sarah Opitz-Stapleton(ISET); Fawad Khan (ISET-Pakistan); Daniel Kull(IIASA)
Marcus Moench (ISET)
Focus
CBA methods
VCI methods
Climate downscalingmethods
India floods
India drought
Nepal Tarai and NorthBihar floods
Pakistan (urban) floods
Methodology summary
Summary report
Working PaperNumber
WP 1
WP 2
WP 3
WP 4
WP 5
WP 6
WP 7
WP 8
WP 9
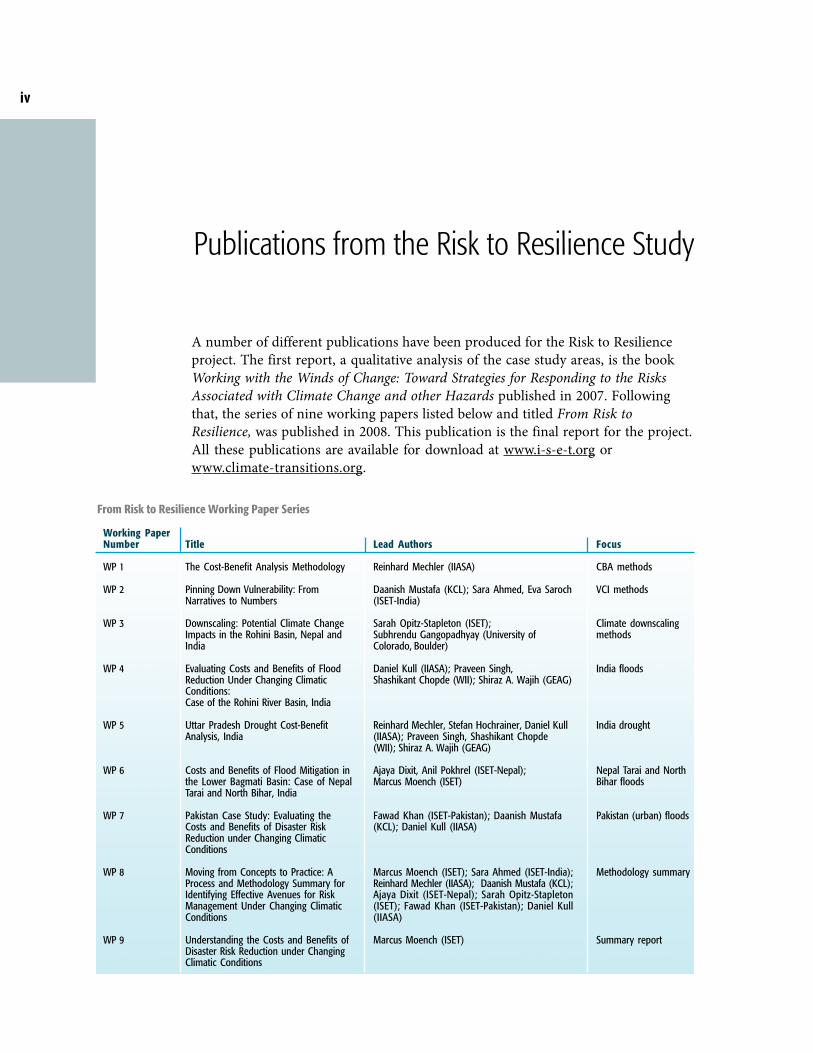
Publications from the Risk to Resilience Study
A number of different publications have been produced for the Risk to Resilienceproject. The first report, a qualitative analysis of the case study areas, is the bookWorking with the Winds of Change: Toward Strategies for Responding to the RisksAssociated with Climate Change and other Hazards published in 2007. Followingthat, the series of nine working papers listed below and titled From Risk toResilience, was published in 2008. This publication is the final report for the project.All these publications are available for download at www.i-s-e-t.org orwww.climate-transitions.org.
From Risk to Resilience Working Paper Series
v
Acknowledgements
This report provides insights from an evaluation of the costs and benefits ofdisaster risk reduction and adaptation to climate change in South Asia. The reportis based on fieldwork undertaken in the Nepal Tarai; Eastern Uttar Pradesh, India;and Rawalpindi, Pakistan. The study as a whole was financed by DFID. Relatedactivities financed by IDRC on adaptation to climate change, NOAA on the use ofclimate information products and ProVention on disaster risk reduction have alsobeen undertaken in conjunction with the study and have contributed in asubstantive manner to the results presented here. The support of all theseorganizations is gratefully acknowledged.
The Risk to Resilience project was highly collaborative. All partner organizationsplayed central field, analytical and conceptual roles. This said, specificorganizations did lead different components. Research in each location wasconducted by core project partners: ISET-Nepal and Nepal Water ConservationFoundation led activities in Nepal; Winrock International India led all activities inIndia, working in close coordination with the Gorakhpur Environmental ActionGroup and the ISET Associates in India; and PIEDAR and ISET Associates workedclosely together in Pakistan. The International Institute of Applied SystemsAnalysis (IIASA) and King’s College London led respectively on the technical cost-benefit and vulnerability components of the project. All activities were coordinatedand supported by ISET.
In addition to the financial support and the involvement of all members of the Riskto Resilience Study Team, several individuals have made important contributions tothis report. These included Subhrendu Gangopadhyay of Environmental StudiesProgram, University of Colorado, Boulder for his contribution on downscaling ofclimate scenarios and Sonam Bennett-Vasseux from ISET for much appreciatededitorial support. Substantive inputs from field research were also contributed inNepal, India and Pakistan by numerous dedicated field staff and individuals ingovernment and non-government organizations as well as the local communitiesthat they interacted with. The intensive, highly professional, work by SureshShrestha and all the others at Format Graphics in the publication of this reportunder difficult conditions is gratefully acknowledged.

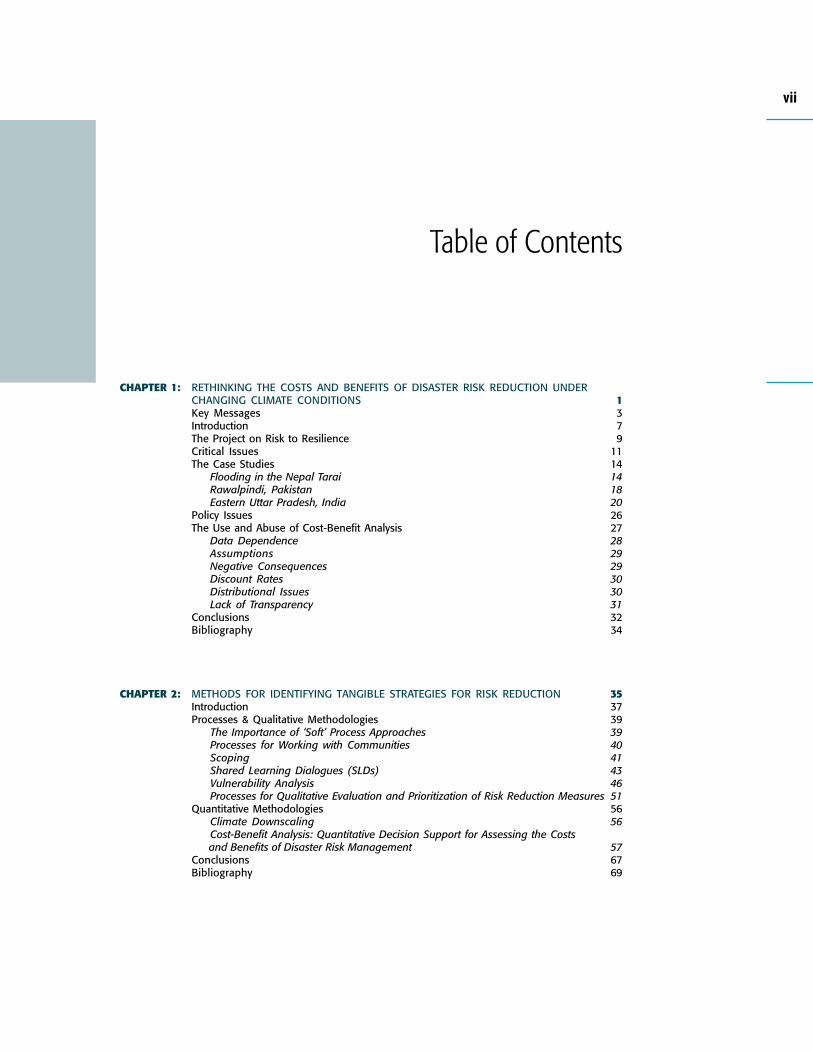
CHAPTER 1: RETHINKING THE COSTS AND BENEFITS OF DISASTER RISK REDUCTION UNDERCHANGING CLIMATE CONDITIONS 1Key Messages 3Introduction 7The Project on Risk to Resilience 9Critical Issues 11The Case Studies 14
Flooding in the Nepal Tarai 14Rawalpindi, Pakistan 18Eastern Uttar Pradesh, India 20
Policy Issues 26The Use and Abuse of Cost-Benefit Analysis 27
Data Dependence 28Assumptions 29Negative Consequences 29Discount Rates 30Distributional Issues 30Lack of Transparency 31
Conclusions 32Bibliography 34
CHAPTER 2: METHODS FOR IDENTIFYING TANGIBLE STRATEGIES FOR RISK REDUCTION 35Introduction 37Processes & Qualitative Methodologies 39
The Importance of ‘Soft’ Process Approaches 39Processes for Working with Communities 40Scoping 41Shared Learning Dialogues (SLDs) 43Vulnerability Analysis 46Processes for Qualitative Evaluation and Prioritization of Risk Reduction Measures 51
Quantitative Methodologies 56Climate Downscaling 56Cost-Benefit Analysis: Quantitative Decision Support for Assessing the Costs
and Benefits of Disaster Risk Management 57Conclusions 67Bibliography 69
Table of Contents
vii
viii
CHAPTER 3: DOWNSCALING CLIMATE INFORMATION IN DATA LIMITED CONTEXTS: POTENTIALCHANGES IN THE ROHINI BASIN, NEPAL AND INDIA 71Introduction 73
The Rohini Basin 76Datasets and Assumptions 78Methodology 81Forecasting Results 88Climate Change Scenario Uncertainty 93
Conclusion 97Bibliography 98
CHAPTER 4: QUALITATIVE ASSESSMENT OF THE COSTS AND BENEFITS OF FLOOD MITIGATION:LOWER BAGMATI BASIN - NEPAL AND INDIA 101Key Messages 103Introduction of the Lower Bagmati Basin: Location, Issues and Responses 105
Administrative Characteristics 106Social and Economic Characteristics 107Hydrologic and Geologic Characteristics 108Climate Change Impacts 111
Evaluating Alternative Flood Management Strategies 112The Qualitative CBA Methodology using Shared Learning Dialogues 113
Example of the Methodology Employed 115Results along the Transect 119
Transect I: Villages along the Bagmati River 119Transect II: Villages along the Lal Bakaiya River 122Transect III: Gaur Municipality - Bairgania Ring Embankment - Pipradi Sultan 124
Analysis: Findings from the Transects 127Issues Encountered in Conducting CBA 129
Conclusions 130Bibliography 132
CHAPTER 5: COMPARING URBAN FLOOD MITIGATION OPTIONS: COSTS ANDBENEFITS IN RAWALPINDI, PAKISTAN 133Introduction 135
The Lai Flood Basin 135Methods 137
The Contextual Environment,from Community to Policy 139Strategies 139What is being Done ? 140What are the Policies ? 145Disjuncture between Community and Government Perceptions 149Identification of Main Strategies Selected for Evaluation 149
Evaluating Tradeoffs 150Who is Vulnerable ? 150Methodology: Qualitative 150Methodology: Quantitative 155
Conclusions 164Bibliography 166
ix
CHAPTER 6: QUANTITATIVE COST-BENEFIT ASSESSMENT OF FLOOD MITIGATION OPTIONS:UTTAR PRADESH, INDIA 169Introduction 171
Historic Political and Policy Environments 171Lack of Learning 171Disjuncture between Groups, Institutions, Levels of Activity and Analysis 172Major Changes due to Climate Change (to 2050) 172
Analysis of Strategies for Flood Risk Reduction 173Utility of Cost-Benefit Analysis 173
Study Background 175Geographical Setting 175Agro-ecological Setting 177Flood Hazard 178An Introduction to Methods 179
Who is Vulnerable ? 181Socio-economic Conditions 181Socio-economic Vulnerability 182Financial Vulnerability 183Spatial Vulnerability 184Summary 185
Community to Policy Context 186Flood Risk Reduction Programmes 186Disjuncture between Institutions and Communities 188Identifying Flood Risk Reduction Strategies 190
Evaluating Tradeoffs 191Qualitative Analysis 191Quantitative Analysis 201
Conclusions 218Flood Risk Reduction Strategies 218Disaster Risk Reduction Policy 218Supporting Decision-Making and Policy Development 219
Bibliography 221
CHAPTER 7: COMBINING INNOVATIVE STRATEGIES FOR EFFECTIVE DROUGHT RISKMANAGEMENT: COSTS AND BENEFITS OF INSURANCE AND IRRIGATION INUTTAR PRADESH, INDIA 223Introduction 225
The Issue: Drought and Rural Livelihoods 226The Methodology and Key Findings 226
The Case Location, Issues and Responses 228The Risks 229Who is Affected and How ? 229The Main Strategies for Risk Reduction that are being Implemented 230
Assessing Risk: The Modelling Approach 232Exposure 234Hazard 235Vulnerability 236Monetary Crop Yield Risk 237Economic Vulnerability and Risk 237
Risk Management Interventions: Identification and Costs 240Overview 240Irrigation 241Insurance 241
Risk Management Interventions - Assessment of Benefits 244Irrigation 244Crop Insurance 244Stochastic Representation of Interventions 245
Economic Efficiency of Risk Management 246Constant Climate 246Changing Climate 247
Conclusions 248Bibliography 250
CHAPTER 8: MOVING FROM POLICY TO PRACTICE: THE ROLE OF COST-BENEFITANALYSIS IN PRO-ACTIVE DISASTER RISK REDUCTION 251Key Issues at the Policy Level 253National Cases 255
India 255Key Characteristics of the Indian Context 255Key Features of the Policy Environment 257Current Operational Environment 262Potential Role of Cost-Benefit Analysis in DRR Efforts in a Flood Context 265
Pakistan 265Key Characteristics of the Pakistan Context 265Policy History and Key Features of the Policy Environment 268Current Operating Environment 270Climate Change and Disasters in Pakistan 275Can Cost-Benefit Analysis Help DRR in Pakistan? 276
Nepal 277Actors and Activities: Fragmentation and Dysfunction 278Building Resilience 285
Summary and Key Findings 293India 295Pakistan 296Nepal 297
Bibliography 298
CHAPTER 9: REFLECTIONS ON THE VALUE OF THE COST-BENEFIT ANALYSIS PROCESS 303Conclusions 305The Value of the Cost-Benefit Analysis Process 306Challenges and Limitations of Cost-Benefit Analysis for Assessing DRR 308Vulnerability and Distributional Analysis 309The Policy Context 310
Pakistan 310India 311Nepal 313
Insights from Cases 315Uttar Pradesh Flood Management 315Uttar Pradesh Drought Management 316Rawalpindi – Lai Basin Flood Management 317Nepal Qualitative Case Study 318
Evaluating the Impacts of Climate Change 319Summary 322
x
Rethinking the Costs and Benefits ofDisaster Risk Reduction underChanging Climate Conditions
1C H A P T E R
Marcus Moench (ISET) &The Risk to Resilience Study Team

2
Catalyzing Climate and Disaster Resilience: Processes for
Identifying Tangible and Economically Robust Strategies

3
Reth
inking
the C
osts
and B
enefi
ts of
Disa
ster R
isk Re
ducti
onun
der C
hang
ing Cl
imate
Cond
itions
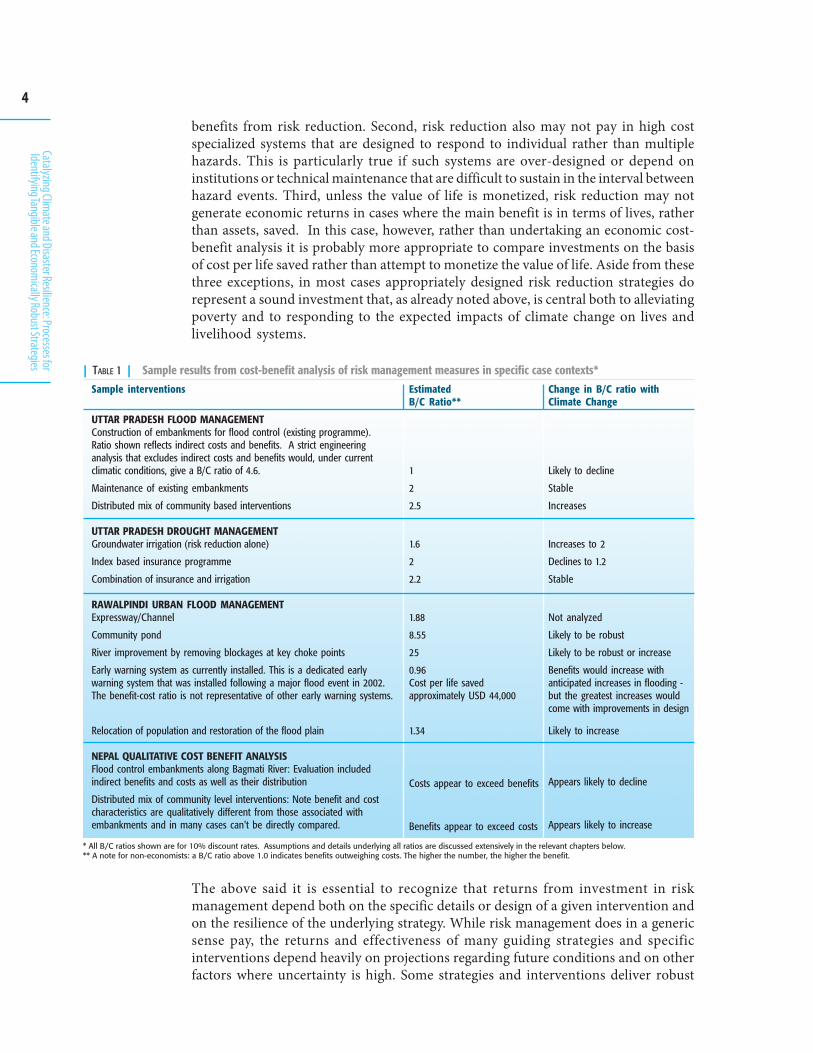
The economic benefits to society of investing in disaster risk management substantiallyexceed the costs. Appropriately designed risk reduction strategies represent a soundinvestment that is central both to alleviating poverty and to responding to the expectedimpacts of climate change on lives and livelihood systems. This core finding emergesfrom detailed analysis of avenues for reducing flood and, to a lesser extent, droughtrisks in India, Nepal and Pakistan. As the sample benefit cost ratios contained inTable 1 indicate, in most cases investigated, benefit/cost ratios are positive and insome instances well above those achieved through other common developmentinvestments. This finding holds true for an array of interventions that includeinsurance, early warning systems, local village-level responses, and large-scaleinfrastructure. Return rates are often higher when the impacts of climate change areconsidered, particularly for strategies that are resilient in the face of uncertainty. Returnrates appear particularly robust for the often lower-cost so called people centredinterventions that reduce the risks associated with high frequency, low magnitudeevents rather than those associated with large disasters. Such events, which can occurannually, result in chronic losses that can erode the wealth of the affected populations.In contrast, the economic benefits that result from interventions that require highinitial investments and are targeted at less frequent but more extreme events are lessrobust. These are particularly vulnerable to assumptions regarding the appropriatediscount rate to use, and to uncertainties regarding the frequency and magnitude ofextreme events as climate conditions change. Indeed, investing in low-cost forms ofrisk reduction that are designed to increase the resiliency of livelihoods, housing andother infrastructure at the household and community levels may be among the mostcost-effective avenues for reducing risks and thereby for supporting adaptation toclimate change. This does not, however, imply that investments should be directedaway from lower frequency-higher magnitude disasters that can set individuals,households and regions back for many years. Instead, it implies the need for a balancedapproach that combines sustained attention to small disasters that receive little publicor policy attention in addition to extreme events with a large-scale, higher-profile impact.
There are three major exceptions to our core finding that risk reduction pays. First,risk reduction may not pay where strategies have major externalities and/or dependheavily on precise knowledge regarding the magnitude and probability of specificevents. In the case of embankments for flood control, for example, accurate evaluationof externalities related to drainage, land use and disease may reduce or offset any
Key Messages
4
Catalyzing Climate and Disaster Resilience: Processes for
Identifying Tangible and Economically Robust Strategies
benefits from risk reduction. Second, risk reduction also may not pay in high costspecialized systems that are designed to respond to individual rather than multiplehazards. This is particularly true if such systems are over-designed or depend oninstitutions or technical maintenance that are difficult to sustain in the interval betweenhazard events. Third, unless the value of life is monetized, risk reduction may notgenerate economic returns in cases where the main benefit is in terms of lives, ratherthan assets, saved. In this case, however, rather than undertaking an economic cost-benefit analysis it is probably more appropriate to compare investments on the basisof cost per life saved rather than attempt to monetize the value of life. Aside from thesethree exceptions, in most cases appropriately designed risk reduction strategies dorepresent a sound investment that, as already noted above, is central both to alleviatingpoverty and to responding to the expected impacts of climate change on lives andlivelihood systems.
The above said it is essential to recognize that returns from investment in riskmanagement depend both on the specific details or design of a given intervention andon the resilience of the underlying strategy. While risk management does in a genericsense pay, the returns and effectiveness of many guiding strategies and specificinterventions depend heavily on projections regarding future conditions and on otherfactors where uncertainty is high. Some strategies and interventions deliver robust
Sample interventions
UTTAR PRADESH FLOOD MANAGEMENTConstruction of embankments for flood control (existing programme).Ratio shown reflects indirect costs and benefits. A strict engineeringanalysis that excludes indirect costs and benefits would, under currentclimatic conditions, give a B/C ratio of 4.6.
Maintenance of existing embankments
Distributed mix of community based interventions
UTTAR PRADESH DROUGHT MANAGEMENTGroundwater irrigation (risk reduction alone)
Index based insurance programme
Combination of insurance and irrigation
RAWALPINDI URBAN FLOOD MANAGEMENTExpressway/Channel
Community pond
River improvement by removing blockages at key choke points
Early warning system as currently installed. This is a dedicated earlywarning system that was installed following a major flood event in 2002.The benefit-cost ratio is not representative of other early warning systems.
Relocation of population and restoration of the flood plain
NEPAL QUALITATIVE COST BENEFIT ANALYSISFlood control embankments along Bagmati River: Evaluation includedindirect benefits and costs as well as their distribution
Distributed mix of community level interventions: Note benefit and costcharacteristics are qualitatively different from those associated withembankments and in many cases can't be directly compared.
EstimatedB/C Ratio**
1
2
2.5
1.6
2
2.2
1.88
8.55
25
0.96Cost per life savedapproximately USD 44,000
1.34
Costs appear to exceed benefits
Benefits appear to exceed costs
Change in B/C ratio withClimate Change
Likely to decline
Stable
Increases
Increases to 2
Declines to 1.2
Stable
Not analyzed
Likely to be robust
Likely to be robust or increase
Benefits would increase withanticipated increases in flooding -but the greatest increases wouldcome with improvements in design
Likely to increase
Appears likely to decline
Appears likely to increase
| TABLE 1 | Sample results from cost-benefit analysis of risk management measures in specific case contexts*
* All B/C ratios shown are for 10% discount rates. Assumptions and details underlying all ratios are discussed extensively in the relevant chapters below.** A note for non-economists: a B/C ratio above 1.0 indicates benefits outweighing costs. The higher the number, the higher the benefit.
5
Reth
inking
the C
osts
and B
enefi
ts of
Disa
ster R
isk Re
ducti
onun
der C
hang
ing Cl
imate
Cond
itions
returns under a wide range of conditions while others depend heavily on the specificnature of hazards. The range in the resilience of different strategies and interventionsalso has implications for our ability to evaluate their returns in contexts where limitedamounts of data are available and numerous assumptions must be made. Specifically:
1. The rates of return between different types of investments in risk reduction vary greatlyin how robust they are under different sets of assumptions and different projections ofclimate change. In many cases, lower levels of investment can generate rates ofreturn that are both greater and much more robust than higher cost investments.This appears to be particularly true of investments that provide annual benefits byimproving the ability of populations to live with frequent floods and droughts,rather than investments focused on larger but less frequent extreme events. Theformer types of investment may also be more socially and institutionally sustainablethan ones directed at infrequent larger events (Gunderson and Holling, 2002;Holling, Gunderson et al., 2002).
2. Even with the best scientific information the ability to project future eventprobabilities will be highly uncertain. Nowhere is this more evident than in thedata limited environments that characterize much of the developing world andwhere hazards are influenced by changing climatic conditions. As a result, anyattempt to project the future costs and benefits of climate related disaster risk reductioninvestments using probabilistic approaches is subject to high levels of uncertainty. It isparticularly inappropriate to treat projections of future climate conditions as providingan accurate representation of future event probabilities. Techniques such as thosedeveloped in this project to down-scale the results of global circulation models tolocal areas can provide key insights but it is essential to acknowledge theirlimitations. They provide indications of potential future climate conditions butcannot be relied on as accurate projections. Furthermore, in many cases the absenceof basic location-specific historical data limits the ability to translate downscaledresults from circulation models into streamflows or the other types of changesrequired for local impact evaluation.
3. In virtually all of the cases we investigated, we discovered that approaches to riskreduction that combine a mix of “hard” infrastructure and “soft” institutional orfinancial measures are more robust than approaches that focus on one or the otheralone. In addition, many of the most resilient avenues for risk reduction may involvestrengthening of underlying communication, transport, economic, banking andother systems rather than on targeted responses to specific hazards (Moench andDixit, 2007).
4. Evaluations of the rates of return of large-scale infrastructure may be misleadinglypositive because of assumptions made about discount rates, investment costs,event frequencies and, very significantly, because negative consequences(“disbenefits” or externalities) tend not to be considered. In the case of embankments,inclusion of realistic land values, crop and other losses associated with water logging andincreases in disease fundamentally reduce the benefit/cost ratio. Returns from suchlarge investments are, furthermore, highly vulnerable to climate change projections.
5. How the costs and benefits of disaster risk reduction are evaluated and how theresults of such analyses are interpreted needs to be carefully assessed. In many
6
Catalyzing Climate and Disaster Resilience: Processes for
Identifying Tangible and Economically Robust Strategies
analyses, the data required to conduct an accurate evaluation are not available orare difficult to generate. As a result, such analyses depend very heavily on theassumptions and estimates of project staff and other experts. Because theseassumptions often are hidden deeply in models and technical discussions they areunlikely to be evident to any but the most engaged of users.
6. Given the high levels of data required along with the uncertainties inherent in relationto climate change, in most contexts limited financial and project analyses are likely tobe more useful than attempts to conduct full cost-benefit analyses. Simplifiedmethodologies that enable analysts to identify key cost and benefit areas along withtheir general magnitudes, coupled with methods for comparing the cost effectivenessof different strategies for reaching similar risk reduction outcomes are essentialcomplements to less frequently applicable full cost-benefit methodologies. In manycases, the costs of a full cost-benefit analysis will exceed the benefits.
Overall, the case studies in this volume demonstrate both the high economic returnsthat can be achieved by investing in risk reduction and the importance of methodologiesfor analyzing the viability of different approaches under often highly uncertain futureconditions. Cost-benefit analysis is one such methodology. In many cases, however,more simplified approaches that identify, but do not fully quantify, major costs andbenefits and also highlight key externalities, uncertainties and assumptions may generateas much information as a full cost-benefit analysis.
In addition to the role of cost-benefit analysis in evaluating the economic returns frominvestments in risk management, the cases in this volume also demonstrate the importanceof process. The process of conducting a cost-benefit analysis encourages individuals andorganizations to move beyond rhetoric and identify very tangible sets of interventions. Italso helps them to evaluate the relationship between perceived risks, vulnerable groupsand proposed responses in ways that can highlight underlying assumptions and hiddensocial or other consequences. Where climate change is concerned, conducting a cost-benefit analysis of risk management measures also forces organizations to translate, asfar as possible, global scientific information into local contexts. Finally, when conductedin an open, transparent and participatory manner, the process can serve as a major toolfor bringing diverse groups of stakeholders and perspectives together, thus generatingbroad-based ownership and understanding of proposed strategies.
The processes outlined in this volume proceed from qualitative engagement and analysisthrough quantitative analysis and then back to qualitative. Risks are first identifiedthrough qualitative shared learning processes. These are then quantified and evaluatedwhere possible in economic terms. The results of this evaluation are, however, recognizedas inherently partial; they reflect the factors that can be quantified and not the numeroussocial or other considerations that cannot. As a result, the final step in the process, areturn to qualitative evaluation, is central to its accuracy. This qualitative-quantitative-qualitative sequence enables stakeholders to understand not just the overall economicreturns from a risk management intervention but also its distributional and otherpotential consequences. This, we believe, is central to understanding who bears thecosts and who benefits from interventions to manage disaster and other risks. As a result,the process is of far more utility for both the identification of effective strategies for riskmanagement and the targeting of such strategies in ways that address the needs of pooror particularly vulnerable communities than the formal results of the economic evaluation.
7
Reth
inking
the C
osts
and B
enefi
ts of
Disa
ster R
isk Re
ducti
onun
der C
hang
ing Cl
imate
Cond
itions
At a global level, evidence regarding the economic impacts of climate change anddisasters is accumulating rapidly. It is now widely recognized that recurrent disastersundermine the ability of regions, nations and the global community to meet basicdevelopment goals. Roughly 75% of disasters are related to storms, floods, droughtsand other climate-related causes (Hoyois and Guha-Sapir, 2004). The intensity andpossibly the frequency of such events are likely to be exacerbated by climate change(IPCC, 2007). As a result, disaster risk reduction (DRR) is central both to meetingglobal development objectives and to any attempt to adapt to climate change. This isrecognized globally in key agreements for action such as the Hyogo Framework forAction (ISDR, 2005).
While broad consensus exists on the need for DRR, little information is available onthe economics of investment in alternative risk reduction strategies and the spectrumof potential strategies ranges greatly from the design of physical structures to thegrowth of social networks and institutions. This makes directing investment to specificDRR activities difficult to justify relative both to alternatives available and to othersocial investments that contribute toward similar development objectives. Nationaland local governments, international financing agencies and NGOs have limitedresources and, furthermore, investments in DRR draw resources away from otherareas where investment may be equally important. Hence, there is both a need and ademand for analytical frameworks, such as cost-benefit analysis, that can supportdecision-making. This need and the pressure to provide solid justification forinvestments are likely to grow. While constraints on the absolute availability offinancing to address the impacts of climate change may decline if innovativemechanisms for funding climate adaptation are implemented, the current globalfinancial crisis suggests that scrutiny and, in some cases, opposition to such funds willincrease. A solid evaluation of the economic costs and benefits of alternative strategieswill be essential to address the opposition and concern that will inevitably grow if thescale of investments increases.
The challenge is not, however, just to demonstrate the economic returns frominvestments. Perceptions of both disaster risks and avenues for addressing them varygreatly between individuals and groups. This is particularly true in the context of
Introduction
8
Catalyzing Climate and Disaster Resilience: Processes for
Identifying Tangible and Economically Robust Strategies
climate change where historical experience may have limited relevance for futureconditions. It is also the case where disasters affect social or economic groups differently.Women, for example, often face fundamentally different types of impacts than men doduring disasters due to the nature and location of their day-to-day activities and thedifferent types of social networks and economic opportunities to which they haveaccess. As a result, approaches that reduce or alter the nature of risk for one groupmay not address the needs of other groups.
In this context, simply documenting an economic justification for investment in riskreduction is insufficient. More wide-reaching analytical frameworks and approachesthat help to identify who gains, who loses, and whether or not the costs of disasters -particularly those associated with climate change - are equitably addressed are alsoessential. Global efforts to address climate change recognize that those benefitingfrom high carbon lifestyles are not the large poor populations in developing countrieswho will bear much of the cost. Consequently, issues of equity and the ability to targetresources for adaptation in ways that actually target the most vulnerable groups arecentral to all efforts to respond to the impacts of climate change. Analytical frameworksexploring the distribution of both impacts from climate related disasters and benefitsfrom risk reduction strategies are, as a result, essential.
At a pragmatic level, the great diversity of approaches to managing disaster risk requiresthe identification of what specifically should be done to reduce risks and for whom indifferent contexts. Terms such as “disaster risk reduction” or “climate adaptation andresilience” only acquire real meaning when they can be translated into tangible coursesof action that have impacts at the ground level. At present, systematic processes foridentifying courses of action to reduce risk for vulnerable communities are rare.Generally, actions to reduce disaster risk focus on proximate causes-such as poorbuilding construction or the lack of protective infrastructure and points of refuge-rather than the deeper systemic factors that create or ameliorate risk within society(Moench and Dixit, 2007). In contrast, this report focuses primarily on the costs andbenefits of specific strategies for reducing flood and drought related disaster risk bothcurrently and under scenarios designed to illustrate the future effects of climate change.
9
Reth
inking
the C
osts
and B
enefi
ts of
Disa
ster R
isk Re
ducti
onun
der C
hang
ing Cl
imate
Cond
itions
The purpose of the project on Risk to Resilience was to evaluate the costs and benefits ofdisaster risk reduction in case study areas in India, Nepal and Pakistan. We focused onwater related disasters and the manner in which they may change as a consequence ofclimate change. Our objective was to develop a suite of methods and analytical casesthat both illustrate methods and evaluate the costs and benefits of specific risk reductionstrategies under different climate scenarios. Our approach consisted of the followingkey elements:
1. Scoping: An intensive scoping process to identify locations and risks that formed arepresentative basis for detailed cases.
2. Vulnerability and capacity analysis: A systematic process within case areas, includingthe development of quantitative vulnerability indices, to identify vulnerable groupsand disaggregate different dimensions of vulnerability.
3. Shared learning dialogues within identified case areas: Iterative meetings withcommunities and key actors that enabled moving from the analysis of vulnerabilityto the clear identification of alternative strategies for disaster risk reduction thatkey actors in the government and affected communities believed will address riskunder current and projected climate conditions.
4. Systematic qualitative approaches for evaluating trade-offs (broad costs and benefits)between alternative strategies for risk reduction: Who benefits? Who loses? and Why?
5. Cost-benefit analysis using quantitative probabilistic techniques for evaluating differentapproaches to disaster risk reduction. This economic and hazard-modellingcomponent included techniques for down-scaling and evaluating the impacts ofclimate change in data limited contexts.
The above methods are discussed in detail in the following chapter. This summaryfocuses on core insights emerging from the application of this suite of methods toflood-related disaster risks in case study sites in the Nepal Tarai (the plains adjacent toIndia), Rawalpindi, Pakistan, and Eastern Uttar Pradesh, India. Examples of their
The Project on Risk to Resilience
10
Catalyzing Climate and Disaster Resilience: Processes for
Identifying Tangible and Economically Robust Strategies
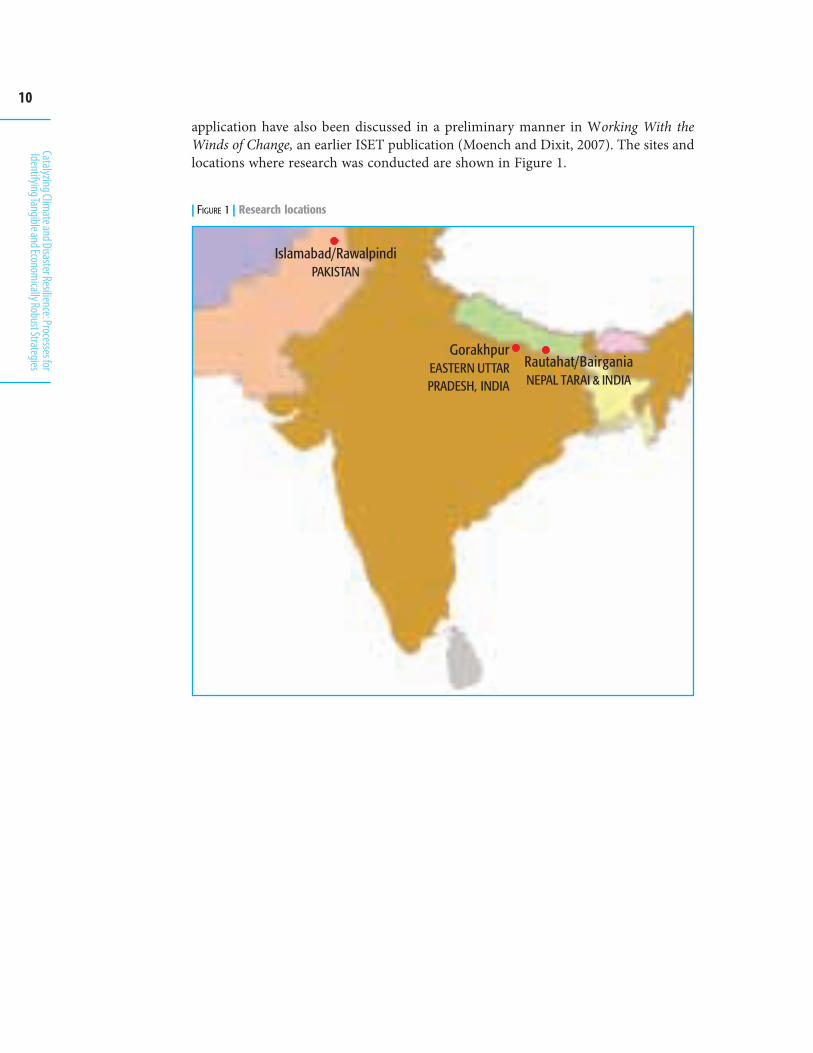
application have also been discussed in a preliminary manner in Working With theWinds of Change, an earlier ISET publication (Moench and Dixit, 2007). The sites andlocations where research was conducted are shown in Figure 1.
| FIGURE 1 | Research locations
Islamabad/RawalpindiPAKISTAN
GorakhpurEASTERN UTTARPRADESH, INDIA
Rautahat/BairganiaNEPAL TARAI & INDIA

11
Reth
inking
the C
osts
and B
enefi
ts of
Disa
ster R
isk Re
ducti
onun
der C
hang
ing Cl
imate
Cond
itions
Research on the costs and benefits of disaster risk reduction in the context of climatechange is, in many ways, a window into complexity. The political and social context ofSouth Asia is dynamic and fluid. Risks evolve rapidly as emergent properties ofdevelopment and settlement processes in different contexts. In conjunction with pre-existing patterns of social, economic and gender differentiation, such processes createa kaleidoscope in which patterns of vulnerability appear or disappear in ways thatdepend as much on interactions within livelihood systems (which span the spectrumfrom local to global) as they do on exposure to location-specific hazards.
As some of our earlier research has clearly documented, changes in vulnerability todisaster often depend as much, if not more, on systemic factors that may have little todo with actions taken under the rubric of “disaster risk reduction” per se (Moench andDixit, 2007). Changing access to communications, financial systems, transport, utilities,health services, and local to global social networks heavily influence where people live,their overall mobility and the vulnerability of their livelihood systems to disruptionduring floods, droughts or other climate related events. They also influence the viabilityof targeted strategies for risk reduction. At the national level, in highly dynamicpolitical environments, institutional memories tend to be short. However well plannedor conceived, the resolve to implement strategies to enforce building codes or land useplans or to maintain early warning systems tends to dissipate rapidly following disasterevents. Unless the “demand” underpinning such strategies remains constant, thedynamic set of urgent issues facing government actors will drive disaster risk reductionactivities into the background - at least until the next disaster.
Similar challenges exist at the community level unless risk reduction measures respondto frequently recurring events. The institutional memory within communities andthe organizational foundations of many community based organizations dependheavily on the degree to which a community is a relatively stable and unified entity. Ifthe types of events that cause disaster occur infrequently, then the institutional memoryof and the organizational capacity to reduce risk will decrease. The ephemeral natureof institutional memories significantly undermines the ability of societies to organizein response to long-term challenges (Gunderson and Holling, 2002). The situation isfurther complicated by fundamental differences in the perceptions of hazard risks by
Critical Issues
12
Catalyzing Climate and Disaster Resilience: Processes for
Identifying Tangible and Economically Robust Strategies
various groups within hazard prone areas. In the case of the Lai Basin in Rawalpindi,Pakistan, for example, men focus on the direct flood risk to assets, structures and lives,while women emphasized the disease and health problems associated with increasesin liquid and solid waste pollution during floods.
Given the complexity inherent in the cases, our analysis of the costs and benefits ofdisaster risk reduction focused on a range of risk response measures implemented bygovernments. Many of these interventions are structural: they involve the constructionof water control structures, such as embankments, and other physical measures. Inaddition, we also identified alternative portfolios of realistic local-level interventionsthat could contribute to disaster risk reduction. These include a spectrum of activities,ranging from the establishment of protected locations (the raising of houses andschools above flood levels) to the establishment of grain banks, local warning systems,self help groups for micro-credit and more diversified livelihood systems. As far aspossible, we evaluated the costs and benefits of these alternatives and contrasted themto those of larger structural interventions. The implications of climate change wereconsidered in these analyses through a combination of published information onclimate impacts and new techniques, partially developed by the ISET team, for down-scaling the outputs of general circulation models.
While the above approach is realistic, it highlights, once again, the complexity inherentin evaluating the costs and benefits of disaster risk reduction in applied contexts.Often the only real “data” that shed light on the costs and benefits of disaster riskreduction relate to large-scale structural interventions that have been implementedby governments. These data are often partial and biased. In most situations, costs areunderestimated and data on externalities are unavailable. As a result, evaluation ofother strategies depends on projections and assumptions that may or may not befully justified or accurately represent future conditions.
The use of climate projections illustrates this well. Accurately evaluating the benefitsfrom disaster risk reduction activities requires information regarding the probabilityof future events. Unless such probabilistic information is available, losses likely withina specific time frame cannot be estimated and, as a result, neither can the benefits ofloss reduction. While existing data on climate change does provide information onbroad trends, current climate models are unable to generate information on conditionslikely to be experienced in specific local areas. Techniques for down-scaling informationto these areas involve, in essence, generating scenarios of future climatic conditions.However, our ability to evaluate or test the accuracy of future scenarios is very limited.Uncertainty is equally high regarding other factors or courses of action that couldcontribute to disaster risk reduction. As the case studies presented in this volumeclearly illustrate, data on assets at risk, hazard characteristics, losses for differinghazard intensities, externalities and the sustainability of interventions are oftenunavailable or inaccessible, yet such data are of fundamental importance for anysystematic evaluation of the costs and benefits of DRR measures. While addressingsuch gaps is possible, any scientifically defensible cost-benefit analysis will requiresubstantial investment in basic data collection. Even if this investment is undertaken,however, considerable uncertainties will remain.
13
Reth
inking
the C
osts
and B
enefi
ts of
Disa
ster R
isk Re
ducti
onun
der C
hang
ing Cl
imate
Cond
itions
The challenge goes well beyond that just mentioned. The dynamic political and socialcontext of South Asia generates questions about the sustainability of interventionsrequiring long-term institutional support, particularly where there are long time lagsbetween disaster events. This is, of course, a critical question for the evaluation ofcosts and benefits. Unless measures are in place and functional when events occur, anyinvestment will be wasted. While the costs and benefits of, for example, improvinghouse design may be high, the costs and benefits of a programme designed to achievethis through building regulations depend on whether or not those regulations can beenforced over the long term. Prior experience, as documented in the history of policyresponses to prior earthquakes in Pakistan, is less than encouraging (Chapter 6 in thisvolume). Relatively little data currently exist to evaluate such questions in a systematicway within a cost-benefit framework.
Finally, questions regarding strategies for risk reduction often exist that are not welladdressed within the framework of cost-benefit analysis. Vulnerability to disastersoften varies greatly between groups, and distributional issues exist in relation to riskreduction interventions. The distributional consequences of different strategies heavilyinfluence whether or not risk reduction contributes to larger societal goals such aspoverty alleviation.
Overall, the broad array of challenges inherent in conducting scientifically defensibleanalyses of the costs and benefits of disaster risk reduction highlights both the strengthsand the limitations of the approach. On one hand, the systematic exploration of factorsthat contribute to the costs and benefits of different strategies represents a powerfulprocess for identifying and evaluating key issues. On the other, the final numbersgenerated through a full economic analysis depend heavily on numerous assumptionsand, as a result, can mislead decision-making. Consequently, in many cases, the processof conducting the systematic set of evaluations required for a cost-benefit analysis ismore important than the ratios ultimately produced. The process can serve as atransparent framework for the identification and analysis of trade-offs amongapproaches, particularly if it starts with qualitative evaluation, utilizes quantitativetechniques where possible but then returns and evaluates quantitative results througha wider qualitative lens. Benefit-cost ratios, however attractive they may seem todecision-makers or those advocating specific strategies, require intimate knowledgeof the data and assumptions on which they are based in order to be interpretedaccurately. The potential for misleading interpretations is high unless decision-makersare intimately involved in the qualitative-quantitative-qualitative analytical process.
14
Catalyzing Climate and Disaster Resilience: Processes for
Identifying Tangible and Economically Robust Strategies
Analyses of the costs and benefits of disaster risk reduction were undertaken in casestudy areas in Rawalpindi, Pakistan; Eastern Uttar Pradesh, India; and the NepalTarai. In each case, the avenues for risk reduction identified included existing riskmanagement interventions implemented by the respective governments and thealternative strategies identified during intensive dialogues with local communities,NGOs, risk management experts and local government entities. In the Nepal case,strategies were evaluated using qualitative approaches to identify major costs andbenefits. In Pakistan and India the research combined qualitative and varying degreesof quantitative analysis. The cases in India involved a full quantitative cost-benefitanalysis coupled with extensive modelling to down-scale results from climate changeprojections. All cases focused on flood risks, except in India, where drought risks werealso analyzed. The methodologies used and the cases investigated are detailed in thechapters that follow.
Flooding in the Nepal Tarai
The Tarai region of Nepal, the narrow belt of plains between India and the Himalayanfoothills, is subject to regular flooding. In order to limit the negative impacts of flooding,embankments have been constructed both within Nepal and across the border inIndia. In addition, local groups, NGOs and government entities have supportedcommunities to take a variety of actions to limit flood impacts at the local level. Thishas included construction of small spurs and embankments to stabilize riverbanks,establishment of raised locations and buildings that provide refuge from floods,building secure water supply systems and sanitation facilities, and reducing floodexposure through forest buffers on stream banks.
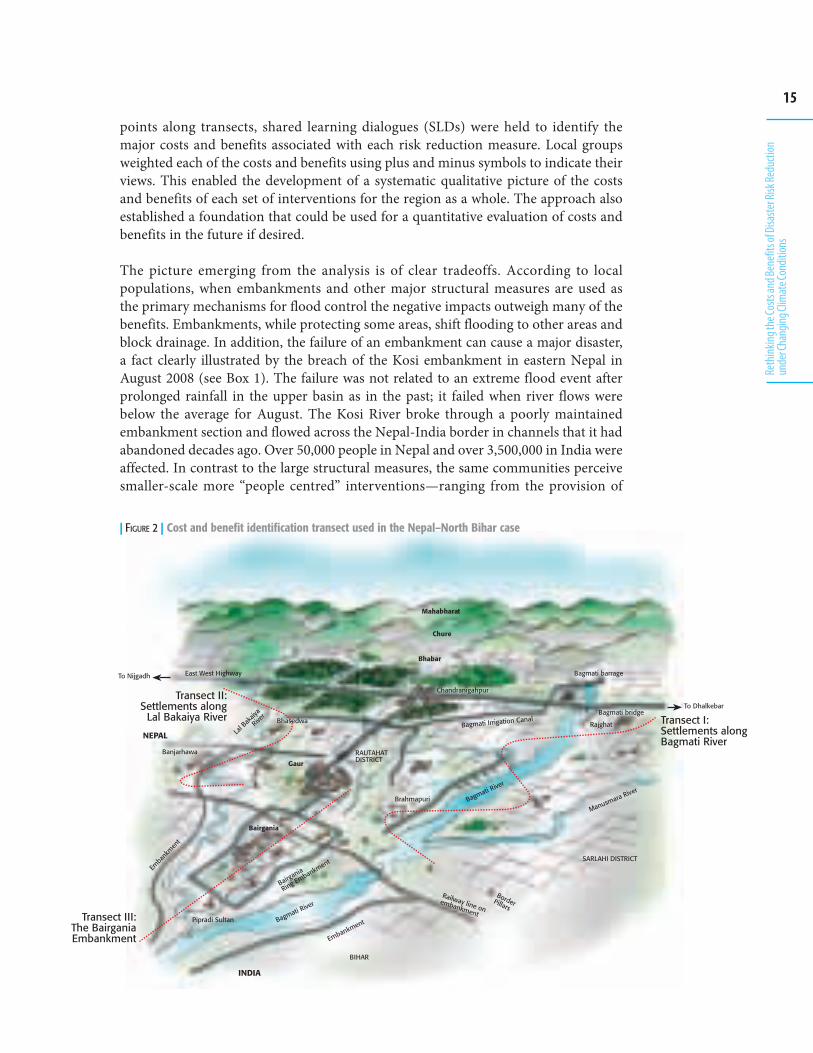
A qualitative systematic “cost-benefit” assessment of the main avenues for flood riskreduction was undertaken by the Risk to Resilience team in the Lower Bagmati Basin.This location is close to the base of the Himalayan foothills in contrast to the morecentral Ganga Basin location of the India case study areas. The costs and benefitsidentified by local populations for specific risk mitigation measures were systematicallydocumented along a series of transects across flood-affected areas (Figure 2). At regular
The Case Studies
15
Reth
inking
the C
osts
and B
enefi
ts of
Disa
ster R
isk Re
ducti
onun
der C
hang
ing Cl
imate
Cond
itions
| FIGURE 2 | Cost and benefit identification transect used in the Nepal–North Bihar case
points along transects, shared learning dialogues (SLDs) were held to identify themajor costs and benefits associated with each risk reduction measure. Local groupsweighted each of the costs and benefits using plus and minus symbols to indicate theirviews. This enabled the development of a systematic qualitative picture of the costsand benefits of each set of interventions for the region as a whole. The approach alsoestablished a foundation that could be used for a quantitative evaluation of costs andbenefits in the future if desired.
The picture emerging from the analysis is of clear tradeoffs. According to localpopulations, when embankments and other major structural measures are used asthe primary mechanisms for flood control the negative impacts outweigh many of thebenefits. Embankments, while protecting some areas, shift flooding to other areas andblock drainage. In addition, the failure of an embankment can cause a major disaster,a fact clearly illustrated by the breach of the Kosi embankment in eastern Nepal inAugust 2008 (see Box 1). The failure was not related to an extreme flood event afterprolonged rainfall in the upper basin as in the past; it failed when river flows werebelow the average for August. The Kosi River broke through a poorly maintainedembankment section and flowed across the Nepal-India border in channels that it hadabandoned decades ago. Over 50,000 people in Nepal and over 3,500,000 in India wereaffected. In contrast to the large structural measures, the same communities perceivesmaller-scale more “people centred” interventions—ranging from the provision of
16
Catalyzing Climate and Disaster Resilience: Processes for
Identifying Tangible and Economically Robust Strategies
BOX 1The Kosi Embankment Breach
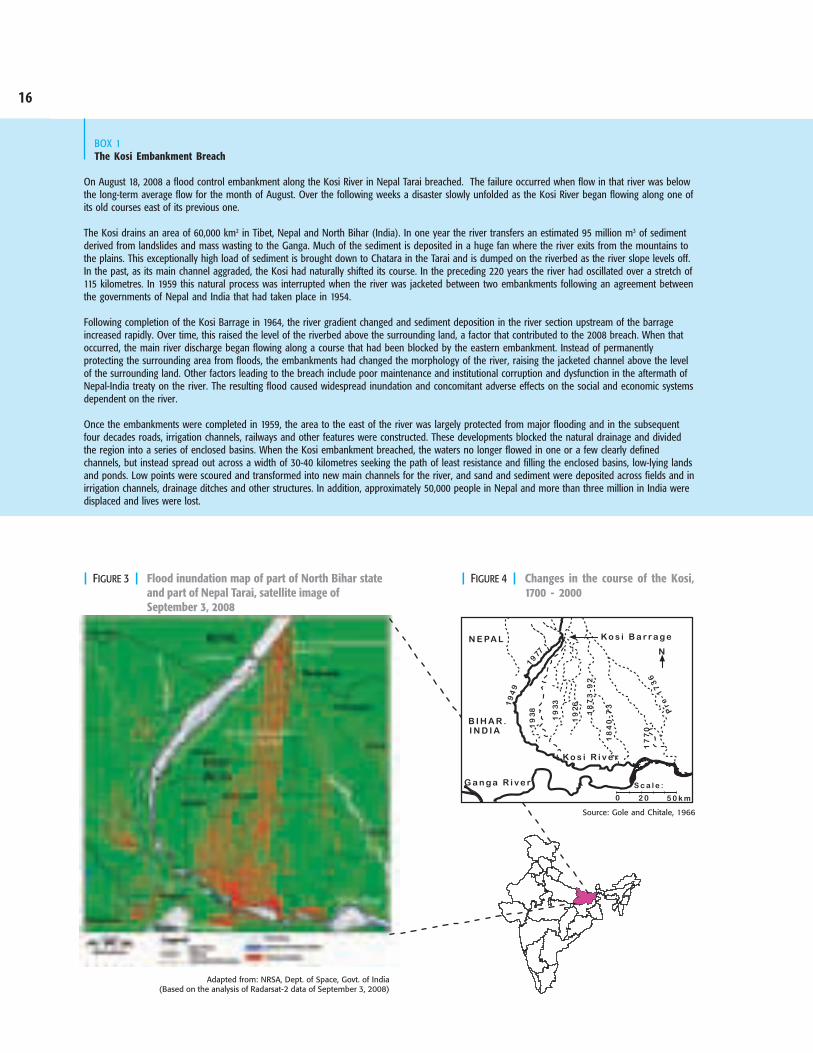
On August 18, 2008 a flood control embankment along the Kosi River in Nepal Tarai breached. The failure occurred when flow in that river was belowthe long-term average flow for the month of August. Over the following weeks a disaster slowly unfolded as the Kosi River began flowing along one ofits old courses east of its previous one.
The Kosi drains an area of 60,000 km2 in Tibet, Nepal and North Bihar (India). In one year the river transfers an estimated 95 million m3 of sedimentderived from landslides and mass wasting to the Ganga. Much of the sediment is deposited in a huge fan where the river exits from the mountains tothe plains. This exceptionally high load of sediment is brought down to Chatara in the Tarai and is dumped on the riverbed as the river slope levels off.In the past, as its main channel aggraded, the Kosi had naturally shifted its course. In the preceding 220 years the river had oscillated over a stretch of115 kilometres. In 1959 this natural process was interrupted when the river was jacketed between two embankments following an agreement betweenthe governments of Nepal and India that had taken place in 1954.
Following completion of the Kosi Barrage in 1964, the river gradient changed and sediment deposition in the river section upstream of the barrageincreased rapidly. Over time, this raised the level of the riverbed above the surrounding land, a factor that contributed to the 2008 breach. When thatoccurred, the main river discharge began flowing along a course that had been blocked by the eastern embankment. Instead of permanentlyprotecting the surrounding area from floods, the embankments had changed the morphology of the river, raising the jacketed channel above the levelof the surrounding land. Other factors leading to the breach include poor maintenance and institutional corruption and dysfunction in the aftermath ofNepal-India treaty on the river. The resulting flood caused widespread inundation and concomitant adverse effects on the social and economic systemsdependent on the river.
Once the embankments were completed in 1959, the area to the east of the river was largely protected from major flooding and in the subsequentfour decades roads, irrigation channels, railways and other features were constructed. These developments blocked the natural drainage and dividedthe region into a series of enclosed basins. When the Kosi embankment breached, the waters no longer flowed in one or a few clearly definedchannels, but instead spread out across a width of 30-40 kilometres seeking the path of least resistance and filling the enclosed basins, low-lying landsand ponds. Low points were scoured and transformed into new main channels for the river, and sand and sediment were deposited across fields and inirrigation channels, drainage ditches and other structures. In addition, approximately 50,000 people in Nepal and more than three million in India weredisplaced and lives were lost.
Adapted from: NRSA, Dept. of Space, Govt. of India(Based on the analysis of Radarsat-2 data of September 3, 2008)
| FIGURE 4 | Changes in the course of the Kosi,1700 - 2000
| FIGURE 3 | Flood inundation map of part of North Bihar stateand part of Nepal Tarai, satellite image ofSeptember 3, 2008
Source: Gole and Chitale, 1966
17
Reth
inking
the C
osts
and B
enefi
ts of
Disa
ster R
isk Re
ducti
onun
der C
hang
ing Cl
imate
Cond
itions
Breaches are an inherent risk of any flood-control embankment but even more so in a river such as the Kosi where the riverbed aggrades rapidlybecause of high sediment load. Topographic maps indicate that the riverbed within the embankment is now about four metres higher than theadjoining land; in other words the elevation of the bed has increased approximately 1 metre per decade since the embankments were put inplace. This August 2008 breach was the eighth major one since the embankment was constructed. No matter how well embankments aremaintained,whether the breach occurs during a high flow or, as in this case, a normal one, breaches are inevitable. Furthermore, when such breaches occur itis next to impossible to permanently return the river to a bed that is, in many cases, well above the adjacent land without substantial input ofresources and technology.
An embankment can provide relatively high levels of flood protection immediately following construction but its ability to protect declines at ratesthat depend primarily on sedimentation and, to a lesser extent, on how well it is constructed and maintained. Unless some way of addressing themassive amount of sediment deposition can be found, the river channel will breach and new channels will be established across lands that havebeen settled for decades.
What are the costs and benefits of an embankment? In the Kosi case, a large section of land in East Bihar was protected from recurrent floodingfor about 50 years. However, protection has encouraged forms of development that are poorly adapted to flooding. As illustrated in the NepalTarai and Eastern Uttar Pradesh (India) flood case studies (Chapters 4 and 6 in this volume), while flood protection does generate clear benefits,it also entails major costs. In the Eastern Uttar Pradesh case study, the combined costs associated with land loss, poor drainage and waterlogging brought the benefit/cost ratio close to 1 suggesting that the economics of investment in embankments is highly questionable. Thiscalculation does not even consider the potential for breaches.
What are the costs of the Kosi breach? The true costs may never be known. The most evident costs include the loss of land, assets andlivelihoods—and of course the loss of lives. They also include losses associated with current and future agricultural production. In addition, thesocial cost associated with disruption of over three million people in one of the most politically unstable areas of India must be recognized. Somefamilies may never be able to live on their now submerged land. Bihar is one of the poorest and least developed regions of India and is a focalpoint for insurgent activities. The loss of lives, livelihoods and, in many ways, hope for the future among its population may well exacerbateexisting frustration and conflict, generating costs that spread across much of South Asian society, not just India. A systematic cost-benefitanalysis that includes the potential for massive disruptions such as the one of August 2008 might assist in identifying strategies with lower levelsof inherent risk.
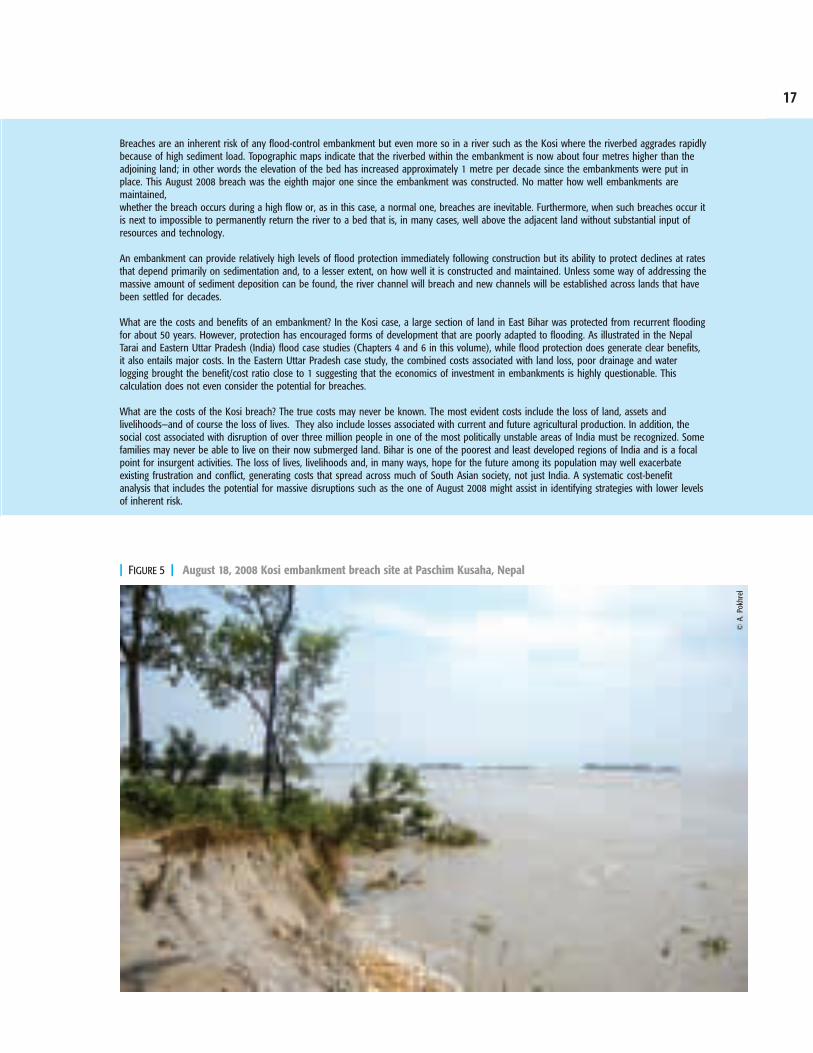
| FIGURE 5 | August 18, 2008 Kosi embankment breach site at Paschim Kusaha, Nepal
© A
. Pok
hrel
18
Catalyzing Climate and Disaster Resilience: Processes for
Identifying Tangible and Economically Robust Strategies
boats to the construction of raised areas—as having relatively large benefits in relationto their costs. They also are not subject to the types of catastrophic failure that large-scale structural measures are. These types of catastrophic failure can, as described inthe accompanying box on the breach in the Kosi embankment, cause major disasters.
The risk reduction interventions that were identified and evaluated included largestructural measures such as embankments as well as local interventions such as boats,bamboo bridges, raised community plinths and houses, sanitation facilities and earlywarning systems. The SLDs and plus-minus system gave a general overview of majorcost and benefit streams (See Chapters 2 and 4 for detailed examples). Many of thepeople centred approaches involved far fewer trade-offs than did the large structuralmeasures. The costs involved were primarily initial capital investments and therewere few, if any, major externalities to take into consideration. Such measures alsoappear to be relatively resilient under a wide variety of climate change scenarios.Unlike the embankments, where the negative consequences appear likely to increasemore rapidly than the benefits as climate change proceeds, the benefits of “peoplecentred” interventions will increase.
Qualitative cost-benefit analyses, such as the one conducted in Nepal, provide manyof the same insights that are generated by a quantitative approach in that they highlightboth the direct and indirect costs and benefits associated with different types of riskreduction intervention. They do not, however, accurately pinpoint the magnitude ofthose costs and benefits identified remain difficult to compare. As a result, the qualitativeanalysis lay the groundwork for quantitative evaluations but do not replace them.
Rawalpindi, Pakistan
The Pakistani case study focuses on flood risk reduction options along the Lai River(also called the Lai Nullah) in urban Rawalpindi (see Figure 6). The Lai is a short riverbasin that, as is the case in many similar urban areas, creates a high risk of flooding ina very densely populated area where many physical assets, from houses to businesses,are concentrated.
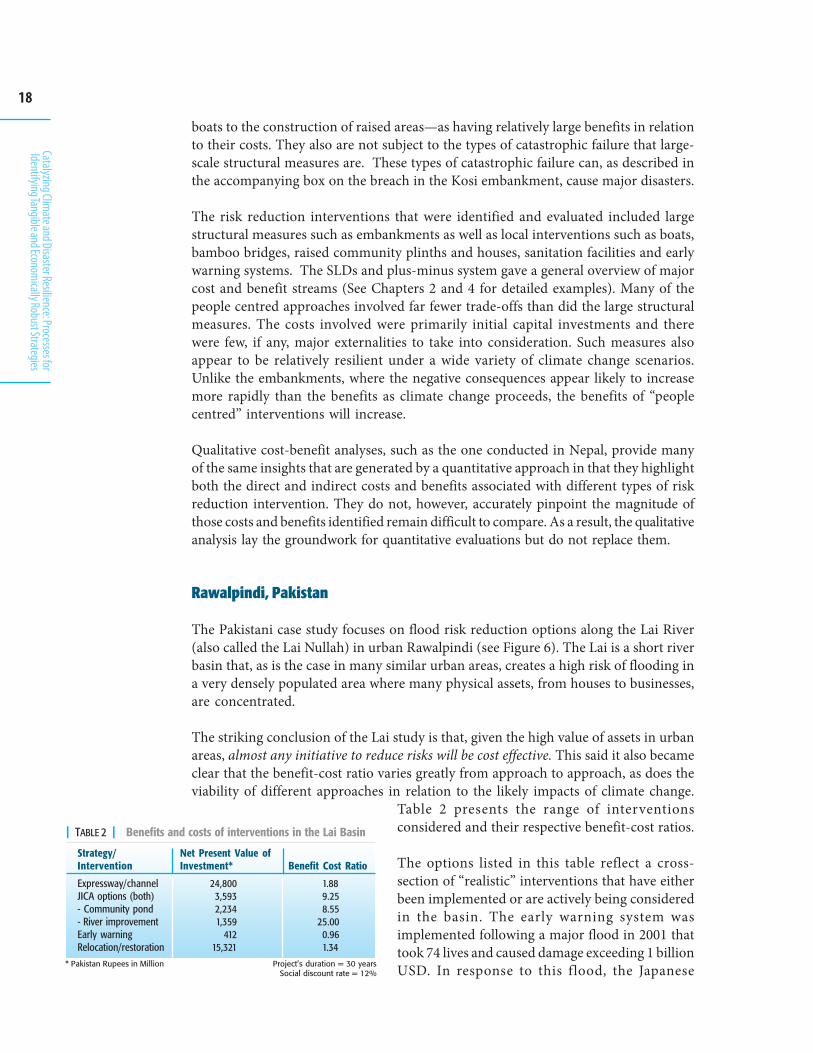
The striking conclusion of the Lai study is that, given the high value of assets in urbanareas, almost any initiative to reduce risks will be cost effective. This said it also becameclear that the benefit-cost ratio varies greatly from approach to approach, as does theviability of different approaches in relation to the likely impacts of climate change.
Table 2 presents the range of interventionsconsidered and their respective benefit-cost ratios.
The options listed in this table reflect a cross-section of “realistic” interventions that have eitherbeen implemented or are actively being consideredin the basin. The early warning system wasimplemented following a major flood in 2001 thattook 74 lives and caused damage exceeding 1 billionUSD. In response to this flood, the Japanese
Strategy/Intervention
Expressway/channelJICA options (both)- Community pond- River improvementEarly warningRelocation/restoration
Benefit Cost Ratio
1.889.258.55
25.000.961.34
| TABLE 2 | Benefits and costs of interventions in the Lai Basin
Net Present Value ofInvestment*
24,8003,5932,2341,359
41215,321
Project’s duration = 30 yearsSocial discount rate = 12%
* Pakistan Rupees in Million
19
Reth
inking
the C
osts
and B
enefi
ts of
Disa
ster R
isk Re
ducti
onun
der C
hang
ing Cl
imate
Cond
itions
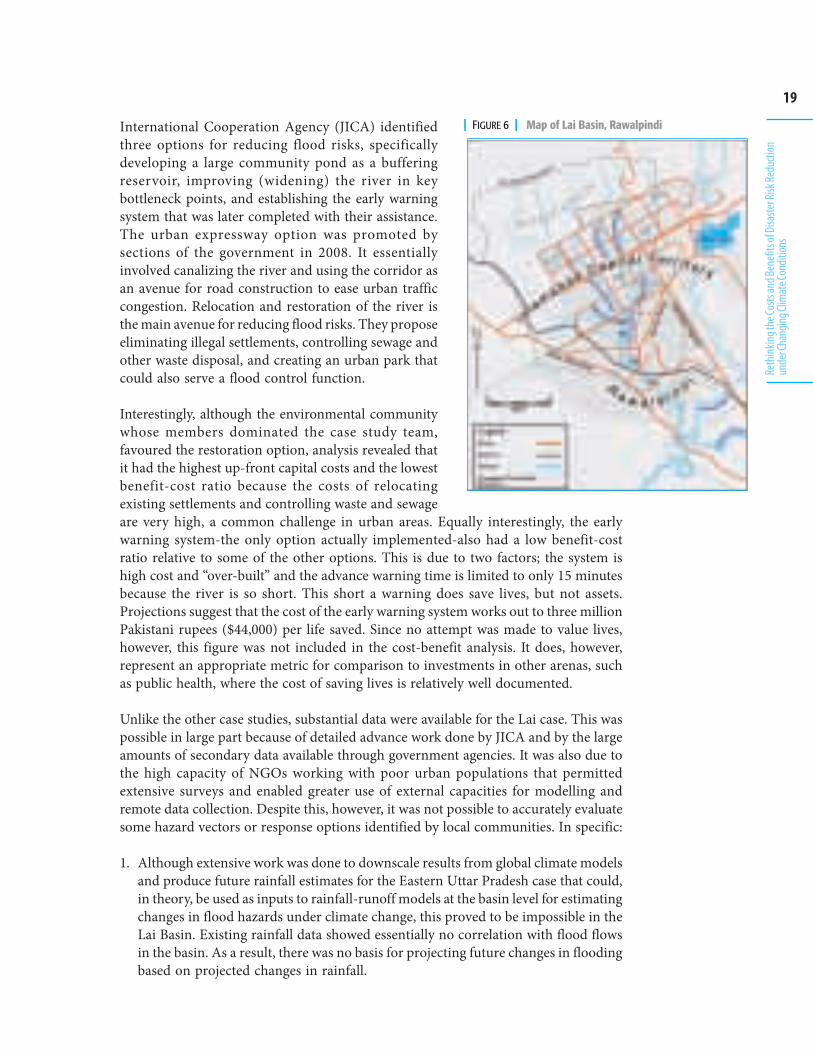
International Cooperation Agency (JICA) identifiedthree options for reducing flood risks, specificallydeveloping a large community pond as a bufferingreservoir, improving (widening) the river in keybottleneck points, and establishing the early warningsystem that was later completed with their assistance.The urban expressway option was promoted bysections of the government in 2008. It essentiallyinvolved canalizing the river and using the corridor asan avenue for road construction to ease urban trafficcongestion. Relocation and restoration of the river isthe main avenue for reducing flood risks. They proposeeliminating illegal settlements, controlling sewage andother waste disposal, and creating an urban park thatcould also serve a flood control function.
Interestingly, although the environmental communitywhose members dominated the case study team,favoured the restoration option, analysis revealed thatit had the highest up-front capital costs and the lowestbenefit-cost ratio because the costs of relocatingexisting settlements and controlling waste and sewageare very high, a common challenge in urban areas. Equally interestingly, the earlywarning system-the only option actually implemented-also had a low benefit-costratio relative to some of the other options. This is due to two factors; the system ishigh cost and “over-built” and the advance warning time is limited to only 15 minutesbecause the river is so short. This short a warning does save lives, but not assets.Projections suggest that the cost of the early warning system works out to three millionPakistani rupees ($44,000) per life saved. Since no attempt was made to value lives,however, this figure was not included in the cost-benefit analysis. It does, however,represent an appropriate metric for comparison to investments in other arenas, suchas public health, where the cost of saving lives is relatively well documented.
Unlike the other case studies, substantial data were available for the Lai case. This waspossible in large part because of detailed advance work done by JICA and by the largeamounts of secondary data available through government agencies. It was also due tothe high capacity of NGOs working with poor urban populations that permittedextensive surveys and enabled greater use of external capacities for modelling andremote data collection. Despite this, however, it was not possible to accurately evaluatesome hazard vectors or response options identified by local communities. In specific:
1. Although extensive work was done to downscale results from global climate modelsand produce future rainfall estimates for the Eastern Uttar Pradesh case that could,in theory, be used as inputs to rainfall-runoff models at the basin level for estimatingchanges in flood hazards under climate change, this proved to be impossible in theLai Basin. Existing rainfall data showed essentially no correlation with flood flowsin the basin. As a result, there was no basis for projecting future changes in floodingbased on projected changes in rainfall.
| FIGURE 6 | Map of Lai Basin, Rawalpindi
20
Catalyzing Climate and Disaster Resilience: Processes for
Identifying Tangible and Economically Robust Strategies
2. Women in the basin identified dispersal of solid waste and sewage into residentialareas along with the diseases this causes as the main concern associated withflooding. The Lai flood plain is a major site for the dumping of solid waste andmany sewers also drain into it. The perspective of women contrasts distinctly withthe focus of the government and most men on the physical damages associatedwith flooding. Unfortunately, due to lack of information on increases in diseaseand how this might change with control over waste disposal, it was not possible toevaluate the costs and benefits of improved solid waste and sewage management.
Overall, the Lai Basin study highlights the cost-effectiveness of most risk reductionprojects in urban areas and the critical role a systematic cost-benefit analysis can playin their evaluation. Although it was impossible to generate direct estimates of changesin magnitudes of flood events likely to occur as a consequence of climate change, theseare expected to increase. As a result, the economic efficiency of all proposed measuresto reduce such risks should increase as well.
The case of the Lai illustrates the substantial impact the availability and accessibilityof data has on the ability to evaluate the costs and benefits of different options. It alsohighlights the fact that in some cases low-cost approaches can generate the samebenefits as high-cost approaches and, as a result, have substantially better benefit-cost ratios. In this case, simple channel improvements would generate much the samebenefits as major structural measures at a fraction of the cost. Similarly, if they arepoorly or over-designed, interventions that tend to be effective in most cases (earlywarning in this instance) can have very low return rates and may have a relatively highcost in relation to non-market objectives such as lives saved.
Eastern Uttar Pradesh, India
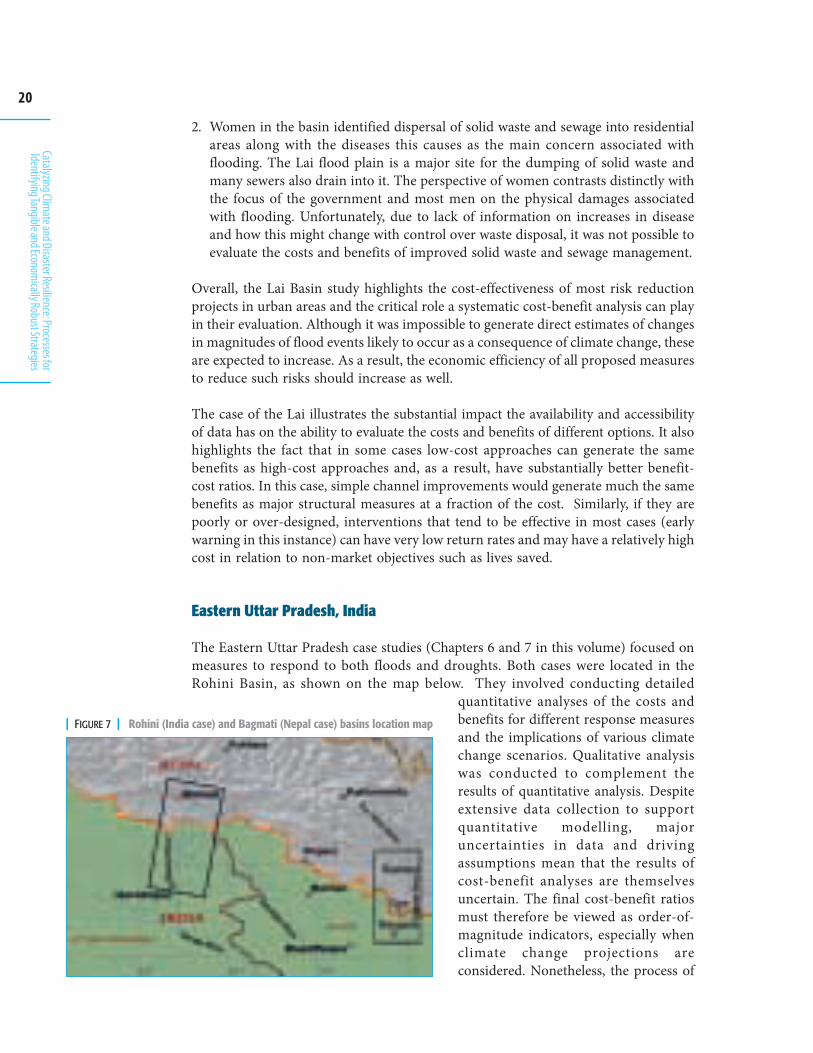
The Eastern Uttar Pradesh case studies (Chapters 6 and 7 in this volume) focused onmeasures to respond to both floods and droughts. Both cases were located in theRohini Basin, as shown on the map below. They involved conducting detailed
quantitative analyses of the costs andbenefits for different response measuresand the implications of various climatechange scenarios. Qualitative analysiswas conducted to complement theresults of quantitative analysis. Despiteextensive data collection to supportquantitative modelling, majoruncertainties in data and drivingassumptions mean that the results ofcost-benefit analyses are themselvesuncertain. The final cost-benefit ratiosmust therefore be viewed as order-of-magnitude indicators, especially whenclimate change projections areconsidered. Nonetheless, the process of
| FIGURE 7 | Rohini (India case) and Bagmati (Nepal case) basins location map
21
Reth
inking
the C
osts
and B
enefi
ts of
Disa
ster R
isk Re
ducti
onun
der C
hang
ing Cl
imate
Cond
itions
conducting the quantitative analysis highlighted an array of costs and benefits andtheir relative magnitudes that would not have been identified in a less systematicapproach. As a result, the process itself, rather than the final quantitative outputs,should be seen as having major advantages in support of informed decision-making.
Flood Risk ReductionAs was the case in Nepal, analyses of flood mitigation strategies in Eastern UttarPradesh contrasted a diverse package of people centred, resilience-driven interventionswith the conventional embankment-focused infrastructure strategy that hascharacterized government initiatives in the recent past. The “people centred approach”involved actions at the household level (raising house plinths, raising fodder storageunits, and introducing a clean a water and sanitation package); actions at thecommunity level (establishing an early warning system, raising communityhandpumps and toilets, building village flood shelters, developing community grainbanks, developing community seed banks, locally maintaining of key drainage points,developing self help groups, and purchasing community boats); and societal-levelinterventions (promoting of flood-adapted agriculture and strengthening the overallhealth care system). These local-level, people centred interventions tended to have lowup-front capital costs and to generate good returns both for the low-magnitude, high-frequency flood events that characterize life in the plains of the Ganga Basin, as well asfor the larger events that cause “disaster.” These characteristics, as discussed furtherbelow, made these interventions far more resilient than those involving high levels ofinvestment and designed to respond to less frequent extreme events.
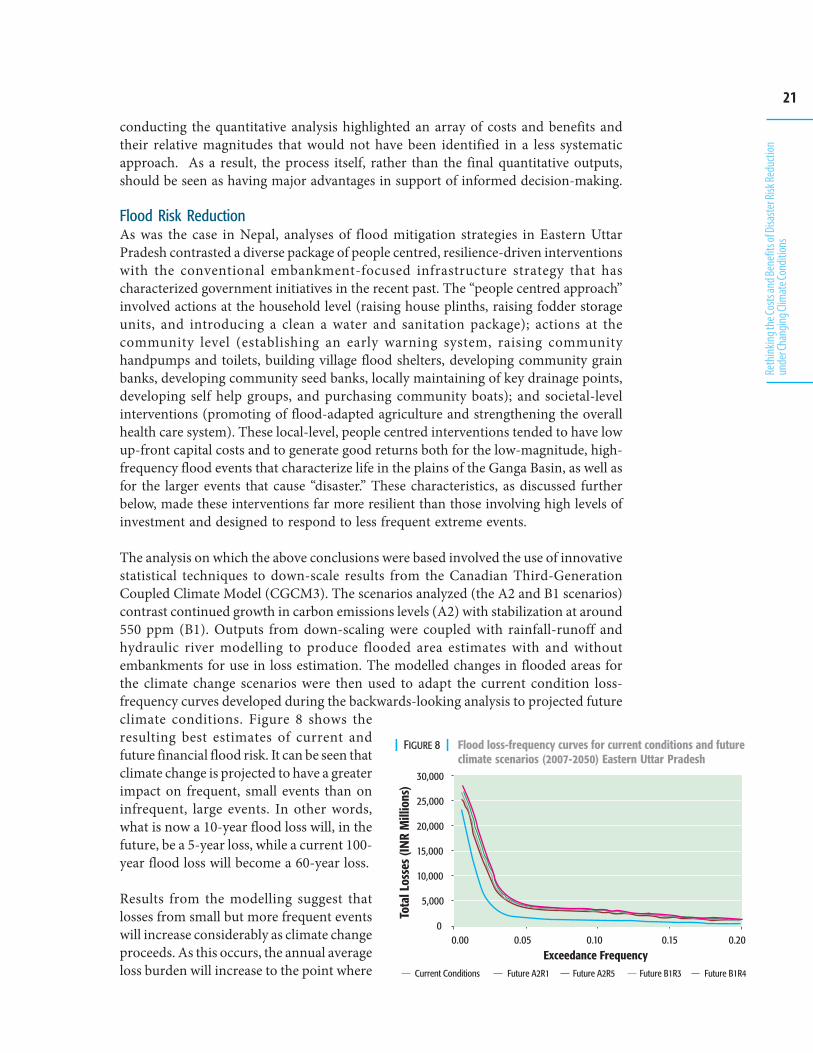
The analysis on which the above conclusions were based involved the use of innovativestatistical techniques to down-scale results from the Canadian Third-GenerationCoupled Climate Model (CGCM3). The scenarios analyzed (the A2 and B1 scenarios)contrast continued growth in carbon emissions levels (A2) with stabilization at around550 ppm (B1). Outputs from down-scaling were coupled with rainfall-runoff andhydraulic river modelling to produce flooded area estimates with and withoutembankments for use in loss estimation. The modelled changes in flooded areas forthe climate change scenarios were then used to adapt the current condition loss-frequency curves developed during the backwards-looking analysis to projected futureclimate conditions. Figure 8 shows theresulting best estimates of current andfuture financial flood risk. It can be seen thatclimate change is projected to have a greaterimpact on frequent, small events than oninfrequent, large events. In other words,what is now a 10-year flood loss will, in thefuture, be a 5-year loss, while a current 100-year flood loss will become a 60-year loss.
Results from the modelling suggest thatlosses from small but more frequent eventswill increase considerably as climate changeproceeds. As this occurs, the annual averageloss burden will increase to the point where
| FIGURE 8 | Flood loss-frequency curves for current conditions and futureclimate scenarios (2007-2050) Eastern Uttar Pradesh
������
������
������
������
������
�������
������������� ���������� �������������������� ������������ ��������������������
�����������������
����
�����
����
�����
����
����
�
��� ��� ����� � ��������� ��������� ��������� ���������
22
Catalyzing Climate and Disaster Resilience: Processes for
Identifying Tangible and Economically Robust Strategies
such “small” floods become more important than large extreme events in terms oflong-term economic impacts. The loss data available, however, were only for the largefloods of in 1998 and 2007. The lack of data on losses for smaller events represents amajor limitation for the analysis of risk reduction measures. The above caveats aside,results of the cost-benefit analysis indicates that there are fundamental differences inthe performances of structural measures on the one hand and a package people centredinterventions on the other.
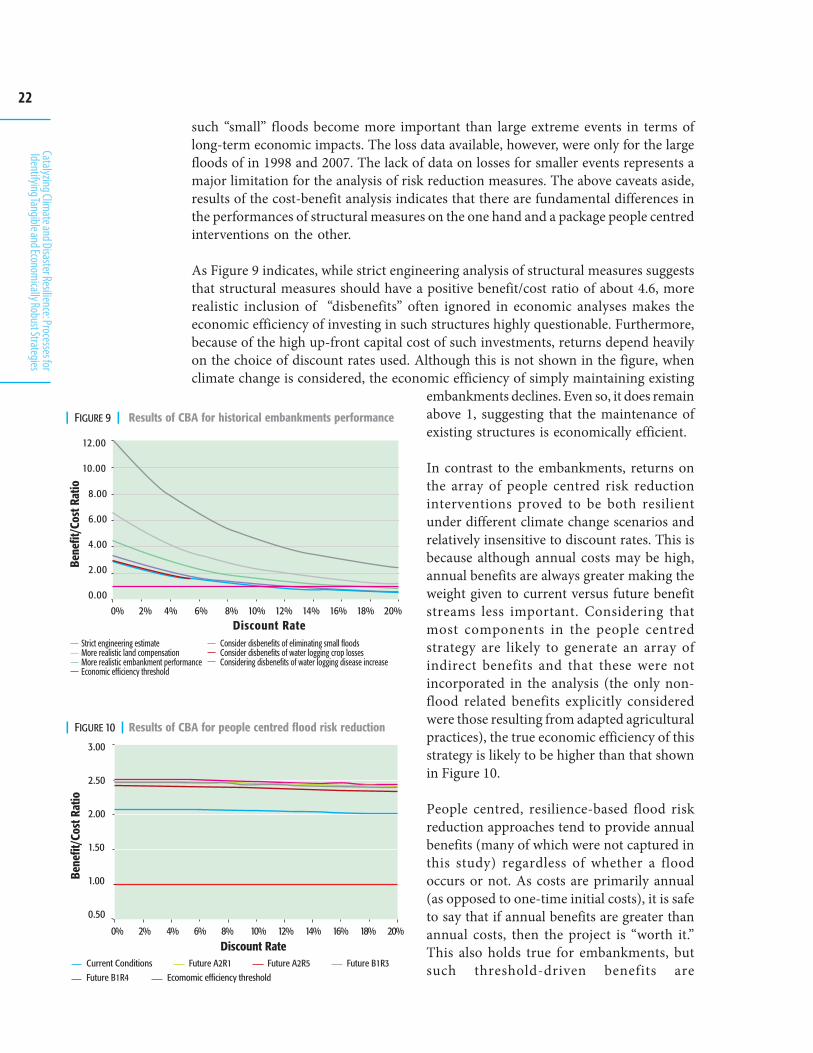
As Figure 9 indicates, while strict engineering analysis of structural measures suggeststhat structural measures should have a positive benefit/cost ratio of about 4.6, morerealistic inclusion of “disbenefits” often ignored in economic analyses makes theeconomic efficiency of investing in such structures highly questionable. Furthermore,because of the high up-front capital cost of such investments, returns depend heavilyon the choice of discount rates used. Although this is not shown in the figure, whenclimate change is considered, the economic efficiency of simply maintaining existing
embankments declines. Even so, it does remainabove 1, suggesting that the maintenance ofexisting structures is economically efficient.
In contrast to the embankments, returns onthe array of people centred risk reductioninterventions proved to be both resilientunder different climate change scenarios andrelatively insensitive to discount rates. This isbecause although annual costs may be high,annual benefits are always greater making theweight given to current versus future benefitstreams less important. Considering thatmost components in the people centredstrategy are likely to generate an array ofindirect benefits and that these were notincorporated in the analysis (the only non-flood related benefits explicitly consideredwere those resulting from adapted agriculturalpractices), the true economic efficiency of thisstrategy is likely to be higher than that shownin Figure 10.
People centred, resilience-based flood riskreduction approaches tend to provide annualbenefits (many of which were not captured inthis study) regardless of whether a floodoccurs or not. As costs are primarily annual(as opposed to one-time initial costs), it is safeto say that if annual benefits are greater thanannual costs, then the project is “worth it.”This also holds true for embankments, butsuch threshold-driven benefits are
�������������������������������������������������������������������������������������������������������������
����
����
����
����
����
����
����
�����
�����
����
�������������
���������������� ���� ��� �!�
��� ��� ����� � ��������� ��������� ���������
���������
| FIGURE 10 | Results of CBA for people centred flood risk reduction
| FIGURE 9 | Results of CBA for historical embankments performance
23
Reth
inking
the C
osts
and B
enefi
ts of
Disa
ster R
isk Re
ducti
onun
der C
hang
ing Cl
imate
Cond
itions
probabilistic (they may or may not be realized in any given year), while resilience-based approaches tend to yield at least some benefits every year.
Resilience-based approaches therefore reduce some of the cost-benefit uncertainty, orat least the dependence of the strategy’s performance on known risk, because theirbenefits do not depend on the occurrence of certain events. In terms of projectedclimate change, the people centred approach performs well even as flood risk increasesand embankments lose efficiency.
Results of the above analyses have major policy implications. In particular, they suggestthat investments to reduce the impact of low-magnitude but frequent events are likely togenerate far more assured returns than investments in large infrastructure where up-front costs are high and returns depend on both discount rates and unknown futureevents. This does not necessarily imply that investments should be directed awayfrom the sort of low-frequency/high-magnitude disasters that can set individuals,households and regions back for many years. On the contrary, it implies that a balancedapproach is needed, one that combines sustained attention to the small disasters thatreceive little public or policy attention as well as to extreme events and their large-scale, high-profile impact.
Drought Risk ReductionThe Uttar Pradesh case site is highly vulnerable not just to floods but also to drought.The primary risk from drought relates to agricultural production in the rice-wheatsystem on which most rural livelihoods in the Ganga Basin are based. As a result,interventions are not as wide-ranging as they are in the case offloods. The Uttar Pradeshdrought analysis focused on twostrategies: using insurancemechanisms to spread droughtrisk and developing groundwaterirrigation for reducing such risk.The approach to the case issummarized in Table 3.
In order to systematically assessthe costs and benefits of thesetwo risk reduction strategies(insurance and irrigation), wedeveloped a risk-analyticmodelling approach. This isillustrated in Figure 11 anddiscussed in more detail inChapter 7. This stochastic modelmade use of Monte-Carlosimulation (the randomizedsimulation of an underlyingstatistical distribution) to
| TABLE 3 | Key characteristics of the Uttar Pradesh drought CBA
Risks assessed
Type of CBA
Utility
Focus and options of analysis
Benefits considered
Unit of analysis
Resource and time commitmentfor the analysis
Key findings
Drought risk affecting small-scale farmers in UP in termsof rice and wheat production and related income
Forward looking, risk based methodology using projectedclimate and corresponding probabilistic outcomes
Pre-project appraisal or project appraisal for detailedevaluation of accepting, modifying or rejecting projects
Risk mitigation and sharing options considered:1. Irrigation: Construction of boreholes for groundwater
pumping - pumping to be paid for by household2. Subsidized micro crop insurance3. Integrated package of the options above
Stabilization of income and consumption
Representative farmer household of 7 comprising 80% ofthe survey sample with income/person of up to INR 6,570(national poverty line in 2008: INR 4,400).
Several man months of professional input due tostatistical analysis, stochastic modelling, and explicitmodelling of the household income generation process
• All options seem economically efficient• Irrigation benefits increase with climate change as low
intensity droughts increase• Insurance benefits reduced, as high intensity events
becomes less frequent with climate change• Integrated package delivers similar benefits at lower costs• For harnessing the benefits of integrated packages,
cross-sectoral cooperation between different public andprivate actors is essential.
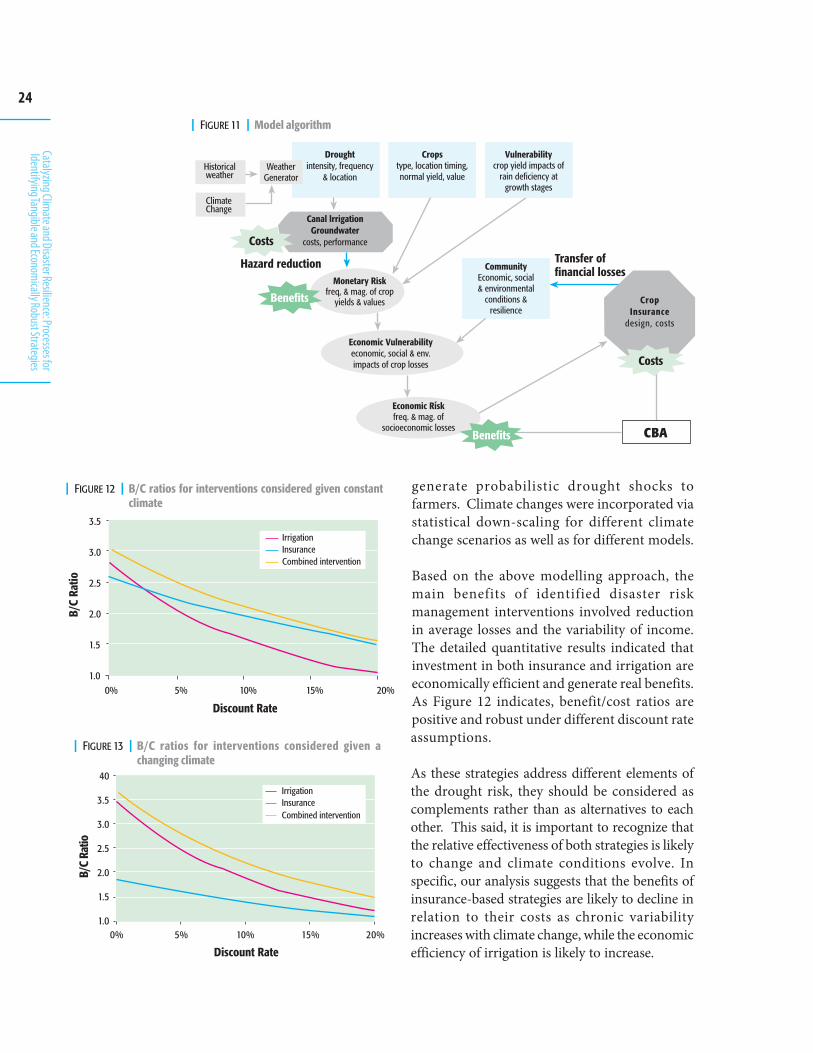
24
Catalyzing Climate and Disaster Resilience: Processes for
Identifying Tangible and Economically Robust Strategies
generate probabilistic drought shocks tofarmers. Climate changes were incorporated viastatistical down-scaling for different climatechange scenarios as well as for different models.
Based on the above modelling approach, themain benefits of identified disaster riskmanagement interventions involved reductionin average losses and the variability of income.The detailed quantitative results indicated thatinvestment in both insurance and irrigation areeconomically efficient and generate real benefits.As Figure 12 indicates, benefit/cost ratios arepositive and robust under different discount rateassumptions.
As these strategies address different elements ofthe drought risk, they should be considered ascomplements rather than as alternatives to eachother. This said, it is important to recognize thatthe relative effectiveness of both strategies is likelyto change and climate conditions evolve. Inspecific, our analysis suggests that the benefits ofinsurance-based strategies are likely to decline inrelation to their costs as chronic variabilityincreases with climate change, while the economicefficiency of irrigation is likely to increase.
| FIGURE 11 | Model algorithm
| FIGURE 12 | B/C ratios for interventions considered given constantclimate
���
���
���
���
���
������ ������������ �������������������� ��������������������������������
����
�����
��"� ���� ���#� ���
$���%&��� $ ��& ��
�������������
| FIGURE 13 | B/C ratios for interventions considered given achanging climate
��"� ���� ���#� ���
$���%&��� $ ��& ��
��
���
���
���
���
���
���
����
�����
�������������
��� ��������� ��������������� ���� ���������
25
Reth
inking
the C
osts
and B
enefi
ts of
Disa
ster R
isk Re
ducti
onun
der C
hang
ing Cl
imate
Cond
itions
Our analysis indicates that a strategic combination of irrigation and insurance hashigher return rates than either technique practiced individually, although all threeapproaches (irrigation, insurance or irrigation-insurance combined) are economicallyefficient. Insurance is not very dependent on discount rate assumptions, as it offers asecure, guaranteed payout, while irrigation and its benefits depend on the ability of ahousehold to pay to pump water. A typical household as modelled in our case studyis financially vulnerable. Multiple adverse shocks over time lead to accumulation ofdebt and to a declining ability to afford pumping in the future (leading to higherdiscount rates). With a changing climate, irrigation benefits increase as average rainfalland rainfall variability increase, while insurance benefits decline, as the incidence ofhigh intensity events decreases. Integrated physical (irrigation) and financial(insurance) intervention packages yield greater benefits at similar costs than eitherstrategy alone. This is a result of strategically targeting high frequency events withirrigation and low frequency events with insurance with a package approach to disasterrisk management. Consequently, it seems important to explore the development ofsuch integrated packages in a process involving different public and private actors.
26
Catalyzing Climate and Disaster Resilience: Processes for
Identifying Tangible and Economically Robust Strategies
Policy Issues
The policy context across South Asia highlights the importance of processes thatfoster the transparent evaluation of the costs and benefits of alternative approachesand their distributional implications.
Detailed analysis of the policy context in India, Nepal and Pakistan clearly shows thatthe policy environment where disasters and climate change are concerned is highlycentralized. Substantial rhetoric exists regarding the need for community participationin reducing the risk of disasters but, in most cases, actual participation is limited.Initiatives to reduce disaster risk, particularly when implemented in response to specificdisaster events, are often influenced by populist or other considerations rather thanby their true role in risk reduction. In addition, the policy environment in all threecountries limits learning. As discussed below, cost-benefit analysis could, ifimplemented in a transparent and participatory manner, play a major role inaddressing some of the above limitations.
27
Reth
inking
the C
osts
and B
enefi
ts of
Disa
ster R
isk Re
ducti
onun
der C
hang
ing Cl
imate
Cond
itions
The case studies illustrate both the importance of correctly evaluating the costs andbenefits of different strategies for disaster risk reduction and the inherent limitationsof existing methodologies for doing so. In many ways, cost-benefit analysis is more anorganizing framework and process for understanding trade-offs than a fully “scientific”method for evaluating the economic returns from a specific investment. Even if theyare produced through a comprehensive analysis, benefit-cost ratios depend heavilyon the array of factors considered, the types and the accuracy of the data available,and the assumptions incorporated in the analysis. Furthermore, unless cost-benefitanalysis is implemented in a transparent manner, the results can easily be manipulatedto produce any outcome the analyst desires. As a result, benefit-cost ratios aremeaningless and subject to misinterpretation in the absence of a full understanding ofthe factors on which they are based.
At present, most cost-benefit analyses are done on a one-off basis using approachesand frameworks tailored to specific local contexts. Although a number of guidelinesexist (Handmer and Thompson, 1997; FEMA, 2001 for guidance on CBA for DRM andNavarro, 2005—the ILPES Manual for assessing the economic impacts of disasters),neither the manuals nor the results in the literature are fully consistent. As a result, inmajor areas such as drought risk reduction, there are no fully accepted andinstitutionalized methods for determining what a cost is, what a benefit is or how todiscount the future. Furthermore, while many economists agree on the value of astatistical life or where and how discounting should be applied, such calculations areoften quite contentious in public policy and stakeholder environments. The markeddifferences in the values of different groups are often difficult to show transparently inexisting cost-benefit frameworks. Furthermore, as conventionally structured, cost-benefit analysis is intended to determine the overall returns to society of a givenintervention, not how those costs and benefits are distributed. Distributional issuesare, however, of central importance in many contexts, particularly where risk reductioninterventions are justified on the basis of their implications for poverty alleviation orfor the needs of specific vulnerable communities.
The above issues and their implications for the use of cost-benefit analysis are exploredin more detail below. The methodology can provide key insights but the inherentlimitations and subjective nature of many components are essential to understand.
The Use and Abuse ofCost-Benefit Analysis
28
Catalyzing Climate and Disaster Resilience: Processes for
Identifying Tangible and Economically Robust Strategies
Data Dependence
Accurate estimation of the costs and benefits of disaster risk reduction in any contextdepends heavily on the availability of data and the ability to project returns over thelifetime of any given intervention. Two elements are central to this. The first concernsthe availability of basic data on the costs of a project or intervention and the specificbenefits it is likely to generate. The second concerns the ability to project the frequencyof future events. Both issues are of particular concern in developing countries, whereexisting data tend to be limited or difficult to access and the collection of additionaldata is time consuming and often expensive.
In most situations, the costs of projects to reduce disaster risk are perceived as relativelyeasy to document with the important exception of any negative consequences(“disbenefits” or “externalities”) they may generate. However, even the relatively easilydocumented “costs” can be far from clear. In project evaluation, for example,governments often count the “cost” of land or other requirements at the rate they offerto displaced people when they exercise the principle of eminent domain rather than atthe rate in the market. As illustrated in the flood case from Uttar Pradesh, the differencecan be so huge as to fundamentally alter the results of the evaluation. Similar issuesexist with other costs.
Issues related to the monetizing of benefits from investing in disaster risk reductionare even more complex. These benefits are, in essence, avoided costs; the costs thatwould have been incurred due to disasters in the absence of any investments in riskreduction. Actual data on the costs of disasters are, of course, only available forhistorical events. In many cases, these data consist only of what governments orinsurance agencies actually paid out in compensation, not the real losses. Estimatingthe real losses, even from historical events, requires a variety of data of types that arenot generally collected. In the case of floods, for example, important losses occur whenpeople are unable to work either because of the flood itself or due to the increase inillness that generally accompanies flooding. Such data is not generally available and itis even more difficult to accurately determine the degree to which a specific risk reductionintervention would reduce such losses. Furthermore, conceptually it would beimportant to assess the income and livelihood consequences (indirect risks) and theirdistributional consequences in addition to the loss of assets and structure (directrisks) of disasters. For example, a loss of INR 10,000 has very different implications fora poor labourer than for a large-scale farmer. Such a loss could result in severemalnutrition and deprivation for the labourer (a major societal cost), but the large-scale farmer would absorb the loss and avoid the indirect societal costs. Normally,indirect risks cannot be assessed easily, as this involves conducting surveys andstatistical and economic analyses. As a result, analysts (even those in this study) tendto focus primarily on direct risks, which, in a development context, often understatethe “real” impacts.
The limitations on data available also determine what strategies can be evaluated. Inthe Pakistan case, the lack of data on the indirect risks to health essentially eliminatedour ability to estimate the costs and benefits of the main risk reduction interventionidentified by women in the affected communities.
29
Reth
inking
the C
osts
and B
enefi
ts of
Disa
ster R
isk Re
ducti
onun
der C
hang
ing Cl
imate
Cond
itions
The lack of data needed to project event probabilities is particularly challenging in thecase of climate related events. In many contexts, historical data regarding basichydrologic parameters (rainfall, streamflows, flooded areas, etc.) are extremely limitedor their access is restricted in the interests of national security. Such data, however, arerequired to down-scale results from general circulation models and translate theminto future flood or drought event probabilities in specific localities. When limitedhistorical data are coupled with the inherent uncertainties in data generated throughdown-scaling techniques, projections regarding the probability of future events areinherently highly uncertain. This uncertainty is of fundamental importance foreverything from the structure of insurance programmes to the design of physicalinfrastructure. Insurance programmes that are designed, for example, to pay out onceevery twenty-five years will not be financially viable if payments of a similar magnitudemust be made more frequently. Similarly, structures that are designed to withstandfloods occurring every hundred years will fail if larger floods occur.
Assumptions
The limited availability of basic data forces analysts to rely heavily on assumptions inorder to estimate the costs and benefits of different interventions. This is an arenawhere seasoned judgment is essential. It is also an arena where lack of transparencycan seriously compromise the legitimacy of the results of cost-benefit analysis. Asillustrated in the Uttar Pradesh flood case, differences in assumptions that seemrelatively minor can often alter cost-benefit estimates in fundamental ways(Chapter 6). The benefit-cost ratios estimated depend significantly on the value ofland assumed and the average width of the area affected by drainage problems behindembankments. Similarly in the Lai Basin case in Pakistan cost-benefit ratios dependedon assumptions regarding the extent of assets that could be moved out of harm’s wayusing the fifteen-minute warning provided by the early warning system.
Academic journals rely on peer review processes to validate both the assumptionsand data on which analyses of all types are based. In applied cost-benefit analyses, aframework enabling stakeholders to see key assumptions and test their impact on thebenefit-cost ratios generated would serve a similar purpose. At present, however,information on assumptions made tends to be buried in the technical details of analyses.
Negative Consequences
The negative consequences (“externalities” or “disbenefits”) associated withinvestments are often ignored in cost-benefit analyses. These frequently relate toenvironmental or other values that are difficult to identify and even more difficult toquantify. The Nepal case illustrates a clear mechanism for identifying the negativeconsequences of different risk reduction strategies and whom they affect. Quantifyingdisbenefits can have a fundamental impact on the overall social cost-benefit assessmentof an intervention and, even if the activity generates positive returns, may indicate theneed for compensation of affected groups or areas. In the Uttar Pradesh flood case, forexample, the negative consequences of embankments include (1) the loss of substantial
30
Catalyzing Climate and Disaster Resilience: Processes for
Identifying Tangible and Economically Robust Strategies
areas of agricultural land (2) the loss of the soil moisture and fertility benefits of smallfloods; (3) actual embankment performance that is substantially below design criteria;(4) losses in crop production caused by the water-logging behind embankments; and(5) increases in disease vectors. Taken together these negative consequences shift thebenefit-cost ratios calculated at a 10% discount rate for embankments from above 4 ina purely engineering analysis to 1 or below. The consideration of externalities changesthe evaluation of the project from one with very high social rates of return to onewhere it is unlikely that the benefits substantially exceed the cost.
In general, where interventions to address disaster risks have negative consequences,they must be included in order to identify real return rates. Interventions that do nothave such negative consequences are likely to have far more robust returns.
Discount Rates
As with any investment intended to generate benefits over an extended time period,the choice of discount rate has a major impact on the present value of investments indisaster risk reduction. This is particularly true where up-front investment costs arelarge and the costs avoided depend heavily on large-magnitude, low-frequency eventsrather than benefits that accrue each year. In this case, the choice of discount rates canheavily affect the economic efficiency of an investment. In contrast, where benefitsaccrue from high-frequency low magnitude events, return rates tend to be moreeconomically robust under a variety of discount rate assumptions. Both of theseissues are clearly illustrated in the contrasting returns for flood risk mitigation usingembankments versus more distributed “people centred” measures in the Eastern UttarPradesh case.
The choice of discount rates often is socially sensitive since it inherently raises ethicalquestions regarding the tradeoff between current benefits (which benefit currentpopulations) and future benefits (which may benefit future generations). Hence,transparency in the analysis is critical.
Distributional Issues
Conventional cost-benefit analysis is concerned primarily with the overall economicreturns to society and not with their distribution. In situations where poverty is amajor concern such as is the case in studied the areas and where justification for anyintervention depends heavily on the implications for vulnerable sections of society,distributional issues are of central importance. In many cases, the benefits frominvestments in risk reduction accrue to dominant sections of society and not to women,children, the poor or other socially excluded groups.
This issue is particularly evident in the examples of major infrastructure projects asdiscussed earlier, but is likely to also be a concern for other interventions. In the caseof embankments in Nepal and Uttar Pradesh, the largest beneficiaries tend to be wealthyindividuals living in towns while the most vulnerable groups, who live between a river
31
Reth
inking
the C
osts
and B
enefi
ts of
Disa
ster R
isk Re
ducti
onun
der C
hang
ing Cl
imate
Cond
itions
and its embankment, just outside embankments or in locations where flow isconcentrated, tend to bear many of the negative consequences. Even with distributedforms of risk reduction, the most vulnerable groups are often the least likely to benefit.This is not always the case, however. Interventions such as the fodder and food banksestablished by self help groups in Uttar Pradesh are of particular benefit to the poorand can also have extremely high benefit-cost ratios.
Targeting benefits toward vulnerable groups highlights the importance of linkingcost-benefit analysis with vulnerability analysis. The process of conducting the analysisconveys more “real” insights on the viability and desirability of DRR measures thando the numbers estimated. While traditional cost-benefit techniques do not considerdistribution, their use in conjunction with qualitative techniques (such as thosedescribed in the Nepal case) can generate key insights into distributional issues.
Lack of Transparency
All of the above issues point toward the importance of transparency. In complex topicareas such as disaster risk reduction and climate change, the validity and accuracy ofcost-benefit analyses depend heavily on a wide range of factors that include dataavailability and quality, assumptions and model design. In most analyses, these factorsare buried in technical details. As a result, decision-makers and other users of the resultshave little understanding regarding the numerous - and often heavily debatable -assumptions that determine the numbers generated. The risks of this are clearlyillustrated in the case of embankments in Uttar Pradesh, where an economic analysisthat draws on official figures and engineering standards alone inaccurately suggest ahigh social return.
Unless the analytical frameworks and the processes used to collect data and makeassumptions are transparent, the real meaning of any cost-benefit analysis will beuncertain and the technique will remain highly vulnerable to abuse when used togenerate criteria for decision-making.
32
Catalyzing Climate and Disaster Resilience: Processes for
Identifying Tangible and Economically Robust Strategies
Conclusions
The case studies in this volume clearly demonstrate that disaster risk reduction paysand that it can make a substantive contribution towards helping people adapt to theimpacts of climate change. Our conclusion confirms the results of numerous otherstudies on the costs and benefits of disaster risk reduction. At the same time, however,the case studies also clearly demonstrate that not all forms of disaster risk reduction aregood investments. They show that attention needs to be given to the manner in whichcost-benefit analyses are framed and conducted. Unless correctly framed and conductedin a transparent and highly participatory manner, the results of cost-benefit analysiscan be highly misleading.
Results of the qualitative and quantitative analyses, experiences in the region, alongwith climatic projections indicating variability will increase suggest that much moreattention needs to be paid to the consequences of inter-and intra-annual variabilityand strategies for reducing the risks related to it. At present, most attention is paid tohigh profile “extreme events” that generate large disasters. While responding to suchevents is important, recurrent smaller events have the potential to generate largeaggregate economic impacts. These events may be of particular importance to theability of populations to move out of poverty and adapt to climate change. As a result,low unit cost distributed approaches to risk reduction that respond to recurrentevents often may be more economically and socially effective than large investmentsin embankments and major flood control measures which are targeted toward lowerfrequency but higher magnitude events. Results from the current project are insufficientto demonstrate this conclusively but do point toward areas where additional researchcould provide critical guidance to policy-making.
A critical area requiring additional evaluation is the costs and benefits of integratedapproaches involving a mix of financial, small-scale distributed and carefully targetedlarger scale interventions for risk sharing and risk reduction. As illustrated in theUttar Pradesh drought case, this combined approach may generate substantially morebenefits than any single approach could on its own.
Cost-benefit analysis is extremely dependent on process and methods if it is to haveany real relevance as a decision support tool. Open transparent processes that utilize
33
Reth
inking
the C
osts
and B
enefi
ts of
Disa
ster R
isk Re
ducti
onun
der C
hang
ing Cl
imate
Cond
itions
both qualitative and quantitative methodologies are essential to produce results thatare robust under different conditions and different sets of assumptions. In some cases,for example, the results of a cost-benefit analysis are not sensitive to assumptionsconcerning data or discount rates; in others the level of sensitivity is high. In UttarPradesh, for example, the cost-benefit analysis clearly demonstrated that distributedinterventions delivering benefits annually with low initial costs are less sensitive todiscount rates or climate change scenarios. In more complicated cases, if cost-benefitanalysis is to be used as a major tool for supporting decision-making, it must becombined with qualitative and open processes of analysis.
Providing for transparency of data and data sources, assumptions, and externalities -including how these were identified - is critical in any cost-benefit analysis as thesefactors greatly influence the results. Transparency enables stakeholders to betterevaluate the validity of the results and/or come to their own conclusions. In addition,consistent frameworks and methods for evaluating different types of interventionsare required to better enable comparison of benefit and cost estimates. This isparticularly important for sensitivity analysis and for displaying the implications forthe resulting benefit-cost ratios. Transparency is also required in order to identify thefactors that have the largest impact on whether or not investments in risk reductiondeliver robust returns under the wide array of possible climate and other conditionslikely to occur in the future.
Cost-benefit analysis has the potential to become a useful tool for decision-makers toevaluate strategies for responding to disasters and reducing the impact of climatechange. Particularly in highly centralized policy environments such as those found inSouth Asia (see Chapter 8) participatory processes for conducting cost-benefit analysiscould, by highlighting their often high returns relative to more centralized structuralmeasures, enable much more serious focus on distributed community basedapproaches. However, for it to evolve from a “special purpose” technique for the one-off evaluation of DRR projects into a major decision-making support tool, substantialimprovements in methodologies and the processes through which they are appliedare essential.
34
Catalyzing Climate and Disaster Resilience: Processes for
Identifying Tangible and Economically Robust Strategies
FEMA (2001) ‘Guidance on Cost-Benefit Analysis of Hazard Mitigation Projects.’ Draftreport, revision 2.0. Washington, D.C.
Gunderson, L. H. and C. S. Holling (eds) (2002) Panarchy: Understanding Transformationsin Human and Natural Systems. Washington, D.C.: Island Press.
Handmer, J. and P. Thompson (1997) Economic Assessment of Disaster Mitigation: ASummary Guide. Resource and Environmental Studies 13. Canberra: Centrefor Resource and Environmental Studies, Australian National University.
Holling, C. S., L. H. Gunderson, and G. D. Peterson (2002) ‘Sustainability andpanarchies’, in L. H. Gunderson and C. S. Holling (eds) Panarchy:understanding transformations in human and natural systems, pp. 63-102.Washington, D.C.: Island Press.
Hoyois, P. and D. Guha-Sapir (2004) ‘Disasters caused by flood: Preliminary data fora 30 year assessment of their occurrence and human impact’. Paperpresented at the Health and Flood Risk Workshop; A Strategic Assessmentof Adaptation Processes and Policies, International workshop, TyndallCentre for Climate Change Research, University of East Anglia, Norwich(18-20 July).
IPCC (2007) Climate Change 2007: The Physical Science Basis, Summary forPolicymakers. Geneva: Intergovernmental Panel on Climate Change.
ISDR (2005) Hyogo Framework for Action 2005-2015: Building the Resilience of Nationsand Communities to Disasters. Extract from the final report of the WorldConference on Disaster Reduction, Hyogo, Japan (18-22 January). Geneva:United Nations International Strategy for Disaster Reduction, A/CONF.206/6
Moench, M. and A. Dixit (eds) (2007) Working with the Winds of Change: TowardStrategies for Responding to the Risks Associated with Climate Change andother Hazards. Boulder: Institute for Social and Environmental Transition;Kathmandu: ISET-Nepal; Geneva: the ProVention Consortium.
Navarro, H. (2005) Manual para la evaluacion de impacto de proyectos y programas delucha contra la pobreza. Manuales. Santiago, Chile: InstitutoLatinoamericano y del Caribe de Planificacion Economica y Social (ILPES),Area de Proyectos y programacion de inversiones.
Bibliography
Methods for IdentifyingTangible Strategies for Risk Reduction
2C H A P T E R
Marcus Moench (ISET)Sara Ahmed (ISET)
Daanish Mustafa (King’s College London)Fawad Khan (ISET)
Reinhard Mechler (IIASA)Daniel Kull (IIASA)
Ajaya Dixit (ISET-Nepal)Sarah Opitz-Stapleton (ISET) &
The Risk to Resilience Study Team

36
Catalyzing Climate and Disaster Resilience: Processes for
Identifying Tangible and Economically Robust Strategies
37
Meth
ods f
or Id
entif
ying T
angib
le St
rateg
ies fo
r Risk
Redu
ction
“More effective prevention strategies would not only save tens ofbillions of dollars, but tens of thousands of lives. Funds currentlyspent on intervention and relief could be devoted to enhancingequitable and sustainable development instead, which would furtherreduce the risk of war and disaster. Building a culture of prevention isnot easy. While the costs of prevention have to be paid in the present,their benefits lie in a distant future. Moreover, the benefits are nottangible; they are the disasters that did not happen,”(Kofi Annan, Annual Report on the Work of the Organisation of the United Nations, 1999).
The role of disasters in building and maintaining the cycle of poverty and underminingdevelopment progress is increasingly recognized as a major global challenge. Whilemany recent disasters are related to geophysical events (earthquakes, tsunamis, etc.),approximately 70% are weather related and this proportion is likely to grow as climatechange processes increase the variability and intensity of weather events (Hoyois andGuha-Sapir, 2004). As a result, cost-effective strategies for reducing disaster risk arecentral both to meeting development goals and responding to the challenges climatechange will present all sectors of society, particularly the poor, women and othervulnerable groups.
The purpose of this chapter on methodologies is to present practical approaches foridentifying, prioritizing and ultimately demonstrating the costs and benefits of tangibleinterventions to reduce disaster risks, particularly those likely to emerge as aconsequence of climate change. Such practical approaches are essential if governments,humanitarian organizations, the private sector and local communities are going toinvest substantial resources in reducing both current disaster risks and thoseanticipated as a consequence of climate change.
Cost-benefit analysis on its own is often a double-edge sword. Many of the costs andbenefits associated with potential interventions to reduce risk are difficult to identifyor quantify objectively. In many cases, perceptions regarding the nature of risks andthe array of potential strategies for reducing them may differ greatly both within andbetween communities. As a result, while the concept of risk reduction may be
Introduction
38
Catalyzing Climate and Disaster Resilience: Processes for
Identifying Tangible and Economically Robust Strategies
understood, what it means in practical terms is often unclear in the absence of detailedanalyses that address location specific conditions and the impacts of hazards ondifferent groups. In addition, the overall economic returns from investments in riskreduction do not reflect their distribution across vulnerable groups in society. As aresult, cost-benefit analysis needs to be part of a larger package of methodologies thatinclude:
1. Clear and transparent processes with extensive stakeholder engagement that enabledevelopment of a common understanding regarding the nature of risk and thepotential strategies for reducing it;
2. Detailed analysis of the factors contributing to vulnerability within exposedcommunities;
3. Quantitative and qualitative methods for evaluating the impacts of climate change;and
4. Processes for quantitative and qualitative data collection and cost-benefit analysisthat are transparent, inclusive and clearly identify the assumptions on which theanalysis is based.
This methodological summary outlines key elements and methodologies forunderstanding risk and vulnerability within communities, identifying potentialresponse strategies and evaluating related qualitative and quantitative costs andbenefits. The approach is based on a shared learning process that moves iterativelyfrom initial scoping to systematic vulnerability analysis, to identification of potentialrisk reduction options, and to qualitative and quantitative evaluation of their costsand benefits as a basis for decision-making. In order to consider impacts of climatechange on the economics of risk reduction strategies, the approach includesdownscaling of results from global circulation models for incorporation in thequantitative evaluation of costs and benefits. Before detailing these methodologies,however, it is essential to understand the underlying reasons behind our emphasis onprocess rather than quantitative outcomes alone.
39
Meth
ods f
or Id
entif
ying T
angib
le St
rateg
ies fo
r Risk
Redu
ction
The Importance of ‘Soft’ Process Approaches
Most investment decisions concerning disaster risk reduction (DRR) in South Asiahave focused on hard prevention or structural measures for which data are morereadily available and costs and benefits more tangible making them easier to quantify.In India, for example, the government for decades has invested heavily in buildingdams and embankments as the cornerstone of flood mitigation efforts. Similarly, fordrought mitigation, investments have focused on the development of irrigation systemsand on watershed management (where most of the investment goes into waterharvesting structures and physical land management activities such as contourbunding). Despite the dominance of hard structural approaches in DRR, increasinglyattention is being devoted to a wide variety of softer measures. These include a rangeof interventions to support community capacity building, develop disastermanagement policies and planning, spread risks through financial or other mechanismsand support adaptation. Such largely community or individual (household) basedmeasures, both autonomous and planned, can contribute to systemic changes that inthe long run may not only support the sustainability of targeted interventions butalso build more enduring and resilient communities.
Community based strategies can either complement or conflict with more centralizedstrategies. In the case of floods, for example, large-scale programmes to regulate riverflows through embankments and dams can fundamentally change both the nature ofrisk and the incentives facing individuals, households and communities to respond torisk. If, for example, river regulation eliminates small-scale annual flood events, thencommunities may feel insulated from flood impacts and have little incentive to investtime or resources in risk reduction. In addition, if the remaining risk relates only tolarge-scale events (for example, when control structures breach) then the scale ofevents may be beyond the capacity of communities to mitigate. A prime example is theembankment breach along the Kosi River in August 2008 that affected over threemillion people in Nepal and the Indian state of Bihar. Similar conflicts betweencommunity incentives and larger-scale initiatives may occur in cases of drought whereirrigation through large systems can provide a buffer—thus eliminating the incentiveof communities to reduce the dependency of livelihoods on agriculture—until thesource of water itself is affected.
Processes & QualitativeMethodologies
40
Catalyzing Climate and Disaster Resilience: Processes for
Identifying Tangible and Economically Robust Strategies
Although it is well recognized that the most effective points of entry for risk reductiontend to be local (Wisner et al., 2004), community based strategies often depend onenabling conditions at higher levels including:
Dependency on data: Localized early warning systems often depend on weatherinformation issued by state or national weather agencies.Risk spreading: The viability of micro-insurance generally requires mechanismsfor reinsurance that spread risk beyond local communities, i.e. beyond groups whoare likely to all be affected by any given event and where simultaneous requirementswould overwhelm local insurance pools.Institutions: Establishment of organizations for DRR may require enablinglegislation and sources of finance from national levels.
Processes for Working with Communities
Working with communities necessitates investing time and resources to determine:
1. Who faces risk and what form that risk takes for different groups within an areavulnerable to specific hazard events; and
2. What courses of action might best address the specific risks faced by differentgroups.
In many situations, disaster risks and the groups that should have interest in reducingrisk may seem self-evident. The reality, however, is often different. In urban Rawalpindi,Pakistan, for example, urban flood control programmes that have attracted massivedonor funding focus on early warning and control of flows. Research by ISET-Pakistanand partners in the flood affected area indicates, however, that health problems createdwhen floods deposit municipal waste across large areas are of much more significanceto women in local communities than the direct flow impacts (see Chapter 5 this volume).Women represent a key group of stakeholders and the strategies they support aredifferent from the structural measures implemented by governments.
Thus, processes that enable the integration of knowledge from different sources areessential. Our ISET partners and field teams used a combination of methods includingbroad scoping activities and shared learning dialogues (SLDs) with a range ofstakeholders to identify different DRR interventions, their broad cost and benefitareas, and potential disbenefits. These initial activities can serve as the basis for moredetailed capacity and vulnerability analyses, qualitative techniques for ranking andprioritizing alternative DRR activities, and if desired, for a full quantitative cost-benefitanalysis. Ideally the SLD process should continue beyond the initial phase as amechanism to feed insights from more detailed vulnerability and cost-benefitassessments back to communities and other key actors as a basis for final decision-making. As a result, although the process below is presented sequentially(scoping>shared learning>vulnerability analysis>qualitative and quantitativeassessment of costs and benefits>ultimate implementation decisions) as diagrammedin Figure 1 should be recognized as iterative.
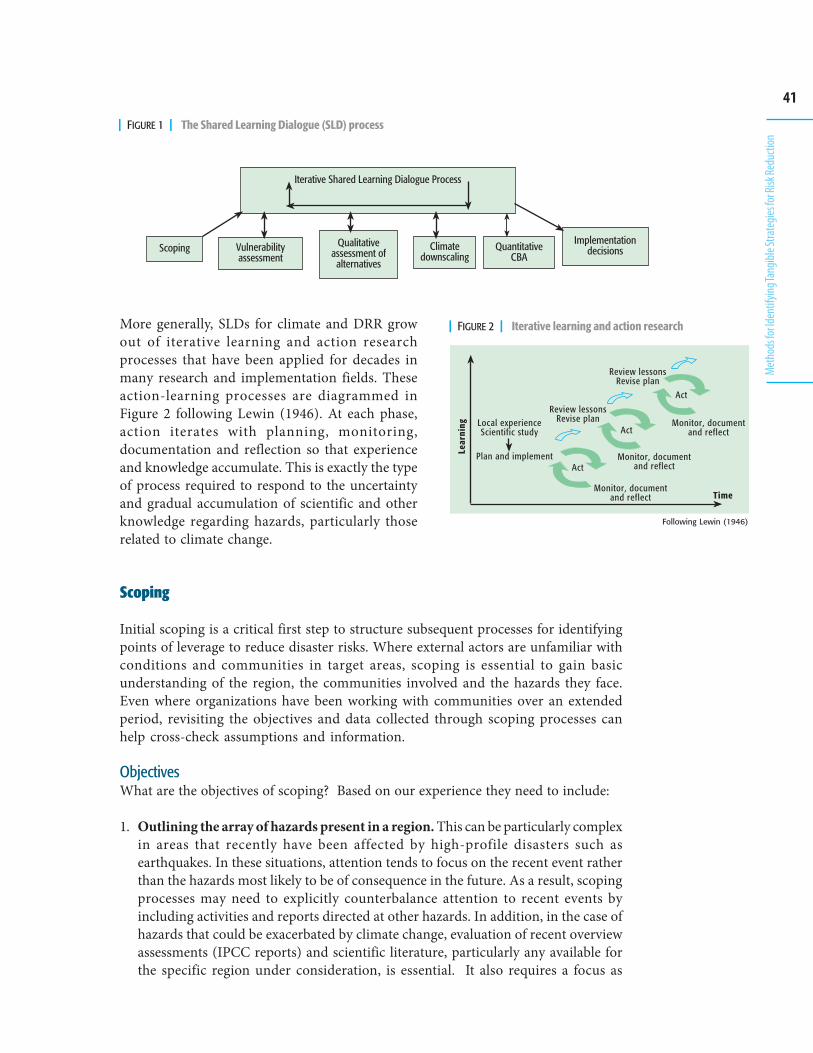
41
Meth
ods f
or Id
entif
ying T
angib
le St
rateg
ies fo
r Risk
Redu
ction
More generally, SLDs for climate and DRR growout of iterative learning and action researchprocesses that have been applied for decades inmany research and implementation fields. Theseaction-learning processes are diagrammed inFigure 2 following Lewin (1946). At each phase,action iterates with planning, monitoring,documentation and reflection so that experienceand knowledge accumulate. This is exactly the typeof process required to respond to the uncertaintyand gradual accumulation of scientific and otherknowledge regarding hazards, particularly thoserelated to climate change.
Scoping
Initial scoping is a critical first step to structure subsequent processes for identifyingpoints of leverage to reduce disaster risks. Where external actors are unfamiliar withconditions and communities in target areas, scoping is essential to gain basicunderstanding of the region, the communities involved and the hazards they face.Even where organizations have been working with communities over an extendedperiod, revisiting the objectives and data collected through scoping processes canhelp cross-check assumptions and information.
ObjectivesWhat are the objectives of scoping? Based on our experience they need to include:
1. Outlining the array of hazards present in a region. This can be particularly complexin areas that recently have been affected by high-profile disasters such asearthquakes. In these situations, attention tends to focus on the recent event ratherthan the hazards most likely to be of consequence in the future. As a result, scopingprocesses may need to explicitly counterbalance attention to recent events byincluding activities and reports directed at other hazards. In addition, in the case ofhazards that could be exacerbated by climate change, evaluation of recent overviewassessments (IPCC reports) and scientific literature, particularly any available forthe specific region under consideration, is essential. It also requires a focus as
| FIGURE 1 | The Shared Learning Dialogue (SLD) process
����
���� ��������������
���������������
������������������������
�����������������
������������������������
��������������������������
��������������������������
��������������������������
���
���
���
���
| FIGURE 2 | Iterative learning and action research
Following Lewin (1946)
42
Catalyzing Climate and Disaster Resilience: Processes for
Identifying Tangible and Economically Robust Strategies
much on levels of uncertainty regarding future conditions as on the results ofspecific future scenarios. A large part of the uncertainty in climate changeprojections is due to an increase in variability away from the previous long-termclimatological mean. The systems literally are transitioning into a new climatestate that we cannot completely know. Understanding the implications ofuncertainty in hazard evaluation is as important as attempts to narrow suchuncertainty.
2. Identifying communities that are particularly vulnerable to different hazardevents. The degree of exposure to different hazards often differs greatly betweencommunities residing in the same area. As our research in Eastern Uttar Pradeshhas documented, people living in traditional (kuccha) houses face far higher floodlosses than those residing in adjacent brick (pukka) houses (Chapter 6 this volume).
3. Beginning the process of exploring how hazards translate into different types ofrisk. Understanding different patterns of vulnerability serves as a basis for initialanalytical activities to map the relationship between hazards and risks faced bydifferent communities. This needs to be addressed at the outset as it is central toidentifying both community interest in risk reduction and the interventions thatcould reduce such risk. Some of these dimensions are relatively obvious. Fisherfolk,for example, may face a very different type of risk from cyclones than other coastalcommunities due to the nature of their work. Similarly, high-rise office workersface different types of vulnerability to earthquakes than poor farmers living inground-level traditional houses. Some key differences, however, are far less obvious.Such differences define what might be called “communities of vulnerability” thatface similar risks and may have similar interests in approaches to risk reduction.
4. Identifying existing projects and programmes. In many regions, existing or recentprojects and programmes have responded to specific hazards and increasingly thepotential consequences of climate change. However, these experiences are rarelyconsidered in the development of new programmes and policies. As a result, regionsoften “reinvent the wheel.” Some level of understanding regarding what has or hasnot worked in the past and why should be a central part of scoping exercises.
5. Identifying major alternative avenues for addressing risk. Although identificationof strategies for addressing risk must remain preliminary at the scoping phase, it iscritical to develop initial ideas on practical avenues as a basis for discussion withkey actors. It is important to think through how different types of hard versus soft,or direct (targeted) versus systemic interventions, might influence the risk faced bydifferent communities of vulnerability. In most cases, key actors tend to moverapidly toward “tangible” hard interventions that directly control the physicalimpact of specific hazards. Such interventions may not, however, be particularlyeffective in relation to the risks faced by different communities of vulnerability. Inflood affected regions, for example, development of basic health care systems mighthave far greater impact on disease morbidity generally associated with flood eventsthan structural control measures. Initial exploration of how different dimensionsof vulnerability relate to risk and how those relate, in turn, to broad categories ofpotential risk reduction strategies is essential during the scoping phase in order to
43
Meth
ods f
or Id
entif
ying T
angib
le St
rateg
ies fo
r Risk
Redu
ction
create a basis for future dialogue and shared learning with key actors andcommunities at later phases.
Core ElementsTo meet the above objectives, scoping processes need, at minimum, to contain thefollowing core elements:
1. Collection and review of existing published and secondary information on hazardsand their impacts: This should include the type of hazard, its frequency and intensity aswell as basic information available on impacts and their distribution (deaths, economiclosses, communities affected, etc.). It should also include information available on thechanging nature of regional hazards whether due to global processes such as climatechange, demographic and economic changes (urbanization, shifts out of, or into,agriculture or other sectors) or other factors. Geo-referenced information (maps orthe data bases required for creating them) can be useful for all of the above.
2. Review of policy and programmes: Targeted reviews of disaster related policiesand programmes are essential in order to understand the institutional landscape.Where possible, such reviews should consider the wider policy environment thatmay contribute to hazard exposure. For example, policies supporting agriculturein drought prone regions or encouraging coastal development, if they exist, couldbe important factors contributing to hazard exposure.
3. Collection of basic information on conditions in exposed communities: Thisshould include basic information on demographics, economic systems, livelihoods,etc. that may be available from secondary sources such as research publications,official government reports, and project documents.
4. Interviews with key informants: This is one of the most important elements Iscoping processes. Carefully targeted key informant interviews can facilitateunderstanding both perceptions regarding the nature of hazards, patterns ofvulnerability and potential response elements. It is important to interview keyactors representing a wide array of social perspectives and knowledge.
The above information provides a basic starting point for the more intensive learningdialogue processes that we believe are essential in order to develop broadly sharedunderstanding of risks and the potential avenues for addressing them.
Shared Learning Dialogues (SLDs)
Moving beyond the level of understanding that can be achieved through initial scopingrequires iterative processes in which analysts and different communities of actors(local “communities”, sector specialists, governmental actors, NGOs, etc.) can shareinsights and come to a common understanding. This is particularly true in the case ofcomplex hazards—such as those associated with climate change—where highlyspecialized information from high-level scientific research must be brought togetherwith the equally specialized, location specific, insights of communities.
44
Catalyzing Climate and Disaster Resilience: Processes for
Identifying Tangible and Economically Robust Strategies
The nature of hazards and the process through which highly variable vulnerabilityattributes create different patterns of risk within communities is complex. No singlegroup, whether at the community level or within the government, is likely to have acomprehensive understanding of risks, particularly for hazards with long recurrenceperiods. Instead, different groups tend to have partial but key insights and perspectivesthat relate to their position within society or the specific vulnerabilities they face.Also, local groups often lack the insights that specialized groups from the internationalscientific or risk management communities can bring.
Furthermore, where responses are concerned, knowledge is also fragmentary. Localcommunities often have key insights about types of activities that could reduce therisks they currently face—but they frequently lack understanding of processes andlimitations at levels beyond their immediate community. Government officials mayhave larger perspectives and certainly understand the operation of the formal systemswithin which they work—but they tend to lack understanding of the differentdimensions of vulnerability within communities. As a result, the solutions they proposerarely respond to diverse priorities at the community level. This is also the case withglobal scientific communities. The scientific community may have unique insightsinto emerging hazards but generally lack understanding of both risk patterns at thecommunity level and the strengths or limitations of government and other institutions.As a result, effective solutions rarely emerge from any one set of actors.
Ultimately, all forms of knowledge on hazards and risk tend to be partial and unlessthese can be integrated, risks cannot be addressed effectively. Shared Learning Dialoguesare the mechanism we have developed for this purpose. SLDs are essentially iterativemulti-stakeholder or focus group meetings with the following key attributes:
1. Information sharing should be multi-directional: the goal is for external actors tolearn from the communities (local groups, government actors, etc.) they areinteracting with and vice versa;
2. The processes should be iterative: People at all levels have time to absorb andthink about the information and perspectives of different groups before they interactagain and work towards the development of specific mechanisms for respondingto hazards and the risks they create;
3. The processes should cross scale, community, organizational and disciplinaryboundaries: They bring together local, regional, national and global scientificperspectives; and
4. The processes should involve participants reflecting different socio-economic,gender, geographic, and cultural groupings: Because patterns of vulnerabilityoften differ between such groupings, the goal is to ensure, as far as possible, thatshared learning processes capture these different patterns and the responsestrategies they suggest.
In the SLD process we have developed, each meeting starts with a presentation outliningkey issues. Other participants are then invited to provide critical comments, insights,
45
Meth
ods f
or Id
entif
ying T
angib
le St
rateg
ies fo
r Risk
Redu
ction
information, data and suggestions drawn from their own organizations and activityareas. Particular attention is paid to identifying areas where all participants agree onkey points, knowledge gaps or the need for specific research or pilot activities. In manycases, the regular meetings lead to sharing of information or further dialogue inelectronic forums. Holding SLDs throughout the duration of a project encourages theengagement of external counterparts and decision-makers in project activities. Suchdialogues also provide an immediate mechanism for feedback and help to ‘close theloop’ between knowledge generation, testing, dissemination and application.
The primary goal of shared learning processes is common understanding regardingthe nature of hazards and the potential avenues for responding to them. This takestime and requires a process in which insights from communities (and often differentgroups within communities) can be brought together with insights from groups andorganizations working at other levels. To achieve this, iteration and interaction withmultiple groups across scales and disciplinary boundaries are essential.
On a practical level, what does a SLD process involve?
1. Iterative meetings among diverse groups that bring together different perspectiveson vulnerability, the factors that contribute to social resilience, and potentialavenues for responding to disaster risks;
2. Provision of key technical and analytical inputs to support the joint understandingof hazards, risks and potential response strategies;
3. Mechanisms to evaluate and prioritize alternative response strategies.
The ultimate outcome of SLD processes should be the identification of avenues forresponding to the specific risks faced by different communities that are:
1. Practical - they have a clear mechanism reducing risk for vulnerable communitiesand can be implemented with the capacities and social or financial resourcesavailable;
2. Broadly owned - they should be understood and supported by key actors (whetherat the community level, the government or the private sector) that need to beinvolved in implementation;
3. Sustainable - they have a clear operational or business model that will ensure riskmitigation interventions remain effective until hazard events occur;
4. Technically effective - the activities should reduce the potential for damage whenhazard events occur or mitigate them (as discussed further in the section onqualitative evaluation this can be an issue when measures depend on thresholdvalues related to the magnitude of events); and
5. Economically and financially cost effective - investments in DRR should beeconomically justifiable relative to other potential uses of public funds.
Although the ultimate objective of SLDs is to identify avenues for responding to risk,this will occur over a process of iterative engagement and may not be an output ofinitial meetings. Prior to more detailed work on vulnerability or the prioritizationand economic evaluation of potential options for responding to risks, SLDs shouldproduce:
46
Catalyzing Climate and Disaster Resilience: Processes for
Identifying Tangible and Economically Robust Strategies
1. A detailed understanding of hazards, including those likely to emerge as aconsequence of climate change, and their likely implications for different groups(communities, gender and economic groupings, geographic regions);
2. A detailed understanding of the factors that local groups view as mediating theimpact of hazard events and strengthening the resilience of society when eventsoccur;
3. An indication of groups where additional vulnerability analysis will be required;4. Broad understanding among key actors (local, regional and external) of potential
risk response strategies that reflects distinctions between hard versus soft, targetedversus systemic, community versus centralized, and risk spreading versus riskreduction concepts; and
5. Initial identification of potential response strategies for more detailed evaluation.
The above initial outcomes should provide a sufficient degree of shared understandingto support more detailed vulnerability analyses as well as qualitative and quantitativeevaluations of avenues for responding to risk, as discussed in the following sections.
Vulnerability Analysis
Why is vulnerability analysis important? In virtually all situations, different groupsface different levels of risk in relation to specific hazards. A tangible example is thetendency of poor populations to cluster in high-risk areas such as urban and ruralflood plains. As a result, they have a far higher level of vulnerability to flooding thangroups living in less hazard prone areas. Interventions to mitigate flooding can bedesigned that meet the needs of such groups. However, in many cases interventionsthat might “benefit” the larger society as a whole actually increase the risk some groupsface. The fact that interventions often have differential effects or may not reach specificgroups is common across most hazards and contexts. In many situations the factorscausing vulnerability are not as direct or immediately evident as in the flooding examplegiven above. Instead, vulnerability may be related to culturally based gender differences(women can be more vulnerable to floods due to cultural inhibitions on swimming orclothing styles), differential access to basic services (you cannot call for help as effectivelyif you do not own a phone), and a host of other factors. As a result, clear understandingof patterns of vulnerability is essential to identifying effective risk reduction strategies.This understanding needs to move beyond the immediately evident exposure to specifichazards and address deeper systemic factors that shape risk for different groups.Furthermore, we believe it is important for approaches to vulnerability analysis to bebased on common metrics—indices, maps and disaggregated data—in order toprovide an effective basis for planning and decision-making. At present mostapproaches to vulnerability analysis are narrative based. Because of this they aredifficult to map in ways that illustrate the concentration or diffusion of vulnerablegroups. They are also difficult to aggregate and disaggregate in ways that assist inidentifying common factors contributing to vulnerability across large areas ormultiple groups. For these reasons, we have developed the semi-quantitativevulnerability index developed as part of the Risk to Resilience Project (for more detailsee Risk to Resilience Working Paper No. 2).
47
Meth
ods f
or Id
entif
ying T
angib
le St
rateg
ies fo
r Risk
Redu
ction
The concept of vulnerability has been one of the most insightful and influential additionsto hazards and climate change research during the last three decades. Althoughvulnerability is a contested term, partly because of different epistemological rootswhich are beyond this summary, we define vulnerability as a “set of conditionsdetermined by physical, social, economic and environmental factors or processes whichincrease the susceptibility of a community to the impact of hazards,” (the HyogoFramework, 2005-2015, adopted by the UN at the World Conference on Disasters in2005).
While vulnerability analyses from varying intellectual and theoretical perspectiveshave enriched the conceptual and analytical understanding of the patterns of damagefrom environmental extremes, their contribution to the policy realm has beenperipheral at best. Some of the reasons for the lack of integration of vulnerability inpolicy include:
The dissonance between policy-makers’ concerns with aggregate populations atthe meso and macro national scales and vulnerability analysts’ general biasestowards socially differentiated household and community levels at the micro andmeso scale (Mustafa, 2002 and 2004);Policy-makers’ social positions as representatives of the prevailing political andeconomic structures and many vulnerability analysts’ concerns with fundamentalinequities of the social structures and the need for systemic change (Hewitt, 1983;Wisner et al., 2004);Policy-makers’ need for simpler, generalized, actionable, preferably quantitativeinformation for input into policy process, and the spatially and temporally nuanced,complex, generally qualitative information directed towards understandingcausation rather than prescribing action generated by vulnerability analyses (e.g.see Swift, 1989; Bohle and Watts, 1993).
Not surprisingly, measuring vulnerability has been an ongoing challenge forresearchers. Anderson and Woodrow (1989) proposed the largely qualitativeCapacities and Vulnerability Analysis (CVA) matrix, which came to be one of themore influential schemas for monitoring the vulnerability of communities andhouseholds, primarily used by many influential NGOs (ActionAid, 2005; Davis, 2004).Drawing on this, we developed a quantitative Vulnerability and Capacities Index(VCI) applicable at household and community levels, with slight modifications forapplication in rural or urban areas.
The VCI identifies eleven most critical drivers of vulnerability and its converse,capacities, from the universe of drivers of social vulnerability identified in the literature.The index is not comprehensive, but rather indicative. Because it is concerned withpersistent conditions that drive vulnerability, the index does not measure them relativeto any thresholds of damage from specific hazards as some other vulnerability indices(see, for example, Luers et al., 2003 and Luers, 2005). The main thematic areas in theVCI are consistent with the thematic areas mentioned by Twigg (2007) under thetheme of risk management and vulnerability reduction for resilient communities, inaddition to similar quantification exercises by others (e.g., Bosheret al., 2007). The overall weight distribution of vulnerability drivers between the three
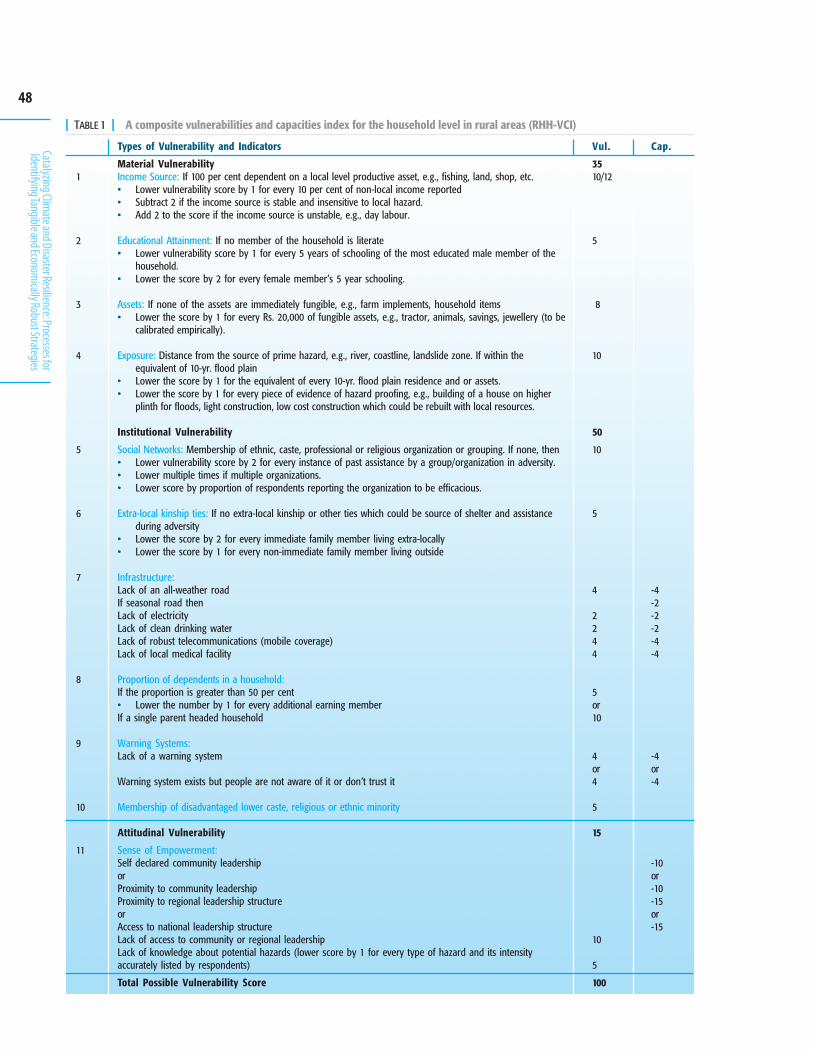
48
Catalyzing Climate and Disaster Resilience: Processes for
Identifying Tangible and Economically Robust Strategies
Types of Vulnerability and Indicators
Material VulnerabilityIncome Source: If 100 per cent dependent on a local level productive asset, e.g., fishing, land, shop, etc.• Lower vulnerability score by 1 for every 10 per cent of non-local income reported• Subtract 2 if the income source is stable and insensitive to local hazard.• Add 2 to the score if the income source is unstable, e.g., day labour.
Educational Attainment: If no member of the household is literate• Lower vulnerability score by 1 for every 5 years of schooling of the most educated male member of the
household.• Lower the score by 2 for every female member’s 5 year schooling.
Assets: If none of the assets are immediately fungible, e.g., farm implements, household items• Lower the score by 1 for every Rs. 20,000 of fungible assets, e.g., tractor, animals, savings, jewellery (to be
calibrated empirically).
Exposure: Distance from the source of prime hazard, e.g., river, coastline, landslide zone. If within theequivalent of 10-yr. flood plain
• Lower the score by 1 for the equivalent of every 10-yr. flood plain residence and or assets.• Lower the score by 1 for every piece of evidence of hazard proofing, e.g., building of a house on higher
plinth for floods, light construction, low cost construction which could be rebuilt with local resources.
Institutional Vulnerability
Social Networks: Membership of ethnic, caste, professional or religious organization or grouping. If none, then• Lower vulnerability score by 2 for every instance of past assistance by a group/organization in adversity.• Lower multiple times if multiple organizations.• Lower score by proportion of respondents reporting the organization to be efficacious.
Extra-local kinship ties: If no extra-local kinship or other ties which could be source of shelter and assistanceduring adversity
• Lower the score by 2 for every immediate family member living extra-locally• Lower the score by 1 for every non-immediate family member living outside
Infrastructure:Lack of an all-weather roadIf seasonal road thenLack of electricityLack of clean drinking waterLack of robust telecommunications (mobile coverage)Lack of local medical facility
Proportion of dependents in a household:If the proportion is greater than 50 per cent• Lower the number by 1 for every additional earning memberIf a single parent headed household
Warning Systems:Lack of a warning system
Warning system exists but people are not aware of it or don’t trust it
Membership of disadvantaged lower caste, religious or ethnic minority
Attitudinal Vulnerability
Sense of Empowerment:Self declared community leadershiporProximity to community leadershipProximity to regional leadership structureorAccess to national leadership structureLack of access to community or regional leadershipLack of knowledge about potential hazards (lower score by 1 for every type of hazard and its intensityaccurately listed by respondents)
Total Possible Vulnerability Score
Vul.
3510/12
5
8
10
50
10
5
4
2244
5or10
4or4
5
15
10
5
100
Cap.
-4-2-2-2-4-4
-4or-4
-10or-10-15or-15
1
2
3
4
5
6
7
8
9
10
11
| TABLE 1 | A composite vulnerabilities and capacities index for the household level in rural areas (RHH-VCI)
49
Meth
ods f
or Id
entif
ying T
angib
le St
rateg
ies fo
r Risk
Redu
ction
categories of material, institutional and attitudinal vulnerabilities is 35, 50 and 15%,respectively. This distribution is roughly consistent with the weights used by Vincent(2004) for measuring vulnerability of African countries: 20% for economic wellbeingand stability, 20% to demographic structure, 40% to institutional stability and strengthof public infrastructure, 10% to global interconnectivity; and 10% to natural resourcedependence. Since we are operating at the micro scale of households and communities,our material vulnerabilities category encompasses the first and the last two of hercategories, while the demographic structure category is not as applicable. Furthermore,general distribution varies slightly as we go from household to community level andfrom rural to urban area VCI indices. Table 1 outlines the VCI used for households inrural areas. The scoring of categories would be different for urban areas and forassessments as the community level.
For details on scoring and more information on rationale for the different indicatorsas well as examples of its use in different contexts, rural/urban and at the householdor community level in each context, see Risk to Resilience Working Paper No. 2. Briefdescriptions of the categories are given below.
Material VulnerabilitiesA diverse livelihood strategy, rather than the quantum of income, is one of the key elementsof resilience against environmental hazards (Moench and Dixit, 2004). Therefore, thediversity and stability of livelihoods is listed as a key component contributing to capacityand its converse to vulnerability in this case. In urban areas, however, diversity of incomesources is a little less important than the absolute magnitude of them, because of theservice and industrial based monetized economies of urban areas.
Formal education, as a driver of vulnerability, is considered as this may be a factor forgaining access to livelihood opportunities and facilities both in rural and urban areas,although the degree of importance may differ.
Fungible assets can be important in terms of helping recovery. For example, maintenanceand selling of farm animals to recover from flood damage is often an importantcomponent of recovery (Mustafa, 1998). It may also include sale of valuable items, e.g.,jewelry, scooters, land, etc. However, sale of these assets in some cases can seriouslyundermine the resource picture and mobility of the household.
Exposure to specific hazards is a component of material vulnerability, but only acomponent and not the whole picture (Cutter, 2000). Attention has to be on the socialin addition to the physical component as well.
Institutional VulnerabilitySocial networks and social capital have been deemed to be important contributors tobuilding resilience and helping recovery from hazards (Fussel, 2007; Bosheret al., 2007; Twigg, 2007), particularly since they can be conduits for information,preparedness, relief and recovery.
Extra-local kinship ties, although important, are difficult to assess in terms of theirquality. In the case of the recent earthquake in Pakistani administered Kashmir (PAK),
50
Catalyzing Climate and Disaster Resilience: Processes for
Identifying Tangible and Economically Robust Strategies
there is considerable evidence that extra-local kinship ties were important in terms ofmoral and material support to earthquake affected areas (Khan and Mustafa, 2007).However, there is also evidence that sometimes, extra-local family members are eitherunable or unwilling to extend significant help to disaster victims, possibly because oftheir own precarious livelihood situations, and can at times become a burden in termsof social obligations rather than an asset (e.g., see Mustafa, 2004).
The proportion of dependents in the household is similarly considered to be aninstitutional vulnerability because the effects of it are institutionally mediated. Havinga large family by itself is not a bad thing, because of the extra labour that comes withlarge families in rural settings. But dependents, particularly young children and theelderly, in the absence of social systems for taking care of them, can be a drain onfamily resources.
The infrastructural measures are similarly listed as institutional vulnerability, becausethey are a function of the quality of governance in a society. Warning systems are aspecial case where just the existence of a warning system is not sufficient, but rather itscredibility and awareness is just as important.
The last category of belonging to an ethnic minority and/or a lower caste can be animportant factor in determining vulnerability. Bosher et al. (2007), while investigatingthe impact of caste on vulnerability in India, found that the contribution of castetowards vulnerability was much more complex and mediated by many other factors,e.g., the characteristics of the community they lived in and the lower caste people’saccess to specialized social networks. Similarly, for ethnic or religious minorities,sometimes specialized networks can facilitate access to resources for relief and recoveryin addition to employment and education opportunities, e.g., the Aga Khan networkprimarily catering to the Ismaili religious community in South Asia and Africa, variouschurch groups helping minority Christian communities in South Asia, as well asschedule caste politicians directing state resources towards their constituencies.
Attitudinal VulnerabilityAmong the attitudinal vulnerabilities, sense of empowerment is considered to be thekey category (Delica-Willison and Willison, 2004). Proximity to local and regionalpower structures in addition to a personal sense of efficacy—all self perceived—isevidence of a sense of empowerment in the face of adversity. Proximity to powerstructures can be very effective in terms of channeling relief and recovery in the aftermathof disasters and even gaining access to government services in addition to criticalproductive resources which otherwise may not be possible for disadvantaged poor,minority or low caste groups (Mustafa, 2002; Bosher et al., 2007). Furthermore,knowledge about and attitude towards potential hazards can also be critical indetermining behaviour and vulnerability to hazards (e.g., see Crozier et al., 2006;Burton et al., 1993).
Data to compile the VCI can be drawn either from primary sources (e.g. householdsurveys or focus group discussions for the community level VCI), or from secondarydata sources (existing surveys). All data collection tools that we developed and used
51
Meth
ods f
or Id
entif
ying T
angib
le St
rateg
ies fo
r Risk
Redu
ction
were simple enough for community researchers to adopt; the idea being that they couldrepeat this exercise six months or one year down the line to look at the impact of thevarious adaptation or DRR interventions. Before undertaking data collection, theremust be thorough discussion of the scoring technique amongst field team members.Scoring should be done by at least two field researchers, particularly for some of themore difficult calibrations on livelihoods, assets and exposure. We also recommendthat scores and their rationale are discussed in the group before being finalized, and thediscussions thoroughly documented before being shared with a wider audience.
In sum, formulation of an index of anything is invariably an exercise in generalization;one is bound to exclude what many may consider important variables, and present astatic snapshot of a dynamic reality particularly when it comes to such a concept asvulnerability. While the impact of the full conceptual and analytical weight ofvulnerability may indeed be reduced by a quantitative measure, the communicativeimpact of the VCI, particularly in a comparative sense and in terms of relaying criticalinformation for non-expert policy-makers, cannot be underestimated. The VCI as ithas been developed and field-tested here, can be used by NGO teams and communityanimators to collect baseline information on vulnerability in a village or urbancommunity so as to not only target specific interventions and limited resources atvulnerable households, but also to later monitor impacts and outcomes of the same.In looking at vulnerability at both the household and community level in a givencontext, whether urban or rural, the VCI provides an objective understanding of thedifferential dimensions of vulnerability. However, as with all quantitative indicators,the VCI is only an approximate measurement of reality and not the reality. Hence, itsuse ideally must be supported by narrative exploring the complex social andinstitutional context underlying the measurement of vulnerability.
Results from a comprehensive vulnerability analysis using the above index can bemapped using geographic information systems or statistically analyzed in order toidentify groups where vulnerability is concentrated. They can also be disaggregated toshow the mix of factors why groups are identified as more or less vulnerable thanothers. When used in SLDs, the results from this type of analysis provide a solid basisfor identifying specific factors that appear to contribute to risk as well as their relativeimportance or weight. This, in turn, provides a tangible basis for identifying andjustifying specific intervention strategies to address risk.
Processes for Qualitative Evaluation and Prioritizationof Risk Reduction Measures
Once an array of potential avenues for responding to risk have been identified througha combination of scoping, SLDs and vulnerability analysis, these options need to beevaluated in a systematic manner to understand tradeoffs and potential costs andbenefits for different vulnerable groups. At a minimum, the types of qualitativeevaluation described in this section should be undertaken. If it is viewed as importantand sufficient resources (data, financial and human) are available this can provide thebasis for a full cost-benefit analysis.
52
Catalyzing Climate and Disaster Resilience: Processes for
Identifying Tangible and Economically Robust Strategies
Initial EvaluationThe qualitative evaluation should subject specific interventions to a number of criticalquestions:
1. Can the relationship between the proposed intervention and the risks faced bycommunities be clearly demonstrated? This may seem obvious but in practice theconnection between implementation activities and risks is often not clear or direct.Key questions to consider include:
Does the strategy affect risk by directly targeting the impact of a hazard event(e.g. by reducing damage to buildings or keeping flooding out of an area) orthrough systemic changes in vulnerability (e.g. by encouraging livelihooddiversification or improving communications)?If the strategy directly targets specific hazard events, are they the most importanthazards? Will targeted interventions be sustainable given the anticipatedfrequency of events? (e.g. will changes in building regulations “last” if earthquakesare extremely rare?)If the strategy focuses on systemic changes, do interventions relate to specificrisks? (e.g. do improvements in general communications systems actuallyimprove early warning capacities?)
2. Does the proposed strategy have major distributional implications? When DRRstrategies are implemented there are often clear winners and losers. For example,in the case of embankments for flood protection, those living in areas between thelevies “lose” (i.e. they are subject to more flooding) while those living in areasprotected by the levies “gain”. Similar differential impacts also exist withmechanisms such as insurance or zoning that tend to benefit wealthy groups, insome cases at the expense of those less well off.
3. Is the strategy accessible to the intended beneficiaries? Insurance, for example,may not be affordable for the poorest sections of society, or for women who maylack collateral, however much they might benefit from it. Similarly, early warningsystems may only serve that portion of the population that has regular access tospecific technologies such as cell phones or radios.
4. Is the proposed strategy based on a sustainable operational model? In manysituations, interventions to reduce risk are not sustainable over the indeterminate,and often long period, between events. In Pakistan, for example, building codes wereestablished following the 1975 Quetta earthquake. These codes existed only on paperand in the memory of a few actors by the time the earthquake in Muzafarabad/Kashmir occurred in 2005. Similar challenges exist with other types of interventionsas well. Expensive “high-tech” interventions (such as tsunami warning systems) oftensuffer from lack of maintenance between events. Unless a clear operational modelensures risk responses remain alive between events, then the viability of such responsesis highly questionable. Here, systemic interventions may have a substantial advantageover interventions targeted at specific hazards. Many systemic interventions (such asthe improvement of communication, transport, education and financial systems)serve multiple immediate purposes and are maintained by the business modelsassociated with those services. This is a distinct contrast to more targeted
53
Meth
ods f
or Id
entif
ying T
angib
le St
rateg
ies fo
r Risk
Redu
ction
interventions (such as flood warning systems or earthquake building codes) thatmay need public funding for ongoing maintenance.
5. Is the strategy consistent with emerging and projected social or other trends? Asillustrated in the cases in this volume, climate change may reduce or increase theeffectiveness of different strategies. However, the effectiveness of strategies also canbe affected by social trends. Community based risk reduction strategies, for example,may face major challenges where migration or other major economic ordemographic shifts increase mobility and reduce the links and commonalitiesbetween individuals living in vulnerable regions. Similarly, strategies reliant ongovernment inputs may not be viable in regions where formal institutions areweak, disrupted or limited by declining financial, technical and other resources.
6. Is the effectiveness of the proposed strategy dependent on key assumptions orthreshold values that may be incorrect or change? In the case of flood control, theviability of embankments and other protective structures depends heavily on thespecific frequency and magnitude of projected flood events. If flood events exceedembankment design criteria then the partial protection provided by suchembankments may actually increase the ultimate scale of disasters by providing anillusion of protection and encouraging settlement and investment in the “protected”areas. The effectiveness of some types of interventions depends heavily on specificassumptions while others are much more robust under uncertainty. This isparticularly important in the case of weather related disasters since climate changeprocesses undermine the reliability of many basic projections regarding flood,storm and drought frequency, intensity and duration.
7. Are the capacities for implementing a given strategy readily available or can theybe easily developed? In many situations, strategies are developed based on theassumption that either technical or institutional resources are available. This mayrange, for example, from data availability to law enforcement. However, theseresources or capacities may not exist or be developed easily.
8. Are there additional questions beyond the above that relate to the viability ofproposed strategies in the specific region of concern? All risks are ultimatelyinherently local. In all situations, additional criteria should be added.
The evaluation process involves direct input from participants in SLDs. It is throughdiscussions of different perspectives on potential options with community members,technical specialists and other key actors, that key advantages and constraintsassociated with each option—i.e. the answers to the above test criteria—become clear.This qualitative comparison of potential strategies can be facilitated by constructinga matrix listing potential interventions on the vertical axis, and responses to theabove test criteria on the horizontal axis. In the example below, clear answers supportingthe strategy are green, answers not supporting a viable strategy are red, and majorquestions are blue. This evaluation provides a fairly robust, although preliminary,indication of strategies that are likely to be viable, others where significant questionsremain to be resolved, and a final set where problems are known to exist that are likelyto undermine the strategies effectiveness.
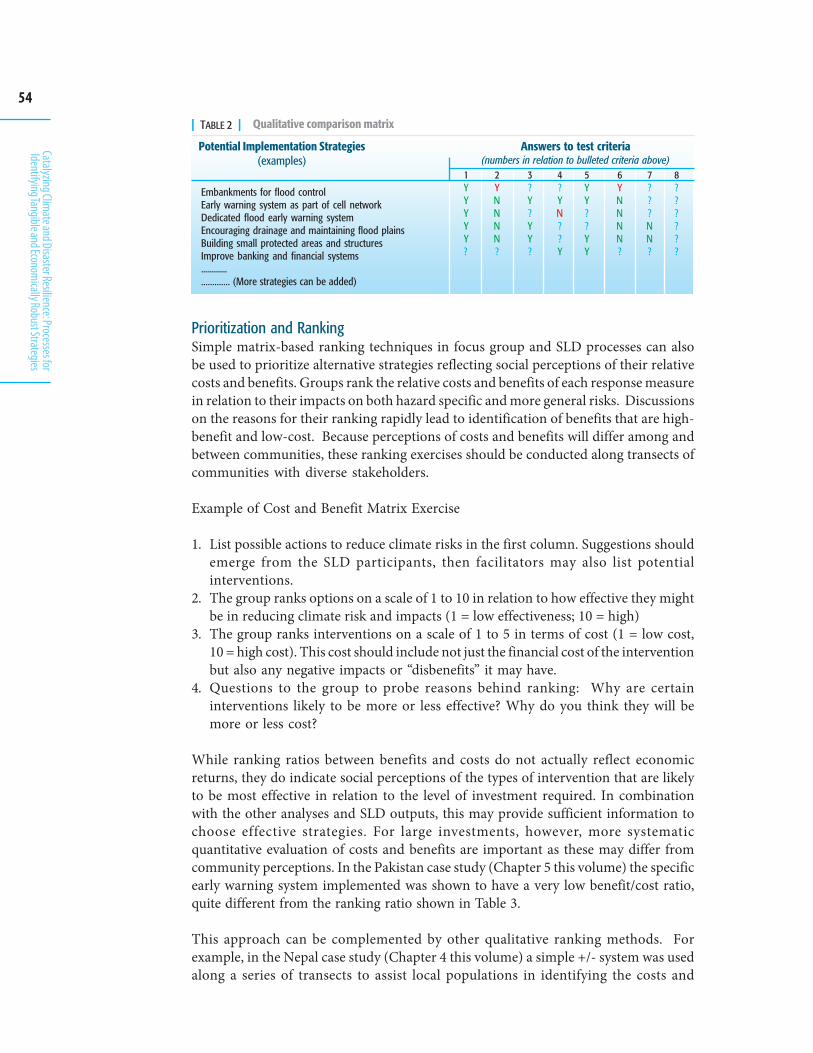
54
Catalyzing Climate and Disaster Resilience: Processes for
Identifying Tangible and Economically Robust Strategies
| TABLE 2 | Qualitative comparison matrix
Potential Implementation Strategies(examples)
Embankments for flood controlEarly warning system as part of cell networkDedicated flood early warning systemEncouraging drainage and maintaining flood plainsBuilding small protected areas and structuresImprove banking and financial systems.......................... (More strategies can be added)
Answers to test criteria(numbers in relation to bulleted criteria above)
1 2 3 4 5 6 7 8Y Y ? ? Y Y ? ?Y N Y Y Y N ? ?Y N ? N ? N ? ?Y N Y ? ? N N ?Y N Y ? Y N N ?? ? ? Y Y ? ? ?
Prioritization and RankingSimple matrix-based ranking techniques in focus group and SLD processes can alsobe used to prioritize alternative strategies reflecting social perceptions of their relativecosts and benefits. Groups rank the relative costs and benefits of each response measurein relation to their impacts on both hazard specific and more general risks. Discussionson the reasons for their ranking rapidly lead to identification of benefits that are high-benefit and low-cost. Because perceptions of costs and benefits will differ among andbetween communities, these ranking exercises should be conducted along transects ofcommunities with diverse stakeholders.
Example of Cost and Benefit Matrix Exercise
1. List possible actions to reduce climate risks in the first column. Suggestions shouldemerge from the SLD participants, then facilitators may also list potentialinterventions.
2. The group ranks options on a scale of 1 to 10 in relation to how effective they mightbe in reducing climate risk and impacts (1 = low effectiveness; 10 = high)
3. The group ranks interventions on a scale of 1 to 5 in terms of cost (1 = low cost,10 = high cost). This cost should include not just the financial cost of the interventionbut also any negative impacts or “disbenefits” it may have.
4. Questions to the group to probe reasons behind ranking: Why are certaininterventions likely to be more or less effective? Why do you think they will bemore or less cost?
While ranking ratios between benefits and costs do not actually reflect economicreturns, they do indicate social perceptions of the types of intervention that are likelyto be most effective in relation to the level of investment required. In combinationwith the other analyses and SLD outputs, this may provide sufficient information tochoose effective strategies. For large investments, however, more systematicquantitative evaluation of costs and benefits are important as these may differ fromcommunity perceptions. In the Pakistan case study (Chapter 5 this volume) the specificearly warning system implemented was shown to have a very low benefit/cost ratio,quite different from the ranking ratio shown in Table 3.
This approach can be complemented by other qualitative ranking methods. Forexample, in the Nepal case study (Chapter 4 this volume) a simple +/- system was usedalong a series of transects to assist local populations in identifying the costs and
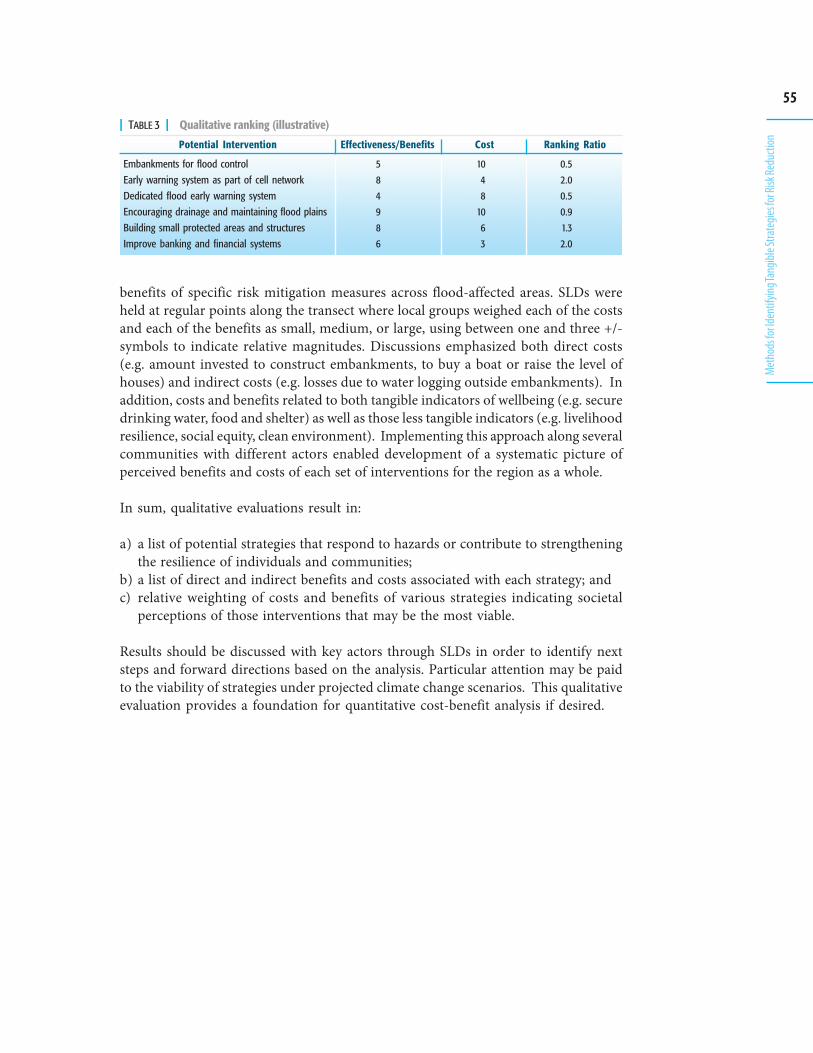
55
Meth
ods f
or Id
entif
ying T
angib
le St
rateg
ies fo
r Risk
Redu
ction
benefits of specific risk mitigation measures across flood-affected areas. SLDs wereheld at regular points along the transect where local groups weighed each of the costsand each of the benefits as small, medium, or large, using between one and three +/-symbols to indicate relative magnitudes. Discussions emphasized both direct costs(e.g. amount invested to construct embankments, to buy a boat or raise the level ofhouses) and indirect costs (e.g. losses due to water logging outside embankments). Inaddition, costs and benefits related to both tangible indicators of wellbeing (e.g. securedrinking water, food and shelter) as well as those less tangible indicators (e.g. livelihoodresilience, social equity, clean environment). Implementing this approach along severalcommunities with different actors enabled development of a systematic picture ofperceived benefits and costs of each set of interventions for the region as a whole.
In sum, qualitative evaluations result in:
a) a list of potential strategies that respond to hazards or contribute to strengtheningthe resilience of individuals and communities;
b) a list of direct and indirect benefits and costs associated with each strategy; andc) relative weighting of costs and benefits of various strategies indicating societal
perceptions of those interventions that may be the most viable.
Results should be discussed with key actors through SLDs in order to identify nextsteps and forward directions based on the analysis. Particular attention may be paidto the viability of strategies under projected climate change scenarios. This qualitativeevaluation provides a foundation for quantitative cost-benefit analysis if desired.
Potential Intervention Ranking RatioEffectiveness/Benefits
| TABLE 3 | Qualitative ranking (illustrative)
Cost
Embankments for flood control 5 10 0.5
Early warning system as part of cell network 8 4 2.0
Dedicated flood early warning system 4 8 0.5
Encouraging drainage and maintaining flood plains 9 10 0.9
Building small protected areas and structures 8 6 1.3
Improve banking and financial systems 6 3 2.0
56
Catalyzing Climate and Disaster Resilience: Processes for
Identifying Tangible and Economically Robust Strategies
Moving beyond qualitative approaches to evaluation, such those described in thepreceding section, represents a significant shift in the level of data, analysis andinformation required. As a result, time and analytical capacity requirements—andconsequently cost—increase. Whether or not to proceed with quantitative analysisrequires careful evaluation of the degree to which the analysis will inform the choice ofrisk management strategies and whether or not the types of information desired canactually be produced. As the Pakistan and India case studies (Chapters 5, 6 and 7 thisvolume) illustrate, even with substantial quantitative data, cost-benefit analyses forrisk reduction often require numerous assumptions and estimates. Furthermore manyof the costs and benefits associated with disasters and alternative risk reductionstrategies cannot be easily measured. Consequently, despite substantial data collection,such analyses are not complete. This said, quantification and the process required todo so, can fundamentally alter understanding of the effectiveness and the underlyingfactors affecting cost and benefit magnitudes.
Many types of quantitative analysis can generate information required for evaluatingthe costs and benefits of climate and disaster risk. These range from basic hydrologicmodelling (essential for projecting flood impacts) to extensive field surveys designedto collect basic data on assets, demographic characteristics, disease, etc. Cataloguingand discussing all these methodologies is beyond the scope of this summary. Instead,we briefly introduce methods for projecting future climate conditions (discussed inmore detail in the following chapter), and focus discussion on quantitative cost-benefitanalysis. Climate change, although highly technical, needs to be considered in analysisof risk reduction to different potential climate futures with regard to weather-relatedhazards.
Climate Downscaling
In order to understand the manner in which floods, droughts, storms or other weatherrelated disasters may change as climatic conditions evolve, analysis is limited by thecurrent state of scientific understanding. Projections, such as those synthesized by theIPCC in its reports, are very general discussing trends and broad patterns of change.Also, there is a lack of scientific consensus about models and future projections,
Quantitative Methodologies
57
Meth
ods f
or Id
entif
ying T
angib
le St
rateg
ies fo
r Risk
Redu
ction
resulting in uncertainty. Moving beyond general projections requires familiarity withthe scientific literature on climate change and the ability to scale the scenarios that canbe generated using large-scale General Circulation Models (GCMs) to the specificarea and hazard of concern. Still, the resolution of the GCMs (100km-200km) is toobroad to be of use in developing specific disaster risk reduction and adaptationmeasures. In the India cases (Chapters 6 and 7), a climate downscaling model wasused to project conditions under different climate scenarios. The flood and droughtmodels used for estimating weather related hazards within river basins require climateinformation at a much smaller geographic scale. Hence, the ability of cost-benefitanalysis and other techniques to assess the economic viability of DRR investmentsrequires probabilistic information (frequencies and magnitudes) of potential eventssuch as floods and droughts.
The climate downscaling model employed in the project involved a statistical techniqueto relate large-scale climate information, such as wind or atmospheric pressure, torainfall patterns in the Rohini basin in Uttar Pradesh, India. The model producedpotential future climate scenarios against which cost and benefits of interventions fordisaster risk reduction were assessed. Details of the methods and results of this climatedownscaling method are described in the following chapter. However, it is importantto highlight that the downscaling method:
a) provides evidence that realities likely to be experienced in specific basins or locationsdiffer greatly from broad climate projections. This is critical for discussing specificresponse strategies; and
b) generates a range of scenarios in which cost-benefit analysis for interventions mayhelp determine robustness of the strategy. If cost-benefit results are positive underall future scenarios, then confidence is much higher than if they are positive underonly a portion of scenarios.
However, given that uncertainty inherent in projections of future climate conditionsis very high, probabilistic approaches to cost-benefit analysis can be used to generatescenarios but not forecast probable returns. As a result, while still reflecting estimatesof potential economic returns from DRR investments, the inherent uncertainty andscenario characteristics of such cost-benefit analyses must be transparently reported.
Cost-Benefit Analysis: Quantitative Decision Support for Assessing the Costsand Benefits of Disaster Risk Management
Why Cost-Benefit Analysis?Cost-benefit analysis is an economic technique used to organize, appraise and presentthe costs and benefits, and inherent tradeoffs of public investment projects and policiestaken by governments and public authorities in order to increase public welfare.Broadly speaking, if benefits exceed costs, then an investment/project should beundertaken. The task of cost-benefit analysis is to systematically assess the costs andbenefits and check whether social welfare is indeed maximized. Its main strength is itsexplicit and rigorous accounting of gains and losses that can be effectively monetized,and in so doing, making decisions more transparent.
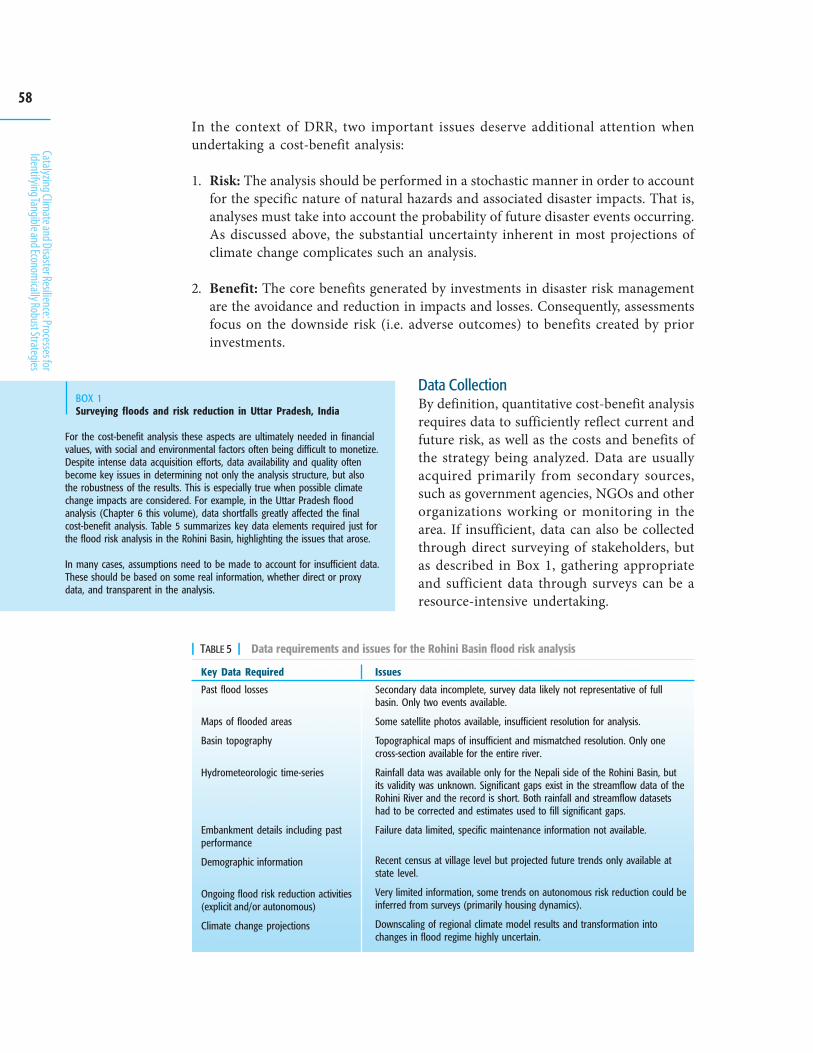
58
Catalyzing Climate and Disaster Resilience: Processes for
Identifying Tangible and Economically Robust Strategies
In the context of DRR, two important issues deserve additional attention whenundertaking a cost-benefit analysis:
1. Risk: The analysis should be performed in a stochastic manner in order to accountfor the specific nature of natural hazards and associated disaster impacts. That is,analyses must take into account the probability of future disaster events occurring.As discussed above, the substantial uncertainty inherent in most projections ofclimate change complicates such an analysis.
2. Benefit: The core benefits generated by investments in disaster risk managementare the avoidance and reduction in impacts and losses. Consequently, assessmentsfocus on the downside risk (i.e. adverse outcomes) to benefits created by priorinvestments.
Data CollectionBy definition, quantitative cost-benefit analysisrequires data to sufficiently reflect current andfuture risk, as well as the costs and benefits ofthe strategy being analyzed. Data are usuallyacquired primarily from secondary sources,such as government agencies, NGOs and otherorganizations working or monitoring in thearea. If insufficient, data can also be collectedthrough direct surveying of stakeholders, butas described in Box 1, gathering appropriateand sufficient data through surveys can be aresource-intensive undertaking.
BOX 1Surveying floods and risk reduction in Uttar Pradesh, India
For the cost-benefit analysis these aspects are ultimately needed in financialvalues, with social and environmental factors often being difficult to monetize.Despite intense data acquisition efforts, data availability and quality oftenbecome key issues in determining not only the analysis structure, but alsothe robustness of the results. This is especially true when possible climatechange impacts are considered. For example, in the Uttar Pradesh floodanalysis (Chapter 6 this volume), data shortfalls greatly affected the finalcost-benefit analysis. Table 5 summarizes key data elements required just forthe flood risk analysis in the Rohini Basin, highlighting the issues that arose.
In many cases, assumptions need to be made to account for insufficient data.These should be based on some real information, whether direct or proxydata, and transparent in the analysis.
Issues
Secondary data incomplete, survey data likely not representative of fullbasin. Only two events available.
Some satellite photos available, insufficient resolution for analysis.
Topographical maps of insufficient and mismatched resolution. Only onecross-section available for the entire river.
Rainfall data was available only for the Nepali side of the Rohini Basin, butits validity was unknown. Significant gaps exist in the streamflow data of theRohini River and the record is short. Both rainfall and streamflow datasetshad to be corrected and estimates used to fill significant gaps.
Failure data limited, specific maintenance information not available.
Recent census at village level but projected future trends only available atstate level.
Very limited information, some trends on autonomous risk reduction could beinferred from surveys (primarily housing dynamics).
Downscaling of regional climate model results and transformation intochanges in flood regime highly uncertain.
Key Data Required
Past flood losses
Maps of flooded areas
Basin topography
Hydrometeorologic time-series
Embankment details including pastperformance
Demographic information
Ongoing flood risk reduction activities(explicit and/or autonomous)
Climate change projections
| TABLE 5 | Data requirements and issues for the Rohini Basin flood risk analysis
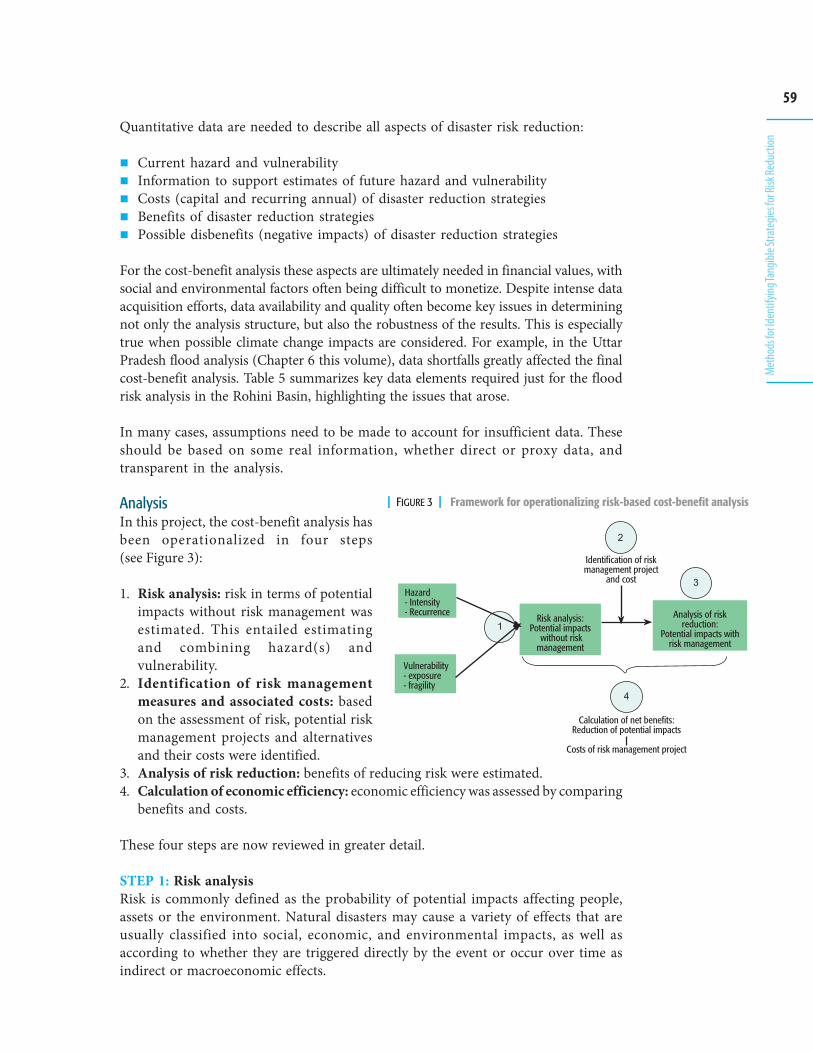
59
Meth
ods f
or Id
entif
ying T
angib
le St
rateg
ies fo
r Risk
Redu
ction
�
�
�
��������������������������������������������������������
����������������� �������!���
"������������������������ �������!���
��������#�$��%�"��������%���������
����������������������������������&����������� �����
������������������������
��������������������&�������� �����
'�����������%�������%��� �����
�
| FIGURE 3 | Framework for operationalizing risk-based cost-benefit analysis
Quantitative data are needed to describe all aspects of disaster risk reduction:
Current hazard and vulnerabilityInformation to support estimates of future hazard and vulnerabilityCosts (capital and recurring annual) of disaster reduction strategiesBenefits of disaster reduction strategiesPossible disbenefits (negative impacts) of disaster reduction strategies
For the cost-benefit analysis these aspects are ultimately needed in financial values, withsocial and environmental factors often being difficult to monetize. Despite intense dataacquisition efforts, data availability and quality often become key issues in determiningnot only the analysis structure, but also the robustness of the results. This is especiallytrue when possible climate change impacts are considered. For example, in the UttarPradesh flood analysis (Chapter 6 this volume), data shortfalls greatly affected the finalcost-benefit analysis. Table 5 summarizes key data elements required just for the floodrisk analysis in the Rohini Basin, highlighting the issues that arose.
In many cases, assumptions need to be made to account for insufficient data. Theseshould be based on some real information, whether direct or proxy data, andtransparent in the analysis.
AnalysisIn this project, the cost-benefit analysis hasbeen operationalized in four steps(see Figure 3):
1. Risk analysis: risk in terms of potentialimpacts without risk management wasestimated. This entailed estimatingand combining hazard(s) andvulnerability.
2. Identification of risk managementmeasures and associated costs: basedon the assessment of risk, potential riskmanagement projects and alternativesand their costs were identified.
3. Analysis of risk reduction: benefits of reducing risk were estimated.4. Calculation of economic efficiency: economic efficiency was assessed by comparing
benefits and costs.
These four steps are now reviewed in greater detail.
STEP 1: Risk analysisRisk is commonly defined as the probability of potential impacts affecting people,assets or the environment. Natural disasters may cause a variety of effects that areusually classified into social, economic, and environmental impacts, as well asaccording to whether they are triggered directly by the event or occur over time asindirect or macroeconomic effects.
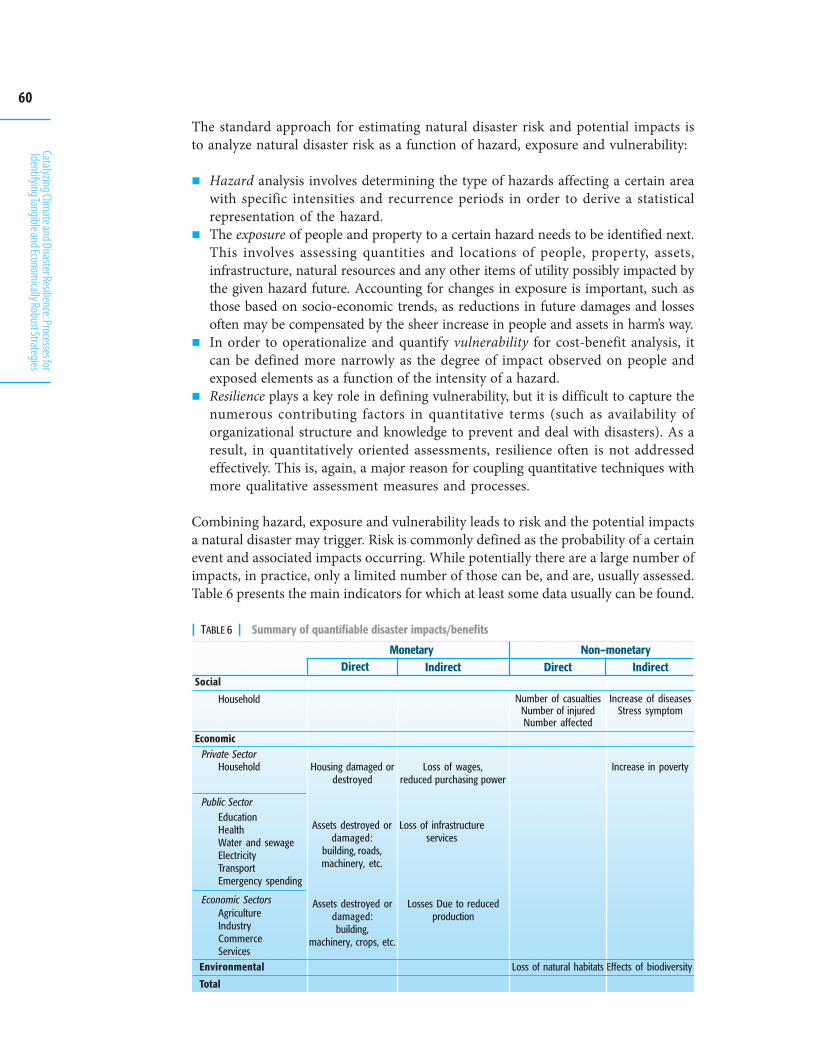
60
Catalyzing Climate and Disaster Resilience: Processes for
Identifying Tangible and Economically Robust Strategies
The standard approach for estimating natural disaster risk and potential impacts isto analyze natural disaster risk as a function of hazard, exposure and vulnerability:
Hazard analysis involves determining the type of hazards affecting a certain areawith specific intensities and recurrence periods in order to derive a statisticalrepresentation of the hazard.The exposure of people and property to a certain hazard needs to be identified next.This involves assessing quantities and locations of people, property, assets,infrastructure, natural resources and any other items of utility possibly impacted bythe given hazard future. Accounting for changes in exposure is important, such asthose based on socio-economic trends, as reductions in future damages and lossesoften may be compensated by the sheer increase in people and assets in harm’s way.In order to operationalize and quantify vulnerability for cost-benefit analysis, itcan be defined more narrowly as the degree of impact observed on people andexposed elements as a function of the intensity of a hazard.Resilience plays a key role in defining vulnerability, but it is difficult to capture thenumerous contributing factors in quantitative terms (such as availability oforganizational structure and knowledge to prevent and deal with disasters). As aresult, in quantitatively oriented assessments, resilience often is not addressedeffectively. This is, again, a major reason for coupling quantitative techniques withmore qualitative assessment measures and processes.
Combining hazard, exposure and vulnerability leads to risk and the potential impactsa natural disaster may trigger. Risk is commonly defined as the probability of a certainevent and associated impacts occurring. While potentially there are a large number ofimpacts, in practice, only a limited number of those can be, and are, usually assessed.Table 6 presents the main indicators for which at least some data usually can be found.
| TABLE 6 | Summary of quantifiable disaster impacts/benefits
Non–monetaryMonetaryDirect
Social
Household Number of casualtiesNumber of injuredNumber affected
Increase of diseasesStress symptom
EconomicPrivate Sector
Household Housing damaged ordestroyed
Loss of wages,reduced purchasing power
Increase in poverty
Public SectorEducationHealthWater and sewageElectricityTransportEmergency spending
Assets destroyed ordamaged:
building, roads,machinery, etc.
Loss of infrastructureservices
Economic SectorsAgricultureIndustryCommerceServices
Assets destroyed ordamaged:building,
machinery, crops, etc.
Losses Due to reducedproduction
Environmental Loss of natural habitats Effects of biodiversity
Total
Indirect Direct Indirect
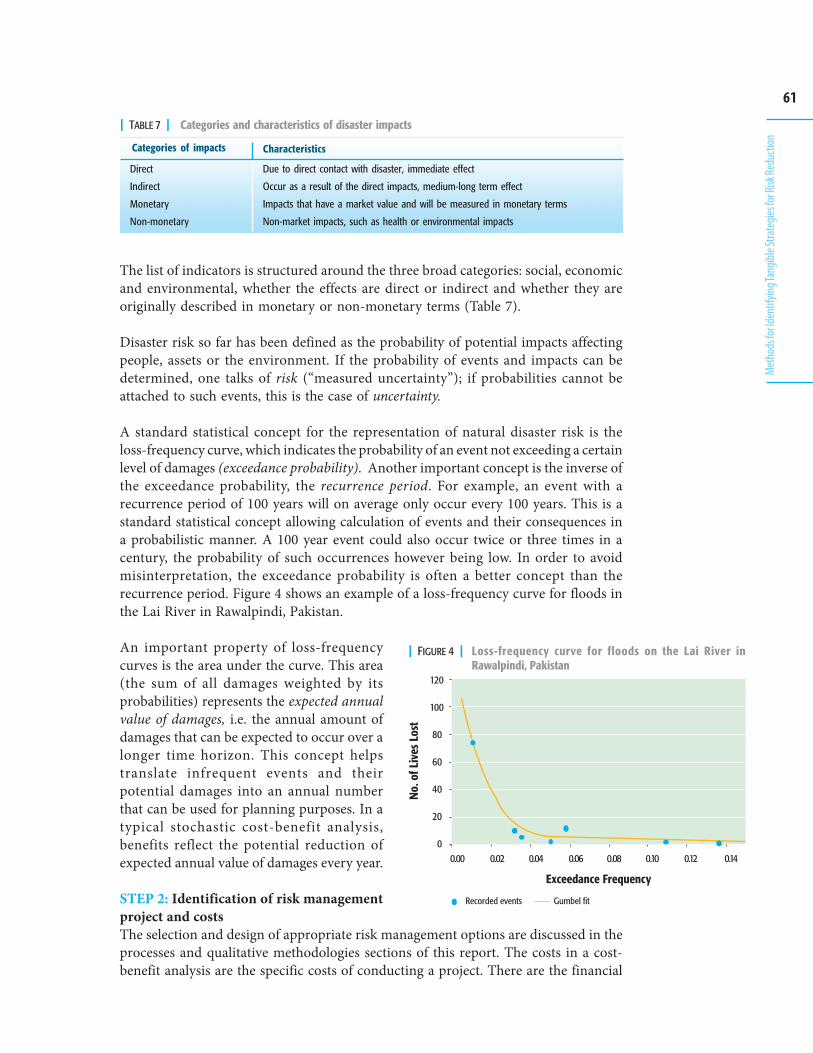
61
Meth
ods f
or Id
entif
ying T
angib
le St
rateg
ies fo
r Risk
Redu
ction
The list of indicators is structured around the three broad categories: social, economicand environmental, whether the effects are direct or indirect and whether they areoriginally described in monetary or non-monetary terms (Table 7).
Disaster risk so far has been defined as the probability of potential impacts affectingpeople, assets or the environment. If the probability of events and impacts can bedetermined, one talks of risk (“measured uncertainty”); if probabilities cannot beattached to such events, this is the case of uncertainty.
A standard statistical concept for the representation of natural disaster risk is theloss-frequency curve, which indicates the probability of an event not exceeding a certainlevel of damages (exceedance probability). Another important concept is the inverse ofthe exceedance probability, the recurrence period. For example, an event with arecurrence period of 100 years will on average only occur every 100 years. This is astandard statistical concept allowing calculation of events and their consequences ina probabilistic manner. A 100 year event could also occur twice or three times in acentury, the probability of such occurrences however being low. In order to avoidmisinterpretation, the exceedance probability is often a better concept than therecurrence period. Figure 4 shows an example of a loss-frequency curve for floods inthe Lai River in Rawalpindi, Pakistan.
An important property of loss-frequencycurves is the area under the curve. This area(the sum of all damages weighted by itsprobabilities) represents the expected annualvalue of damages, i.e. the annual amount ofdamages that can be expected to occur over alonger time horizon. This concept helpstranslate infrequent events and theirpotential damages into an annual numberthat can be used for planning purposes. In atypical stochastic cost-benefit analysis,benefits reflect the potential reduction ofexpected annual value of damages every year.
STEP 2: Identification of risk managementproject and costsThe selection and design of appropriate risk management options are discussed in theprocesses and qualitative methodologies sections of this report. The costs in a cost-benefit analysis are the specific costs of conducting a project. There are the financial
Categories of impacts Characteristics
Direct
Indirect
Monetary
Non-monetary
Due to direct contact with disaster, immediate effect
Occur as a result of the direct impacts, medium-long term effect
Impacts that have a market value and will be measured in monetary terms
Non-market impacts, such as health or environmental impacts
| TABLE 7 | Categories and characteristics of disaster impacts
| FIGURE 4 | Loss-frequency curve for floods on the Lai River inRawalpindi, Pakistan
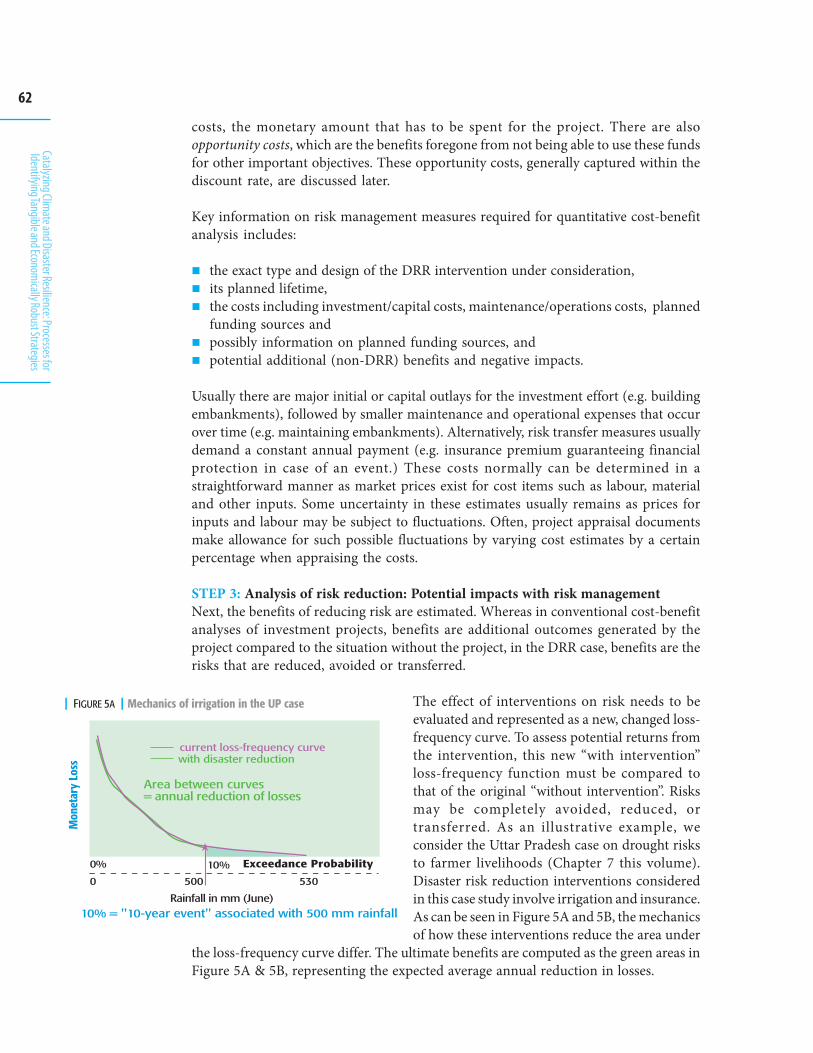
62
Catalyzing Climate and Disaster Resilience: Processes for
Identifying Tangible and Economically Robust Strategies
costs, the monetary amount that has to be spent for the project. There are alsoopportunity costs, which are the benefits foregone from not being able to use these fundsfor other important objectives. These opportunity costs, generally captured within thediscount rate, are discussed later.
Key information on risk management measures required for quantitative cost-benefitanalysis includes:
the exact type and design of the DRR intervention under consideration,its planned lifetime,the costs including investment/capital costs, maintenance/operations costs, plannedfunding sources andpossibly information on planned funding sources, andpotential additional (non-DRR) benefits and negative impacts.
Usually there are major initial or capital outlays for the investment effort (e.g. buildingembankments), followed by smaller maintenance and operational expenses that occurover time (e.g. maintaining embankments). Alternatively, risk transfer measures usuallydemand a constant annual payment (e.g. insurance premium guaranteeing financialprotection in case of an event.) These costs normally can be determined in astraightforward manner as market prices exist for cost items such as labour, materialand other inputs. Some uncertainty in these estimates usually remains as prices forinputs and labour may be subject to fluctuations. Often, project appraisal documentsmake allowance for such possible fluctuations by varying cost estimates by a certainpercentage when appraising the costs.
STEP 3: Analysis of risk reduction: Potential impacts with risk managementNext, the benefits of reducing risk are estimated. Whereas in conventional cost-benefitanalyses of investment projects, benefits are additional outcomes generated by theproject compared to the situation without the project, in the DRR case, benefits are therisks that are reduced, avoided or transferred.
The effect of interventions on risk needs to beevaluated and represented as a new, changed loss-frequency curve. To assess potential returns fromthe intervention, this new “with intervention”loss-frequency function must be compared tothat of the original “without intervention”. Risksmay be completely avoided, reduced, ortransferred. As an illustrative example, weconsider the Uttar Pradesh case on drought risksto farmer livelihoods (Chapter 7 this volume).Disaster risk reduction interventions consideredin this case study involve irrigation and insurance.As can be seen in Figure 5A and 5B, the mechanicsof how these interventions reduce the area under
the loss-frequency curve differ. The ultimate benefits are computed as the green areas inFigure 5A & 5B, representing the expected average annual reduction in losses.
�����������������(��������������������������
����������%��)�������������&�����������������
���������������*+���,
��
����
���
��
-./�(�0-.%���������0���������������&�1..�����������
1..
./
. 12.
-./ ���������������������
| FIGURE 5A | Mechanics of irrigation in the UP case
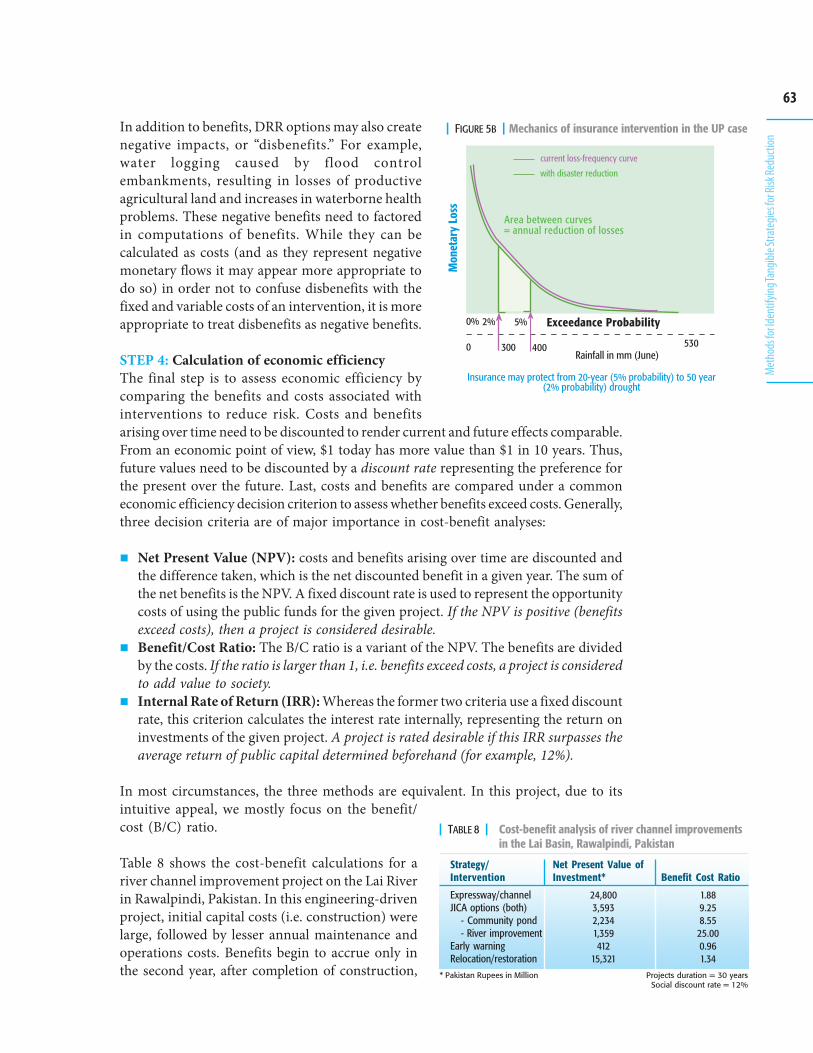
63
Meth
ods f
or Id
entif
ying T
angib
le St
rateg
ies fo
r Risk
Redu
ction
In addition to benefits, DRR options may also createnegative impacts, or “disbenefits.” For example,water logging caused by flood controlembankments, resulting in losses of productiveagricultural land and increases in waterborne healthproblems. These negative benefits need to factoredin computations of benefits. While they can becalculated as costs (and as they represent negativemonetary flows it may appear more appropriate todo so) in order not to confuse disbenefits with thefixed and variable costs of an intervention, it is moreappropriate to treat disbenefits as negative benefits.
STEP 4: Calculation of economic efficiencyThe final step is to assess economic efficiency bycomparing the benefits and costs associated withinterventions to reduce risk. Costs and benefitsarising over time need to be discounted to render current and future effects comparable.From an economic point of view, $1 today has more value than $1 in 10 years. Thus,future values need to be discounted by a discount rate representing the preference forthe present over the future. Last, costs and benefits are compared under a commoneconomic efficiency decision criterion to assess whether benefits exceed costs. Generally,three decision criteria are of major importance in cost-benefit analyses:
Net Present Value (NPV): costs and benefits arising over time are discounted andthe difference taken, which is the net discounted benefit in a given year. The sum ofthe net benefits is the NPV. A fixed discount rate is used to represent the opportunitycosts of using the public funds for the given project. If the NPV is positive (benefitsexceed costs), then a project is considered desirable.Benefit/Cost Ratio: The B/C ratio is a variant of the NPV. The benefits are dividedby the costs. If the ratio is larger than 1, i.e. benefits exceed costs, a project is consideredto add value to society.Internal Rate of Return (IRR): Whereas the former two criteria use a fixed discountrate, this criterion calculates the interest rate internally, representing the return oninvestments of the given project. A project is rated desirable if this IRR surpasses theaverage return of public capital determined beforehand (for example, 12%).
In most circumstances, the three methods are equivalent. In this project, due to itsintuitive appeal, we mostly focus on the benefit/cost (B/C) ratio.
Table 8 shows the cost-benefit calculations for ariver channel improvement project on the Lai Riverin Rawalpindi, Pakistan. In this engineering-drivenproject, initial capital costs (i.e. construction) werelarge, followed by lesser annual maintenance andoperations costs. Benefits begin to accrue only inthe second year, after completion of construction,
"����������������������3.%����*1/����������,����1.����*3/����������,���� &�
3/
�����������������(��������������������������
����������%��)����������
���&�����������������
��
����
���
��
2..
1/
���������������*+���,
./ ���������������������
. 4.. 12.
| FIGURE 5B | Mechanics of insurance intervention in the UP case
Strategy/Intervention
Expressway/channelJICA options (both)
- Community pond- River improvement
Early warningRelocation/restoration
Benefit Cost Ratio
1.889.258.55
25.000.961.34
| TABLE 8 | Cost-benefit analysis of river channel improvementsin the Lai Basin, Rawalpindi, Pakistan
Net Present Value ofInvestment*
24,8003,5932,2341,359412
15,321Projects duration = 30 years
Social discount rate = 12%* Pakistan Rupees in Million
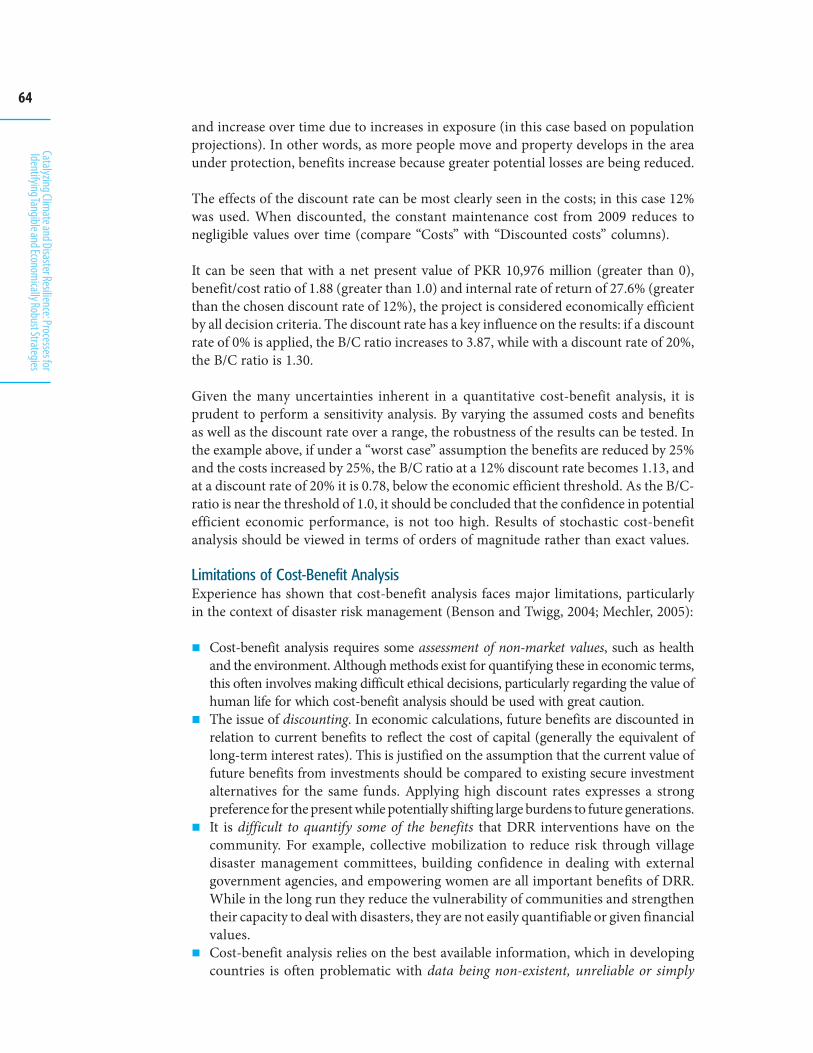
64
Catalyzing Climate and Disaster Resilience: Processes for
Identifying Tangible and Economically Robust Strategies
and increase over time due to increases in exposure (in this case based on populationprojections). In other words, as more people move and property develops in the areaunder protection, benefits increase because greater potential losses are being reduced.
The effects of the discount rate can be most clearly seen in the costs; in this case 12%was used. When discounted, the constant maintenance cost from 2009 reduces tonegligible values over time (compare “Costs” with “Discounted costs” columns).
It can be seen that with a net present value of PKR 10,976 million (greater than 0),benefit/cost ratio of 1.88 (greater than 1.0) and internal rate of return of 27.6% (greaterthan the chosen discount rate of 12%), the project is considered economically efficientby all decision criteria. The discount rate has a key influence on the results: if a discountrate of 0% is applied, the B/C ratio increases to 3.87, while with a discount rate of 20%,the B/C ratio is 1.30.
Given the many uncertainties inherent in a quantitative cost-benefit analysis, it isprudent to perform a sensitivity analysis. By varying the assumed costs and benefitsas well as the discount rate over a range, the robustness of the results can be tested. Inthe example above, if under a “worst case” assumption the benefits are reduced by 25%and the costs increased by 25%, the B/C ratio at a 12% discount rate becomes 1.13, andat a discount rate of 20% it is 0.78, below the economic efficient threshold. As the B/C-ratio is near the threshold of 1.0, it should be concluded that the confidence in potentialefficient economic performance, is not too high. Results of stochastic cost-benefitanalysis should be viewed in terms of orders of magnitude rather than exact values.
Limitations of Cost-Benefit AnalysisExperience has shown that cost-benefit analysis faces major limitations, particularlyin the context of disaster risk management (Benson and Twigg, 2004; Mechler, 2005):
Cost-benefit analysis requires some assessment of non-market values, such as healthand the environment. Although methods exist for quantifying these in economic terms,this often involves making difficult ethical decisions, particularly regarding the value ofhuman life for which cost-benefit analysis should be used with great caution.The issue of discounting. In economic calculations, future benefits are discounted inrelation to current benefits to reflect the cost of capital (generally the equivalent oflong-term interest rates). This is justified on the assumption that the current value offuture benefits from investments should be compared to existing secure investmentalternatives for the same funds. Applying high discount rates expresses a strongpreference for the present while potentially shifting large burdens to future generations.It is difficult to quantify some of the benefits that DRR interventions have on thecommunity. For example, collective mobilization to reduce risk through villagedisaster management committees, building confidence in dealing with externalgovernment agencies, and empowering women are all important benefits of DRR.While in the long run they reduce the vulnerability of communities and strengthentheir capacity to deal with disasters, they are not easily quantifiable or given financialvalues.Cost-benefit analysis relies on the best available information, which in developingcountries is often problematic with data being non-existent, unreliable or simply
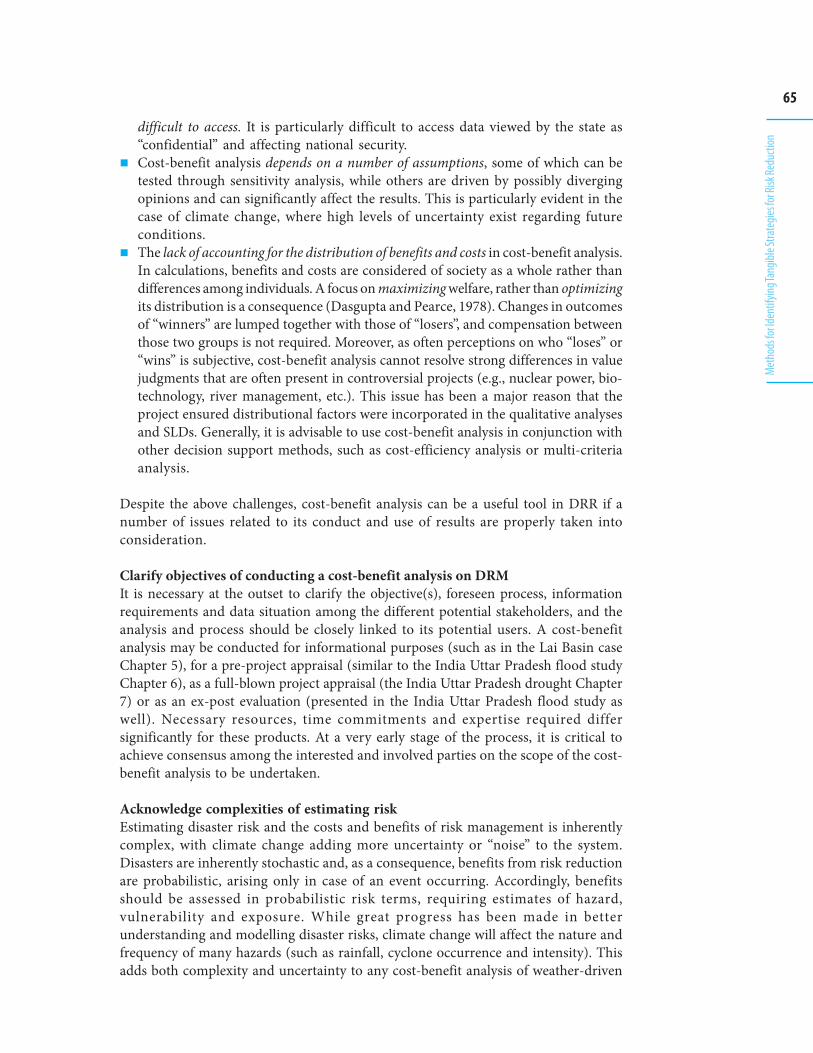
65
Meth
ods f
or Id
entif
ying T
angib
le St
rateg
ies fo
r Risk
Redu
ction
difficult to access. It is particularly difficult to access data viewed by the state as“confidential” and affecting national security.Cost-benefit analysis depends on a number of assumptions, some of which can betested through sensitivity analysis, while others are driven by possibly divergingopinions and can significantly affect the results. This is particularly evident in thecase of climate change, where high levels of uncertainty exist regarding futureconditions.The lack of accounting for the distribution of benefits and costs in cost-benefit analysis.In calculations, benefits and costs are considered of society as a whole rather thandifferences among individuals. A focus on maximizing welfare, rather than optimizingits distribution is a consequence (Dasgupta and Pearce, 1978). Changes in outcomesof “winners” are lumped together with those of “losers”, and compensation betweenthose two groups is not required. Moreover, as often perceptions on who “loses” or“wins” is subjective, cost-benefit analysis cannot resolve strong differences in valuejudgments that are often present in controversial projects (e.g., nuclear power, bio-technology, river management, etc.). This issue has been a major reason that theproject ensured distributional factors were incorporated in the qualitative analysesand SLDs. Generally, it is advisable to use cost-benefit analysis in conjunction withother decision support methods, such as cost-efficiency analysis or multi-criteriaanalysis.
Despite the above challenges, cost-benefit analysis can be a useful tool in DRR if anumber of issues related to its conduct and use of results are properly taken intoconsideration.
Clarify objectives of conducting a cost-benefit analysis on DRMIt is necessary at the outset to clarify the objective(s), foreseen process, informationrequirements and data situation among the different potential stakeholders, and theanalysis and process should be closely linked to its potential users. A cost-benefitanalysis may be conducted for informational purposes (such as in the Lai Basin caseChapter 5), for a pre-project appraisal (similar to the India Uttar Pradesh flood studyChapter 6), as a full-blown project appraisal (the India Uttar Pradesh drought Chapter7) or as an ex-post evaluation (presented in the India Uttar Pradesh flood study aswell). Necessary resources, time commitments and expertise required differsignificantly for these products. At a very early stage of the process, it is critical toachieve consensus among the interested and involved parties on the scope of the cost-benefit analysis to be undertaken.
Acknowledge complexities of estimating riskEstimating disaster risk and the costs and benefits of risk management is inherentlycomplex, with climate change adding more uncertainty or “noise” to the system.Disasters are inherently stochastic and, as a consequence, benefits from risk reductionare probabilistic, arising only in case of an event occurring. Accordingly, benefitsshould be assessed in probabilistic risk terms, requiring estimates of hazard,vulnerability and exposure. While great progress has been made in betterunderstanding and modelling disaster risks, climate change will affect the nature andfrequency of many hazards (such as rainfall, cyclone occurrence and intensity). Thisadds both complexity and uncertainty to any cost-benefit analysis of weather-driven
66
Catalyzing Climate and Disaster Resilience: Processes for
Identifying Tangible and Economically Robust Strategies
risk management, due to the inherent difficulties of modelling the climatic system andanthropogenic interventions.
Probabilistic estimates of future disaster risk incorporating climate changeconsiderations may sometimes not be possible due to a lack of reliable information.Even with sound understanding of the system as a whole, analysis relevant for DRRand cost-benefit analysis can also be difficult due to lack of expertise and operationalresources. Methodological shortcuts often have to be applied to arrive at a broaderunderstanding of key risks and benefits of DRR. These specific challenges andcharacteristics of DRR need to be transparently communicated and clearly understoodin order to properly interpret results derived in a cost-benefit analysis.
Process-orientationGiven the complexities involved in estimating the costs and benefits of DRR and thehistorical and current usage of cost-benefit analysis as a decision support tool, itseems appropriate to conclude that the focus should be strongly on process ratherthan outcome. Cost-benefit analysis is a useful tool for organizing, assessing andfinally presenting the cost and benefits, and pros and cons of interventions, and itdemands a coherent methodological, transparent approach. Yet, given the difficultiesof properly accounting for extreme event risk and climate change, cost-benefit analysisis likely not as well suited to be employed as a purely outcome-oriented tool in DRR,at least in environments where data are limited—a common case in developmentcooperation. The evaluative process involved in conducting a cost-benefit analysis isgenerally more important and more reliable as a basis for decision-making than thefinal computed benefit-cost ratios.
If this is properly understood, the key role it can play in DRR becomes clear. In manyways, cost-benefit analysis represents a process for organizing and evaluatinginformation on interventions to reduce risk in ways that can lead to commonunderstanding and provide a basis for decision-making. To achieve this, however,organization of the process is as important as the analytical results it generates. SLDsfacilitate this process, by bringing together the perspectives of diverse community,expert and government groups, and can be used to assess uncertainties and buildawareness and ownership of the results from the analysis. SLDs can also be used torefine and bound assumptions of disaster impacts, valuations, and utility ofinterventions. SLDs provide perhaps the best avenue of assessing many of the variableswhere quantitative data are lacking or insufficient.

67
Meth
ods f
or Id
entif
ying T
angib
le St
rateg
ies fo
r Risk
Redu
ction
The steps outlined in this methodology summary represent a systematic process fortranslating broad concepts of disaster risk reduction into tangible strategies wheretheir economic viability can be evaluated. As highlighted here, cost-benefit analysisshould be viewed not as a “stand alone” activity but rather as part of a larger processof decision-making. The numerical results from cost-benefit analysis can be misleadingand inappropriate to utilize for decision-making unless they emerge from such aprocess. That is, in cost-benefit analyses of disaster risk management, assumptionsmust be made, data must be evaluated and uncertainties are likely to be high. This isparticularly true in the case of weather related disasters where the impacts of climatechange at a local level are poorly known and inherently have high levels of uncertainty.In addition, ethical decisions must often be made regarding who benefits and whobears the cost of interventions. As a result, utilizing the results of cost-benefit analysisas a basis for decision-making requires understanding and appreciation for the nuancesinherent in the analysis. Overall, cost-benefit analysis needs to involve a larger processinvolving extensive stakeholder involvement that moves from initial assessment, toanalysis of vulnerability and initial qualitative evaluation of potential risk managementstrategies, to more quantitative techniques. To put this in another way, the processinvolved in conducting a cost-benefit analysis is of more utility as a basis for decision-making than the final computed benefit-cost ratios or rates of return.
That said, it is important to emphasize that the suite of methods presented here,including quantitative cost-benefit analysis, represent powerful tools for translatingbroad concepts for DRR into practical strategies that can be justified on a combinationof economic and other grounds. Shared learning dialogues provide a framework forincrementally building shared understanding of the nature of risk and the types ofinterventions that might be undertaken to reduce it. Supporting this type of dialoguewith inputs that move progressively from qualitative to more quantitative forms ofevaluation enables learning and the gradual evolution of shared understanding.Furthermore, particularly when systematic approaches to vulnerability analysis areused, strategies can be targeted at the communities that are most at risk and mostlikely to benefit from different interventions. Qualitative evaluation methods canenhance understanding of societal perceptions of disaster risk strategies, anddistributional effects within and among communities. Quantitative techniques for
Conclusions
68
Catalyzing Climate and Disaster Resilience: Processes for
Identifying Tangible and Economically Robust Strategies
climate downscaling and cost-benefit analysis scenario generation can enable groupsto understand the implications of different strategies even given the high levels ofuncertainty that exist concerning future conditions. This is absolutely central if societyis to develop approaches to risk reduction and adaptation that are robust in relationto the wide arrange of directions in which climate conditions can evolve. As a result,the methodologies outlined in this summary can be critical in developing effectiveand equitable responses to hazards including those emerging as a consequence ofclimate change.
69
Meth
ods f
or Id
entif
ying T
angib
le St
rateg
ies fo
r Risk
Redu
ction
ActionAid (2005) Participatory Vulnerability Analysis: A Step by Step Guide for Field Staff. London:ActionAid International.
Anderson, M. and P. Woodrow (1989) Rising from the Ashes: Development Strategies in Times ofDisasters. London: Westview Press.
Benson, C. and J. Twigg (2004) “Measuring Mitigation”: Methodologies for Assessing Natural HazardRisks and the Net Benefits of Mitigation - A Scoping Study. Geneva: InternationalFederation of the Red Cross and Red Crescent Societies, ProVention Consortium.
Christensen, J.H., et al. (2007) ‘Regional Climate Projections’ in S. Solomon, D. Qin, M. Manning,Z. Chen, M. Marquis, K.B. Avery, M. Tignor and H.L. Miller (eds), Climate Change2007: The Physical Science Basis, Contribution of Working Group I to the FourthAssessment Report of the Intergovernmental Panel on Climate Change. Cambridge,UK: Cambridge University Press.
Gangopadhyay, S., et al. (2005) ‘Statistical downscaling using K-nearest neighbors’, Water ResourcesResearch 41: W0204.
Gosain, A.K., et al. (2006) ‘Climate change impact assessment on hydrology of Indian river basins’,Current Science 90(3): 346-353.
Hewitt, K. (ed.) (1983) Interpretations of Calamity. Winchester, MA: Allen & Unwin Inc.
Hoyois, P. and D. Guha-Sapir (2004) ‘Disasters caused by flood: Preliminary data for a 30 yearassessment of their occurrence and human impact’. Paper presented at the Healthand Flood Risk Workshop; A Strategic Assessment of Adaptation Processes andPolicies, International workshop, Tyndall Centre for Climate Change Research,University of East Anglia, Norwich (18-20 July).
IPCC (2000) Special Report on Emissions Scenarios. Nakicenovic, N. and Stuart, R. (eds). Cambridge,UK: Cambridge University Press.
IPCC Working Group II (2007) Climate Change 2007: Impacts, Adaptation and Vulnerability.Contribution of Working Group II to the Fourth Assessment Report of theIntergovernmental Panel on Climate Change. Cambridge, UK: Cambridge UniversityPress.
Kalnay, E., et al. (1996) ‘The NCEP/NCAR reanalysis 40-year project’, Bulletin of the AmericanMeteorological Society 77: 437-471.
Bibliography
70
Catalyzing Climate and Disaster Resilience: Processes for
Identifying Tangible and Economically Robust Strategies
Kripilani, R.H., et al. (2007) ‘South Asian summer monsoon precipitation variability: Coupledclimate model simulations and projections under IPCC AR4’, Theoretical and AppliedClimatology 90: 133-159.
Kumar, K.R., et al. (2006) ‘High-resolution climate change scenarios for India for the 21st century’,Current Science 90(3): 334-346.
Lewin, K. (1946) ‘Action Research and Minority Problems’, Journal of Social Issues 2(4): 34-46.
Luers, A.L. (2005) ‘The surface of vulnerability: An analytical framework for examiningenvironmental change’, Global Environmental Change 15: 214-223.
Luers, A.L., D.B. Lobell, L.S. Sklar, C.L. Addams, and P.A. Matson (2003) ‘A method for quantifyingvulnerability, applied to the agricultural system of the Yaqui Valley, Mexico’, GlobalEnvironmental Change 13, 255-267.
Mechler, R. (2005) ‘Cost-benefit analysis of natural disaster risk management in developingcountries’. GTZ Working paper. Eschborn, Germany: Deutsche Gesellschaft fuerTechnische Zusammenarbeit (GTZ).
Mustafa, D. (2004) ‘Reinforcing vulnerability? The disaster relief, recovery and response to the2001 flood Rawalpindi/Islamabad, Pakistan’, Environmental Hazards: Human andPolicy Dimensions 5(3/4): 71-82.
Mustafa, D. (2002) ‘To each according to his power? Access to irrigation water and vulnerability toflood hazard in Pakistan’, Environment and Planning D: Society and Space 20(6): 737-752.
Osborn, T.J., et al. (1999) ‘Evaluation of the North Atlantic Oscillation as simulated by a climatemodel’, Climate Dynamics 15, 685-702.
Trigo, R.M. and J.P. Palutikof (2001) ‘Precipitation Scenarios over Iberia: A Comparison betweenDirect GCM Output and Different Downscaling Techniques’, Journal of Climate 14:4422-4446.
Vincent, K. (2004) ‘Creating an index of social vulnerability to climate change in Africa’. TyndallCentre for Climate Research Working Paper 56. Norwich, UK: University of EastAnglia.
von Storch, H., B. Hewitson and L. Mearns (2000) ‘Review of Empirical Downscaling Techniques’,in Regional Climate Development under Global Warming, General Technical ReportNo. 4., Conference Proceedings, Torbjornrud, Norway.
Wisner, B., P. Blaikie, T. Cannon, and I. Davis (eds) (2004) At Risk: Natural Hazards, People’sVulnerability and Disaster. London and New York: Routledge.
Yates, D., et al. (2003) ‘A technique for generating regional climate scenarios using a nearest-neighbor algorithm’, Water Resources Research 39(7): 1199.
Downscaling Climate Informationin Data Limited Contexts:
Potential Changes in the Rohini Basin,Nepal and India
3C H A P T E R
Sarah Optiz-Stapleton (ISET)Subhrendu Gangopadhyay (University of Colorado, Boulder) &
The Risk to Resilience Study Team

72
Catalyzing Climate and Disaster Resilience: Processes for
Identifying Tangible and Economically Robust Strategies
73
Down
scalin
g Clim
ate I
nfor
mat
ion in
Data
Lim
ited C
onte
xts:
Pote
ntial
chan
ges in
the R
ohini
Basin
, Nep
al an
d Ind
ia
Introduction
Floods, droughts and other weather related disasters are major factors contributingto endemic poverty in regions such as South Asia, and this is likely to increase asclimate change proceeds. Disaster risk reduction interventions represent a majoravenue for responding to both existing flood and drought hazards and the increasesin these hazards likely to emerge as a consequence of climate change. Investments inrisk reduction are, however, difficult to economically justify unless their returns canbe assessed. Cost-benefit techniques are the primary set of economic tools throughwhich such assessments are currently made. The ability to make such assessmentsdepends on the availability of probabilistic information. We need to know the frequencywith which events such as floods and droughts will occur and we need to know themagnitude of such events. Such natural hazard information is generally not availableor is sparse, particularly at the local level in developing countries where the resourcesand abilities to collect weather and hydrologic data are limited. Yet, populations indeveloping countries are particularly vulnerable to weather related hazards and arelikely to be more negatively impacted by climate change than populations in developedcountries. Thus, it is critical to attempt to quantify the impacts of disaster riskreduction interventions in such areas as much as is possible.
The Rohini Basin, part of the larger Ganga Basin and straddling the border of Indiaand Nepal (Figure 1), is home to some of the poorest populations in the world.Populations in the Nepal Tarai and in the Indian state of Uttar Pradesh are particularlyaffected by weather related disasters (Moench and Dixit, 2004). Social, political andeconomic factors, in combination with geography, make this basin vulnerable toflooding during the monsoon months. During the 2007 monsoon, over 2 million inUttar Pradesh were adversely affected by floods through habitat loss, destruction ofvillages, inundation of cropland and livelihood disruption. Likewise, droughts in theregion are equally detrimental to agriculture and livelihoods. The combination of thetwo weather related hazards, almost on an annual basis, steadily erodes assets andlivelihoods in the basin and contributes to endemic poverty. This chapter highlightsthe challenges of accessing hydrometeorological data for a data-poor region (theRohini Basin) and the strengths and limitations of climate downscaling for assessingpotential climate change impacts in the basin.
74
Catalyzing Climate and Disaster Resilience: Processes for
Identifying Tangible and Economically Robust Strategies
Little published information exists on the hydrometeorological cycle of the RohiniBasin and none at all on potential basin-specific climate change impacts. Broadly, theIntergovernmental Panel on Climate Change (Christensen et al., 2007) estimates thataverage June-August precipitation throughout South Asia (defined as the region 50N,640E to 500N, 1000E – a region bordered by India in the south and Kazakhstan in theNorth, Pakistan in west and Burma in the east) will increase approximately 11%, aswill heavy precipitation events by 2099. This is an extremely large area (marked bydiverse precipitation and temperature regimes), with some areas dominated by themonsoon and others not experiencing the monsoon. The general circulation models’(GCMs) projections do not say how the precipitation will be spread throughout thearea or give consistent projections in changes to the timing of the precipitation. Actualclimate change impacts at smaller geographic scales, such as river basins like theRohini, are likely to be different than those aggregated at larger scales. This is due tothe fact that precipitation patterns vary greatly, even within small areas. Furthermore,such information is often not specific enough to be used in planning and implementingadaptation and disaster risk reduction measures. In order to effectively support suchmeasures, information about potential climate change impacts is needed at smallergeographic scales. Quantifying climate change impacts at smaller scales requirestranslating results from general circulation models.
General circulation models are complex computer models that simulate global weather(timescales under 10 days) and climate (anything over 10 days) patterns by modellingthe physical processes and interactions between the land, ocean, and the atmosphere.The horizontal grid resolution of GCMs is typically on the order of 100-200 km,insufficient to capture trends or make projections of potential climate change impactsat smaller scales, such as river basins. Furthermore, there are large discrepanciesamong precipitation estimates derived from the various GCMs utilized by the IPCC(Kripalani et al., 2007; Tolika et al., 2006). However, GCMs generally simulate large-scale climate fields, such as wind and humidity (Trigo and Palutikof, 2001; Osborn etal., 1999) quite well. Thus, the climate fields simulated by GCMs can be used to drivedownscaling models that simulate climate change impacts at smaller geographic scales.
Various downscaling techniques have been developed that attempt provide forecastsof potential climate change impacts at smaller scales, guided by output scenariosfrom GCMs (Dibike and Coulibaly, 2005; Gangopadhyay et al., 2005). The techniquesrange from numerical methods (for example, PRECIS developed by the UK HadleyCentre) and statistical techniques. Numerical methods forecast the physical responsesof an area (from regional-scale to global-scale) to various sets of inputs (e.g., soilmoisture or greenhouse gas concentrations). Numerical climate models run at anygeographic scale require large sets of reliable data; data that may not exist in developingcountry contexts such as the border region of Nepal and India. Statistical downscalingtechniques attempt to establish a statistical relationship between point source orsmaller, area-averaged (weather station) weather variables, such as precipitation orstreamflow, and large-scale climate fields such as wind or air pressure at differentatmospheric levels. The quantity that we are trying to predict (rainfall in the case ofthe Rohini Basin) is known as the predictand. The variables used to forecast the rainfallare known as predictors. We will use these definitions throughout the chapter.
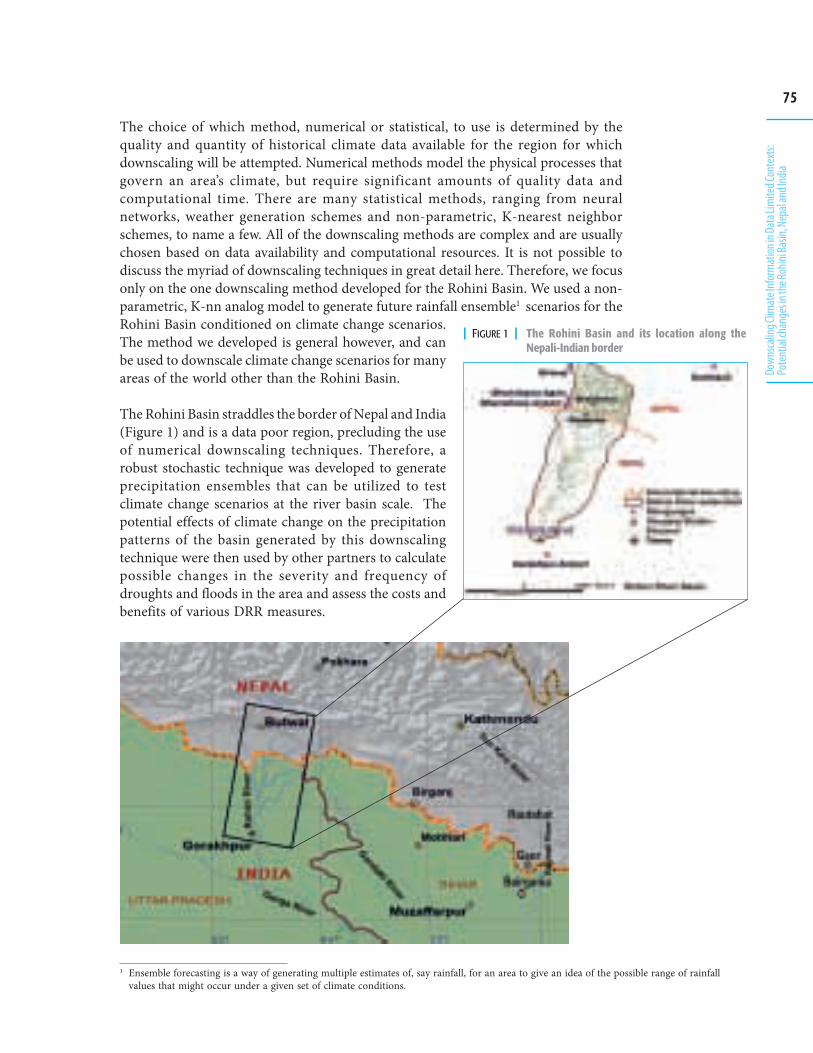
75
Down
scalin
g Clim
ate I
nfor
mat
ion in
Data
Lim
ited C
onte
xts:
Pote
ntial
chan
ges in
the R
ohini
Basin
, Nep
al an
d Ind
ia
The choice of which method, numerical or statistical, to use is determined by thequality and quantity of historical climate data available for the region for whichdownscaling will be attempted. Numerical methods model the physical processes thatgovern an area’s climate, but require significant amounts of quality data andcomputational time. There are many statistical methods, ranging from neuralnetworks, weather generation schemes and non-parametric, K-nearest neighborschemes, to name a few. All of the downscaling methods are complex and are usuallychosen based on data availability and computational resources. It is not possible todiscuss the myriad of downscaling techniques in great detail here. Therefore, we focusonly on the one downscaling method developed for the Rohini Basin. We used a non-parametric, K-nn analog model to generate future rainfall ensemble1 scenarios for theRohini Basin conditioned on climate change scenarios.The method we developed is general however, and canbe used to downscale climate change scenarios for manyareas of the world other than the Rohini Basin.
The Rohini Basin straddles the border of Nepal and India(Figure 1) and is a data poor region, precluding the useof numerical downscaling techniques. Therefore, arobust stochastic technique was developed to generateprecipitation ensembles that can be utilized to testclimate change scenarios at the river basin scale. Thepotential effects of climate change on the precipitationpatterns of the basin generated by this downscalingtechnique were then used by other partners to calculatepossible changes in the severity and frequency ofdroughts and floods in the area and assess the costs andbenefits of various DRR measures.
| FIGURE 1 | The Rohini Basin and its location along theNepali-Indian border
1 Ensemble forecasting is a way of generating multiple estimates of, say rainfall, for an area to give an idea of the possible range of rainfallvalues that might occur under a given set of climate conditions.
76
Catalyzing Climate and Disaster Resilience: Processes for
Identifying Tangible and Economically Robust Strategies
We must caution, however, that while the downscaling method here is robust and theresults can provide key insights into potential climate change impacts, the predictionsare just that, predictions. Our confidence in the climate change projections is limitedby the quality and quantity of historical data available for the Rohini Basin. We canpresent the probabilities with which we think various amounts of rain might fall anddescribe the amount of variability that we might see in the future. Quantifying ourconfidence in the projections is a little more difficult. Nonetheless, we are extremelyconfident that climate change is impacting and will continue to impact thehydrometeorological cycle of the Rohini Basin. While we cannot be certain which ofour climate change projections will come true, the collection of projections point tospecific trends in the timing and amount of precipitation in the basin that can be usedin disaster risk and cost-benefit analysis.
The chapter is organized in the following manner: First we describe the Rohini Basin’shydrometeorological characteristics. We then discuss the data collected, the processthrough which data were collected and analyzed, and the limitations to our datasets.We then present the model methodology and assess the skill of the model over atraining period. Finally, we make the climate change projections and interpret theprojections within the limitations of the historical data. The majority of the chapter isslightly technical in nature, as it describes data characteristics, the physicalrelationships that govern the Rohini’s precipitation and the model. The discussion ofthe climate change projections and their limitations is not as technical.
The Rohini Basin
The Rohini Basin is relatively small, with a catchment area of 2701 km2 that straddlesthe borders of Nepal and India (1943 km2 in India and 758 km2 in Nepal). The basin liesjust south of the Himalayan Range, which rises to 8000 m in less than 100 km from thebasin. Precipitation patterns in the basin are strongly linked with the seasons and fallsalways as rain (as opposed to snow). While only 30% of the total catchment area lieswithin Nepal, the majority of the rain that feeds the basin falls within the headwaterreaches in Nepal (Dixit et al., 2007; NWCF, 2006). There are strong geographic rainfallgradients in the basin, largely controlled by orography and the angle at whichmonsoon storm tracks impinge upon land features. Evidence suggests that even acrosssmall scales (>100 km) areas on the upwind side of land features (e.g. hills and ridges)will receive considerably more precipitation than areas on the downwind side (Barrosand Lang, 2003). The average annual precipitation for the Nepali portion of the basinis approximately 2100 mm compared with 1000-1200 mm in Gorakhpur district onthe Indian side of the basin (India Water Portal, 2008).
Nearly 90% of the basin’s annual precipitation falls from roughly mid-June throughmid-September (Figure 2) and is associated with the larger South Asian Monsoon.The South Asian Monsoon is an annual pattern of increased rainfall over South Asia,typically beginning around late May and ending in September2 . The monsoon is a
2 The exact timing of monsoon onset and termination depends on the location. For the Rohini Basin, the monsoon typically begins aroundmid-June and ends mid-September. There is, however, considerable variation each year.
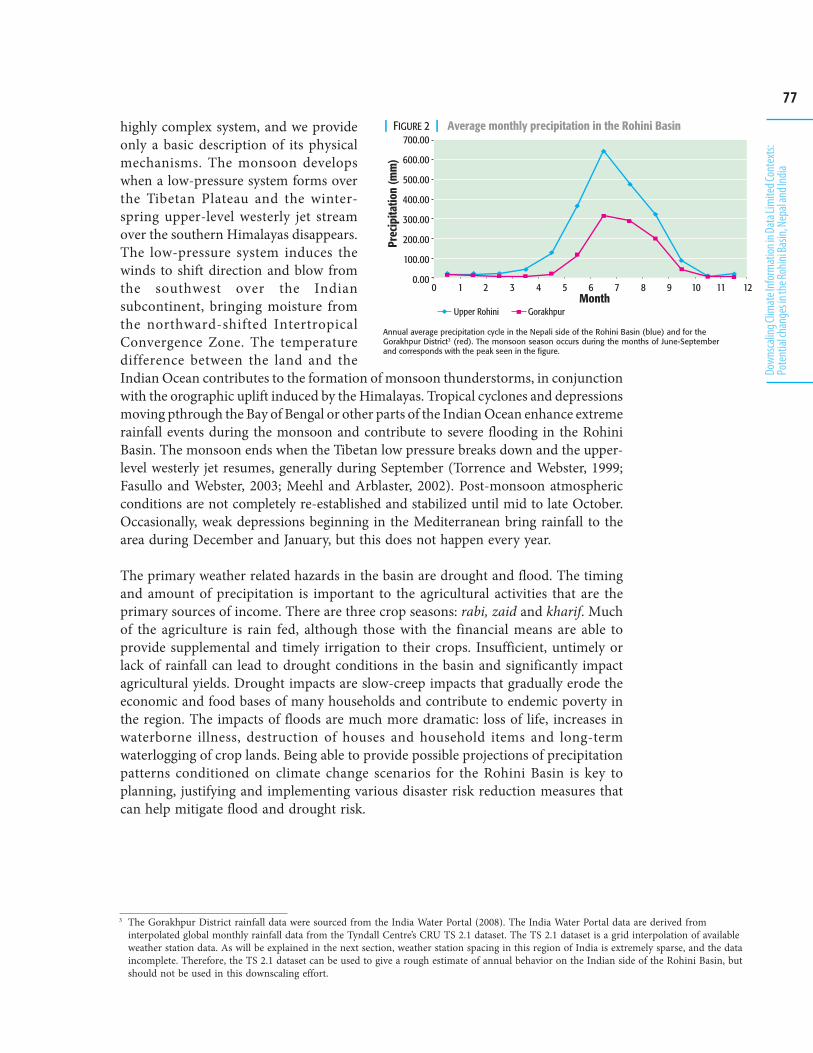
77
Down
scalin
g Clim
ate I
nfor
mat
ion in
Data
Lim
ited C
onte
xts:
Pote
ntial
chan
ges in
the R
ohini
Basin
, Nep
al an
d Ind
ia
highly complex system, and we provideonly a basic description of its physicalmechanisms. The monsoon developswhen a low-pressure system forms overthe Tibetan Plateau and the winter-spring upper-level westerly jet streamover the southern Himalayas disappears.The low-pressure system induces thewinds to shift direction and blow fromthe southwest over the Indiansubcontinent, bringing moisture fromthe northward-shifted IntertropicalConvergence Zone. The temperaturedifference between the land and theIndian Ocean contributes to the formation of monsoon thunderstorms, in conjunctionwith the orographic uplift induced by the Himalayas. Tropical cyclones and depressionsmoving pthrough the Bay of Bengal or other parts of the Indian Ocean enhance extremerainfall events during the monsoon and contribute to severe flooding in the RohiniBasin. The monsoon ends when the Tibetan low pressure breaks down and the upper-level westerly jet resumes, generally during September (Torrence and Webster, 1999;Fasullo and Webster, 2003; Meehl and Arblaster, 2002). Post-monsoon atmosphericconditions are not completely re-established and stabilized until mid to late October.Occasionally, weak depressions beginning in the Mediterranean bring rainfall to thearea during December and January, but this does not happen every year.
The primary weather related hazards in the basin are drought and flood. The timingand amount of precipitation is important to the agricultural activities that are theprimary sources of income. There are three crop seasons: rabi, zaid and kharif. Muchof the agriculture is rain fed, although those with the financial means are able toprovide supplemental and timely irrigation to their crops. Insufficient, untimely orlack of rainfall can lead to drought conditions in the basin and significantly impactagricultural yields. Drought impacts are slow-creep impacts that gradually erode theeconomic and food bases of many households and contribute to endemic poverty inthe region. The impacts of floods are much more dramatic: loss of life, increases inwaterborne illness, destruction of houses and household items and long-termwaterlogging of crop lands. Being able to provide possible projections of precipitationpatterns conditioned on climate change scenarios for the Rohini Basin is key toplanning, justifying and implementing various disaster risk reduction measures thatcan help mitigate flood and drought risk.
Annual average precipitation cycle in the Nepali side of the Rohini Basin (blue) and for theGorakhpur District3 (red). The monsoon season occurs during the months of June-Septemberand corresponds with the peak seen in the figure.
| FIGURE 2 | Average monthly precipitation in the Rohini Basin������
������
������
������
������
������
�����
����
�����
������
��� ��
��
� � � � � � � � ��
� ��������� ������ ��
3 The Gorakhpur District rainfall data were sourced from the India Water Portal (2008). The India Water Portal data are derived frominterpolated global monthly rainfall data from the Tyndall Centre’s CRU TS 2.1 dataset. The TS 2.1 dataset is a grid interpolation of availableweather station data. As will be explained in the next section, weather station spacing in this region of India is extremely sparse, and the dataincomplete. Therefore, the TS 2.1 dataset can be used to give a rough estimate of annual behavior on the Indian side of the Rohini Basin, butshould not be used in this downscaling effort.
78
Catalyzing Climate and Disaster Resilience: Processes for
Identifying Tangible and Economically Robust Strategies
Datasets and Assumptions
Rainfall DataThe most important aspect of downscaling climate change scenarios to smaller scalesis the selection of relevant data. As mentioned in the introduction, the IPCC projectionscover an extremely large geographic area encompassing the highest mountain rangein the world, deserts and rainforest. The Rohini Basin, though tiny in comparison,still has a remarkable north-south rainfall gradient in which small perturbations inprecipitation can have large effects. Thus, selecting data that captures the long-termhistorical variability of an area is critical to making confident projections of potentialclimate changes. However, in many parts of the world, data records are of insufficientlength and are incomplete with little to no information on how the data are collectedand verified. This implies that downscaled models for certain regions are compromisedfrom the beginning of the effort. Despite these limitations, it is still possible to makeprojections about general trends in precipitation and temperature that can be usefulin DRR efforts.
Obtaining daily precipitation data of sufficient historical length for the basin wasextremely difficult. ISET-Nepal was able to purchase complete, primary rainfall datafor five weather stations in the basin for the period 1976-2006. The validity of thedatasets cannot, however, be verified. The Nepal Department of Hydrology andMeteorology informed us that significant sets of missing rainfall data had been back-estimated. Thus, there are potential flaws in the Nepali datasets that cannot be verifiedor corrected because of lack of information.
There are only two weather stations on the Indian side, one at Gorakhpur Airport andone in the Nautanwa Block. Purchasing datasets for Nautanwa and Gorakhpur Airportfrom the Indian Government was beyond the scope of the budget allocated for thisproject. The Nautanwa station data, even though an extremely incomplete record,would have cost INR 50,000 or roughly USD 1,600 (at the time) to access. In the end,due to cost limitations, no datasets for India were purchased or utilized in thedownscaling model.
We attempted to acquire Indian rainfall data and to verify the Nepali data from othersources. Supplemental data was acquired for Bhairhawa Airport (Nepal) andGorakhpur Airport (India) from the National Climate Data Center (NCDC) for theperiods of 1977-2006 and 1954-2006. Roughly 35% (excluding the 1960’s and ‘70’s,which were almost completely missing) of the NCDC dataset for Gorakhpur Airportwas missing and could not be filled using traditional hydrology methods because wehad no other datasets for stations on the Indian side. Nor were we willing to backfillthe Gorakhpur data using a weather generator because the spotty sample we had didnot capture the long-term climatological variability possible at that location. TheNCDC dataset for Bhairhawa Airport was used to fill gaps in the Bhairhawa Airportset compiled by ISET-Nepal and to check the validity of the dataset. The two datasetswere strongly correlated at 0.98, which is to be expected as NCDC relies on thegovernment reported data as well. Thus, no Indian rainfall stations were included in
79
Down
scalin
g Clim
ate I
nfor
mat
ion in
Data
Lim
ited C
onte
xts:
Pote
ntial
chan
ges in
the R
ohini
Basin
, Nep
al an
d Ind
ia
this modelling effort, which makes it difficult to project potential climate change impactson the Indian side of the basin. The lack of Indian rainfall data presents a severelimitation of the model’s ability to accurately make predictions of potential climatechange impacts in the Rohini Basin.
All of the Nepali stations, except Dumakauli, lie within the catchment area of the river.Dumakauli is not in the basin, but it is extremely close and its precipitation patternsare similar to the other stations in the basin both in amount and timing. Due to thelimited amount of rainfall data and the geographic distribution of raingauges in thebasin, we felt it necessary to include Dumakauli in model predictions. Less than 3% ofthe data were missing for any given year from each of the Nepali stations over theperiod of 1976-2006. Daily precipitation values were aggregated to obtain monthlyrainfall totals for each of the five stations for the 31-year timeframe. While 31years ofdata might seem sufficient, this cannot be discerned until the model is run for a testperiod and the results verified over the test period.
The model was run for two separate time periods, 1976 to 2006 and 2007 to 2050. Thefirst time period formed the testing phase of the model, during which we could see howwell the model was able to replicate past precipitation patterns and quantify the model’sstrengths and weaknesses. It is through the testing phase that we were also able toverify the data limitations. While there are some differences in the precipitation patternsbetween the stations on the Nepal side, the five stations’ rainfalls were correlated wellenough to justify using the five station-averaged monthly rainfall to test the model.The actual downscaling of climate change scenarios for the period 2007-2050 wasdone separately for each station.
Large-scale climate dataOnce rainfall data were collected for the basin, we began searching for the appropriatelarge-scale climate features that relate to the basin’s rainfall. Large-scale climate fieldpredictors for this study were obtained from the NCEP/NCAR reanalysis archive(Kalnay et al., 1996). Much of the rainfall associated with the monsoon is due tothunderstorm (convective) activity over the basin embedded within the extra-tropicalmonsoon waves moving off the Bay of Bengal. The processes governing convectiveactivity are complex and we chose a simplified set of physical mechanisms that giverise to convection. Selection of large-scale climate fields is governed by two sets ofassumptions that determine the physical relationship between the local variable(rainfall) and the large-scale variables. The first set is based on the necessaryatmospheric conditions that allow for convective activity on which most of the Rohini’srainfall is based:
1) changes in air pressure that lead to atmospheric instability (measured throughgeopotential height)
2) moist air (measured through specific humidity)3) warm air (measured through air temperature)4) a transport mechanism to move the warm, moist air (measured through meridional
and zonal winds)
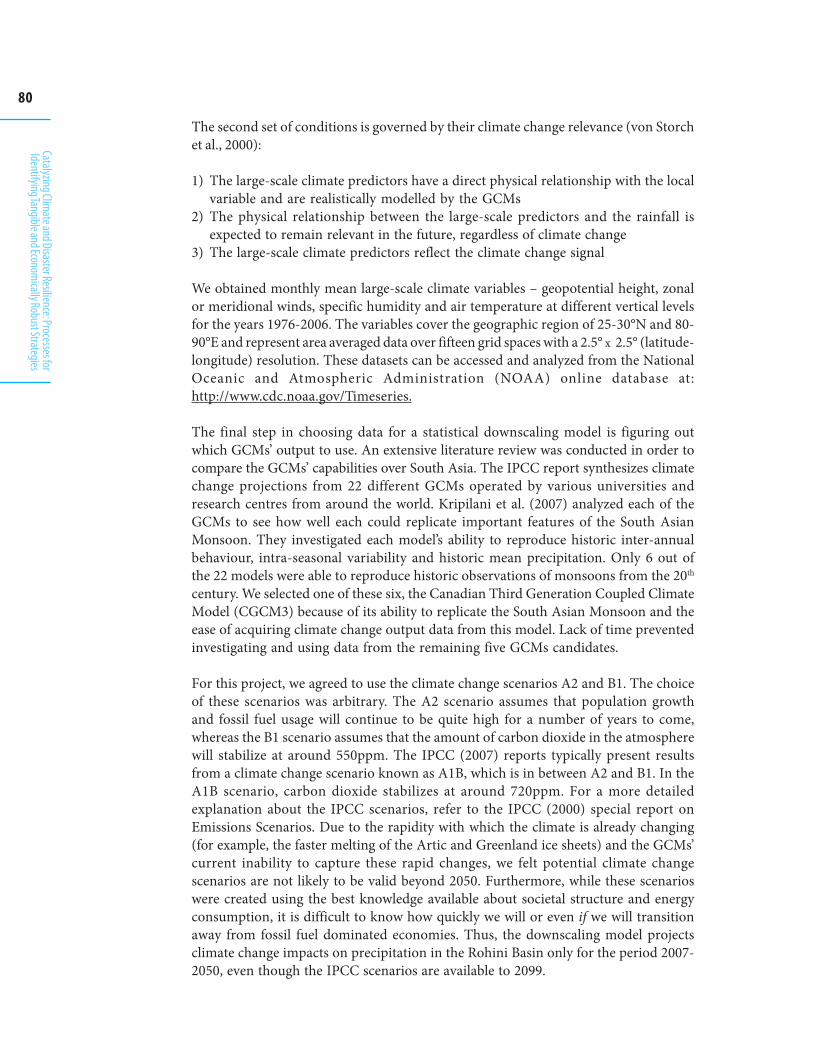
80
Catalyzing Climate and Disaster Resilience: Processes for
Identifying Tangible and Economically Robust Strategies
The second set of conditions is governed by their climate change relevance (von Storchet al., 2000):
1) The large-scale climate predictors have a direct physical relationship with the localvariable and are realistically modelled by the GCMs
2) The physical relationship between the large-scale predictors and the rainfall isexpected to remain relevant in the future, regardless of climate change
3) The large-scale climate predictors reflect the climate change signal
We obtained monthly mean large-scale climate variables – geopotential height, zonalor meridional winds, specific humidity and air temperature at different vertical levelsfor the years 1976-2006. The variables cover the geographic region of 25-30°N and 80-90°E and represent area averaged data over fifteen grid spaces with a 2.5° x 2.5° (latitude-longitude) resolution. These datasets can be accessed and analyzed from the NationalOceanic and Atmospheric Administration (NOAA) online database at:http://www.cdc.noaa.gov/Timeseries.
The final step in choosing data for a statistical downscaling model is figuring outwhich GCMs’ output to use. An extensive literature review was conducted in order tocompare the GCMs’ capabilities over South Asia. The IPCC report synthesizes climatechange projections from 22 different GCMs operated by various universities andresearch centres from around the world. Kripilani et al. (2007) analyzed each of theGCMs to see how well each could replicate important features of the South AsianMonsoon. They investigated each model’s ability to reproduce historic inter-annualbehaviour, intra-seasonal variability and historic mean precipitation. Only 6 out ofthe 22 models were able to reproduce historic observations of monsoons from the 20th
century. We selected one of these six, the Canadian Third Generation Coupled ClimateModel (CGCM3) because of its ability to replicate the South Asian Monsoon and theease of acquiring climate change output data from this model. Lack of time preventedinvestigating and using data from the remaining five GCMs candidates.
For this project, we agreed to use the climate change scenarios A2 and B1. The choiceof these scenarios was arbitrary. The A2 scenario assumes that population growthand fossil fuel usage will continue to be quite high for a number of years to come,whereas the B1 scenario assumes that the amount of carbon dioxide in the atmospherewill stabilize at around 550ppm. The IPCC (2007) reports typically present resultsfrom a climate change scenario known as A1B, which is in between A2 and B1. In theA1B scenario, carbon dioxide stabilizes at around 720ppm. For a more detailedexplanation about the IPCC scenarios, refer to the IPCC (2000) special report onEmissions Scenarios. Due to the rapidity with which the climate is already changing(for example, the faster melting of the Artic and Greenland ice sheets) and the GCMs’current inability to capture these rapid changes, we felt potential climate changescenarios are not likely to be valid beyond 2050. Furthermore, while these scenarioswere created using the best knowledge available about societal structure and energyconsumption, it is difficult to know how quickly we will or even if we will transitionaway from fossil fuel dominated economies. Thus, the downscaling model projectsclimate change impacts on precipitation in the Rohini Basin only for the period 2007-2050, even though the IPCC scenarios are available to 2099.
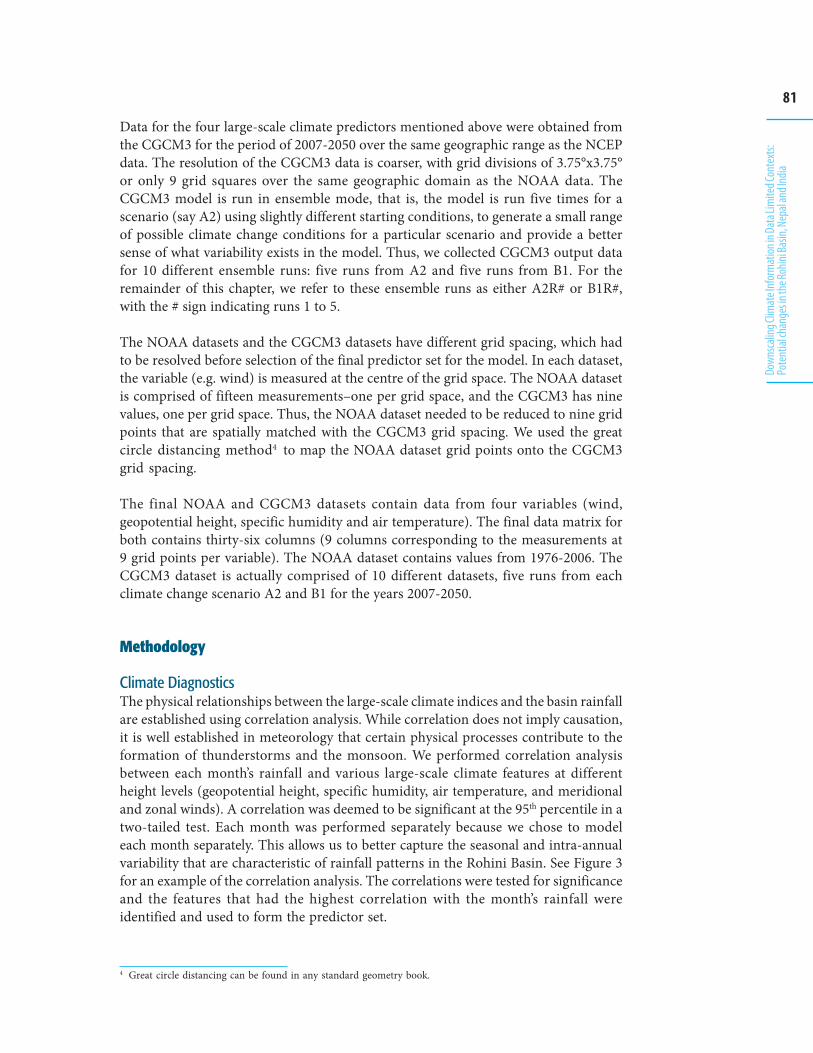
81
Down
scalin
g Clim
ate I
nfor
mat
ion in
Data
Lim
ited C
onte
xts:
Pote
ntial
chan
ges in
the R
ohini
Basin
, Nep
al an
d Ind
ia
Data for the four large-scale climate predictors mentioned above were obtained fromthe CGCM3 for the period of 2007-2050 over the same geographic range as the NCEPdata. The resolution of the CGCM3 data is coarser, with grid divisions of 3.75°x3.75°or only 9 grid squares over the same geographic domain as the NOAA data. TheCGCM3 model is run in ensemble mode, that is, the model is run five times for ascenario (say A2) using slightly different starting conditions, to generate a small rangeof possible climate change conditions for a particular scenario and provide a bettersense of what variability exists in the model. Thus, we collected CGCM3 output datafor 10 different ensemble runs: five runs from A2 and five runs from B1. For theremainder of this chapter, we refer to these ensemble runs as either A2R# or B1R#,with the # sign indicating runs 1 to 5.
The NOAA datasets and the CGCM3 datasets have different grid spacing, which hadto be resolved before selection of the final predictor set for the model. In each dataset,the variable (e.g. wind) is measured at the centre of the grid space. The NOAA datasetis comprised of fifteen measurements–one per grid space, and the CGCM3 has ninevalues, one per grid space. Thus, the NOAA dataset needed to be reduced to nine gridpoints that are spatially matched with the CGCM3 grid spacing. We used the greatcircle distancing method4 to map the NOAA dataset grid points onto the CGCM3grid spacing.
The final NOAA and CGCM3 datasets contain data from four variables (wind,geopotential height, specific humidity and air temperature). The final data matrix forboth contains thirty-six columns (9 columns corresponding to the measurements at9 grid points per variable). The NOAA dataset contains values from 1976-2006. TheCGCM3 dataset is actually comprised of 10 different datasets, five runs from eachclimate change scenario A2 and B1 for the years 2007-2050.
Methodology
Climate DiagnosticsThe physical relationships between the large-scale climate indices and the basin rainfallare established using correlation analysis. While correlation does not imply causation,it is well established in meteorology that certain physical processes contribute to theformation of thunderstorms and the monsoon. We performed correlation analysisbetween each month’s rainfall and various large-scale climate features at differentheight levels (geopotential height, specific humidity, air temperature, and meridionaland zonal winds). A correlation was deemed to be significant at the 95th percentile in atwo-tailed test. Each month was performed separately because we chose to modeleach month separately. This allows us to better capture the seasonal and intra-annualvariability that are characteristic of rainfall patterns in the Rohini Basin. See Figure 3for an example of the correlation analysis. The correlations were tested for significanceand the features that had the highest correlation with the month’s rainfall wereidentified and used to form the predictor set.
4 Great circle distancing can be found in any standard geometry book.
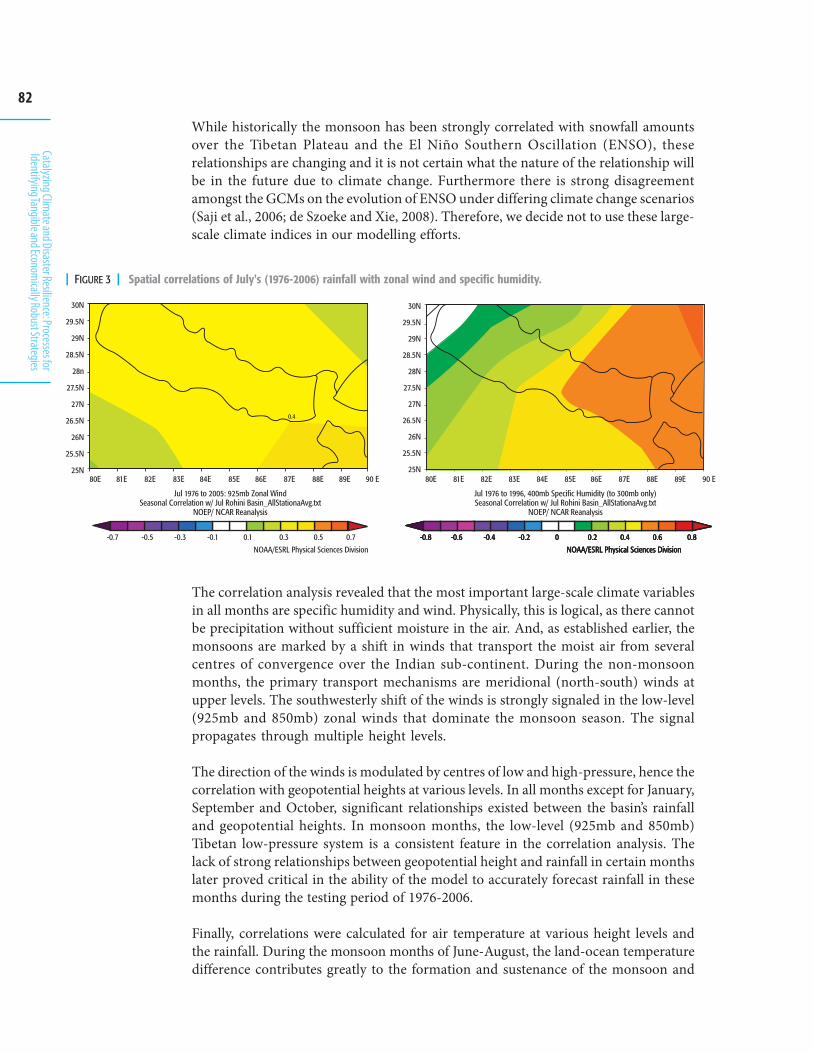
82
Catalyzing Climate and Disaster Resilience: Processes for
Identifying Tangible and Economically Robust Strategies
While historically the monsoon has been strongly correlated with snowfall amountsover the Tibetan Plateau and the El Niño Southern Oscillation (ENSO), theserelationships are changing and it is not certain what the nature of the relationship willbe in the future due to climate change. Furthermore there is strong disagreementamongst the GCMs on the evolution of ENSO under differing climate change scenarios(Saji et al., 2006; de Szoeke and Xie, 2008). Therefore, we decide not to use these large-scale climate indices in our modelling efforts.
The correlation analysis revealed that the most important large-scale climate variablesin all months are specific humidity and wind. Physically, this is logical, as there cannotbe precipitation without sufficient moisture in the air. And, as established earlier, themonsoons are marked by a shift in winds that transport the moist air from severalcentres of convergence over the Indian sub-continent. During the non-monsoonmonths, the primary transport mechanisms are meridional (north-south) winds atupper levels. The southwesterly shift of the winds is strongly signaled in the low-level(925mb and 850mb) zonal winds that dominate the monsoon season. The signalpropagates through multiple height levels.
The direction of the winds is modulated by centres of low and high-pressure, hence thecorrelation with geopotential heights at various levels. In all months except for January,September and October, significant relationships existed between the basin’s rainfalland geopotential heights. In monsoon months, the low-level (925mb and 850mb)Tibetan low-pressure system is a consistent feature in the correlation analysis. Thelack of strong relationships between geopotential height and rainfall in certain monthslater proved critical in the ability of the model to accurately forecast rainfall in thesemonths during the testing period of 1976-2006.
Finally, correlations were calculated for air temperature at various height levels andthe rainfall. During the monsoon months of June-August, the land-ocean temperaturedifference contributes greatly to the formation and sustenance of the monsoon and
| FIGURE 3 | Spatial correlations of July's (1976-2006) rainfall with zonal wind and specific humidity.
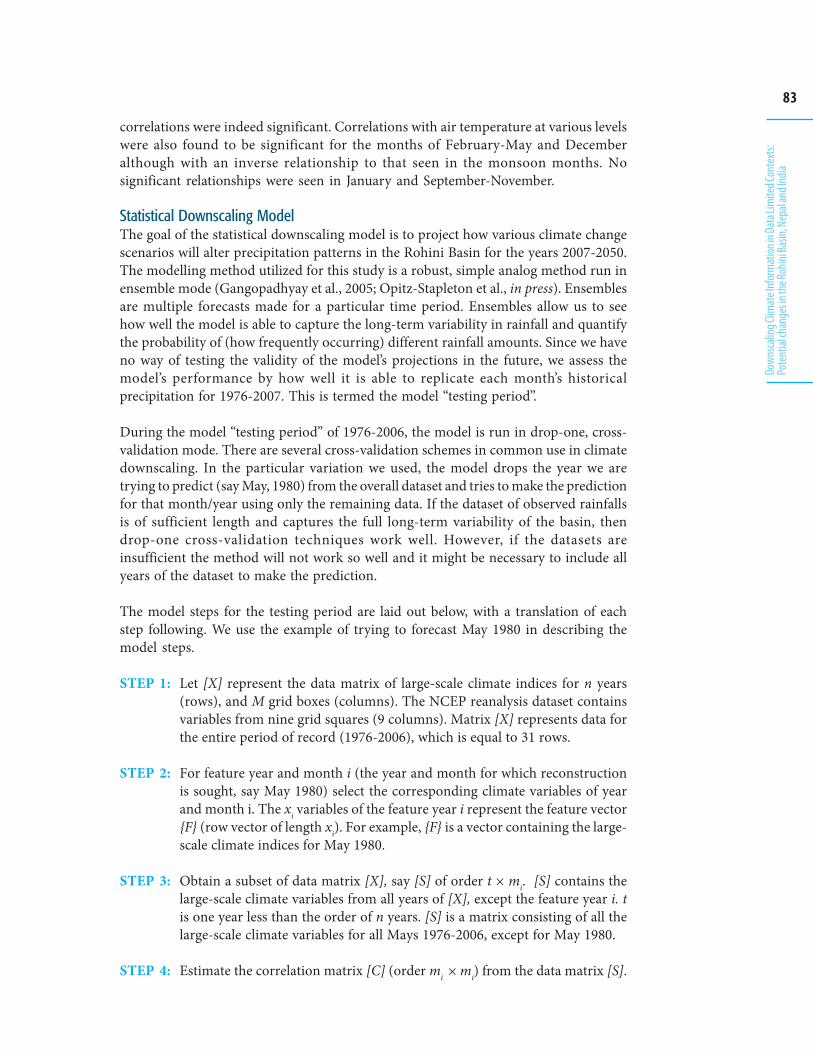
83
Down
scalin
g Clim
ate I
nfor
mat
ion in
Data
Lim
ited C
onte
xts:
Pote
ntial
chan
ges in
the R
ohini
Basin
, Nep
al an
d Ind
ia
correlations were indeed significant. Correlations with air temperature at various levelswere also found to be significant for the months of February-May and Decemberalthough with an inverse relationship to that seen in the monsoon months. Nosignificant relationships were seen in January and September-November.
Statistical Downscaling ModelThe goal of the statistical downscaling model is to project how various climate changescenarios will alter precipitation patterns in the Rohini Basin for the years 2007-2050.The modelling method utilized for this study is a robust, simple analog method run inensemble mode (Gangopadhyay et al., 2005; Opitz-Stapleton et al., in press). Ensemblesare multiple forecasts made for a particular time period. Ensembles allow us to seehow well the model is able to capture the long-term variability in rainfall and quantifythe probability of (how frequently occurring) different rainfall amounts. Since we haveno way of testing the validity of the model’s projections in the future, we assess themodel’s performance by how well it is able to replicate each month’s historicalprecipitation for 1976-2007. This is termed the model “testing period”.
During the model “testing period” of 1976-2006, the model is run in drop-one, cross-validation mode. There are several cross-validation schemes in common use in climatedownscaling. In the particular variation we used, the model drops the year we aretrying to predict (say May, 1980) from the overall dataset and tries to make the predictionfor that month/year using only the remaining data. If the dataset of observed rainfallsis of sufficient length and captures the full long-term variability of the basin, thendrop-one cross-validation techniques work well. However, if the datasets areinsufficient the method will not work so well and it might be necessary to include allyears of the dataset to make the prediction.
The model steps for the testing period are laid out below, with a translation of eachstep following. We use the example of trying to forecast May 1980 in describing themodel steps.
STEP 1: Let [X] represent the data matrix of large-scale climate indices for n years(rows), and M grid boxes (columns). The NCEP reanalysis dataset containsvariables from nine grid squares (9 columns). Matrix [X] represents data forthe entire period of record (1976-2006), which is equal to 31 rows.
STEP 2: For feature year and month i (the year and month for which reconstructionis sought, say May 1980) select the corresponding climate variables of yearand month i. The xi variables of the feature year i represent the feature vector{F} (row vector of length xi). For example, {F} is a vector containing the large-scale climate indices for May 1980.
STEP 3: Obtain a subset of data matrix [X], say [S] of order t × mi. [S] contains thelarge-scale climate variables from all years of [X], except the feature year i. tis one year less than the order of n years. [S] is a matrix consisting of all thelarge-scale climate variables for all Mays 1976-2006, except for May 1980.
STEP 4: Estimate the correlation matrix [C] (order mi × mi) from the data matrix [S].

84
Catalyzing Climate and Disaster Resilience: Processes for
Identifying Tangible and Economically Robust Strategies
STEP 5: Perform PCA (Principal Component Analysis; see von Storch and Zwiers2001; Wilks 2006) using matrix [C] to obtain the mi eigen values )()1( ,,
imλλ K , and the eigen matrix (matrix of eigen vectors as columns) [E](order, mi × mi).
STEP 6: Project the feature vector {F} for feature year i onto the eigen vectors inmatrix [E]. The projected feature vector, }{ 'F is given by,
iiii mmmm EFF ××× = ][}{}{ 11
'
STEP 7: Calculate the mi principal components. The principal component matrix[Z] is obtained from, [Z]n×mi
= [S]t×mi[E]mi ×mi
STEP 8: For each element m (m=1, …, n) compute the weighted Euclidian distance(dt) between the projected feature vector, }{ 'F (Step 7), and the principalcomponents contained in matrix [Z] (Step 8).
( )
2/1
1
2'
1⎥⎥⎥⎥
⎦
⎤
⎢⎢⎢⎢
⎣
⎡
−= ∑∑=
=
nret
jtjjm
pp
jt zfd
i
λ
λ
where, nret is the number of principal components retained such that
∑
=
≈nret
jj
1)( 90.0λ ; ztj are the elements of [Z], and '
jf are the elements of
the projected feature vector }{ 'F . This gives a set of n distances aspossible neighbours from the overlap period to feature year i.
STEP 9: Sort the distances dt in ascending order, and retain only the first K-neighbours (Gangopadhyay et al., 2005). The prescribed choice for K is n ≈ 6 in this case. The K-nearest neighbours represent the K most similaryears from the dataset to the feature year i.
STEP 10: Select the observed rainfall for each of the K neighbour years from thesubset period, this represents the set of possible rainfall magnitudes forfeature year i.
STEP 11: Assign weights to each of the K rainfall values. Several weighting schemesbased on either K (Lall and Sharma, 1996; Rajagopalan and Lall, 1999) ordistance such as the bi-square weight function (Gangopadhyay et al., 2005)and inverse distance weighting (Chow et al., 1988) are available. We utilized
(2)
(1)
(3)
...
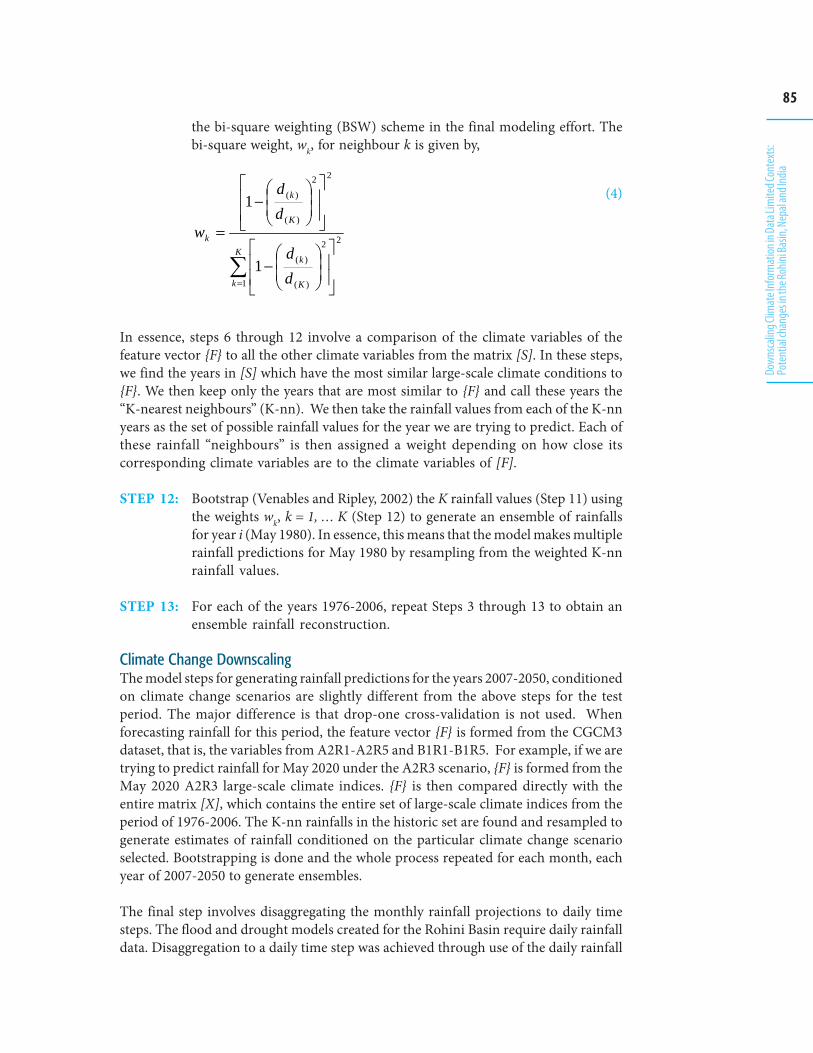
85
Down
scalin
g Clim
ate I
nfor
mat
ion in
Data
Lim
ited C
onte
xts:
Pote
ntial
chan
ges in
the R
ohini
Basin
, Nep
al an
d Ind
ia
the bi-square weighting (BSW) scheme in the final modeling effort. Thebi-square weight, wk, for neighbour k is given by,
∑= ⎥
⎥
⎦
⎤
⎢⎢
⎣
⎡
⎟⎟⎠
⎞⎜⎜⎝
⎛−
⎥⎥
⎦
⎤
⎢⎢
⎣
⎡
⎟⎟⎠
⎞⎜⎜⎝
⎛−
=K
k K
k
K
k
k
d
d
d
d
w
1
22
)(
)(
22
)(
)(
1
1
In essence, steps 6 through 12 involve a comparison of the climate variables of thefeature vector {F} to all the other climate variables from the matrix [S]. In these steps,we find the years in [S] which have the most similar large-scale climate conditions to{F}. We then keep only the years that are most similar to {F} and call these years the“K-nearest neighbours” (K-nn). We then take the rainfall values from each of the K-nnyears as the set of possible rainfall values for the year we are trying to predict. Each ofthese rainfall “neighbours” is then assigned a weight depending on how close itscorresponding climate variables are to the climate variables of [F].
STEP 12: Bootstrap (Venables and Ripley, 2002) the K rainfall values (Step 11) usingthe weights wk, k = 1, … K (Step 12) to generate an ensemble of rainfallsfor year i (May 1980). In essence, this means that the model makes multiplerainfall predictions for May 1980 by resampling from the weighted K-nnrainfall values.
STEP 13: For each of the years 1976-2006, repeat Steps 3 through 13 to obtain anensemble rainfall reconstruction.
Climate Change DownscalingThe model steps for generating rainfall predictions for the years 2007-2050, conditionedon climate change scenarios are slightly different from the above steps for the testperiod. The major difference is that drop-one cross-validation is not used. Whenforecasting rainfall for this period, the feature vector {F} is formed from the CGCM3dataset, that is, the variables from A2R1-A2R5 and B1R1-B1R5. For example, if we aretrying to predict rainfall for May 2020 under the A2R3 scenario, {F} is formed from theMay 2020 A2R3 large-scale climate indices. {F} is then compared directly with theentire matrix [X], which contains the entire set of large-scale climate indices from theperiod of 1976-2006. The K-nn rainfalls in the historic set are found and resampled togenerate estimates of rainfall conditioned on the particular climate change scenarioselected. Bootstrapping is done and the whole process repeated for each month, eachyear of 2007-2050 to generate ensembles.
The final step involves disaggregating the monthly rainfall projections to daily timesteps. The flood and drought models created for the Rohini Basin require daily rainfalldata. Disaggregation to a daily time step was achieved through use of the daily rainfall
(4)
86
Catalyzing Climate and Disaster Resilience: Processes for
Identifying Tangible and Economically Robust Strategies
percentage distributions from the historical record. For example, say May 2020 hadsix K-nn: 1978, 1987, 1992, 1995, 2001 and 2003 and that in May 1978, rain fell on sixdays throughout the month, with each day receiving some percentage of the totalmonthly rainfall. The daily rainfall percentages of each K-nn were then multiplied byMay 2020’s monthly rainfall projections to produce hypothetical, but probable dailyrainfall distributions.
Model VerificationEach ensemble forecast is equally probable for the period 2007-2050. We will notknow until the future has become the past which forecast was the most accurate. Wecan only test the model’s accuracy, and whether or not we chose the correct large-scaleclimate variables, by seeing how well the model could replicate the historical rainfallsfor 1976-2006. There are several methods used to verify ensemble forecast skill (testingthe forecast performance). We used four verification measures that are subsequentlydescribed: boxplots, correlation analysis, the Ranked Probability Skill Score, andreliability diagrams. For the remainder of this chapter, we only discuss the monthlyensemble rainfall projections and all verification of the forecasts’ skill is over themonthly forecasts.
One method is to visually compare the ensemble rainfalls with the historical rainfalls,such as seen in Figure 4. Boxplots provide a pictorial comparison of the historicalrainfall with the model’s ensemble rainfalls. Each box represents the interquartile(25th-75th percentile) range of the rainfall ensembles generated by the model. The bottom“whisker” coming out of the box presents some of the lowest rainfall ensembles andthe top “whisker” represents approximately the highest rainfall projections. Opencircles signify values greater than the 95th percentile or less than the 5th percentile andare outliers. The box represents the spread of the majority of the rainfall ensembles.The black line in the middle of the box represents the middle value ensemble rainfall.The red triangle represents the actual, historically observed rainfall.
The second method involves correlating the median rainfall ensemble value with theobserved, historical rainfall. This allows us to test how close the median predictionwas to the actual value. A strong correlation (significant above the 95th percentile)indicates that the median prediction was consistently similar to the historicalobservation over the test period.
The final two methods (Ranked Probability Skill Score and reliability diagrams) weredesigned specifically by meteorologists and climatologists to test the performance ofensemble forecasts. If there were only one forecast value, it would be easy to see howclose it came to the actual value. However, we needed to run the model in ensemblemode in order to test the characteristics of our historical rainfall dataset: 1) was itlong enough? and 2) even if it is not of the ideal length, are the model’s forecasts stillreliable enough to give us confidence in making climate change projections?
The Ranked Probability Skill Score (RPSS) tests how reliable the ensemble forecastsactually were in predicting the observed rainfall in comparison with the performanceof a forecast based on chance. The RPSS is based on the ranked probability score (RPS)(Murphy, 1972), which measures the ability of the forecasts to predict the actual
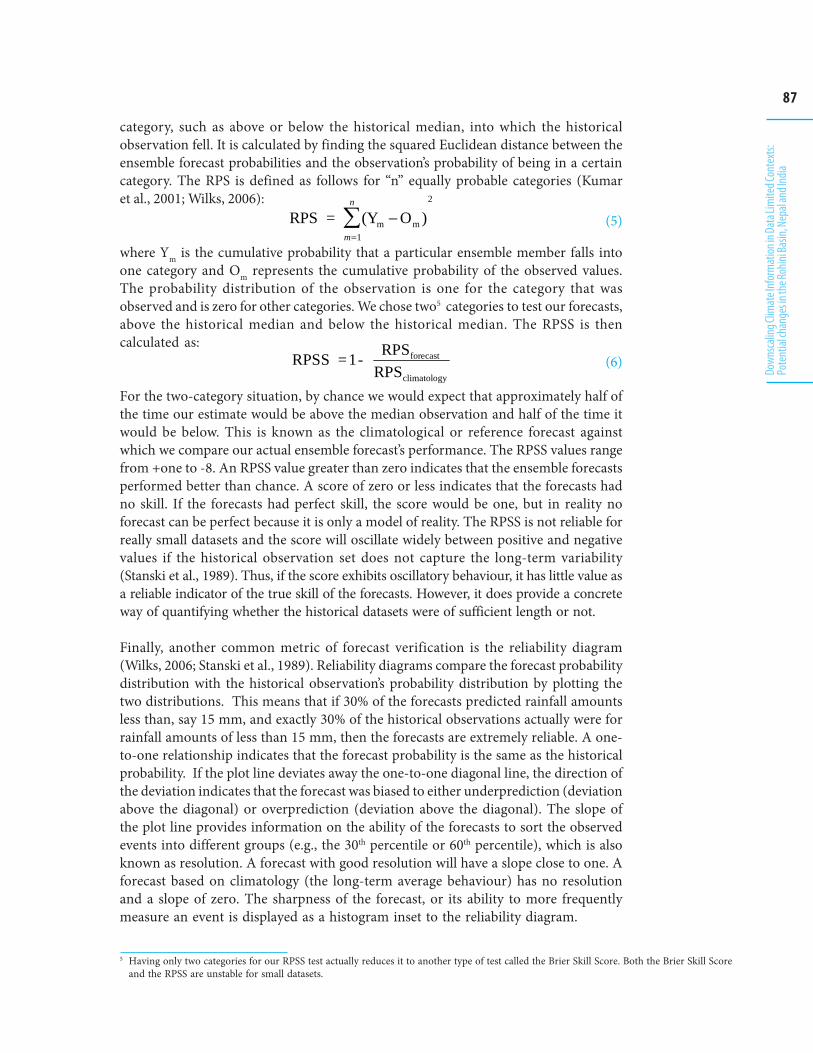
87
Down
scalin
g Clim
ate I
nfor
mat
ion in
Data
Lim
ited C
onte
xts:
Pote
ntial
chan
ges in
the R
ohini
Basin
, Nep
al an
d Ind
ia
category, such as above or below the historical median, into which the historicalobservation fell. It is calculated by finding the squared Euclidean distance between theensemble forecast probabilities and the observation’s probability of being in a certaincategory. The RPS is defined as follows for “n” equally probable categories (Kumaret al., 2001; Wilks, 2006):
where Ym is the cumulative probability that a particular ensemble member falls intoone category and Om represents the cumulative probability of the observed values.The probability distribution of the observation is one for the category that wasobserved and is zero for other categories. We chose two5 categories to test our forecasts,above the historical median and below the historical median. The RPSS is thencalculated as:
For the two-category situation, by chance we would expect that approximately half ofthe time our estimate would be above the median observation and half of the time itwould be below. This is known as the climatological or reference forecast againstwhich we compare our actual ensemble forecast’s performance. The RPSS values rangefrom +one to -8. An RPSS value greater than zero indicates that the ensemble forecastsperformed better than chance. A score of zero or less indicates that the forecasts hadno skill. If the forecasts had perfect skill, the score would be one, but in reality noforecast can be perfect because it is only a model of reality. The RPSS is not reliable forreally small datasets and the score will oscillate widely between positive and negativevalues if the historical observation set does not capture the long-term variability(Stanski et al., 1989). Thus, if the score exhibits oscillatory behaviour, it has little value asa reliable indicator of the true skill of the forecasts. However, it does provide a concreteway of quantifying whether the historical datasets were of sufficient length or not.
Finally, another common metric of forecast verification is the reliability diagram(Wilks, 2006; Stanski et al., 1989). Reliability diagrams compare the forecast probabilitydistribution with the historical observation’s probability distribution by plotting thetwo distributions. This means that if 30% of the forecasts predicted rainfall amountsless than, say 15 mm, and exactly 30% of the historical observations actually were forrainfall amounts of less than 15 mm, then the forecasts are extremely reliable. A one-to-one relationship indicates that the forecast probability is the same as the historicalprobability. If the plot line deviates away the one-to-one diagonal line, the direction ofthe deviation indicates that the forecast was biased to either underprediction (deviationabove the diagonal) or overprediction (deviation above the diagonal). The slope ofthe plot line provides information on the ability of the forecasts to sort the observedevents into different groups (e.g., the 30th percentile or 60th percentile), which is alsoknown as resolution. A forecast with good resolution will have a slope close to one. Aforecast based on climatology (the long-term average behaviour) has no resolutionand a slope of zero. The sharpness of the forecast, or its ability to more frequentlymeasure an event is displayed as a histogram inset to the reliability diagram.
RPS = (Ym − Om )
m=1
n
∑2
RPSS =1-
RPSforecast
RPSclimatology
5 Having only two categories for our RPSS test actually reduces it to another type of test called the Brier Skill Score. Both the Brier Skill Scoreand the RPSS are unstable for small datasets.
(5)
(6)
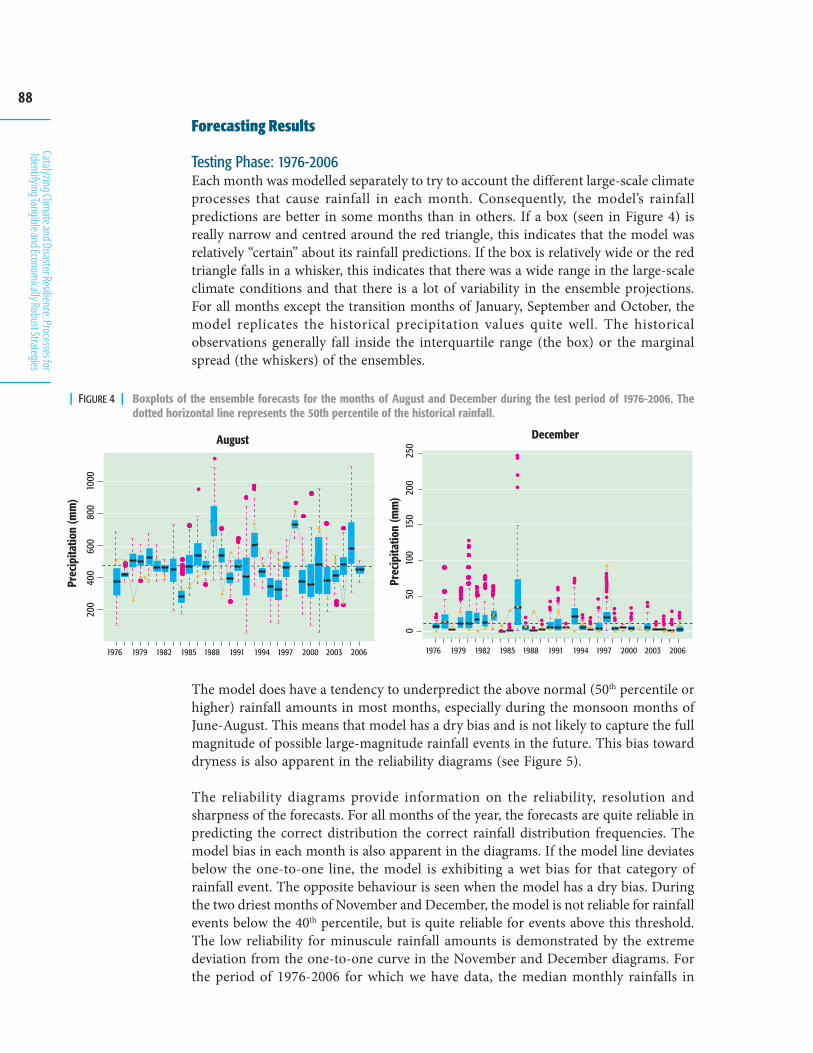
88
Catalyzing Climate and Disaster Resilience: Processes for
Identifying Tangible and Economically Robust Strategies
Forecasting Results
Testing Phase: 1976-2006Each month was modelled separately to try to account the different large-scale climateprocesses that cause rainfall in each month. Consequently, the model’s rainfallpredictions are better in some months than in others. If a box (seen in Figure 4) isreally narrow and centred around the red triangle, this indicates that the model wasrelatively “certain” about its rainfall predictions. If the box is relatively wide or the redtriangle falls in a whisker, this indicates that there was a wide range in the large-scaleclimate conditions and that there is a lot of variability in the ensemble projections.For all months except the transition months of January, September and October, themodel replicates the historical precipitation values quite well. The historicalobservations generally fall inside the interquartile range (the box) or the marginalspread (the whiskers) of the ensembles.
| FIGURE 4 | Boxplots of the ensemble forecasts for the months of August and December during the test period of 1976-2006. Thedotted horizontal line represents the 50th percentile of the historical rainfall.
0 5
0
100
15
0
2
00
250
December
1976 1979 1982 1985 1988 1991 1994 1997 2000 2003 2006
Prec
ipita
tion
(mm
)
200
400
6
00
8
00
10
00
Prec
ipita
tion
(mm
)
August
1976 1979 1982 1985 1988 1991 1994 1997 2000 2003 2006
The model does have a tendency to underpredict the above normal (50th percentile orhigher) rainfall amounts in most months, especially during the monsoon months ofJune-August. This means that model has a dry bias and is not likely to capture the fullmagnitude of possible large-magnitude rainfall events in the future. This bias towarddryness is also apparent in the reliability diagrams (see Figure 5).
The reliability diagrams provide information on the reliability, resolution andsharpness of the forecasts. For all months of the year, the forecasts are quite reliable inpredicting the correct distribution the correct rainfall distribution frequencies. Themodel bias in each month is also apparent in the diagrams. If the model line deviatesbelow the one-to-one line, the model is exhibiting a wet bias for that category ofrainfall event. The opposite behaviour is seen when the model has a dry bias. Duringthe two driest months of November and December, the model is not reliable for rainfallevents below the 40th percentile, but is quite reliable for events above this threshold.The low reliability for minuscule rainfall amounts is demonstrated by the extremedeviation from the one-to-one curve in the November and December diagrams. Forthe period of 1976-2006 for which we have data, the median monthly rainfalls in
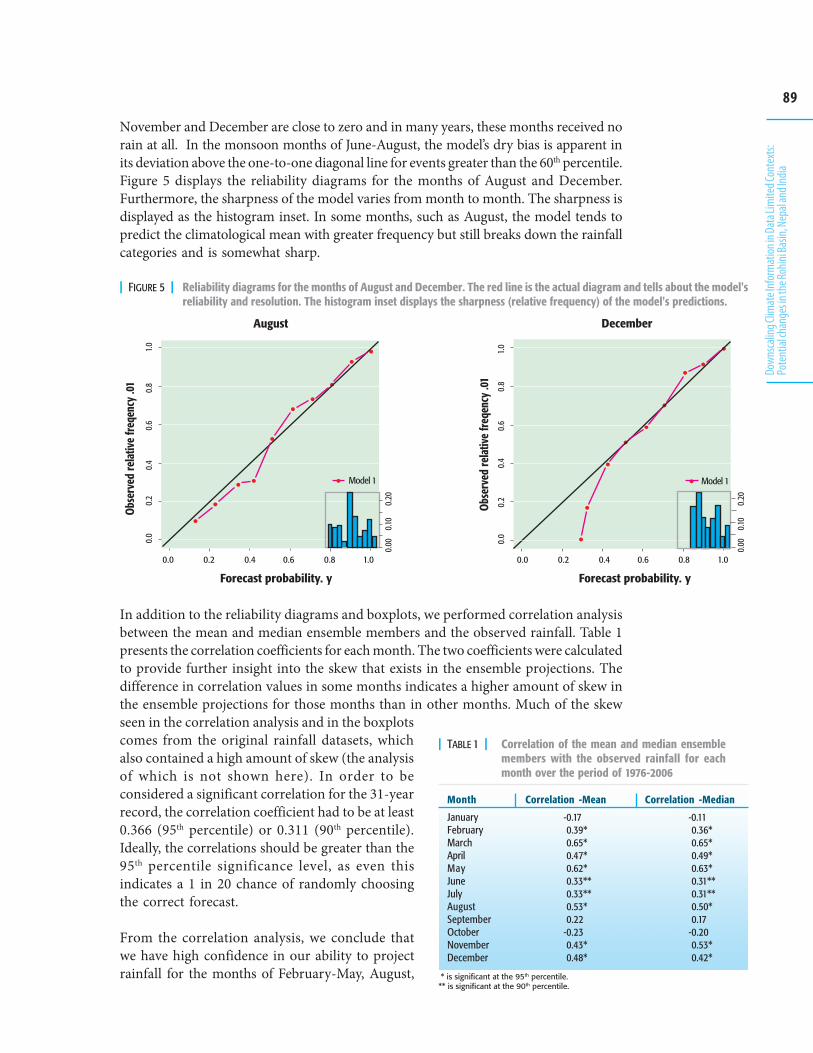
89
Down
scalin
g Clim
ate I
nfor
mat
ion in
Data
Lim
ited C
onte
xts:
Pote
ntial
chan
ges in
the R
ohini
Basin
, Nep
al an
d Ind
ia
November and December are close to zero and in many years, these months received norain at all. In the monsoon months of June-August, the model’s dry bias is apparent inits deviation above the one-to-one diagonal line for events greater than the 60th percentile.Figure 5 displays the reliability diagrams for the months of August and December.Furthermore, the sharpness of the model varies from month to month. The sharpness isdisplayed as the histogram inset. In some months, such as August, the model tends topredict the climatological mean with greater frequency but still breaks down the rainfallcategories and is somewhat sharp.
| FIGURE 5 | Reliability diagrams for the months of August and December. The red line is the actual diagram and tells about the model'sreliability and resolution. The histogram inset displays the sharpness (relative frequency) of the model's predictions.
������ ������
������������������������������������������������������������������ ������
����
������
������
����
������
������
����
������
������
�����
�����
������
�����
��
������
�����
����
������
������
����
������
������
����
������
������
����
������
������
����
����
�����
��
�������
�������� ������� ������� ���
����
�����
�����
�����
��
�������� ������� ������� ���
������� ���������� �������� ���������� �
� ! ��
����
�����
�����
�����
��
������������������������������������������������������������������ ������
In addition to the reliability diagrams and boxplots, we performed correlation analysisbetween the mean and median ensemble members and the observed rainfall. Table 1presents the correlation coefficients for each month. The two coefficients were calculatedto provide further insight into the skew that exists in the ensemble projections. Thedifference in correlation values in some months indicates a higher amount of skew inthe ensemble projections for those months than in other months. Much of the skewseen in the correlation analysis and in the boxplotscomes from the original rainfall datasets, whichalso contained a high amount of skew (the analysisof which is not shown here). In order to beconsidered a significant correlation for the 31-yearrecord, the correlation coefficient had to be at least0.366 (95th percentile) or 0.311 (90th percentile).Ideally, the correlations should be greater than the95th percentile significance level, as even thisindicates a 1 in 20 chance of randomly choosingthe correct forecast.
From the correlation analysis, we conclude thatwe have high confidence in our ability to projectrainfall for the months of February-May, August,
Month
JanuaryFebruaryMarchAprilMayJuneJulyAugustSeptemberOctoberNovemberDecember
Correlation -Mean
-0.170.39*0.65*0.47*0.62*0.33**0.33**0.53*0.22
-0.230.43*0.48*
Correlation -Median
-0.110.36*0.65*0.49*0.63*0.31**0.31**0.50*0.17
-0.200.53*0.42*
| TABLE 1 | Correlation of the mean and median ensemblemembers with the observed rainfall for eachmonth over the period of 1976-2006
* is significant at the 95th percentile.** is significant at the 90th percentile.
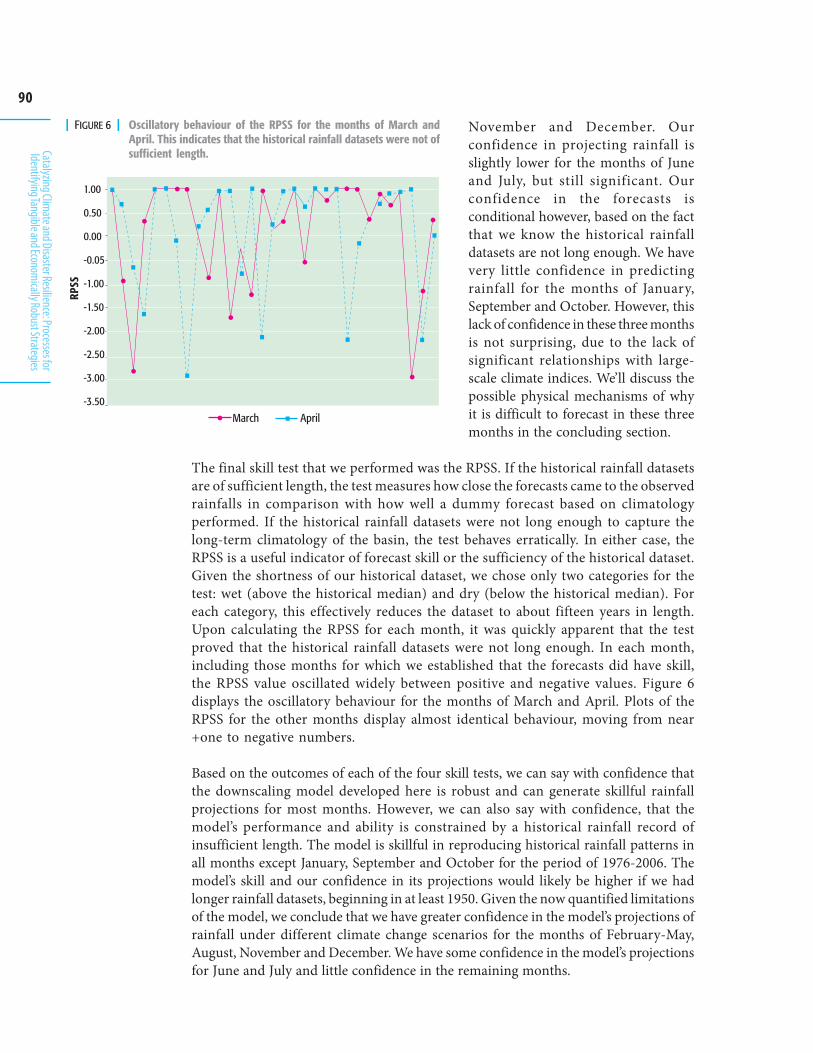
90
Catalyzing Climate and Disaster Resilience: Processes for
Identifying Tangible and Economically Robust Strategies
| FIGURE 6 | Oscillatory behaviour of the RPSS for the months of March andApril. This indicates that the historical rainfall datasets were not ofsufficient length.
����� � ���
���
����
����
�����
����
����
�����
�����
�����
�����
"�##
November and December. Ourconfidence in projecting rainfall isslightly lower for the months of Juneand July, but still significant. Ourconfidence in the forecasts isconditional however, based on the factthat we know the historical rainfalldatasets are not long enough. We havevery little confidence in predictingrainfall for the months of January,September and October. However, thislack of confidence in these three monthsis not surprising, due to the lack ofsignificant relationships with large-scale climate indices. We’ll discuss thepossible physical mechanisms of whyit is difficult to forecast in these threemonths in the concluding section.
The final skill test that we performed was the RPSS. If the historical rainfall datasetsare of sufficient length, the test measures how close the forecasts came to the observedrainfalls in comparison with how well a dummy forecast based on climatologyperformed. If the historical rainfall datasets were not long enough to capture thelong-term climatology of the basin, the test behaves erratically. In either case, theRPSS is a useful indicator of forecast skill or the sufficiency of the historical dataset.Given the shortness of our historical dataset, we chose only two categories for thetest: wet (above the historical median) and dry (below the historical median). Foreach category, this effectively reduces the dataset to about fifteen years in length.Upon calculating the RPSS for each month, it was quickly apparent that the testproved that the historical rainfall datasets were not long enough. In each month,including those months for which we established that the forecasts did have skill,the RPSS value oscillated widely between positive and negative values. Figure 6displays the oscillatory behaviour for the months of March and April. Plots of theRPSS for the other months display almost identical behaviour, moving from near+one to negative numbers.
Based on the outcomes of each of the four skill tests, we can say with confidence thatthe downscaling model developed here is robust and can generate skillful rainfallprojections for most months. However, we can also say with confidence, that themodel’s performance and ability is constrained by a historical rainfall record ofinsufficient length. The model is skillful in reproducing historical rainfall patterns inall months except January, September and October for the period of 1976-2006. Themodel’s skill and our confidence in its projections would likely be higher if we hadlonger rainfall datasets, beginning in at least 1950. Given the now quantified limitationsof the model, we conclude that we have greater confidence in the model’s projections ofrainfall under different climate change scenarios for the months of February-May,August, November and December. We have some confidence in the model’s projectionsfor June and July and little confidence in the remaining months.
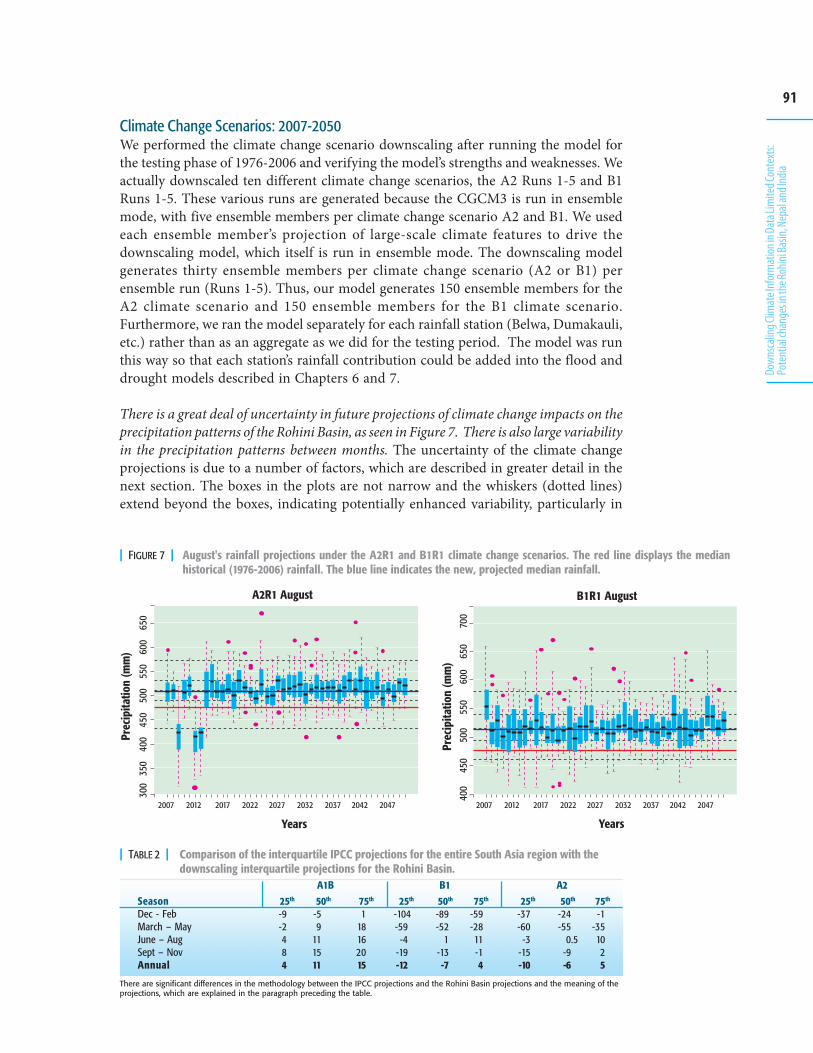
91
Down
scalin
g Clim
ate I
nfor
mat
ion in
Data
Lim
ited C
onte
xts:
Pote
ntial
chan
ges in
the R
ohini
Basin
, Nep
al an
d Ind
ia
Climate Change Scenarios: 2007-2050We performed the climate change scenario downscaling after running the model forthe testing phase of 1976-2006 and verifying the model’s strengths and weaknesses. Weactually downscaled ten different climate change scenarios, the A2 Runs 1-5 and B1Runs 1-5. These various runs are generated because the CGCM3 is run in ensemblemode, with five ensemble members per climate change scenario A2 and B1. We usedeach ensemble member’s projection of large-scale climate features to drive thedownscaling model, which itself is run in ensemble mode. The downscaling modelgenerates thirty ensemble members per climate change scenario (A2 or B1) perensemble run (Runs 1-5). Thus, our model generates 150 ensemble members for theA2 climate scenario and 150 ensemble members for the B1 climate scenario.Furthermore, we ran the model separately for each rainfall station (Belwa, Dumakauli,etc.) rather than as an aggregate as we did for the testing period. The model was runthis way so that each station’s rainfall contribution could be added into the flood anddrought models described in Chapters 6 and 7.
There is a great deal of uncertainty in future projections of climate change impacts on theprecipitation patterns of the Rohini Basin, as seen in Figure 7. There is also large variabilityin the precipitation patterns between months. The uncertainty of the climate changeprojections is due to a number of factors, which are described in greater detail in thenext section. The boxes in the plots are not narrow and the whiskers (dotted lines)extend beyond the boxes, indicating potentially enhanced variability, particularly in
| FIGURE 7 | August's rainfall projections under the A2R1 and B1R1 climate change scenarios. The red line displays the medianhistorical (1976-2006) rainfall. The blue line indicates the new, projected median rainfall.
25th
-9-2484
50th
-59
111511
75th
118162015
25th
-104-59
-4-19-12
50th
-89-52
1-13-7
75th
-59-2811-14
25th
-37-60
-3-15-10
50th
-24-55
0.5-9-6
75th
-1-351025
A1B B1 A2SeasonDec - FebMarch – MayJune – AugSept – NovAnnual
| TABLE 2 | Comparison of the interquartile IPCC projections for the entire South Asia region with thedownscaling interquartile projections for the Rohini Basin.
There are significant differences in the methodology between the IPCC projections and the Rohini Basin projections and the meaning of theprojections, which are explained in the paragraph preceding the table.
92
Catalyzing Climate and Disaster Resilience: Processes for
Identifying Tangible and Economically Robust Strategies
the monsoon months. During the non-monsoon months, the boxplots are tighterand less variability in rainfall is seen. It is better to utilize the ensemble projections asa range of possible precipitation, and not try to expect a single rainfall value, which noclimate model could give. The best way to acquire a sense of how rainfall might changeis to compare the 25th, median and 75th percentile ensemble projections (A2: runs 1-5and B1: runs 1-5) with the historical median to figure out, on average, if the month islikely to be wetter or dryer than the historical period. The comparison of theinterquartile range with the historical rainfall is displayed in Table 2.
The IPCC (Christensen et al., 2007) projections for the entire South Asia region arebroad, indicating a general decrease in precipitation in non-monsoon months and anincrease in precipitation during the monsoon months. Table 2 provides a comparisonbetween the IPCC’s projections for the entire region and the downscaled projectionsfor the Rohini Basin. There are caveats to the IPCC’s projections:
1) Their projections are run for the period of 2010-2099 and our downscaledprojections are for 2007-2050. Furthermore, their projections take a longer time toconverge (reach agreement between models).
2) IPCC projections are based on a summary of results from a minimum of 14 out of22 different GCMs. Our downscaled projections are based on the output of a singleGCM. The GCMs are numerical models taking into account physical processesbetween the land, ocean and atmosphere. Our downscaling model looks at thestatistical relationship between large-scale climate features and rainfall.
3) The IPCC projections are for an extremely large geographic area. Ours are basinspecific and there are significant differences of scale.
4) The most crucial difference is that the IPCC projections mentioned in the reportare for the scenario A1B, which is different from our choice of scenarios A2 and B1.The A1B scenario is based on carbon dioxide emissions stabilizing at about720ppm, which is different than the A2 and B2 scenarios.
Overall, the IPCC (Christensen, 2007) projections for the entire South Asian regionindicate a slight drying of the area for the December-February season under the A1Bscenario. In other seasons of the year, the IPCC broadly projects an increase inprecipitation. Our basin specific projections are different, and a little more extremethan the IPCC projections. Given the dry bias of the downscaling model and thelimitations of the historical rainfall dataset, we believe the projections toward drynessare a bit extreme. Therefore, we recommend the 75th percentiles rainfall projectionsunder both the A2 and B1 climate change scenarios. In all seasons except the monsoonseason, there is a general tendency toward drying, which we believe to be accurate.During the monsoon season, there is potentially a significant increase in the overallseasonal precipitation. Given the nature of monsoon rainfall as intense, localizedevents lasting only a day or two, a wetter monsoon season indicates more extreme,high intensity rainfall events. These projections point to increased precipitationvariability throughout the year, with a greater chance of both floods and droughtsdepending on the season.
The seasonal aggregation of climate change projections masks the variability betweenmonths. For the A2 and B1 scenarios, the Rohini Basin appears to be drying out in all
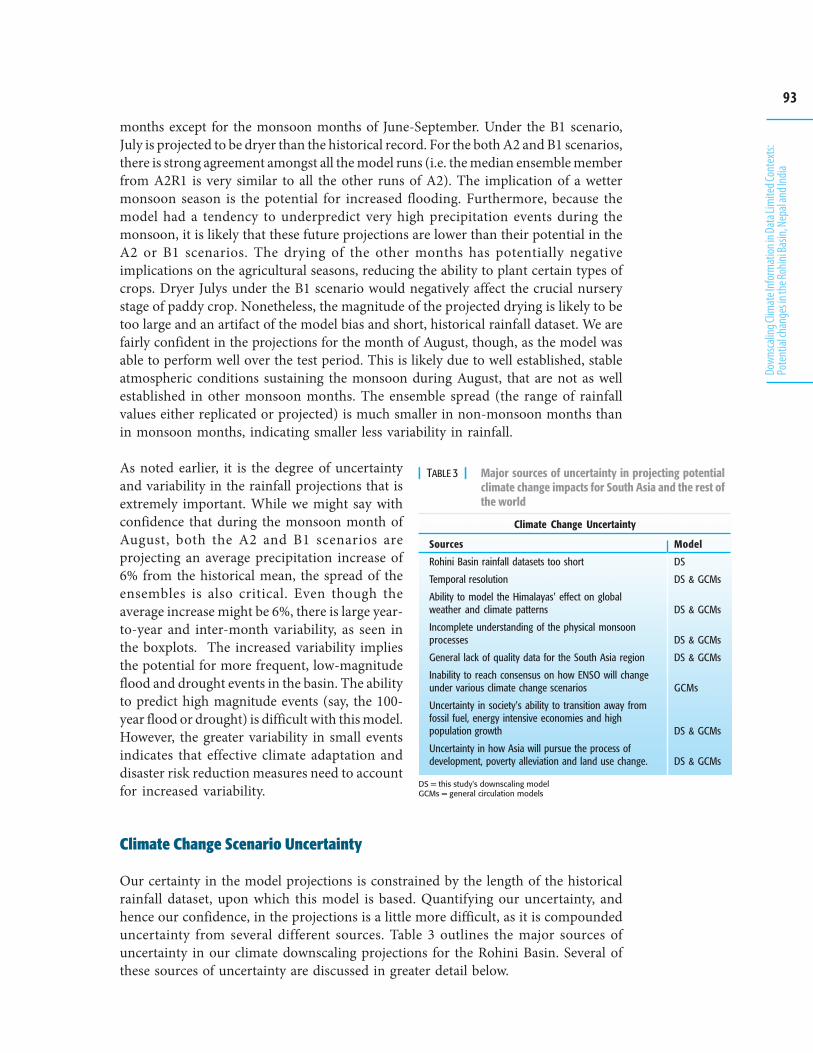
93
Down
scalin
g Clim
ate I
nfor
mat
ion in
Data
Lim
ited C
onte
xts:
Pote
ntial
chan
ges in
the R
ohini
Basin
, Nep
al an
d Ind
ia
months except for the monsoon months of June-September. Under the B1 scenario,July is projected to be dryer than the historical record. For the both A2 and B1 scenarios,there is strong agreement amongst all the model runs (i.e. the median ensemble memberfrom A2R1 is very similar to all the other runs of A2). The implication of a wettermonsoon season is the potential for increased flooding. Furthermore, because themodel had a tendency to underpredict very high precipitation events during themonsoon, it is likely that these future projections are lower than their potential in theA2 or B1 scenarios. The drying of the other months has potentially negativeimplications on the agricultural seasons, reducing the ability to plant certain types ofcrops. Dryer Julys under the B1 scenario would negatively affect the crucial nurserystage of paddy crop. Nonetheless, the magnitude of the projected drying is likely to betoo large and an artifact of the model bias and short, historical rainfall dataset. We arefairly confident in the projections for the month of August, though, as the model wasable to perform well over the test period. This is likely due to well established, stableatmospheric conditions sustaining the monsoon during August, that are not as wellestablished in other monsoon months. The ensemble spread (the range of rainfallvalues either replicated or projected) is much smaller in non-monsoon months thanin monsoon months, indicating smaller less variability in rainfall.
As noted earlier, it is the degree of uncertaintyand variability in the rainfall projections that isextremely important. While we might say withconfidence that during the monsoon month ofAugust, both the A2 and B1 scenarios areprojecting an average precipitation increase of6% from the historical mean, the spread of theensembles is also critical. Even though theaverage increase might be 6%, there is large year-to-year and inter-month variability, as seen inthe boxplots. The increased variability impliesthe potential for more frequent, low-magnitudeflood and drought events in the basin. The abilityto predict high magnitude events (say, the 100-year flood or drought) is difficult with this model.However, the greater variability in small eventsindicates that effective climate adaptation anddisaster risk reduction measures need to accountfor increased variability.
Climate Change Scenario Uncertainty
Our certainty in the model projections is constrained by the length of the historicalrainfall dataset, upon which this model is based. Quantifying our uncertainty, andhence our confidence, in the projections is a little more difficult, as it is compoundeduncertainty from several different sources. Table 3 outlines the major sources ofuncertainty in our climate downscaling projections for the Rohini Basin. Several ofthese sources of uncertainty are discussed in greater detail below.
Climate Change Uncertainty
Sources
Rohini Basin rainfall datasets too short
Temporal resolution
Ability to model the Himalayas' effect on globalweather and climate patterns
Incomplete understanding of the physical monsoonprocesses
General lack of quality data for the South Asia region
Inability to reach consensus on how ENSO will changeunder various climate change scenarios
Uncertainty in society's ability to transition away fromfossil fuel, energy intensive economies and highpopulation growth
Uncertainty in how Asia will pursue the process ofdevelopment, poverty alleviation and land use change.
Model
DS
DS & GCMs
DS & GCMs
DS & GCMs
DS & GCMs
GCMs
DS & GCMs
DS & GCMs
| TABLE 3 | Major sources of uncertainty in projecting potentialclimate change impacts for South Asia and the rest ofthe world
DS = this study's downscaling modelGCMs = general circulation models
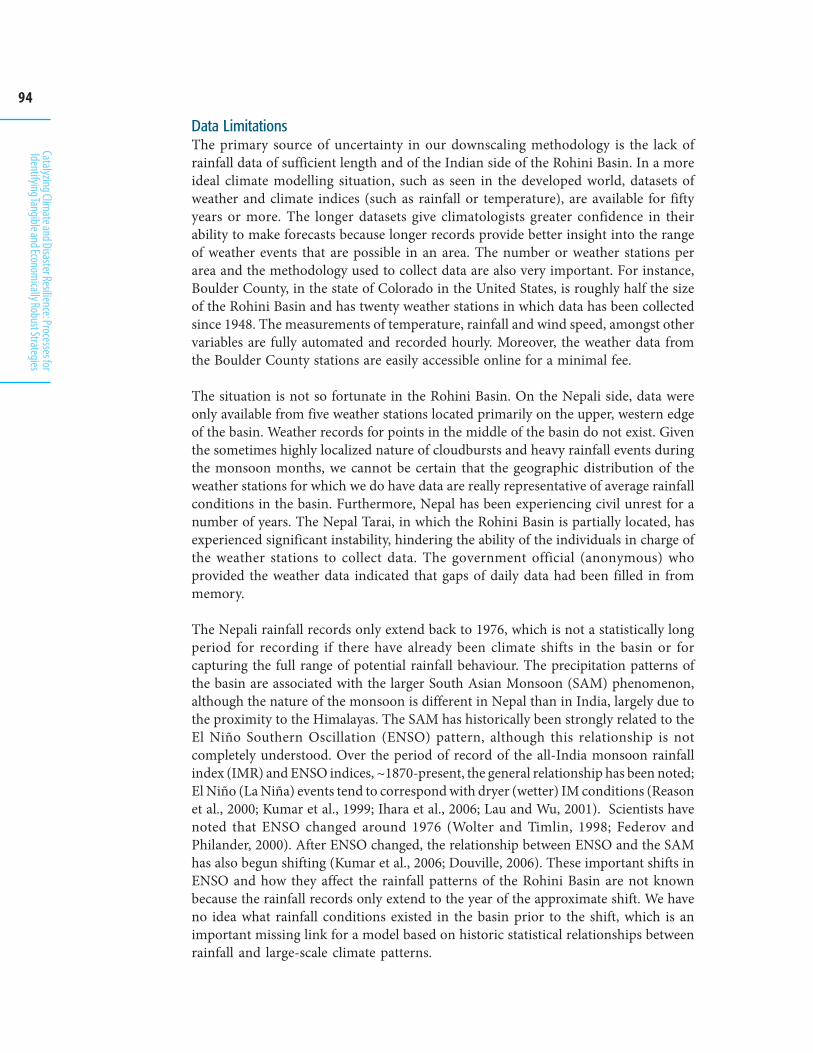
94
Catalyzing Climate and Disaster Resilience: Processes for
Identifying Tangible and Economically Robust Strategies
Data LimitationsThe primary source of uncertainty in our downscaling methodology is the lack ofrainfall data of sufficient length and of the Indian side of the Rohini Basin. In a moreideal climate modelling situation, such as seen in the developed world, datasets ofweather and climate indices (such as rainfall or temperature), are available for fiftyyears or more. The longer datasets give climatologists greater confidence in theirability to make forecasts because longer records provide better insight into the rangeof weather events that are possible in an area. The number or weather stations perarea and the methodology used to collect data are also very important. For instance,Boulder County, in the state of Colorado in the United States, is roughly half the sizeof the Rohini Basin and has twenty weather stations in which data has been collectedsince 1948. The measurements of temperature, rainfall and wind speed, amongst othervariables are fully automated and recorded hourly. Moreover, the weather data fromthe Boulder County stations are easily accessible online for a minimal fee.
The situation is not so fortunate in the Rohini Basin. On the Nepali side, data wereonly available from five weather stations located primarily on the upper, western edgeof the basin. Weather records for points in the middle of the basin do not exist. Giventhe sometimes highly localized nature of cloudbursts and heavy rainfall events duringthe monsoon months, we cannot be certain that the geographic distribution of theweather stations for which we do have data are really representative of average rainfallconditions in the basin. Furthermore, Nepal has been experiencing civil unrest for anumber of years. The Nepal Tarai, in which the Rohini Basin is partially located, hasexperienced significant instability, hindering the ability of the individuals in charge ofthe weather stations to collect data. The government official (anonymous) whoprovided the weather data indicated that gaps of daily data had been filled in frommemory.
The Nepali rainfall records only extend back to 1976, which is not a statistically longperiod for recording if there have already been climate shifts in the basin or forcapturing the full range of potential rainfall behaviour. The precipitation patterns ofthe basin are associated with the larger South Asian Monsoon (SAM) phenomenon,although the nature of the monsoon is different in Nepal than in India, largely due tothe proximity to the Himalayas. The SAM has historically been strongly related to theEl Niño Southern Oscillation (ENSO) pattern, although this relationship is notcompletely understood. Over the period of record of the all-India monsoon rainfallindex (IMR) and ENSO indices, ~1870-present, the general relationship has been noted;El Niño (La Niña) events tend to correspond with dryer (wetter) IM conditions (Reasonet al., 2000; Kumar et al., 1999; Ihara et al., 2006; Lau and Wu, 2001). Scientists havenoted that ENSO changed around 1976 (Wolter and Timlin, 1998; Federov andPhilander, 2000). After ENSO changed, the relationship between ENSO and the SAMhas also begun shifting (Kumar et al., 2006; Douville, 2006). These important shifts inENSO and how they affect the rainfall patterns of the Rohini Basin are not knownbecause the rainfall records only extend to the year of the approximate shift. We haveno idea what rainfall conditions existed in the basin prior to the shift, which is animportant missing link for a model based on historic statistical relationships betweenrainfall and large-scale climate patterns.
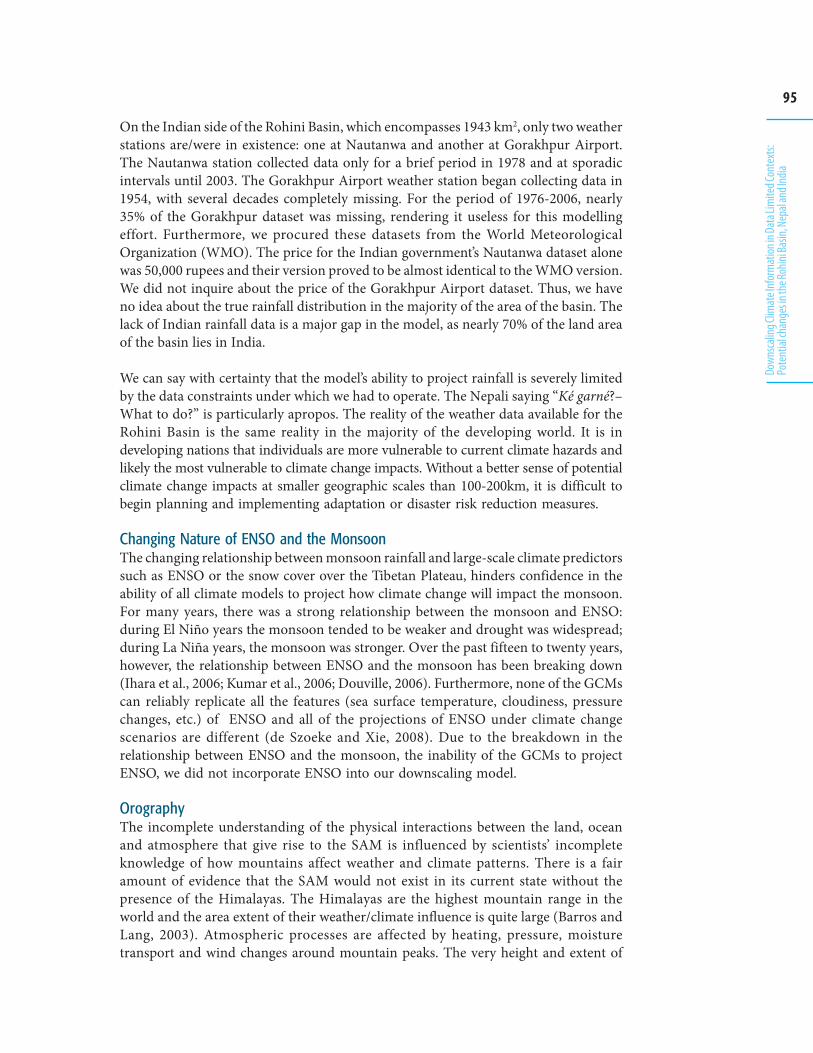
95
Down
scalin
g Clim
ate I
nfor
mat
ion in
Data
Lim
ited C
onte
xts:
Pote
ntial
chan
ges in
the R
ohini
Basin
, Nep
al an
d Ind
ia
On the Indian side of the Rohini Basin, which encompasses 1943 km2, only two weatherstations are/were in existence: one at Nautanwa and another at Gorakhpur Airport.The Nautanwa station collected data only for a brief period in 1978 and at sporadicintervals until 2003. The Gorakhpur Airport weather station began collecting data in1954, with several decades completely missing. For the period of 1976-2006, nearly35% of the Gorakhpur dataset was missing, rendering it useless for this modellingeffort. Furthermore, we procured these datasets from the World MeteorologicalOrganization (WMO). The price for the Indian government’s Nautanwa dataset alonewas 50,000 rupees and their version proved to be almost identical to the WMO version.We did not inquire about the price of the Gorakhpur Airport dataset. Thus, we haveno idea about the true rainfall distribution in the majority of the area of the basin. Thelack of Indian rainfall data is a major gap in the model, as nearly 70% of the land areaof the basin lies in India.
We can say with certainty that the model’s ability to project rainfall is severely limitedby the data constraints under which we had to operate. The Nepali saying “Ké garné?–What to do?” is particularly apropos. The reality of the weather data available for theRohini Basin is the same reality in the majority of the developing world. It is indeveloping nations that individuals are more vulnerable to current climate hazards andlikely the most vulnerable to climate change impacts. Without a better sense of potentialclimate change impacts at smaller geographic scales than 100-200km, it is difficult tobegin planning and implementing adaptation or disaster risk reduction measures.
Changing Nature of ENSO and the MonsoonThe changing relationship between monsoon rainfall and large-scale climate predictorssuch as ENSO or the snow cover over the Tibetan Plateau, hinders confidence in theability of all climate models to project how climate change will impact the monsoon.For many years, there was a strong relationship between the monsoon and ENSO:during El Niño years the monsoon tended to be weaker and drought was widespread;during La Niña years, the monsoon was stronger. Over the past fifteen to twenty years,however, the relationship between ENSO and the monsoon has been breaking down(Ihara et al., 2006; Kumar et al., 2006; Douville, 2006). Furthermore, none of the GCMscan reliably replicate all the features (sea surface temperature, cloudiness, pressurechanges, etc.) of ENSO and all of the projections of ENSO under climate changescenarios are different (de Szoeke and Xie, 2008). Due to the breakdown in therelationship between ENSO and the monsoon, the inability of the GCMs to projectENSO, we did not incorporate ENSO into our downscaling model.
OrographyThe incomplete understanding of the physical interactions between the land, oceanand atmosphere that give rise to the SAM is influenced by scientists’ incompleteknowledge of how mountains affect weather and climate patterns. There is a fairamount of evidence that the SAM would not exist in its current state without thepresence of the Himalayas. The Himalayas are the highest mountain range in theworld and the area extent of their weather/climate influence is quite large (Barros andLang, 2003). Atmospheric processes are affected by heating, pressure, moisturetransport and wind changes around mountain peaks. The very height and extent of
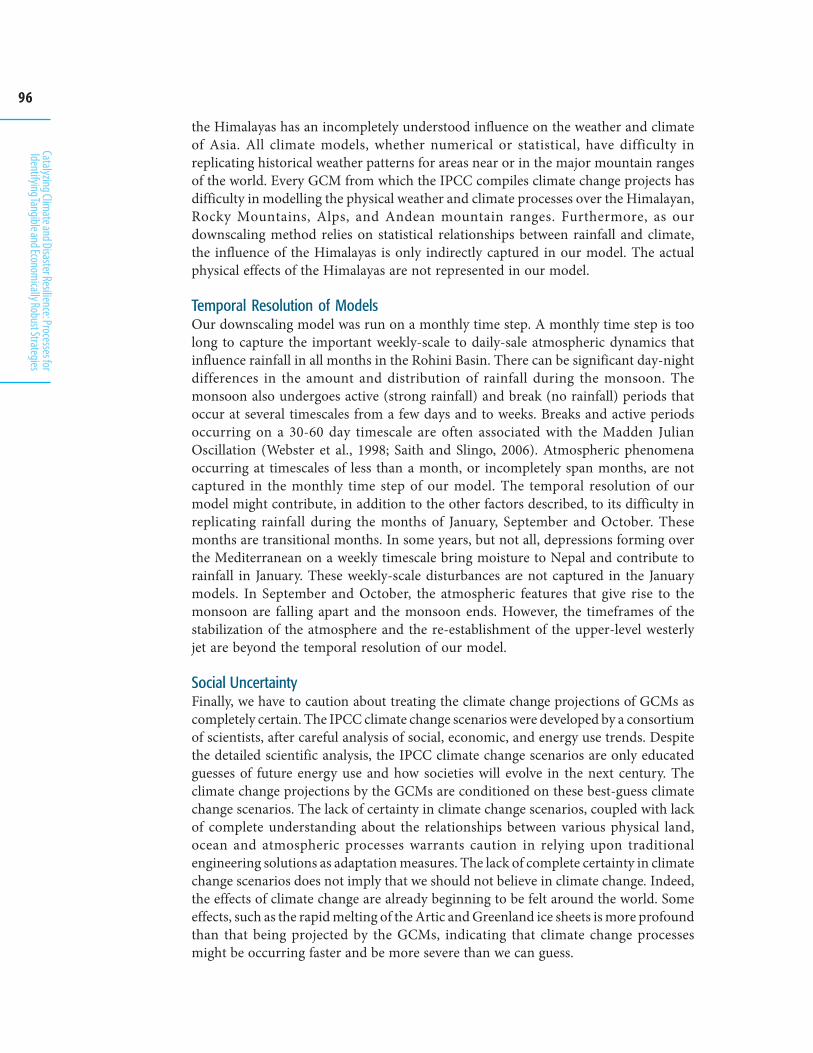
96
Catalyzing Climate and Disaster Resilience: Processes for
Identifying Tangible and Economically Robust Strategies
the Himalayas has an incompletely understood influence on the weather and climateof Asia. All climate models, whether numerical or statistical, have difficulty inreplicating historical weather patterns for areas near or in the major mountain rangesof the world. Every GCM from which the IPCC compiles climate change projects hasdifficulty in modelling the physical weather and climate processes over the Himalayan,Rocky Mountains, Alps, and Andean mountain ranges. Furthermore, as ourdownscaling method relies on statistical relationships between rainfall and climate,the influence of the Himalayas is only indirectly captured in our model. The actualphysical effects of the Himalayas are not represented in our model.
Temporal Resolution of ModelsOur downscaling model was run on a monthly time step. A monthly time step is toolong to capture the important weekly-scale to daily-sale atmospheric dynamics thatinfluence rainfall in all months in the Rohini Basin. There can be significant day-nightdifferences in the amount and distribution of rainfall during the monsoon. Themonsoon also undergoes active (strong rainfall) and break (no rainfall) periods thatoccur at several timescales from a few days and to weeks. Breaks and active periodsoccurring on a 30-60 day timescale are often associated with the Madden JulianOscillation (Webster et al., 1998; Saith and Slingo, 2006). Atmospheric phenomenaoccurring at timescales of less than a month, or incompletely span months, are notcaptured in the monthly time step of our model. The temporal resolution of ourmodel might contribute, in addition to the other factors described, to its difficulty inreplicating rainfall during the months of January, September and October. Thesemonths are transitional months. In some years, but not all, depressions forming overthe Mediterranean on a weekly timescale bring moisture to Nepal and contribute torainfall in January. These weekly-scale disturbances are not captured in the Januarymodels. In September and October, the atmospheric features that give rise to themonsoon are falling apart and the monsoon ends. However, the timeframes of thestabilization of the atmosphere and the re-establishment of the upper-level westerlyjet are beyond the temporal resolution of our model.
Social UncertaintyFinally, we have to caution about treating the climate change projections of GCMs ascompletely certain. The IPCC climate change scenarios were developed by a consortiumof scientists, after careful analysis of social, economic, and energy use trends. Despitethe detailed scientific analysis, the IPCC climate change scenarios are only educatedguesses of future energy use and how societies will evolve in the next century. Theclimate change projections by the GCMs are conditioned on these best-guess climatechange scenarios. The lack of certainty in climate change scenarios, coupled with lackof complete understanding about the relationships between various physical land,ocean and atmospheric processes warrants caution in relying upon traditionalengineering solutions as adaptation measures. The lack of complete certainty in climatechange scenarios does not imply that we should not believe in climate change. Indeed,the effects of climate change are already beginning to be felt around the world. Someeffects, such as the rapid melting of the Artic and Greenland ice sheets is more profoundthan that being projected by the GCMs, indicating that climate change processesmight be occurring faster and be more severe than we can guess.
97
Down
scalin
g Clim
ate I
nfor
mat
ion in
Data
Lim
ited C
onte
xts:
Pote
ntial
chan
ges in
the R
ohini
Basin
, Nep
al an
d Ind
ia
Conclusion
In summary, the analog, statistical downscaling method just discussed provides arobust method for translating large-scale climate change scenarios generated by GCMsto potential scenarios at river basin scales. The accuracy and skill of the downscaledoutputs is constrained by the quality and quantity of the data available for the RohiniBasin. We have concretely demonstrated that the Nepali datasets were too short tocapture the full range of historical climate variability in the basin. We did not have anydata for the Indian side of the basin. The incompleteness of the data is an importantsource of uncertainty that propagates into the climate change scenarios. Lack of dataand the inability to establish large-scale climate feature relationships in certain monthsmade it difficult for the model to replicate historic rainfall for the months of January,September and October. Nonetheless, the model is skillful in replicating rainfall in themonths of February-May, August, November and December. The model has a littleless skill in the months of June and July, but is still useful. During the driest months ofNovember and December, the model does not do well in capturing years without rainand is biased toward being too wet. In other months, including the monsoon months,the model is biased toward being too dry.
This bias toward dryness in most months influences the climate change projectionsunder the A2 and B1 scenarios. During the monsoon months, both the A2 and B1downscaled scenarios indicate an increase in precipitation in the Rohini Basin. Asmuch of the monsoon rainfall occurs as intense, short duration (less than a few days)events, an overall increase in monsoon rainfall indicates an increased probabilityextreme rainfall events and flooding. The model projects a decrease in precipitation innon-monsoon months. In all months, precipitation variability will increase. Giventhe model’s dry bias in all months except November and December, the climate changeprojections are likely too dry. Thus, while we do believe that there will be less rainfallin the Rohini Basin during the non-monsoon months, the magnitude of the dryprojections is likely too high. Conversely, the magnitude of rainfall during the monsoonmonths is likely underestimated. However, there are many sources of uncertainty thatcould be contributing to the model bias and the variability in the rainfall projections.
98
Catalyzing Climate and Disaster Resilience: Processes for
Identifying Tangible and Economically Robust Strategies
Barros, A.P. and T.J. Lang (2003) ‘Monitoring the Monsoon in the Himalayas:Observations in Central Nepal, June 2001’, Monthly Weather Review 131:1408-1427.
Christensen, J.H., et al. (2007) ‘Regional Climate Projections’ in S. Solomon, D. Qin, M.Manning, Z. Chen, M. Marquis, K.B. Avery, M. Tignor and H.L. Miller(eds), Climate Change 2007: The Physical Science Basis, Contribution ofWorking Group I to the Fourth Assessment Report of theIntergovernmental Panel on Climate Change. Cambridge, UK: CambridgeUniversity Press.
De Szoeke, S.P. and S.P. Xie (2008) ‘The Tropical Eastern Pacific Seasonal Cycle:Assessment of Errors and Mechanisms in the IPCC AR4 Coupled Ocean-Atmosphere General Circulation Models’, Journal of Climate 21: 2573-2590.
Dibike, Y.B. and P. Coulibaly (2005) ‘Hydrologic impact of climate change in theSaguenay watershed: comparison of downscaling methods and hydrologicmodels’, Journal of Hydrology 307: 145-163.
Dixit, A., et al. (2007) ‘Flood Disaster Impacts and Responses in Nepal Tarai’sMarginalised Basins’, in M. Moench and A. Dixit (eds) Working with theWinds of Change: Toward Strategies for Responding to the Risks Associatedwith Climate Change and Other Risks, pp. 119-157. Boulder: Institute forSocial and Environmental Transition; Kathmandu: ISET-Nepal; Geneva:the ProVention Consortium.
Douville, H. (2006) ‘Impact of Regional SST Anomalies on the Indian MonsoonResponse to Global Warming in the CNRM Climate Model’, Journal ofClimate 19: 2008-2024.
Fasullo, J. and P.J. Webster (2003) ‘A Hydrologic Definition of Indian Monsoon Onsetand Withdrawal’ Journal of Climate 16: 3200-3211.
Fedorov, A.V. and S.G. Philander (2000) ‘Is El Niño Changing?’ Science 288: 1997-2002.Gangopadhyay, S., et al. (2005) ‘Statistical downscaling using K-nearest neighbors’,
Water Resources Research 41: W0204.
Bibliography
99
Down
scalin
g Clim
ate I
nfor
mat
ion in
Data
Lim
ited C
onte
xts:
Pote
ntial
chan
ges in
the R
ohini
Basin
, Nep
al an
d Ind
ia
Ihara, C., et al. (2006) ‘Indian Summer Monsoon Rainfall and its Link with ENSO andIndian Ocean Climate Indices’, International Journal of Climatology 27(2):179-187. DOI: 10.1002/joc.1394.
India Water Portal (2008) ‘Meterological Data’. http://www.indiawaterportal.org/data/metdata/ [accessed September, 2008].
IPCC (2000) Special Report on Emissions Scenarios. Nakicenovic, N. and Stuart, R.(eds). Cambridge, UK: Cambridge University Press.
Kalnay, E., et al. (1996) ‘The NCEP/NCAR reanalysis 40-year project’, Bulletin of theAmerican Meteorological Society 77: 437-471.
Kripalani, R.H., et al. (2007) ‘South Asian summer monsoon precipitation variability:Coupled climate model simulations and projections under IPCC AR4’,Theoretical and Applied Climatology 90: 133-159.
Kumar, A., et al. (2001) ‘Seasonal predictions, probabilistic verifications, and ensemblesize’, Journal of Climate 14: 1671-1676.
Kumar, K.K., et al. (2006) ‘Unravelling the Mystery of Indian Monsoon Failure DuringEl Niño’, Science 90(12): 115-119.
Kumar, K.K., et al. (1999) ‘Epochal changes in Indian monsoon-ENSO precursors’,Geophysical Research Letters 26(1): 75-78.
Lall, U. and A. Sharma (1996) ‘A Nearest Neighbor Bootstrap for ResamplingHydrologic Time Series’, Water Resources Research 32(3): 679-693.
Lau, K.M. and H.T. Wu (2001) ‘Principal Modes of Rainfall-SST Variability of theAsian Summer Monsoon: A Reassessment of the Monsoon-ENSORelationship’, Journal of Climate 14: 2880-2895.
Littlewood, I.G., et al. (2007) ‘Predicting daily streamflow using rainfall forecasts, asimple loss module and unit hydrographs: Two Brazilian catchments’,Environmental Modelling & Software 22: 1229-1239.
Meehl, G.A. and J.M. Arblaster (2002) ‘The Tropospheric Biennial Oscillation andAsian-Australian Monsoon Rainfall’, Journal of Climate 15: 722-44.
Moench, M. and A. Dixit (eds) (2004) Adaptive Capacity and Livelihood Resilience:Adaptive Strategies for Responding to Floods and Droughts in South Asia.Boulder: Institute for Social and Environmental Transition; Kathmandu:ISET-Nepal.
Nepal Water Conservation Foundation (2006) Reconceptualizing flood mitigation inTarai. Kathmandu: Nepal Water Conservation Foundation.
Opitz-Stapleton, S., et al. (in press) ‘Developing Monthly Precipitation Ensembles fromLarge-scale Climate Fields Using a Non-Parametric StatisticalDownscaling Algorithm with an Application to the Rohini River Basin,Nepal’, submitted to Journal of Hydrology.
Osborn, T.J., et al. (1999) ‘Evaluation of the North Atlantic Oscillation as simulated bya climate model’, Climate Dynamics 15: 685-702.
Rajagopalan, B. and U. Lall (1999) ‘A k-nearest-neighbor simulator for dailyprecipitation and other weather variables’, Water Resources Research 35(10):3089-3101.
100
Catalyzing Climate and Disaster Resilience: Processes for
Identifying Tangible and Economically Robust Strategies
Reason, C.J.C., et al. (2000) ‘ENSO and Climatic Signals across the Indian Ocean Basinin the Global Context: Part 1, Interannual Composite Patterns’,International Journal of Climatology 20: 1285-327.
Saith, N. and J. Slingo (2006) ‘The Role of the Madden-Julian Oscillation in the El Niñoand Indian Drought of 2002’, International Journal of Climatology 26: 1361-1378.
Saji, N.H, et al. (2006) ‘Tropical Indian Ocean Variability in the IPCC Twentieth-CenturyClimate Simulations’, Journal of Climate 19: 4397-4417.
Stanski, H.R., et al. (1989) Survey of Common Verification Methods in Meteorology.Research Report No. MSRB 89-5, Environment Canada, AtmosphericEnvironment Service. Ottawa: Environment Canada.
Tolika, K., et al. (2006) ‘An Evaluation of a General Circulation Model (GCM) and theNCEP-NCAR Reanalysis Data for Winter Precipitation in Greece’,International Journal of Climatology 26: 935-955.
Torrence, C. and P.J. Webster (1999) ‘Interdecadal Changes in the ENSO-MonsoonSystem’, Journal of Climate 12: 2679-2690.
Trigo, R.M. and J.P. Palutikof (2001) ‘Precipitation Scenarios over Iberia: A Comparisonbetween Direct GCM Output and Different Downscaling Techniques’,Journal of Climate 14: 4422-4446.
Venables, W.N. and B.D. Ripley (2002) Modern Applied Statistics with S. 4th Ed. London:Springer.
von Storch, H. and F.W. Zwiers (2001) Statistical Analysis in Climate Research.Cambridge, UK: Cambridge University Press.
Webster, P.J., et al. (1998) ‘Monsoons: Processes, predictability, and the prospects forprediction’, Journal of Geophysical Research 103(C7): 14451-14510.
Wilks, D. (2006) Statistical Methods in the Atmospheric Sciences. New York: Elsevier.Wolter, K. and M.S. Timlin (1998) ‘Measuring the strength of ENSO events: How does
1997/98 rank?’ Weather 53(9): 315-324.
Qualitative Assessment of the Costsand Benefits of Flood Mitigation:Lower Bagmati Basin – Nepal and India
4C H A P T E R
Ajaya Dixit (ISET-Nepal)Anil Pokhrel (ISET-Nepal)Marcus Moench (ISET) &
The Risk to Resilience Study Team
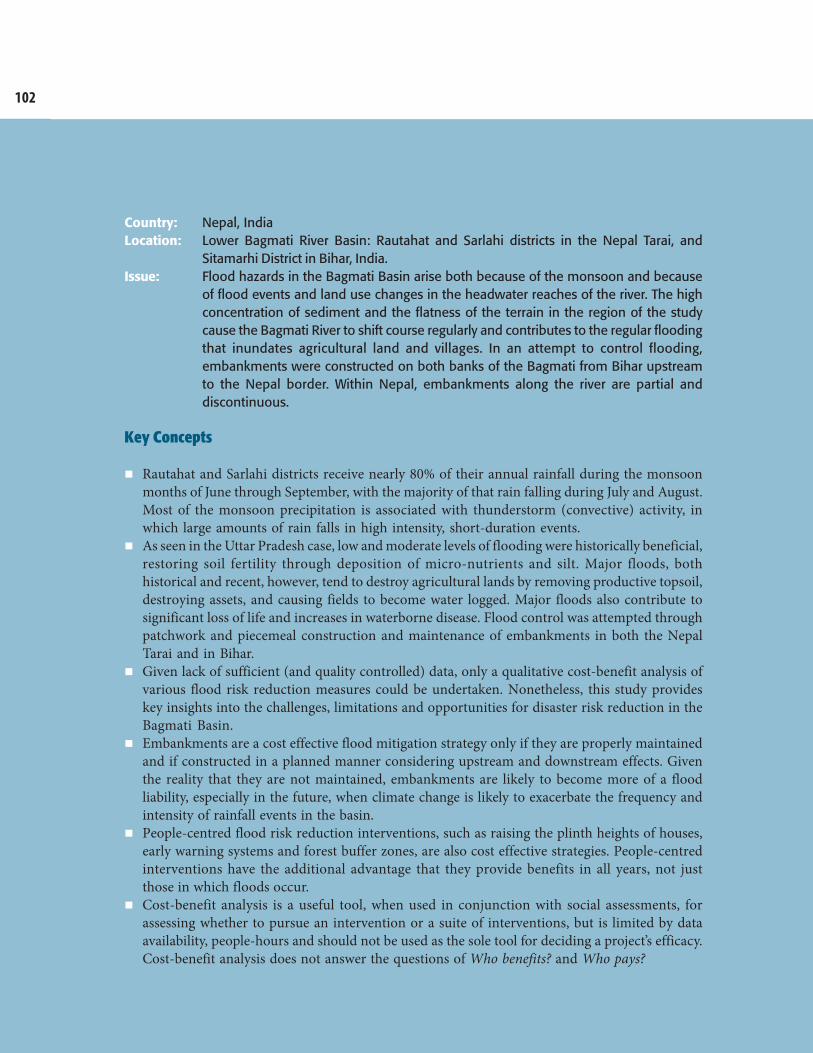
102
Catalyzing Climate and Disaster Resilience: Processes for
Identifying Tangible and Economically Robust Strategies
Country: Nepal, IndiaLocation: Lower Bagmati River Basin: Rautahat and Sarlahi districts in the Nepal Tarai, and
Sitamarhi District in Bihar, India.Issue: Flood hazards in the Bagmati Basin arise both because of the monsoon and because
of flood events and land use changes in the headwater reaches of the river. The highconcentration of sediment and the flatness of the terrain in the region of the studycause the Bagmati River to shift course regularly and contributes to the regular floodingthat inundates agricultural land and villages. In an attempt to control flooding,embankments were constructed on both banks of the Bagmati from Bihar upstreamto the Nepal border. Within Nepal, embankments along the river are partial anddiscontinuous.
Key Concepts
Rautahat and Sarlahi districts receive nearly 80% of their annual rainfall during the monsoonmonths of June through September, with the majority of that rain falling during July and August.Most of the monsoon precipitation is associated with thunderstorm (convective) activity, inwhich large amounts of rain falls in high intensity, short-duration events.As seen in the Uttar Pradesh case, low and moderate levels of flooding were historically beneficial,restoring soil fertility through deposition of micro-nutrients and silt. Major floods, bothhistorical and recent, however, tend to destroy agricultural lands by removing productive topsoil,destroying assets, and causing fields to become water logged. Major floods also contribute tosignificant loss of life and increases in waterborne disease. Flood control was attempted throughpatchwork and piecemeal construction and maintenance of embankments in both the NepalTarai and in Bihar.Given lack of sufficient (and quality controlled) data, only a qualitative cost-benefit analysis ofvarious flood risk reduction measures could be undertaken. Nonetheless, this study provideskey insights into the challenges, limitations and opportunities for disaster risk reduction in theBagmati Basin.Embankments are a cost effective flood mitigation strategy only if they are properly maintainedand if constructed in a planned manner considering upstream and downstream effects. Giventhe reality that they are not maintained, embankments are likely to become more of a floodliability, especially in the future, when climate change is likely to exacerbate the frequency andintensity of rainfall events in the basin.People-centred flood risk reduction interventions, such as raising the plinth heights of houses,early warning systems and forest buffer zones, are also cost effective strategies. People-centredinterventions have the additional advantage that they provide benefits in all years, not justthose in which floods occur.Cost-benefit analysis is a useful tool, when used in conjunction with social assessments, forassessing whether to pursue an intervention or a suite of interventions, but is limited by dataavailability, people-hours and should not be used as the sole tool for deciding a project’s efficacy.Cost-benefit analysis does not answer the questions of Who benefits? and Who pays?
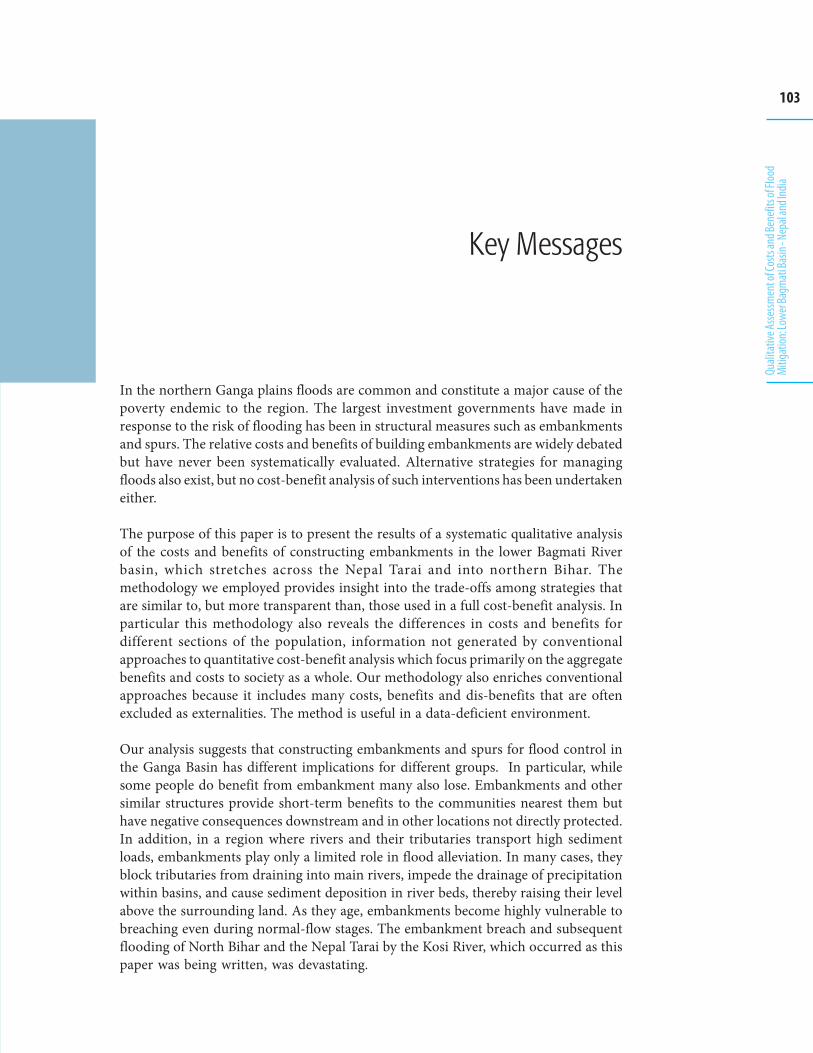
103
Quali
tativ
e Asse
ssmen
t of C
osts
and B
enefi
ts of
Floo
dMi
tigat
ion: L
ower
Bagm
ati B
asin
- Nep
al an
d Ind
ia
Key Messages
In the northern Ganga plains floods are common and constitute a major cause of thepoverty endemic to the region. The largest investment governments have made inresponse to the risk of flooding has been in structural measures such as embankmentsand spurs. The relative costs and benefits of building embankments are widely debatedbut have never been systematically evaluated. Alternative strategies for managingfloods also exist, but no cost-benefit analysis of such interventions has been undertakeneither.
The purpose of this paper is to present the results of a systematic qualitative analysisof the costs and benefits of constructing embankments in the lower Bagmati Riverbasin, which stretches across the Nepal Tarai and into northern Bihar. Themethodology we employed provides insight into the trade-offs among strategies thatare similar to, but more transparent than, those used in a full cost-benefit analysis. Inparticular this methodology also reveals the differences in costs and benefits fordifferent sections of the population, information not generated by conventionalapproaches to quantitative cost-benefit analysis which focus primarily on the aggregatebenefits and costs to society as a whole. Our methodology also enriches conventionalapproaches because it includes many costs, benefits and dis-benefits that are oftenexcluded as externalities. The method is useful in a data-deficient environment.
Our analysis suggests that constructing embankments and spurs for flood control inthe Ganga Basin has different implications for different groups. In particular, whilesome people do benefit from embankment many also lose. Embankments and othersimilar structures provide short-term benefits to the communities nearest them buthave negative consequences downstream and in other locations not directly protected.In addition, in a region where rivers and their tributaries transport high sedimentloads, embankments play only a limited role in flood alleviation. In many cases, theyblock tributaries from draining into main rivers, impede the drainage of precipitationwithin basins, and cause sediment deposition in river beds, thereby raising their levelabove the surrounding land. As they age, embankments become highly vulnerable tobreaching even during normal-flow stages. The embankment breach and subsequentflooding of North Bihar and the Nepal Tarai by the Kosi River, which occurred as thispaper was being written, was devastating.
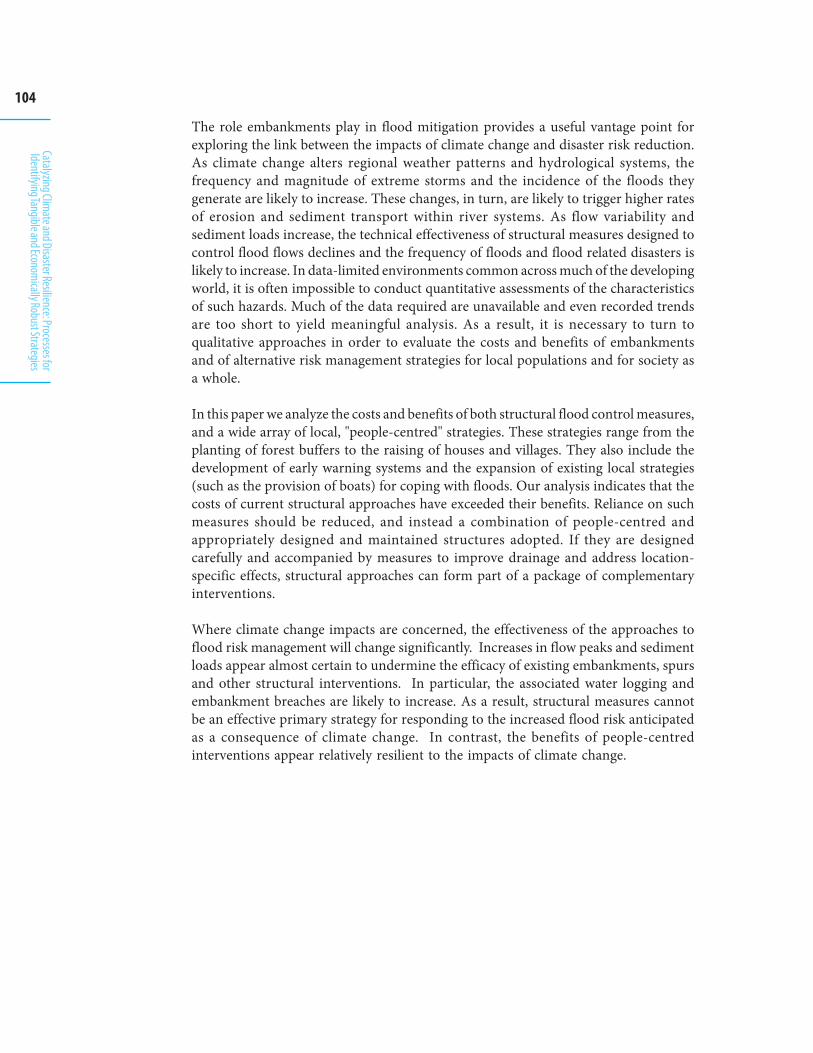
104
Catalyzing Climate and Disaster Resilience: Processes for
Identifying Tangible and Economically Robust Strategies
The role embankments play in flood mitigation provides a useful vantage point forexploring the link between the impacts of climate change and disaster risk reduction.As climate change alters regional weather patterns and hydrological systems, thefrequency and magnitude of extreme storms and the incidence of the floods theygenerate are likely to increase. These changes, in turn, are likely to trigger higher ratesof erosion and sediment transport within river systems. As flow variability andsediment loads increase, the technical effectiveness of structural measures designed tocontrol flood flows declines and the frequency of floods and flood related disasters islikely to increase. In data-limited environments common across much of the developingworld, it is often impossible to conduct quantitative assessments of the characteristicsof such hazards. Much of the data required are unavailable and even recorded trendsare too short to yield meaningful analysis. As a result, it is necessary to turn toqualitative approaches in order to evaluate the costs and benefits of embankmentsand of alternative risk management strategies for local populations and for society asa whole.
In this paper we analyze the costs and benefits of both structural flood control measures,and a wide array of local, "people-centred" strategies. These strategies range from theplanting of forest buffers to the raising of houses and villages. They also include thedevelopment of early warning systems and the expansion of existing local strategies(such as the provision of boats) for coping with floods. Our analysis indicates that thecosts of current structural approaches have exceeded their benefits. Reliance on suchmeasures should be reduced, and instead a combination of people-centred andappropriately designed and maintained structures adopted. If they are designedcarefully and accompanied by measures to improve drainage and address location-specific effects, structural approaches can form part of a package of complementaryinterventions.
Where climate change impacts are concerned, the effectiveness of the approaches toflood risk management will change significantly. Increases in flow peaks and sedimentloads appear almost certain to undermine the efficacy of existing embankments, spursand other structural interventions. In particular, the associated water logging andembankment breaches are likely to increase. As a result, structural measures cannotbe an effective primary strategy for responding to the increased flood risk anticipatedas a consequence of climate change. In contrast, the benefits of people-centredinterventions appear relatively resilient to the impacts of climate change.
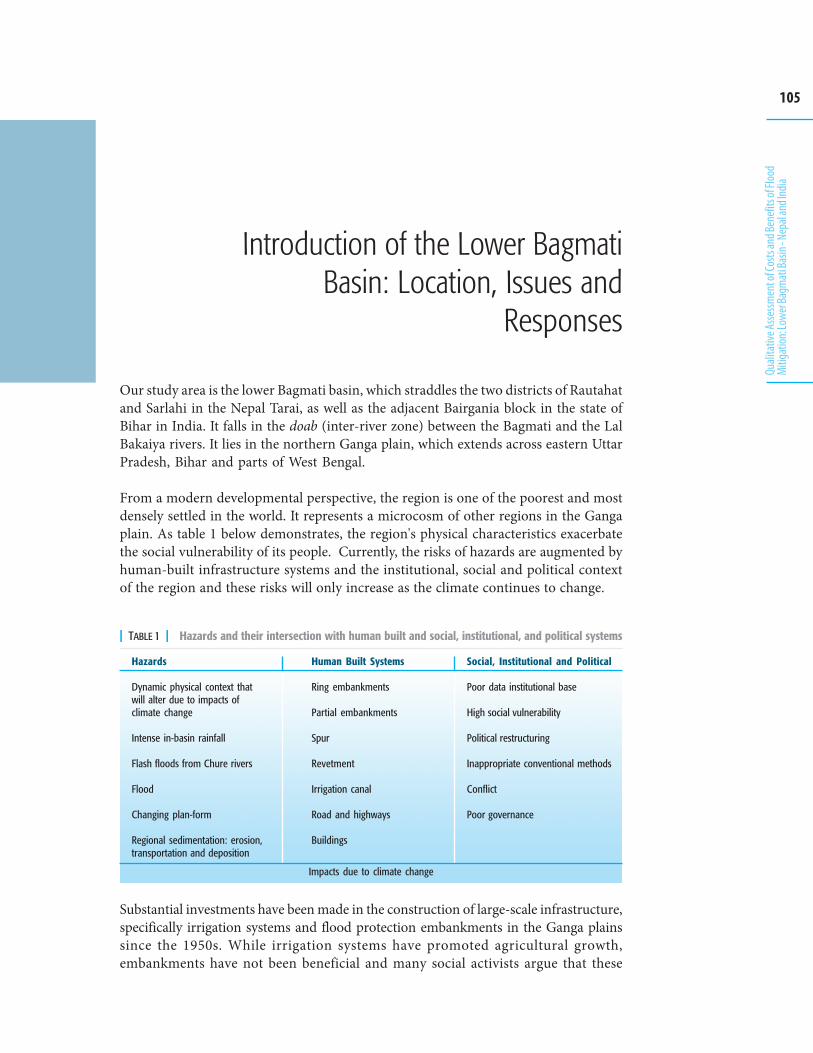
105
Quali
tativ
e Asse
ssmen
t of C
osts
and B
enefi
ts of
Floo
dMi
tigat
ion: L
ower
Bagm
ati B
asin
- Nep
al an
d Ind
ia
Introduction of the Lower BagmatiBasin: Location, Issues and
Responses
Our study area is the lower Bagmati basin, which straddles the two districts of Rautahatand Sarlahi in the Nepal Tarai, as well as the adjacent Bairgania block in the state ofBihar in India. It falls in the doab (inter-river zone) between the Bagmati and the LalBakaiya rivers. It lies in the northern Ganga plain, which extends across eastern UttarPradesh, Bihar and parts of West Bengal.
From a modern developmental perspective, the region is one of the poorest and mostdensely settled in the world. It represents a microcosm of other regions in the Gangaplain. As table 1 below demonstrates, the region's physical characteristics exacerbatethe social vulnerability of its people. Currently, the risks of hazards are augmented byhuman-built infrastructure systems and the institutional, social and political contextof the region and these risks will only increase as the climate continues to change.
Hazards
Dynamic physical context thatwill alter due to impacts ofclimate change
Intense in-basin rainfall
Flash floods from Chure rivers
Flood
Changing plan-form
Regional sedimentation: erosion,transportation and deposition
Human Built Systems
Ring embankments
Partial embankments
Spur
Revetment
Irrigation canal
Road and highways
Buildings
Social, Institutional and Political
Poor data institutional base
High social vulnerability
Political restructuring
Inappropriate conventional methods
Conflict
Poor governance
Impacts due to climate change
| TABLE 1 | Hazards and their intersection with human built and social, institutional, and political systems
Substantial investments have been made in the construction of large-scale infrastructure,specifically irrigation systems and flood protection embankments in the Ganga plainssince the 1950s. While irrigation systems have promoted agricultural growth,embankments have not been beneficial and many social activists argue that these
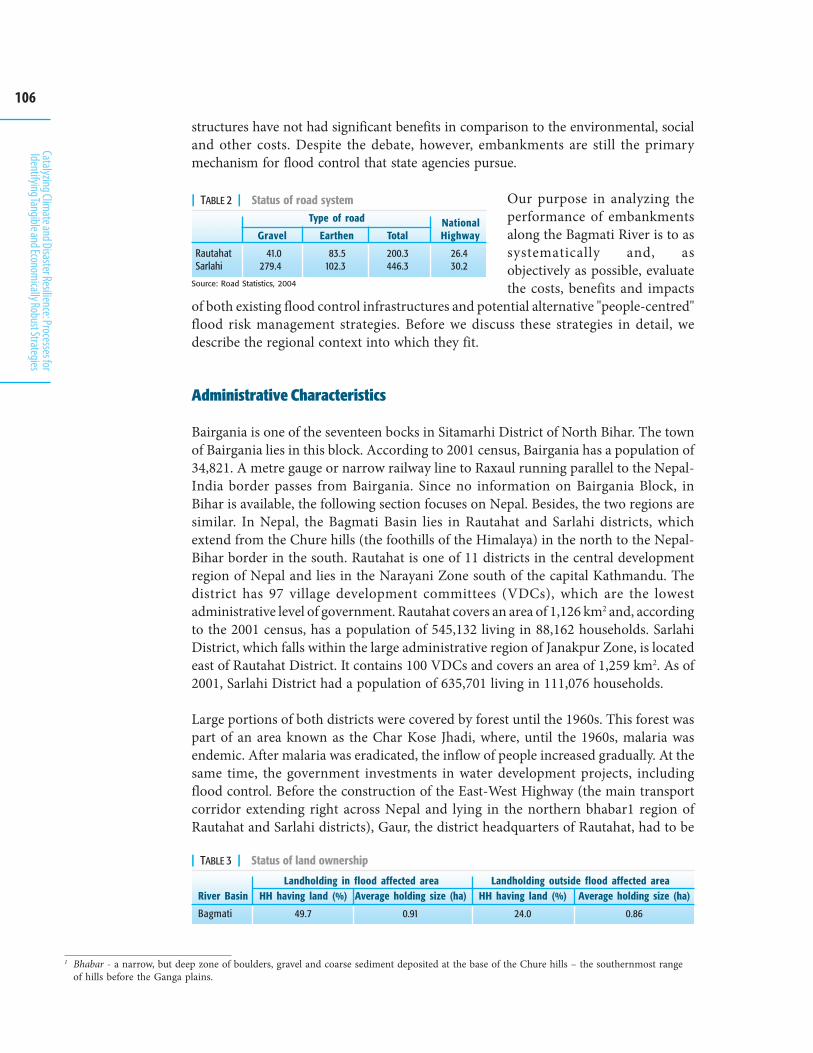
106
Catalyzing Climate and Disaster Resilience: Processes for
Identifying Tangible and Economically Robust Strategies
structures have not had significant benefits in comparison to the environmental, socialand other costs. Despite the debate, however, embankments are still the primarymechanism for flood control that state agencies pursue.
Our purpose in analyzing theperformance of embankmentsalong the Bagmati River is to assystematically and, asobjectively as possible, evaluatethe costs, benefits and impacts
of both existing flood control infrastructures and potential alternative "people-centred"flood risk management strategies. Before we discuss these strategies in detail, wedescribe the regional context into which they fit.
Administrative Characteristics
Bairgania is one of the seventeen bocks in Sitamarhi District of North Bihar. The townof Bairgania lies in this block. According to 2001 census, Bairgania has a population of34,821. A metre gauge or narrow railway line to Raxaul running parallel to the Nepal-India border passes from Bairgania. Since no information on Bairgania Block, inBihar is available, the following section focuses on Nepal. Besides, the two regions aresimilar. In Nepal, the Bagmati Basin lies in Rautahat and Sarlahi districts, whichextend from the Chure hills (the foothills of the Himalaya) in the north to the Nepal-Bihar border in the south. Rautahat is one of 11 districts in the central developmentregion of Nepal and lies in the Narayani Zone south of the capital Kathmandu. Thedistrict has 97 village development committees (VDCs), which are the lowestadministrative level of government. Rautahat covers an area of 1,126 km2 and, accordingto the 2001 census, has a population of 545,132 living in 88,162 households. SarlahiDistrict, which falls within the large administrative region of Janakpur Zone, is locatedeast of Rautahat District. It contains 100 VDCs and covers an area of 1,259 km2. As of2001, Sarlahi District had a population of 635,701 living in 111,076 households.
Large portions of both districts were covered by forest until the 1960s. This forest waspart of an area known as the Char Kose Jhadi, where, until the 1960s, malaria wasendemic. After malaria was eradicated, the inflow of people increased gradually. At thesame time, the government investments in water development projects, includingflood control. Before the construction of the East-West Highway (the main transportcorridor extending right across Nepal and lying in the northern bhabar1 region ofRautahat and Sarlahi districts), Gaur, the district headquarters of Rautahat, had to be
1 Bhabar - a narrow, but deep zone of boulders, gravel and coarse sediment deposited at the base of the Chure hills – the southernmost rangeof hills before the Ganga plains.
River Basin
Bagmati
HH having land (%)
49.7
Average holding size (ha)
0.91
HH having land (%)
24.0
Average holding size (ha)
0.86
| TABLE 3 | Status of land ownership
Landholding in flood affected area Landholding outside flood affected area
Gravel
41.0279.4
Earthen
83.5102.3
Total
200.3446.3
NationalHighway
26.430.2
RautahatSarlahi
Type of road
| TABLE 2 | Status of road system
Source: Road Statistics, 2004
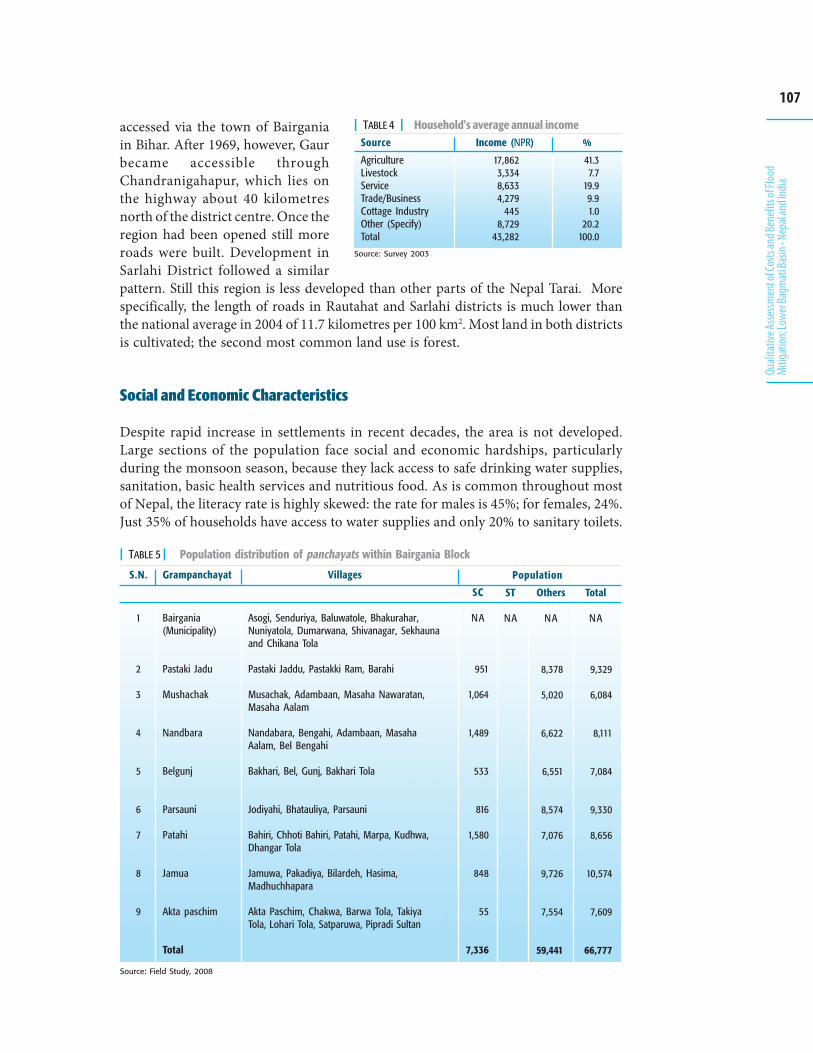
107
Quali
tativ
e Asse
ssmen
t of C
osts
and B
enefi
ts of
Floo
dMi
tigat
ion: L
ower
Bagm
ati B
asin
- Nep
al an
d Ind
ia
accessed via the town of Bairganiain Bihar. After 1969, however, Gaurbecame accessible throughChandranigahapur, which lies onthe highway about 40 kilometresnorth of the district centre. Once theregion had been opened still moreroads were built. Development inSarlahi District followed a similarpattern. Still this region is less developed than other parts of the Nepal Tarai. Morespecifically, the length of roads in Rautahat and Sarlahi districts is much lower thanthe national average in 2004 of 11.7 kilometres per 100 km2. Most land in both districtsis cultivated; the second most common land use is forest.
Social and Economic Characteristics
Despite rapid increase in settlements in recent decades, the area is not developed.Large sections of the population face social and economic hardships, particularlyduring the monsoon season, because they lack access to safe drinking water supplies,sanitation, basic health services and nutritious food. As is common throughout mostof Nepal, the literacy rate is highly skewed: the rate for males is 45%; for females, 24%.Just 35% of households have access to water supplies and only 20% to sanitary toilets.
Source
AgricultureLivestockServiceTrade/BusinessCottage IndustryOther (Specify)Total
Income (NPR)
17,8623,3348,6334,279
4458,729
43,282
%
41.37.7
19.99.91.0
20.2100.0
| TABLE 4 | Household's average annual income
Source: Survey 2003
S.N.
1
2
3
4
5
6
7
8
9
Grampanchayat
Bairgania(Municipality)
Pastaki Jadu
Mushachak
Nandbara
Belgunj
Parsauni
Patahi
Jamua
Akta paschim
Total
ST
NA
| TABLE 5 | Population distribution of panchayats within Bairgania Block
SC
NA
951
1,064
1,489
533
816
1,580
848
55
7,336
Others
NA
8,378
5,020
6,622
6,551
8,574
7,076
9,726
7,554
59,441
Total
NA
9,329
6,084
8,111
7,084
9,330
8,656
10,574
7,609
66,777
PopulationVillages
Asogi, Senduriya, Baluwatole, Bhakurahar,Nuniyatola, Dumarwana, Shivanagar, Sekhaunaand Chikana Tola
Pastaki Jaddu, Pastakki Ram, Barahi
Musachak, Adambaan, Masaha Nawaratan,Masaha Aalam
Nandabara, Bengahi, Adambaan, MasahaAalam, Bel Bengahi
Bakhari, Bel, Gunj, Bakhari Tola
Jodiyahi, Bhatauliya, Parsauni
Bahiri, Chhoti Bahiri, Patahi, Marpa, Kudhwa,Dhangar Tola
Jamuwa, Pakadiya, Bilardeh, Hasima,Madhuchhapara
Akta Paschim, Chakwa, Barwa Tola, TakiyaTola, Lohari Tola, Satparuwa, Pipradi Sultan
Source: Field Study, 2008
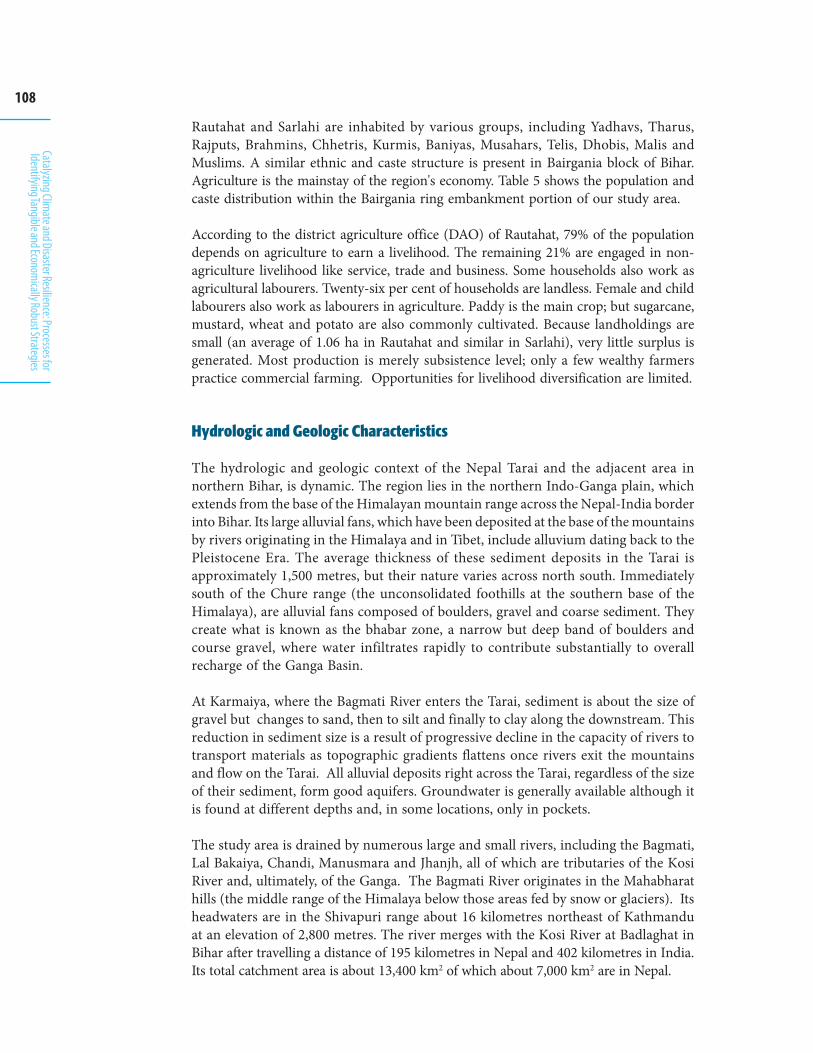
108
Catalyzing Climate and Disaster Resilience: Processes for
Identifying Tangible and Economically Robust Strategies
Rautahat and Sarlahi are inhabited by various groups, including Yadhavs, Tharus,Rajputs, Brahmins, Chhetris, Kurmis, Baniyas, Musahars, Telis, Dhobis, Malis andMuslims. A similar ethnic and caste structure is present in Bairgania block of Bihar.Agriculture is the mainstay of the region's economy. Table 5 shows the population andcaste distribution within the Bairgania ring embankment portion of our study area.
According to the district agriculture office (DAO) of Rautahat, 79% of the populationdepends on agriculture to earn a livelihood. The remaining 21% are engaged in non-agriculture livelihood like service, trade and business. Some households also work asagricultural labourers. Twenty-six per cent of households are landless. Female and childlabourers also work as labourers in agriculture. Paddy is the main crop; but sugarcane,mustard, wheat and potato are also commonly cultivated. Because landholdings aresmall (an average of 1.06 ha in Rautahat and similar in Sarlahi), very little surplus isgenerated. Most production is merely subsistence level; only a few wealthy farmerspractice commercial farming. Opportunities for livelihood diversification are limited.
Hydrologic and Geologic Characteristics
The hydrologic and geologic context of the Nepal Tarai and the adjacent area innorthern Bihar, is dynamic. The region lies in the northern Indo-Ganga plain, whichextends from the base of the Himalayan mountain range across the Nepal-India borderinto Bihar. Its large alluvial fans, which have been deposited at the base of the mountainsby rivers originating in the Himalaya and in Tibet, include alluvium dating back to thePleistocene Era. The average thickness of these sediment deposits in the Tarai isapproximately 1,500 metres, but their nature varies across north south. Immediatelysouth of the Chure range (the unconsolidated foothills at the southern base of theHimalaya), are alluvial fans composed of boulders, gravel and coarse sediment. Theycreate what is known as the bhabar zone, a narrow but deep band of boulders andcourse gravel, where water infiltrates rapidly to contribute substantially to overallrecharge of the Ganga Basin.
At Karmaiya, where the Bagmati River enters the Tarai, sediment is about the size ofgravel but changes to sand, then to silt and finally to clay along the downstream. Thisreduction in sediment size is a result of progressive decline in the capacity of rivers totransport materials as topographic gradients flattens once rivers exit the mountainsand flow on the Tarai. All alluvial deposits right across the Tarai, regardless of the sizeof their sediment, form good aquifers. Groundwater is generally available although itis found at different depths and, in some locations, only in pockets.
The study area is drained by numerous large and small rivers, including the Bagmati,Lal Bakaiya, Chandi, Manusmara and Jhanjh, all of which are tributaries of the KosiRiver and, ultimately, of the Ganga. The Bagmati River originates in the Mahabharathills (the middle range of the Himalaya below those areas fed by snow or glaciers). Itsheadwaters are in the Shivapuri range about 16 kilometres northeast of Kathmanduat an elevation of 2,800 metres. The river merges with the Kosi River at Badlaghat inBihar after travelling a distance of 195 kilometres in Nepal and 402 kilometres in India.Its total catchment area is about 13,400 km2 of which about 7,000 km2 are in Nepal.
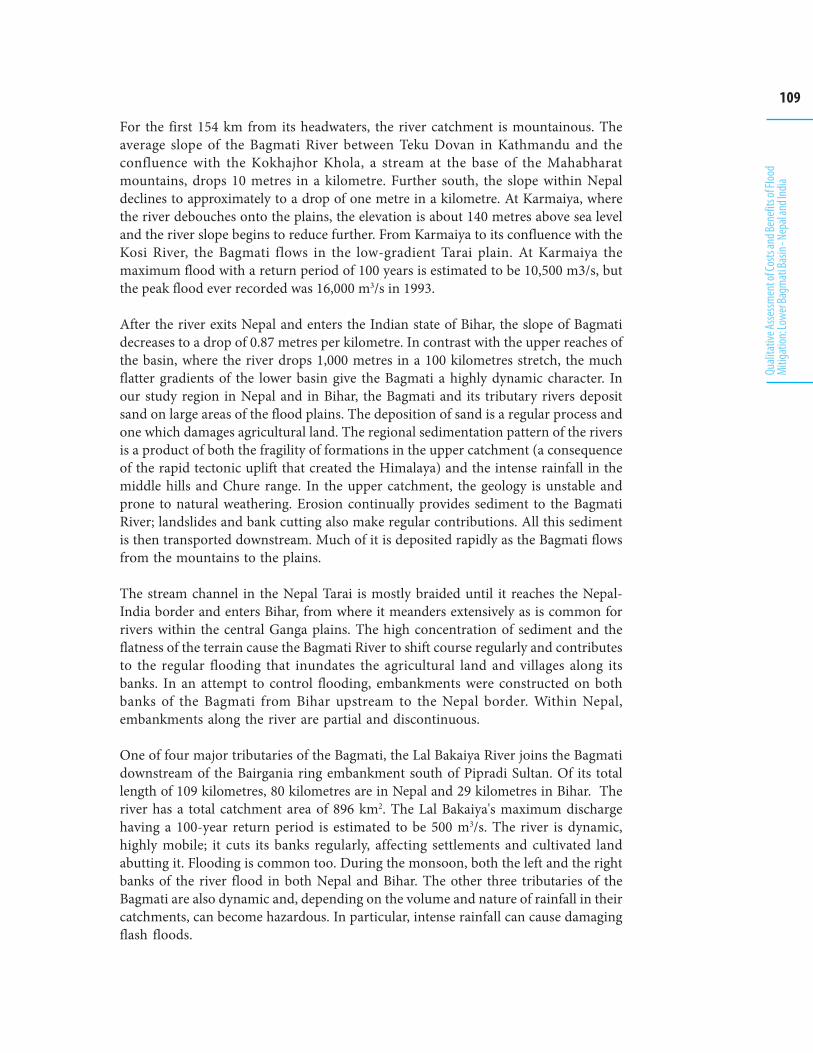
109
Quali
tativ
e Asse
ssmen
t of C
osts
and B
enefi
ts of
Floo
dMi
tigat
ion: L
ower
Bagm
ati B
asin
- Nep
al an
d Ind
ia
For the first 154 km from its headwaters, the river catchment is mountainous. Theaverage slope of the Bagmati River between Teku Dovan in Kathmandu and theconfluence with the Kokhajhor Khola, a stream at the base of the Mahabharatmountains, drops 10 metres in a kilometre. Further south, the slope within Nepaldeclines to approximately to a drop of one metre in a kilometre. At Karmaiya, wherethe river debouches onto the plains, the elevation is about 140 metres above sea leveland the river slope begins to reduce further. From Karmaiya to its confluence with theKosi River, the Bagmati flows in the low-gradient Tarai plain. At Karmaiya themaximum flood with a return period of 100 years is estimated to be 10,500 m3/s, butthe peak flood ever recorded was 16,000 m3/s in 1993.
After the river exits Nepal and enters the Indian state of Bihar, the slope of Bagmatidecreases to a drop of 0.87 metres per kilometre. In contrast with the upper reaches ofthe basin, where the river drops 1,000 metres in a 100 kilometres stretch, the muchflatter gradients of the lower basin give the Bagmati a highly dynamic character. Inour study region in Nepal and in Bihar, the Bagmati and its tributary rivers depositsand on large areas of the flood plains. The deposition of sand is a regular process andone which damages agricultural land. The regional sedimentation pattern of the riversis a product of both the fragility of formations in the upper catchment (a consequenceof the rapid tectonic uplift that created the Himalaya) and the intense rainfall in themiddle hills and Chure range. In the upper catchment, the geology is unstable andprone to natural weathering. Erosion continually provides sediment to the BagmatiRiver; landslides and bank cutting also make regular contributions. All this sedimentis then transported downstream. Much of it is deposited rapidly as the Bagmati flowsfrom the mountains to the plains.
The stream channel in the Nepal Tarai is mostly braided until it reaches the Nepal-India border and enters Bihar, from where it meanders extensively as is common forrivers within the central Ganga plains. The high concentration of sediment and theflatness of the terrain cause the Bagmati River to shift course regularly and contributesto the regular flooding that inundates the agricultural land and villages along itsbanks. In an attempt to control flooding, embankments were constructed on bothbanks of the Bagmati from Bihar upstream to the Nepal border. Within Nepal,embankments along the river are partial and discontinuous.
One of four major tributaries of the Bagmati, the Lal Bakaiya River joins the Bagmatidownstream of the Bairgania ring embankment south of Pipradi Sultan. Of its totallength of 109 kilometres, 80 kilometres are in Nepal and 29 kilometres in Bihar. Theriver has a total catchment area of 896 km2. The Lal Bakaiya's maximum dischargehaving a 100-year return period is estimated to be 500 m3/s. The river is dynamic,highly mobile; it cuts its banks regularly, affecting settlements and cultivated landabutting it. Flooding is common too. During the monsoon, both the left and the rightbanks of the river flood in both Nepal and Bihar. The other three tributaries of theBagmati are also dynamic and, depending on the volume and nature of rainfall in theircatchments, can become hazardous. In particular, intense rainfall can cause damagingflash floods.
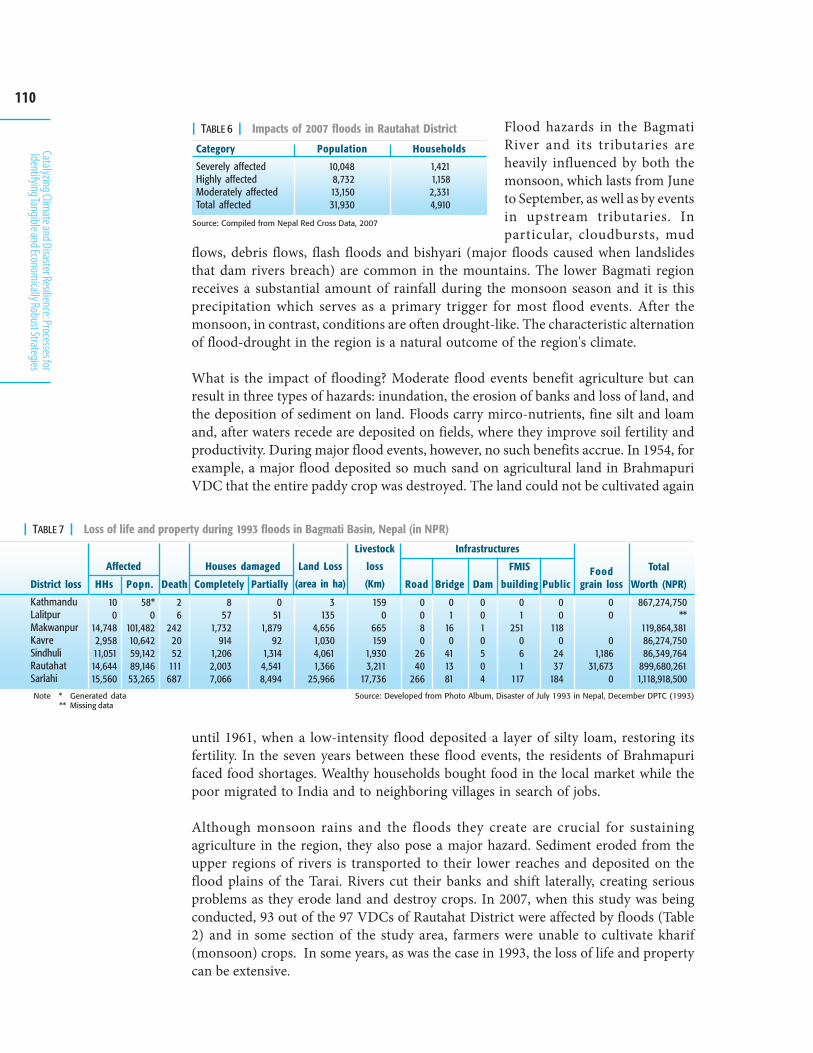
110
Catalyzing Climate and Disaster Resilience: Processes for
Identifying Tangible and Economically Robust Strategies
Flood hazards in the BagmatiRiver and its tributaries areheavily influenced by both themonsoon, which lasts from Juneto September, as well as by eventsin upstream tributaries. Inparticular, cloudbursts, mud
flows, debris flows, flash floods and bishyari (major floods caused when landslidesthat dam rivers breach) are common in the mountains. The lower Bagmati regionreceives a substantial amount of rainfall during the monsoon season and it is thisprecipitation which serves as a primary trigger for most flood events. After themonsoon, in contrast, conditions are often drought-like. The characteristic alternationof flood-drought in the region is a natural outcome of the region's climate.
What is the impact of flooding? Moderate flood events benefit agriculture but canresult in three types of hazards: inundation, the erosion of banks and loss of land, andthe deposition of sediment on land. Floods carry mirco-nutrients, fine silt and loamand, after waters recede are deposited on fields, where they improve soil fertility andproductivity. During major flood events, however, no such benefits accrue. In 1954, forexample, a major flood deposited so much sand on agricultural land in BrahmapuriVDC that the entire paddy crop was destroyed. The land could not be cultivated again
Category
Severely affectedHighly affectedModerately affectedTotal affected
Population
10,0488,73213,15031,930
Households
1,4211,1582,3314,910
| TABLE 6 | Impacts of 2007 floods in Rautahat District
Source: Compiled from Nepal Red Cross Data, 2007
until 1961, when a low-intensity flood deposited a layer of silty loam, restoring itsfertility. In the seven years between these flood events, the residents of Brahmapurifaced food shortages. Wealthy households bought food in the local market while thepoor migrated to India and to neighboring villages in search of jobs.
Although monsoon rains and the floods they create are crucial for sustainingagriculture in the region, they also pose a major hazard. Sediment eroded from theupper regions of rivers is transported to their lower reaches and deposited on theflood plains of the Tarai. Rivers cut their banks and shift laterally, creating seriousproblems as they erode land and destroy crops. In 2007, when this study was beingconducted, 93 out of the 97 VDCs of Rautahat District were affected by floods (Table2) and in some section of the study area, farmers were unable to cultivate kharif(monsoon) crops. In some years, as was the case in 1993, the loss of life and propertycan be extensive.
| TABLE 7 | Loss of life and property during 1993 floods in Bagmati Basin, Nepal (in NPR)
District loss
KathmanduLalitpurMakwanpurKavreSindhuliRautahatSarlahi
100
14,7482,95811,05114,64415,560
Note * Generated data ** Missing data
Affected
HHs Popn.
58*0
101,48210,64259,14289,14653,265
Death
26
2422052
111687
857
1,732914
1,2062,0037,066
Houses damaged
Completely Partially
051
1,87992
1,3144,5418,494
Land Loss
(area in ha)
3135
4,6561,0304,0611,366
25,966
Livestock
loss
(Km)
1590
665159
1,9303,211
17,736
Infrastructures
0080
2640
266
Road Bridge Dam
FMIS
building Public
01
160
411381
0010504
01
251061
117
00
1180
2437
184
Foodgrain loss
00
01,186
31,6730
Total
Worth (NPR)
867,274,750**
119,864,38186,274,75086,349,764
899,680,2611,118,918,500
Source: Developed from Photo Album, Disaster of July 1993 in Nepal, December DPTC (1993)
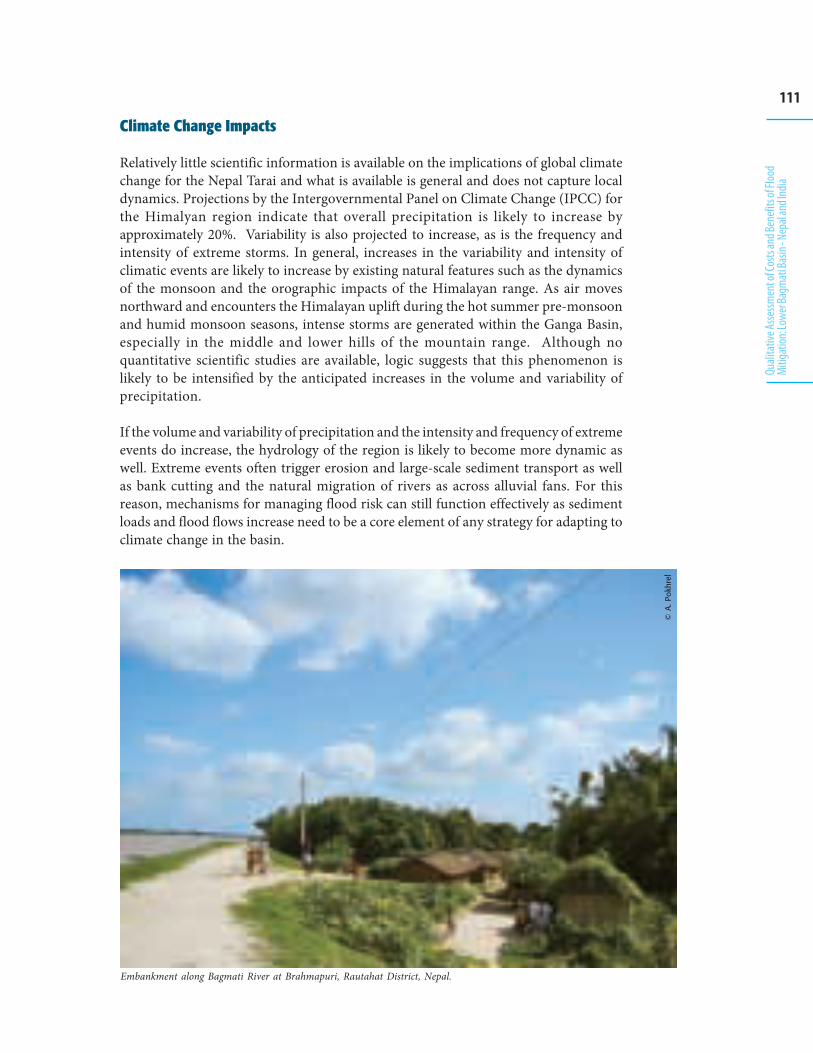
111
Quali
tativ
e Asse
ssmen
t of C
osts
and B
enefi
ts of
Floo
dMi
tigat
ion: L
ower
Bagm
ati B
asin
- Nep
al an
d Ind
ia
Climate Change Impacts
Relatively little scientific information is available on the implications of global climatechange for the Nepal Tarai and what is available is general and does not capture localdynamics. Projections by the Intergovernmental Panel on Climate Change (IPCC) forthe Himalyan region indicate that overall precipitation is likely to increase byapproximately 20%. Variability is also projected to increase, as is the frequency andintensity of extreme storms. In general, increases in the variability and intensity ofclimatic events are likely to increase by existing natural features such as the dynamicsof the monsoon and the orographic impacts of the Himalayan range. As air movesnorthward and encounters the Himalayan uplift during the hot summer pre-monsoonand humid monsoon seasons, intense storms are generated within the Ganga Basin,especially in the middle and lower hills of the mountain range. Although noquantitative scientific studies are available, logic suggests that this phenomenon islikely to be intensified by the anticipated increases in the volume and variability ofprecipitation.
If the volume and variability of precipitation and the intensity and frequency of extremeevents do increase, the hydrology of the region is likely to become more dynamic aswell. Extreme events often trigger erosion and large-scale sediment transport as wellas bank cutting and the natural migration of rivers as across alluvial fans. For thisreason, mechanisms for managing flood risk can still function effectively as sedimentloads and flood flows increase need to be a core element of any strategy for adapting toclimate change in the basin.
Embankment along Bagmati River at Brahmapuri, Rautahat District, Nepal.
© A
. Pok
hrel
112
Catalyzing Climate and Disaster Resilience: Processes for
Identifying Tangible and Economically Robust Strategies
Evaluating Alternative FloodManagement Strategies
Given the dynamic nature of the Bagmati River and its tributaries, the adverse impactthat existing patterns of flooding already wreak on with region's population and thelikelihood that such impacts will worsen as climate change makes the regionalhydrological systems more erratic, there is an urgent need to identify effectivemechanisms for flood risk management. As discussed above, the current approachesto flood management implemented by the governments of India and Nepal relyprimarily on embankments and other structural measures. In addition to such formalinterventions, local populations have developed an array of strategies for coping withor adapting to the dynamic nature of the region's hydrology.
There is little data on the effectiveness of either these structural measures or the informalself-initiated responses of individuals or communities. There is a dearth of even themost basic of data, such as precipitation within the basin, river flow levels, areas offlooding, and investment in the construction of flood control structures, whateverdata is available is often incomplete or of uncertain quality. With so little information,making effective decisions regarding flood control strategies is difficult.
Because there is so little quantitative information, it is essential to turn to qualitativeapproaches to identifying and evaluating alternative strategies as a first most basicstep towards making informed decisions. What sort of information is needed? At thevery least, an understanding of the potential strategies for responding to floods isessential. Beyond this, developing an understanding of the effectiveness of suchstrategies as well as benefits they generate and, the costs they entail, who benefits andwho loses is central to strategic decision-making. Qualitative approaches to cost-benefit identification and evaluation, such as the methodology outlined below, canprovide much of this insight. If necessary, such approaches can also provide afoundation for quantitative approaches to evaluating the costs and benefits of specificstrategies for flood risk management.
113
Quali
tativ
e Asse
ssmen
t of C
osts
and B
enefi
ts of
Floo
dMi
tigat
ion: L
ower
Bagm
ati B
asin
- Nep
al an
d Ind
ia
The Qualitative CBAMethodology using Shared
Learning Dialogues
BOX 1Indicators of wellbeing
A society is doing well when its members enjoy
• Secure access to food, clothes, shelter, drinking waterand energy
• Affordable health services, hygiene and sanitation• Access to education• Access to reliable communication systems• A reliable source of livelihoods, i.e. livelihood resilience• Social harmony• Individual and collective security• A clean environment• Harmonious cultural and religious identity• Voice and representation• Social equity
How does one evaluate the potential gains and losses associated with a flood or otherdisasters. Gains help meet basic societal goals such as those listed in Box 1, whilelosses reduce the ability of society to reach them. Reaching these indicators of wellbeingis central to development efforts, but far beyond thecapacity of disaster risk reduction interventions to achieveon their own. Besides, only the first four objectives aretangible enough to be directly identified and measured. Itis these four objectives that our methodology assesses toestimate the costs and benefits of flood risk managementstrategies though it could also be used to identify thesestrategies influence a society's ability to reach some of theother goals as well.
To assess cost and benefits, we followed the relatively simpleset of steps listed below though the process was not aslinear or smooth as the step suggests. Indeed, lines dividingsteps became evident only in retrospect and the ordersometimes varied. That said, the overall process ofevaluation did move through the phases identified below.
STEP 1: coping and initial engagement: Since ISET-Nepal and its partners have beenworking in the region for several years, our initial scoping activities focusedon reviewing the relevant information (maps, background documents, etc.)already available as well as on making a series of visits to the region. Duringthese visits team members discussed flood-related issues with existing contacts,identified new contacts and met with local communities. In addition, wegathered published and other information related to the region's hydrologyand the impacts of climate change that ISET-Nepal had not collected earlier.This step identified areas affected by and vulnerable to floods as well as localperceptions about existing governmental, community and individual strategiesfor responding to floods and, in effect, set the stage for more detaileddiscussions with local communities regarding the specific nature of floodhazards and response strategies. In addition, our review of global and regional
Adapted from Kuiper (1971)
114
Catalyzing Climate and Disaster Resilience: Processes for
Identifying Tangible and Economically Robust Strategies
climate and water-related literature identified key issues that did not emergein discussions at the local level.
STEP 2: Intensive shared learning dialogues to identify key risks and potentialresponse strategies: The next step was to hold a series of focused groupand one-to-one discussions in local communities in order to outline floodhazards and responses to them. The discussions focused specifically on thenature, condition and location of the flood mitigation measures thegovernment had implemented as well as on systematically identifying whatpeople do during floods and what measures they take to meet their keyneeds, including how they protect their lives, livelihoods and assets. Usinginformation from global scientific literature on climate change, study teammembers asked individuals and groups what they thought the major issuesand challenges would be if climate change projections became a reality andif floods and drought impacts become more intense and more frequent.
STEP 3: Intervention-specific evaluations to identify the benefits and costs associatedwith each response strategy. The results of the shared learning dialogueswere used to identify key risk management measures for evaluation. In thelower Bagmati River Basin these measures consisted of (a) structuralinterventions, specifically the network of flood control embankments thathas been constructed over recent decades; and (b) an array of alternativemeasures, undertaken by individuals, communities and NGOs to minimizethe risks they face. In the case of embankments, the evaluation involvedmapping existing structures and then holding a series of shared learningdialogues with communities along a series of transects cutting across theregion. The purpose of this exercise was to identify and discuss localperceptions of the benefits of these interventions and if the negative impactsassociated with them. Since alternative measures do not cut right across thelandscape, discussions were not organized along the transects.
STEP 4: Ranking and related techniques to assign relative weights to perceivedbenefits and costs: In consultation with local communities, we ranked therelative costs and benefits of each response measure identified. People wereasked to identify all the benefits associated with each measure and then weighteach benefit on a simple scale from small to medium to large. In the case ofembankments, the ranking of both benefits and costs was done along transectsthat cut across protected and unprotected areas both up and downstreamfrom the protected locations. During the shared learning dialogues processwe listened to the perspectives and insights of local communities but also hadthem consider information that they had not previously known. Discussionsemphasized both direct costs (like how much was invested to constructembankments, what it costs to buy a boat or raise the level of houses) andindirect costs (like the losses due to water logging outside embankments). Theend result of this process was (a) a list of strategies that either had beenimplemented to respond to floods or that contribute to the ability ofindividuals and communities to manage flood risks; (b) a list of the direct andindirect benefits and costs associated with each strategy; and (c) a weighting
115
Quali
tativ
e Asse
ssmen
t of C
osts
and B
enefi
ts of
Floo
dMi
tigat
ion: L
ower
Bagm
ati B
asin
- Nep
al an
d Ind
ia
of those costs and benefits using a simple plus-minus system. Examples ofhow this worked in practice are outlined in the next section.
STEP 5: Shared learning dialogues to identify directions of change in perceivedbenefits and costs as climate and other processes of change proceed: Inthis final step discussions were held with communities to consider theimplications of climate change would have on the direct and indirect benefitsand costs currently associated with each of the main response strategies.The focus was on whether or not the strategies would remain effective in theprojected climate change scenarios. Participants were asked, for example,whether or not they thought water logging and the tendency of embankmentsto breach would increase. They were also asked whether or not the benefitsof the community and household-based strategies listed of Box 2 (such asthe traditional practices of using boats, raising the level of plinths andconstructing silos to protect grains in locations safe from inundation) wouldstill be generated. Other questions brought out peoples' perception of thechanges in the direct and indirect costs associated with each strategy.
After all five steps had been carried out, we had generated a list of hazards and responsestrategies as well as the costs and benefits associated with each strategy and their relativeweights. The costs and benefits related to the tangible indicators of wellbeing identifiedin the first four bullets in Box 1 (secure drinking water, food and shelter, energy, andhealth and education and communication services). The methodology also enabled usto identify and weight the impacts of various strategies on some of the less tangibleindicators of wellbeing, such as livelihood resilience, social equity and harmony, a cleanenvironment, and so on. How this worked in practice is illustrated in the example below.
Example of the Methodology Employed
The five-step sequential process described above was over the qualitative yet systematiccost-benefit assessment. It involved conducting shared learning dialogues with localpeople, local governments and NGOs about specific risk mitigation measures, bothconventional and alternative. This assessment was conducted in villages located alonga series of transects selected to cut across a spectrum of conditions from those in thelower sections of the basin in Bihar to those in the adjacent upstream areas in Nepal(see Figure 1). For each transect, costs and benefits were compiled according to thetype of intervention. For some local interventions, such as early warning systems,raising the plinth of houses and providing boats for use during floods, the use oftransects that cut across the region was less essential than for other interventions,such as embankments, whose upstream-downstream relationships strongly influencecosts, benefits and their distribution. Even in terms of community based responses,however, strategies do differ substantially in different areas because the nature of theflood hazards people face change. The use of transects enabled the evaluators to dotwo things:
a) capture the local nuances of the interventions carried out in various villages andtheir relation to the various characteristics of the flood hazard; and
116
Catalyzing Climate and Disaster Resilience: Processes for
Identifying Tangible and Economically Robust Strategies
b) zoom out for a wider and therefore more complete picture of the issues that is notpossible if interventions carried out in just one village are the sole focus.
The shared learning dialogues conducted in villages along transects were combinedwith a systematic assessment of vulnerability. Other dialogues were carried out withlocal government agencies such as the VDCs, district development committees (DDCs),local and International NGOs as well as with sector-specific high-level institutionssuch as the Department of Irrigation and the Department of Agriculture. Dialoguesmoved through a typical sequence, beginning with a discussion of the specific localcharacteristics of flooding to government, NGO and community responses to it. Thendiscussions shifted to the advantages and disadvantages of those responses and endedwith the identification of those advantages and disadvantages as specific benefits orcosts. The evolution of the nature of the discussion, which often occurred over severalmeetings, enabled researchers to develop a disaggregated list identifying the specificdirect and indirect benefits and costs associated with each individual strategy.
The costs and benefits identified differed for each type of intervention. Discussions ofthe benefits of embankments, for example, typically started with the direct floodprotection they provide and then moved on to consider their role, as areas of relativelyhigh elevations serving as points of refuge to secure lives and assets after villages areinundated. The costs identified often focused first on the construction and maintenanceof the embankments but then moved on to consider impacts such as water logging andthe increased incidence of disease due to stagnant water, impacts which are typicallytreated as externalities in conventional economic analysis. Finally, as discussions ofsuch tangible costs and benefits proceeded, other benefits and costs related to gender,social cohesion, and other factors emerged. A similar evolution in the nature ofdiscussions also took place in the case of community based strategies, but most of themhad no major costs to consider aside from the initial direct financial and maintenancecosts (like the cost of purchasing and maintaining a boat or installing, operating andmaintaining a flood warning system).
Along each transect, each cost and each benefit was initially marked with a minus (-)or plus (+) sign respectively following dialogues with different groups selected toreflect various geographic contexts, gender, poverty and other factors that affect thelevel of exposure and vulnerability to floods. Once impacts were identified as plus orminus, ranking and other techniques were used to assign each cost or benefit a relativemagnitude ranging from one three, plusses (+++) or minuses (- - -).
We selected three transects in the lower Bagmati basin to capture the diversity insocial and natural context and in past interventions (see Figure 1). A snapshot of themain villages engaged in the shared learning dialogues along each transect is giventable below. The transects crossed through the following areas:
1. The main channel of the Bagmati River2. The Lal Bakaiya tributary to the Bagmati; and3. The Bagmati-Lal Bakaiya doab across the Gaur municipality, through the Bairgania
ring embankment and to Pipradi Sultan.
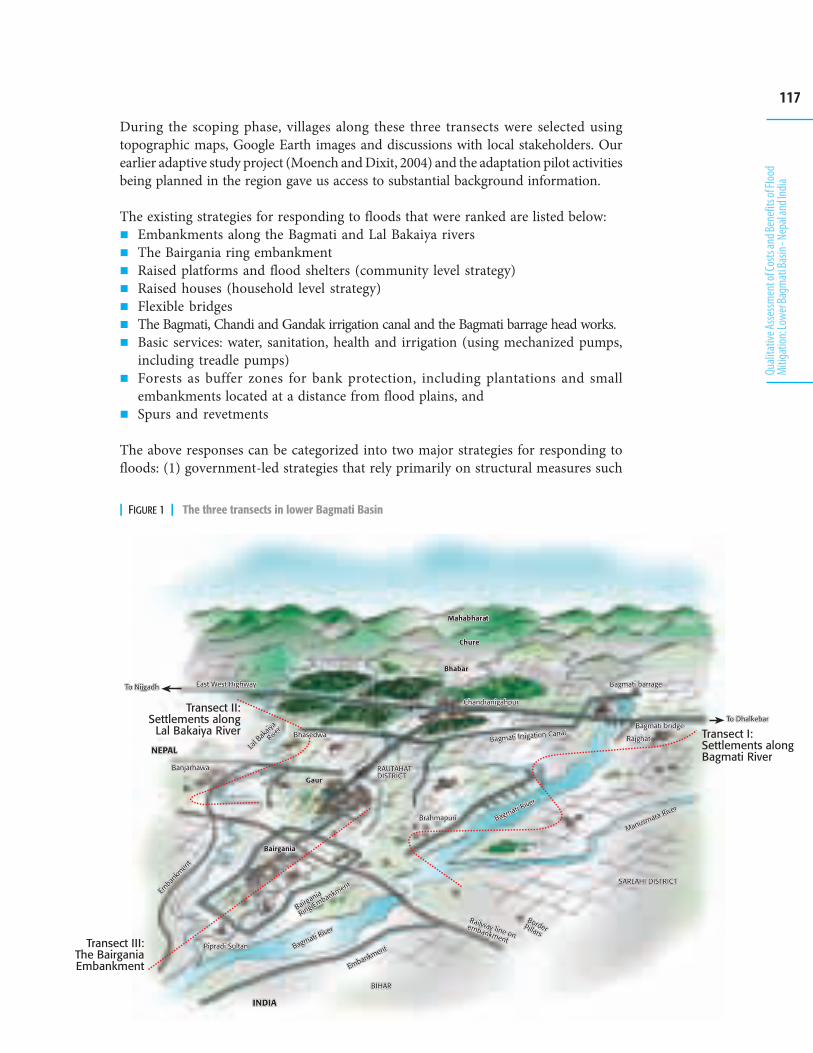
117
Quali
tativ
e Asse
ssmen
t of C
osts
and B
enefi
ts of
Floo
dMi
tigat
ion: L
ower
Bagm
ati B
asin
- Nep
al an
d Ind
ia
During the scoping phase, villages along these three transects were selected usingtopographic maps, Google Earth images and discussions with local stakeholders. Ourearlier adaptive study project (Moench and Dixit, 2004) and the adaptation pilot activitiesbeing planned in the region gave us access to substantial background information.
The existing strategies for responding to floods that were ranked are listed below:Embankments along the Bagmati and Lal Bakaiya riversThe Bairgania ring embankmentRaised platforms and flood shelters (community level strategy)Raised houses (household level strategy)Flexible bridgesThe Bagmati, Chandi and Gandak irrigation canal and the Bagmati barrage head works.Basic services: water, sanitation, health and irrigation (using mechanized pumps,including treadle pumps)Forests as buffer zones for bank protection, including plantations and smallembankments located at a distance from flood plains, andSpurs and revetments
The above responses can be categorized into two major strategies for responding tofloods: (1) government-led strategies that rely primarily on structural measures such
������������������������������
������������
������������������������������������
��� ��������� ��������� ������
���������������������
������������������������������������
���������������������������������������
���������������
������������������������ ������� ������� �������
���������������������
������������
������������������������
�������� ��������������� ��������������� �������
��������� ����� ����� �����
������!�������
������!�������
������!���������������
��������
��������
���������������
� ���� ���� ���
�����
���
�����
���
�����
���
�����"��
����
��
�����"��
����
��
�����"��
����
��
������������������������
������������ ������������ ������������
���������������������������
���������!�
���������!�
���������!�
��#
��#
��#
���� ���� ����
"����$���������!"����$���������!"����$���������!���%���������%���������%������
"""������������������������
"""������������
������������
������������������
��� ������###
��������������������� ������������������������ ���������������
&&&���������������
������������###
����'�����(�����������"��������
����'����(�����������������������!����# ����'���(
������������������������#
������������������
��� ������###
| FIGURE 1 | The three transects in lower Bagmati Basin
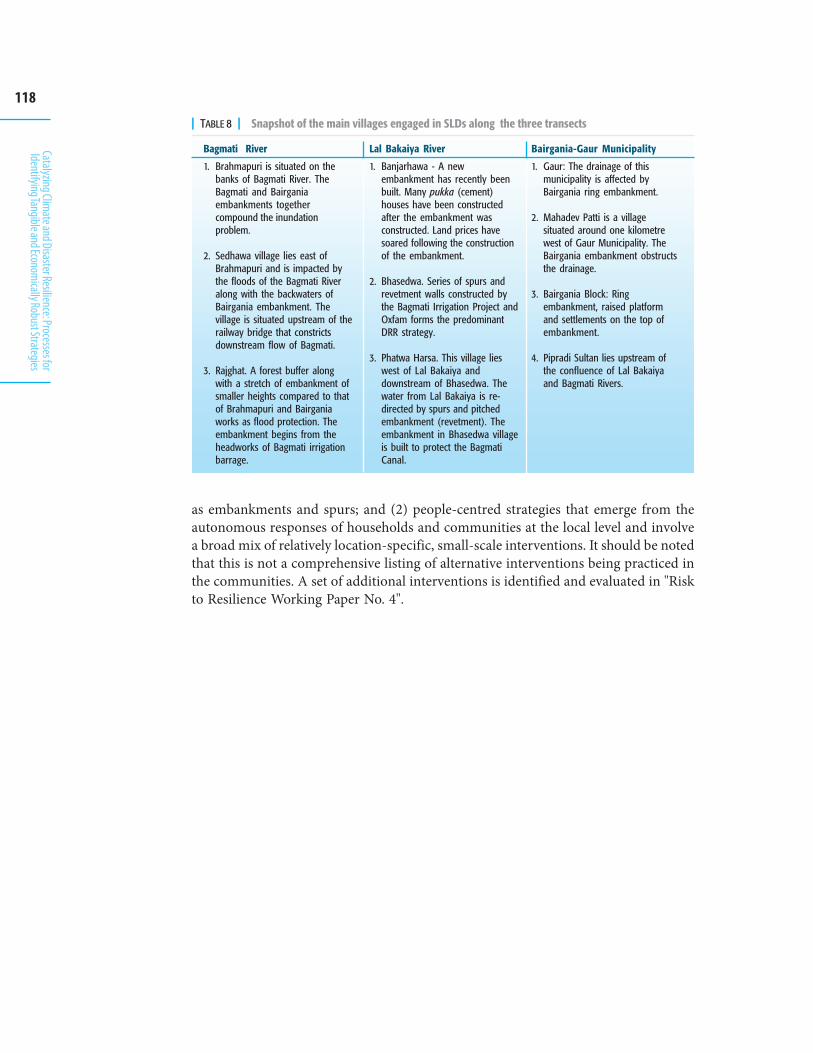
118
Catalyzing Climate and Disaster Resilience: Processes for
Identifying Tangible and Economically Robust Strategies
Bagmati River
1. Brahmapuri is situated on thebanks of Bagmati River. TheBagmati and Bairganiaembankments togethercompound the inundationproblem.
2. Sedhawa village lies east ofBrahmapuri and is impacted bythe floods of the Bagmati Riveralong with the backwaters ofBairgania embankment. Thevillage is situated upstream of therailway bridge that constrictsdownstream flow of Bagmati.
3. Rajghat. A forest buffer alongwith a stretch of embankment ofsmaller heights compared to thatof Brahmapuri and Bairganiaworks as flood protection. Theembankment begins from theheadworks of Bagmati irrigationbarrage.
Lal Bakaiya River
1. Banjarhawa - A newembankment has recently beenbuilt. Many pukka (cement)houses have been constructedafter the embankment wasconstructed. Land prices havesoared following the constructionof the embankment.
2. Bhasedwa. Series of spurs andrevetment walls constructed bythe Bagmati Irrigation Project andOxfam forms the predominantDRR strategy.
3. Phatwa Harsa. This village lieswest of Lal Bakaiya anddownstream of Bhasedwa. Thewater from Lal Bakaiya is re-directed by spurs and pitchedembankment (revetment). Theembankment in Bhasedwa villageis built to protect the BagmatiCanal.
Bairgania-Gaur Municipality
1. Gaur: The drainage of thismunicipality is affected byBairgania ring embankment.
2. Mahadev Patti is a villagesituated around one kilometrewest of Gaur Municipality. TheBairgania embankment obstructsthe drainage.
3. Bairgania Block: Ringembankment, raised platformand settlements on the top ofembankment.
4. Pipradi Sultan lies upstream ofthe confluence of Lal Bakaiyaand Bagmati Rivers.
| TABLE 8 | Snapshot of the main villages engaged in SLDs along the three transects
as embankments and spurs; and (2) people-centred strategies that emerge from theautonomous responses of households and communities at the local level and involvea broad mix of relatively location-specific, small-scale interventions. It should be notedthat this is not a comprehensive listing of alternative interventions being practiced inthe communities. A set of additional interventions is identified and evaluated in "Riskto Resilience Working Paper No. 4".
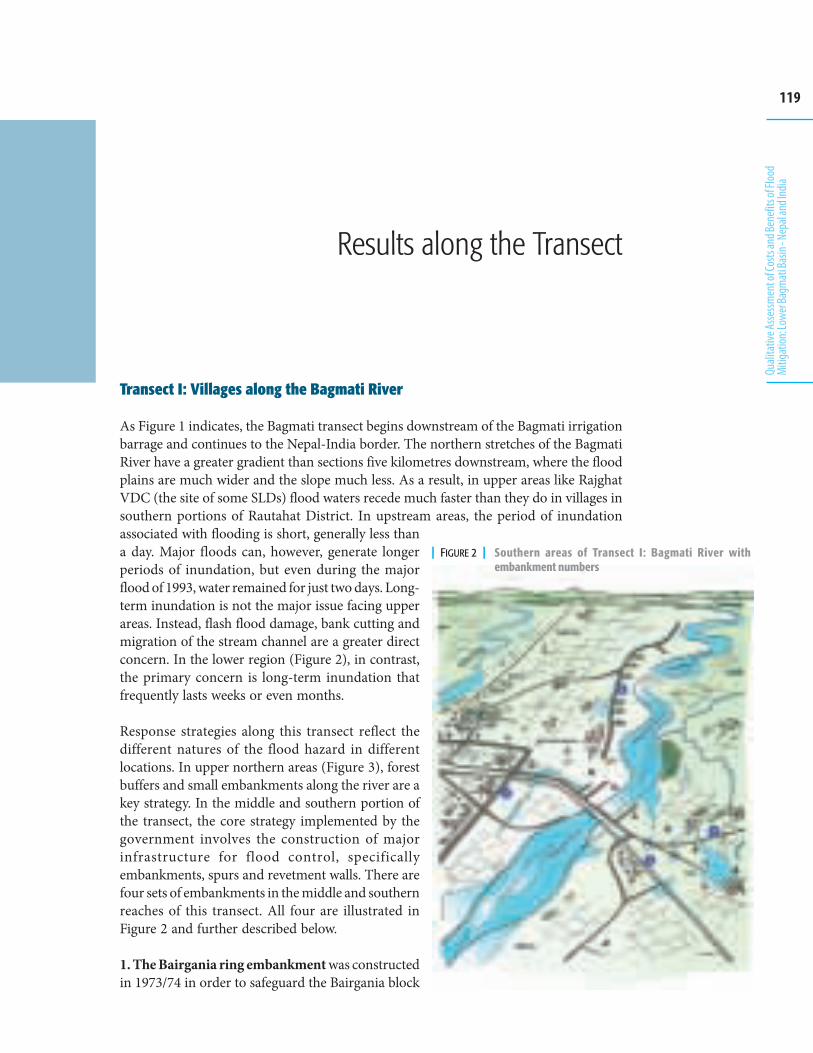
119
Quali
tativ
e Asse
ssmen
t of C
osts
and B
enefi
ts of
Floo
dMi
tigat
ion: L
ower
Bagm
ati B
asin
- Nep
al an
d Ind
ia
Results along the Transect
| FIGURE 2 | Southern areas of Transect I: Bagmati River withembankment numbers
Transect I: Villages along the Bagmati River
As Figure 1 indicates, the Bagmati transect begins downstream of the Bagmati irrigationbarrage and continues to the Nepal-India border. The northern stretches of the BagmatiRiver have a greater gradient than sections five kilometres downstream, where the floodplains are much wider and the slope much less. As a result, in upper areas like RajghatVDC (the site of some SLDs) flood waters recede much faster than they do in villages insouthern portions of Rautahat District. In upstream areas, the period of inundationassociated with flooding is short, generally less thana day. Major floods can, however, generate longerperiods of inundation, but even during the majorflood of 1993, water remained for just two days. Long-term inundation is not the major issue facing upperareas. Instead, flash flood damage, bank cutting andmigration of the stream channel are a greater directconcern. In the lower region (Figure 2), in contrast,the primary concern is long-term inundation thatfrequently lasts weeks or even months.
Response strategies along this transect reflect thedifferent natures of the flood hazard in differentlocations. In upper northern areas (Figure 3), forestbuffers and small embankments along the river are akey strategy. In the middle and southern portion ofthe transect, the core strategy implemented by thegovernment involves the construction of majorinfrastructure for flood control, specificallyembankments, spurs and revetment walls. There arefour sets of embankments in the middle and southernreaches of this transect. All four are illustrated inFigure 2 and further described below.
1. The Bairgania ring embankment was constructedin 1973/74 in order to safeguard the Bairgania block
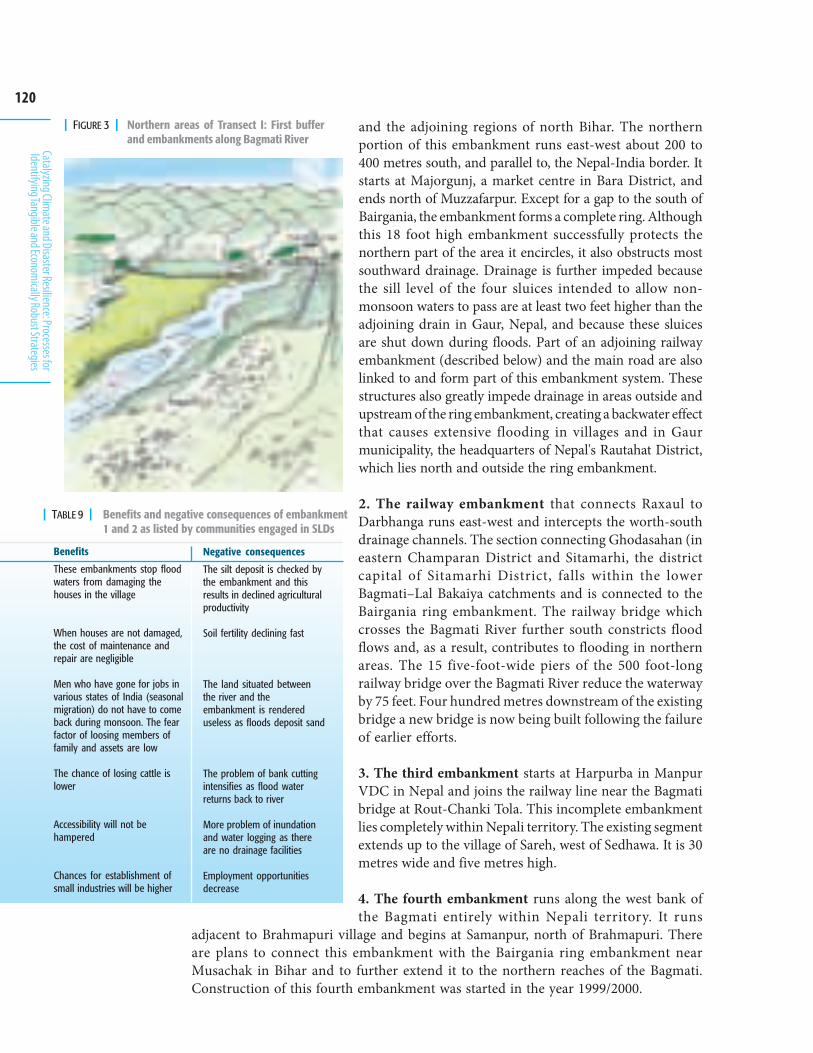
120
Catalyzing Climate and Disaster Resilience: Processes for
Identifying Tangible and Economically Robust Strategies
Benefits
These embankments stop floodwaters from damaging thehouses in the village
When houses are not damaged,the cost of maintenance andrepair are negligible
Men who have gone for jobs invarious states of India (seasonalmigration) do not have to comeback during monsoon. The fearfactor of loosing members offamily and assets are low
The chance of losing cattle islower
Accessibility will not behampered
Chances for establishment ofsmall industries will be higher
Negative consequences
The silt deposit is checked bythe embankment and thisresults in declined agriculturalproductivity
Soil fertility declining fast
The land situated betweenthe river and theembankment is rendereduseless as floods deposit sand
The problem of bank cuttingintensifies as flood waterreturns back to river
More problem of inundationand water logging as thereare no drainage facilities
Employment opportunitiesdecrease
| TABLE 9 | Benefits and negative consequences of embankment1 and 2 as listed by communities engaged in SLDs
and the adjoining regions of north Bihar. The northernportion of this embankment runs east-west about 200 to400 metres south, and parallel to, the Nepal-India border. Itstarts at Majorgunj, a market centre in Bara District, andends north of Muzzafarpur. Except for a gap to the south ofBairgania, the embankment forms a complete ring. Althoughthis 18 foot high embankment successfully protects thenorthern part of the area it encircles, it also obstructs mostsouthward drainage. Drainage is further impeded becausethe sill level of the four sluices intended to allow non-monsoon waters to pass are at least two feet higher than theadjoining drain in Gaur, Nepal, and because these sluicesare shut down during floods. Part of an adjoining railwayembankment (described below) and the main road are alsolinked to and form part of this embankment system. Thesestructures also greatly impede drainage in areas outside andupstream of the ring embankment, creating a backwater effectthat causes extensive flooding in villages and in Gaurmunicipality, the headquarters of Nepal's Rautahat District,which lies north and outside the ring embankment.
2. The railway embankment that connects Raxaul toDarbhanga runs east-west and intercepts the worth-southdrainage channels. The section connecting Ghodasahan (ineastern Champaran District and Sitamarhi, the districtcapital of Sitamarhi District, falls within the lowerBagmati–Lal Bakaiya catchments and is connected to theBairgania ring embankment. The railway bridge whichcrosses the Bagmati River further south constricts floodflows and, as a result, contributes to flooding in northernareas. The 15 five-foot-wide piers of the 500 foot-longrailway bridge over the Bagmati River reduce the waterwayby 75 feet. Four hundred metres downstream of the existingbridge a new bridge is now being built following the failureof earlier efforts.
3. The third embankment starts at Harpurba in ManpurVDC in Nepal and joins the railway line near the Bagmatibridge at Rout-Chanki Tola. This incomplete embankmentlies completely within Nepali territory. The existing segmentextends up to the village of Sareh, west of Sedhawa. It is 30metres wide and five metres high.
4. The fourth embankment runs along the west bank ofthe Bagmati entirely within Nepali territory. It runs
adjacent to Brahmapuri village and begins at Samanpur, north of Brahmapuri. Thereare plans to connect this embankment with the Bairgania ring embankment nearMusachak in Bihar and to further extend it to the northern reaches of the Bagmati.Construction of this fourth embankment was started in the year 1999/2000.
| FIGURE 3 | Northern areas of Transect I: First bufferand embankments along Bagmati River
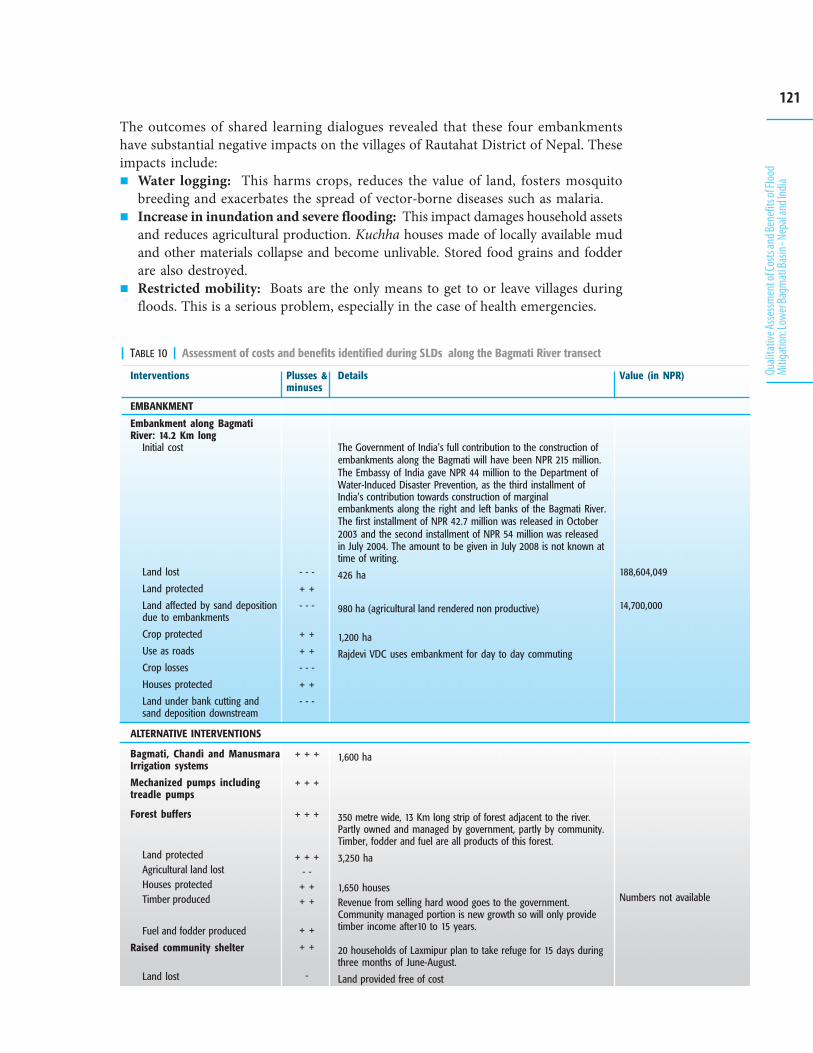
121
Quali
tativ
e Asse
ssmen
t of C
osts
and B
enefi
ts of
Floo
dMi
tigat
ion: L
ower
Bagm
ati B
asin
- Nep
al an
d Ind
ia
Interventions
Embankment along BagmatiRiver: 14.2 Km long
Initial cost
Land lost
Land protected
Land affected by sand depositiondue to embankments
Crop protected
Use as roads
Crop losses
Houses protected
Land under bank cutting andsand deposition downstream
Bagmati, Chandi and ManusmaraIrrigation systems
Mechanized pumps includingtreadle pumps
Forest buffers
Land protectedAgricultural land lostHouses protectedTimber produced
Fuel and fodder produced
Raised community shelter
Land lost
Plusses &minuses
- - -
+ +
- - -
+ +
+ +
- - -
+ +
- - -
+ + +
+ + +
+ + +
+ + +- -
+ ++ +
+ +
+ +
-
Details
The Government of India's full contribution to the construction ofembankments along the Bagmati will have been NPR 215 million.The Embassy of India gave NPR 44 million to the Department ofWater-Induced Disaster Prevention, as the third installment ofIndia's contribution towards construction of marginalembankments along the right and left banks of the Bagmati River.The first installment of NPR 42.7 million was released in October2003 and the second installment of NPR 54 million was releasedin July 2004. The amount to be given in July 2008 is not known attime of writing.
426 ha
980 ha (agricultural land rendered non productive)
1,200 ha
Rajdevi VDC uses embankment for day to day commuting
1,600 ha
350 metre wide, 13 Km long strip of forest adjacent to the river.Partly owned and managed by government, partly by community.Timber, fodder and fuel are all products of this forest.
3,250 ha
1,650 housesRevenue from selling hard wood goes to the government.Community managed portion is new growth so will only providetimber income after10 to 15 years.
20 households of Laxmipur plan to take refuge for 15 days duringthree months of June-August.
Land provided free of cost
Value (in NPR)
188,604,049
14,700,000
Numbers not available
| TABLE 10 | Assessment of costs and benefits identified during SLDs along the Bagmati River transect
EMBANKMENT
ALTERNATIVE INTERVENTIONS
The outcomes of shared learning dialogues revealed that these four embankmentshave substantial negative impacts on the villages of Rautahat District of Nepal. Theseimpacts include:
Water logging: This harms crops, reduces the value of land, fosters mosquitobreeding and exacerbates the spread of vector-borne diseases such as malaria.Increase in inundation and severe flooding: This impact damages household assetsand reduces agricultural production. Kuchha houses made of locally available mudand other materials collapse and become unlivable. Stored food grains and fodderare also destroyed.Restricted mobility: Boats are the only means to get to or leave villages duringfloods. This is a serious problem, especially in the case of health emergencies.
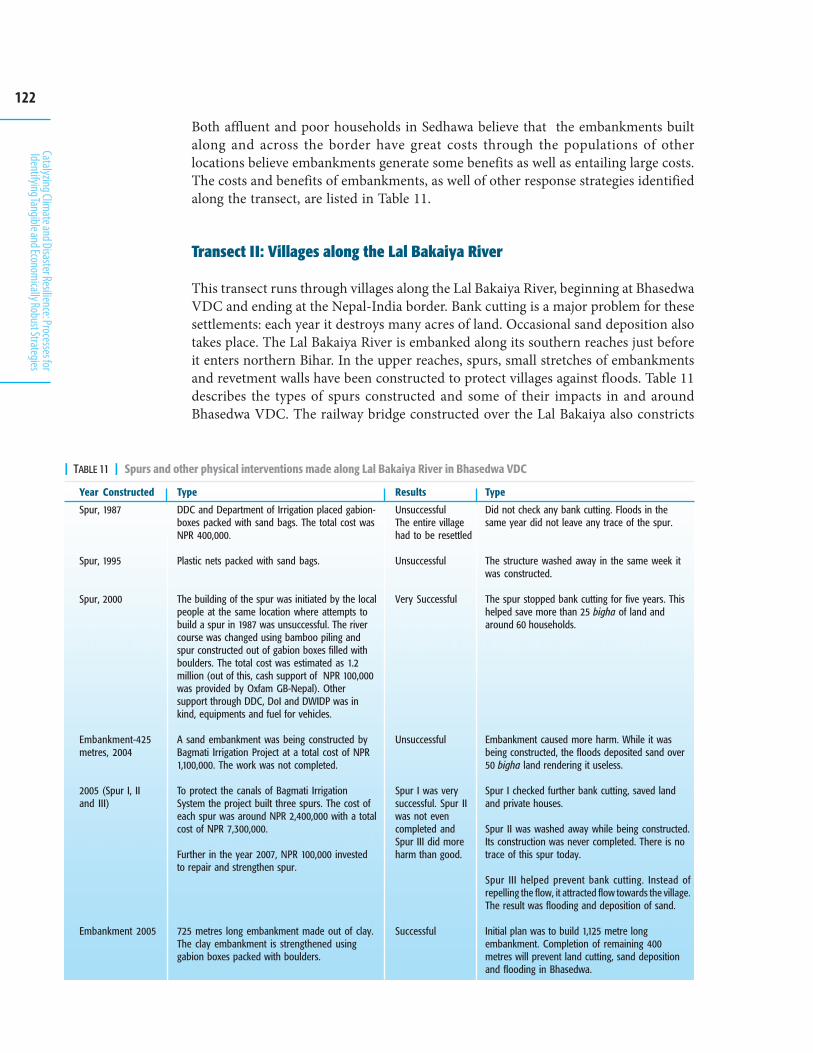
122
Catalyzing Climate and Disaster Resilience: Processes for
Identifying Tangible and Economically Robust Strategies
Both affluent and poor households in Sedhawa believe that the embankments builtalong and across the border have great costs through the populations of otherlocations believe embankments generate some benefits as well as entailing large costs.The costs and benefits of embankments, as well of other response strategies identifiedalong the transect, are listed in Table 11.
Transect II: Villages along the Lal Bakaiya River
This transect runs through villages along the Lal Bakaiya River, beginning at BhasedwaVDC and ending at the Nepal-India border. Bank cutting is a major problem for thesesettlements: each year it destroys many acres of land. Occasional sand deposition alsotakes place. The Lal Bakaiya River is embanked along its southern reaches just beforeit enters northern Bihar. In the upper reaches, spurs, small stretches of embankmentsand revetment walls have been constructed to protect villages against floods. Table 11describes the types of spurs constructed and some of their impacts in and aroundBhasedwa VDC. The railway bridge constructed over the Lal Bakaiya also constricts
Year Constructed
Spur, 1987
Spur, 1995
Spur, 2000
Embankment-425metres, 2004
2005 (Spur I, IIand III)
Embankment 2005
Type
DDC and Department of Irrigation placed gabion-boxes packed with sand bags. The total cost wasNPR 400,000.
Plastic nets packed with sand bags.
The building of the spur was initiated by the localpeople at the same location where attempts tobuild a spur in 1987 was unsuccessful. The rivercourse was changed using bamboo piling andspur constructed out of gabion boxes filled withboulders. The total cost was estimated as 1.2million (out of this, cash support of NPR 100,000was provided by Oxfam GB-Nepal). Othersupport through DDC, DoI and DWIDP was inkind, equipments and fuel for vehicles.
A sand embankment was being constructed byBagmati Irrigation Project at a total cost of NPR1,100,000. The work was not completed.
To protect the canals of Bagmati IrrigationSystem the project built three spurs. The cost ofeach spur was around NPR 2,400,000 with a totalcost of NPR 7,300,000.
Further in the year 2007, NPR 100,000 investedto repair and strengthen spur.
725 metres long embankment made out of clay.The clay embankment is strengthened usinggabion boxes packed with boulders.
Type
Did not check any bank cutting. Floods in thesame year did not leave any trace of the spur.
The structure washed away in the same week itwas constructed.
The spur stopped bank cutting for five years. Thishelped save more than 25 bigha of land andaround 60 households.
Embankment caused more harm. While it wasbeing constructed, the floods deposited sand over50 bigha land rendering it useless.
Spur I checked further bank cutting, saved landand private houses.
Spur II was washed away while being constructed.Its construction was never completed. There is notrace of this spur today.
Spur III helped prevent bank cutting. Instead ofrepelling the flow, it attracted flow towards the village.The result was flooding and deposition of sand.
Initial plan was to build 1,125 metre longembankment. Completion of remaining 400metres will prevent land cutting, sand depositionand flooding in Bhasedwa.
Results
UnsuccessfulThe entire villagehad to be resettled
Unsuccessful
Very Successful
Unsuccessful
Spur I was verysuccessful. Spur IIwas not evencompleted andSpur III did moreharm than good.
Successful
| TABLE 11 | Spurs and other physical interventions made along Lal Bakaiya River in Bhasedwa VDC
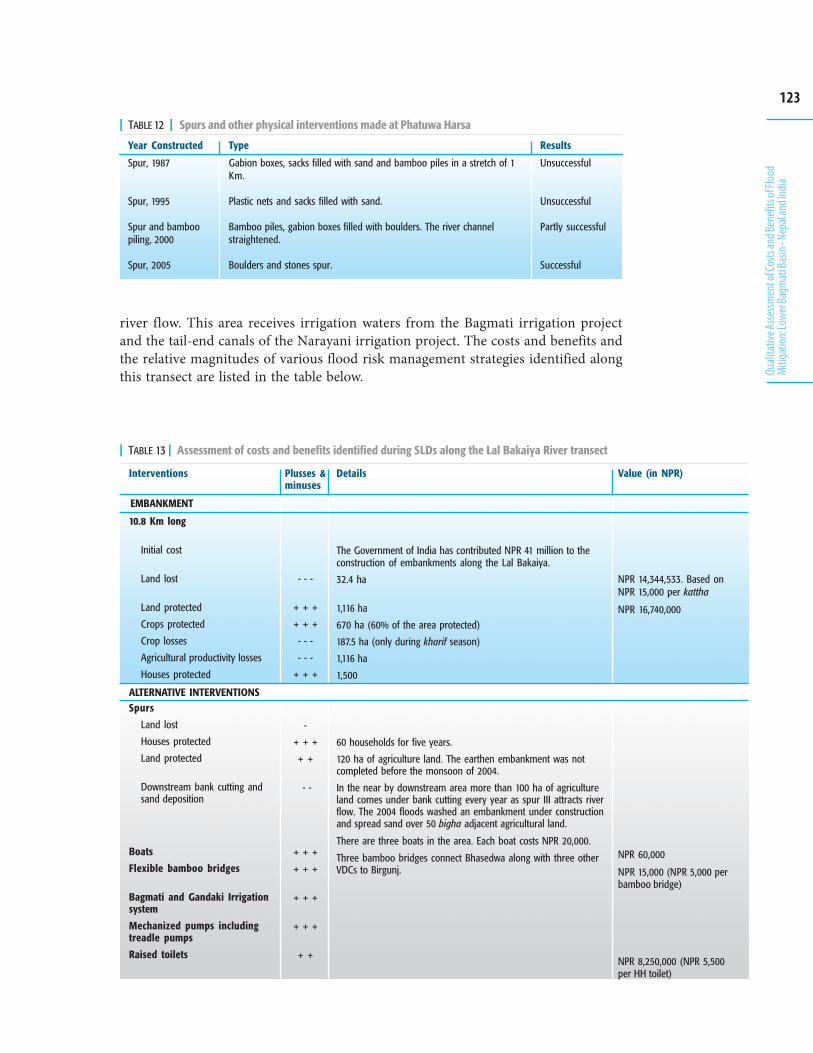
123
Quali
tativ
e Asse
ssmen
t of C
osts
and B
enefi
ts of
Floo
dMi
tigat
ion: L
ower
Bagm
ati B
asin
- Nep
al an
d Ind
ia
Year Constructed
Spur, 1987
Spur, 1995
Spur and bamboopiling, 2000
Spur, 2005
Type
Gabion boxes, sacks filled with sand and bamboo piles in a stretch of 1Km.
Plastic nets and sacks filled with sand.
Bamboo piles, gabion boxes filled with boulders. The river channelstraightened.
Boulders and stones spur.
Results
Unsuccessful
Unsuccessful
Partly successful
Successful
| TABLE 12 | Spurs and other physical interventions made at Phatuwa Harsa
river flow. This area receives irrigation waters from the Bagmati irrigation projectand the tail-end canals of the Narayani irrigation project. The costs and benefits andthe relative magnitudes of various flood risk management strategies identified alongthis transect are listed in the table below.
Interventions
10.8 Km long
Initial cost
Land lost
Land protected
Crops protected
Crop losses
Agricultural productivity losses
Houses protected
Spurs
Land lost
Houses protected
Land protected
Downstream bank cutting andsand deposition
Boats
Flexible bamboo bridges
Bagmati and Gandaki Irrigationsystem
Mechanized pumps includingtreadle pumps
Raised toilets
Plusses &minuses
- - -
+ + +
+ + +
- - -
- - -
+ + +
-
+ + +
+ +
- -
+ + +
+ + +
+ + +
+ + +
+ +
Details
The Government of India has contributed NPR 41 million to theconstruction of embankments along the Lal Bakaiya.
32.4 ha
1,116 ha
670 ha (60% of the area protected)
187.5 ha (only during kharif season)
1,116 ha
1,500
60 households for five years.
120 ha of agriculture land. The earthen embankment was notcompleted before the monsoon of 2004.
In the near by downstream area more than 100 ha of agricultureland comes under bank cutting every year as spur III attracts riverflow. The 2004 floods washed an embankment under constructionand spread sand over 50 bigha adjacent agricultural land.
There are three boats in the area. Each boat costs NPR 20,000.
Three bamboo bridges connect Bhasedwa along with three otherVDCs to Birgunj.
Value (in NPR)
NPR 14,344,533. Based onNPR 15,000 per kattha
NPR 16,740,000
NPR 60,000
NPR 15,000 (NPR 5,000 perbamboo bridge)
NPR 8,250,000 (NPR 5,500per HH toilet)
| TABLE 13 | Assessment of costs and benefits identified during SLDs along the Lal Bakaiya River transect
EMBANKMENT
ALTERNATIVE INTERVENTIONS
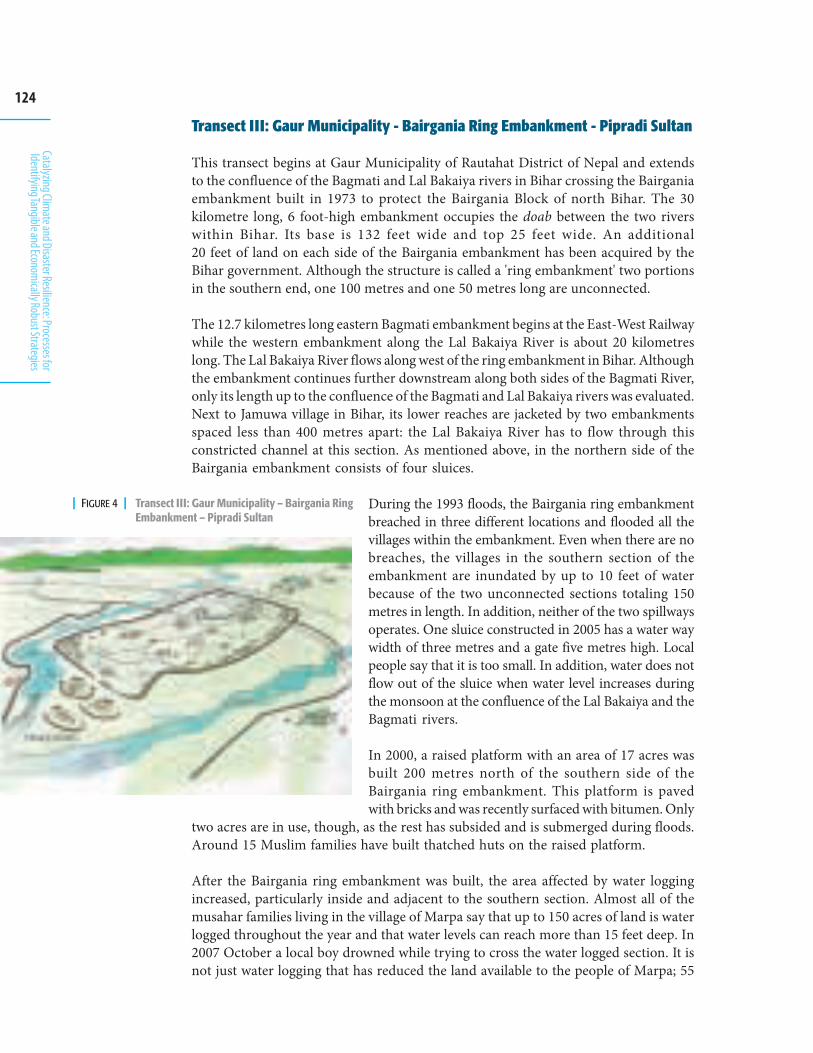
124
Catalyzing Climate and Disaster Resilience: Processes for
Identifying Tangible and Economically Robust Strategies
Transect III: Gaur Municipality - Bairgania Ring Embankment - Pipradi Sultan
This transect begins at Gaur Municipality of Rautahat District of Nepal and extendsto the confluence of the Bagmati and Lal Bakaiya rivers in Bihar crossing the Bairganiaembankment built in 1973 to protect the Bairgania Block of north Bihar. The 30kilometre long, 6 foot-high embankment occupies the doab between the two riverswithin Bihar. Its base is 132 feet wide and top 25 feet wide. An additional20 feet of land on each side of the Bairgania embankment has been acquired by theBihar government. Although the structure is called a 'ring embankment' two portionsin the southern end, one 100 metres and one 50 metres long are unconnected.
The 12.7 kilometres long eastern Bagmati embankment begins at the East-West Railwaywhile the western embankment along the Lal Bakaiya River is about 20 kilometreslong. The Lal Bakaiya River flows along west of the ring embankment in Bihar. Althoughthe embankment continues further downstream along both sides of the Bagmati River,only its length up to the confluence of the Bagmati and Lal Bakaiya rivers was evaluated.Next to Jamuwa village in Bihar, its lower reaches are jacketed by two embankmentsspaced less than 400 metres apart: the Lal Bakaiya River has to flow through thisconstricted channel at this section. As mentioned above, in the northern side of theBairgania embankment consists of four sluices.
During the 1993 floods, the Bairgania ring embankmentbreached in three different locations and flooded all thevillages within the embankment. Even when there are nobreaches, the villages in the southern section of theembankment are inundated by up to 10 feet of waterbecause of the two unconnected sections totaling 150metres in length. In addition, neither of the two spillwaysoperates. One sluice constructed in 2005 has a water waywidth of three metres and a gate five metres high. Localpeople say that it is too small. In addition, water does notflow out of the sluice when water level increases duringthe monsoon at the confluence of the Lal Bakaiya and theBagmati rivers.
In 2000, a raised platform with an area of 17 acres wasbuilt 200 metres north of the southern side of theBairgania ring embankment. This platform is pavedwith bricks and was recently surfaced with bitumen. Only
two acres are in use, though, as the rest has subsided and is submerged during floods.Around 15 Muslim families have built thatched huts on the raised platform.
After the Bairgania ring embankment was built, the area affected by water loggingincreased, particularly inside and adjacent to the southern section. Almost all of themusahar families living in the village of Marpa say that up to 150 acres of land is waterlogged throughout the year and that water levels can reach more than 15 feet deep. In2007 October a local boy drowned while trying to cross the water logged section. It isnot just water logging that has reduced the land available to the people of Marpa; 55
| FIGURE 4 | Transect III: Gaur Municipality – Bairgania RingEmbankment – Pipradi Sultan
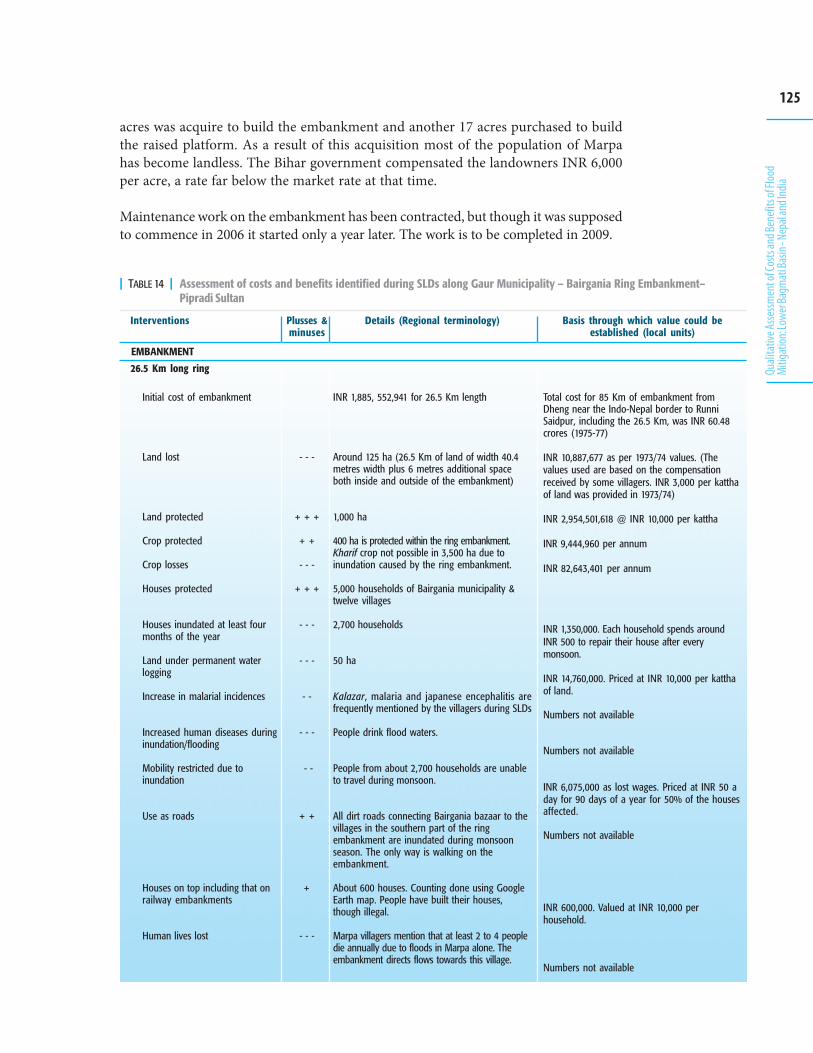
125
Quali
tativ
e Asse
ssmen
t of C
osts
and B
enefi
ts of
Floo
dMi
tigat
ion: L
ower
Bagm
ati B
asin
- Nep
al an
d Ind
ia
acres was acquire to build the embankment and another 17 acres purchased to buildthe raised platform. As a result of this acquisition most of the population of Marpahas become landless. The Bihar government compensated the landowners INR 6,000per acre, a rate far below the market rate at that time.
Maintenance work on the embankment has been contracted, but though it was supposedto commence in 2006 it started only a year later. The work is to be completed in 2009.
Interventions
26.5 Km long ring
Initial cost of embankment
Land lost
Land protected
Crop protected
Crop losses
Houses protected
Houses inundated at least fourmonths of the year
Land under permanent waterlogging
Increase in malarial incidences
Increased human diseases duringinundation/flooding
Mobility restricted due toinundation
Use as roads
Houses on top including that onrailway embankments
Human lives lost
Plusses &minuses
- - -
+ + +
+ +
- - -
+ + +
- - -
- - -
- -
- - -
- -
+ +
+
- - -
Details (Regional terminology)
INR 1,885, 552,941 for 26.5 Km length
Around 125 ha (26.5 Km of land of width 40.4metres width plus 6 metres additional spaceboth inside and outside of the embankment)
1,000 ha
400 ha is protected within the ring embankment.Kharif crop not possible in 3,500 ha due toinundation caused by the ring embankment.
5,000 households of Bairgania municipality &twelve villages
2,700 households
50 ha
Kalazar, malaria and japanese encephalitis arefrequently mentioned by the villagers during SLDs
People drink flood waters.
People from about 2,700 households are unableto travel during monsoon.
All dirt roads connecting Bairgania bazaar to thevillages in the southern part of the ringembankment are inundated during monsoonseason. The only way is walking on theembankment.
About 600 houses. Counting done using GoogleEarth map. People have built their houses,though illegal.
Marpa villagers mention that at least 2 to 4 peopledie annually due to floods in Marpa alone. Theembankment directs flows towards this village.
Basis through which value could beestablished (local units)
Total cost for 85 Km of embankment fromDheng near the Indo-Nepal border to RunniSaidpur, including the 26.5 Km, was INR 60.48crores (1975-77)
INR 10,887,677 as per 1973/74 values. (Thevalues used are based on the compensationreceived by some villagers. INR 3,000 per katthaof land was provided in 1973/74)
INR 2,954,501,618 @ INR 10,000 per kattha
INR 9,444,960 per annum
INR 82,643,401 per annum
INR 1,350,000. Each household spends aroundINR 500 to repair their house after everymonsoon.
INR 14,760,000. Priced at INR 10,000 per katthaof land.
Numbers not available
Numbers not available
INR 6,075,000 as lost wages. Priced at INR 50 aday for 90 days of a year for 50% of the housesaffected.
Numbers not available
INR 600,000. Valued at INR 10,000 perhousehold.
Numbers not available
| TABLE 14 | Assessment of costs and benefits identified during SLDs along Gaur Municipality – Bairgania Ring Embankment–Pipradi Sultan
EMBANKMENT
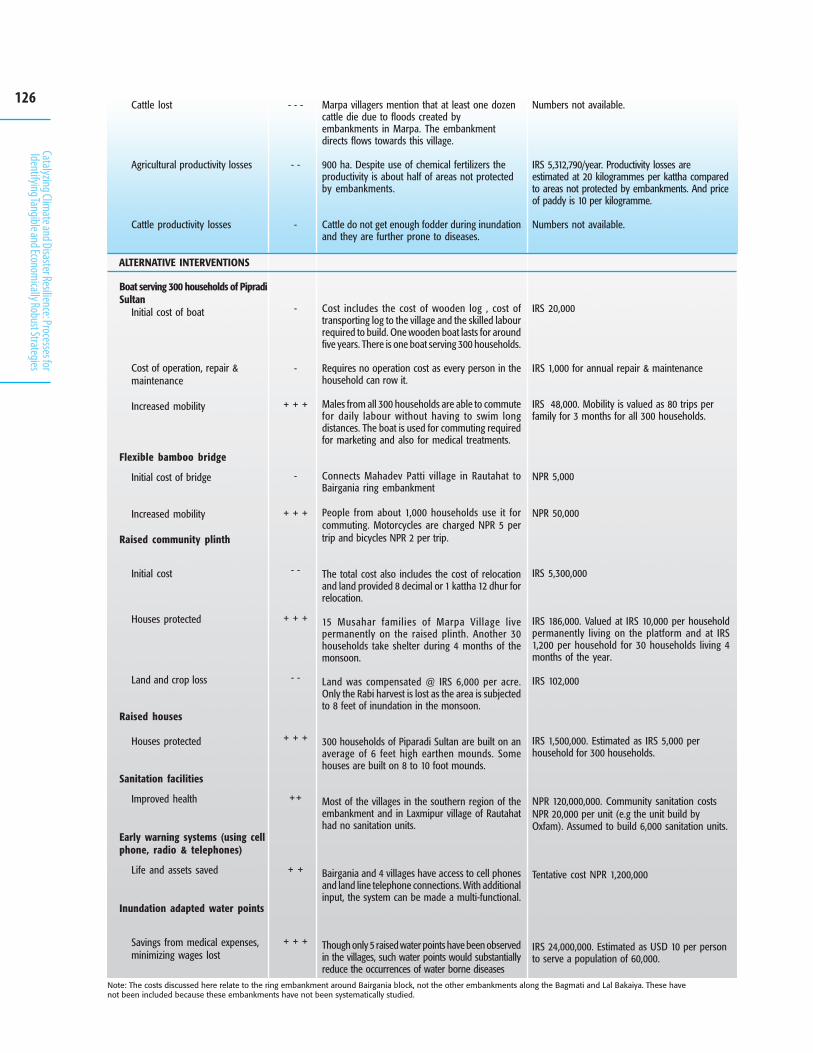
126
Catalyzing Climate and Disaster Resilience: Processes for
Identifying Tangible and Economically Robust Strategies
Numbers not available.
IRS 5,312,790/year. Productivity losses areestimated at 20 kilogrammes per kattha comparedto areas not protected by embankments. And priceof paddy is 10 per kilogramme.
Numbers not available.
IRS 20,000
IRS 1,000 for annual repair & maintenance
IRS 48,000. Mobility is valued as 80 trips perfamily for 3 months for all 300 households.
NPR 5,000
NPR 50,000
IRS 5,300,000
IRS 186,000. Valued at IRS 10,000 per householdpermanently living on the platform and at IRS1,200 per household for 30 households living 4months of the year.
IRS 102,000
IRS 1,500,000. Estimated as IRS 5,000 perhousehold for 300 households.
NPR 120,000,000. Community sanitation costsNPR 20,000 per unit (e.g the unit build byOxfam). Assumed to build 6,000 sanitation units.
Tentative cost NPR 1,200,000
IRS 24,000,000. Estimated as USD 10 per personto serve a population of 60,000.
Marpa villagers mention that at least one dozencattle die due to floods created byembankments in Marpa. The embankmentdirects flows towards this village.
900 ha. Despite use of chemical fertilizers theproductivity is about half of areas not protectedby embankments.
Cattle do not get enough fodder during inundationand they are further prone to diseases.
Cost includes the cost of wooden log , cost oftransporting log to the village and the skilled labourrequired to build. One wooden boat lasts for aroundfive years. There is one boat serving 300 households.
Requires no operation cost as every person in thehousehold can row it.
Males from all 300 households are able to commutefor daily labour without having to swim longdistances. The boat is used for commuting requiredfor marketing and also for medical treatments.
Connects Mahadev Patti village in Rautahat toBairgania ring embankment
People from about 1,000 households use it forcommuting. Motorcycles are charged NPR 5 pertrip and bicycles NPR 2 per trip.
The total cost also includes the cost of relocationand land provided 8 decimal or 1 kattha 12 dhur forrelocation.
15 Musahar families of Marpa Village livepermanently on the raised plinth. Another 30households take shelter during 4 months of themonsoon.
Land was compensated @ IRS 6,000 per acre.Only the Rabi harvest is lost as the area is subjectedto 8 feet of inundation in the monsoon.
300 households of Piparadi Sultan are built on anaverage of 6 feet high earthen mounds. Somehouses are built on 8 to 10 foot mounds.
Most of the villages in the southern region of theembankment and in Laxmipur village of Rautahathad no sanitation units.
Bairgania and 4 villages have access to cell phonesand land line telephone connections. With additionalinput, the system can be made a multi-functional.
Though only 5 raised water points have been observedin the villages, such water points would substantiallyreduce the occurrences of water borne diseases
- - -
- -
-
-
-
+ + +
-
+ + +
- -
+ + +
- -
+ + +
+ +
+ +
+ + +
Note: The costs discussed here relate to the ring embankment around Bairgania block, not the other embankments along the Bagmati and Lal Bakaiya. These havenot been included because these embankments have not been systematically studied.
Cattle lost
Agricultural productivity losses
Cattle productivity losses
Boat serving 300 households of PipradiSultan
Initial cost of boat
Cost of operation, repair &maintenance
Increased mobility
Flexible bamboo bridge
Initial cost of bridge
Increased mobility
Raised community plinth
Initial cost
Houses protected
Land and crop loss
Raised houses
Houses protected
Sanitation facilities
Improved health
Early warning systems (using cellphone, radio & telephones)
Life and assets saved
Inundation adapted water points
Savings from medical expenses,minimizing wages lost
ALTERNATIVE INTERVENTIONS
127
Quali
tativ
e Asse
ssmen
t of C
osts
and B
enefi
ts of
Floo
dMi
tigat
ion: L
ower
Bagm
ati B
asin
- Nep
al an
d Ind
ia
Analysis: Findings fromthe Transects
As transects along the lower Bagmati River illustrate, flood control measures havemany trade-offs. Where embankments are concerned, the wide variety of major costsappears to overwhelm unquestionably considerable benefits. Furthermore, thedistribution of benefits and costs is highly skewed. In the case of the ring embankment,for example, those who live or own land in regions that are protected, but located at adistance from water logged area benefit, while those who live north of the embankmentor in the southern water logged area bear much of the cost. All embankments havesimilar distributional effects.
The identification of the major indirect costs of embankments and other flood-management strategy using qualitative analysis can serve as a first step towardquantifying them. Many of the costs are related to backwater effects and the blockageof natural drainage. Investments in drainage and in re-designing structural measuresto reduce such costs could form part of a solution, but, at heart, there is no easysolution to many of the costs identified. Sedimentation, for example, will remain highno matter what measures are implemented. As a result, any sort of structuralprotection will always have a limited lifetime.
Qualitative analysis also highlights the substantial benefits that can be achieved byimplementing an array of individual and community interventions ranging from theprovision of boats and flexible bridges to the construction of raised platforms. Whilesuch approaches do not provide as much direct protection from floods asembankments do, they do generate major benefits and appear to involve far fewertrade-offs. The costs involved are largely just initial capital investments; there are few,if any, major externalities to take into consideration.
While the above differences between structural and people-centred categories ofstrategies are significant, it is important to recognize that comparisons between thetwo are somewhat misleading. First, in many ways, the types of benefits and costsgenerated by each are difficult to compare directly. Furthermore, while some of thecosts of structural measures are a built-in feature of the technology itself, at leastsome of the associated indirect costs are due to poor initial design and maintenance.Finally, embankments have benefit unique to themselves. they can be used to protectclearly defined areas (such as towns) where high-value investments are concentrated
128
Catalyzing Climate and Disaster Resilience: Processes for
Identifying Tangible and Economically Robust Strategies
and can serve as points of refuge during flood events. None of the people-centredmeasures evaluated in this study can provide either of these benefits on their own.
If designed carefully and accompanied by technically effective measures to improvedrainage and socially effective measures to address the distributional impacts,structural approaches can form part of a package of interventions that complementpeople-centred measures. Our analysis indicates that the costs of current structuralapproaches exceed their benefits and that, as a result, reliance on such measures shouldbe reduced. A combination of people-centred and appropriately designed andmaintained structures that help populations to live with floods is more effective thaneither strategy on its own.
The effectiveness of the two different approaches to flood risk management will changesignificantly due to climate change. Structural approaches will probably prove to beincreasingly less effective while people-centred strategies will sustain. Higher flowpeaks and sediment loads will almost certainly make existing embankments, spursand other structural interventions ineffective. As result water logging, breaches andother costs will increase further. This means, reliance on structural measures as astrategy for responding to the increased flood risk anticipated as a consequence ofclimate change will not be effective. In contrast, the benefits from people-centredinterventions appear relatively resilient to the impacts of climate change. The benefitsfrom boats, early warning systems and raised plinth levels on houses, for example, arelikely to grow if floods increase though their benefits may not be sufficient to respondadequately to the impacts of climate change on local populations. A combination ofstrategies may ultimately prove more effective than reliance on one response alone.
Given that governments continue to emphasis on importance of embankmentsconstruction to alleviate the impact of flooding, we must consider the large-scaleimplication of our qualitative cost-benefit analysis. State reliance on embankment wasmarkedly evident in the conclusions of many meetings between government of Nepaland India. According to Dixit (2008) the Standing Committee on Inundation ProblemsAlong the Border Regions of the Nepal Tarai has repeatedely recommended that newembankments be built even though the problem is itself created by obstruction ofnatural drainage caused by an embankment built in northern Uttar Pradesh and Bihar.
The existing political and institutional dynamics have meant that state agenciesstrongly support the construction of embankments to serve as the primary mechanismfor flood protection despite the fact that these structures have had more negative thanpositive impacts. A more balanced regional approach that emphasizes people-centredinterventions, limited structural protection measures in conjunction with specificinvestments in drainage and maintenance to reduce the embankment-created costs ofwater logging, disease transmission and breaching, could be effective both now and inthe future under changed climatic conditions.
Such efforts are likely to yield more dividends than will total reliance on relief. In 2007the representatives of communities affected by flooding in the region themselvesexpressed severe dissatisfaction with relief efforts, especially the use of high-cost
129
Quali
tativ
e Asse
ssmen
t of C
osts
and B
enefi
ts of
Floo
dMi
tigat
ion: L
ower
Bagm
ati B
asin
- Nep
al an
d Ind
ia
helicopters to distribute food and materials. They suggested that measures that focuson preparedness and incremental support are likely to be much more effective in thelong run. The same criticism was made during the floods of 2008.
Issues Encountered in Conducting CBA
Although the qualitative estimate of costs and benefits was conducted in a systematicway, it has certain limitations primarily because the data available in the region isvery limited. In many cases data for the last decade is not even available. Informationon the direct costs of most interventions (for example, embankments and irrigationprojects) is also lacking. The challenge of locating data is illustrated well in the case ofthe regional profiles produced by Nepal's Department of Agriculture). While thedistrict offices of the Department do publish annual district profiles which recordagricultural inputs and outputs, total food surpluses and deficits and the prevailingmarket prices for agricultural produce, they are rarely available for any year before2003. In addition, district offices lack institutional memories because personnel aretransferred frequently. Furthermore, although district offices do forward their annualprofiles to regional offices, when these offices were moved from Hetauda to Kathmanduand back again, most data were lost.
Major difficulties also exist in obtaining reliable demographic data and maps. Officialsin Bairgania block, for one, were hesitant to provide such data until letters and thescope of research were presented. Only then was the researchers directed to Sitamarhi,the district headquarters. There the local maps available at Sitamarhi Cadastral Sectionproved very difficult to obtain. At the Bairgania block office, even the 2001 census datawas unavailable and there are no civil society actors like NGOs which could providethat information.
In addition to challenges in collecting data, assessing the losses avoided and the oftennon-market nature of the benefits of many disaster risk reduction investments, iscomplex. As a result, many indirect costs and benefits associated with interventionsmight be unintentionally overlooked. The political uncertainty and unrest in the NepalTarai that began in 2007 and has continued to date was another major impediment.Surprise strikes and protests hindered the mobility of the study team and events likebeating to death 30 people in the third week of March 2007 in Gaur the headquarterswere acts of political violence.
In addition to limitations in the conduction of the analysis, the very idea of using cost-benefit analysis to evaluate flood risk management strategies is a relatively new one.Most donors and government departments and their field staff are unfamiliar withthis approach. Advocating use of cost-benefit analysis as a tool for evaluating floodmanagement interventions in the policy-making process is a hurdle. To overcomesuch challenges, points of entry need to be identified as a part of a continuous processand attempted by engaging with agencies such as the Ministry of Finance andintroducing the insights of analysis into the process of preparing the country's NationalAdaptation Plan of Action (NAPA).
130
Catalyzing Climate and Disaster Resilience: Processes for
Identifying Tangible and Economically Robust Strategies
Conclusions
Our assessment clearly reveals that current investments in constructing embankmentsto address flood risks produce both winners and losers. Structural measures provideshort-term benefits to a few communities but generate negative consequencesdownstream and in unprotected areas when they prevent flood water within the basinfrom draining quickly. Furthermore, when embankments breach, the devastation in,and cost to the protected areas will be extremely high. The flooding caused by thebreach of the Kosi embankment in Nepal's Sunsari District on 18 August, 2008, is acase in point. The resulting inundation affected over 50,000 people in Nepal and asmany as 3,500,000 in North Bihar.
Analysis in the case study region suggests that the number of families benefiting fromstructural measures, such as embankments, as they are currently designed, is relativelyfew if one keeps the costs in mind. Our analysis also suggests that in a dynamichydrologic context where rivers move laterally and transfer large sediment loads, therole of embankments is limited and that their effectiveness may decline further ashydrological dynamics become more erratic due to the impacts of global climatechange. People-centred investments such as early warning systems, raising the plinthlevel of houses and providing boats, in contrast, have fewer costs than benefits. Theyalso appear far more resilient to the expected uncertainty associated with climatechange impacts. This said, however, it is unclear that such strategies will be able tomitigate flood risks sufficiently to reduce losses as the impact of climate change on thehydrological cycle increases.
In a context where embankments, spurs and other structural measures are the focusof government and policy-making organizations, the qualitative methodology of thisstudy provides new insights and helps evaluate alternatives. By systematicallyidentifying the costs and benefits of embankments and other alternatives in this methodcould be a useful tool for planning and implementing disaster risk reductions strategies.
Our qualitative cost-benefit analysis helped to identify (a) the types of costs and benefitsassociated with various flood management techniques; (b) the relative magnitudes ofthese costs and benefits; and (c) their distribution. While this method does not providesufficient information for us to be able to evaluate the overall economic viability of the
131
Quali
tativ
e Asse
ssmen
t of C
osts
and B
enefi
ts of
Floo
dMi
tigat
ion: L
ower
Bagm
ati B
asin
- Nep
al an
d Ind
ia
various strategies, it does provide critical insights, which are, at the least, sufficient toindicate major areas where work is needed on drainage and sediment management,for example, if structural measures are to be part of future flood risk mitigationstrategies. The analysis also provides key insights into people-centred measures thatcould serve as a core element in the design of future strategies to manage flood risksand adapt to climate change impacts.
The information generated by this qualitative benefit-cost assessment can serve as afoundation for many of the similar insights that would be generated by a quantitativeapproach. It highlights both the direct and indirect costs and benefits associated witheach type of risk reduction intervention. In addition, the methodology enables anevaluation of the differential distribution of costs and benefits to different sections ofthe population in a data-deficient environment. Quantitative cost-benefit techniques,in contrast, are inadequate for estimating the magnitude of the costs and benefitsidentified and for comparing them meaningfully. In many ways, this qualitative analysislays the groundwork for a quantitative evaluation without replacing it. If a full cost-benefit analysis is needed to assess structural options, this methodology wouldstrongly complement it because it identifies and includes many costs and benefits thatare often excluded as externalities in standard economic evaluations.
132
Catalyzing Climate and Disaster Resilience: Processes for
Identifying Tangible and Economically Robust Strategies
Bibliography
Department of Roads (2004) ‘Road Statistics’. Kathmandu: Government of Nepal http://www.dor.gov.np/road_statistics.php [accessed June 5, 2008].
Gyawali, D. and A. Dixit (1994) ‘The Himalaya Ganga: Contending with Interlinkages in a ComplexSystem’, Water Nepal 4(1): 1-6.
Hufschmidt M. M., D.E. James, A.D. Meister, B.T. Bowler, and J.A. Dixon (1983) Environment,Natural systems, and Development: An Economic Valuation Guide. Baltimore,Maryland: John Hopkins University Press.
IPCC (2007) ‘Summary for Policymakers’, in M.L. Parry, O.F. Canziani, J.P. Palutikof, P.J. van derLinden and C.E. Hanson (eds) Climate Change 2007: Impacts, Adaptation andVulnerability, Contribution of Working Group II to the Fourth Assessment Reportof the Intergovernmental Panel on Climate Change, pp 7-22. Cambridge, UK:Cambridge University Press.
Kuiper, E. (1971) Water Resources Project Economics. London: Butterworths.MoWR (1993) Report on Floods in Bagmati River Basin July 19-21, 1993. Kathmandu: Ministry of
Water Resources, Government of Nepal.Moench, M. and A. Dixit (eds) (2007) Working with the Winds of Change: Toward Strategies for
Responding to the Risks Associated with Climate Change and Other Risks. Boulder:Institute for Social and Environmental Transition; Kathmandu: ISET-Nepal; Geneva:the ProVention Consortium.
Moench, M. and A. Dixit (eds) (2004) Adaptive Capacity and Livelihood Resilience: AdaptiveStrategies for Responding to Floods and Droughts in South Asia. Boulder: Institute forSocial and Environmental Transition; Kathmandu: ISET-Nepal.
Nepal Red Cross Society (2007) ‘Impacts of 2007 floods’. Unpublished report.
Comparing Urban Flood Mitigation Options:Costs and Benefits in Rawalpindi, Pakistan
5C H A P T E R
Fawad Khan (ISET)Syed Ayub Qutub (PIEDAR)
Daanish Mustafa (King’s College London)Atta-ur Rehman (ISET)
Daniel Kull (IIASA) &The Risk to Resilience Study Team
134
Catalyzing Climate and Disaster Resilience: Processes for
Identifying Tangible and Economically Robust Strategies
Country: PakistanLocation: The Rawalpindi/Islamabad conurbation: Areas subject to flooding by the Lai RiverIssue: Urban flooding along the river corridor exacerbates poor living conditions in densely
populated areas with severe drinking water, sanitation and solid wasteproblems. The study investigated the efficacy of four disaster risk reduction measuresthat sought to reduce flood impacts.
Key Concepts
The Lai River basin is prone to flooding, particularly during the monsoon season, but is notconsidered important enough by national-level actors to invest in disaster risk reductionmeasures.Different actors at various scales have unique views of the hazards facing the basin and howto address them. National and regional level government actors want structural remediationmeasures and an early warning system. Local residents identify a wider range of strategiesfor strengthening resiliency, including clean drinking water and solid waste management.Both of these issues, and others, are exacerbated in flood situations. Yet the governmentrarely consults the public when conceiving and implementing projects.The study utilized a qualitative-quantitative-qualitative analysis of the efficacy of four DRRmeasures: the Lai Expressway and Channel Improvement Project, early warning systems,flood retention ponds and channel section straightening, and the hypothetical constructionof a wetland flood plain buffer on 100m of either side of the Lai River.Sectoral competition between government agencies and across scales hampers dialogueand action in the basin. Data problems are rife, mainly caused by secrecy, unwillingness toshare “public” data with the public or other government sectors, and simple lack of data oroutdated data.A fluid political environment transitioning toward a parliamentary democracy is causinguncertainty in disaster risk reduction (DRR) policies and lack of consistency in policiesbetween one government and the next. This hinders the development and implementationof coherent, multi-hazard plans at any level from local to national, whether they are inresponse to man-made hazards, such as improper sewage disposal, or natural hazards suchas floods.Given the data limitations and shifting political landscapes, a full cost-benefit analysis ofthe four selected DRR measures proved difficult to perform. Therefore, the more importantresults of this study are the processes and steps taken, such as shared learning dialogues(SLDs) and flood mapping exercises, than any of the numbers produced by the cost-benefitanalysis.
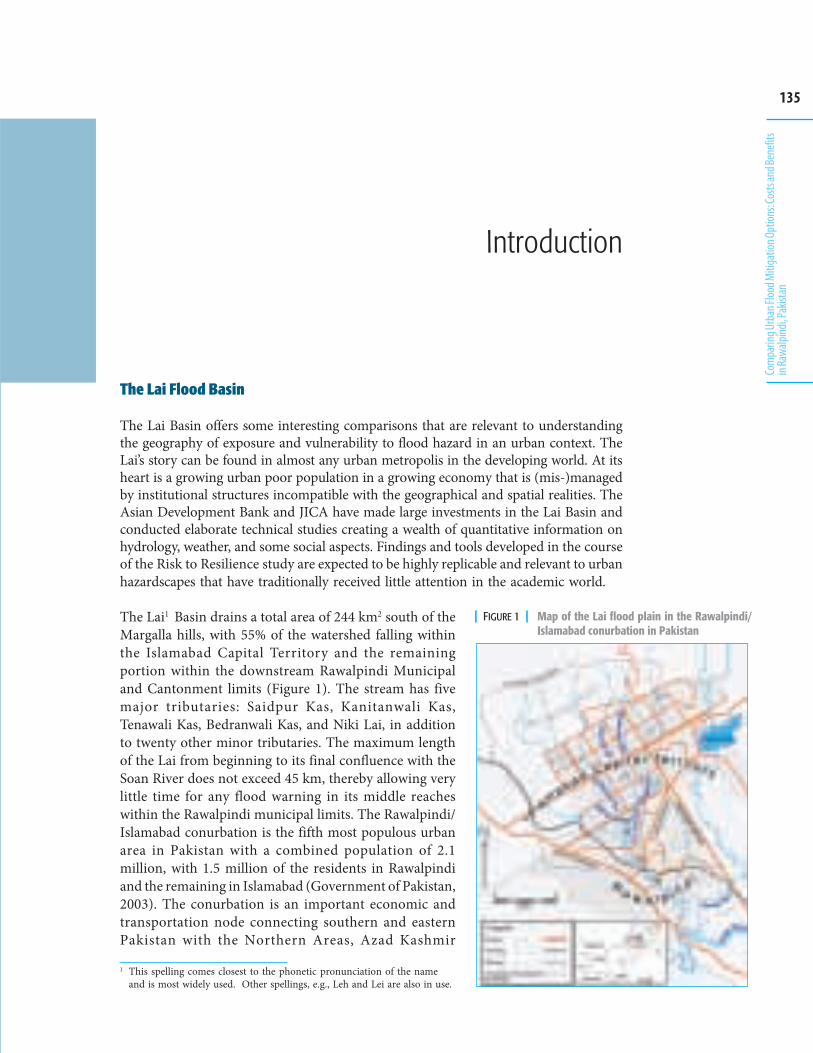
135
Com
parin
g Urb
an Fl
ood M
itiga
tion O
ption
s: Cos
ts an
d Ben
efits
in Ra
walpi
ndi, P
akist
an
The Lai Flood Basin
The Lai Basin offers some interesting comparisons that are relevant to understandingthe geography of exposure and vulnerability to flood hazard in an urban context. TheLai’s story can be found in almost any urban metropolis in the developing world. At itsheart is a growing urban poor population in a growing economy that is (mis-)managedby institutional structures incompatible with the geographical and spatial realities. TheAsian Development Bank and JICA have made large investments in the Lai Basin andconducted elaborate technical studies creating a wealth of quantitative information onhydrology, weather, and some social aspects. Findings and tools developed in the courseof the Risk to Resilience study are expected to be highly replicable and relevant to urbanhazardscapes that have traditionally received little attention in the academic world.
The Lai1 Basin drains a total area of 244 km2 south of theMargalla hills, with 55% of the watershed falling withinthe Islamabad Capital Territory and the remainingportion within the downstream Rawalpindi Municipaland Cantonment limits (Figure 1). The stream has fivemajor tributaries: Saidpur Kas, Kanitanwali Kas,Tenawali Kas, Bedranwali Kas, and Niki Lai, in additionto twenty other minor tributaries. The maximum lengthof the Lai from beginning to its final confluence with theSoan River does not exceed 45 km, thereby allowing verylittle time for any flood warning in its middle reacheswithin the Rawalpindi municipal limits. The Rawalpindi/Islamabad conurbation is the fifth most populous urbanarea in Pakistan with a combined population of 2.1million, with 1.5 million of the residents in Rawalpindiand the remaining in Islamabad (Government of Pakistan,2003). The conurbation is an important economic andtransportation node connecting southern and easternPakistan with the Northern Areas, Azad Kashmir
Introduction
| FIGURE 1 | Map of the Lai flood plain in the Rawalpindi/Islamabad conurbation in Pakistan
1 This spelling comes closest to the phonetic pronunciation of the nameand is most widely used. Other spellings, e.g., Leh and Lei are also in use.
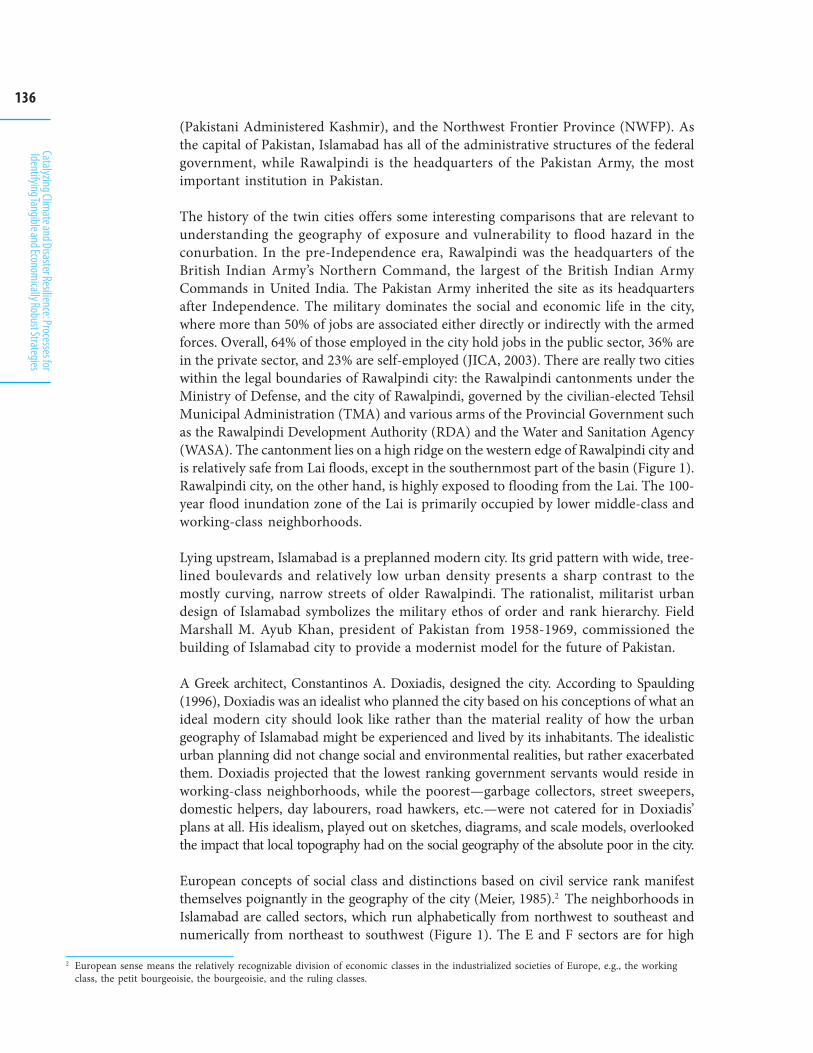
136
Catalyzing Climate and Disaster Resilience: Processes for
Identifying Tangible and Economically Robust Strategies
(Pakistani Administered Kashmir), and the Northwest Frontier Province (NWFP). Asthe capital of Pakistan, Islamabad has all of the administrative structures of the federalgovernment, while Rawalpindi is the headquarters of the Pakistan Army, the mostimportant institution in Pakistan.
The history of the twin cities offers some interesting comparisons that are relevant tounderstanding the geography of exposure and vulnerability to flood hazard in theconurbation. In the pre-Independence era, Rawalpindi was the headquarters of theBritish Indian Army’s Northern Command, the largest of the British Indian ArmyCommands in United India. The Pakistan Army inherited the site as its headquartersafter Independence. The military dominates the social and economic life in the city,where more than 50% of jobs are associated either directly or indirectly with the armedforces. Overall, 64% of those employed in the city hold jobs in the public sector, 36% arein the private sector, and 23% are self-employed (JICA, 2003). There are really two citieswithin the legal boundaries of Rawalpindi city: the Rawalpindi cantonments under theMinistry of Defense, and the city of Rawalpindi, governed by the civilian-elected TehsilMunicipal Administration (TMA) and various arms of the Provincial Government suchas the Rawalpindi Development Authority (RDA) and the Water and Sanitation Agency(WASA). The cantonment lies on a high ridge on the western edge of Rawalpindi city andis relatively safe from Lai floods, except in the southernmost part of the basin (Figure 1).Rawalpindi city, on the other hand, is highly exposed to flooding from the Lai. The 100-year flood inundation zone of the Lai is primarily occupied by lower middle-class andworking-class neighborhoods.
Lying upstream, Islamabad is a preplanned modern city. Its grid pattern with wide, tree-lined boulevards and relatively low urban density presents a sharp contrast to themostly curving, narrow streets of older Rawalpindi. The rationalist, militarist urbandesign of Islamabad symbolizes the military ethos of order and rank hierarchy. FieldMarshall M. Ayub Khan, president of Pakistan from 1958-1969, commissioned thebuilding of Islamabad city to provide a modernist model for the future of Pakistan.
A Greek architect, Constantinos A. Doxiadis, designed the city. According to Spaulding(1996), Doxiadis was an idealist who planned the city based on his conceptions of what anideal modern city should look like rather than the material reality of how the urbangeography of Islamabad might be experienced and lived by its inhabitants. The idealisticurban planning did not change social and environmental realities, but rather exacerbatedthem. Doxiadis projected that the lowest ranking government servants would reside inworking-class neighborhoods, while the poorest—garbage collectors, street sweepers,domestic helpers, day labourers, road hawkers, etc.—were not catered for in Doxiadis’plans at all. His idealism, played out on sketches, diagrams, and scale models, overlookedthe impact that local topography had on the social geography of the absolute poor in the city.
European concepts of social class and distinctions based on civil service rank manifestthemselves poignantly in the geography of the city (Meier, 1985).2 The neighborhoods inIslamabad are called sectors, which run alphabetically from northwest to southeast andnumerically from northeast to southwest (Figure 1). The E and F sectors are for high
2 European sense means the relatively recognizable division of economic classes in the industrialized societies of Europe, e.g., the workingclass, the petit bourgeoisie, the bourgeoisie, and the ruling classes.
137
Com
parin
g Urb
an Fl
ood M
itiga
tion O
ption
s: Cos
ts an
d Ben
efits
in Ra
walpi
ndi, P
akist
an
ranking officials, corporate elites, and diplomats, and they are separated by a commercialand green area, called ‘Blue Area’, from the more middle class G and I sectors. The industrialand agricultural H sectors are sandwiched between the two middle class G and I sectors.
It is little surprise, then, that in those areas by the banks of the tributaries of the Lai wherethe topography dips below the plains on which the city is built, one finds unplannedshantytowns called katchi abadis (Spaulding, 1996). More than 3% of Islamabad’spopulation, or about 3,000 households, lives in these katchi abadis and are the onlyneighborhoods that repeatedly suffer damage from floods, and especially the 2001 floods.
Moreover, the city was designed with very little regard for the hydrology andgeomorphology of the basin in which it is located. The physical location of Islamabadcreates special problems for Rawalpindi downstream. The decreased water absorptioncapacity of an expanding Islamabad, with significant amounts of impervious surface,further accentuates flood peaks downstream, in addition to reducing the groundwaterrecharge upon which much of Rawalpindi’s poorer population depends for water (Malik,2000a; Malik, 2000b).
The institutional hazardscape of the Lai is characterized by equally complex multiple,fragmented jurisdictions. At the macro-scale, the upper basin is under the federallycontrolled Capital Development Authority (CDA) and its various directorates, for examplewater supply, sanitation, and environmental management. The middle basin falls underthe local Rawalpindi Tehsil Municipal Administration (TMA), as well as the provinciallycontrolled Rawalpindi Development Authority (RDA). The lower basin is again under thefederally controlled Rawalpindi and Chaklala Cantonment Boards (RCB and CCB) andtheir various departments. The assorted stakeholder institutions within the Lai Basindisplay all the specialized bureaucratic structures and disciplinary backgrounds, frompublic administrator to civil engineers, particular to a modernist state apparatus. WhereIslamabad’s urban geography may be the poster child for the high modernist ideologyinherent to “seeing like a state” (Scott, 1998), the state institutions operating within the LaiBasin also manifest what Dove and Kammen (2001) call the disconnect between the fluidand diverse ‘vernacular models of development’ and the ‘official models of development.’Bureaucratic objectives are disconnected and uncoordinated: the sanitation directorateof the CDA is preoccupied with solid and liquid waste disposal, while the ReliefCommissioner of Rawalpindi focuses solely on floods. The messy interlinkages betweenissue areas, although widely recognized, do not and supposedly must not distract thepublic servants from their assigned tasks.
Methods
For this case study, the team utilized a qualitative-quantitative-qualitative (3Q)approach3 . The study was framed by a qualitative analysis in the scoping stage. The firststage included a literature review of disaster risk reduction in the region, in Pakistan andspecific interventions in the two areas scoped for the study–Muzaffarabad Tehsil in the
3 This term was coined by the study team. The usual conceptualization (qualitative) and subsequent analysis (quantitative) was not deemed tobe sufficient for drawing meaningful conclusions and hence another qualitative assessment of the results was imperative for advocacy anddecision making.
138
Catalyzing Climate and Disaster Resilience: Processes for
Identifying Tangible and Economically Robust Strategies
aftermath of the 2005 earthquake and the Lai Basin in Rawalpindi that is prone to frequentflooding. Initial stakeholder analysis and the subsequent first round of shared learningdialogues (SLDs) were held by ISET-Pakistan’s team at the institutional/organizationallevel and by PIEDAR at the community level. King’s College London supported bothteams in conceptual issues and orientation for fieldwork. A transect walk helped identifycommunities selected for the iterative SLD process. This process allowed the study teamto rank the hazards in the area and evaluate a wide range of options that were notconsidered in the formal policy circles.
At the institutional level, three rounds of SLDs were organized by ISET-Pakistan’s team.Initially, a stakeholder list of relevant organizations was drawn up and reviewed through outthe SLD process. One-on-one interviews were conducted with key officials involved in riskreduction and disaster management. These included stakeholders from all tiers of government,civil society, media, the private sector and individuals with interest in Lai issues.
In parallel, a comprehensive literature review was conducted, including gray literature,such as project planning documents. A thorough historical review of newspapers wasundertaken to understand the context of the evolution of the Lai’s problems and solutionsdiscussed over the last couple of decades.
The study team was then able to shortlist a number of options to be evaluatedquantitatively. A CBA analysis of four options was carried out using the availablesecondary data with additional information obtained from contour maps and satelliteimagery. The four disaster risk reduction options selected for analysis were: the LaiExpressway and Channel Improvement Project, an early warning project, the strategicconstruction of flood retention ponds and channel segment straightening, and thehypothetical construction of wetland flood plain buffers on 100m either side of the river.Initially, consideration was given to options that demonstrated a soft versus structuralapproach; the final decision on options evaluated, however, also depended on theavailability of the necessary data to carry out a full cost-benefit analysis. Thecomprehensive flood mitigation plan prepared by JICA provided a wealth of information.Although collecting primary data was beyond the scope of this study, a cost-effectivemethod of more accurately assessing assets at risk was devised by using contour mappingand Google Earth pictures to manually identify and count existing structures that mightbe impacted in flood damage for various flood return periods.
In order to estimate flood damage further into the future, the Lai’s flood depths werecalculated and projections for various flood return periods of between 5 to 200 yearswere calculated. In addition, a simple statistical rainfall runoff model was developed topredict flooding patterns for various climate change scenarios in the region.
In parallel, an index based vulnerability analysis was conducted in some of the worstaffected areas of the Lai flood plain. Following an economic analysis of the variousoptions, the strategies were once again evaluated with the policy and politicalenvironment in mind to assess how disaster risk reduction could be best advocated atvarious levels. An evaluation of the usefulness of CBA for various points of leverage inacademic, policy formulation and implementation of various developmental and riskreduction activities was also undertaken, thus adding a third layer of qualitativeassessment to assess the distribution of costs, benefits and vulnerability in the area.
139
Com
parin
g Urb
an Fl
ood M
itiga
tion O
ption
s: Cos
ts an
d Ben
efits
in Ra
walpi
ndi, P
akist
an
The Contextual Environment,from Community to Policy
Strategies
The newly appointed chairman of the National Disaster Management Authorityadmitted, in his first contact with the research team, that the Lai was too small to beconsidered for risk reduction at present (Khan and Mustafa, 2007). In the past, therehad been announcements about various measures to control flooding, including ideassuch as covering the Lai with concrete which would be paid for with proceeds fromshopping plazas built over the top. In our newspaper research, we discovered that theidea of straightening and deepening the Lai river channel had been debated since theseventies. Discussions of the encroachment along the river’s flood channel and ofremoving these illegal settlements had also been ongoing. In reality, however, notmuch has been accomplished. Garbage dumping, new encroachments and continuedflooding have undone whatever little channel improvement activities have been carriedout. One participant at a local level institutional SLD commented, “I have seenbulldozers move up and down the Lai ever since I was child but the flooding and otherproblems remain unresolved.” (SLD with District Government organizations, 2007).
A project on early warning was announced as an urgent project implemented as theFlood Forecasting and Warning System for Lai Nullah Project, with the technical andfinancial assistance of JICA. The exorbitant cost of the project, initially estimated atPKR 16 billion (about USD 260 million at the time), was only announced years later,however, in early 2007, quoted in the press as the ‘Lai Expressway’.
External support agencies have also promoted mitigation programmes for the Laithat largely comprise structural measures. For example, after the flood of 2001, JICAfunded a mitigation programme for the Lai that included check dams in the catchment,a lake upstream of the flood prone area, and diversion of its three main tributaries toanother river. This so called “comprehensive flood mitigation strategy” was formulatedwith little consultation with communities living along the Lai or the proposed diversionchannel. In the end, the large engineering components were not implemented despitethe laborious technical preparation owing to the prohibitive cost. There was, however,a degree of improvement with removal of some of the illegal settlers along the banks ofthe riverbed, some removal of garbage and opening of the river channel following each
140
Catalyzing Climate and Disaster Resilience: Processes for
Identifying Tangible and Economically Robust Strategies
flood. Most of the gains were lost within a year due tolack of enforcement bringing the situation back to thepre-flood levels as population moved back and garbagedumping resumed.
What is being Done?
The local authorities make an annual flood preparationplan before each monsoon (SLD with Fire Department,2007; EDO Health, 2007) to prepare for flooding. Dueto scant financial allocations, the plans are nominal andinclude a couple of buildings designated as shelters andmeager funds allocated for food and basic necessitiesfor flood relief. What happens in practice is that thefiremen monitor the water levels during the monsoonsand when these reach a certain level (a 20 foot rise), theysound their sirens and urge settlers in the flood plain toevacuate. The designated shelters were only ever usedduring the 2001 floods, when even the homes of thosewho provided shelter to friends and families living onlower ground got inundated. The only proactivedisaster management efforts come from local levelauthorities, but the bulk of disaster related funds andresources lie at a much higher level in the institutionalhierarchy and do not filter down.
Early Warning SystemDue to the high cost of JICA’s comprehensive floodmitigation plan, only one component of the plan hasbeen implemented. From the array of soft resilienceoptions proposed, an intricate flood warning systemfor the Lai was chosen to be implemented. Although therisk reduction operational arrangements, which involvecommunication and monitoring are in place, they areyet to be tested in a real disaster situation.
The operation control room is located in the TehsilMunicipal Administration. The flood warning alarmactivation is entrusted with the 1122 emergency servicewhile the overall control of the early warning systemlies with the district cordination officer (DCO). Theactual relief and rescue organizations at the locallevel—the fire department and the voluntary civildefence—belong to yet a different tier of the localgovernment. Communication between these
organizations and with other backup control stations with the Pakistan MeteorologicalDepartment, the implementation agency for the project, is informal and unreliable.
Box 1Newspaper Review – Old wine in a new bottle
The demand for straightening, deepening, diverting, building checkdams and lining with concrete the Lai Nullah has been a majorrecurrent theme among the residents and managers of the city,particularly whenever there is a high flood in the Lai. The DailyJang newspaper offers numerous news items, editorials, andstatements on the subject wherein people have been demandingfor decades that these activities be carried out to manage floods inthe Lai. In the 4th September 1971 issue of the paper, for example,a meeting of the Commissioner, Rawalpindi Division was reportedon. The article states: “Commissioner, Rawalpindi Division,Mr. Inayat Mirza, has directed the Irrigation Department and theTown Planners to straighten the Lai, particularly the meander nearGawalmandi bridge. ‘These meanders are as a matter of fact thereal cause of surge in Lai’, he stated.” In the same article, thenewspaper quotes a scheme put forward by a retired engineerand town planner of the Rawalpindi Improvement Trust, in which anumber of small check dams would be built near Golra village,which is at the origin of the Lai. According to him, a pipe ofsizeable diametre should be laid down in the Lai and covered withearth, over which a couple of bazaars could be raised.
In the wake of the 1974 floods, a news report says, “the DeputyCommissioner of the district has instructed the city municipalityand the Rawalpindi Improvement Trust to clean the Lai andstraighten it to avert floods on urgent basis”. The DeputyCommissioner allocated PKR 70,000 for this purpose. In the samenews report, residents of the city had demanded a permanentsolution to the floods in the Lai and suggested that it should belined and covered with concrete. In another news article publishedin the 23rd August 1975 issue, the president of a local communitybased organization who is also an architect states: “both sides ofLai should be lined with concrete and banks of it may be raisedhigh.” He also suggested a road be built on either bank of thenullah, which would not only prevent floods but ease the pressureof traffic in the city and improve the surroundings of the nullah atthe same time.
In 1981, the then president of Pakistan was quoted as saying thata comprehensive plan should be formulated to prevent floods inthe Lai and that the Federal Government would provide funds forthe project. A committee headed by the Minister for Housing wasset up to look into the various flood mitigation options. Theseincluded, amongst others, concrete lining of the river channel anddiversion of the Lai Nullah into the Korang River.
An editorial of August 1982 says, “Either Lai is diverted or a highconcrete wall may be raised on its sides to contain the floodwater”. In yet another editorial of June 1985, diversion of the LaiNullah was again emphasized as a possible measure to controlfloods. During the 90s, particularly the 1994, 1995 and 1996 floods,demands to prevent flooding in the Lai were yet again brought up.In the aftermath of the unusually high floods of 2001, all thesedemands and ideas surfaced again and an urgent project waslaunched for cleaning, deepening and straightening the riverchannel as well as removing encroachments to make way forflood waters under the Lai Nullah Improvement Project funded bythe Asian Development Bank.
Source: Daily Jang archives, 1970-2006.
141
Com
parin
g Urb
an Fl
ood M
itiga
tion O
ption
s: Cos
ts an
d Ben
efits
in Ra
walpi
ndi, P
akist
an
Most government projects, not just those witha high political profile such as the early warningsystem or the Lai Expressway described above,focus on investment and physical works withlittle consideration for operational aspects orprovision for maintenance, let alonesustainability. For example, a recentlycompleted project of the Rawalpindi WaterSupply and Sanitation Agency augmentedwater supplies while cross contamination withsewage in the distribution network remains apersistent problem.
Rawalpindi Environmental ImprovementProject (REIP)Under this project (see Box 3) for theimprovement of the sewage system, existingdrains will be remodelled and new drainsconstructed at selected locations. The sewagetreatment plant, the project’s majorcomponent, is proposed to be built on the leftbank of the River Soan. Additionally, for bettersolid waste management, in terms of collectionand disposal, a 75 acre sanitary landfill site hasbeen proposed near a village some 30kilometres outside the main city. Relocation ofa slaughterhouse, located in the city centre, toa more hygienic and environmentallyacceptable facility at the existing SihalaSlaughterhouse will improve environmentalquality. Construction of 15 public toilets is alsopart of the project. Forty contaminated orinefficient tube wells will be replaced and 35tube wells rehabilitated to improve waterquality and its distribution.
From its inception, the project has been slowin implementing different components and isdelayed. For the sewage treatment plant, forexample, 6,000 canals of land are required butonly 2,000 have been acquired. The preliminarydesign of the plan has, however, been prepared.Remodelling of existing drains (nullahs) isimpeded owing to limited access to thosenullahs with people having encroached on themby building houses or markets near and overthem. There is no route for machinery andequipment to have access to the nullahs. For
Box 2Project for the Improvement of the Flood Forecasting and WarningSystem for the Lai Basin in Islamabad and Rawalpindi.
In the wake of exceptionally high floods in the Lai Nullah in 2001, theGovernment of Pakistan requested the Government of Japan to extendtechnical assistance for a study on ‘Comprehensive Flood Mitigation andEnvironmental Improvement Plan of Lai Nullah Basin’. The JapanInternational Cooperation Agency (JICA) decided to conduct the study,mutually agreed on between the two governments. The study began inAugust 2002 and was completed in September 2003. Its objectives includedthe formulation of a master plan for comprehensive flood mitigation andenvironmental improvement in the study area, and capacity building—thetransfer of skills and technology in these domains to counterpart personnelof concerned government agencies.
Non-structural measures recommended in the study included a floodforecasting and warning system and creating flood risk maps. Both thesemeasures were proposed for implementation through an urgent project.Other non-structural measures related to environmental improvementincluded land use control, control of solid-waste dumped into the river,improvement of drainage and sewerage and institutional strengthening inthe implementation of the flood mitigation project, which included capacitybuilding and formulating the institutional framework with clear roles andresponsibilities.
The following structural measures were recommended for flood mitigationfor the Lai Nullah:1. Improvement of the river channel by deepening and protecting the sides
of the Lai Nullah and its tributaries;2. Creating a flood retarding basin at F-9 Park;3. Creating a flood diversion channel;4. Building a flood control dam; and5. Creating on-site flood detention facilities.
Following extensive discussions on the different options and their pros andcons, the flood forecasting and warning system were undertaken as anurgent project. The overall goal of the project is to mitigate flood damage,particularly death and injury to residents in the capital region through promptevacuation of residents to safer locations. The project aims to provide earlyand accurate forecasting and flood warning with a lead-time of one to twohours. The Government of Pakistan requested the Government of Japan foraid in procuring equipment as well as in the construction and installation ofthe facilities, which included a real time observation system of rainfall andriver water level gauge stations, a data processing system for floodprediction, and a flood warning system. The project also included drawing upa flood hazard map and designing a flood evacuation plan and a flood riskmanagement plan.
The total cost of the project was PKR 360,000 million. The costs borne byJapan and Pakistan respectively were PKR 337,000 and PKR 23,000 million.The project was to be completed in 21 months.
The departments and agencies involved in the project include the PakistanMeteorological Department (PMD), the Federal Flood Commission (FFC), theWater and Sanitation Authority (WASA) and the Tehsil MunicipalAdministration (TMA). An elaborate system of flood forecasting and warninghas been established, which comprises six raingauge stations (automaticrainfall data observation), two water level gauge stations and ten flood-warning posts. A master control room is set up in the PMD headquarters inIslamabad, and two monitoring stations are set up at the Federal FloodCommission office in Islamabad and at the Water and Sanitation Authority’soffice in Rawalpindi. A Flood Warning Control Centre is established at theTMA office in Rawalpindi. The early warning system became functional in2007 and a full drill was carried out before the monsoon of that year.
Source: PC-I, JICA Study, various newspapers.
142
Catalyzing Climate and Disaster Resilience: Processes for
Identifying Tangible and Economically Robust Strategies
Box 3Rawalpindi Environmental Improvement Project (REIP)
REIP is a five years project launched in 2006. Total cost of the project is estimated to be PKR 5.142 billion, out ofwhich Asian Development Bank, Government of the Punjab and District Government Rawalpindi has contributed70%, 25% and 5% of the total cost respectively. It aims to improve living conditions and quality of life of the peopleof Rawalpindi by improving water supply, sanitation facilities, solid waste management, wastewater treatment, andslaughterhouse. It also includes strengthening of institutional capacities of the Tehsil Municipal Administration(TMA) and Water and Sanitation Agency (WASA). The project components comprised environmental sanitation,water supply services and institutional development including financial management, database development, assetmanagement project implementation support and incremental administration support.
this component of the project, five major drains were planned to be remodelled. Theproject for one of these drains was awarded to a contractor, but this contractor hasnot been able to start work because of the lack of physical access to the drain. Thecontractor entered into litigation to get the project revoked. Another of the five drainsis currently being remodelled by the Public Works Department, while projects for thethree remaining drains have yet to be awarded. Replacement of the sewage network inthe most populated localities of the city is in progress. Replacement of drinking waterpipes is also in progress, as is the construction of public toilets and rehabilitation oftube wells. Approximately 20% of the project’s work is complete so far (SLD withWASA, 2008).
Lai Expressway and Flood Channel ProjectRawalpindi was the constituency of the former Federal Minister for Railways. In March2007, he sought and obtained the endorsement of the president of Pakistan for the LaiExpressway Project along both banks of the Lai Nullah to provide another arterialconnection between Rawalpindi and Islamabad. The project was also marketed as aflood protection project. Sheikh Rashid Ahmed, Minister for Railways, said in anewspaper interview that about 300,000 people living in the vicinity of the Lai wouldno longer have to face the threat of floods, as the Expressway would elevate the banksof the river (Dawn, 2007a). The then Director General of the Rawalpindi DevelopmentAuthority clarified in a newspaper interview that this was not a road developmentproject and that the full name of the project was the Lai Nullah Expressway and FloodChannel Project (Dawn, 2007b). The project was inaugurated even before it was formallyapproved by the Planning Commission.
Government departments and executing agencies also have vested interests inpromoting politically motivated projects that are aligned with or expand theirmandates. The Frontier Works Organization, for example, proudly displayedbillboards boasting the Lai Expressway as the largest turnkey infrastructure projectin Rawalpindi. Such departmental engagement is frequently the reason that projectssurvive a change of government.
The project was first reported in the press in early February of 2007, when a presentationwas made to the President of Pakistan, General Pervez Musharraf, who expressed keeninterest in the project. He directed to form a steering committee, comprising the DeputyChairman of the Planning Commission, the Chief Secretary of the Punjab and the ChiefEngineer at the Army General Headquarters, to work out details of the project.
Source: ADB, 2008
143
Com
parin
g Urb
an Fl
ood M
itiga
tion O
ption
s: Cos
ts an
d Ben
efits
in Ra
walpi
ndi, P
akist
an
Sheikh Rashid Ahmed, the then Minister for Railways and a long time resident andpolitician of the city, publicly claimed that the Lai Expressway Project was a result ofhis efforts. In the public gathering on 27 March in Rawalpindi, he said that theExpressway was his dream that had been materialized by the President (Dawn, 2007b).This was confirmed by one of the officials of the RDA (implementing agency of theproject) that he floated the idea during 2002-2004 to the President for his consideration.In 2007, he began to mobilize his election campaign around this mega project. On 27March 2007, a big public gathering was organized in Liaquat Bagh, where the Presidentmade the announcement and inaugurated the project claiming that the Lai Expresswaywill change the face of the city (Dawn, 2007b). At the time, the project had not beenapproved by the Planning Commission. The President also announced that peoplerelocated by the project should be given a better deal than their present housing,which was also endorsed through the directive issued by the then Prime Minister thesame month. The President also announced an elevated expressway on Murree Road,widening of Airport Road, a Rawalpindi bypass from Rawat, and in recognition ofthe efforts of Sheikh Rashid Ahmed, the Lai Expressway was renamed as the SheikhRashid Expressway.
On the other hand, the Government of the Punjab, which was sharing 50% of the costof the project, did not seem to be in favor of this project because of its high cost,estimated at PKR 16 billion at that time. There were numerous smaller or medium-scale development projects that could be launched in different districts to mobilizevoters for the upcoming election across the province, rather than investing so muchmoney in one city. The dispute over costs and cost-sharing were also reflected in theminutes of the proceedings of the first Steering Committee meeting held on 15 May2007, where the Deputy Chairman of the Planning Commission emphasized that theGovernment of Punjab should own the project and release the required amount atthe earliest possible date. The Federal Government made a commitment to allocate200 million in Public Sector Development Programme, 2007-2008 and theGovernment of Punjab was asked to make equivalent allocation in the AnnualDevelopment Programme, 2007-2008.
Given the personal interest of the President, the project processing and preparatorystudies were completed in record time. The feasibility study was carried out in 15days by National Engineering Services Pakistan (NESPAK), while approval fromECNEC (the highest body to approve the project above PKR 500 million) cameimmediately. The Expressway was declared a special scheme and the government-owned NESPAK was entrusted with the tasks of design and research, while the FrontierWorks Organization (FWO, a subsidiary of Pakistan Army) was named the executingorganization. The Rawalpindi Development Authority was supposed to act ascoordinating agency. Contracts were awarded to NESPAK and FWO withoutcompetitive bidding, which is required for any development project. Additionally,the unit rates quoted by FWO for the project were higher by 25% compared to thestandard approved unit rates by the Government of Punjab. According to the contractsubmitted to and approved by the Punjab Government, FWO was supposed to design,execute and commission the project within a stipulated period of two years’turnaround time.
144
Catalyzing Climate and Disaster Resilience: Processes for
Identifying Tangible and Economically Robust Strategies
When the project was submitted to the Planning Commission for final approval, theDeputy Chairman challenged the competency of FWO to complete the project withinthe given timeframe. He said that funds should not be released until FWO couldprovide assurances that the project would be completed and fully operational withintwo years. At this point, the FWO expressed reservations in undertaking the projectbased on the time condition. Prior to the formal award of project, the Director Generalof the RDA (a retired brigadier) signed an agreement, through which RDA was toprovide FWO PKR 200 million as an ‘initial advance’ apart from the mobilizationadvance, which was not yet processed. The cheque was issued for payment to FWO bythe RDA. The treasury refused to honor the cheque because there was no provision inthe original project agreement to pay a contractor an initial advance.
The struggle to award the project to FWO continued and after many delays, thePlanning Commission awarded the project to FWO divided into several smaller workpackages without a stipulated period to complete the project.
An assistant director of the RDA was of the view that the project might take five yearsto complete, as mega projects routinely face continuous delays. Similarly, the projectcost was projected escalate from PKR 18 billion to PKR 30 billion. Responding toenvironmental implications of the project, he said that as far as groundwater rechargeis concerned, the water of Lai is too contaminated to use for any purpose. He alsoindicated that trunk sewers for sewage water on the side of Lai and the lining of the Laibed and slopes with RCC would not only increase the velocity of the water, whichwould prevent recurrent floods, but also improve the environment. The assistantdirector also indicated that the project would incur high costs, but it would be self-sustaining, as toll would be charged from the users. (SLD with RDA, 2008)
The main aim of the project was to share the ever-increasing pressure and burden ofthe traffic load of the city. It would have been a traffic-signal free road with an averagespeed of 50 kmph. The project road was to start at the Chaklala Bridge and end at theKatarian Bridge. The total length of the two carriageways would have been 22.2 km.Three interchanges were proposed, at Chaklala bridge, Murree Road and Katarianbridge and eight flyovers would be constructed on eight major crossings.
The secondary objective of the project was to avert floods in Lai. For this purpose, theLai’s bed would be deepened by about one metre for reasonable flow velocities. Thebed widths were so selected as to accommodate 100 years discharge levels within an 8metres flow depth, with 0.5 m freeboard (the height difference between the water surfaceand the top of the channel walls). The side slopes of the nullahs would have beenstraightened and maintained through reinforced earthen walls and RCC box structuresto create the roadway space. The nullahs then would be properly lined with RCC.(Government of Punjab, 2007; SLD with RDA, 2008)
Originally, the project cost was PKR 14.7 billion, a breakdown of PKR 8.0 billion forremodelling the Lai and PKR 6.7 billion for the expressway. The Deputy Chairman ofthe Planning Commission made a suggestion in the Steering Committee meeting tohave fully separate and independent trunk sewers for sewage water along the LaiNullah, which were capable of conveying projected sewage flow for the next 100 years.
145
Com
parin
g Urb
an Fl
ood M
itiga
tion O
ption
s: Cos
ts an
d Ben
efits
in Ra
walpi
ndi, P
akist
an
The sewer construction further escalated the cost by over PKR 1 billion. The finalproject cost was projected to reach PKR 17.77 billion. Originally, 50% of the sewagewater was to flow through the channel and 50% through the trunk sewers, to be laiddown under the Rawalpindi Environment Improvement Project (Government ofPunjab 2007a).
The expressway would have given a direct route from the current military and jointcommand headquarters to new headquarters planned near the headwaters of the Lai.This factor may explain the heavy lobbying from the military headed government andits deputies at various levels in the government. The original JICA flood mitigationstudy had recommended channel improvement of the Lai downstream from theexpressway portion, as this area was identified as a “bottle-neck” for flood waterflows. However, increasing the slope and capacity of channel upstrean would onlyaggravate the flooding downstream, which incidentally is occupied by military housingincluding the Army House for the Chief of the Armed Forces.
The expressway also proposed lining of the channel, which would seriously affectgroundwater recharge in a basin where water tables are declining. In 2008, somenewspapers reported that, due to lack of infiltration in built-up Islamabad andgroundwater drafting for drinking water, the water tables have declined up to a depthof 400 feet from a historical level of 80 feet. Municipal tube wells for drinking waterhave to be augmented with water from nearby dams and still do not fulfill total demand.A new project for drinking water supply to the twin cities (Rawalpindi–Islamabad)has already been planned, but has awaited approval for funding for the past two years.This drinking water project, the Ghazi Barotha Water Supply System, is estimated tocost PKR 47 billion. The project will have massive pumping requirements because it isslated to transport 200 million gallons of water per day (MGD) from the Indus Riverto Islamabad through a 60 km long pipeline (APP, 2008). Additionally, the Expressway’sdesign assumes that the clay soil would allow construction of a channel. The soil typehas already caused problems as the walls of the river start crumbling after a smallrain. The instability has already brought down a road and the boundary walls of somehouses (The News, 2007; SLD with the residents of Kumhar Road, 2007).
What are the Policies?
In Pakistan, government policy remains focused on infrastructure development, especiallymega-projects, and technology driven solutions to natural hazards. Disaster riskreduction is a growing buzzword, but it is little understood outside specialized agenciesand civil society groups working on disaster risk management. There is little appreciationthat human activities, including inappropriate development, contribute to naturalhazards and vulnerability. DRR is not an explicit part of mainstream government planningdocuments, including the latest Vision 2030 and Poverty Reduction Strategy Paper-II.In addition, the focus of disaster related activities is mostly on response rather thanproactive programming (see Chapter 8 for further discussion).
Continuous build-up areas are divided into multiple jurisdictions, each reporting todifferent levels of government. On the other hand, forums for basin-wide cooperation
146
Catalyzing Climate and Disaster Resilience: Processes for
Identifying Tangible and Economically Robust Strategies
are weaker than in the past, or completely absent. In such a hierarchical organizationalculture, it is not a surprise that Islamabad’s Capital Development Authority takes noaccount of the downstream streamflow and flooding impacts of its land developmentprojects (Mustafa, 2005).
In absence of a tacit policy and implementation of the newly drafted National DisasterManagement Framework the implicit policy is dictated by the consistently appliedpractices. This means that lack of a policy or institutional framework for risk reductionleaves a de facto practice that is not necessarily a well thought out strategy, but rathera product of various influences. In the scoping stage of this research project, a fewdominant issues were recorded for further exploration. They have influenced the defacto strategy to manage the risk in the Lai flood plain and include:
Technological versus institutional approach to DRRIn this aspect we found that technology was far more dominant than an institutionalperspective to manage disasters. Both the hard resilience highway project and theelaborate early warning rely on exclusive technologies that are the forte of theimplementation agencies. Frontier Works Organization’s claim to fame is the buildingof the Karakoram Highway to China along the silk route. The Meteorology Departmentholds the monopoly on raingauges and weather stations. Such influences have far-reaching implications for disaster management and coordination of various actorsrequired for disaster management. Lack of an institutional mechanism or planningfor DRR prevents mainstreaming of tools like CBA for risk reduction (SLD with GOs,2007). These may be employed voluntarily by those who oppose the approaches orpossibly as a precondition from foreign funding agencies. In the Lai’s case, we foundthat even the foreign funding agency was reluctant to have such an analysis conductedfor fear of hindering the investments already jeopardized by the previously describedfluid political conditions. They denied the research team data by saying that they didnot have any more copies of the studies conducted.
The actual actors that could be useful in risk reduction and response are completelydisenfranchized from the process. The Fire Department, which was mandated to dealwith all calamities, remains under-resourced as mentioned by the fire chief, and doesnot even posses a 30 foot ladder. Responding to the shrinking role in disastermanagement, the Deputy Fire Officer responded by saying, “Their attitude seems tobe, “Extinguish the fire if you can, otherwise let it be” (SLD with Fire Department,2008). Similarly, the Civil Defence organization is being ignored and is a weakeninginstitution (SLD with Non-government and local organization, 2007). Paralleldepartments, like rescue 1122 have been established. The concepts of incident andoperational control are no longer followed, as these departments belong to differenttiers of local government and do not have effective coordination mechanisms forvarious disasters.
Perception of Linkages between DRR an broader programmatic goalsFrom the highest policy to local governments, the understanding of risk reduction asa part of everyday disaster management is simply nonexistent. Even the I/NGOs haveseparated DRR activities their regular activities. In the SLD with the Town Planner, heclearly stated, “We have nothing to do with disaster management.” According to him,
147
Com
parin
g Urb
an Fl
ood M
itiga
tion O
ption
s: Cos
ts an
d Ben
efits
in Ra
walpi
ndi, P
akist
an
they were only concerned with building control and compliance to building codes!(SLD with Rowal Town TMA, 2007). Sitting on the bank of the Lai with the earlywarning system in his premises, he did not realize how building standards in terms ofplinth levels and control are an essential part of risk reduction in a flood plain.
He did admit that building controls were not enforced and that only after the collapseof a shopping plaza, the municipality woke up to the lack of enforcement. In addition,we realize that contour or flood maps of the Lai are not publicly available, as somehowthis information is sensitive to national security. Lack of such basic informationprecludes the local government from taking proactive steps. Similarly, almost all ofthe other service providers in the Lai area, like health, education, water and sanitation,claimed that risk reduction was not their mandate and some external structuralmeasure was the only solution to avert risk in the Lai flood plain. However, appropriatebuilding codes, zoning and enforcement may be the most cost effective measures forrisk reduction, which would not require any extra resource beyond what the localauthorities are mandated to do in their day-to-day responsibilities.
Political versus techno-administrative understanding of DRRWhile DRR is considered strictly a technical and sectoral issue, the impetus for riskreduction comes from political forces. The politicized nature of DRR is so wellestablished in the area that some of the Civil Defence volunteers complained that thecommunities would sometimes not cooperate with them. The locals assumed that theCivil Defence was there to further some political motive and not help in reality. Despitethe concrete risk reduction measure, Lai flooding has been used by politicians asmeans of gaining support from communities as they are photographed wading inknee-deep waters while making statements about providing relief to the affectedcommunities (Daily Jang archives, 2007).
The launch of “Lai Expressway” which was later renamed “Sheikh Rashid Expressway”was a maneuver in electioneering and pork barrel politics. Such large-scale interventioncould not have been proposed by any single organization because of their sectoralmandates and interests. It by-passed all the regular project preparation and approvalstages as a “fast-track” investment made through the directive of the President ofPakistan. To get financial allocations, some documentation such as a Feasibility Reportand an Environmental Impact Assessment were hastily prepared and missed criticalissues like groundwater recharge due to paving of the riverbed with concrete. Expectinga governmental CBA of various options would have been unrealistic in this case, as itmay have highlighted alternate options that were more cost effective. Therefore, nogovernment CBA was conducted to evaluate the Expressway project.
Understanding concept of vulnerability and its nuancesVulnerability is a growing buzzword in the NGO circles, but often used more in relationto gender debates and the consequences of patriarchic systems. In governmentplanning circles, vulnerability is equated to poverty. At the local level, although thecommunities may not be able to realistically fathom costs, they have a very good ideaof vulnerabilities and their causes. What is clearly missing from the debate at variouspolicy levels is the concept of building resilience in communities by addressing theroot causes of vulnerability to reduce risk. As a result, provision of basic infrastructure
148
Catalyzing Climate and Disaster Resilience: Processes for
Identifying Tangible and Economically Robust Strategies
and services never enters the debate on risk reduction. Cost-benefit analysis of suchstrategies, if possible, would be a great tool for advocating more innovative thinkingabout adaptation to an uncertain environment.
Linkages between theory and practices in organizational planningAlthough the technical, hierarchical structure is good in delivering standardized services,more nuanced and flexible approaches have a hard time taking root in such systems.Besides the old mandates, inclusion of cross-cutting issues such as gender, environmentand risk reduction get little more than lip service. In one of the largest reconstructionefforts of Pakistan, backed but multi-lateral agencies and manpower, ERRA still doesnot have gender disaggregated data on casualties or compensations (SLD with ERRA,2007). However, like the supporting agencies, it does have a well-written gender policydocument. As a result, when its benevolent donors flaunt the physical progress andquick disbursements as a great success story, the comparatively meager allocation forrisk reduction policy research and other measures remains under-utilized.
Use of CBA or qualitative indices for vulnerability identification would have beenextremely useful for choosing strategies for reconstruction; however, no such measureswere used to make priorities. Reconstruction efforts provide great opportunities toutilize and incorporate such cost-benefit analysis in reconstruction and developmentwork, but once again, physical progress and disbursement seemed to be the leadingprinciples for implementation.
Geographical scales of programming and perceptions oflinkages between different levelsThere is strong hierarchy at different scales and a trend towards centralization,especially in better-funded risk reduction activities. The local aspects and commandand control systems are being diluted and becoming weaker. Measures such as riskinsurance, which could actually benefit from the small scale are yet to surface in thedebate of risk reduction and adaptation.
Reliance on technology and the large financing required tends to work against localinstitutional strengthening. Instead of delegating human and financial resources forgreater programmatic activity at local level, the tendency is to usurp the functions andwhatever meager resources exist at the local level. This further weakens local mechanismsfor risk reduction, as we can see from the cases of the Civil Defence organization, the FireDepartment and the town planning department of the Tehsil Municipal Administration.
Relationship between actors, sectors and organizationsThere is fierce competition for resources among various organizations and sectoralactors. Disaster risk reduction is based on competing technologies and the monopoliesthat various organizations hold for such technology. Even the NGOs have resorted tothe “community participation conquers all” mantra. Within the Lai area, the erstwhileRawalpindi Development Authority (provincial) and the City District Governmentcompeted to become the implementing agency for various disaster projects. As aresult, if and when these projects are completed the final operations and maintenancewill fall with the local Tehsil Municipal Administration who neither has the resourcesnor ownership of the project. In our SLD, a TMA operative said outright “I am against
149
Com
parin
g Urb
an Fl
ood M
itiga
tion O
ption
s: Cos
ts an
d Ben
efits
in Ra
walpi
ndi, P
akist
an
this project because if the rationale is traffic improvement, then existing roads (underTMA) should be improved.” He said that the project cost was too high and involveddisplacement of many people. Besides he did not think it was possible to raise suchhigh concrete walls with only PKR 16 billion and even then, the walls could do nothingagainst 650mm of rain.
Disjuncture between Community and Government Perceptions
Among the affected communities, some men and women think of the Lai Expresswayas a miracle cure that will tame the Lai forever. The deepening of the bed of the Lai isranked second and fifth in the list of measures proposed by men and womenrespectively, for the protection of seven neighbouring Union Councils from floods.The men give first preference to replacement of outworn water pipes, and the womenprefer solid waste management, widening of streets, better health and educationfacilities ahead of deepening of Lai riverbed. Based on their grounded experiences,communities typically consider a wider range of choices than politicians andgovernment officials. They appreciate that the Lai Expressway will entail clearing andpaving over graveyards, demolitions of buildings, and eviction of people.Compensations for land acquisition under the antiquated Land Acquisition Act, 1894,are often delayed for decades and benefit only titled landowners. So communities onthe banks of Lai trade off the temptations of improved access between metropolitancentres, higher land values, and flood resistance against the pain of displacement.
Identification of Main Strategies Selected for Evaluation
The research team wanted to evaluate disaster risk reduction strategies of hard versussoft resilience. Lack of data (mentioned earlier) left few choices of strategies forevaluation. The strategies being evaluated are: construction of the Expressway andChannel Improvement Project, the early warning systems, and a hypothetical solutionof wetland restoration through relocation on communities on the banks of Lai. Thefirst solution was given a go-ahead by the previous government, but its fate currentlylies in doldrums with the change of the government and not likely to be resurrectedany time soon. The second one, the early warning system, is almost implemented andin the pilot testing stage. The third one, while hypothetical, would have large ecologicalbenefits and will be analyzed to give us a sense of the cost of taking such non-structural,eco-friendly policies. The third option does not preclude the Lai from being used as atransportation corridor, but we suggest an elevated light rail instead of as a motorway.It is an environmentally friendly option that serves both the rich and the poor.
There are further DRR strategies and basic infrastructure services like health, cleanwater and solid waste management, which would contribute greatly to the resilienceof the communities around Lai. However, there is not sufficient data available todetermine the benefits and the costs saved to communities of these other strategies.Therefore, these options were not explored in the quantitative analyses. Yet, theseoptions have been addressed in the qualitative analysis, which includes a capacity andvulnerability index.
150
Catalyzing Climate and Disaster Resilience: Processes for
Identifying Tangible and Economically Robust Strategies
Who is Vulnerable ?
After the 2001 flood, the re-settlement of vulnerable populations at highest risk in the Laiflood plain had some justification in DRR terms, but was mishandled. An arrogantencroachment removal project has left the vulnerable people with little trust in governmentintentions. Similarly, an inadequate understanding of the Lai’s dynamic hydrology andgeomorphology has bedevilled engineering interventions. The anti-encroachment andcompensation programmes were acutely flawed because officials ignored the land tenuresituation in the flood plain. A sizeable number of people who were thrown out of their homesdid not own them, but rather rented them from the notorious land grabbers. In certainneighbourhoods, up to 75% of the residents were tenants, according to the local propertydealers and councillors. According to the rules of the project, compensation could only begranted to those who could produce legal papers in support of their claim to the property.
Consequently, landlords collected the compensation that was meant to assist thosemade homeless by the anti-encroachment programme. The residents of the katchi abadi,the poorest of the poor, rarely received compensation. Members of the land mafia, whodefrauded the people by settling them in the Lai Nullah flood zone, were the mainbeneficiaries of the compensation programme. They either held titles or power of attorneyfor properties from their multiple renters. Urban land records in Pakistan have becomea legal labyrinth with a multiplication of owners after each generation. In addition, totalcompensation paid was reduced considerably from what had been projected. The RDAoriginally earmarked PKR 880 million (US $15.2 million) for compensation, but onlydisbursed about half of that amount, PKR 445 million (US $7.7 million). Of the total of1,200 households that were affected by the project, 200 were not paid any compensation atall, because they were located on government land in the channel of the Lai. Yet, some ofthese people had been living in the flood plain for more than thirty years. (Mustafa, 2004)
Methodology: Qualitative
The Lai Basin area was selected after a scoping study on a set of criteria that includerelevance in multi-hazard and risk reduction issues; availability and accessibility of
Evaluating Tradeoffs
151
Com
parin
g Urb
an Fl
ood M
itiga
tion O
ption
s: Cos
ts an
d Ben
efits
in Ra
walpi
ndi, P
akist
an
relevant data sources and means to collect further information; and familiarity andexperience of the partners through previous work and personal exposure to the localcultural and institutional environment. Finally, the ability to generate case scenariosto highlight the benefits and cost of risk reduction and to contribute to a broaderregional and global knowledge base was considered in the selection process.
In order to gain indigenous data from the Lai’s most hazard prone community ontheir perceptions of their prioritized hazards and prioritized common solutions sharedlearning dialogues (SLDs) were considered the most effective methodology. Sharedlearning dialogues represent a direct system of feedback and facilitate to “close theloop between knowledge generation, testing, dissemination and application” (Moenchand Dixit, 2007). SLDs are crucial for generating a common understanding ofopportunities and constraints without bias towards preconceived notions of whatconstitutes disaster risk reduction. They essentially involve semi-structured dialogueswith groups of key actors at regular periods throughout a research project. Eachmeeting starts with a brief summary and presentation of critical issues by theorganizers. The other participants are then invited to provide vital comments, insights,information, data and proposals drawn from their own experience and activity areas.Particular attention is paid to classifying points of entry where all participants agreeon key points, knowledge gaps or the need for specific research or action required inorder to improve the current risk situation. Holding shared learning dialogues throughthe duration of this research project aimed to encourage the enhancement of knowledgeon DRR among disaster prone communities, relating existing indigenous knowledgeon disasters to relevant authorities in order to bring about a positive change from thegrass root level. In essence, SLD meetings ensure that results and suggestions found atthe community level are shared with local and national government authorities.Comments of the authorities will be related to the community in order to facilitatecommunication between the previously unrelated groups.
A research team trained by PIEDAR and experts from King’s College London conductedshared learning dialogues (SLDs) along the flood prone Lai Basin in Rawalpindi. SLDswere carried out based on the assumption that there is a certain amount of knowledgewithin the sphere of experts and there is a certain amount of indigenous knowledge indisaster prone communities. SLDs aimed to increase the overlap between the two spheres.SLDs are an iterative process of mutual learning. In the Lai Basin, a series of SLDs wereconducted with each flood prone community, sharing with them the concepts of DisasterRisk Reduction, learning about their perceptions of hazards and proposed solutions,and facilitating reflection on livelihood resilience, response to disasters, effectivenessand costs of hazard management, and effects of climate change.
Methods and Tools Used in the FieldUrban communities are diverse and complex. An overall appreciation of the Lai Basincommunities was required before SLDs could be undertaken with particularcommunities. One guiding principle was to give the most attention to areas along thebanks of Lai that are most affected by floods. Another principle was to haverepresentation of all the reaches of the Lai as it traverses Rawalpindi city. Third, areaswith varying levels of social, economic and geographical vulnerability were selected inorder to obtain a mix of circumstances.
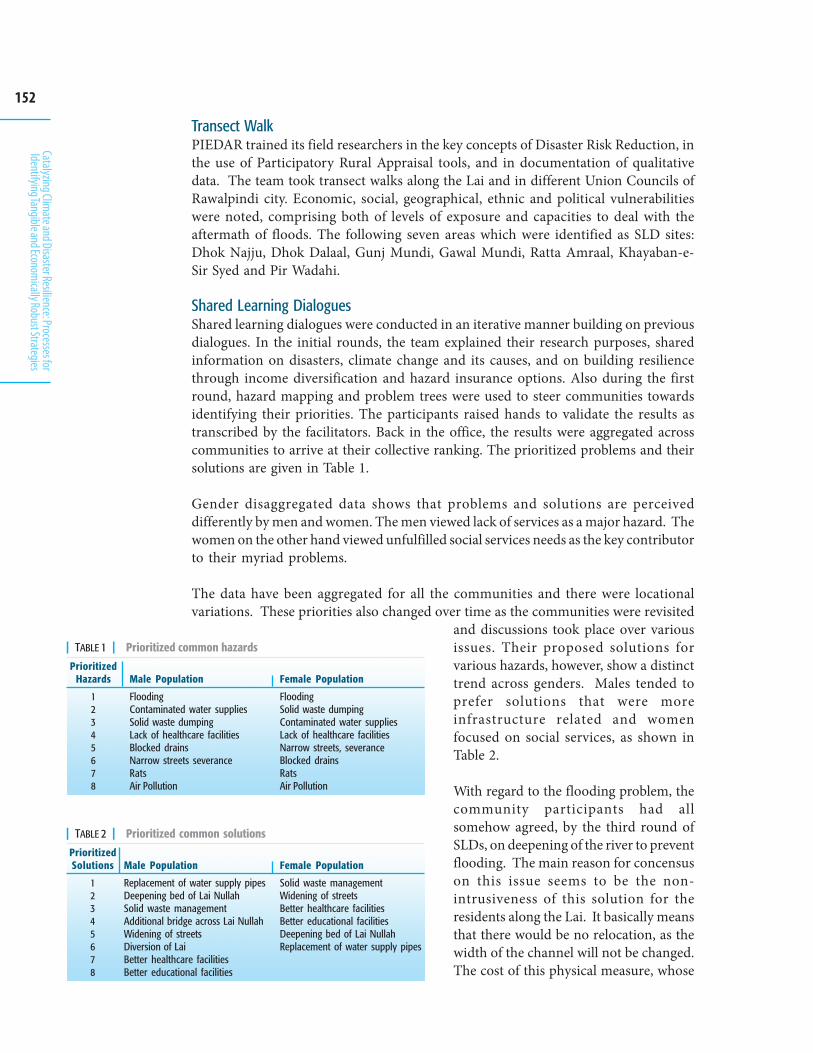
152
Catalyzing Climate and Disaster Resilience: Processes for
Identifying Tangible and Economically Robust Strategies
Transect WalkPIEDAR trained its field researchers in the key concepts of Disaster Risk Reduction, inthe use of Participatory Rural Appraisal tools, and in documentation of qualitativedata. The team took transect walks along the Lai and in different Union Councils ofRawalpindi city. Economic, social, geographical, ethnic and political vulnerabilitieswere noted, comprising both of levels of exposure and capacities to deal with theaftermath of floods. The following seven areas which were identified as SLD sites:Dhok Najju, Dhok Dalaal, Gunj Mundi, Gawal Mundi, Ratta Amraal, Khayaban-e-Sir Syed and Pir Wadahi.
Shared Learning DialoguesShared learning dialogues were conducted in an iterative manner building on previousdialogues. In the initial rounds, the team explained their research purposes, sharedinformation on disasters, climate change and its causes, and on building resiliencethrough income diversification and hazard insurance options. Also during the firstround, hazard mapping and problem trees were used to steer communities towardsidentifying their priorities. The participants raised hands to validate the results astranscribed by the facilitators. Back in the office, the results were aggregated acrosscommunities to arrive at their collective ranking. The prioritized problems and theirsolutions are given in Table 1.
Gender disaggregated data shows that problems and solutions are perceiveddifferently by men and women. The men viewed lack of services as a major hazard. Thewomen on the other hand viewed unfulfilled social services needs as the key contributorto their myriad problems.
The data have been aggregated for all the communities and there were locationalvariations. These priorities also changed over time as the communities were revisited
and discussions took place over variousissues. Their proposed solutions forvarious hazards, however, show a distincttrend across genders. Males tended toprefer solutions that were moreinfrastructure related and womenfocused on social services, as shown inTable 2.
With regard to the flooding problem, thecommunity participants had allsomehow agreed, by the third round ofSLDs, on deepening of the river to preventflooding. The main reason for concensuson this issue seems to be the non-intrusiveness of this solution for theresidents along the Lai. It basically meansthat there would be no relocation, as thewidth of the channel will not be changed.The cost of this physical measure, whose
PrioritizedHazards
12345678
Male Population
FloodingContaminated water suppliesSolid waste dumpingLack of healthcare facilitiesBlocked drainsNarrow streets severanceRatsAir Pollution
Female Population
FloodingSolid waste dumpingContaminated water suppliesLack of healthcare facilitiesNarrow streets, severanceBlocked drainsRatsAir Pollution
| TABLE 1 | Prioritized common hazards
PrioritizedSolutions
12345678
Male Population
Replacement of water supply pipesDeepening bed of Lai NullahSolid waste managementAdditional bridge across Lai NullahWidening of streetsDiversion of LaiBetter healthcare facilitiesBetter educational facilities
Female Population
Solid waste managementWidening of streetsBetter healthcare facilitiesBetter educational facilitiesDeepening bed of Lai NullahReplacement of water supply pipes
| TABLE 2 | Prioritized common solutions
153
Com
parin
g Urb
an Fl
ood M
itiga
tion O
ption
s: Cos
ts an
d Ben
efits
in Ra
walpi
ndi, P
akist
an
scale the communities could not fathom, would therefore be borne completely by thegovernment.
The reason of mistrust of the government has a history. In the previous floods, theresidents were dissatisfied with how relief was distributed. Among the commoncomplaints was that of local leaders only helping their kin, kith and political supporters.There are other issues in the system of how relief is distributed. For physical damgesto structures, only the owners of the houses are paid. From our field visits, we foundthat a large portion of the affected residents rented their premises and hence none ofthe losses to contents of their houses were compensated. Also the most vulnerableand consequently those who suffered the most losses, lived in illegal houses that werenot on the record of the local authorities and hence did not even figure in the reliefdistribution. It is difficult to imagine how these houses can be constructed and habitatedwithout active connivance of the local authourities and service providers. Even forthe house owners there were issues with relocation. The procedure for relocation inits implementation is far from fair and has since long caused serious problems withdonors who demand a reasonable resettlement policy for all. Widening or vacatingthe banks of Lai for the residents is, therefore, potentially a more uncertain andhazardous process than the floods themselves.
The second round of SLDs consisted of sharing further information on resilientcommunities and reconfirmed the information from the former SLD along with someinteresting new nuances. The communities were given feedback on the views of federaland local government authorities on their alleged complaints in an effort to bridge thethe knowledge gap between communities and government. A backlash on governmentviews was recorded during this round as both sides persisted on blame shifting anddisplaying helplessness without mutual cooperation. During an SLD held with localauthorities, the Rawalpindi Development Authority did not participate. Manyquestions of the community on their ineffective and even non-existent solid wastemanagement policy were left unanswered. The general view recorded in the secondround was that the government is far removed from ground reality, but at the sametime area improvements are impossible without government help.
Upon revisiting the list of hazards and their possible solutions, there was a convergenceof ideas and it seemed that within the iterative process, a sense of focus was developed.This may have been caused by conscientization of concepts or also may be a deliberatemove by the communities to focus their demands on issues that they perceived thesurvey team to be most likely to influence and alter in their favor. The newspapers andelectioneering had focused on flood hazards and the construction of a signal-freehighway on the banks of Lai. It seems a rational response from the communities toput flooding on the top of their list, as they knew that the governement was leaningtowards investing in a solution for this problem.
Vulnerability/Capacity IndexDuring the third round, Capacity and Vulnerability Assessments and a Capacity andVulnerability Index were recorded with the cooperation of the seven communities.These portray an image of varying vulnerabilities and capacities in the areas wereSLDs were undertaken. Table 3 provides quantitative assessment of the vulnerabilities
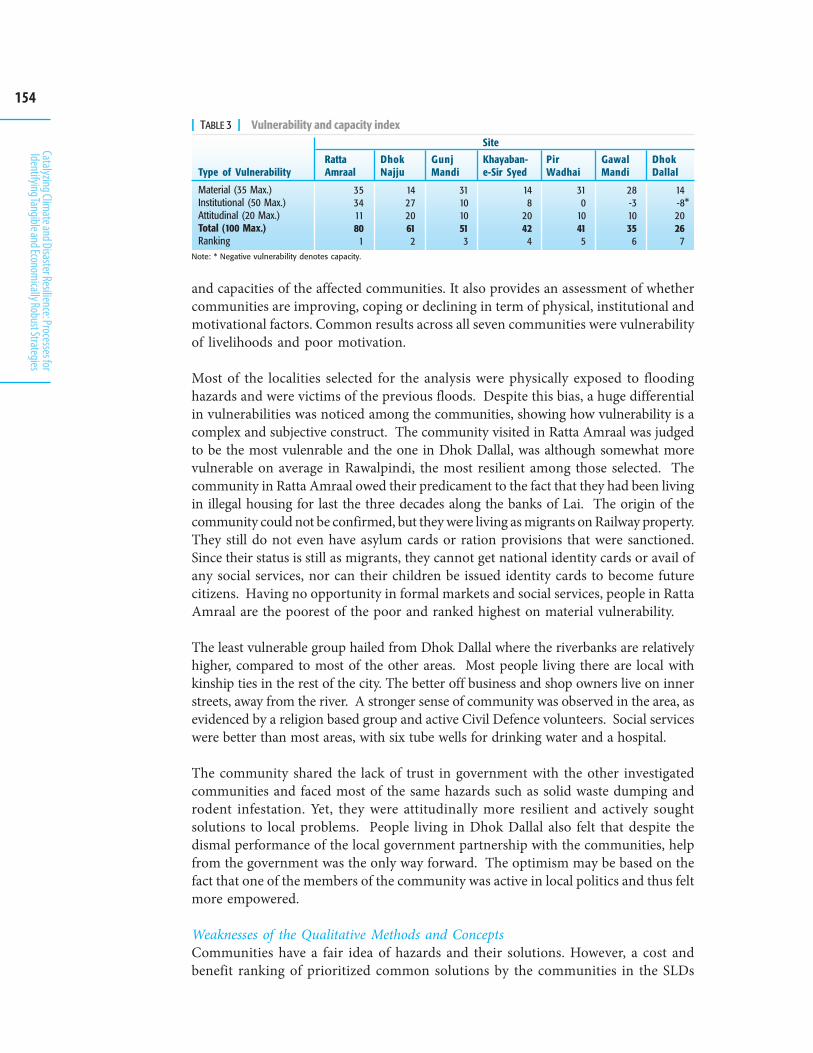
154
Catalyzing Climate and Disaster Resilience: Processes for
Identifying Tangible and Economically Robust Strategies
and capacities of the affected communities. It also provides an assessment of whethercommunities are improving, coping or declining in term of physical, institutional andmotivational factors. Common results across all seven communities were vulnerabilityof livelihoods and poor motivation.
Most of the localities selected for the analysis were physically exposed to floodinghazards and were victims of the previous floods. Despite this bias, a huge differentialin vulnerabilities was noticed among the communities, showing how vulnerability is acomplex and subjective construct. The community visited in Ratta Amraal was judgedto be the most vulenrable and the one in Dhok Dallal, was although somewhat morevulnerable on average in Rawalpindi, the most resilient among those selected. Thecommunity in Ratta Amraal owed their predicament to the fact that they had been livingin illegal housing for last the three decades along the banks of Lai. The origin of thecommunity could not be confirmed, but they were living as migrants on Railway property.They still do not even have asylum cards or ration provisions that were sanctioned.Since their status is still as migrants, they cannot get national identity cards or avail ofany social services, nor can their children be issued identity cards to become futurecitizens. Having no opportunity in formal markets and social services, people in RattaAmraal are the poorest of the poor and ranked highest on material vulnerability.
The least vulnerable group hailed from Dhok Dallal where the riverbanks are relativelyhigher, compared to most of the other areas. Most people living there are local withkinship ties in the rest of the city. The better off business and shop owners live on innerstreets, away from the river. A stronger sense of community was observed in the area, asevidenced by a religion based group and active Civil Defence volunteers. Social serviceswere better than most areas, with six tube wells for drinking water and a hospital.
The community shared the lack of trust in government with the other investigatedcommunities and faced most of the same hazards such as solid waste dumping androdent infestation. Yet, they were attitudinally more resilient and actively soughtsolutions to local problems. People living in Dhok Dallal also felt that despite thedismal performance of the local government partnership with the communities, helpfrom the government was the only way forward. The optimism may be based on thefact that one of the members of the community was active in local politics and thus feltmore empowered.
Weaknesses of the Qualitative Methods and ConceptsCommunities have a fair idea of hazards and their solutions. However, a cost andbenefit ranking of prioritized common solutions by the communities in the SLDs
Type of Vulnerability
Material (35 Max.)Institutional (50 Max.)Attitudinal (20 Max.)Total (100 Max.)Ranking
Site
RattaAmraal
DhokNajju
GunjMandi
Khayaban-e-Sir Syed
PirWadhai
GawalMandi
DhokDallal
| TABLE 3 | Vulnerability and capacity index
Note: * Negative vulnerability denotes capacity.
35341180
1
142720612
311010513
148
2042
4
310
10415
28-31035
6
14-82026
7
*
155
Com
parin
g Urb
an Fl
ood M
itiga
tion O
ption
s: Cos
ts an
d Ben
efits
in Ra
walpi
ndi, P
akist
an
failed as a method, as the communities confused unit and total costs. They also didnot have a fair idea of the cost of some projects.
Shared learning dialogues need not necessarily float ideas that will be accepted or evenbe considered important by the communities. A pertinent example of an unacceptableidea was “Hazard Insurance”. Despite facilitating meetings with insurance experts andexplaining the benefits of hazard insurance, the communities all proved reluctant tobuy insurance. The reasons were lack of trust in institutions providing insurance andthe inability to afford insurance owing to continuous price hikes and inflation. Theimpacts of climate change were acceptable and even considered already visible bymost communities. However, learning about climate change was consideredunimportant, as people feel powerless to reverse the impacts and are too busy strugglingto survive to do anything else.
Another weakness of the process is that to obtain data from SLDs (that may representthe entire study area of Lai) requires large amounts of inputs in terms of money, timeand resource persons. At the same time, the value of the process is such that with evenvery little investment, one can identify cross-cutting issues that are common to mostlocalities, which may not surface in discussions at other levels. For example, theunequivocal identification of basic infrastructure and services as a key component ofresilience by all communities is an important insight that the disaster risk relatedorganizations have yet to consider in their strategies for building resilience.
As mentioned before, the SLDs in this instance ended with alignment to the currentdiscourse at an organizational level. People demanded structural measures in riskreduction, as they were aware that chances of getting input from the governementwere higher than those for asking for basic services such as clean drinking water,health etc. This falls much in line with Sameul Paul’s (1990) assertion that citizens usevoice in proportion to their perception of its effectiveness. Since electioneering was atits peak during the SLD period, the communities may have used the SLDs as a forumto voice their demands for invesments that the government may be considering tomake for different reasons.
Methodology: Quantitative
As discussed previously, the Pakistan case study was limited to using secondary datafor conducting a cost-benefit analysis of various options for disaster risk reduction.This restricted analysis to strategies for which there was enough data available. Suchinterventions included the channel improvement/expressway project, which has beenput on the back burner because of the political motivations behind it and the subsequentchange of governments. The second is a recently completed Early Warning Systeminstalled with the help of grants from JICA and a retention pond, also funded withJICA’s help, and the third option, for which a CBA was attempted, is a hypotheticalexample of wetland restoration by relocation of people in the flood plane. For allthree of these scenarios it was essential to assess the assets at risk, which was doneusing a somewhat generalized estimation because of lack of specific data before the2001 flood. Now with cheap (actually free) technologies, such as satellite imagery with
156
Catalyzing Climate and Disaster Resilience: Processes for
Identifying Tangible and Economically Robust Strategies
resolution high enough to count building units, it is much easier to precisely measureassets at risk. Conversely, finding usable data on health, sanitation and effects ofdrinking water issues was next to impossible without extensive primary research.Following is step by step description of the CBA process, which will make explicit notjust the specific methodology for this analysis, but also the assumptions and limitationswhich are a part of the process.
The Cost-Benefit AnalysisThis section describes the parameters and relevant data used for risk reduction in allthree scenarios, namely: concrete lining of the channel, the warning system/construction of a retention pond in the upper reaches of the stream, and relocation ofthe most exposed population to higher ground. Along with the general assumptionsand limitations, which are a part of the process of conducting a CBA, issues specific toeach strategy are described individually under that approach. Following is an overviewof the process adopted for conducting the CBA.
RiskFlooding was the primary risk identified by the communities and in institutionalshared learning dialogues (SLDs). The JICA study on comprehensive flood mitigationconducted after the 2001 floods proved to be a wealth of information. However,most of the data going into it were provided neither by JICA nor the local counterpartauthorities (i.e. the Federal Flood Commission) who remained skeptical of theanalysis.
The flood hazard, return periods and depths have been based on JICA’s estimation ofvarious return periods (i.e. 5, 25, 50 and 100-year periods). Since JICA consultants hadleft accessible neither the software nor the data for its analysis, the research teamdecided to use its own model to fit the results that JICA had estimated based on theactual data from the 2001 flood. The team used a simple steady-state hydraulic modelfine-tuned with critical, on the ground measurements, such as those at bridges, etc. Asa result, the estimations came within acceptable range for a cost-benefit analysis basedprimarily on secondary data. For a more forward looking analysis, the team triedvarious commonly used statistical distributions for flood modelling such as Gumbeland Pareto, finding the best fit with Log Pearson 3 and used it to extrapolate floodlevels up to the 200-year return period.
VulnerabilityThe basic vulnerability analysis was conducted using assets at risk and damage datafrom the flood of 2001. Since there was a three-fold difference between the officialgovernment figures and what JICA had calculated, it was deemed necessary to reviewboth studies’ processes of estimation. The government had calculated damage usingcompensation data and hence did not include huge losses that were not compensated.The JICA study did approximate the number of structures and assigned values takingcitywide averages rather than look at the specific assets that were affected. It is reasonableto assume that the pattern of settlement and distribution of different types ofinfrastructure would be different from the city average on the banks of Lai. The areainhabited by lower income groups and the nature of the land is likely to be differentbecause of its exposure to flood risk. Therefore, a triangulation of property values was
157
Com
parin
g Urb
an Fl
ood M
itiga
tion O
ption
s: Cos
ts an
d Ben
efits
in Ra
walpi
ndi, P
akist
an
conducted through interviews with real estate agents along the entire stretch of theflood plain to estimate realistic figures.
According to the real estate agents, around 80% of the properties within 100 metres ofthe banks of the Lai are illegal and hence, it was necessary to reconfirm the number ofunits along the river’s banks. Readily available Google Earth imagery was used toascertain actual assets at risk rather than estimations or official figures. Contourmaps of flood depths for various return periods were superimposed on the GoogleEarth images to calculate the number of structures likely to be affected at differentflood levels.
Procuring reasonable contour maps for this analysis was extremely difficult. Officialmaps are considered classified because the Lai is close to the General Headquarters ofthe Pakistan military. The minimum size of maps required for a visual count of assetsat risk was 1:50,000. The research team used the surveys done for a detailed design ofthe Lai expressway to make a raster and vector analysis of flood depth using ArcMap,ArcInfo and Adobe Illustrator software. These data were useful for plotting the damageestimations for floods below the 100-year return periods as there are no historicaldamage data for these scenarios.
Depth-Damage AnalysisAs there was no local data on depth-damage ratios, the team used data from variousstudies in the region and globally and then used what seemed to be reasonable estimatesfrom Rawalpindi and corroborated them with anecdotal evidence found in qualitativesurveys on the area. Average depths of the 2001 flood were used as the estimator formedian damage figures and applied to other return periods.
Economic EffectsThe impact of the 2001 flood is the only event that is well documented for damagecaused. These figures were used to interpolate and extrapolate damages for otherreturn periods using flood depths from hydraulic modelling, area of inundation andsatellite imagery of the area.
The historical data on flood damage in 2001 had huge variations. The officialgovernment estimates were several times lower than those estimated through theJICA survey, which reached a figure of PKR 53 billion as opposed to PKR 10-15 billionby the official estimates. The reason for this discrepancy may be that the official estimateis based on a flat compensation on the basis of whether the houses damaged ordestroyed were of katcha (mud) or pukka (brick and cement) construction only andnot by the extent of actual damage. Also, there is a flat compensation for death dependingon whether the person was the family breadwinner or not and for heads of cattle lostthat can be verified through official documents only. Therefore, the study team usedthe JICA survey results rather than the official figures.
The surveys in the JICA study measured some indirect damage, estimated fromrandom surveys. This analysis tried to measure the damage caused by the disruptionof business due to the closing of markets and factories and also that caused by damageto productive assets. The figures for these “flow” damages turned out to be to the tune
158
Catalyzing Climate and Disaster Resilience: Processes for
Identifying Tangible and Economically Robust Strategies
of 35% of the total damages. Although the survey sample was not well designed andthe results are not statistically significant, the value derived seems to be anunderestimate when compared to the generic flood damage figures in other cases offlood damage estimates in the literature. Therefore, it was decided to use this figure aslong as the analysis did not overestimate the benefits of risk reduction, since not usingindirect costs of floods would have been a gross underestimation of damage.
Environmental and ecological effects of floods were not included in the analysis due tolack of data. Nevertheless, the qualitative assessments and the SLD process clearlyindicated that diseases and illnesses due to lack of sanitation and clean drinking waterare some of the major costs to the local populations. There is also anecdotal evidencethat some families had to stop sending their children to school or sent them to lessexpensive schools as a part of a coping strategy due to long-term losses to familyincomes.
The environmental and social benefits of certain risk reduction strategies can beimmense and therefore it is imperative to include these for better analysis of thealternatives. These are opportunity costs or benefits that are often overlooked inanalyses for project selection. In the new expressway design for channel improvement,the base of the deepened river bed was also to be paved. This would have had direconsequences to groundwater recharge in the city. For drinking water alone, the lackof recharge will exacerbate the current falling of the average water tables from under40 feet in 1980 to over 150 feet in 2003 due to groundwater overdraft (ADB, 2005).Therefore, important issues that were not quantified are described in the followingsub-sections which describe how the analysis for the four given options was structured.Besides the generic approach described above, these subsections detail the particularassumptions and challenges for using CBA in different scenarios.
Sheikh Rashid ExpresswayThe Sheikh Rashid expressway was the most likely option for implementation untilthe recent elections, after which the political forces behind the project were thrownout of power. This project was a hastily designed, dual-purpose project that wouldhave provided flood protection through deepening and paving with concrete the sectionof the Lai that passes through the most densely populated areas of Rawalpindi. Thesecond purpose of this project was to provide an expressway that joined Rawalpindiand Islamabad to ease the traffic burden between the two cities. The highway wouldalso connect the old Army headquarters of the country with the new one beingconstructed upstream in Islamabad.
There were several issues with this project. First, there was little experience ofmaintaining a paved channel in a perennial river prone to flooding without additionalmeasures for water diversion. Second, although the middle section of the river wasbeing designed to carry a 100-year return period flood, there was no modeling donefor the effects on the section downstream from the project area, which has a muchlower carrying capacity and already causes backwater effects in the river. Third, sincethis was a multi-purpose project, the benefits from transportation and an increase inproperty value would have accrued as additional benefits that were not attributableto just flood prevention.
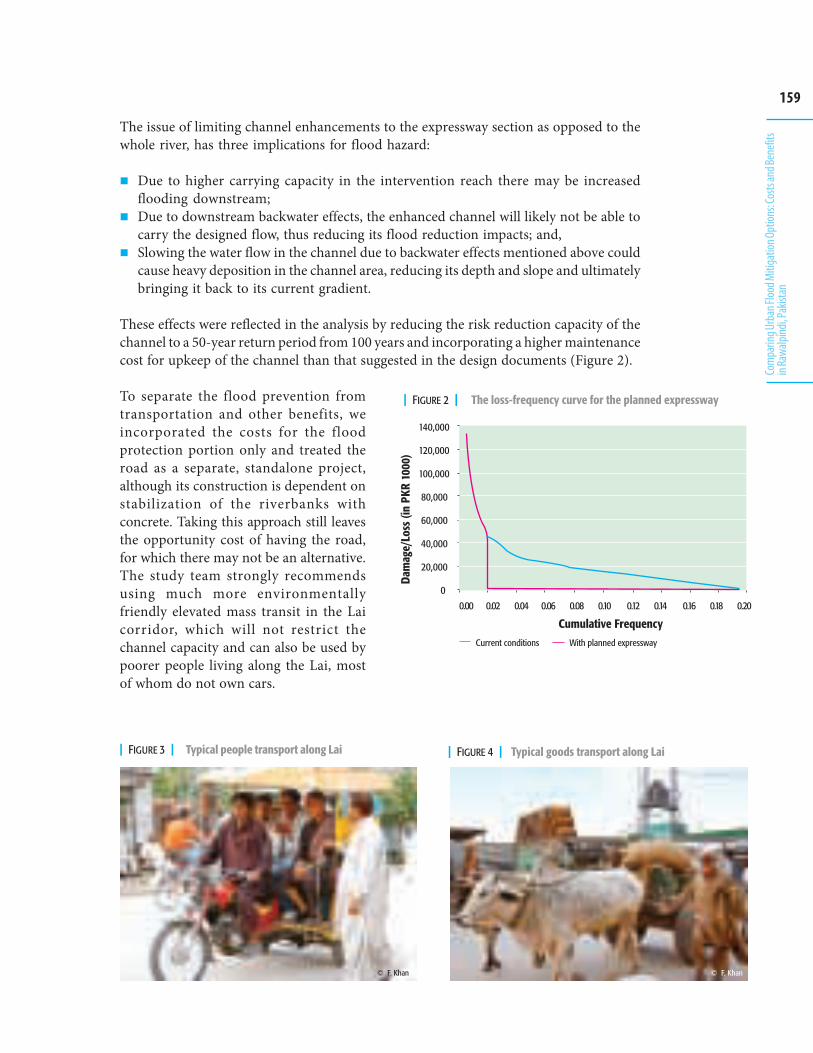
159
Com
parin
g Urb
an Fl
ood M
itiga
tion O
ption
s: Cos
ts an
d Ben
efits
in Ra
walpi
ndi, P
akist
an
The issue of limiting channel enhancements to the expressway section as opposed to thewhole river, has three implications for flood hazard:
Due to higher carrying capacity in the intervention reach there may be increasedflooding downstream;Due to downstream backwater effects, the enhanced channel will likely not be able tocarry the designed flow, thus reducing its flood reduction impacts; and,Slowing the water flow in the channel due to backwater effects mentioned above couldcause heavy deposition in the channel area, reducing its depth and slope and ultimatelybringing it back to its current gradient.
These effects were reflected in the analysis by reducing the risk reduction capacity of thechannel to a 50-year return period from 100 years and incorporating a higher maintenancecost for upkeep of the channel than that suggested in the design documents (Figure 2).
To separate the flood prevention fromtransportation and other benefits, weincorporated the costs for the floodprotection portion only and treated theroad as a separate, standalone project,although its construction is dependent onstabilization of the riverbanks withconcrete. Taking this approach still leavesthe opportunity cost of having the road,for which there may not be an alternative.The study team strongly recommendsusing much more environmentallyfriendly elevated mass transit in the Laicorridor, which will not restrict thechannel capacity and can also be used bypoorer people living along the Lai, mostof whom do not own cars.
| FIGURE 2 | The loss-frequency curve for the planned expressway
��������������������������������������������������������������������������������������������������������������������������������������
����������� ����
������
������
������
������
������
������
������
����������
���
������������
������
��� ������������� ���������� �� ��� �����
| FIGURE 3 | Typical people transport along Lai
Figure Need
| FIGURE 4 | Typical goods transport along Lai
© F. Khan© F. Khan
160
Catalyzing Climate and Disaster Resilience: Processes for
Identifying Tangible and Economically Robust Strategies
Social benefits of flood prevention in terms of disease burden, psycho-social effects oftrauma and long-term effects, such as children dropping out of school because of postflood poverty, were not included in the analysis because of lack of credible data foranalysis. These benefits of risk reduction are also omitted in all the other scenarios andhence do not affect comparative analysis too much when it comes to selecting options.
There were some alarming ecological effects of this project as it was designed becauseit would have stopped groundwater recharge in the areas of the river to be paved.Although not included in the mitigation strategy for reducing environmental damage,the design of the channel can be altered to allow infiltration of water without asubstantial cost increase. Therefore, the cost of loss of groundwater recharge was notadded to the analysis.
Despite all the issues, the “hard resilience” technical measure still yields a positivebenefit-cost ratio of 1.88 at a commonly used discount rate of 12%. With lack ofcomparative strategies, a project like this would easily be approved in policy circlesand it indeed was approved by the last government.
JICA river improvement options/retention pondAmong the options recommended by a JICA study for flood mitigation after the 2001flood were some comparable options for channel improvement. Two of theserecommendations were the construction of a pond upstream of Rawalpindi in a park,and the straightening of a river bottleneck downstream of the densely populated areato increase flood flow and reduce backwater effects.
Since the modelling software was not available to the study team and the JICA countryoffice was reluctant to provide the data, the following parameters shown in Table 4were used to estimate the risk reduction strategy.
The risk reduction for various flood intensities was calculated through the decrease inflooded area and subsequent reduction in damage (Figure 5). This strategy yields thebest benefit-cost ratio of the four strategies reviewed and is higher by several orders ofmagnitude.
| TABLE 4 | Estimated discharge by return period (m3/s)
Reference Point
KattarianGawal Mandi
Channel Capacity 5-yr 10-yr 25-yr 50-yr 100-yr
With Pond (Peak reduction of 190 m3/sec for 25-yr and 240 m3/sec for 100-yr)
KattarianGawal Mandi
9601,320
1,4501,970
2,0301,840
River Improvement (Increment flow capacity of 260 m3/sec)
KattarianGawal Mandi
8901,250
1,2101,920
2,0102,700
Both measures (450 m3/sec)
7001,060
1,1901,710
1,7702,460
Source: JICA, 2003 and interpolation by authors
KattarianGawal Mandi
640820
640820
640820
640820
640820
640820
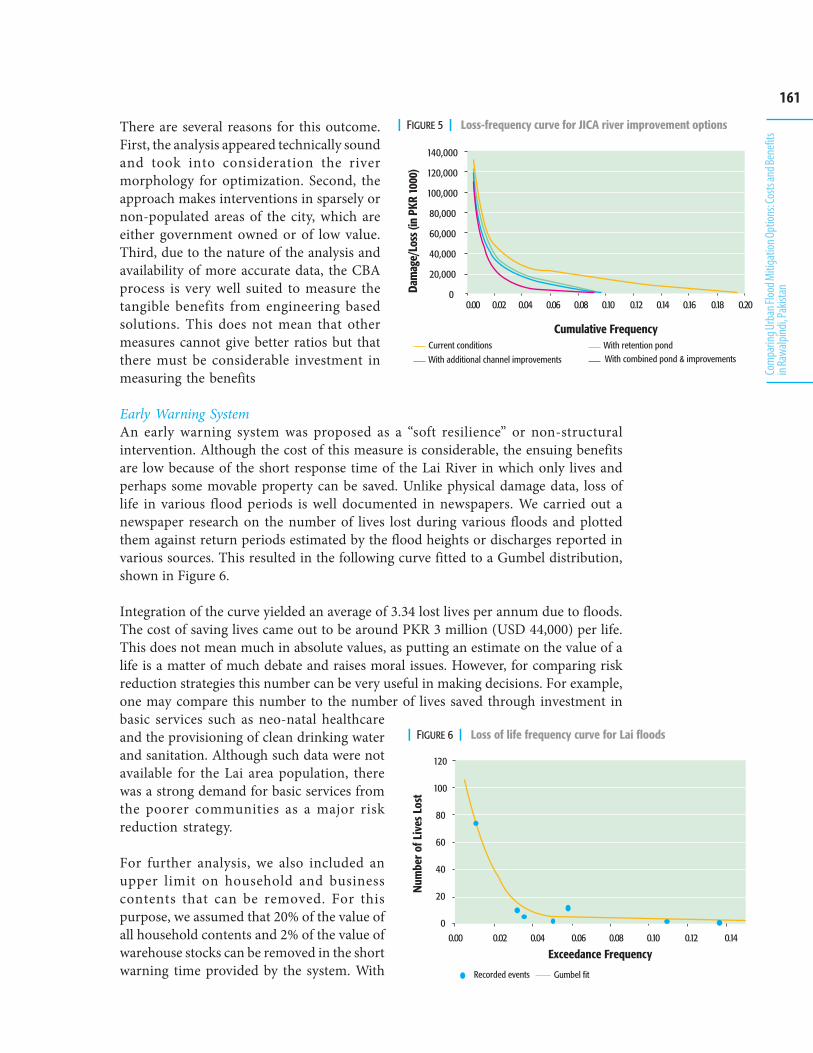
161
Com
parin
g Urb
an Fl
ood M
itiga
tion O
ption
s: Cos
ts an
d Ben
efits
in Ra
walpi
ndi, P
akist
an
There are several reasons for this outcome.First, the analysis appeared technically soundand took into consideration the rivermorphology for optimization. Second, theapproach makes interventions in sparsely ornon-populated areas of the city, which areeither government owned or of low value.Third, due to the nature of the analysis andavailability of more accurate data, the CBAprocess is very well suited to measure thetangible benefits from engineering basedsolutions. This does not mean that othermeasures cannot give better ratios but thatthere must be considerable investment inmeasuring the benefits
Early Warning SystemAn early warning system was proposed as a “soft resilience” or non-structuralintervention. Although the cost of this measure is considerable, the ensuing benefitsare low because of the short response time of the Lai River in which only lives andperhaps some movable property can be saved. Unlike physical damage data, loss oflife in various flood periods is well documented in newspapers. We carried out anewspaper research on the number of lives lost during various floods and plottedthem against return periods estimated by the flood heights or discharges reported invarious sources. This resulted in the following curve fitted to a Gumbel distribution,shown in Figure 6.
Integration of the curve yielded an average of 3.34 lost lives per annum due to floods.The cost of saving lives came out to be around PKR 3 million (USD 44,000) per life.This does not mean much in absolute values, as putting an estimate on the value of alife is a matter of much debate and raises moral issues. However, for comparing riskreduction strategies this number can be very useful in making decisions. For example,one may compare this number to the number of lives saved through investment inbasic services such as neo-natal healthcareand the provisioning of clean drinking waterand sanitation. Although such data were notavailable for the Lai area population, therewas a strong demand for basic services fromthe poorer communities as a major riskreduction strategy.
For further analysis, we also included anupper limit on household and businesscontents that can be removed. For thispurpose, we assumed that 20% of the value ofall household contents and 2% of the value ofwarehouse stocks can be removed in the shortwarning time provided by the system. With
| FIGURE 5 | Loss-frequency curve for JICA river improvement options
��� ������������� ������ � ����������
��������������������� �������� � ��� ����������� ������� ������� � ���
������������������������������������������������������������������������������������������������������������������������������������
����������� ����
������
������
������
������
������
������
������
�������������������������
������
| FIGURE 6 | Loss of life frequency curve for Lai floods
���
���
���
���
���
���
�����������������������������������������������������������������������������������������������������������������������������������������������
��� ����� ����
! ���� �� � ��� "��� ��#��
!��
"��#��������
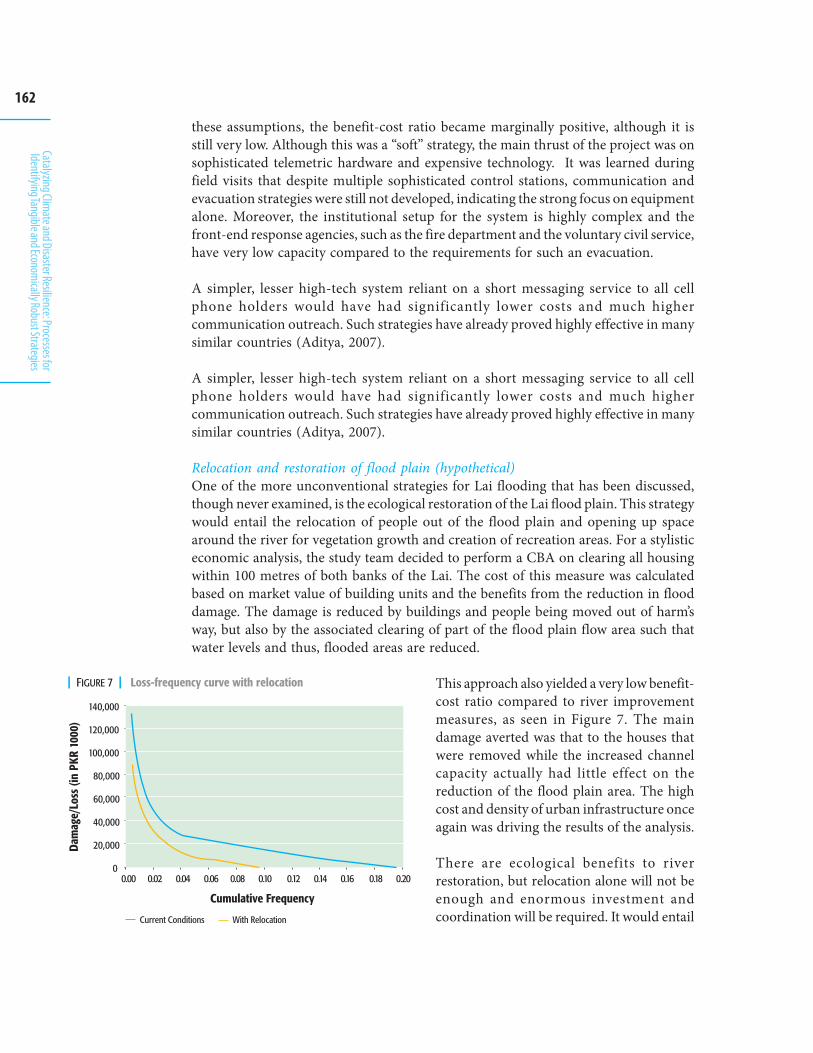
162
Catalyzing Climate and Disaster Resilience: Processes for
Identifying Tangible and Economically Robust Strategies
these assumptions, the benefit-cost ratio became marginally positive, although it isstill very low. Although this was a “soft” strategy, the main thrust of the project was onsophisticated telemetric hardware and expensive technology. It was learned duringfield visits that despite multiple sophisticated control stations, communication andevacuation strategies were still not developed, indicating the strong focus on equipmentalone. Moreover, the institutional setup for the system is highly complex and thefront-end response agencies, such as the fire department and the voluntary civil service,have very low capacity compared to the requirements for such an evacuation.
A simpler, lesser high-tech system reliant on a short messaging service to all cellphone holders would have had significantly lower costs and much highercommunication outreach. Such strategies have already proved highly effective in manysimilar countries (Aditya, 2007).
A simpler, lesser high-tech system reliant on a short messaging service to all cellphone holders would have had significantly lower costs and much highercommunication outreach. Such strategies have already proved highly effective in manysimilar countries (Aditya, 2007).
Relocation and restoration of flood plain (hypothetical)One of the more unconventional strategies for Lai flooding that has been discussed,though never examined, is the ecological restoration of the Lai flood plain. This strategywould entail the relocation of people out of the flood plain and opening up spacearound the river for vegetation growth and creation of recreation areas. For a stylisticeconomic analysis, the study team decided to perform a CBA on clearing all housingwithin 100 metres of both banks of the Lai. The cost of this measure was calculatedbased on market value of building units and the benefits from the reduction in flooddamage. The damage is reduced by buildings and people being moved out of harm’sway, but also by the associated clearing of part of the flood plain flow area such thatwater levels and thus, flooded areas are reduced.
This approach also yielded a very low benefit-cost ratio compared to river improvementmeasures, as seen in Figure 7. The maindamage averted was that to the houses thatwere removed while the increased channelcapacity actually had little effect on thereduction of the flood plain area. The highcost and density of urban infrastructure onceagain was driving the results of the analysis.
There are ecological benefits to riverrestoration, but relocation alone will not beenough and enormous investment andcoordination will be required. It would entail
| FIGURE 7 | Loss-frequency curve with relocation
������
������
������
�������
�������
�������
�������
���������������������������������������������������������������������������������������������������������������������������������������
����������� ����
���
������������
������
��� ������������ �����! ��������
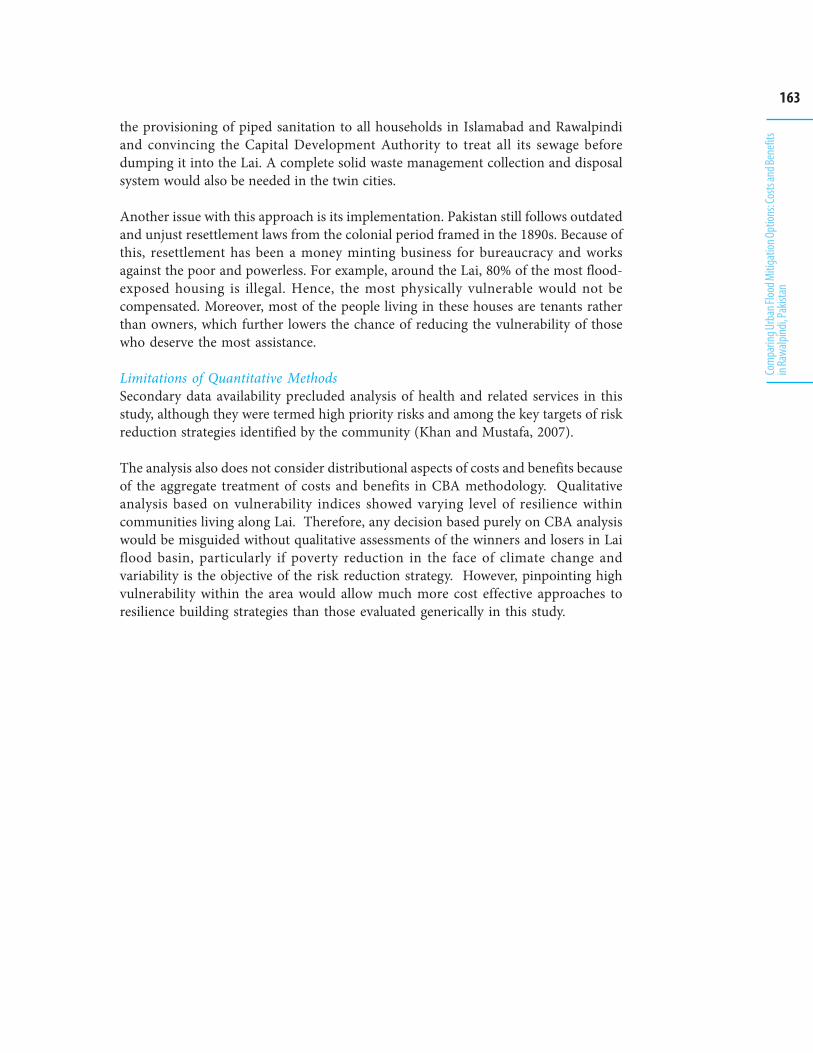
163
Com
parin
g Urb
an Fl
ood M
itiga
tion O
ption
s: Cos
ts an
d Ben
efits
in Ra
walpi
ndi, P
akist
an
the provisioning of piped sanitation to all households in Islamabad and Rawalpindiand convincing the Capital Development Authority to treat all its sewage beforedumping it into the Lai. A complete solid waste management collection and disposalsystem would also be needed in the twin cities.
Another issue with this approach is its implementation. Pakistan still follows outdatedand unjust resettlement laws from the colonial period framed in the 1890s. Because ofthis, resettlement has been a money minting business for bureaucracy and worksagainst the poor and powerless. For example, around the Lai, 80% of the most flood-exposed housing is illegal. Hence, the most physically vulnerable would not becompensated. Moreover, most of the people living in these houses are tenants ratherthan owners, which further lowers the chance of reducing the vulnerability of thosewho deserve the most assistance.
Limitations of Quantitative MethodsSecondary data availability precluded analysis of health and related services in thisstudy, although they were termed high priority risks and among the key targets of riskreduction strategies identified by the community (Khan and Mustafa, 2007).
The analysis also does not consider distributional aspects of costs and benefits becauseof the aggregate treatment of costs and benefits in CBA methodology. Qualitativeanalysis based on vulnerability indices showed varying level of resilience withincommunities living along Lai. Therefore, any decision based purely on CBA analysiswould be misguided without qualitative assessments of the winners and losers in Laiflood basin, particularly if poverty reduction in the face of climate change andvariability is the objective of the risk reduction strategy. However, pinpointing highvulnerability within the area would allow much more cost effective approaches toresilience building strategies than those evaluated generically in this study.
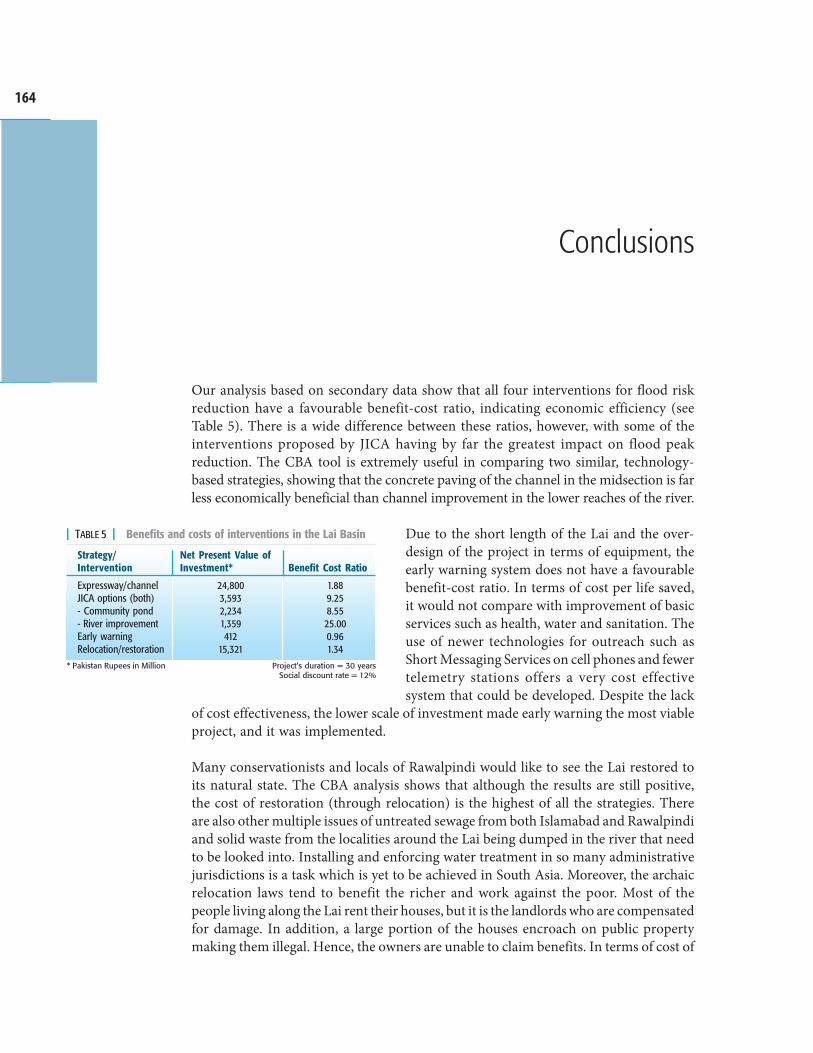
164
Catalyzing Climate and Disaster Resilience: Processes for
Identifying Tangible and Economically Robust Strategies
Our analysis based on secondary data show that all four interventions for flood riskreduction have a favourable benefit-cost ratio, indicating economic efficiency (seeTable 5). There is a wide difference between these ratios, however, with some of theinterventions proposed by JICA having by far the greatest impact on flood peakreduction. The CBA tool is extremely useful in comparing two similar, technology-based strategies, showing that the concrete paving of the channel in the midsection is farless economically beneficial than channel improvement in the lower reaches of the river.
Due to the short length of the Lai and the over-design of the project in terms of equipment, theearly warning system does not have a favourablebenefit-cost ratio. In terms of cost per life saved,it would not compare with improvement of basicservices such as health, water and sanitation. Theuse of newer technologies for outreach such asShort Messaging Services on cell phones and fewertelemetry stations offers a very cost effectivesystem that could be developed. Despite the lack
of cost effectiveness, the lower scale of investment made early warning the most viableproject, and it was implemented.
Many conservationists and locals of Rawalpindi would like to see the Lai restored toits natural state. The CBA analysis shows that although the results are still positive,the cost of restoration (through relocation) is the highest of all the strategies. Thereare also other multiple issues of untreated sewage from both Islamabad and Rawalpindiand solid waste from the localities around the Lai being dumped in the river that needto be looked into. Installing and enforcing water treatment in so many administrativejurisdictions is a task which is yet to be achieved in South Asia. Moreover, the archaicrelocation laws tend to benefit the richer and work against the poor. Most of thepeople living along the Lai rent their houses, but it is the landlords who are compensatedfor damage. In addition, a large portion of the houses encroach on public propertymaking them illegal. Hence, the owners are unable to claim benefits. In terms of cost of
Conclusions
Strategy/Intervention
Expressway/channelJICA options (both)- Community pond- River improvementEarly warningRelocation/restoration
Benefit Cost Ratio
1.889.258.55
25.000.961.34
| TABLE 5 | Benefits and costs of interventions in the Lai Basin
Net Present Value ofInvestment*
24,8003,5932,2341,359412
15,321Project’s duration = 30 years
Social discount rate = 12%* Pakistan Rupees in Million
165
Com
parin
g Urb
an Fl
ood M
itiga
tion O
ption
s: Cos
ts an
d Ben
efits
in Ra
walpi
ndi, P
akist
an
land, the Capital Development Authority has the mandate to develop new housingand owns large tracts of land for low cost housing. If the houses along the Lai were tobe exchanged for units upstream the prospect of relocation would become highlyfeasible as the authorities would have to pay for land development only and not forthe cost of the land. However, this would have to be done under a special project withmore pro-poor policies and procedures.
The CBA process has made it possible to compare similar approaches for costeffectiveness and has lent a sense of proportion to softer approaches in risk reductionthat tend to focus more on people rather than the hazard. The process has alsohighlighted the shortcomings of the tool in assessing people-centred, resiliencebuilding. Due to the lack of distributional aspects in the analysis, it is extremelyimportant to use more qualitative tools that focus on the differential effects of variousapproaches on the poor and the vulnerable. If one were to focus on resilience buildingand number of people helped rather than the amount of capital, then such an analysiswould yield even better results.
Despite its shortcomings, this CBA has established that one form of river improvementis much better than the other and also that the early warning system could have beenmade much more cost effective had a CBA been carried out. Use of CBA with its knownlimitations leads to a tangible decision support system in some cases and calls forfurther analysis in others.
166
Catalyzing Climate and Disaster Resilience: Processes for
Identifying Tangible and Economically Robust Strategies
Aditya, V. (2007) ‘Information, Communication Systems, Early Warning: Building“Alive” Systems for Last Mile Communities’. Paper presented atLIRNEasia workshop, Sharing Knowledge on Disaster Warning, NewDelhi 19 November 2007. http://www.lirneasia.net/wp-content/uploads/2007/11/aditya-delhi-workshop.pdf [accessed 6 Aug 2008].
Asian Development Bank (2008). ‘Rawalpindi Environmental Improvement Project’.www.adb.org/Business/Opportunities/not/pak/gpn2211 pak.asp[accessed June 8, 2008].
Asian Development Bank (2005). ‘Summary Environmental Impact Assessment,Rawalpindi Environmental Improvement Project in the Islamic Republicof Pakistan.’ http://www.adb.org/Documents/Environment/PAK/Rawalpindi-Environmental-Improvement.pdf [accessed 6 Aug 2008].
Associated Press of Pakistan (2008) ‘Water Supply, Sewerage on Top Priority in nextCDA Budget’. www.app.com.pk/en_/index.php?option=com_content&task=view&id=40001&Itemid=2[accessed June 8, 2008].
Dove, M. R., and D. M. Kammen (2001) ‘Vernacular models of Development: AnAnalysis of Indonesia under the ‘‘New Order’’’, World Development 29 (4):619-639.
Government of Pakistan (2008) Vision 2030. Islamabad: Government of Pakistanhttp://202.83.167.93/pcportal/vision2030.htm [accessed May 22, 2008]
Government of Pakistan (2007) National Disaster Risk Management Framework,Pakistan. Islamabad: National Disaster Management Authority,Government of Pakistan.
Government of Pakistan (2005) ‘PC-I, Flood Forecasting and Warning System for LaiNullah Basin in Islamabad-Rawalpindi’.
Government of Pakistan (2003) Rawalpindi: Population and Housing Census 1998.Islamabad: Population Census Organization, Government of Pakistan.
Government of Punjab (2007a) ‘PC-I, Sheikh Rashid Expressway and Flood ChannelProject’.
Bibliography
167
Com
parin
g Urb
an Fl
ood M
itiga
tion O
ption
s: Cos
ts an
d Ben
efits
in Ra
walpi
ndi, P
akist
an
Government of Punjab (2007b) ‘Environmental Impact Assessment, Lai Expresswayand Flood Channel Project’. Draft Report.
Government of Punjab (2001) Punjab Local Government Ordinance 2001. 4th ed.Lahore: the Consultax Pakistan 2007.
Global Change Impact Study Centre (2008) ‘Understanding Climate Change inPakistan’. Presentation made by Dr. Arshad M. Khan at the Roundtable onClimate Change Adaptation, ISET, Islamabad, Pakistan, 3 April, 2008.
Japan International Cooperation Agency (JICA) (2003) ‘The Study on ComprehensiveFlood Mitigation and Environmental Improvement Plan of Lai NullahBasin in the Islamic Republic of Pakistan’.
Japan International Cooperation Agency (JICA) (2002) ‘Study for Social Environment:Comprehensive Flood Mitigation and Environmental Improvement Planof Lai Nullah Basin in the Islamic Republic of Pakistan’.
Khan, F. and Mustafa, D. (2007). Navigating the Contours of the PakistaniHazardscape: Disaster Experience versus Policy. In Moench, M. and A.Dixit (eds.), Working with the winds of change: towards strategies forresponding to the risks associated with climate change and other hazards.ISET-Nepal and ProVention: Kathmandu, Nepal; pp. 193-234
Malik, A. H. (2000a) ‘Integrated Urban Lei River (North Pakistan)Water ResourcesManagement’, International Journal of Water Resources Development 16(1):97 117.
Malik. A. H. (2000b) ‘Lei Drainage Basin (Rawalpindi-Islamabad): An Example ofSustainable Groundwater Exploitation’, Science Vision 5(4): 27-38.
Meier, R. (1985) ‘Islamabad Is Already Twenty-five’, Ekistics 52: 212-216.Moench, M. and A. Dixit (eds) (2007) Working with the Winds of Change: Toward
Strategies for Responding to the Risks Associated with Climate Change andOther Risks. Boulder: Institute for Social and Environmental Transition;Kathmandu: ISET-Nepal; Geneva: the ProVention Consortium.
Moench, M. and A. Dixit (eds) (2004) Adaptive Capacity and Livelihood Resilience:Adaptive Strategies for Responding to Floods and Droughts in South Asia.Boulder: Institute for Social and Environmental Transition; Kathmandu:ISET-Nepal.
Mustafa, D. (2005) ‘The production of an Urban Hazardscape in Pakistan: Modernity,Vulnerability and the Range of Choice’, The Annals of the Association ofAmerican Geographers 95(3): 566-586.
Mustafa, D. (2004) ‘Reinforcing Vulnerability? The Disaster relief, recovery andresponse to the 2001 flood Rawalpindi/Islamabad, Pakistan’,Environmental Hazards: Human and Policy Dimensions, 5(3/4): 71-82.
NDMA (2008) http://www.ndma.gov.pk/8octeq.html [accessed 18 February 2008].Paul, Samuel (2003) Holding the State to Account. Bangalore: Books for Change.Spaulding, F. (1996) ‘Architecture and Islamabad’. Paper presented at Workshop on
State of Pakistan Studies, Washington DC.Scott, J. C. (1998) Seeing like a state. New Haven, CT: Yale University Press.
168
Catalyzing Climate and Disaster Resilience: Processes for
Identifying Tangible and Economically Robust Strategies
Shared learning dialogue with Government Organizations, Islamabad, 22 March 2007.Shared learning dialogue with Zafar Iqbal, Assistant Director, Survey of Pakistan, 22
March 2007.Shared learning dialogue with Fareeha Omar, Gender Expert Earthquake Rehabilitation
and Reconstruction Authority, 24 April, 2007Shared learning dialogue with non-government and local organizations, Rawalpindi, 13
September 2007.Shared learning dialogue with G. M. Naz, Deputy Fire Officer, Fire Services, Rawalpindi, 5
October 2007.Shared learning dialogue with Rifaqat Iqbal, Assistant Director, Rawalpindi
Development Authority, 13 February 2008.Shared learning dialogue with Amir Bashir, Director Engineering, Rawalpindi
Development Authority, 13 February 2008.Shared learning dialogue with Iqtidar Yaqoob, Town Officer Planning, Rawal Town Town
Municipal Authority, 21 May 2007.Shared learning dialogue with Zahoor Dogar, Deputy Project Director, Rawalpindi
Environmental Improvement Project, WASA, 21 June 2008.Shared learning dialogue with Dr. Tahir Ahmed, Medical Officer, EDO Health, 17 July 2007.Shared learning dialogue with Riaz Ahmed, Chief Draftman, Small Dams Organization, 8
March 2007.Shared learning dialogue with Azmat Hayat Khan, Director R&D, PMD, 20 January 2007.Shared learning dialogue with the Residents of Kumhar Road, Rawalpindi, 15 September
2007.Shared learning dialogue with Akhtar Mehmood, Assistant Met Officer, Flood
Forecasting Division, 30 January 2007.The Dawn (2007a), Press Report, 10 March 2007The Dawn (2007b) Press Report, 27 March 2007The Dawn (2007c) Press Report, 20 September 2007The News (2007), Press Report, 9 September 2007The News (2008), Press Report, 23 March 2008)
Quantitative Cost-Benefit Assessment ofFlood Mitigation Options:
Uttar Pradesh, India
6C H A P T E R
Praveen Singh (WII)Daniel Kull (IIASA)
Shashikant Chopde (WII)Shiraz A. Wajih (GEAG) &
The Risk to Resilience Study Team
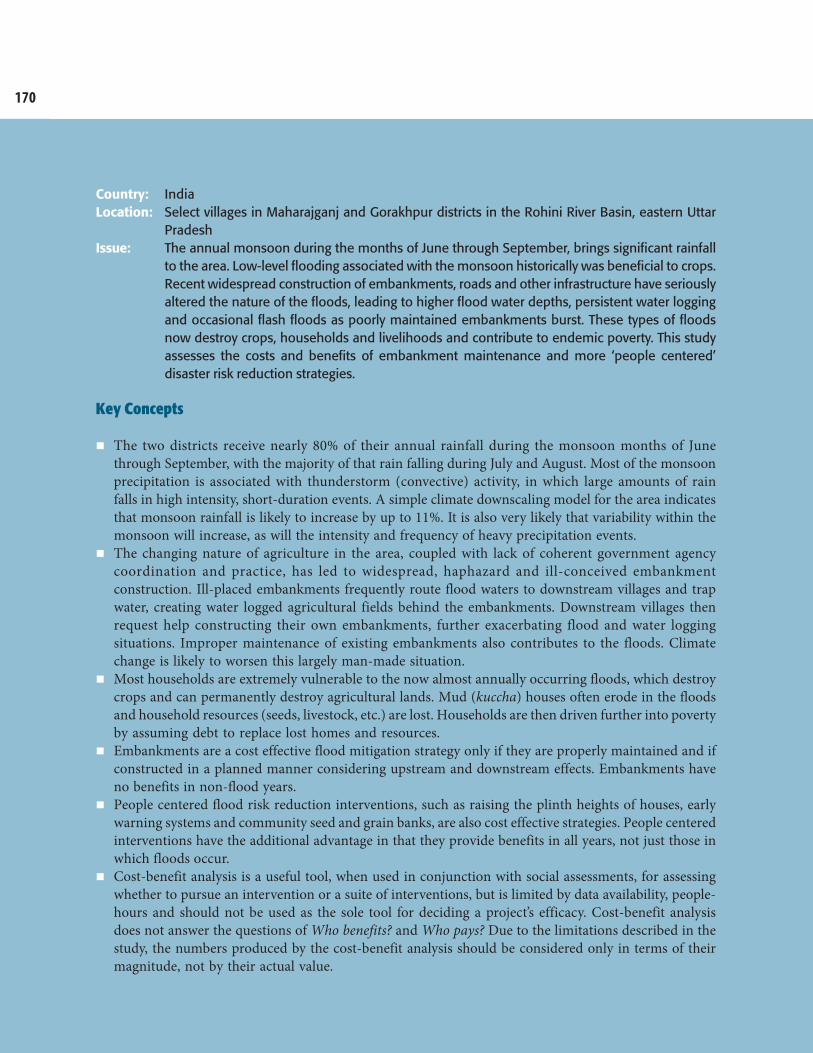
170
Catalyzing Climate and Disaster Resilience: Processes for
Identifying Tangible and Economically Robust Strategies
Country: IndiaLocation: Select villages in Maharajganj and Gorakhpur districts in the Rohini River Basin, eastern Uttar
PradeshIssue: The annual monsoon during the months of June through September, brings significant rainfall
to the area. Low-level flooding associated with the monsoon historically was beneficial to crops.Recent widespread construction of embankments, roads and other infrastructure have seriouslyaltered the nature of the floods, leading to higher flood water depths, persistent water loggingand occasional flash floods as poorly maintained embankments burst. These types of floodsnow destroy crops, households and livelihoods and contribute to endemic poverty. This studyassesses the costs and benefits of embankment maintenance and more ‘people centered’disaster risk reduction strategies.
Key Concepts
The two districts receive nearly 80% of their annual rainfall during the monsoon months of Junethrough September, with the majority of that rain falling during July and August. Most of the monsoonprecipitation is associated with thunderstorm (convective) activity, in which large amounts of rainfalls in high intensity, short-duration events. A simple climate downscaling model for the area indicatesthat monsoon rainfall is likely to increase by up to 11%. It is also very likely that variability within themonsoon will increase, as will the intensity and frequency of heavy precipitation events.The changing nature of agriculture in the area, coupled with lack of coherent government agencycoordination and practice, has led to widespread, haphazard and ill-conceived embankmentconstruction. Ill-placed embankments frequently route flood waters to downstream villages and trapwater, creating water logged agricultural fields behind the embankments. Downstream villages thenrequest help constructing their own embankments, further exacerbating flood and water loggingsituations. Improper maintenance of existing embankments also contributes to the floods. Climatechange is likely to worsen this largely man-made situation.Most households are extremely vulnerable to the now almost annually occurring floods, which destroycrops and can permanently destroy agricultural lands. Mud (kuccha) houses often erode in the floodsand household resources (seeds, livestock, etc.) are lost. Households are then driven further into povertyby assuming debt to replace lost homes and resources.Embankments are a cost effective flood mitigation strategy only if they are properly maintained and ifconstructed in a planned manner considering upstream and downstream effects. Embankments haveno benefits in non-flood years.People centered flood risk reduction interventions, such as raising the plinth heights of houses, earlywarning systems and community seed and grain banks, are also cost effective strategies. People centeredinterventions have the additional advantage in that they provide benefits in all years, not just those inwhich floods occur.Cost-benefit analysis is a useful tool, when used in conjunction with social assessments, for assessingwhether to pursue an intervention or a suite of interventions, but is limited by data availability, people-hours and should not be used as the sole tool for deciding a project’s efficacy. Cost-benefit analysisdoes not answer the questions of Who benefits? and Who pays? Due to the limitations described in thestudy, the numbers produced by the cost-benefit analysis should be considered only in terms of theirmagnitude, not by their actual value.
171
Quan
titat
ive Co
st-Be
nefit
Asse
ssmen
t of F
lood M
itiga
tion
Optio
ns: U
ttar P
rade
sh, In
dia
Historic Political and Policy Environments
Strategies for flood protection within the Rohini Basin have been heavily influenced bythe fluid political and policy environment of the region. The political leadership ofnewly independent India believed that flood control was the best way to protect peopleand secure agriculture. Embankments therefore gradually became the dominant floodrisk reduction strategy, alongside a focus on growing crops requiring specific inputsand production techniques which are dependent on large-scale flood control andirrigation schemes and the bureaucracies created for their management.
Initial construction of embankments in the Rohini Basin created a self-propagatingdynamic. Embankment construction started during the 1970s and evolved in a piecemealand uncoordinated manner over the following 3-4 decades. Since embankments on onestretch of a river have adverse impacts on other areas, this partial approach generatedfurther demands for embankment construction. Thus, the basin witnessed a competitiveconstruction of embankments, with political leaders driven by short-term populistagendas often propagating the strategy when in a position of power.
Presently, any major flood event is followed the allocation of massive funds for constructionof new embankments and repair of old ones. The situation is further complicated by thetransboundary nature of the Rohini basin, which crosses the Nepal-India border. Bothsides of the border have experienced political turmoil at various points of time and thelevel of cooperation on everything from data collection and sharing, to actual jointmanagement of smaller shared rivers such as the Rohini has been minimal. Under thesecircumstances, relatively little attention is given to the effectiveness of existing strategiesfor flood control or the potential availability of alternative approaches.
Lack of Learning
Despite recommendations from several expert committees and other knowledgeplatforms, there has yet to be a paradigm shift from flood control to flood management.Studies conducted by the Planning Commission have questioned the role ofembankments, and a number of donors and NGOs also have highlighted their adverse
Introduction
172
Catalyzing Climate and Disaster Resilience: Processes for
Identifying Tangible and Economically Robust Strategies
impacts. The political leadership, however, continues to place faith in controlstructures that also help gain political support in their constituencies. And whilemost high-level committees and task forces have flagged the importance of maintainingflood control structures such as embankments, this is seldom undertaken due topolitical and budgetary constraints.
The bureaucratization and centralization of water resource development in India hasled to a lack of transparency of information. Most data, including river discharges, areclassified. As a result, water resource management has become confined to specialists,rather than discussed openly in political and public spheres. This has reduced theability to learn from experiences, such as those emerging from work on decentralizedrisk reduction strategies in other parts of the Sub-Continent, for example, Bangladeshand to some extent the Nepal Tarai.
Disjuncture between Groups, Institutions, Levels of Activity and Analysis
There is a lack of inter-sectoral coordination amongst the various government agenciesinvolved in different aspects of flood management. Each has its own independentagenda, without taking in to account common concerns. Furthermore, administrativeand physical boundaries often do not match. Flood management must be at the basinlevel, but most river basins fall within several administrative boundaries. Most actionsdirectly concerned with floods thus are designed and implemented at the administrativelevel, but their implications are felt at the basin level.
There appears to be a disjuncture between community needs and governmentprogrammes. While a cross-sectoral approach is required to address the basic needsof communities in flood prone areas, especially on issues of communications andlivelihood resilience, government flood management plans generally do not focus onthe entire range of needs and potential interventions. Livelihood promotion, with thepotential to address the root cause of flood vulnerability, is often not considered.
Community mobilization and capacity building require a strong network of NGOswith a long-term focus on development. In the Rohini Basin, however, very few NGOsare operating in flood-affected areas and those that are present primarily providerelief. Furthermore, long-term programmes require substantial resources.
Most rural development activities are designed at the national-level and commonacross the country, lacking mechanisms to respond to local contexts and specificities.There are no specific features for flood prone areas. Despite the requirement forparticipatory bottom-up planning approaches when preparing official disastermanagement plans, this is rarely realized in practice.
Major Changes due to Climate Change (to 2050)
Downscaled climate change projections to the year 2050 indicate monsoon (June toSeptember) rainfall in the Rohini Basin will increase. Translated into potential changes
173
Quan
titat
ive Co
st-Be
nefit
Asse
ssmen
t of F
lood M
itiga
tion
Optio
ns: U
ttar P
rade
sh, In
dia
in flooding, the frequency of smaller less intense events will increase, while rarer butmore intense floods will remain relatively constant. What is now a 10-year flood lossin the future will be a 5-year loss, while a current 100-year flood loss will become a 60-year loss.
The embankment-driven notion of ‘keeping away floods’ becomes difficult to implementsuccessfully when the thresholds needed for design, for instance flood frequencies andmagnitudes, are dynamic and highly uncertain. As a result, alternative strategies suchas those designed to strengthening the resilience of livelihoods and communities inflood prone areas and the ability of people to ‘live with floods’ need to be explored aspotential alternative or complementary strategies as climate change proceeds.
Analysis of Strategies for Flood Risk Reduction
Detailed evaluation of the costs and benefits of alternative strategies for flood riskmanagement along the Rohini Basin in Eastern Uttar Pradesh, India, highlightsubstantial differences in economic returns.
Construction of embankments for flood control has been the primary strategy forrisk management over the last half century. Detailed analysis undertaken through theproject demonstrates that this investment cannot be concluded to have beeneconomically beneficial. When analyzed from a social welfare perspective in which allcosts and benefits are considered, the benefit/cost ratio from past investments is about1; that is the costs have equaled the benefits. Projected impacts from climate changewould reduce returns further probably driving the benefit/cost ratio for newembankment construction in the future below 1. Given that investments in existingembankments represent sunk costs, investments in proper maintenance of thoseembankments would, however, generate high economic returns (benefit/cost ratios inthe range of 2) under both current and future climate change scenarios.
In contrast to historical reliance on major structural measures for flood control,scenarios based on a more “people centered” resilience-driven flood risk reductionapproach perform more economically efficiently. Benefit/cost ratios for such strategiesrange from 2 to 2.5 under both current and future climate change scenarios.Furthermore, since such strategies have low initial investment costs in relation toannual operation and maintenance, these returns are not sensitive to discount ratesor assumptions regarding future climate conditions. Projected increases in flood riskdue to climate change are unlikely to erode the overall returns from people centeredstrategies. Overall, economic returns from portfolios of people centered strategiesappear highly resilient under a wide variety of conditions and assumptions.
Utility of Cost-Benefit Analysis
Cost-benefit analysis provides a useful support tool for decision-making and policydevelopment for disaster risk reduction. However, the limitations in applying cost-benefit analysis need to be considered. Limitations on data availability and quality
174
Catalyzing Climate and Disaster Resilience: Processes for
Identifying Tangible and Economically Robust Strategies
constrained the analysis. Such limitations are inherent in most risk managementcontexts, particularly in the developing world. As a consequence, however, theoutcomes from cost-benefit analyses depend heavily on key assumptions and data.Testing the accuracy of available data and any assumptions that must be made throughextensive stakeholder involvement in the analytical process is, as a result, essential.Benefit/cost ratios and other quantitative outputs are most meaningful as order ofmagnitude estimates rather than absolute values, especially when the inherentuncertainties in climate change projections are considered.
To complement this approach, qualitative evaluation provides insights about theperceptions and needs of diverse stakeholders, as well as varied benefits and impactsof potential disaster risk reduction strategies on different locations and communities.If undertaken in an inclusive stakeholder-based manner, the process of undertaking acost-benefit analysis forces participants to systematically evaluate the details of riskmanagement strategies and the assumptions underpinning them. This analyticalprocess can ensure that the strategies ultimately selected are socially and technicallyviable, broadly owned and likely to generate solid economic returns. It can also ensurethat the distributional consequences of strategies–who benefits and who pays–areaddressed; a factor not incorporated in conventional cost-benefit analysis. Withoutinclusiveness, debate and iterative learning among stakeholders, cost-benefit analysiscan easily be manipulated and thus misused.
175
Quan
titat
ive Co
st-Be
nefit
Asse
ssmen
t of F
lood M
itiga
tion
Optio
ns: U
ttar P
rade
sh, In
dia
The Rohini Basin, a part of the Ganga Basin, has its headwaters in the Nepal Tarai,but is located primarily in the northeastern region of Uttar Pradesh, India. Thebasin is prone to annual monsoon floods, the intensity and frequency of which seemto have increased during the past 10 years. In this case study, the costs and benefitsof different flood risk reduction approaches under potential climate change wereanalyzed and compared. In addition, the utility, applicability and limitations ofcost-benefit analysis for supporting disaster risk reduction decision-making undera changing climate were investigated.
The economic performance of embankments, reflecting a historically dominantcentralized flood risk reduction approach, was analyzed in comparison to a moreegalitarian “people centered” basket of interventions implemented at individual,community and societal levels. These flood risk reduction strategies were evaluatedthrough both qualitative and quantitative frameworks.
The subsequent section introduces the geographic context of the Rohini Basin studyarea and methodology of the study, followed by a section detailing variousdimensions of vulnerability of the flood affected population. A fourth section outlinesrelevant policy issues for disaster risk reduction, and the process of selecting theflood risk reduction strategies for analysis. Details of the qualitative and quantitativeanalyses of these two contrasting approaches (embankments and people centeredoptions) are detailed in section five. The final section summarizes key conclusionsand reviews the robustness and utility of the cost-benefit analysis within the policycontext.
Geographical Setting
The Rohini River is part of the Ganga Basin, located in Gorakhpur and MaharajganjDistricts in the northeast Tarai region of Uttar Pradesh, India, in what is also knownas the trans-Sarayu plains. Starting in Nepal, the river flows approximately northto south with a catchment area in India of about 872 km2. The Rohini ends at its
Study Background
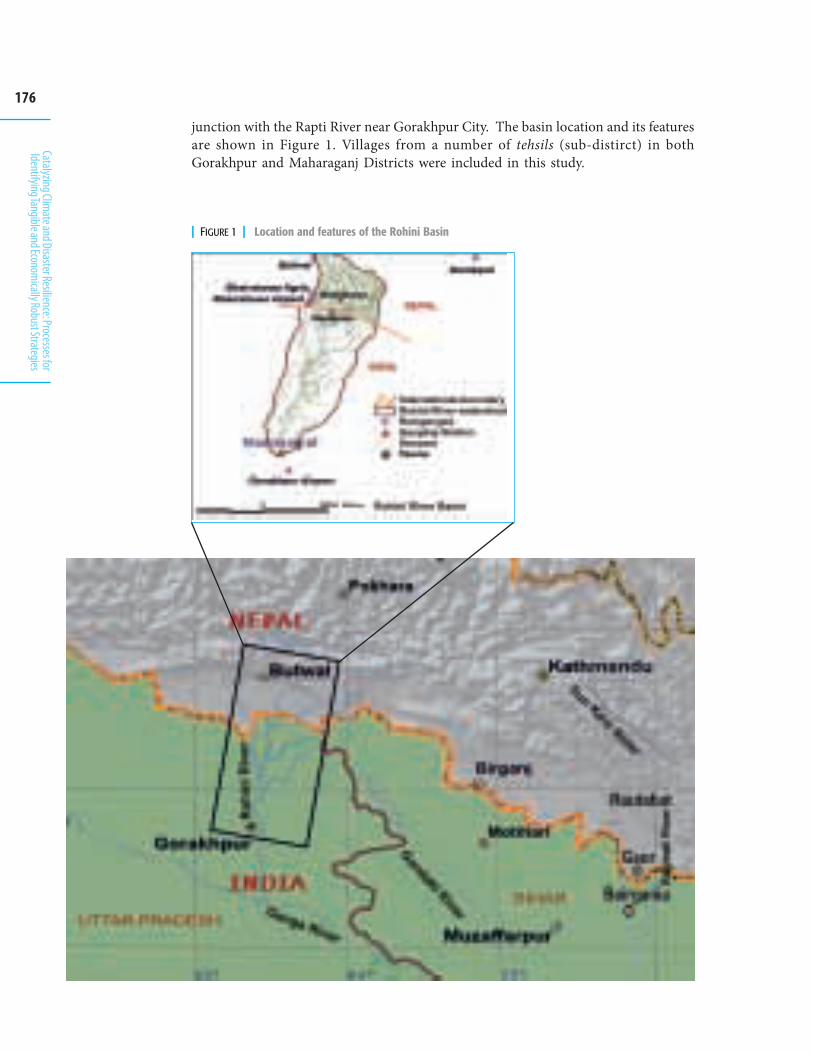
176
Catalyzing Climate and Disaster Resilience: Processes for
Identifying Tangible and Economically Robust Strategies
| FIGURE 1 | Location and features of the Rohini Basin
junction with the Rapti River near Gorakhpur City. The basin location and its featuresare shown in Figure 1. Villages from a number of tehsils (sub-distirct) in bothGorakhpur and Maharaganj Districts were included in this study.
177
Quan
titat
ive Co
st-Be
nefit
Asse
ssmen
t of F
lood M
itiga
tion
Optio
ns: U
ttar P
rade
sh, In
dia
Agro-ecological Setting
Within India, the Rohini Basin covers elevations from 107 m in the northeast to 76 mabove sea level in the southeast, resulting in a gentle slope from north to south. Witha very small slope, even the smallest disruption in the natural flow of water can causelarge-scale and long-term flooding.
The Rohini and Piyas Rivers traverse the case study area and merge in the middle ofthe basin. Many other hill streams and drainage channels join the Rohini River,which itself is a tributary of the Rapti River. These rivers and streams swell withwater and debris during the monsoon, and with poorly formed banks, are prone tooverflowing and erosion. This leads to frequent changes in the course of the rivers,more often in the northern reaches of the basin.
A large number of permanent water bodies (charans) cover the area; these developedover time due to changing river courses and abandoned channels blocked by silt.The basin also contains a vast expanse of temporary swamps and jhils (local waterbodies), which vary from broad sheets of water during the rains to shallow marshesor even arable land during the dry season. Historically, these water bodies playedan important role in flood management and provided livelihoods to a largepopulation. In the last two decades, however, the water bodies have been heavilyencroached upon.
The climate of the area is monsoonal. The temperature ranges between 50C to 460Cand average rainfall is approximately 1200-1400 mm/annum, over 80% of which fallsduring the monsoon months of June through September. July and August are thewettest months, receiving about 60% of the monsoon season rainfall.
Numerous rivers and drainage channels transport soil and silt from the hills of Nepal.This soil plays a vital role in crop production. The low-lying lands usually have clayeysoil well suited for rice paddy, while the higher lands have loam or a clay and sandmixture well suited for wheat, pulses and oilseeds. About 80% of the area is undercultivation. There are two main crop seasons: kharif (monsoon) and rabi (winter), witha third during the summer (zaid) in places where suitable irrigation exists. The maincrops of the region are paddy in kharif, wheat in rabi and vegetables and maize in zaid.
About 50-60 years ago, the copping pattern was quite different.1 Paddy was the maincrop, particularly in areas having older alluvium (clayey) soil, with only a few minorrabi crops like pulses and oilseeds. Madua, kerav, kodo, chana, jau, savan (millet andlegume crops) and a little bit of wheat, sugarcane and bajra (pearl millet) were alsogrown. With increasing irrigation through canals and private tube wells, wheatbecame more popular than minor crops. Many of the kharif crops like madua andkodo (millets), which had been either grown separately or inter-cropped with paddy,have almost disappeared.
1 This summary of agricultural changes is based on interviews and surveys.
178
Catalyzing Climate and Disaster Resilience: Processes for
Identifying Tangible and Economically Robust Strategies
The growing popularity of ‘green revolution’ methods, while relatively recent in theregion compared to other parts of India, has substantially changed agriculture inthe area. High yield variety (HYV) seeds have replaced indigenous varieties and theuse of chemical fertilizers has increased, along with groundwater irrigation. Whileagricultural productivity in the region has increased, it still remains low by nationalor state averages, primarily due to small land holdings, lack of irrigation and anabsence of extension services. A lack of infrastructure for food storage andprocessing, communication, and electricity further limits agricultural income. Thereis potential for families to strengthen incomes through agricultural diversification,off-farm and non-farm employment opportunities. However, these opportunitiesare limited to date, and there are only some small industries in the region, primarilyagriculture based, such as rice and flour mills.
Flood Hazard
Like all of eastern India, the Rohini Basin is prone to floods during the four monsoonmonths. About one third of its catchment lies in the Nepal Tarai where cloudburstscause intense rainfall events. There is always some annual flooding, with majorfloods occurring in 1954, 1961, 1974 and 1993. In the last 10 years the intensity andfrequency of floods appear to have increased and three major floods have occurredwithin a decade: 1998, 2001 and 2007.
In the upper part of the basin, piyas, or small hill streams and drainage channels, areprone to erosion and sudden course changes. In the lower part, the very low gradientcauses the Rohini to meander sluggishly through the plains.
Since the 1970s, embankments (currently totalling over 113 km in length) and somespurs have been constructed for flood control. However, these embankments havefrequently breached, causing more damage than if they had not been built. Thestructures fail primarily because they are not maintained properly, or in some casestheir hydraulic designs are exceeded. Embankments have also caused the river bedto rise, decreasing the river’s carrying capacity and increasing chances of flooding.
Water logging occurs because of drainage congestion caused mainly byembankments and other linear developments (roads, railways, canals, urbanization,etc.). In certain areas, including Maharajganj, the water logged area increased by65-95% during 1971 to 1991. In many cases waterways developed across road andrailway embankments drain insufficiently. Excessive rainfall can cause overflowingof low and poorly formed riverbanks, and drainage congestion is a serious problem.Siphons are either closed during high floods or do not function due to silting andclogging. The flood hazard is pronounced where drainage channels merge into theRohini, especially lower in the basin above the confluence of the Rohini and RaptiRivers. The overall nature of flooding therefore has changed; inundation depthshave become higher and more unpredictable (embankment failures), with constantwater logging in certain areas. While earlier floods were considered to have donemore good than harm, they now cause immense damage to life and property, andhave become an obstacle to development in the region.
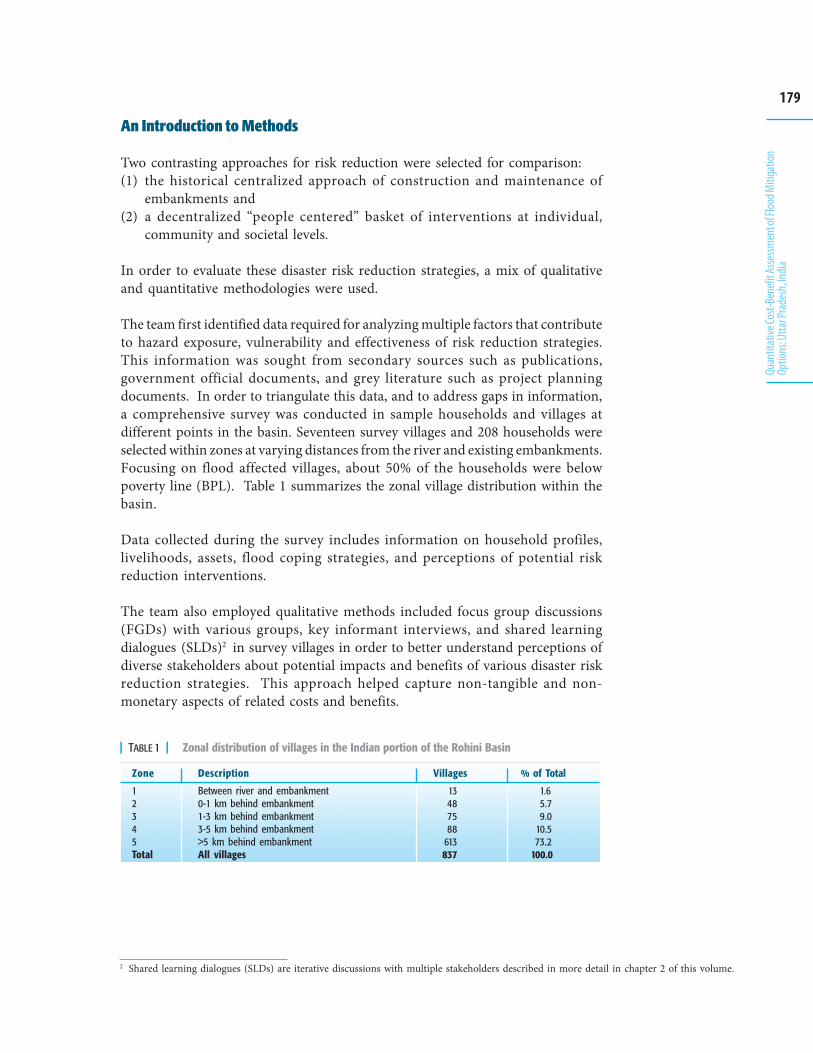
179
Quan
titat
ive Co
st-Be
nefit
Asse
ssmen
t of F
lood M
itiga
tion
Optio
ns: U
ttar P
rade
sh, In
dia
An Introduction to Methods
Two contrasting approaches for risk reduction were selected for comparison:(1) the historical centralized approach of construction and maintenance of
embankments and(2) a decentralized “people centered” basket of interventions at individual,
community and societal levels.
In order to evaluate these disaster risk reduction strategies, a mix of qualitativeand quantitative methodologies were used.
The team first identified data required for analyzing multiple factors that contributeto hazard exposure, vulnerability and effectiveness of risk reduction strategies.This information was sought from secondary sources such as publications,government official documents, and grey literature such as project planningdocuments. In order to triangulate this data, and to address gaps in information,a comprehensive survey was conducted in sample households and villages atdifferent points in the basin. Seventeen survey villages and 208 households wereselected within zones at varying distances from the river and existing embankments.Focusing on flood affected villages, about 50% of the households were belowpoverty line (BPL). Table 1 summarizes the zonal village distribution within thebasin.
Data collected during the survey includes information on household profiles,livelihoods, assets, flood coping strategies, and perceptions of potential riskreduction interventions.
The team also employed qualitative methods included focus group discussions(FGDs) with various groups, key informant interviews, and shared learningdialogues (SLDs)2 in survey villages in order to better understand perceptions ofdiverse stakeholders about potential impacts and benefits of various disaster riskreduction strategies. This approach helped capture non-tangible and non-monetary aspects of related costs and benefits.
2 Shared learning dialogues (SLDs) are iterative discussions with multiple stakeholders described in more detail in chapter 2 of this volume.
| TABLE 1 | Zonal distribution of villages in the Indian portion of the Rohini Basin
Zone
12345Total
Description
Between river and embankment0-1 km behind embankment1-3 km behind embankment3-5 km behind embankment>5 km behind embankmentAll villages
Villages
13487588
613837
% of Total
1.65.79.0
10.573.2
100.0

180
Catalyzing Climate and Disaster Resilience: Processes for
Identifying Tangible and Economically Robust Strategies
The quantitative evaluation framework applied a combination of backwards- andforwards-looking risk analyses to drive a stochastic cost-benefit analysis. Past floodimpacts and hydrometeorological data were adapted to current conditions todetermine risk, while climate and flood modelling estimated potential future risk.Field experience and estimations were used to quantify and monetize costs, benefitsand disbenefits (potential negative consequences of interventions). Details ofmethodologies for these evaluations are provided in the section titled “EvaluatingTradeoffs” in this chapter. Finally, the methodology, experiences and results of theanalysis process were reviewed for robustness and utility within the policy context.
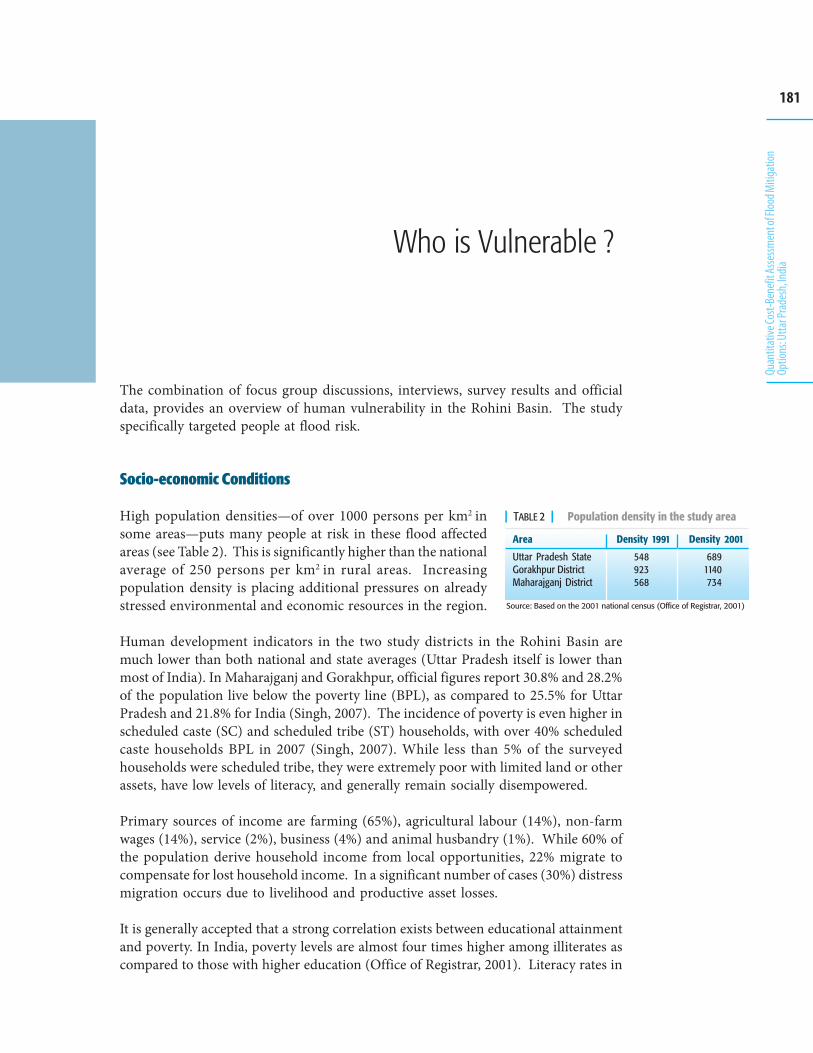
181
Quan
titat
ive Co
st-Be
nefit
Asse
ssmen
t of F
lood M
itiga
tion
Optio
ns: U
ttar P
rade
sh, In
dia
Who is Vulnerable ?
The combination of focus group discussions, interviews, survey results and officialdata, provides an overview of human vulnerability in the Rohini Basin. The studyspecifically targeted people at flood risk.
Socio-economic Conditions
High population densities—of over 1000 persons per km2 insome areas—puts many people at risk in these flood affectedareas (see Table 2). This is significantly higher than the nationalaverage of 250 persons per km2 in rural areas. Increasingpopulation density is placing additional pressures on alreadystressed environmental and economic resources in the region.
Human development indicators in the two study districts in the Rohini Basin aremuch lower than both national and state averages (Uttar Pradesh itself is lower thanmost of India). In Maharajganj and Gorakhpur, official figures report 30.8% and 28.2%of the population live below the poverty line (BPL), as compared to 25.5% for UttarPradesh and 21.8% for India (Singh, 2007). The incidence of poverty is even higher inscheduled caste (SC) and scheduled tribe (ST) households, with over 40% scheduledcaste households BPL in 2007 (Singh, 2007). While less than 5% of the surveyedhouseholds were scheduled tribe, they were extremely poor with limited land or otherassets, have low levels of literacy, and generally remain socially disempowered.
Primary sources of income are farming (65%), agricultural labour (14%), non-farmwages (14%), service (2%), business (4%) and animal husbandry (1%). While 60% ofthe population derive household income from local opportunities, 22% migrate tocompensate for lost household income. In a significant number of cases (30%) distressmigration occurs due to livelihood and productive asset losses.
It is generally accepted that a strong correlation exists between educational attainmentand poverty. In India, poverty levels are almost four times higher among illiterates ascompared to those with higher education (Office of Registrar, 2001). Literacy rates in
| TABLE 2 | Population density in the study area
Area
Uttar Pradesh StateGorakhpur DistrictMaharajganj District
Density 1991
548923568
Density 2001
6891140734
Source: Based on the 2001 national census (Office of Registrar, 2001)
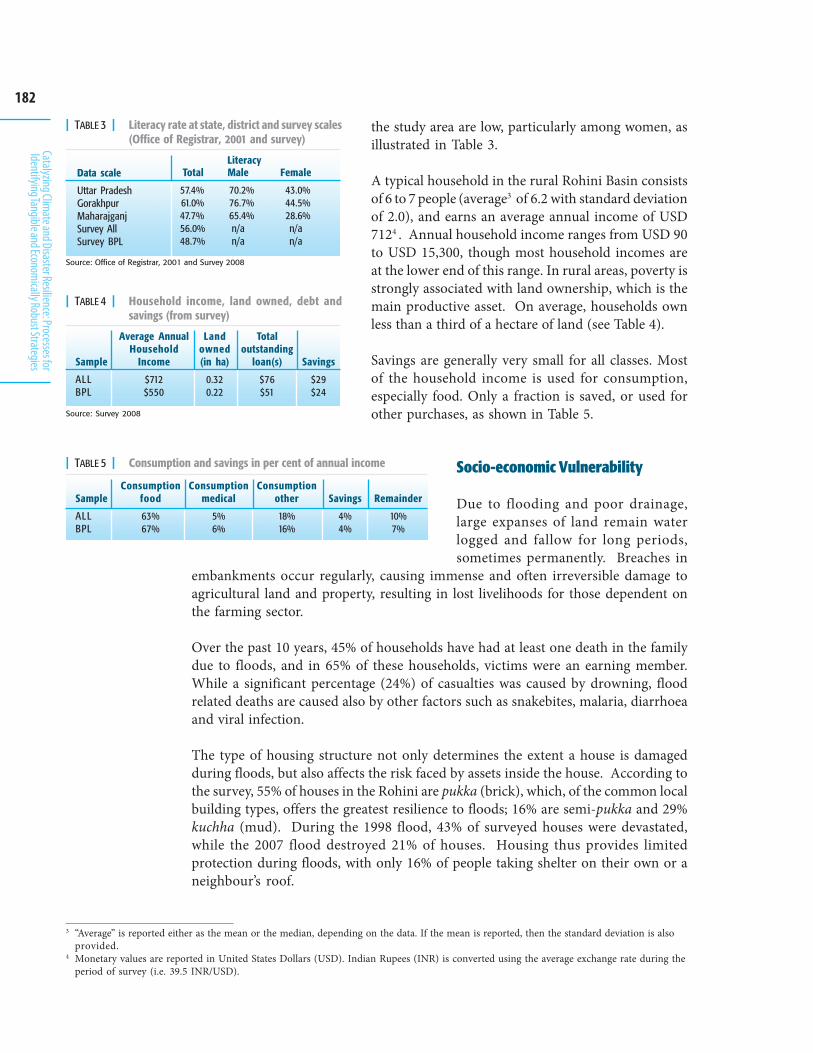
182
Catalyzing Climate and Disaster Resilience: Processes for
Identifying Tangible and Economically Robust Strategies
the study area are low, particularly among women, asillustrated in Table 3.
A typical household in the rural Rohini Basin consistsof 6 to 7 people (average3 of 6.2 with standard deviationof 2.0), and earns an average annual income of USD7124 . Annual household income ranges from USD 90to USD 15,300, though most household incomes areat the lower end of this range. In rural areas, poverty isstrongly associated with land ownership, which is themain productive asset. On average, households ownless than a third of a hectare of land (see Table 4).
Savings are generally very small for all classes. Mostof the household income is used for consumption,especially food. Only a fraction is saved, or used forother purchases, as shown in Table 5.
Socio-economic Vulnerability
Due to flooding and poor drainage,large expanses of land remain waterlogged and fallow for long periods,sometimes permanently. Breaches in
embankments occur regularly, causing immense and often irreversible damage toagricultural land and property, resulting in lost livelihoods for those dependent onthe farming sector.
Over the past 10 years, 45% of households have had at least one death in the familydue to floods, and in 65% of these households, victims were an earning member.While a significant percentage (24%) of casualties was caused by drowning, floodrelated deaths are caused also by other factors such as snakebites, malaria, diarrhoeaand viral infection.
The type of housing structure not only determines the extent a house is damagedduring floods, but also affects the risk faced by assets inside the house. According tothe survey, 55% of houses in the Rohini are pukka (brick), which, of the common localbuilding types, offers the greatest resilience to floods; 16% are semi-pukka and 29%kuchha (mud). During the 1998 flood, 43% of surveyed houses were devastated,while the 2007 flood destroyed 21% of houses. Housing thus provides limitedprotection during floods, with only 16% of people taking shelter on their own or aneighbour’s roof.
Remainder
10%7%
| TABLE 5 | Consumption and savings in per cent of annual income
Sample
ALLBPL
Consumptionfood
63%67%
Consumptionmedical
5%6%
Consumptionother
18%16%
Savings
4%4%
| TABLE 4 | Household income, land owned, debt andsavings (from survey)
Sample
ALLBPL
Average AnnualHousehold
Income
$712$550
Landowned(in ha)
0.320.22
Savings
$29$24
Totaloutstanding
loan(s)
$76$51
Data scale
Uttar PradeshGorakhpurMaharajganjSurvey AllSurvey BPL
| TABLE 3 | Literacy rate at state, district and survey scales(Office of Registrar, 2001 and survey)
Total
57.4%61.0%47.7%56.0%48.7%
Male
70.2%76.7%65.4%n/an/a
Female
43.0%44.5%28.6%n/an/a
Literacy
Source: Office of Registrar, 2001 and Survey 2008
Source: Survey 2008
3 “Average” is reported either as the mean or the median, depending on the data. If the mean is reported, then the standard deviation is alsoprovided.
4 Monetary values are reported in United States Dollars (USD). Indian Rupees (INR) is converted using the average exchange rate during theperiod of survey (i.e. 39.5 INR/USD).
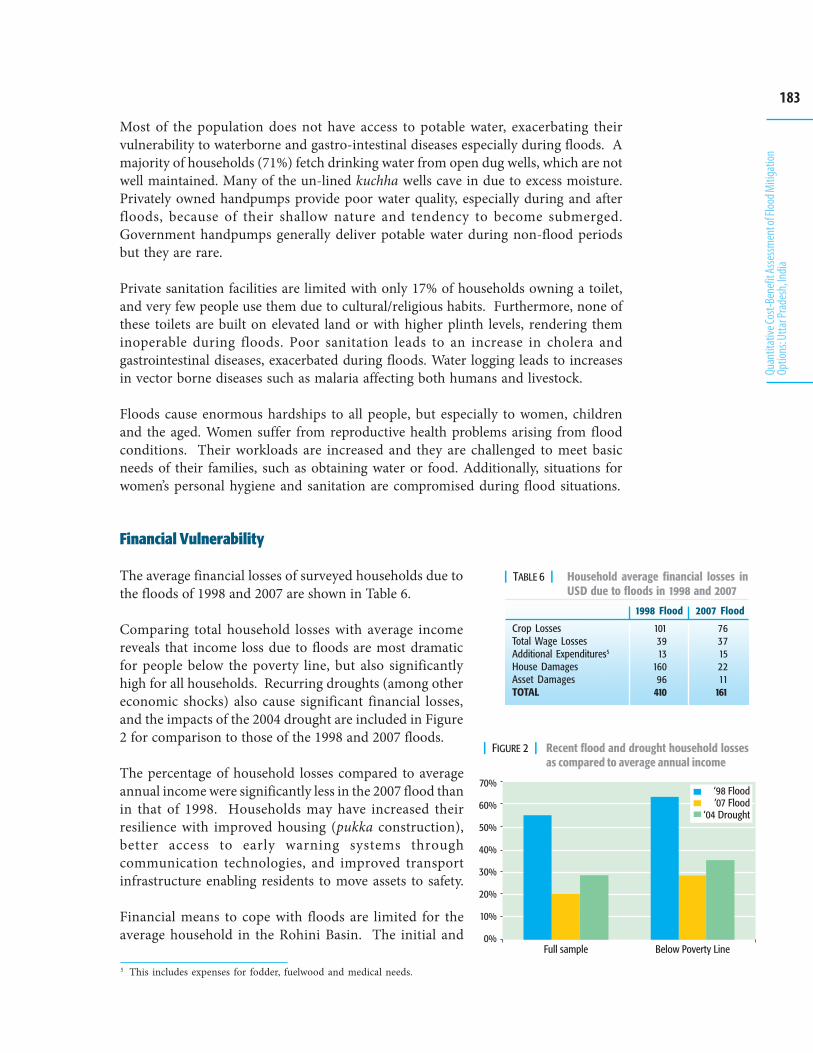
183
Quan
titat
ive Co
st-Be
nefit
Asse
ssmen
t of F
lood M
itiga
tion
Optio
ns: U
ttar P
rade
sh, In
dia
Most of the population does not have access to potable water, exacerbating theirvulnerability to waterborne and gastro-intestinal diseases especially during floods. Amajority of households (71%) fetch drinking water from open dug wells, which are notwell maintained. Many of the un-lined kuchha wells cave in due to excess moisture.Privately owned handpumps provide poor water quality, especially during and afterfloods, because of their shallow nature and tendency to become submerged.Government handpumps generally deliver potable water during non-flood periodsbut they are rare.
Private sanitation facilities are limited with only 17% of households owning a toilet,and very few people use them due to cultural/religious habits. Furthermore, none ofthese toilets are built on elevated land or with higher plinth levels, rendering theminoperable during floods. Poor sanitation leads to an increase in cholera andgastrointestinal diseases, exacerbated during floods. Water logging leads to increasesin vector borne diseases such as malaria affecting both humans and livestock.
Floods cause enormous hardships to all people, but especially to women, childrenand the aged. Women suffer from reproductive health problems arising from floodconditions. Their workloads are increased and they are challenged to meet basicneeds of their families, such as obtaining water or food. Additionally, situations forwomen’s personal hygiene and sanitation are compromised during flood situations.
Financial Vulnerability
The average financial losses of surveyed households due tothe floods of 1998 and 2007 are shown in Table 6.
Comparing total household losses with average incomereveals that income loss due to floods are most dramaticfor people below the poverty line, but also significantlyhigh for all households. Recurring droughts (among othereconomic shocks) also cause significant financial losses,and the impacts of the 2004 drought are included in Figure2 for comparison to those of the 1998 and 2007 floods.
The percentage of household losses compared to averageannual income were significantly less in the 2007 flood thanin that of 1998. Households may have increased theirresilience with improved housing (pukka construction),better access to early warning systems throughcommunication technologies, and improved transportinfrastructure enabling residents to move assets to safety.
Financial means to cope with floods are limited for theaverage household in the Rohini Basin. The initial and
| TABLE 6 | Household average financial losses inUSD due to floods in 1998 and 2007
1998 Flood
1013913
16096
410
2007 Flood
7637152211
161
Crop LossesTotal Wage LossesAdditional Expenditures5
House DamagesAsset DamagesTOTAL
5 This includes expenses for fodder, fuelwood and medical needs.
| FIGURE 2 | Recent flood and drought household lossesas compared to average annual income
70%
60%
50%
40%
30%
20%
10%
0%Full sample Below Poverty Line
‘98 Flood’07 Flood
‘04 Drought
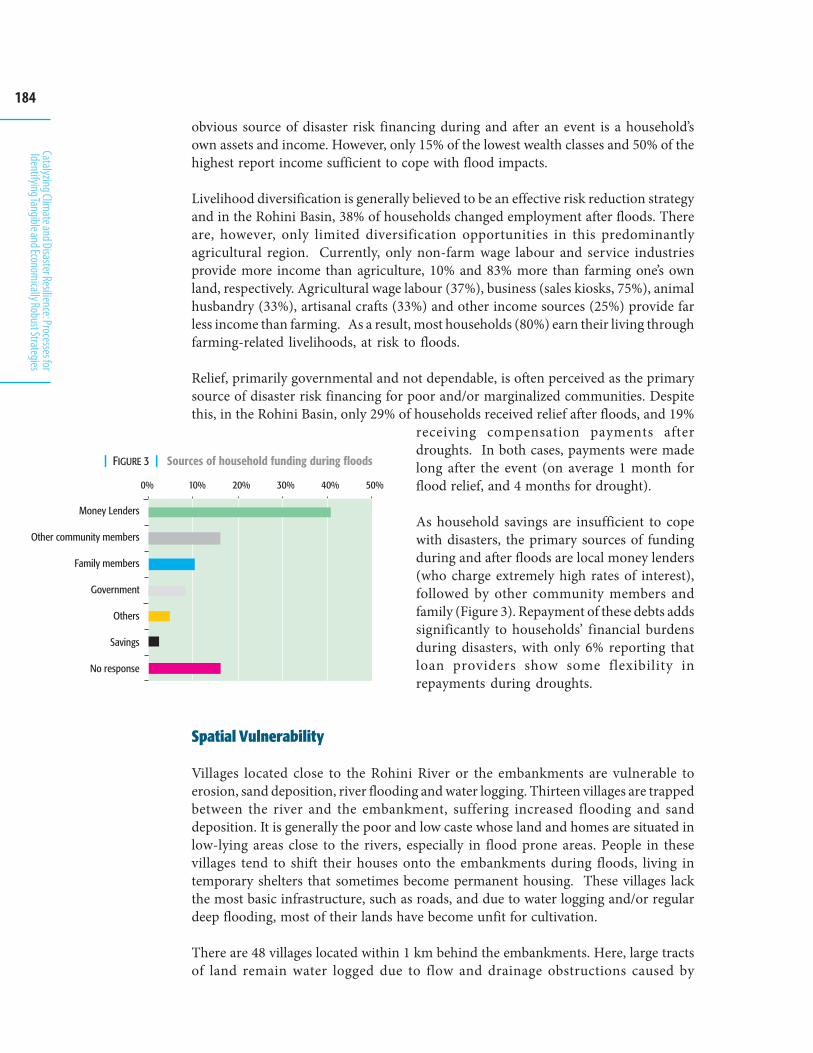
184
Catalyzing Climate and Disaster Resilience: Processes for
Identifying Tangible and Economically Robust Strategies
obvious source of disaster risk financing during and after an event is a household’sown assets and income. However, only 15% of the lowest wealth classes and 50% of thehighest report income sufficient to cope with flood impacts.
Livelihood diversification is generally believed to be an effective risk reduction strategyand in the Rohini Basin, 38% of households changed employment after floods. Thereare, however, only limited diversification opportunities in this predominantlyagricultural region. Currently, only non-farm wage labour and service industriesprovide more income than agriculture, 10% and 83% more than farming one’s ownland, respectively. Agricultural wage labour (37%), business (sales kiosks, 75%), animalhusbandry (33%), artisanal crafts (33%) and other income sources (25%) provide farless income than farming. As a result, most households (80%) earn their living throughfarming-related livelihoods, at risk to floods.
Relief, primarily governmental and not dependable, is often perceived as the primarysource of disaster risk financing for poor and/or marginalized communities. Despitethis, in the Rohini Basin, only 29% of households received relief after floods, and 19%
receiving compensation payments afterdroughts. In both cases, payments were madelong after the event (on average 1 month forflood relief, and 4 months for drought).
As household savings are insufficient to copewith disasters, the primary sources of fundingduring and after floods are local money lenders(who charge extremely high rates of interest),followed by other community members andfamily (Figure 3). Repayment of these debts addssignificantly to households’ financial burdensduring disasters, with only 6% reporting thatloan providers show some flexibility inrepayments during droughts.
Spatial Vulnerability
Villages located close to the Rohini River or the embankments are vulnerable toerosion, sand deposition, river flooding and water logging. Thirteen villages are trappedbetween the river and the embankment, suffering increased flooding and sanddeposition. It is generally the poor and low caste whose land and homes are situated inlow-lying areas close to the rivers, especially in flood prone areas. People in thesevillages tend to shift their houses onto the embankments during floods, living intemporary shelters that sometimes become permanent housing. These villages lackthe most basic infrastructure, such as roads, and due to water logging and/or regulardeep flooding, most of their lands have become unfit for cultivation.
There are 48 villages located within 1 km behind the embankments. Here, large tractsof land remain water logged due to flow and drainage obstructions caused by
| FIGURE 3 | Sources of household funding during floods
�����������
�� �����������������
������������
���������
�� �
������
��������
��� ���������������������������� �������������!�������������"��
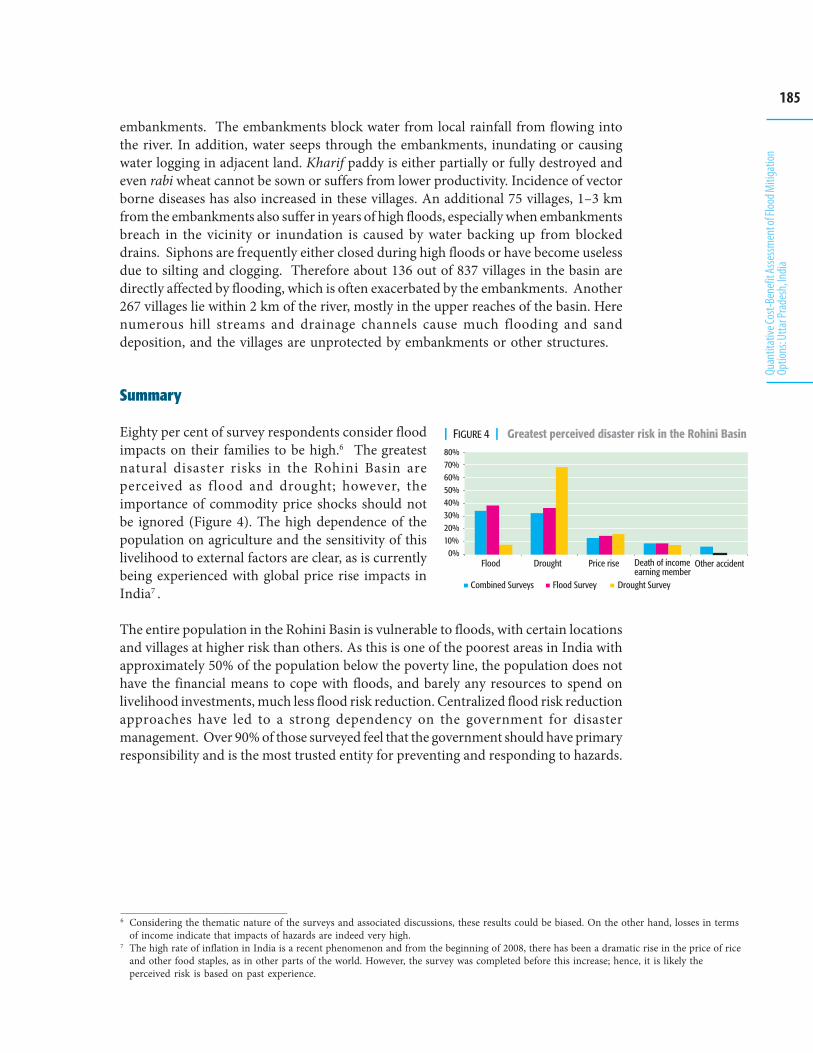
185
Quan
titat
ive Co
st-Be
nefit
Asse
ssmen
t of F
lood M
itiga
tion
Optio
ns: U
ttar P
rade
sh, In
dia
embankments. The embankments block water from local rainfall from flowing intothe river. In addition, water seeps through the embankments, inundating or causingwater logging in adjacent land. Kharif paddy is either partially or fully destroyed andeven rabi wheat cannot be sown or suffers from lower productivity. Incidence of vectorborne diseases has also increased in these villages. An additional 75 villages, 1–3 kmfrom the embankments also suffer in years of high floods, especially when embankmentsbreach in the vicinity or inundation is caused by water backing up from blockeddrains. Siphons are frequently either closed during high floods or have become uselessdue to silting and clogging. Therefore about 136 out of 837 villages in the basin aredirectly affected by flooding, which is often exacerbated by the embankments. Another267 villages lie within 2 km of the river, mostly in the upper reaches of the basin. Herenumerous hill streams and drainage channels cause much flooding and sanddeposition, and the villages are unprotected by embankments or other structures.
Summary
Eighty per cent of survey respondents consider floodimpacts on their families to be high.6 The greatestnatural disaster risks in the Rohini Basin areperceived as flood and drought; however, theimportance of commodity price shocks should notbe ignored (Figure 4). The high dependence of thepopulation on agriculture and the sensitivity of thislivelihood to external factors are clear, as is currentlybeing experienced with global price rise impacts inIndia7 .
The entire population in the Rohini Basin is vulnerable to floods, with certain locationsand villages at higher risk than others. As this is one of the poorest areas in India withapproximately 50% of the population below the poverty line, the population does nothave the financial means to cope with floods, and barely any resources to spend onlivelihood investments, much less flood risk reduction. Centralized flood risk reductionapproaches have led to a strong dependency on the government for disastermanagement. Over 90% of those surveyed feel that the government should have primaryresponsibility and is the most trusted entity for preventing and responding to hazards.
| FIGURE 4 | Greatest perceived disaster risk in the Rohini Basin
�� ��������������� #��� � $������ #��� ��%�������������������
&�������������������������������������������#��� �������
'��(��)��"��!�� ������������
6 Considering the thematic nature of the surveys and associated discussions, these results could be biased. On the other hand, losses in termsof income indicate that impacts of hazards are indeed very high.
7 The high rate of inflation in India is a recent phenomenon and from the beginning of 2008, there has been a dramatic rise in the price of riceand other food staples, as in other parts of the world. However, the survey was completed before this increase; hence, it is likely theperceived risk is based on past experience.
186
Catalyzing Climate and Disaster Resilience: Processes for
Identifying Tangible and Economically Robust Strategies
Community to Policy Context
Recognizing the intensive and negative impacts of floods in the Rohini Basin, andelsewhere in India, various organizations and agencies have developed strategies andactions to reduce flood risk. Some involve national-level policy and institutionaldevelopment, while others specifically target communities and households at risk. Inmost cases, programmes have been developed in response to flood hazards and impacts,as opposed to addressing the underlying factors such as poverty and marginalizationthat contribute to risk and vulnerability.
Flood Risk Reduction Programmes
Initiatives of the Government of India (GoI)The 2005 Disaster Management Act guides national government risk reductionactivities. This Act represented a paradigm shift from an approach of “disaster relief ”
to a more proactive strategy of prevention, mitigation andpreparedness. A National Disaster Management Authority(NDMA) was constituted as the apex body under the Ministryof Home Affairs (MHA) for establishing policies, plans andguidelines for disaster management, particularly of centralgovernment ministries and departments. The Prime Ministerchairs the NDMA, and corollary state (SDMA) and District(DDMA) level authorities also have high-level leadership, chairedby a Chief Minster and District Magistrate, respectively.
In the Eleventh Plan8 of the Government of India, INR 80 billionhave been allocated for flood management (Government ofIndia, 2008). After extensive consultations with a wide range ofstakeholders, the NDMA recently issued guidelines for floodmanagement (NDMA, 2008) to assist government bodies, fromnational to district levels, to develop flood management plans.The guidelines outline both structural and non-structural
BOX 1Responsibilities of the NDMA
• Approve plans of central government ministries/departments as per the national plan.
• Establish guidelines for SDMAs for drawing stateAction Plans,
• Establish guidelines for central governmentministries/departments for integrating, preventionand mitigation measures as part of theirdevelopmental plan and projects,
• Coordinate enforcement and implementation ofpolicy and plan for disaster management,
• Recommend provision of funds for disastermanagement, and
• Establish policies and plans for National Institute ofDisaster Management (NIDM) which is mandatedwith research, capacity building and creation ofinformation repository on disaster management.
8 The Indian Government issues plans for the Indian economy on a five-year basis. They are currently on the 11th five year economic plan.
187
Quan
titat
ive Co
st-Be
nefit
Asse
ssmen
t of F
lood M
itiga
tion
Optio
ns: U
ttar P
rade
sh, In
dia
measures for flood management. Structural measures include embankments, drainageand channel improvement, while non-structural measures include flood plain zoning,flood proofing of public utility structures such as hospitals, early warning and adoptionof integrated water resources management (IWRM). The guidelines also highlightbuilding capacities and raising awareness of various stakeholders.
Uttar Pradesh was one of the initial states to implement the Act (third after Gujaratand Madhya Pradesh), constituting the SDMA and DDMAs. However, state floodmanagement in Uttar Pradesh continues to concentrate on the structural measures ofembankments and siphons for drainage, and relief programmes. The Central WaterCommission (CWC) has begun issuing early warnings of floods based on inflows toreservoirs. However, these forecasts are based on manual observation, i.e. rivergaugestations, which do not function effectively during floods and are of insufficient numberto adequately gauge probable flood inflows to the reservoirs. As a result, the CWCoften releases water suddenly from the reservoirs, causing floods in downstream areas.
In the past, several committees, high-level working groups and task forces9 have beenappointed to investigate flooding problems and suggest remediation measures.Unfortunately, few of the recommendations have been implemented, due to a range ofsocial, financial, administrative and political reasons. The main areas identified foraction requiring compliance by the Government of Uttar Pradesh (GoUP) are:
Undertaking realistic and scientific assessments of flood damage at basin or sub-basin levels (the reported damage data by GoUP currently is not by basin or sub-basin).Assessment of existing and future flood control measures, including collection ofquantitative data on performance and long-term socio-economic conditions.(GoUP has accepted the recommendations to perform such studies).Flood plain zoning be legislated and enforced.Water storage as part of flood management, including flood space in reservoirs tothe extent feasible against competing uses of irrigation and hydropower. (GoUPhas agreed to this recommendation).Funds made available for construction and maintenance of structural measures.(A lack of funds has led to poor maintenance in Uttar Pradesh)Implementation of flood proofing measures such as raising villages andconstruction of appropriate flood shelters. (The performance of GoUP has notbeen satisfactory).
Overall, the Government of India has renewed its efforts to mainstream floodmanagement in development initiatives. It has developed stronger mechanisms forcoordination (including monitoring and review) amongst central ministries/departments and state governments. It has also stepped up scientific assessments offlood risk using advanced modelling, remote sensing and GIS and of the performance
9 Policy statement, 1954; High Level Committee on Floods, 1957; Policy statement, 1958; Ministers’ Committee on Flood Control, 1964;Working Group on Flood Control for Five-Year Plans; Rashtriya Barh Ayog, 1980; Pritam Singh Committee Report, 1980; Report of FloodManagement in the States of Bihar, Uttar Pradesh, West Bengal and Orissa, 1988; Regional Task Forces, 1996; Expert Group on FloodManagement in Uttar Pradesh and Bihar, 1999; Report of the Committee on Silting of Rivers in India, 2002; Expert Committee to ReviewRecommendations of Rashtriya Barh Ayog, 2003; and, the Task Force on Flood Management/ Erosion Control, 2004.
188
Catalyzing Climate and Disaster Resilience: Processes for
Identifying Tangible and Economically Robust Strategies
of flood control measures. However, political, social, administrative and financialchallenges continue to constrain the implementation of flood management plans atstate levels.
Programmes of other organizations/agencies
The United Nations (UN) systemThe United Nations in India has dedicated resources to disaster risk reduction. Thishas included incorporating disaster risk reduction into the Millennium DevelopmentGoal (MDG) plans; developing analytical tools for identifying vulnerable groups andtargeting development cooperation funds; and addressing the underlying factorscontributing to disaster impacts. A flagship initiative is the UNDP Disaster RiskManagement (UNDP-DRM) programme described in Box 2.
International humanitarian organizationsOrganizations such as the Indian Red Cross Society,OXFAM, CARE-India, CARITAS-India, ChristianAid, World Vision India, CASA and ECHO providedisaster aid in the flood affected areas of UttarPradesh. These relief agencies supply food, clothing,and medicine, and increasingly are supportingpreparedness programmes. However, most of theseinitiatives do not yet link to long-term developmentprogrammes.
Private sectorAlthough private sector organizations areincreasing support to disaster managementactivities nationally, this private support remainslimited in Uttar Pradesh. In addition, they havefocused primarily on emergency relief, recovery, andreconstruction, but not on addressing underlyingcauses of risk. ICICI Lombard and TATA AIG haveprovided general crop insurance. There is potentialfor the business sector to invest in monitoring andsurveillance of hazards through promotion of
technologies (such as cell phones) as well as mechanisms for sharing risk (such asinsurance).
Details of other people centered flood risk reduction strategies at the individual andcommunity levels are discussed in the section “Evaluating Tradeoffs”.
Disjuncture between Institutions and Communities
A number of challenges exist, however, with current disaster risk reduction and floodmanagement activities. One prominent issue is the lack of inter-sectoral coordinationamong the various government agencies/departments involved in different aspects of
BOX 2 GoI-UNDP Disaster Risk Management (DRM) Programme
A comprehensive programme to reduce vulnerability to all types ofhazards is being implemented in 169 districts in 17 multi-hazard pronestates, including Uttar Pradesh, with assistance from UNDP, USAID andthe European Union. The project has implemented prevention andmitigation measures and preparedness for rapid response to disasters,and focused on building the capabilities of communities, voluntaryorganizations and government functionaries at all levels.
The project is assisting Uttar Pradesh (and other states) to developstate, district and block level disaster management plans. Villagedisaster management plans are being developed in conjunction withthe Panchayati Raj Institutions, or PRIs (local governing bodies). TheUNDP-DRM programme is training institutions and disastermanagement teams consisting of village volunteers in preparednessand response such as search and rescue, first aid, relief coordination,and shelter management; establishing multi-hazard resistantEmergency Operation Centres at state and district levels; and trainingmasons, engineers and architects in disaster resistant technologies andconstruction.
The programme seeks to institutionalize DRM planning andinterventions widely throughout the country, thereby reducingvulnerability and ultimately make disaster prevention and mitigation apart of normal day-to-day life.
189
Quan
titat
ive Co
st-Be
nefit
Asse
ssmen
t of F
lood M
itiga
tion
Optio
ns: U
ttar P
rade
sh, In
dia
flood management, which is hindered by a lack of communication and competitionfor budgetary allocations. For example, the state irrigation department constructsand maintains flood control and drainage projects, while central agencies managerain and discharge observation stations. Each department follows its own independentagenda without consideration of how its activities may affect those of otherdepartments, or influence flood management. Also, administrative and physicalboundaries do not match. Flood management must be at the river basin level, butmost major basins fall within many different administrative boundaries. Thus, mostactions directly concerned with floods are designed and implemented at theadministrative level, but their implications are felt at the basin level.
While there appears to be flood risk reduction efforts at many different levels, it is notclear if these are meeting the needs of those most vulnerable, i.e. poor and marginalizedpeople at high risk to flood impacts. Top-down programmes often are driven by theassumption that broad based risk reduction and/or economic growth will contributeto the resilience of individual households, which may or may not be the case. Instead,there appears to be a disjuncture between community needs and governmentprogrammes. While a cross-sectoral approach is required to address the basic needsof communities in flood prone areas, especially on issues of communications andlivelihood resilience, government flood management plans generally do not focus onthe entire gamut of needs and potential interventions. Livelihood promotion, with thepotential to address the root cause of flood vulnerability, is often not considered bygovernmental agencies.
Most rural development activities are designed at the national-level and commonacross the country, thus lacking mechanisms to respond to local contexts andspecificities. There are no locale-specific features for flood prone areas. Furthermore,despite the requirement for participatory bottom-up planning approaches whenpreparing official disaster management plans, this is rarely realized in practice, due toconstraints in budgets and capacities. As noted by Dr. NC Saxena, Former Secretary,Planning Commission (GoI):
The local governing bodies, the Panchayati Raj Institutions (PRIs), have beenunderutilized and completely left out of planning and implementation of mostgovernment initiatives for disaster management. While concerns have been raisedabout their limited capacities, there is an urgent need to involve PRIs in environmentalgovernance (Ramakrishnan et al., 2002).
The other implication of sectoral scheme orientation is that the conceptof district planning has remained a non-starter, despite several effortssince the V Plan period to operationalize it. The fact that states havelittle discretionary funds to allocate to the districts and most planfunds to the districts originate from the central Ministries have furtherworsened prospects for decentralized multi-sectoral planningemerging out of the felt needs of the local bodies and the people.10
10 N.C. Saxena’s inputs on Solution Exchange (an egroup run by UNDP, New Delhi)
190
Catalyzing Climate and Disaster Resilience: Processes for
Identifying Tangible and Economically Robust Strategies
Community mobilization and capacity building require a strong network of NGOswith a long-term focus on development. In the Rohini Basin, however, very few NGOsoperate in flood-affected areas and those that are present primarily provide disasterrelief, rather than focusing on risk resilient development. Furthermore, long-termprogrammes require substantial resources and time that the few locally operatingNGOs cannot currently provide.
Identifying Flood Risk Reduction Strategies
The reviewed vulnerabilities and disjunctures in current flood risk reduction effortsprovided insight in identifying disaster risk reduction strategies in the Rohini Basin.Specific different risk reduction approaches for evaluation were identified and selectedthrough shared learning dialogues with various community stakeholders. Thetraditional highly centralized and hierarchical (in terms of decision-making andimplementation processes) strategy to control rivers through embankments wasanalyzed for its past as well as projected future economic performance. A contrastingdecentralized and more egalitarian “people centered” basket of interventions, wasalso analyzed. Interventions in this strategy at the household, community and widersocietal level that were evaluated included:
At the individual level:
raising of house plinths,raising of fodder storage units,a water and sanitation package (rainwater harvesting, raising existing privatehandpumps, toilets).
At the community level:
an early warning system,raising community handpumps and toilets,building of village flood shelters,establishing community grain banks,establishing community seed banks,local maintenance of key drainage bottlenecks,development of self help groups, andpurchasing of community boats.
At the societal level:
promotion of flood adapted agriculture (pre-flood cultivation, deep water crops,post-flood cultivation)strengthening overall health care system (immunization of people and livestock,distribution of mosquito nets, increased access to medical services)
191
Quan
titat
ive Co
st-Be
nefit
Asse
ssmen
t of F
lood M
itiga
tion
Optio
ns: U
ttar P
rade
sh, In
dia
Evaluating Tradeoffs
Qualitative Analysis
The qualitative evaluation aimed to better understand diversity within the basin andassess the varied impacts of existing and potential disaster risk reduction strategies atdifferent locations. The quantitative analysis (reviewed later), driven by stochasticcost-benefit analysis, viewed the basin as a single homogenous “community.” Littleattempt was made to capture distributional aspects of who “benefits” and who “pays”.The qualitative evaluation explored these issues, as well as the finer nuances of theperceptions of diverse stakeholders, disaster risk reduction efforts at the local level,and local capacity to adapt. Non-quantifiable elements like issues related to equityand gender, as well as historical perspectives, also are better understood throughqualitative methods.
Methods used were focus group discussions (FGDs) with various groups (small andbig farmers, women) and key informant interviews with panchayat leaders and villageelders. At least two FGDs were conducted in each selected village, not only with differentsocial and economic groups, but also at different locations to understand howvulnerability varied within the villages. Social and resource maps, as well as seasonalitycharts, were created in collaboration with villagers, and transect walks implemented.Care was taken to include one woman in each team of researchers to facilitate thecapture of women’s perspectives.
EmbankmentsAt present the entire reach of the Rohini River—from its confluence with the Piyas toits junction with the Rapti—has been surrounded either by river embankments orroads. While these 113 km of embankments provide some protection to the area, theyalso contribute to adverse impacts. As more embankments were added, drainagecongestion increased and the basin continues to experience disastrous floods.Embankment breaches, due to limitations in design and poor maintenance, haveexacerbated floods. The nature of floods has changed with this artificial re-structuringof the basin: floods come suddenly and with force (especially when embankmentsbreach), their duration and intensity has increased, and heavier sand rather than finesilt is deposited in the flooded areas.11 The change in river regime has also led to

192
Catalyzing Climate and Disaster Resilience: Processes for
Identifying Tangible and Economically Robust Strategies
changes in habitation (newer tolas–small clusters of habitations–have developed closerto the river) and in cropping patterns (kharif paddy is now grown in areas protectedby embankments), which have further increased the risk to people living in the area.The impacts of floods are different depending on location within the basin. Table 7summarizes local perceptions about flood impacts and embankments of villageslocated at varying distances from embankments. More detailed discussion ofviewpoints in each area follows.
The livelihoods and agriculture of villages trapped between the river and embankmentshave been completely destroyed. While only a few villages along the Rohini River fallin this category as the embankments are not very far from the river and most villageshave shifted to other locations, in the case of the Kosi River, about two million peopleremain trapped between the embankments and the river (Mishra, 2008a).Embankments constrict floods to smaller cross-sectional areas, resulting in higher
| TABLE 7 | Perceptions about flood impacts and embankments
Location of village
Villages trapped between theriver and embankments
Stretches where there are noembankments
Villages close to the river(within 3 kilometres) andbehind embankments
Villages living far (more than 3to 4 km) from theembankments
Upper reaches of the basin,especially in the area betweenthe Rohini and Piyas Rivers,where there are noembankments
Confluence of streams andrivers
Impacts
Higher and longer duration floods;agriculture completely destroyed; sanddeposition; shifting of housespermanently or temporary
Higher and longer duration floods;sand deposition in some places andgood silt deposit in others; no kharifcrop, except early variety; constantdanger to life and property duringflood
Acreage under paddy crop increaseddue to protection; increase in waterlogged area; no silt, hence decline inland productivity; increase in vectorborne disease; bad sanitation; largedamage to life and property whenembankments breach
No major impact except in villagesclose to a drainage channel; there isbackflow in these channels because ofthe obstruction by embankmentscausing higher floods, water logging
Flash floods and sudden change incourse of rivers; sand deposition
Higher and longer floods; water-logging problem serious; completedestruction of life and assets whenembankments breach; unprotectedvillages suffer
Perception about embankments
Embankments should be shiftedcloser to the river so that theirvillages also get protection
Embankments should be built toprotect their villages
Embankments should be maintainedproperly and drainage siphonsconstructed for water to drain offquickly
No apparent concerns aboutembankments
Some protection (embankments andspurs) should be provided
Strengthening of embankments andconstruction of drainage mechanisms(siphons)
11 The recent floods in north Bihar due to breaches in Kosi River embankments are a testimony to the devastation that can be caused byembankment failures (Mishra, 2008 b).
193
Quan
titat
ive Co
st-Be
nefit
Asse
ssmen
t of F
lood M
itiga
tion
Optio
ns: U
ttar P
rade
sh, In
dia
water levels. Trapped villages are submerged completely, standing crops destroyed,agricultural lands suffer sand deposition, and houses collapse. This occurs almostevery year, even during “normal” flood years.
Most villagers have shifted their houses to safer locations, primarily on top of theembankments. They seek alternative livelihoods to cover the losses from abnormalfloods. In the two tolas of Sona Tikar, the people were rehabilitated after the floods of1984: each household received about 3 decimals (roughly 0.012 ha)12 of homesteadland elsewhere. But most of their agricultural land remains uncultivable due to sanddeposition or water logging. Further, the health and sanitation conditions in thesevillages (or in the new locations over the embankment) are poor due to an absence oflatrines, proper drinking water supply and water logging. These problems becomeworse during and after floods.
Strikingly, the people in these villages want the embankments shifted closer to the river sothat their land and habitation is protected from river floods. This is not very surprisingconsidering the disproportionate dependence of the majority of the households onagriculture, and an absence of alternate livelihoods and places for rehabilitation.
Embankments may cause higher and more destructive floods in stretches where thereare no embankments. For example, the two tolas of Aaraji and Suvain on the rightbank of the river suffer because of embankments on the opposite side. Last yeartemporary spurs constructed on the left bank to prevent bank erosion—althoughsaving habitation on that side—diverted floods to the right bank, leading to thedestruction of the two tolas. Though they have permanently shifted their huts andkuccha houses on top of the embankments, most of their agricultural land isuncultivable due to sand deposition. Rehabilitation requires high investment in orderto level the land, which the inhabitants cannot afford, nor would it be worthwhile dueto continued flood risk. Some villages do not even have high ground to take shelterduring floods; they move with their valuables and some necessities to other locations(roads, relatives in other villages, etc.). Poverty levels are higher in these locations,evident in the prevalent housing construction (mostly kuchha).
Sanitation in these villages is poor, becoming even worse during and after floods. Theonly places to defecate above water level are the embankments and road, and these arethe places where they live. A lack of privacy and security makes it more difficult forwomen. Potable drinking water is limited during floods.
The people in these villages want the embankments on their side of the river to be extendedfurther upstream so that they too are protected from river floods. Additionally theydesire better roads and drinking water. They feel the government should not onlycompensate them for house damage, but also build pukka houses for them. Further, theycomplained that because of their relative inaccessibility during floods, they do not receiverelief.
12 A decimal (also spelled decimel) is an obsolete unit of area in India and Bangladesh approximately equal to 1/100 acre (40.46 m ). Aftermetrication in the mid-20th century by both countries, the unit became obsolete.
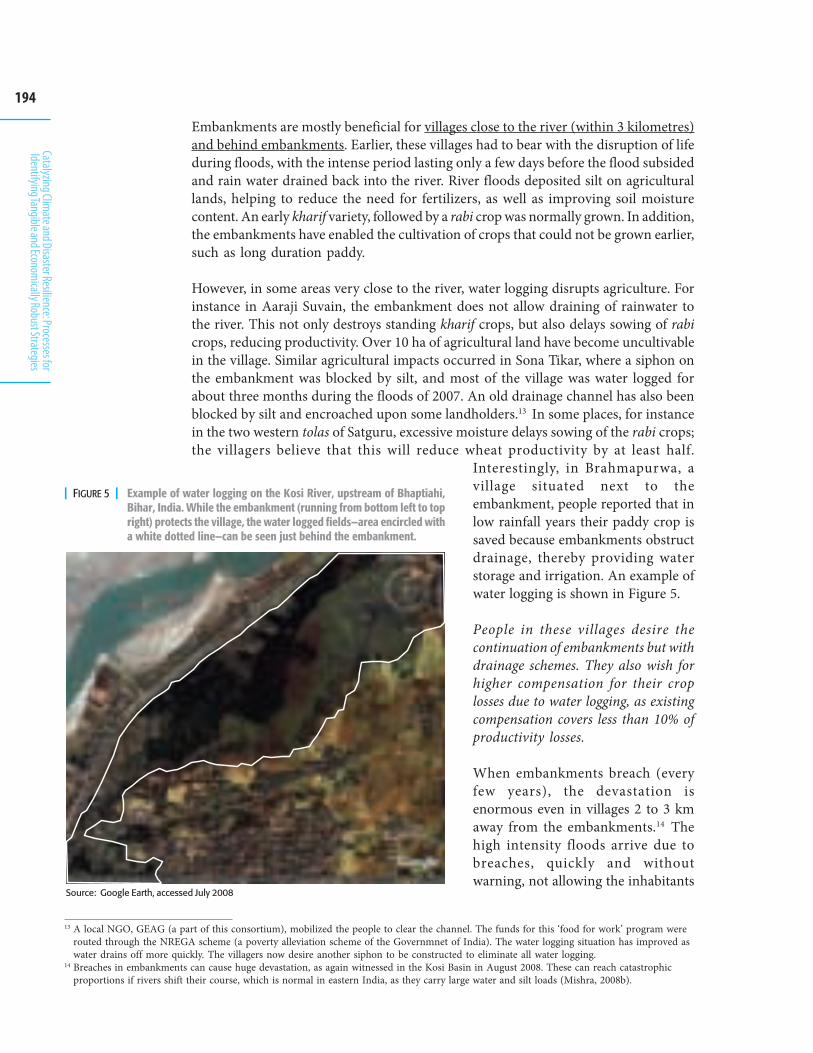
194
Catalyzing Climate and Disaster Resilience: Processes for
Identifying Tangible and Economically Robust Strategies
Embankments are mostly beneficial for villages close to the river (within 3 kilometres)and behind embankments. Earlier, these villages had to bear with the disruption of lifeduring floods, with the intense period lasting only a few days before the flood subsidedand rain water drained back into the river. River floods deposited silt on agriculturallands, helping to reduce the need for fertilizers, as well as improving soil moisturecontent. An early kharif variety, followed by a rabi crop was normally grown. In addition,the embankments have enabled the cultivation of crops that could not be grown earlier,such as long duration paddy.
However, in some areas very close to the river, water logging disrupts agriculture. Forinstance in Aaraji Suvain, the embankment does not allow draining of rainwater tothe river. This not only destroys standing kharif crops, but also delays sowing of rabicrops, reducing productivity. Over 10 ha of agricultural land have become uncultivablein the village. Similar agricultural impacts occurred in Sona Tikar, where a siphon onthe embankment was blocked by silt, and most of the village was water logged forabout three months during the floods of 2007. An old drainage channel has also beenblocked by silt and encroached upon some landholders.13 In some places, for instancein the two western tolas of Satguru, excessive moisture delays sowing of the rabi crops;the villagers believe that this will reduce wheat productivity by at least half.
Interestingly, in Brahmapurwa, avillage situated next to theembankment, people reported that inlow rainfall years their paddy crop issaved because embankments obstructdrainage, thereby providing waterstorage and irrigation. An example ofwater logging is shown in Figure 5.
People in these villages desire thecontinuation of embankments but withdrainage schemes. They also wish forhigher compensation for their croplosses due to water logging, as existingcompensation covers less than 10% ofproductivity losses.
When embankments breach (everyfew years), the devastation isenormous even in villages 2 to 3 kmaway from the embankments.14 Thehigh intensity floods arrive due tobreaches, quickly and withoutwarning, not allowing the inhabitants
13 A local NGO, GEAG (a part of this consortium), mobilized the people to clear the channel. The funds for this ‘food for work’ program wererouted through the NREGA scheme (a poverty alleviation scheme of the Governmnet of India). The water logging situation has improved aswater drains off more quickly. The villagers now desire another siphon to be constructed to eliminate all water logging.
14 Breaches in embankments can cause huge devastation, as again witnessed in the Kosi Basin in August 2008. These can reach catastrophicproportions if rivers shift their course, which is normal in eastern India, as they carry large water and silt loads (Mishra, 2008b).
| FIGURE 5 | Example of water logging on the Kosi River, upstream of Bhaptiahi,Bihar, India. While the embankment (running from bottom left to topright) protects the village, the water logged fields—area encircled witha white dotted line—can be seen just behind the embankment.
Source: Google Earth, accessed July 2008
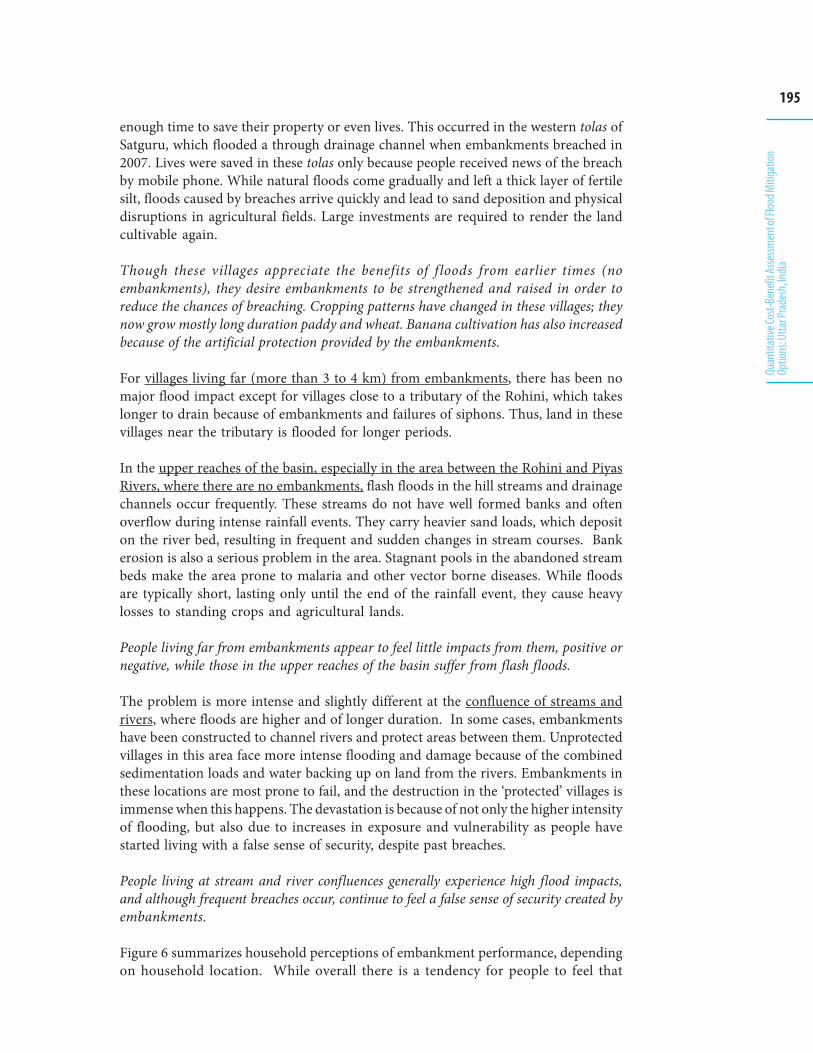
195
Quan
titat
ive Co
st-Be
nefit
Asse
ssmen
t of F
lood M
itiga
tion
Optio
ns: U
ttar P
rade
sh, In
dia
enough time to save their property or even lives. This occurred in the western tolas ofSatguru, which flooded a through drainage channel when embankments breached in2007. Lives were saved in these tolas only because people received news of the breachby mobile phone. While natural floods come gradually and left a thick layer of fertilesilt, floods caused by breaches arrive quickly and lead to sand deposition and physicaldisruptions in agricultural fields. Large investments are required to render the landcultivable again.
Though these villages appreciate the benefits of f loods from earlier times (noembankments), they desire embankments to be strengthened and raised in order toreduce the chances of breaching. Cropping patterns have changed in these villages; theynow grow mostly long duration paddy and wheat. Banana cultivation has also increasedbecause of the artificial protection provided by the embankments.
For villages living far (more than 3 to 4 km) from embankments, there has been nomajor flood impact except for villages close to a tributary of the Rohini, which takeslonger to drain because of embankments and failures of siphons. Thus, land in thesevillages near the tributary is flooded for longer periods.
In the upper reaches of the basin, especially in the area between the Rohini and PiyasRivers, where there are no embankments, flash floods in the hill streams and drainagechannels occur frequently. These streams do not have well formed banks and oftenoverflow during intense rainfall events. They carry heavier sand loads, which depositon the river bed, resulting in frequent and sudden changes in stream courses. Bankerosion is also a serious problem in the area. Stagnant pools in the abandoned streambeds make the area prone to malaria and other vector borne diseases. While floodsare typically short, lasting only until the end of the rainfall event, they cause heavylosses to standing crops and agricultural lands.
People living far from embankments appear to feel little impacts from them, positive ornegative, while those in the upper reaches of the basin suffer from flash floods.
The problem is more intense and slightly different at the confluence of streams andrivers, where floods are higher and of longer duration. In some cases, embankmentshave been constructed to channel rivers and protect areas between them. Unprotectedvillages in this area face more intense flooding and damage because of the combinedsedimentation loads and water backing up on land from the rivers. Embankments inthese locations are most prone to fail, and the destruction in the ‘protected’ villages isimmense when this happens. The devastation is because of not only the higher intensityof flooding, but also due to increases in exposure and vulnerability as people havestarted living with a false sense of security, despite past breaches.
People living at stream and river confluences generally experience high flood impacts,and although frequent breaches occur, continue to feel a false sense of security created byembankments.
Figure 6 summarizes household perceptions of embankment performance, dependingon household location. While overall there is a tendency for people to feel that
196
Catalyzing Climate and Disaster Resilience: Processes for
Identifying Tangible and Economically Robust Strategies "�*���� ���
�����*����
����
+��
'��
(��
)��
"��
!��
��
���
���
���,�������������������
-��.��������/�����*����
������������ �0��*����� ��������*����
�0 �*���� ��������*����
0"�*���� ��������*����
�
1����������������������������2������������������������������2�����
embankments have actually increased flooding, perceptions depend heavily on theindividual experiences and location.
Embankments have changed not only the nature of floods but also the manner inwhich people live in the region. While in some areas, embankments certainly provideflood protection, this often is negated by water logging and drainage congestion inlarge areas, rendering agricultural land uncultivable. In embankment ‘protected’ areas,people feel a sense of security that has led them to change their lifestyle and agriculturalpractices, increasing their exposure and vulnerability. However, past experience hasdemonstrated that this protection is not guaranteed and the devastation caused in‘protected’ areas after breaches or overflows likely cancels out any benefits.Furthermore, embankments that provide protection and benefit some areas may comeat the cost of other areas that become more exposed to higher intensity floods anderosion.
While the presence of embankments has led to increased acreage of higher value cropsand thus increased incomes, this has been negated by increases in fallow land due towater logging. Water logging has also led to a higher incidence of vector borne diseases,increasing health expenditure.
People centered flood risk reductionGovernments and NGOs in flood prone areas have also implemented decentralizedand non-structural flood risk reduction measures. The effectiveness and reach of someof these were evaluated through qualitative methods with the villages.
NGO facilitated risk reduction activitiesWhile there are many NGOs working in this basin on issues such as HIV/AIDS, humantrafficking, education, and women’s empowerment, very few focus specifically on disasters(floods and drought) or sustainable agriculture. Of those NGOs concentrating ondisasters, most focus more on relief than on decentralized risk reduction. A few NGOswork on promoting and demonstrating long-term adaptation activities, but their reach
| FIGURE 6 | Household perceptions of embankment performance, depending on household location(from the survey)
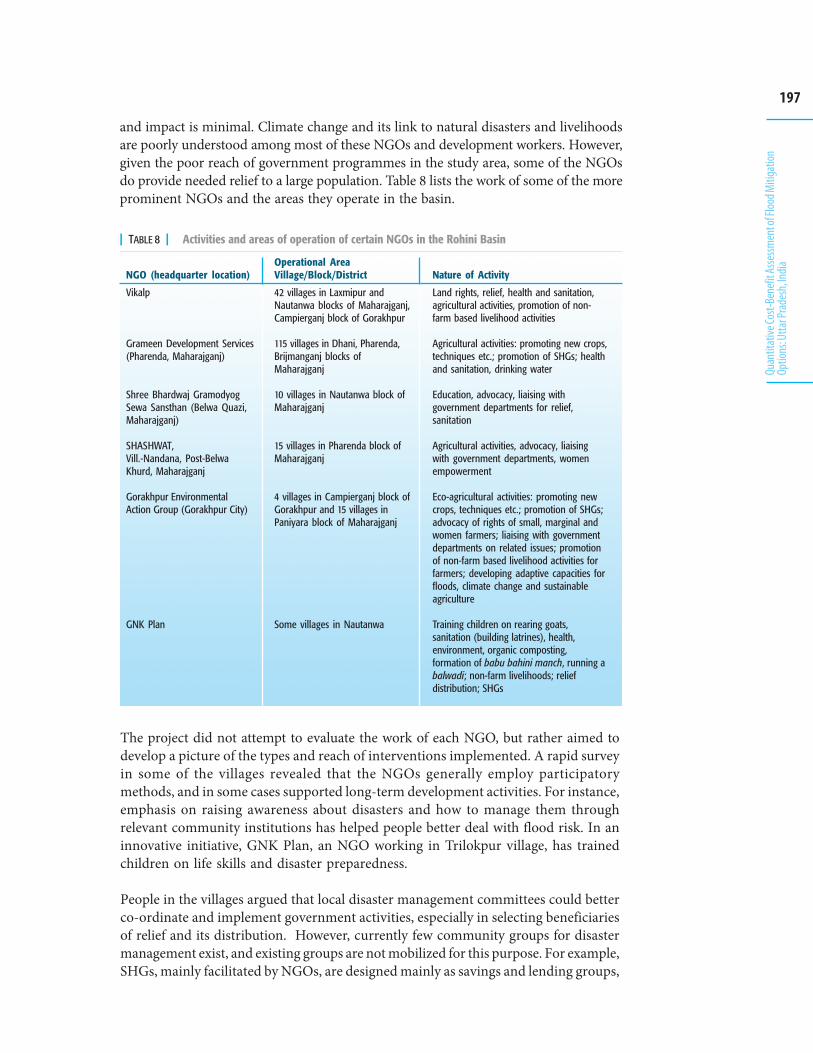
197
Quan
titat
ive Co
st-Be
nefit
Asse
ssmen
t of F
lood M
itiga
tion
Optio
ns: U
ttar P
rade
sh, In
dia
and impact is minimal. Climate change and its link to natural disasters and livelihoodsare poorly understood among most of these NGOs and development workers. However,given the poor reach of government programmes in the study area, some of the NGOsdo provide needed relief to a large population. Table 8 lists the work of some of the moreprominent NGOs and the areas they operate in the basin.
| TABLE 8 | Activities and areas of operation of certain NGOs in the Rohini Basin
NGO (headquarter location)
Vikalp
Grameen Development Services(Pharenda, Maharajganj)
Shree Bhardwaj GramodyogSewa Sansthan (Belwa Quazi,Maharajganj)
SHASHWAT,Vill.-Nandana, Post-BelwaKhurd, Maharajganj
Gorakhpur EnvironmentalAction Group (Gorakhpur City)
GNK Plan
Operational AreaVillage/Block/District
42 villages in Laxmipur andNautanwa blocks of Maharajganj,Campierganj block of Gorakhpur
115 villages in Dhani, Pharenda,Brijmanganj blocks ofMaharajganj
10 villages in Nautanwa block ofMaharajganj
15 villages in Pharenda block ofMaharajganj
4 villages in Campierganj block ofGorakhpur and 15 villages inPaniyara block of Maharajganj
Some villages in Nautanwa
Nature of Activity
Land rights, relief, health and sanitation,agricultural activities, promotion of non-farm based livelihood activities
Agricultural activities: promoting new crops,techniques etc.; promotion of SHGs; healthand sanitation, drinking water
Education, advocacy, liaising withgovernment departments for relief,sanitation
Agricultural activities, advocacy, liaisingwith government departments, womenempowerment
Eco-agricultural activities: promoting newcrops, techniques etc.; promotion of SHGs;advocacy of rights of small, marginal andwomen farmers; liaising with governmentdepartments on related issues; promotionof non-farm based livelihood activities forfarmers; developing adaptive capacities forfloods, climate change and sustainableagriculture
Training children on rearing goats,sanitation (building latrines), health,environment, organic composting,formation of babu bahini manch, running abalwadi; non-farm livelihoods; reliefdistribution; SHGs
The project did not attempt to evaluate the work of each NGO, but rather aimed todevelop a picture of the types and reach of interventions implemented. A rapid surveyin some of the villages revealed that the NGOs generally employ participatorymethods, and in some cases supported long-term development activities. For instance,emphasis on raising awareness about disasters and how to manage them throughrelevant community institutions has helped people better deal with flood risk. In aninnovative initiative, GNK Plan, an NGO working in Trilokpur village, has trainedchildren on life skills and disaster preparedness.
People in the villages argued that local disaster management committees could betterco-ordinate and implement government activities, especially in selecting beneficiariesof relief and its distribution. However, currently few community groups for disastermanagement exist, and existing groups are not mobilized for this purpose. For example,SHGs, mainly facilitated by NGOs, are designed mainly as savings and lending groups,
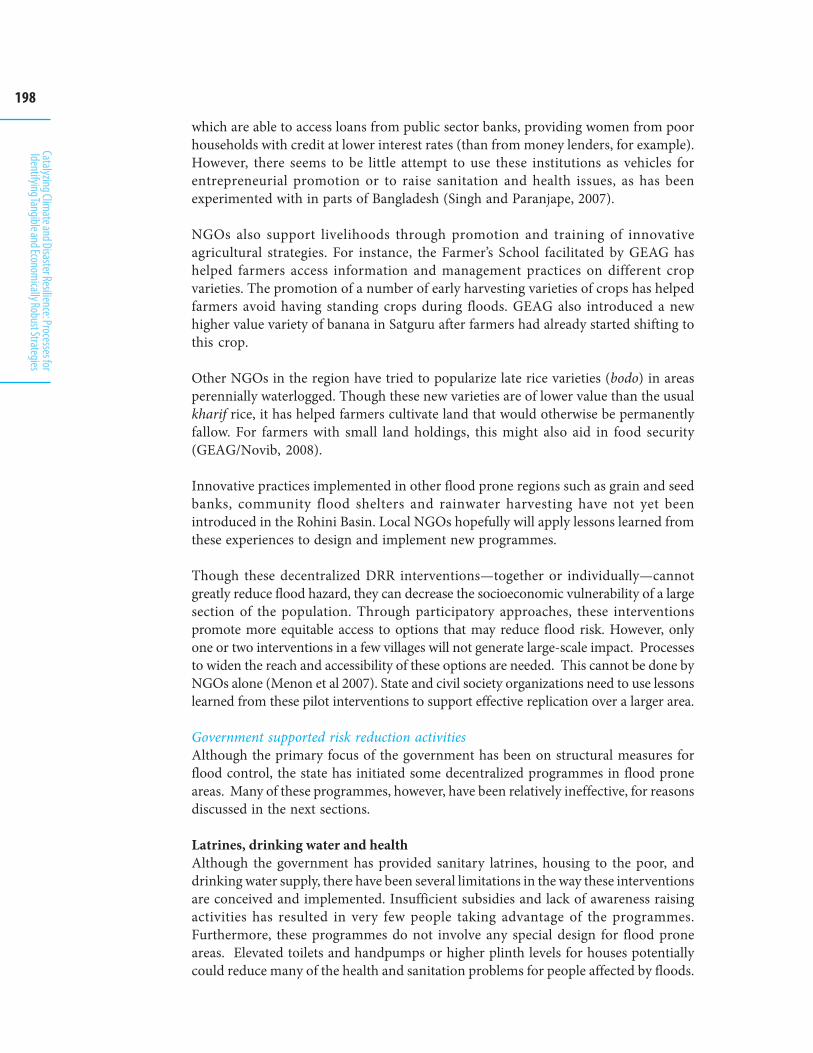
198
Catalyzing Climate and Disaster Resilience: Processes for
Identifying Tangible and Economically Robust Strategies
which are able to access loans from public sector banks, providing women from poorhouseholds with credit at lower interest rates (than from money lenders, for example).However, there seems to be little attempt to use these institutions as vehicles forentrepreneurial promotion or to raise sanitation and health issues, as has beenexperimented with in parts of Bangladesh (Singh and Paranjape, 2007).
NGOs also support livelihoods through promotion and training of innovativeagricultural strategies. For instance, the Farmer’s School facilitated by GEAG hashelped farmers access information and management practices on different cropvarieties. The promotion of a number of early harvesting varieties of crops has helpedfarmers avoid having standing crops during floods. GEAG also introduced a newhigher value variety of banana in Satguru after farmers had already started shifting tothis crop.
Other NGOs in the region have tried to popularize late rice varieties (bodo) in areasperennially waterlogged. Though these new varieties are of lower value than the usualkharif rice, it has helped farmers cultivate land that would otherwise be permanentlyfallow. For farmers with small land holdings, this might also aid in food security(GEAG/Novib, 2008).
Innovative practices implemented in other flood prone regions such as grain and seedbanks, community flood shelters and rainwater harvesting have not yet beenintroduced in the Rohini Basin. Local NGOs hopefully will apply lessons learned fromthese experiences to design and implement new programmes.
Though these decentralized DRR interventions—together or individually—cannotgreatly reduce flood hazard, they can decrease the socioeconomic vulnerability of a largesection of the population. Through participatory approaches, these interventionspromote more equitable access to options that may reduce flood risk. However, onlyone or two interventions in a few villages will not generate large-scale impact. Processesto widen the reach and accessibility of these options are needed. This cannot be done byNGOs alone (Menon et al 2007). State and civil society organizations need to use lessonslearned from these pilot interventions to support effective replication over a larger area.
Government supported risk reduction activitiesAlthough the primary focus of the government has been on structural measures forflood control, the state has initiated some decentralized programmes in flood proneareas. Many of these programmes, however, have been relatively ineffective, for reasonsdiscussed in the next sections.
Latrines, drinking water and healthAlthough the government has provided sanitary latrines, housing to the poor, anddrinking water supply, there have been several limitations in the way these interventionsare conceived and implemented. Insufficient subsidies and lack of awareness raisingactivities has resulted in very few people taking advantage of the programmes.Furthermore, these programmes do not involve any special design for flood proneareas. Elevated toilets and handpumps or higher plinth levels for houses potentiallycould reduce many of the health and sanitation problems for people affected by floods.
199
Quan
titat
ive Co
st-Be
nefit
Asse
ssmen
t of F
lood M
itiga
tion
Optio
ns: U
ttar P
rade
sh, In
dia
This requires not only higher subsidies for people living in flood prone areas, but alsoa change of the mindset of both policy makers and implementers.
Some government programmes have limited reach because of standard problems ofdelivery through a large bureaucracy. For instance, although budgets exist, villagesoften do not have access to health care. In Brahmapurwa, a village of extremely poorhouseholds seriously affected by floods and water logging, no health camps wereorganized and the nearest primary health centre was 15 km away.
Key weaknesses in these government programmes are insufficient subsidies, lack oftransparency in delivery, and limited reach. The same set of challenges plaguesagricultural extension services, although state scientific and agricultural researchinstitutes invest in the development of improved varieties of crops that give higheryields and are more resilient in flood conditions.
ReliefRelief during and after floods is helpful if appropriate quantities of quality materialare delivered quickly. However, this rarely occurs in the Rohini Basin, particularlywith relief distributed by the government. Assessing the extent and level of damage,selecting beneficiaries and distributing relief are the responsibility of the revenue branchof the district administration. However, the process becomes delayed due tobureaucratic processes at local and district levels.
Key issues that arose during the evaluation of relief include:
i. Lack of representation of the panchayat or civil society in any stage of the assessmentor distribution. As a result, relief seldom reaches those most in need,
ii. Extensive time required delays arrival of relief. For example, one may have to opena bank account just to receive relief in the amount of 1 USD,
iii. The high level of poverty in the Rohini Basin has already stressed existing budgets,hence funds available at times of disaster are less than that required, and
iv. State level politicians often use their clout to have their electoral constituencydeclared as “disaster affected”. Because of this, the most affected areas in need ofsupport—but politically weak and under-represented—are unable to obtainassistance.
Early warningThough public early warning mechanisms such as flood forecasts exist, these frequentlydo not reach local populations because of inadequate communication or translationof this information in formats accessible to local villages. Alternatively, private warningsof impending disasters have been facilitated by the popularity. For instance, somepeople reported that relatives in the upper part of the basin (Nautanwa) warned themof heavy rainfall and rising water levels. Similarly, people living in the low-lying easterntolas of Satguru (about 2 km from the embankments) received calls from friends livingclose to the river about an embankment breach. This provided them with about anhour to get to a safer location; they were still, however, not able to save many of theirassets.
200
Catalyzing Climate and Disaster Resilience: Processes for
Identifying Tangible and Economically Robust Strategies
Raising homestead landAfter the floods of 1981, the government raised homestead land in villages close to theriver, by as much as 1.8 m in some places. However, during large events such as the2007 flood, this elevation increase was still not enough to rise above the flood watersin many locations. In Manoharchak, floods caused by an embankment breach enteredhomes built on raised land, which was only a small area occupied by houses and cattlesheds. Thus, all cropped areas, including crop nurseries and vegetable gardens, arestill exposed to flooding and water-logging.15 In the Rohini Basin, the total number ofvillages and area of land raised is quite low.
Household flood risk reduction and adaptation activitiesHouseholds employ a number of adaptation and risk reduction activities, which appearnot to be driven by external factors, but rather evolve over a period of time in responseto adversity. Some of the more prominent actions include:
Migration: A cursory look at labour and semi-skilled workers in any urban area innorth and west India will reveal that many come from eastern Indian states like UttarPradesh. In most of the surveyed households in the Rohini Basin, one or more membersmigrate to urban or agricultural rural areas to supplement income. The type ofmigration and its duration is broad: those from higher caste backgrounds or artisanalcastes have better employment prospects in urban areas; those from lower andagriculture-based castes obtain mostly low paying manual work, dependent on theagricultural season.
Rehan is a very common practice in villages in this region. The poor must give land ascollateral when borrowing money. While no interest is charged, the borrower mustgive crops from this land until the debt is paid, or at times work in the field or householdof the lender.
Share-cropping, locally known as adhiya, is not very common as there are not manyfarmers with large land holdings. However, adhiya is very common in goat-rearing: apoor person manages a goat for a better well off person for 1 to 2 years, and they sharethe proceeds when it is sold.
A number of people have raised plinth levels of newly constructed houses. Many feelit is worth the higher cost, and this generally occurs more in villages where peoplehave been able to save. In villages close to the river where the depths of floods arehigher, people do not see any advantage of raising plinths, although some poorhouseholds raise levels of kuccha houses and cattle-sheds. Unlike other flood proneareas, there is no raising of latrines and handpumps in the Rohini Basin.
ConclusionsEmbankments clearly have provided flood protection benefits to some communities,while increasing flood impacts on others. When embankments are constructed, theyblock flood waters from entering low-lying areas that, in natural systems, buffer flood
15 In some parts of Bangladesh enough lands are raised to accommodate houses, latrines, cattle sheds, nurseries and vegetable gardens. Thishas ensured not only the safety of the people, but also protects income generating activities (Singh & Paranjape 2007).
201
Quan
titat
ive Co
st-Be
nefit
Asse
ssmen
t of F
lood M
itiga
tion
Optio
ns: U
ttar P
rade
sh, In
dia
levels by serving as storage areas within the flood plain. As a result, the waters thatwould have been stored in such areas are diverted to any areas that remain unprotected;thus increasing flood levels in those areas. Overall, partial embankment systems createinherent tradeoffs; reduced flooding in protected areas comes at the cost of increasedflooding in those areas that are unprotected. Some communities have even been trappedbetween the river and embankments, rendering them uninhabitable during themonsoon season. Embankments have increased water logging, with local rainfall andtributary flows unable to properly drain. This makes certain areas unusable formonsoon (kharif) crops, and often delays planting of winter (rabi) crops, reducingyields. In some areas, the land has become totally unusable and is now a source ofwaterborne diseases.
The benefit of embankments to households and communities depends on location.Although central agencies bear the costs of embankments (construction and, in theory,maintenance), many communities experience “disbenefits”, or negative impacts. Thecommunities themselves have no input in embankment design or implementation,and are disempowered from decision-making processes.
People-centred flood risk reduction interventions so far are limited in the RohiniBasin. Whether implemented by government, NGOs, SHGs or households themselves,their impacts (in terms of costs and benefits) are difficult to quantify. Theseinterventions contribute to overall resilience, reducing household vulnerability notonly to floods, but also to other economic shocks (droughts, commodity pricefluctuations, etc.). However, these approaches are piece-meal and not coordinatedwithin an integrated flood risk reduction approach.
As the name would suggest, people centered approaches have included more stakeholderinvolvement in their design and implementation. Yet there appears to be a generalinconsistency between those most in need and those able to access benefits. While someprogrammes specifically target the poor and marginalized, others only are accessible tobetter off or well-connected households. Adaptive actions that may reduce risk such aschanging cropping patterns, building more resilient housing, and early warning throughmobile phones, are more accessible to those with resources. Hence, better designedflood risk reduction programmes are needed to reach those who are most in need of thebenefits, but who can pay only very little or none of the costs.
Quantitative Analysis
Cost-benefit analysis was performed to quantitatively evaluate under several potentialchanging climate scenarios, two contrasting flood risk management approaches inthe Rohini Basin, based on existing as well as potential interventions. In addition, theuse of cost-benefit analysis under complex and dynamic conditions was investigated.By applying a highly data–and resource-intensive stochastic cost-benefit approach, adetailed modelling approach was reviewed and evaluated for applicability, robustness(especially under uncertain conditions), and utility for the disaster risk reductiondecision-making process.
202
Catalyzing Climate and Disaster Resilience: Processes for
Identifying Tangible and Economically Robust Strategies
As described in the methodology chapter of this volume, a combination of backwards-and forwards-looking risk analyses was applied to assess current and future floodrisk. Review of past flood impacts and hydrometeorological data provided estimatesfor current risk, while climate/weather and flood modelling, combined with projectedchanges in exposure and vulnerability, were used to estimate risk for the period 2007-2050. Current and projected Rohini Basin-wide loss frequency relationships weredeveloped. Benefits of flood risk reduction options were quantified through theirdiffering impacts on the loss frequency relationships and ultimately included in thecost-benefit analysis as reductions in annual expected losses. Intervention costs wereestimated from past and current projects, and potential disbenefits were also quantifiedand incorporated in the analysis.
Despite considerable data collection and modelling efforts, the ultimate cost-benefitanalysis is considered to be of a “pre-project appraisal” level of complexity. The pastperformance of Rohini Basin embankments were also analyzed through apost-completion evaluation. This work represents a middle level of resource andtime commitments in the range of potential complexities of cost-benefit analysis (seeChapter 2).
Climate and weather modellingThis section summarizes the weather and climate change analysis relevant for the floodrisk analysis in the Rohini Basin; a more detailed review is provided in Chapter 3.
Climate change is projected to influence river flow patterns through changes in theamount and timing of rainfall in the basin. The IPCC (Christensen et al., 2007) projectsan approximate 11% increase in precipitation during the monsoon months for theentire Ganga Basin. The IPCC projections, however, are based on the geographicresolution of the general circulation models synthesized on the order of 100 to 200 km,which is too large a geographic range to support targeted climate change adaptationinterventions in the Rohini Basin. Therefore, a statistical downscaling model wasdeveloped to investigate potential climate change impacts on precipitation patternsin the Rohini Basin and to be used in flood models.
Statistical downscaling models work by finding a relationship between large-scaleclimate variables (e.g. wind, pressure or air temperature) and a local variable, such asthe rainfall in the Rohini Basin. The particular downscaling method used is a robust,analogue method that looks for similarities in large-scale climate variables across aperiod for which historical observations are available (1976-2006) to replicate historicalrainfalls. Projections of potential climate change impacts on precipitation are madeby comparing future projections of large-scale climate variables (in this study obtainedfrom the Canadian Third Generation Coupled Climate Model or CGCM3) withhistorical observations of large-scale climate variables and then resampling therainfalls of the most similar historic years.
Climate change projections for the Rohini Basin are based upon two climate changescenarios: A2 and B1. The A2 scenario refers to a world with continued high relianceon fossil fuels and high population growth. The B1 scenario assumes that carbondioxide levels in the atmosphere stabilize around 550 ppm. The A2 and B1 scenarios
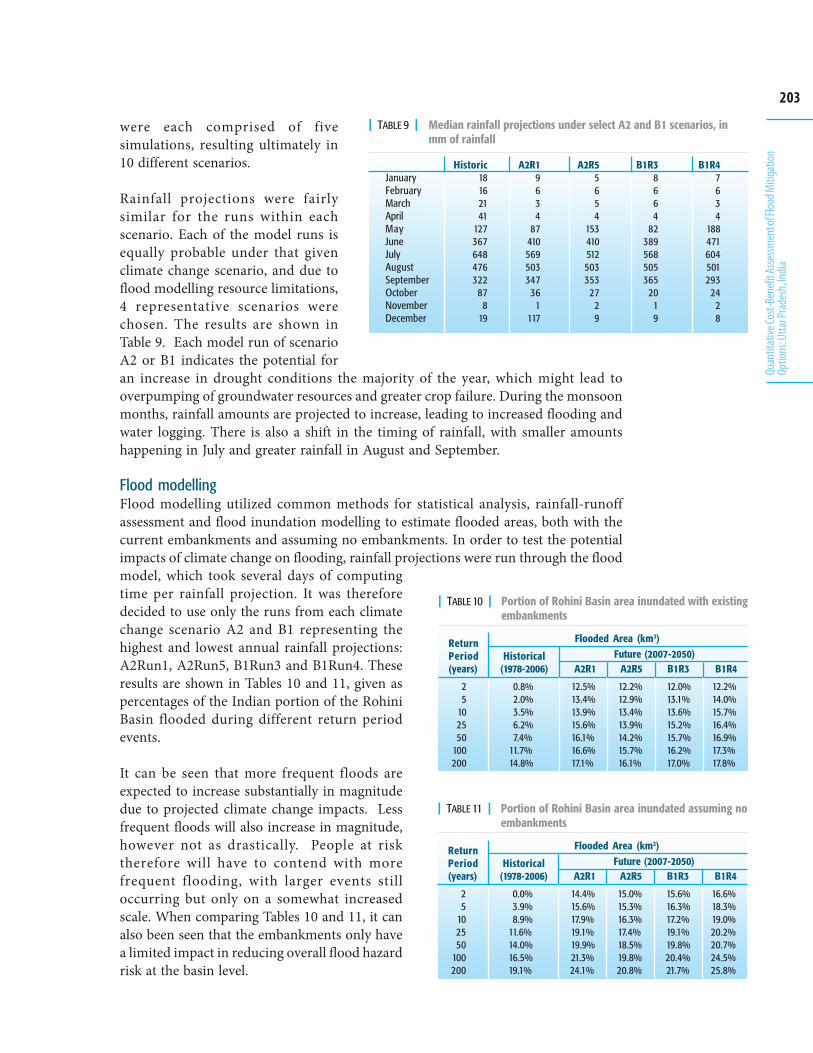
203
Quan
titat
ive Co
st-Be
nefit
Asse
ssmen
t of F
lood M
itiga
tion
Optio
ns: U
ttar P
rade
sh, In
dia
were each comprised of fivesimulations, resulting ultimately in10 different scenarios.
Rainfall projections were fairlysimilar for the runs within eachscenario. Each of the model runs isequally probable under that givenclimate change scenario, and due toflood modelling resource limitations,4 representative scenarios werechosen. The results are shown inTable 9. Each model run of scenarioA2 or B1 indicates the potential foran increase in drought conditions the majority of the year, which might lead tooverpumping of groundwater resources and greater crop failure. During the monsoonmonths, rainfall amounts are projected to increase, leading to increased flooding andwater logging. There is also a shift in the timing of rainfall, with smaller amountshappening in July and greater rainfall in August and September.
Flood modellingFlood modelling utilized common methods for statistical analysis, rainfall-runoffassessment and flood inundation modelling to estimate flooded areas, both with thecurrent embankments and assuming no embankments. In order to test the potentialimpacts of climate change on flooding, rainfall projections were run through the floodmodel, which took several days of computingtime per rainfall projection. It was thereforedecided to use only the runs from each climatechange scenario A2 and B1 representing thehighest and lowest annual rainfall projections:A2Run1, A2Run5, B1Run3 and B1Run4. Theseresults are shown in Tables 10 and 11, given aspercentages of the Indian portion of the RohiniBasin flooded during different return periodevents.
It can be seen that more frequent floods areexpected to increase substantially in magnitudedue to projected climate change impacts. Lessfrequent floods will also increase in magnitude,however not as drastically. People at risktherefore will have to contend with morefrequent flooding, with larger events stilloccurring but only on a somewhat increasedscale. When comparing Tables 10 and 11, it canalso been seen that the embankments only havea limited impact in reducing overall flood hazardrisk at the basin level.
| TABLE 10 | Portion of Rohini Basin area inundated with existingembankments
ReturnPeriod(years)
25
102550
100200
Historical(1978-2006)
0.8%2.0%3.5%6.2%7.4%
11.7%14.8%
Flooded Area (km2)
B1R4
12.2%14.0%15.7%16.4%16.9%17.3%17.8%
A2R1
12.5%13.4%13.9%15.6%16.1%16.6%17.1%
A2R5
12.2%12.9%13.4%13.9%14.2%15.7%16.1%
B1R3
12.0%13.1%13.6%15.2%15.7%16.2%17.0%
Future (2007-2050)
| TABLE 11 | Portion of Rohini Basin area inundated assuming noembankments
ReturnPeriod(years)
25
102550
100200
Historical(1978-2006)
0.0%3.9%8.9%
11.6%14.0%16.5%19.1%
Flooded Area (km2)
A2R1
14.4%15.6%17.9%19.1%19.9%21.3%24.1%
Future (2007-2050)B1R4
16.6%18.3%19.0%20.2%20.7%24.5%25.8%
A2R5
15.0%15.3%16.3%17.4%18.5%19.8%20.8%
B1R3
15.6%16.3%17.2%19.1%19.8%20.4%21.7%
JanuaryFebruaryMarchAprilMayJuneJulyAugustSeptemberOctoberNovemberDecember
Historic18162141
127367648476322
878
19
A2R19634
87410569503347
361
117
A2R55654
153410512503353
2729
B1R38664
82389568505365
2019
B1R47634
188471604501293
2428
| TABLE 9 | Median rainfall projections under select A2 and B1 scenarios, inmm of rainfall
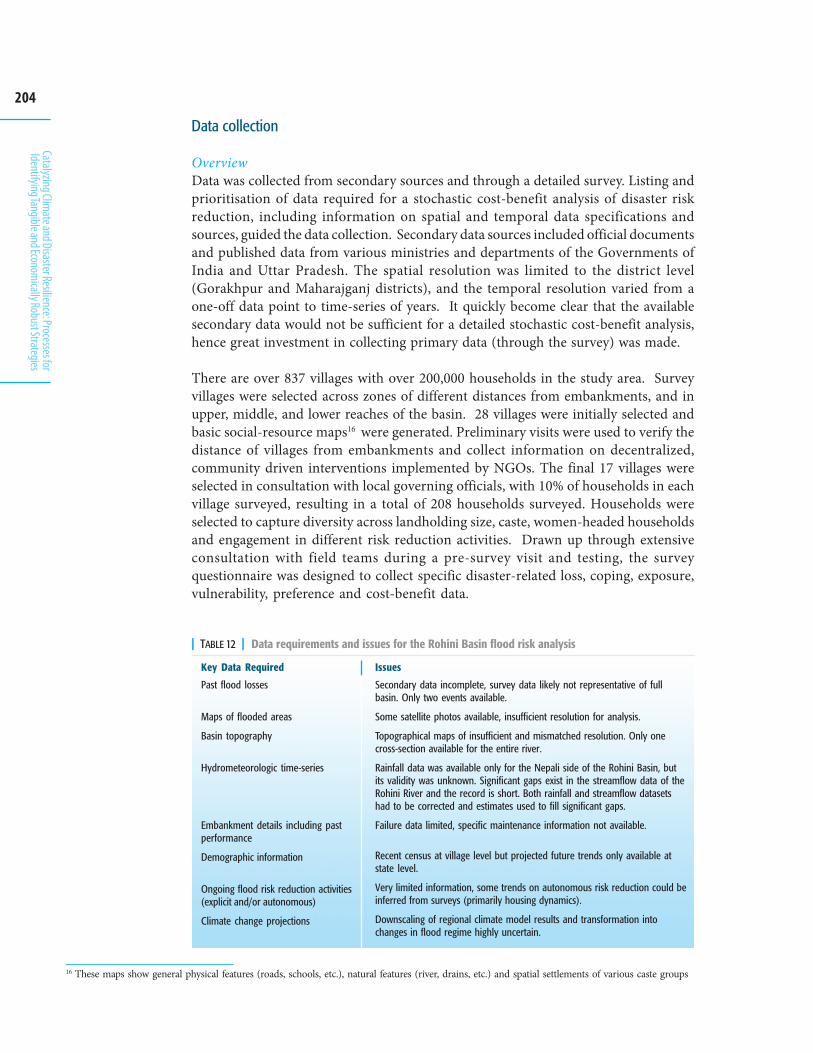
204
Catalyzing Climate and Disaster Resilience: Processes for
Identifying Tangible and Economically Robust Strategies
Data collection
OverviewData was collected from secondary sources and through a detailed survey. Listing andprioritisation of data required for a stochastic cost-benefit analysis of disaster riskreduction, including information on spatial and temporal data specifications andsources, guided the data collection. Secondary data sources included official documentsand published data from various ministries and departments of the Governments ofIndia and Uttar Pradesh. The spatial resolution was limited to the district level(Gorakhpur and Maharajganj districts), and the temporal resolution varied from aone-off data point to time-series of years. It quickly become clear that the availablesecondary data would not be sufficient for a detailed stochastic cost-benefit analysis,hence great investment in collecting primary data (through the survey) was made.
There are over 837 villages with over 200,000 households in the study area. Surveyvillages were selected across zones of different distances from embankments, and inupper, middle, and lower reaches of the basin. 28 villages were initially selected andbasic social-resource maps16 were generated. Preliminary visits were used to verify thedistance of villages from embankments and collect information on decentralized,community driven interventions implemented by NGOs. The final 17 villages wereselected in consultation with local governing officials, with 10% of households in eachvillage surveyed, resulting in a total of 208 households surveyed. Households wereselected to capture diversity across landholding size, caste, women-headed householdsand engagement in different risk reduction activities. Drawn up through extensiveconsultation with field teams during a pre-survey visit and testing, the surveyquestionnaire was designed to collect specific disaster-related loss, coping, exposure,vulnerability, preference and cost-benefit data.
Issues
Secondary data incomplete, survey data likely not representative of fullbasin. Only two events available.
Some satellite photos available, insufficient resolution for analysis.
Topographical maps of insufficient and mismatched resolution. Only onecross-section available for the entire river.
Rainfall data was available only for the Nepali side of the Rohini Basin, butits validity was unknown. Significant gaps exist in the streamflow data of theRohini River and the record is short. Both rainfall and streamflow datasetshad to be corrected and estimates used to fill significant gaps.
Failure data limited, specific maintenance information not available.
Recent census at village level but projected future trends only available atstate level.
Very limited information, some trends on autonomous risk reduction could beinferred from surveys (primarily housing dynamics).
Downscaling of regional climate model results and transformation intochanges in flood regime highly uncertain.
Key Data Required
Past flood losses
Maps of flooded areas
Basin topography
Hydrometeorologic time-series
Embankment details including pastperformance
Demographic information
Ongoing flood risk reduction activities(explicit and/or autonomous)
Climate change projections
| TABLE 12 | Data requirements and issues for the Rohini Basin flood risk analysis
16 These maps show general physical features (roads, schools, etc.), natural features (river, drains, etc.) and spatial settlements of various caste groups
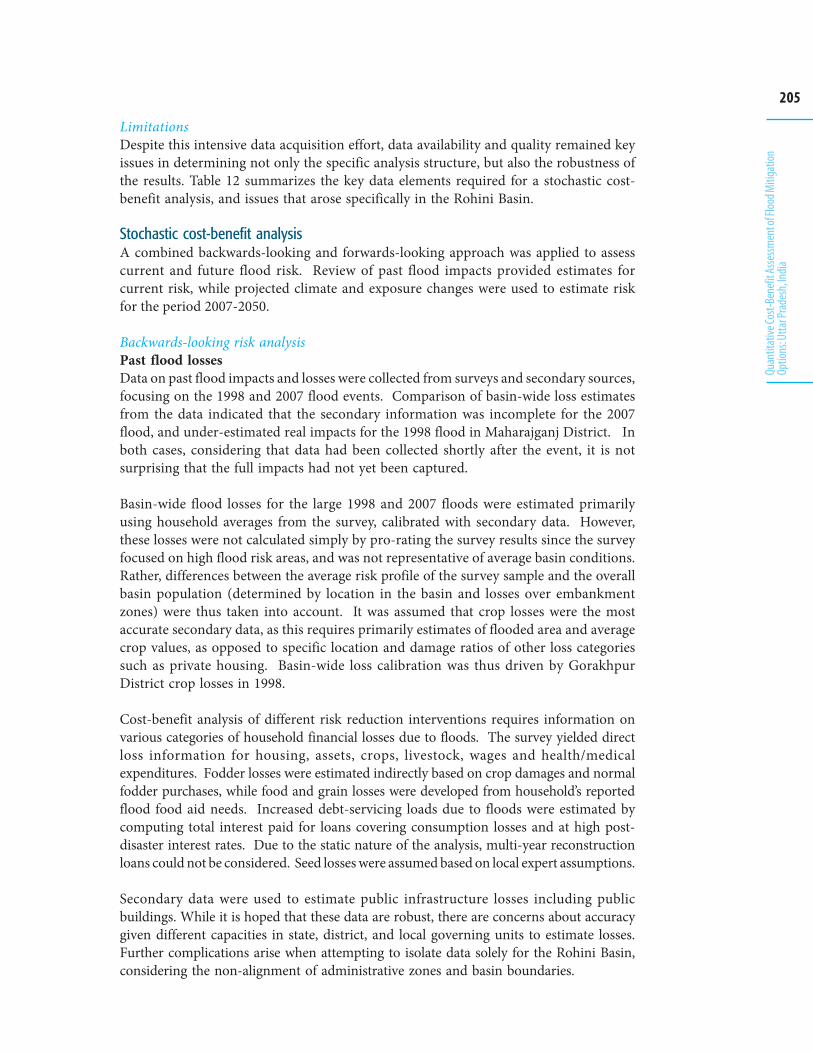
205
Quan
titat
ive Co
st-Be
nefit
Asse
ssmen
t of F
lood M
itiga
tion
Optio
ns: U
ttar P
rade
sh, In
dia
LimitationsDespite this intensive data acquisition effort, data availability and quality remained keyissues in determining not only the specific analysis structure, but also the robustness ofthe results. Table 12 summarizes the key data elements required for a stochastic cost-benefit analysis, and issues that arose specifically in the Rohini Basin.
Stochastic cost-benefit analysisA combined backwards-looking and forwards-looking approach was applied to assesscurrent and future flood risk. Review of past flood impacts provided estimates forcurrent risk, while projected climate and exposure changes were used to estimate riskfor the period 2007-2050.
Backwards-looking risk analysisPast flood lossesData on past flood impacts and losses were collected from surveys and secondary sources,focusing on the 1998 and 2007 flood events. Comparison of basin-wide loss estimatesfrom the data indicated that the secondary information was incomplete for the 2007flood, and under-estimated real impacts for the 1998 flood in Maharajganj District. Inboth cases, considering that data had been collected shortly after the event, it is notsurprising that the full impacts had not yet been captured.
Basin-wide flood losses for the large 1998 and 2007 floods were estimated primarilyusing household averages from the survey, calibrated with secondary data. However,these losses were not calculated simply by pro-rating the survey results since the surveyfocused on high flood risk areas, and was not representative of average basin conditions.Rather, differences between the average risk profile of the survey sample and the overallbasin population (determined by location in the basin and losses over embankmentzones) were thus taken into account. It was assumed that crop losses were the mostaccurate secondary data, as this requires primarily estimates of flooded area and averagecrop values, as opposed to specific location and damage ratios of other loss categoriessuch as private housing. Basin-wide loss calibration was thus driven by GorakhpurDistrict crop losses in 1998.
Cost-benefit analysis of different risk reduction interventions requires information onvarious categories of household financial losses due to floods. The survey yielded directloss information for housing, assets, crops, livestock, wages and health/medicalexpenditures. Fodder losses were estimated indirectly based on crop damages and normalfodder purchases, while food and grain losses were developed from household’s reportedflood food aid needs. Increased debt-servicing loads due to floods were estimated bycomputing total interest paid for loans covering consumption losses and at high post-disaster interest rates. Due to the static nature of the analysis, multi-year reconstructionloans could not be considered. Seed losses were assumed based on local expert assumptions.
Secondary data were used to estimate public infrastructure losses including publicbuildings. While it is hoped that these data are robust, there are concerns about accuracygiven different capacities in state, district, and local governing units to estimate losses.Further complications arise when attempting to isolate data solely for the Rohini Basin,considering the non-alignment of administrative zones and basin boundaries.
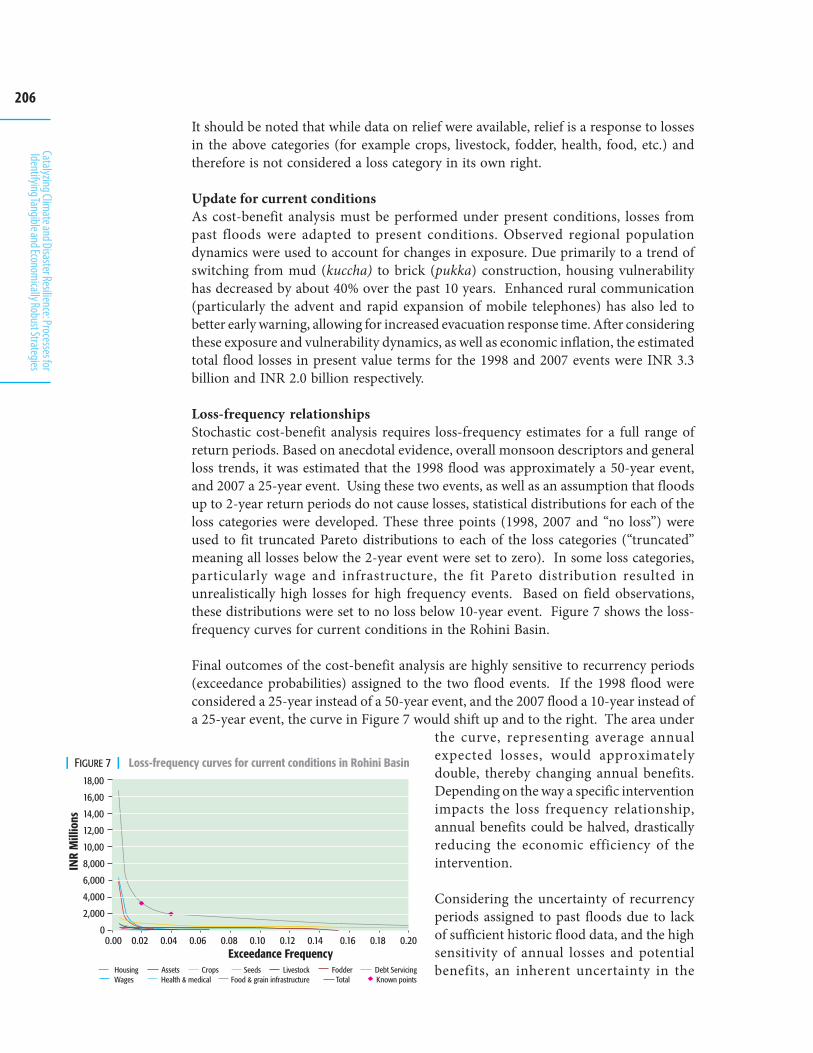
206
Catalyzing Climate and Disaster Resilience: Processes for
Identifying Tangible and Economically Robust Strategies
| FIGURE 7 | Loss-frequency curves for current conditions in Rohini Basin
It should be noted that while data on relief were available, relief is a response to lossesin the above categories (for example crops, livestock, fodder, health, food, etc.) andtherefore is not considered a loss category in its own right.
Update for current conditionsAs cost-benefit analysis must be performed under present conditions, losses frompast floods were adapted to present conditions. Observed regional populationdynamics were used to account for changes in exposure. Due primarily to a trend ofswitching from mud (kuccha) to brick (pukka) construction, housing vulnerabilityhas decreased by about 40% over the past 10 years. Enhanced rural communication(particularly the advent and rapid expansion of mobile telephones) has also led tobetter early warning, allowing for increased evacuation response time. After consideringthese exposure and vulnerability dynamics, as well as economic inflation, the estimatedtotal flood losses in present value terms for the 1998 and 2007 events were INR 3.3billion and INR 2.0 billion respectively.
Loss-frequency relationshipsStochastic cost-benefit analysis requires loss-frequency estimates for a full range ofreturn periods. Based on anecdotal evidence, overall monsoon descriptors and generalloss trends, it was estimated that the 1998 flood was approximately a 50-year event,and 2007 a 25-year event. Using these two events, as well as an assumption that floodsup to 2-year return periods do not cause losses, statistical distributions for each of theloss categories were developed. These three points (1998, 2007 and “no loss”) wereused to fit truncated Pareto distributions to each of the loss categories (“truncated”meaning all losses below the 2-year event were set to zero). In some loss categories,particularly wage and infrastructure, the fit Pareto distribution resulted inunrealistically high losses for high frequency events. Based on field observations,these distributions were set to no loss below 10-year event. Figure 7 shows the loss-frequency curves for current conditions in the Rohini Basin.
Final outcomes of the cost-benefit analysis are highly sensitive to recurrency periods(exceedance probabilities) assigned to the two flood events. If the 1998 flood wereconsidered a 25-year instead of a 50-year event, and the 2007 flood a 10-year instead ofa 25-year event, the curve in Figure 7 would shift up and to the right. The area under
the curve, representing average annualexpected losses, would approximatelydouble, thereby changing annual benefits.Depending on the way a specific interventionimpacts the loss frequency relationship,annual benefits could be halved, drasticallyreducing the economic efficiency of theintervention.
Considering the uncertainty of recurrencyperiods assigned to past floods due to lackof sufficient historic flood data, and the highsensitivity of annual losses and potentialbenefits, an inherent uncertainty in the
�3�������3��������3�!������3�)�������3�'������3���������3��������3�!��������3�)�������3�'�������3��
4����� ,�� &�� ���� �������* ����� #������������5��� 4���� �/�������� �����/��������%������� 6���� 7��.�������
�'8��
�)8��
�!8��
��8��
��8��
'8���
)8���
!8���
�8���
��������
����
����
��
�� ���� �������� �
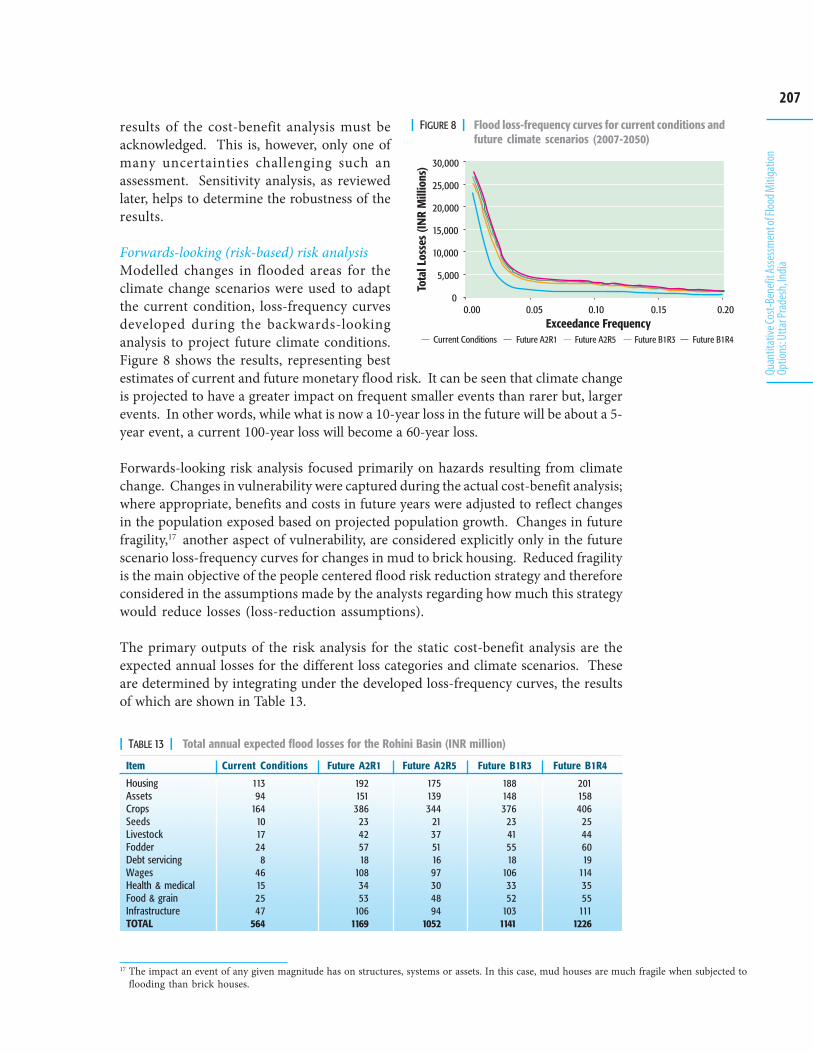
207
Quan
titat
ive Co
st-Be
nefit
Asse
ssmen
t of F
lood M
itiga
tion
Optio
ns: U
ttar P
rade
sh, In
dia
�8���
�"8���
��8���
�"8���
��8���
��"8���
����������3�� �������3�" �������������3�� �������������������3�" �������3��
�� ���� �������� �
����
����
��
�����
����
��
�
&�����&�������� ������,�1� ������,�1" ������-�1 ������-�1!
| FIGURE 8 | Flood loss-frequency curves for current conditions andfuture climate scenarios (2007-2050)
results of the cost-benefit analysis must beacknowledged. This is, however, only one ofmany uncertainties challenging such anassessment. Sensitivity analysis, as reviewedlater, helps to determine the robustness of theresults.
Forwards-looking (risk-based) risk analysisModelled changes in flooded areas for theclimate change scenarios were used to adaptthe current condition, loss-frequency curvesdeveloped during the backwards-lookinganalysis to project future climate conditions.Figure 8 shows the results, representing bestestimates of current and future monetary flood risk. It can be seen that climate changeis projected to have a greater impact on frequent smaller events than rarer but, largerevents. In other words, while what is now a 10-year loss in the future will be about a 5-year event, a current 100-year loss will become a 60-year loss.
Forwards-looking risk analysis focused primarily on hazards resulting from climatechange. Changes in vulnerability were captured during the actual cost-benefit analysis;where appropriate, benefits and costs in future years were adjusted to reflect changesin the population exposed based on projected population growth. Changes in futurefragility,17 another aspect of vulnerability, are considered explicitly only in the futurescenario loss-frequency curves for changes in mud to brick housing. Reduced fragilityis the main objective of the people centered flood risk reduction strategy and thereforeconsidered in the assumptions made by the analysts regarding how much this strategywould reduce losses (loss-reduction assumptions).
The primary outputs of the risk analysis for the static cost-benefit analysis are theexpected annual losses for the different loss categories and climate scenarios. Theseare determined by integrating under the developed loss-frequency curves, the resultsof which are shown in Table 13.
| TABLE 13 | Total annual expected flood losses for the Rohini Basin (INR million)
Item
HousingAssetsCropsSeedsLivestockFodderDebt servicingWagesHealth & medicalFood & grainInfrastructureTOTAL
Current Conditions
11394
164101724
846152547
564
Future A2R1
192151386
23425718
1083453
1061169
Future A2R5
175139344
2137511697304894
1052
Future B1R3
188148376
23415518
1063352
1031141
Future B1R4
201158406
25446019
1143555
1111226
17 The impact an event of any given magnitude has on structures, systems or assets. In this case, mud houses are much fragile when subjected toflooding than brick houses.
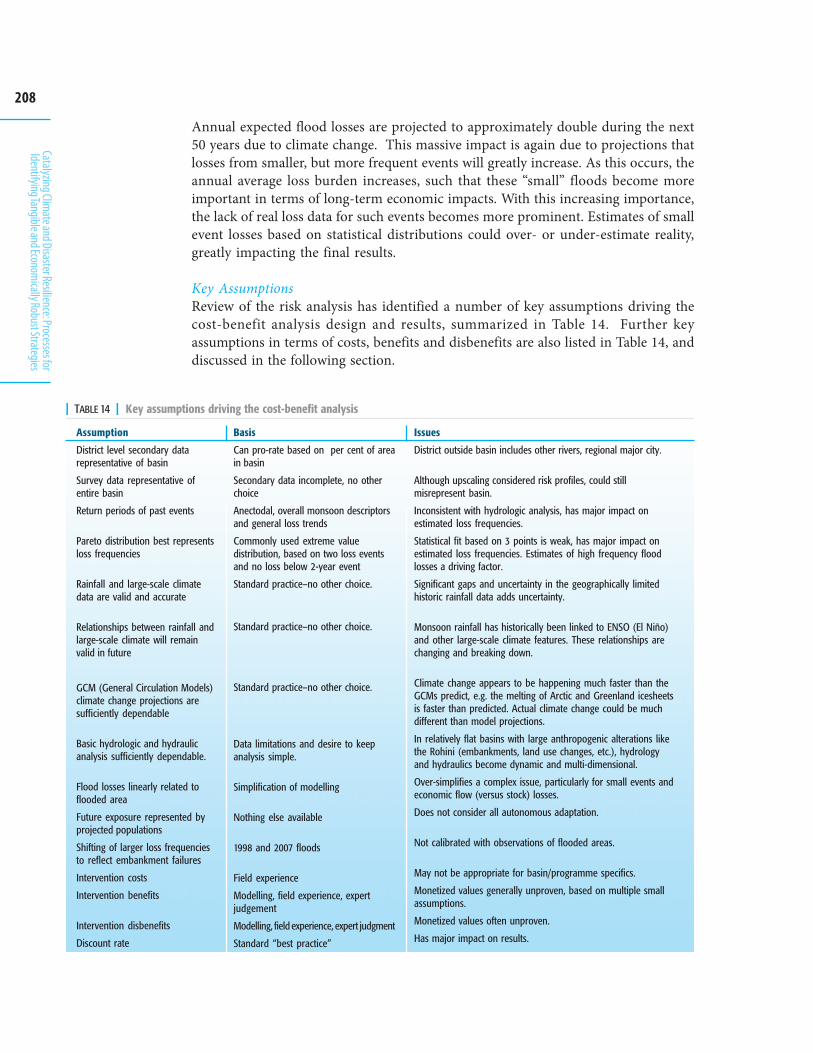
208
Catalyzing Climate and Disaster Resilience: Processes for
Identifying Tangible and Economically Robust Strategies
Annual expected flood losses are projected to approximately double during the next50 years due to climate change. This massive impact is again due to projections thatlosses from smaller, but more frequent events will greatly increase. As this occurs, theannual average loss burden increases, such that these “small” floods become moreimportant in terms of long-term economic impacts. With this increasing importance,the lack of real loss data for such events becomes more prominent. Estimates of smallevent losses based on statistical distributions could over- or under-estimate reality,greatly impacting the final results.
Key AssumptionsReview of the risk analysis has identified a number of key assumptions driving thecost-benefit analysis design and results, summarized in Table 14. Further keyassumptions in terms of costs, benefits and disbenefits are also listed in Table 14, anddiscussed in the following section.
Assumption
District level secondary datarepresentative of basin
Survey data representative ofentire basin
Return periods of past events
Pareto distribution best representsloss frequencies
Rainfall and large-scale climatedata are valid and accurate
Relationships between rainfall andlarge-scale climate will remainvalid in future
GCM (General Circulation Models)climate change projections aresufficiently dependable
Basic hydrologic and hydraulicanalysis sufficiently dependable.
Flood losses linearly related toflooded area
Future exposure represented byprojected populations
Shifting of larger loss frequenciesto reflect embankment failures
Intervention costs
Intervention benefits
Intervention disbenefits
Discount rate
Basis
Can pro-rate based on per cent of areain basin
Secondary data incomplete, no otherchoice
Anectodal, overall monsoon descriptorsand general loss trends
Commonly used extreme valuedistribution, based on two loss eventsand no loss below 2-year event
Standard practice–no other choice.
Standard practice–no other choice.
Standard practice–no other choice.
Data limitations and desire to keepanalysis simple.
Simplification of modelling
Nothing else available
1998 and 2007 floods
Field experience
Modelling, field experience, expertjudgement
Modelling, field experience, expert judgment
Standard “best practice”
Issues
District outside basin includes other rivers, regional major city.
Although upscaling considered risk profiles, could stillmisrepresent basin.
Inconsistent with hydrologic analysis, has major impact onestimated loss frequencies.
Statistical fit based on 3 points is weak, has major impact onestimated loss frequencies. Estimates of high frequency floodlosses a driving factor.
Significant gaps and uncertainty in the geographically limitedhistoric rainfall data adds uncertainty.
Monsoon rainfall has historically been linked to ENSO (El Niño)and other large-scale climate features. These relationships arechanging and breaking down.
Climate change appears to be happening much faster than theGCMs predict, e.g. the melting of Arctic and Greenland icesheetsis faster than predicted. Actual climate change could be muchdifferent than model projections.
In relatively flat basins with large anthropogenic alterations likethe Rohini (embankments, land use changes, etc.), hydrologyand hydraulics become dynamic and multi-dimensional.
Over-simplifies a complex issue, particularly for small events andeconomic flow (versus stock) losses.
Does not consider all autonomous adaptation.
Not calibrated with observations of flooded areas.
May not be appropriate for basin/programme specifics.
Monetized values generally unproven, based on multiple smallassumptions.
Monetized values often unproven.
Has major impact on results.
| TABLE 14 | Key assumptions driving the cost-benefit analysis
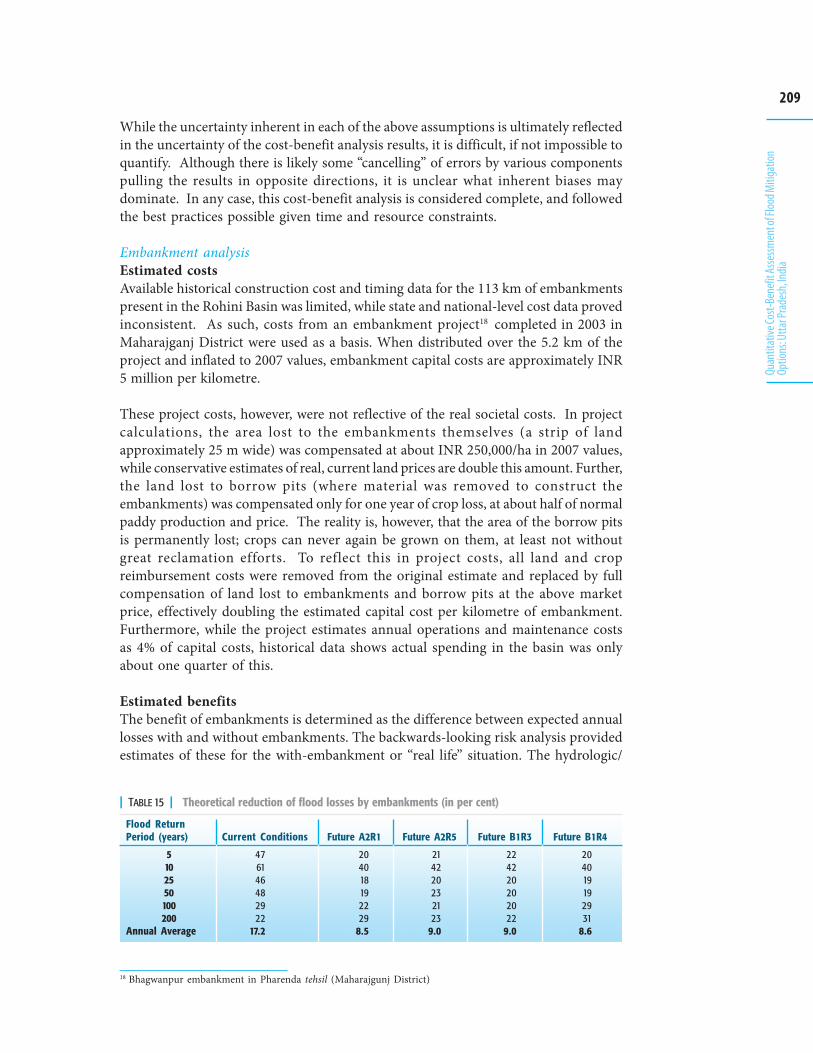
209
Quan
titat
ive Co
st-Be
nefit
Asse
ssmen
t of F
lood M
itiga
tion
Optio
ns: U
ttar P
rade
sh, In
dia
While the uncertainty inherent in each of the above assumptions is ultimately reflectedin the uncertainty of the cost-benefit analysis results, it is difficult, if not impossible toquantify. Although there is likely some “cancelling” of errors by various componentspulling the results in opposite directions, it is unclear what inherent biases maydominate. In any case, this cost-benefit analysis is considered complete, and followedthe best practices possible given time and resource constraints.
Embankment analysisEstimated costsAvailable historical construction cost and timing data for the 113 km of embankmentspresent in the Rohini Basin was limited, while state and national-level cost data provedinconsistent. As such, costs from an embankment project18 completed in 2003 inMaharajganj District were used as a basis. When distributed over the 5.2 km of theproject and inflated to 2007 values, embankment capital costs are approximately INR5 million per kilometre.
These project costs, however, were not reflective of the real societal costs. In projectcalculations, the area lost to the embankments themselves (a strip of landapproximately 25 m wide) was compensated at about INR 250,000/ha in 2007 values,while conservative estimates of real, current land prices are double this amount. Further,the land lost to borrow pits (where material was removed to construct theembankments) was compensated only for one year of crop loss, at about half of normalpaddy production and price. The reality is, however, that the area of the borrow pitsis permanently lost; crops can never again be grown on them, at least not withoutgreat reclamation efforts. To reflect this in project costs, all land and cropreimbursement costs were removed from the original estimate and replaced by fullcompensation of land lost to embankments and borrow pits at the above marketprice, effectively doubling the estimated capital cost per kilometre of embankment.Furthermore, while the project estimates annual operations and maintenance costsas 4% of capital costs, historical data shows actual spending in the basin was onlyabout one quarter of this.
Estimated benefitsThe benefit of embankments is determined as the difference between expected annuallosses with and without embankments. The backwards-looking risk analysis providedestimates of these for the with-embankment or “real life” situation. The hydrologic/
18 Bhagwanpur embankment in Pharenda tehsil (Maharajgunj District)
| TABLE 15 | Theoretical reduction of flood losses by embankments (in per cent)
Flood ReturnPeriod (years)
5102550100200
Annual Average
Current Conditions
476146482922
17.2
Future A2R1
204018192229
8.5
Future A2R5
214220232123
9.0
Future B1R3
224220202022
9.0
Future B1R4
204019192931
8.6
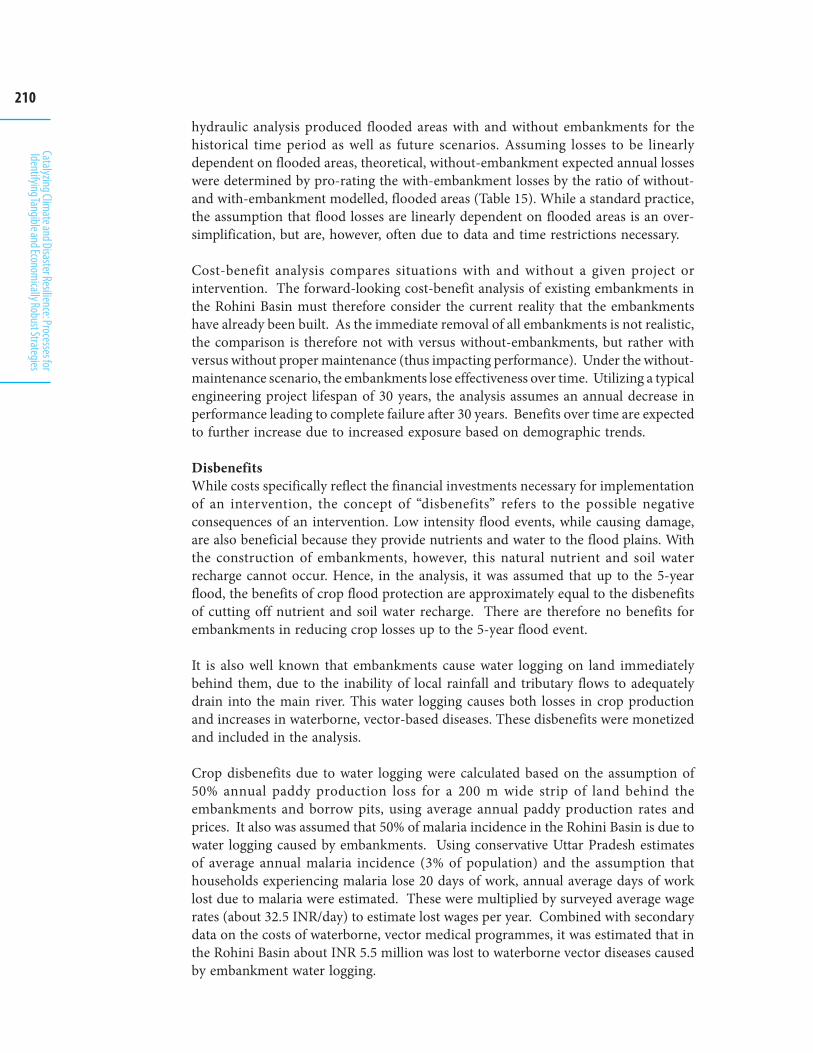
210
Catalyzing Climate and Disaster Resilience: Processes for
Identifying Tangible and Economically Robust Strategies
hydraulic analysis produced flooded areas with and without embankments for thehistorical time period as well as future scenarios. Assuming losses to be linearlydependent on flooded areas, theoretical, without-embankment expected annual losseswere determined by pro-rating the with-embankment losses by the ratio of without-and with-embankment modelled, flooded areas (Table 15). While a standard practice,the assumption that flood losses are linearly dependent on flooded areas is an over-simplification, but are, however, often due to data and time restrictions necessary.
Cost-benefit analysis compares situations with and without a given project orintervention. The forward-looking cost-benefit analysis of existing embankments inthe Rohini Basin must therefore consider the current reality that the embankmentshave already been built. As the immediate removal of all embankments is not realistic,the comparison is therefore not with versus without-embankments, but rather withversus without proper maintenance (thus impacting performance). Under the without-maintenance scenario, the embankments lose effectiveness over time. Utilizing a typicalengineering project lifespan of 30 years, the analysis assumes an annual decrease inperformance leading to complete failure after 30 years. Benefits over time are expectedto further increase due to increased exposure based on demographic trends.
DisbenefitsWhile costs specifically reflect the financial investments necessary for implementationof an intervention, the concept of “disbenefits” refers to the possible negativeconsequences of an intervention. Low intensity flood events, while causing damage,are also beneficial because they provide nutrients and water to the flood plains. Withthe construction of embankments, however, this natural nutrient and soil waterrecharge cannot occur. Hence, in the analysis, it was assumed that up to the 5-yearflood, the benefits of crop flood protection are approximately equal to the disbenefitsof cutting off nutrient and soil water recharge. There are therefore no benefits forembankments in reducing crop losses up to the 5-year flood event.
It is also well known that embankments cause water logging on land immediatelybehind them, due to the inability of local rainfall and tributary flows to adequatelydrain into the main river. This water logging causes both losses in crop productionand increases in waterborne, vector-based diseases. These disbenefits were monetizedand included in the analysis.
Crop disbenefits due to water logging were calculated based on the assumption of50% annual paddy production loss for a 200 m wide strip of land behind theembankments and borrow pits, using average annual paddy production rates andprices. It also was assumed that 50% of malaria incidence in the Rohini Basin is due towater logging caused by embankments. Using conservative Uttar Pradesh estimatesof average annual malaria incidence (3% of population) and the assumption thathouseholds experiencing malaria lose 20 days of work, annual average days of worklost due to malaria were estimated. These were multiplied by surveyed average wagerates (about 32.5 INR/day) to estimate lost wages per year. Combined with secondarydata on the costs of waterborne, vector medical programmes, it was estimated that inthe Rohini Basin about INR 5.5 million was lost to waterborne vector diseases causedby embankment water logging.
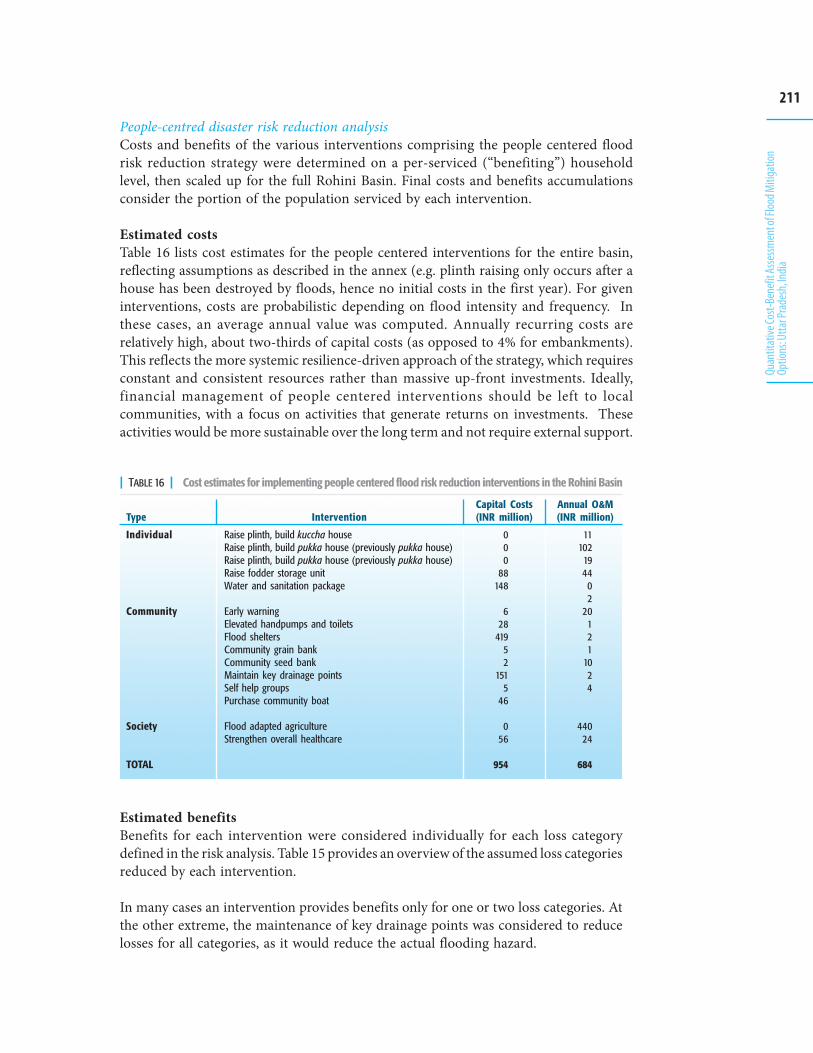
211
Quan
titat
ive Co
st-Be
nefit
Asse
ssmen
t of F
lood M
itiga
tion
Optio
ns: U
ttar P
rade
sh, In
dia
People-centred disaster risk reduction analysisCosts and benefits of the various interventions comprising the people centered floodrisk reduction strategy were determined on a per-serviced (“benefiting”) householdlevel, then scaled up for the full Rohini Basin. Final costs and benefits accumulationsconsider the portion of the population serviced by each intervention.
Estimated costsTable 16 lists cost estimates for the people centered interventions for the entire basin,reflecting assumptions as described in the annex (e.g. plinth raising only occurs after ahouse has been destroyed by floods, hence no initial costs in the first year). For giveninterventions, costs are probabilistic depending on flood intensity and frequency. Inthese cases, an average annual value was computed. Annually recurring costs arerelatively high, about two-thirds of capital costs (as opposed to 4% for embankments).This reflects the more systemic resilience-driven approach of the strategy, which requiresconstant and consistent resources rather than massive up-front investments. Ideally,financial management of people centered interventions should be left to localcommunities, with a focus on activities that generate returns on investments. Theseactivities would be more sustainable over the long term and not require external support.
| TABLE 16 | Cost estimates for implementing people centered flood risk reduction interventions in the Rohini Basin
Type
Individual
Community
Society
TOTAL
Intervention
Raise plinth, build kuccha houseRaise plinth, build pukka house (previously pukka house)Raise plinth, build pukka house (previously pukka house)Raise fodder storage unitWater and sanitation package
Early warningElevated handpumps and toiletsFlood sheltersCommunity grain bankCommunity seed bankMaintain key drainage pointsSelf help groupsPurchase community boat
Flood adapted agricultureStrengthen overall healthcare
Capital Costs(INR million)
000
88148
628
41952
1515
46
056
954
Annual O&M(INR million)
11102
1944
02
20121
1024
44024
684
Estimated benefitsBenefits for each intervention were considered individually for each loss categorydefined in the risk analysis. Table 15 provides an overview of the assumed loss categoriesreduced by each intervention.
In many cases an intervention provides benefits only for one or two loss categories. Atthe other extreme, the maintenance of key drainage points was considered to reducelosses for all categories, as it would reduce the actual flooding hazard.
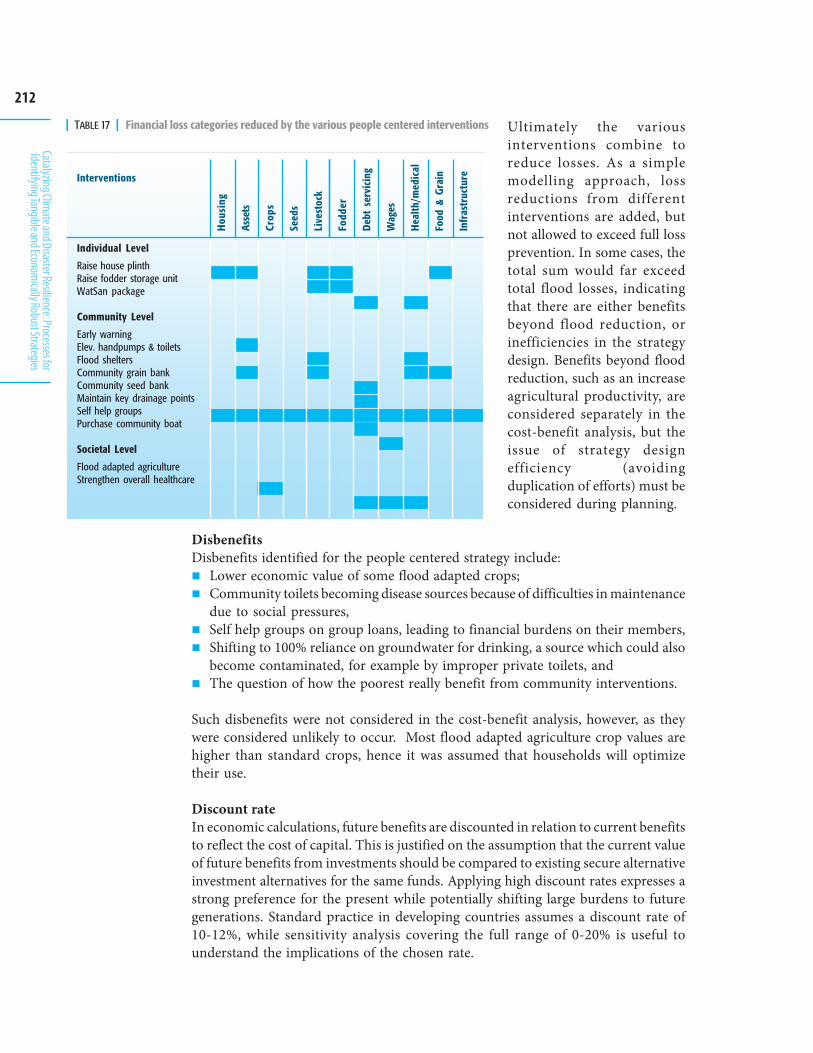
212
Catalyzing Climate and Disaster Resilience: Processes for
Identifying Tangible and Economically Robust Strategies
Ultimately the variousinterventions combine toreduce losses. As a simplemodelling approach, lossreductions from differentinterventions are added, butnot allowed to exceed full lossprevention. In some cases, thetotal sum would far exceedtotal flood losses, indicatingthat there are either benefitsbeyond flood reduction, orinefficiencies in the strategydesign. Benefits beyond floodreduction, such as an increaseagricultural productivity, areconsidered separately in thecost-benefit analysis, but theissue of strategy designefficiency (avoidingduplication of efforts) must beconsidered during planning.
DisbenefitsDisbenefits identified for the people centered strategy include:
Lower economic value of some flood adapted crops;Community toilets becoming disease sources because of difficulties in maintenancedue to social pressures,Self help groups on group loans, leading to financial burdens on their members,Shifting to 100% reliance on groundwater for drinking, a source which could alsobecome contaminated, for example by improper private toilets, andThe question of how the poorest really benefit from community interventions.
Such disbenefits were not considered in the cost-benefit analysis, however, as theywere considered unlikely to occur. Most flood adapted agriculture crop values arehigher than standard crops, hence it was assumed that households will optimizetheir use.
Discount rateIn economic calculations, future benefits are discounted in relation to current benefitsto reflect the cost of capital. This is justified on the assumption that the current valueof future benefits from investments should be compared to existing secure alternativeinvestment alternatives for the same funds. Applying high discount rates expresses astrong preference for the present while potentially shifting large burdens to futuregenerations. Standard practice in developing countries assumes a discount rate of10-12%, while sensitivity analysis covering the full range of 0-20% is useful tounderstand the implications of the chosen rate.
| TABLE 17 | Financial loss categories reduced by the various people centered interventions
Interventions
Individual Level
Raise house plinthRaise fodder storage unitWatSan package
Community Level
Early warningElev. handpumps & toiletsFlood sheltersCommunity grain bankCommunity seed bankMaintain key drainage pointsSelf help groupsPurchase community boat
Societal Level
Flood adapted agricultureStrengthen overall healthcare
Hou
sing
Asse
ts
Crop
s
Seed
s
Live
stoc
k
Fodd
er
Deb
t se
rvic
ing
Wag
es
Hea
lth/m
edic
al
Food
& G
rain
Infr
astr
uctu
re
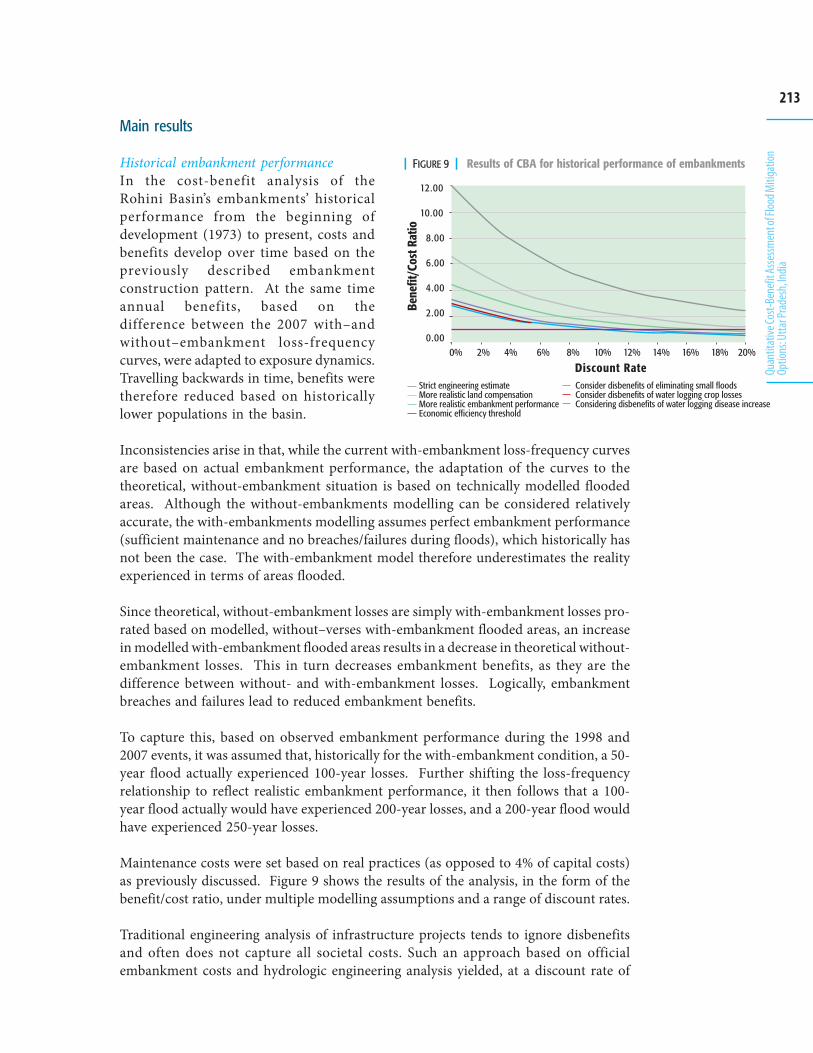
213
Quan
titat
ive Co
st-Be
nefit
Asse
ssmen
t of F
lood M
itiga
tion
Optio
ns: U
ttar P
rade
sh, In
dia
�� ��������
���
�����
����
����
���������������������������������������������������������������������*�������%������9���������%%��������� � ���
&������������%����%������������������%����&������������%����%�.�������������������&���������������%����%�.������������������������
����������������!���������)��������'������������������������!�������)�������'��������
��3��
��3��
��'3��
��)3��
��!3��
���3��
���3��
| FIGURE 9 | Results of CBA for historical performance of embankments
Main results
Historical embankment performanceIn the cost-benefit analysis of theRohini Basin’s embankments’ historicalperformance from the beginning ofdevelopment (1973) to present, costs andbenefits develop over time based on thepreviously described embankmentconstruction pattern. At the same timeannual benefits, based on thedifference between the 2007 with–andwithout–embankment loss-frequencycurves, were adapted to exposure dynamics.Travelling backwards in time, benefits weretherefore reduced based on historicallylower populations in the basin.
Inconsistencies arise in that, while the current with-embankment loss-frequency curvesare based on actual embankment performance, the adaptation of the curves to thetheoretical, without-embankment situation is based on technically modelled floodedareas. Although the without-embankments modelling can be considered relativelyaccurate, the with-embankments modelling assumes perfect embankment performance(sufficient maintenance and no breaches/failures during floods), which historically hasnot been the case. The with-embankment model therefore underestimates the realityexperienced in terms of areas flooded.
Since theoretical, without-embankment losses are simply with-embankment losses pro-rated based on modelled, without–verses with-embankment flooded areas, an increasein modelled with-embankment flooded areas results in a decrease in theoretical without-embankment losses. This in turn decreases embankment benefits, as they are thedifference between without- and with-embankment losses. Logically, embankmentbreaches and failures lead to reduced embankment benefits.
To capture this, based on observed embankment performance during the 1998 and2007 events, it was assumed that, historically for the with-embankment condition, a 50-year flood actually experienced 100-year losses. Further shifting the loss-frequencyrelationship to reflect realistic embankment performance, it then follows that a 100-year flood actually would have experienced 200-year losses, and a 200-year flood wouldhave experienced 250-year losses.
Maintenance costs were set based on real practices (as opposed to 4% of capital costs)as previously discussed. Figure 9 shows the results of the analysis, in the form of thebenefit/cost ratio, under multiple modelling assumptions and a range of discount rates.
Traditional engineering analysis of infrastructure projects tends to ignore disbenefitsand often does not capture all societal costs. Such an approach based on officialembankment costs and hydrologic engineering analysis yielded, at a discount rate of
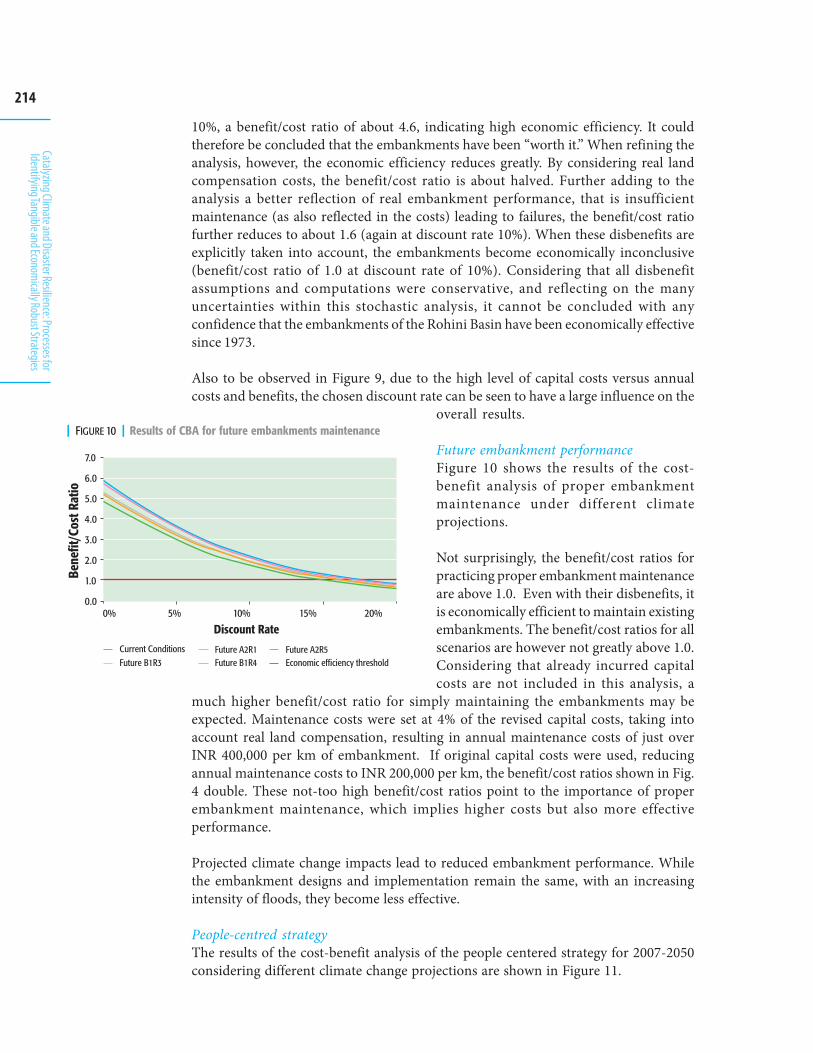
214
Catalyzing Climate and Disaster Resilience: Processes for
Identifying Tangible and Economically Robust Strategies
(3�
)3�
"3�
!3�
3�
�3�
�3�
�3�
���
�����
����
����
��� �������"�� ������������������ ���"�� ������������
�� ��������
9���������%%��������� � ���&�����&�������� ������,�1� ������,�1"������-�1 ������-�1!
| FIGURE 10 | Results of CBA for future embankments maintenance
10%, a benefit/cost ratio of about 4.6, indicating high economic efficiency. It couldtherefore be concluded that the embankments have been “worth it.” When refining theanalysis, however, the economic efficiency reduces greatly. By considering real landcompensation costs, the benefit/cost ratio is about halved. Further adding to theanalysis a better reflection of real embankment performance, that is insufficientmaintenance (as also reflected in the costs) leading to failures, the benefit/cost ratiofurther reduces to about 1.6 (again at discount rate 10%). When these disbenefits areexplicitly taken into account, the embankments become economically inconclusive(benefit/cost ratio of 1.0 at discount rate of 10%). Considering that all disbenefitassumptions and computations were conservative, and reflecting on the manyuncertainties within this stochastic analysis, it cannot be concluded with anyconfidence that the embankments of the Rohini Basin have been economically effectivesince 1973.
Also to be observed in Figure 9, due to the high level of capital costs versus annualcosts and benefits, the chosen discount rate can be seen to have a large influence on the
overall results.
Future embankment performanceFigure 10 shows the results of the cost-benefit analysis of proper embankmentmaintenance under different climateprojections.
Not surprisingly, the benefit/cost ratios forpracticing proper embankment maintenanceare above 1.0. Even with their disbenefits, itis economically efficient to maintain existingembankments. The benefit/cost ratios for allscenarios are however not greatly above 1.0.Considering that already incurred capitalcosts are not included in this analysis, a
much higher benefit/cost ratio for simply maintaining the embankments may beexpected. Maintenance costs were set at 4% of the revised capital costs, taking intoaccount real land compensation, resulting in annual maintenance costs of just overINR 400,000 per km of embankment. If original capital costs were used, reducingannual maintenance costs to INR 200,000 per km, the benefit/cost ratios shown in Fig.4 double. These not-too high benefit/cost ratios point to the importance of properembankment maintenance, which implies higher costs but also more effectiveperformance.
Projected climate change impacts lead to reduced embankment performance. Whilethe embankment designs and implementation remain the same, with an increasingintensity of floods, they become less effective.
People-centred strategyThe results of the cost-benefit analysis of the people centered strategy for 2007-2050considering different climate change projections are shown in Figure 11.
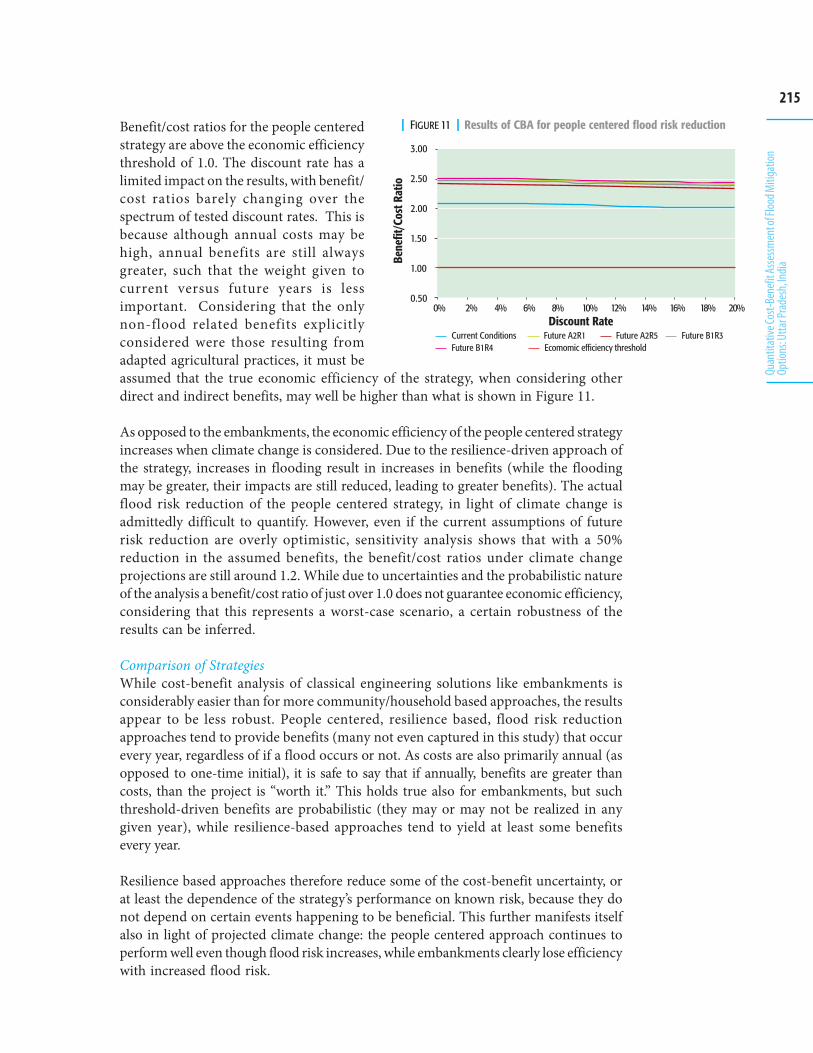
215
Quan
titat
ive Co
st-Be
nefit
Asse
ssmen
t of F
lood M
itiga
tion
Optio
ns: U
ttar P
rade
sh, In
dia
3��
�3"�
�3��
�3"�
�3��
�3"�
���
�����
����
����
�� ��������
9���������%%��������� � ���&�����&�������� ������,�1� ������,�1" ������-�1 ������-�1!
��������������������������!�����������)�����������'������������������������������������!����������)�����������'������������
| FIGURE 11 | Results of CBA for people centered flood risk reductionBenefit/cost ratios for the people centeredstrategy are above the economic efficiencythreshold of 1.0. The discount rate has alimited impact on the results, with benefit/cost ratios barely changing over thespectrum of tested discount rates. This isbecause although annual costs may behigh, annual benefits are still alwaysgreater, such that the weight given tocurrent versus future years is lessimportant. Considering that the onlynon-flood related benefits explicitlyconsidered were those resulting fromadapted agricultural practices, it must beassumed that the true economic efficiency of the strategy, when considering otherdirect and indirect benefits, may well be higher than what is shown in Figure 11.
As opposed to the embankments, the economic efficiency of the people centered strategyincreases when climate change is considered. Due to the resilience-driven approach ofthe strategy, increases in flooding result in increases in benefits (while the floodingmay be greater, their impacts are still reduced, leading to greater benefits). The actualflood risk reduction of the people centered strategy, in light of climate change isadmittedly difficult to quantify. However, even if the current assumptions of futurerisk reduction are overly optimistic, sensitivity analysis shows that with a 50%reduction in the assumed benefits, the benefit/cost ratios under climate changeprojections are still around 1.2. While due to uncertainties and the probabilistic natureof the analysis a benefit/cost ratio of just over 1.0 does not guarantee economic efficiency,considering that this represents a worst-case scenario, a certain robustness of theresults can be inferred.
Comparison of StrategiesWhile cost-benefit analysis of classical engineering solutions like embankments isconsiderably easier than for more community/household based approaches, the resultsappear to be less robust. People centered, resilience based, flood risk reductionapproaches tend to provide benefits (many not even captured in this study) that occurevery year, regardless of if a flood occurs or not. As costs are also primarily annual (asopposed to one-time initial), it is safe to say that if annually, benefits are greater thancosts, than the project is “worth it.” This holds true also for embankments, but suchthreshold-driven benefits are probabilistic (they may or may not be realized in anygiven year), while resilience-based approaches tend to yield at least some benefitsevery year.
Resilience based approaches therefore reduce some of the cost-benefit uncertainty, orat least the dependence of the strategy’s performance on known risk, because they donot depend on certain events happening to be beneficial. This further manifests itselfalso in light of projected climate change: the people centered approach continues toperform well even though flood risk increases, while embankments clearly lose efficiencywith increased flood risk.
216
Catalyzing Climate and Disaster Resilience: Processes for
Identifying Tangible and Economically Robust Strategies
Estimating the costs and benefits of the embankment strategy proved morestraightforward than the people centered strategy. Embankments are engineeringconstructions with specific dimensions and thus costs, as well as threshold drivendesigns that make it relatively easy to estimate benefits. These are, however, challengedby the primary assumptions that embankments will always be perfectly maintainedand subsequently perform as planned, and that all flood losses including thoseinvolving financial flows and regional supplies, are reduced proportionally to thereduced area of flooding.
People centered benefits are more difficult to assess. Assumptions must be made onintervention impacts at the household level, also varying by flood intensity. Further,the combining of benefits of multiple interventions, while performed linearly in thisstudy, is in reality, likely not a simple sum of benefits. As different interventions providebenefits, behaviours and risk choices may change, leading to dynamic starting pointsfor other benefits. Non-flood related benefits, while clearly of importance to peoplecentered strategies, may also be difficult to quantify.
In theory, the resource management of a people centered strategy, defined by relativelyhigh annual costs, should be left to the served communities and includeself propagating resource mobilization (return on investments). It also, however, begsthe question of securing guaranteed long-term outside support as opposed to one-off“donations.”
Cost-Benefit Analysis Issues
EvaluationIntense data collection efforts in the Rohini Basin provided very useful insights intohousehold flood impacts and coping strategies, particularly through the survey. Atthe same time, however, the collected data still provided only an incomplete picture offlood losses for two large and recent events. Broad assumptions were needed to estimatevarious categories of losses, both at the household and basin levels. In light of themultitude of uncertainties introduced during other stages of the cost-benefit analysis,the data collection effort, while indeed increasing confidence in assumptions, cannotbe considered to have been worthwhile in terms of improving the cost-benefit analysisresults.
Given the vast uncertainties in the collected data, risk analysis and cost, benefit anddisbenefit estimations, the results of cost-benefit analyses are racked with compoundeduncertainty. Final numbers must therefore be treated in terms of order of magnitudeto draw reasonable conclusions, and a benefit/cost ratio of over 1.0 cannot withouthesitation be accepted as an indicator that an intervention is “worth it.”
While the absolute results may not always be robust, the process of developing theanalysis itself was quite useful. Beyond the fundamental challenge of risk analysis,assumptions about disaster reduction strategies were developed in a transparent andlogical manner. Particularly for people centered approaches, the compounding ofbenefits had to be considered, possibly also contributing to the optimization of limitedresources. Without transparent and detailed discussions between the involved
217
Quan
titat
ive Co
st-Be
nefit
Asse
ssmen
t of F
lood M
itiga
tion
Optio
ns: U
ttar P
rade
sh, In
dia
stakeholders, however, cost-benefit analysis can be easily manipulated and thusmisused.
For the people centered, flood risk reduction strategy, cost-benefit analysis was usedto provide an aggregated economic analysis of the full strategy. It could just as easilybe applied individually to each intervention to provide component evaluations. Thiswould, however, lead to incomplete results as some more coordination driven actions,while contributing to the overall strategy impacts, may on their own provide littlemonetizable risk reduction benefits (for example, the development of self help groups).
A known drawback of cost-benefit analysis is that it does not consider distributionalaspects, that is “who pays?” and “who benefits?” This continues to be a challengewhen analyzing centralized disaster reduction strategies like embankments, but issomewhat better handled through the inherent designs of people centered riskreduction strategies.
Possibilities for improvementProvided the necessary data were available, the hydroclimatologic hazard analysiscould well be refined by utilizing more complex analysis methods. Given the intensedata acquisition required for this, as well as current limitations on climate modelling,such an effort is likely not worth the effort in terms of improving overall results. Thisconclusion is further supported by the identified analysis limitations: results shouldbe considered in terms of orders of magnitude with the process being more importantthan the exact values.
As discussed, the cost-benefit analysis did not explicitly consider who loses and whobenefits from disaster reduction interventions (“distributional aspects”). Suchinformation is particularly critical for specifically targeting assistance to the poorand vulnerable. It is thus important to simultaneously consider more qualitativevulnerability, preference and risk reduction analyses. These should help guide notonly strategy design, but also support assumptions used within the cost-benefitanalysis. Less tangible and therefore difficult to monetize costs, benefits and disbenefitswould be given due consideration, unlike in the current approach.
The analysis as performed has captured only benefits with regards to reductions inimmediate asset losses. Flow effects, such as dynamic impacts on household income,savings and consumption over many years, are better indicators for individual andsocietal welfare and changes therein, due to shocks such as disasters. In our case, asseteffects were used as a proxy for the flow effects, which may be sufficient given the scopeof the analysis. A more comprehensive, yet more complex analysis such as conductedin the Uttar Pradesh Drought case (Chapter 7) in this volume, would better reflectlong-term welfare issues.
218
Catalyzing Climate and Disaster Resilience: Processes for
Identifying Tangible and Economically Robust Strategies
Flood Risk Reduction Strategies
This study projects that flood impacts in the Rohini Basin will increase in the future(to 2050) due to climate change. Smaller floods will occur more frequently (abouttwice as often as they are now experienced), while rarer but more intense floods willremain relatively consistent. This will result in a twofold increase in future averageannual economic loss due to floods.
Historical analysis of embankments following a strict engineering cost-benefit analysisshows a high benefit/cost ratio, indicating economically efficient performance.However, when conservative estimates of disbenefits, more realistic costs and actualstructural performance are incorporated, the ratio reduces substantially. Given themany uncertainties involved, it cannot be concluded that the Rohini Riverembankments have been, in overall economic terms, cost-effective. Future analysisindicates that proper embankment maintenance, even under climate changeprojections, is economically efficient. Projected climate change, however, will reduceembankment economic performance.
The benefit/cost ratio for the people centered strategy indicates economic efficiencyfor all climate change scenarios. Moreover, the results are less dependent on thediscount rate because benefits are greater than costs every year, even accruing in non-flood years. In contrast to embankments, the economic efficiency of the people centeredstrategy does not reduce due to projected climate change impacts. The resilience-driven approach of the strategy means increased flood risk does not reduce overallbenefits, whereas the threshold-driven embankments depend upon certain design floodsto optimize benefits.
Disaster Risk Reduction Policy
Pilot projects that demonstrate optimal design, implementation and performance ofa decentralized, resilience-driven package of interventions need to be initiated. Whileproper maintenance of existing embankments is important, additional state resources
Conclusions
219
Quan
titat
ive Co
st-Be
nefit
Asse
ssmen
t of F
lood M
itiga
tion
Optio
ns: U
ttar P
rade
sh, In
dia
should be directed towards piloting and scaling up “softer” flood risk reductionstrategies that enhance the resilience of vulnerable populations.
In order to ensure local relevance and applicability, a people centered approach requiresdecentralized approaches, with local level stakeholder participation in the developmentof disaster management plans, including identification and implementation of themost appropriate interventions. Most of the financial management of theseinterventions should be left to communities. Interventions providing sufficient returnson investments will likely be the most viable and sustainable over the long term.Decentralized management however, is difficult to put into practice, particularly givenlimited local capacities and inflexibility of a highly bureaucratic state.
As a result, there is a need to strengthen the capacity of local level institutions. Stateinstitutions are often ill-equipped, or potentially unsuitable to implement these locallevel options. While civil society organisations have experience of working withcommunities and facilitating innovative approaches, they may not have the reach orcapacity to operate at a larger scale. Furthermore, these organizations must shiftfrom the existing “relief ” focus, to one of long-term sustainable development.
Local governing bodies (such as the Panchayat Raj Institutions), in part because offinancial dependence, are sometimes more accountable to higher levels of state thanto the people they represent. This may hinder their ability to respond to localstakeholder priorities and needs. These local level bodies also generally lack capacityfor planning and implementation of large-scale interventions. Local level resourcemanagement (e.g. water user groups) and credit institutions (e.g. self help groups)may facilitate implementation of interventions, but lack political legitimacy. Ideally,processes that bring together Panchayat Raj Institutions and NGOs to facilitate peoplecentered risk reduction activities will be most effective.
Supporting Decision-Making and Policy Development
Cost-benefit analysis provides a useful support tool for decision-making and policydevelopment for disaster risk reduction. However, the limitations in applying cost-benefit analysis should also be considered. In this study, a simplified estimation of thecosts and benefits of embankments was relatively straightforward, but challenged byissues of proper embankment maintenance and vast loss assumptions. People centeredcost and benefits are even more difficult to assess, with assumptions required not onlyat the household level, but also with regards to compound impacts of multipleinterventions. Add to this vast uncertainty in the risk data, assumptions and analysis,as well as intervention disbenefits, the results of cost-benefit analyses themselves arehighly uncertain. This is even more pronounced when climate change is taken intoconsideration. To draw reasonable and reliable conclusions, final numbers must betreated in terms of order of magnitude.
Furthermore, quantitative cost-benefit analysis does not capture distributional (Whobenefits? Who loses?) and non-monetizable aspects of disaster risk reductioninterventions. It should thus not be used as a standalone decision-making metric, but
220
Catalyzing Climate and Disaster Resilience: Processes for
Identifying Tangible and Economically Robust Strategies
rather in conjunction with vulnerability-based, stakeholder-driven processes. Tocomplement this approach, qualitative evaluation provides insights about diversestakeholder perceptions and needs, as well as varied benefits and impacts of potentialdisaster risk reduction strategies on different locations and communities. Non-quantifiable elements such as issues related to equity and gender, as well as historicalperspectives, are best understood through qualitative methods.
The real benefit from cost-benefit analysis lies in the framework and process used.The approach provides a logical and transparent framework for organizing andreviewing assumptions. It also provides a clear basis that key stakeholders can utilizeto evaluate tradeoffs and implications of their own assumptions. As a result, it canhelp operationalize and promote dialogue and integration of policies and programmesacross ministries, departments and organizations.

221
Quan
titat
ive Co
st-Be
nefit
Asse
ssmen
t of F
lood M
itiga
tion
Optio
ns: U
ttar P
rade
sh, In
dia
Bibliography
Agarwal, A. and Chak, A. (eds) (1991) Floods, Flood Plain and Environmental Myths,State of India’s Environment: A Citizen’s Report. New Delhi: Centre forScience and Environment.
Barh Mukti Abiyan (1998) Proceedings of the Seminar on River Crisis in South Asia,21-22 June. Patna, India: Bar Mukti Abiyan.
Barh Mukti Abiyan (1997) Proceedings of the Second Delegates Conference, 5-6 April.Patna, India: Barh Mukti Abiyan.
Christensen, J.H., et al. (2007) ‘Regional Climate Projections’ in S. Solomon, D. Qin,M. Manning, Z. Chen, M. Marquis, K.B. Avery, M. Tignor and H.L. Miller(eds), Climate Change 2007: The Physical Science Basis, Contribution ofWorking Group I to the Fourth Assessment Report of theIntergovernmental Panel on Climate Change. Cambridge, UK: CambridgeUniversity Press.
Government of India (May 3, 2008) ‘Flood Management Programme’. Press release,http://pib.nic.in/release/release.asp?relid=38419 [accessed June 5, 2008].
Kumar, A., C. Bhanu, C. Maji, D. Banerji, D.K. Mishra and H. Takkar (1999) TheTroubled Waters: A report on the 1998 Floods in Eastern Uttar Pradesh.The Independent People’s Commission on Floods in Uttar Pradesh. NewDelhi: Oxfam (India) Trust.
Manor, J. (2004) ‘User Committees: A Potentially Damaging Second Wave ofDecentralization?’ European Journal of Development Research 16(1): 194-213.
Menon, A., P. Singh, E. Shah, S. Paranjape, and J.J. Joy (2007) Community-based NaturalResource Management: Issues and Cases from South Asia. New Delhi: SAGE.
Mishra, D.K. (2008a) Trapped! Between the Devil and Deep Waters: The Story of Bihar’sKosi River. New Delhi: SANDRP and People’s Science Institute.
Mishra, D.K. (2008b) ‘Bihar Floods: The Inevitable Has Happened’, Economic andPolitical Weekly, 43(46): 47-52.
Mishra, D.K. (1997)‘The Bihar Flood Story’, Economic and Political Weekly 32(35):2206-2217.
222
Catalyzing Climate and Disaster Resilience: Processes for
Identifying Tangible and Economically Robust Strategies
Mishra, D.K. (1994) Barh Se Trast, Sinchai Se Past: Uttar Bihar ki Vyatha Katha (Hindi).Patna, India: Barh Mukti Abhiyan.
National Disaster Management Authority (NDMA) (2008) National DisasterManagement Guidelines: Management of Floods. New Delhi: Governmentof India.
Office of the Registrar General of India (2001) Census of India. New Delhi: RegistrarGeneral and Census Commissioner. http://www.censusindia.gov.in/[accessed June 5, 2008].
PFI and PRB (2007) ‘The Future Population of India: A Long-range DemographicView’. Report Brochure, August 2007. New Delhi: Population Foundationof India and Population Reference Bureau.
Programme Evaluation Organisation (1979) Evaluation of the Kosi Embankment: ACase Study. New Delhi: Planning Commission, Government of India.
Ramakrishnan, R., M. Dubey, R. Raman, P. Baumann, and J. Farrington. (2002)Panchayati Raj and Natural Resource Management: How to DecentraliseManagement over National Resources. London: Overseas DevelopmentInstitute.
Seminar, 1999. 478 (June)Singh, A.K. (2007) ‘Poverty Trends and Correlates in Uttar Pradesh’. Discussant Note
for the International Seminar on Revisiting the Poverty Issue: Measurement,Identification and Eradication Strategies, A N Sinha Institute of SocialStudies (ANSISS), Patna, India (20-22 July).
Singh, P. and S. Paranjape, S. (2007) ‘Sustainable Livelihoods in Riverine Charland:The Case of Gono Chetona’, in Ajit Menon et al. (eds) Community-basedNatural Resource Management: Issues and Cases from South Asia. NewDelhi: SAGE.
Thornthwaite, C.W. and J.R. Mather (1955) ‘The Water Balance’, Climatology 8(8): 1-104.
Todini, E. (1996) ‘The ARNO Rainfall-Runoff Model’, Journal of Hydrology 175: 339–382.USACE (2006) HEC-RAS River Analysis System: User’s Manual. U.S. Army Corps of
Engineers, Institute for Water Resources, Hydrologic Engineer Center,Davis, USA, Version 4.0 Beta, November 2006. http://www.hec.usace.army.mil/software/hec-ras/ [accessed June 5, 2008].
Wajih, S.A. and V. Kumar (1992) Impact of Degrading Ecosystem on Health: A Study inChronically Flood Prone and Waterlogged Areas of Eastern U.P. Gorakhpur,India: Gorakhpur Environmental Action Group.
Combining Innovative Strategies forEffective Drought Risk Management:
Costs and Benefits of Insurance and Irrigationin Uttar Pradesh, India
7C H A P T E R
This chapter is a joint product of the above mentioned authors. We further gratefully acknowledge critical assistance by Sunandan Tiwari,Mamta Borgoyary and Sharmistha Bose (WII), who all provided extensive input for designing the surveys- both the quantitative and qualitativeassessments- and were also involved in field work for the qualitative survey. Abhilash Srivastav and Gyaneshwar Singh (GEAG) providedimportant support for collecting the necessary secondary data and co-ordinating the survey operation. The quantitative and qualitativeassessment would not have been possible without the vital support of many field team members of GEAG for conducting the actual field survey.
Reinhard Mechler (IIASA)Stefan Hochrainer (IIASA)
Praveen Singh (WII)Shashikant Chopde (WII)
Shiraz A. Wajih (GEAG)Daniel Kull (IIASA) &
The Risk to Resilience Study Team
224
Catalyzing Climate and Disaster Resilience: Processes for
Identifying Tangible and Economically Robust Strategies
Country: IndiaLocation: Nautanwa tehsil, Maharajganj district, eastern Uttar PradeshIssue: High frequency, low intensity drought contributes to endemic poverty in the area.
High intensity, low frequency droughts also have significant negative impacts onthe economic bases and livelihoods of households. Boreholes for groundwaterirrigation and micro-insurance are cost effective strategies that can reduce thefinancial risk drought poses to poor households
Key Concepts
The study area receives only 20-30% of its total annual rainfall outside the monsoon monthsof June through September. Most households support themselves through agriculturalactivities and are vulnerable to droughts. When rain fails, is deficient, or is untimely, cropsplanted during the months of October through the end of May can fail.Many households lack protective buffers against climate variability. A simple climatedownscaling model for the area reveals that climate variability is likely to increase in allmonths of the year by 2050. It is very likely that rainfall during the non-monsoon monthswill decrease, with possible rainfall reductions ranging from -1% to -50% of the historicaverage (1976-2006), depending on the season and the climate change scenario.The study assessed the costs and benefits of two drought adaptation strategies forhouseholds below the poverty line: constructing boreholes with public resources forgroundwater irrigation and risk spreading through subsidized crop micro-insurance. Bothstrategies yield benefit cost ratios greater than one. A combination of the two strategiesprovides a better cost benefit ratio than either intervention alone. The benefits of the twostrategies increase when potential climate change impacts are considered.Pumping groundwater from boreholes for irrigation is best suited for reducing droughtrisk associated with high frequency, low intensity droughts. Access to groundwater irrigationis currently constrained by inadequate and insufficient electricity to drive the pumps. Insteadhouseholds rely on diesel pumps, which are expensive to operate and can stretch budgets ifirrigation is necessary several times a year or for long periods of time. Households belowthe poverty line can ill afford pumping for regular irrigation. Thus, borehole pumping isonly a suitable drought risk reduction measure for a short-duration, low intensity drought.Crop micro-insurance, when subsidized, is an effective risk and poverty reduction strategyfor poor households against high-intensity, infrequently occurring drought events. If thepremium is not subsidized by at least half, poor households are, however, unable to affordthis protection. The insurance scheme considers households at or below the poverty lineand hence the subsidy is justified as a poverty reduction investment. Additionally, if weconsider the cost of post disaster relief spending, the cost of the premium paid by thegovernment is comparable in magnitude.Although theoretical in nature and somewhat simplistic in assumptions, this studydemonstrates the need for ingenuity in disaster risk reduction strategies and targetingthem according to specific needs for economic efficiency.
225
Com
bining
Inno
vativ
e Stra
tegie
s for
Effec
tive D
roug
ht Ri
skM
anag
emen
t: Cos
ts an
d Ben
efits
of In
sura
nce a
nd Irr
igatio
n in
Utta
r Pra
desh
, India
Drought related disasters are a major factor contributing to endemic poverty,particularly in developing countries, where a large proportion of the populationdepends on agricultural livelihoods. Such disasters, and the associatedimpoverishment of large populations, are likely to grow if climate variability increasesas a consequence of global change processes. Furthermore, while large-scale droughtsmay have the sufficient, immediate impact to draw the attention and concern ofglobal actors, the increases in incremental losses associated with changes in thevariability and unpredictability of climate conditions may have an equally greatimpact on vulnerable populations. Strategies for reducing this impact are, as a result,central to poverty alleviation and adaptation to climate change.
The case study presented here analyzes the costs and benefits of alternative strategiesfor mitigating the impact of drought on rural livelihoods in Uttar Pradesh, India.The case study explores both insurance mechanisms for spreading drought risk and,as an alternative, the development of groundwater irrigation for reducing such risk.The study draws attention toward approaches to drought mitigation that are basedon integrated combinations of strategies, which may perform better than a single setof techniques or mechanisms. While the study is based on analysis within a relativelynarrow case area, the results have more general implications for the development ofeffective strategies for responding to drought and other challenges associated withglobal climate change.
Our analysis indicates that a strategic combination of irrigation, plus an insurancestrategy, has higher return rates than either technique practiced on its own.Specifically, the study suggests that the benefits of insurance are likely to decline inrelation to the costs if climatic variability increases substantially because of climatechange, thereby necessitating its use in combination with a more conventionalstrategy.
Introduction
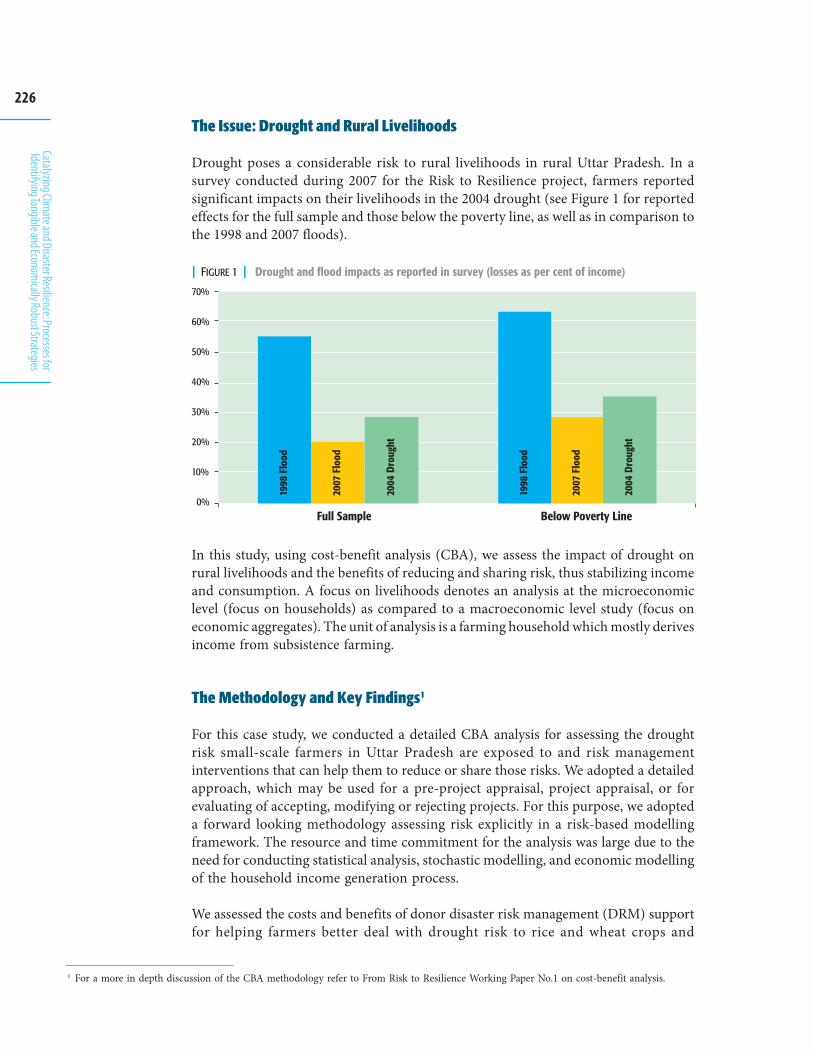
226
Catalyzing Climate and Disaster Resilience: Processes for
Identifying Tangible and Economically Robust Strategies
The Issue: Drought and Rural Livelihoods
Drought poses a considerable risk to rural livelihoods in rural Uttar Pradesh. In asurvey conducted during 2007 for the Risk to Resilience project, farmers reportedsignificant impacts on their livelihoods in the 2004 drought (see Figure 1 for reportedeffects for the full sample and those below the poverty line, as well as in comparison tothe 1998 and 2007 floods).
In this study, using cost-benefit analysis (CBA), we assess the impact of drought onrural livelihoods and the benefits of reducing and sharing risk, thus stabilizing incomeand consumption. A focus on livelihoods denotes an analysis at the microeconomiclevel (focus on households) as compared to a macroeconomic level study (focus oneconomic aggregates). The unit of analysis is a farming household which mostly derivesincome from subsistence farming.
The Methodology and Key Findings1
For this case study, we conducted a detailed CBA analysis for assessing the droughtrisk small-scale farmers in Uttar Pradesh are exposed to and risk managementinterventions that can help them to reduce or share those risks. We adopted a detailedapproach, which may be used for a pre-project appraisal, project appraisal, or forevaluating of accepting, modifying or rejecting projects. For this purpose, we adopteda forward looking methodology assessing risk explicitly in a risk-based modellingframework. The resource and time commitment for the analysis was large due to theneed for conducting statistical analysis, stochastic modelling, and economic modellingof the household income generation process.
We assessed the costs and benefits of donor disaster risk management (DRM) supportfor helping farmers better deal with drought risk to rice and wheat crops and
| FIGURE 1 | Drought and flood impacts as reported in survey (losses as per cent of income)
1 For a more in depth discussion of the CBA methodology refer to From Risk to Resilience Working Paper No.1 on cost-benefit analysis.
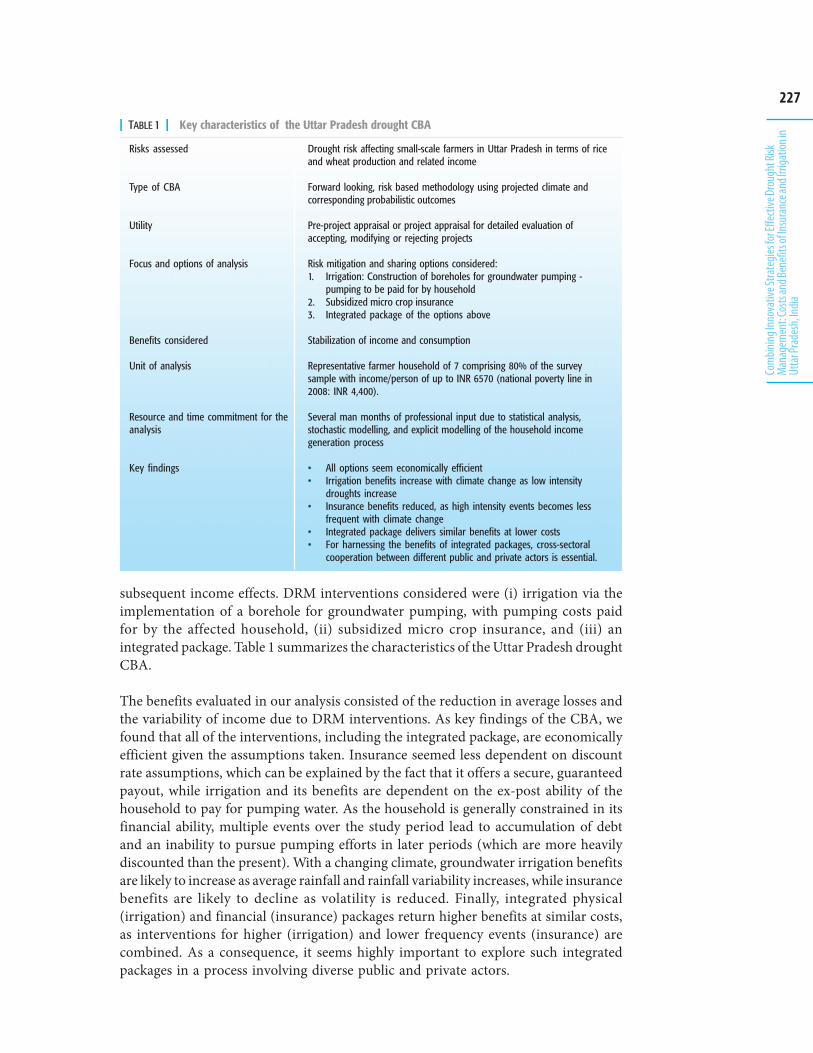
227
Com
bining
Inno
vativ
e Stra
tegie
s for
Effec
tive D
roug
ht Ri
skM
anag
emen
t: Cos
ts an
d Ben
efits
of In
sura
nce a
nd Irr
igatio
n in
Utta
r Pra
desh
, India
subsequent income effects. DRM interventions considered were (i) irrigation via theimplementation of a borehole for groundwater pumping, with pumping costs paidfor by the affected household, (ii) subsidized micro crop insurance, and (iii) anintegrated package. Table 1 summarizes the characteristics of the Uttar Pradesh droughtCBA.
The benefits evaluated in our analysis consisted of the reduction in average losses andthe variability of income due to DRM interventions. As key findings of the CBA, wefound that all of the interventions, including the integrated package, are economicallyefficient given the assumptions taken. Insurance seemed less dependent on discountrate assumptions, which can be explained by the fact that it offers a secure, guaranteedpayout, while irrigation and its benefits are dependent on the ex-post ability of thehousehold to pay for pumping water. As the household is generally constrained in itsfinancial ability, multiple events over the study period lead to accumulation of debtand an inability to pursue pumping efforts in later periods (which are more heavilydiscounted than the present). With a changing climate, groundwater irrigation benefitsare likely to increase as average rainfall and rainfall variability increases, while insurancebenefits are likely to decline as volatility is reduced. Finally, integrated physical(irrigation) and financial (insurance) packages return higher benefits at similar costs,as interventions for higher (irrigation) and lower frequency events (insurance) arecombined. As a consequence, it seems highly important to explore such integratedpackages in a process involving diverse public and private actors.
Risks assessed
Type of CBA
Utility
Focus and options of analysis
Benefits considered
Unit of analysis
Resource and time commitment for theanalysis
Key findings
Drought risk affecting small-scale farmers in Uttar Pradesh in terms of riceand wheat production and related income
Forward looking, risk based methodology using projected climate andcorresponding probabilistic outcomes
Pre-project appraisal or project appraisal for detailed evaluation ofaccepting, modifying or rejecting projects
Risk mitigation and sharing options considered:1. Irrigation: Construction of boreholes for groundwater pumping -
pumping to be paid for by household2. Subsidized micro crop insurance3. Integrated package of the options above
Stabilization of income and consumption
Representative farmer household of 7 comprising 80% of the surveysample with income/person of up to INR 6570 (national poverty line in2008: INR 4,400).
Several man months of professional input due to statistical analysis,stochastic modelling, and explicit modelling of the household incomegeneration process
• All options seem economically efficient• Irrigation benefits increase with climate change as low intensity
droughts increase• Insurance benefits reduced, as high intensity events becomes less
frequent with climate change• Integrated package delivers similar benefits at lower costs• For harnessing the benefits of integrated packages, cross-sectoral
cooperation between different public and private actors is essential.
| TABLE 1 | Key characteristics of the Uttar Pradesh drought CBA
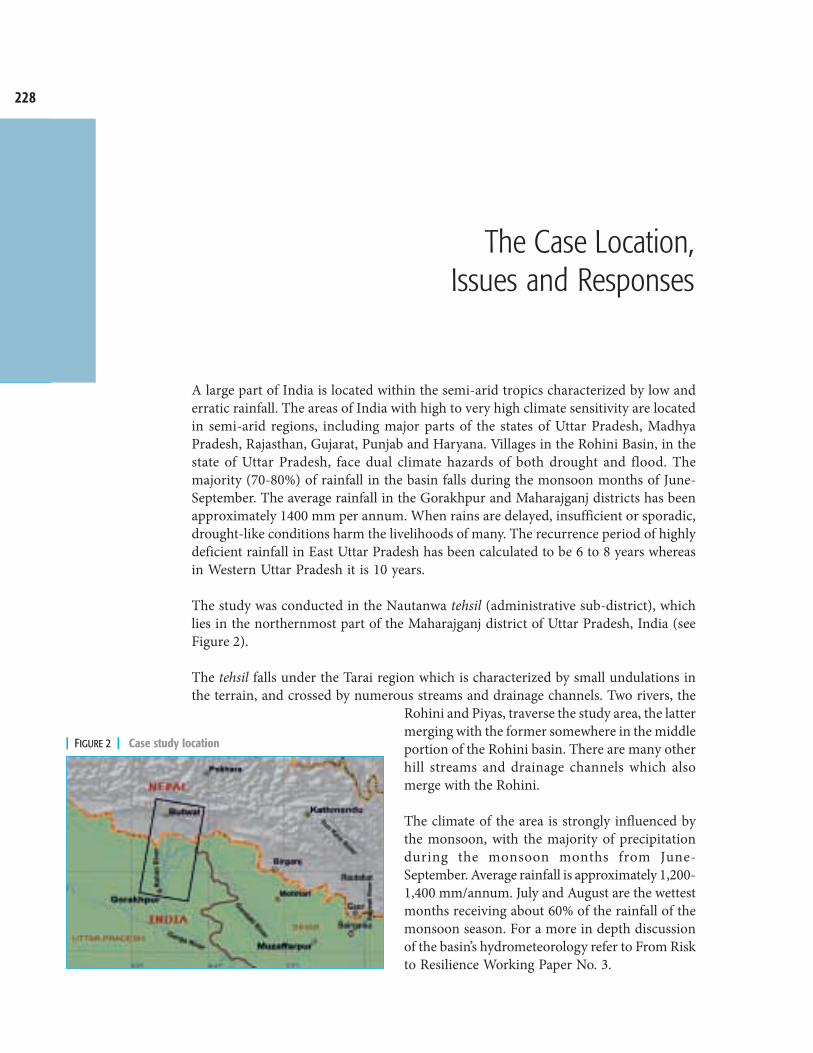
228
Catalyzing Climate and Disaster Resilience: Processes for
Identifying Tangible and Economically Robust Strategies
The Case Location,Issues and Responses
A large part of India is located within the semi-arid tropics characterized by low anderratic rainfall. The areas of India with high to very high climate sensitivity are locatedin semi-arid regions, including major parts of the states of Uttar Pradesh, MadhyaPradesh, Rajasthan, Gujarat, Punjab and Haryana. Villages in the Rohini Basin, in thestate of Uttar Pradesh, face dual climate hazards of both drought and flood. Themajority (70-80%) of rainfall in the basin falls during the monsoon months of June-September. The average rainfall in the Gorakhpur and Maharajganj districts has beenapproximately 1400 mm per annum. When rains are delayed, insufficient or sporadic,drought-like conditions harm the livelihoods of many. The recurrence period of highlydeficient rainfall in East Uttar Pradesh has been calculated to be 6 to 8 years whereasin Western Uttar Pradesh it is 10 years.
The study was conducted in the Nautanwa tehsil (administrative sub-district), whichlies in the northernmost part of the Maharajganj district of Uttar Pradesh, India (seeFigure 2).
The tehsil falls under the Tarai region which is characterized by small undulations inthe terrain, and crossed by numerous streams and drainage channels. Two rivers, the
Rohini and Piyas, traverse the study area, the lattermerging with the former somewhere in the middleportion of the Rohini basin. There are many otherhill streams and drainage channels which alsomerge with the Rohini.
The climate of the area is strongly influenced bythe monsoon, with the majority of precipitationduring the monsoon months from June-September. Average rainfall is approximately 1,200-1,400 mm/annum. July and August are the wettestmonths receiving about 60% of the rainfall of themonsoon season. For a more in depth discussionof the basin’s hydrometeorology refer to From Riskto Resilience Working Paper No. 3.
| FIGURE 2 | Case study location
229
Com
bining
Inno
vativ
e Stra
tegie
s for
Effec
tive D
roug
ht Ri
skM
anag
emen
t: Cos
ts an
d Ben
efits
of In
sura
nce a
nd Irr
igatio
n in
Utta
r Pra
desh
, India
About 80% of the area is under cultivation. There are two main cropping seasons - themonsoon kharif and the winter rabi season. A third crop, zaid, during the summers isalso sown where artificial irrigation facilities exist. The main crops of the region arerice in kharif, wheat in rabi and vegetables and maize in zaid. Despite its late adoption,the ‘green revolution’ has changed agricultural practices. High Yield Variety (HYV)seeds have replaced the indigenous varieties of seeds and the use of chemical fertilizershas increased, along with groundwater irrigation. Although this has increased croppingintensity and crop productivity in the region, productivity still remains low by nationalor state averages.2 The main causes of low productivity are small land holdings, lack ofirrigation facilities and absence of extension services. Absence of infrastructure forfood storage, processing, communication, electricity etc. all add to the poor gains inagricultural income. There is ample scope for agricultural diversification anddevelopment of off-farm and non-farm activities.
The Risks
Although predominantly flood prone, the basin also experiences drought-likeconditions which cause widespread distress. Drought occurs due to below normal,untimely or poorly distributed rainfall. Considering that rain fed agriculture is practicedin large parts of the basin, even a slight deviation in the quantity or timing of rainfallcauses distress. The areas relatively more vulnerable to drought are the Nautanwa andLaxmipur tehsils. These tehsils are particularly vulnerable because large parts are locatedin the uplands where the soil is of an inter-mixture of clay and sand (domat)—whichretains less water—and canal networks are limited. Although irrigation from tubewells is increasing in this area, it is not economical to use groundwater to save the ricecrop, especially if rains fail during the crucial flowering stage of rice. Drought alsoaffects rabi crops in the case of an early cessation of rain; this reduces the moisturecontent of the soil thereby decreasing the productivity of wheat.
Who is Affected and How ?
When drought hits this region, the entire population, except that falling in the canalcommand area, is affected, but the extent of population effected varies according tolocation. Those living in uplands are hit hardest as there is no moisture in their land. Anumber of people whose land is closer to a stream or drainage channel frequently putan obstruction in the water and pump it to their fields, while others use groundwaterover a small area to protect their crops. Small and marginal farmers and landlesslabourers, the most vulnerable groups, suffer the effects of drought the most. They notonly lose the investments they made in the sowing and other operations but also losethe food grain they rely upon for subsistence. The landless are also heavily affected asthere is no agricultural work available locally and they lose employment opportunities.Households where one or more members have migrated outside can survive the effectsof drought if they receive income from remittances, but others have to suffer malnutritionand exploitation at the hands of local moneylenders.
2 The crop production is quite low as compared to national averages and the grain production is 21.4 and 25.6 quintals/ha in Gorakhpur andMaharajganj districts respectively.
230
Catalyzing Climate and Disaster Resilience: Processes for
Identifying Tangible and Economically Robust Strategies
The Main Strategies for Risk Reduction that are being Implemented
Historically, the main strategy employed to deal with drought and rainfall variabilityhas been surface irrigation. Parts of this tehsil fall under the command of variousperennial canal networks—Gandak canals, the Rohini canal and the Danda canal. TheRohini canal is the oldest. It was built in 1954 to irrigate a narrow strip of land on theright bank of the river. Although it was built to irrigate the kharif rice crop, it has alsohelped in the extension of the area under wheat cultivation. The Gandak and Dandacanals were built during the 1970s. Although these canals are important, only a smallarea of the study tehsil benefits from canal waters while large stretches of it are outsidethe command area.
In the 1980s, and even more in the 1990s, there was an increase in the use of groundwaterirrigation through borewells. Earlier, open dugwells were used only to irrigate a smallarea under some valuable rabi crops and for summer (zaid) vegetables. The developmentof groundwater irrigation started very late in eastern India (compared to north, westand south India). Although this region has about one-fourth of India’s usablegroundwater resources, only about one-fifth of the groundwater potential has beenexploited (Shah, 2001). The growth of groundwater irrigation in the region is mainlydue to private sector initiative rather than government policies. Apart from privateborewells, some government group tube well schemes do exist. However, these havenot been good models of efficiency or equity, and have mostly failed to deliver theexpected benefits.
Whatever little groundwater irrigation exists is further constrained by the inadequateand insufficient electricity supply in the region. Tube wells have to be run on dieselpumps and the cost of irrigation is significant. This has put a limit not only on thetotal area irrigated but also on securing the main crop—kharif rice—from rainfallvariability.3 On the other hand, groundwater irrigation does help save the rabi wheatand also gives an option of growing vegetable crops during zaid. A water market hasdeveloped in this region: those who do not have tube wells buy water from neighbouringwells and rent the diesel pumps required to deliver the purchased water to their fields.Generally, the cost of irrigation from a 5 horsepower pump comes to about INR 80 perhour. So the issue is not of irrigation availability but of affordability.
Aside from irrigation, a key strategy of the government to deal with drought is the ex-post distribution of relief to the affected population. For instance, after the drought of2004, Nautanwa was declared drought affected. All the landholders received cash relieffor crops lost on the basis of their landholding size. In some cases, the relief amountwas as little as INR 50. The relief amount hardly covered one-tenth of the cost ofsowing the fields. The timing and/or delay in relief distribution also make it more of apolitically driven event rather than a sincere attempt to cover the losses of the droughtaffected people. In most cases, the state level politicians use their clout to get theirelectoral constituency declared as disaster affected to gain popularity. Because of thisareas that are affected and need support are often left out.
3 Further, tube well irrigation for rice is possible only in the nursery preparation stage; if drought occurs anytime in the post transplantationstage then it becomes unviable to save the entire rice crop.
231
Com
bining
Inno
vativ
e Stra
tegie
s for
Effec
tive D
roug
ht Ri
skM
anag
emen
t: Cos
ts an
d Ben
efits
of In
sura
nce a
nd Irr
igatio
n in
Utta
r Pra
desh
, India
In contrast to relying on humanitarian relief, crop insurance could serve as animportant strategy for helping farmers address drought risk. Crop insurance has notyet, however, become very common in this area. Only a few big farmers have access tofinancial services such as Kisan Credit Cards (KCC) and historically only some ofthem have taken loans for agriculture. According to responses in the survey conductedfor this project, none of those surveyed are aware of the crop insurance that KCCholders have access to. They are only aware of the built-in life insurance benefit of theKCC. This is surprising, considering that in some villages, for instance Satguru, farmersare growing high investment, high-risk banana crops. In the canal irrigated villages,e.g. Koharwal, about 100 households have KCC. They all consider that it is a goodscheme as the loans are provided at low interest rates (7-9%). But even here none of theKCC holders, including the village pradhan (the elected village leader), or are aware ofthe crop insurance aspect of the KCC. Obviously banks and extension agencies of thegovernment have not done enough for raising awareness on this issue.
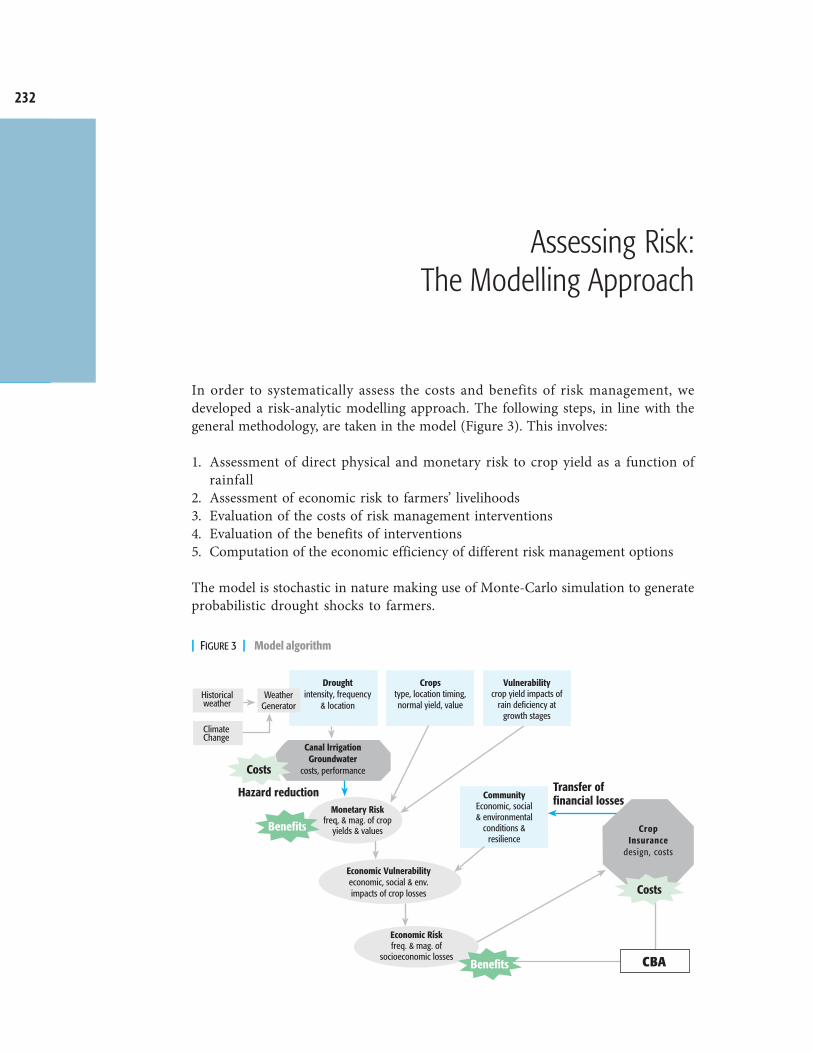
232
Catalyzing Climate and Disaster Resilience: Processes for
Identifying Tangible and Economically Robust Strategies
Assessing Risk:The Modelling Approach
In order to systematically assess the costs and benefits of risk management, wedeveloped a risk-analytic modelling approach. The following steps, in line with thegeneral methodology, are taken in the model (Figure 3). This involves:
1. Assessment of direct physical and monetary risk to crop yield as a function ofrainfall
2. Assessment of economic risk to farmers’ livelihoods3. Evaluation of the costs of risk management interventions4. Evaluation of the benefits of interventions5. Computation of the economic efficiency of different risk management options
The model is stochastic in nature making use of Monte-Carlo simulation to generateprobabilistic drought shocks to farmers.
| FIGURE 3 | Model algorithm
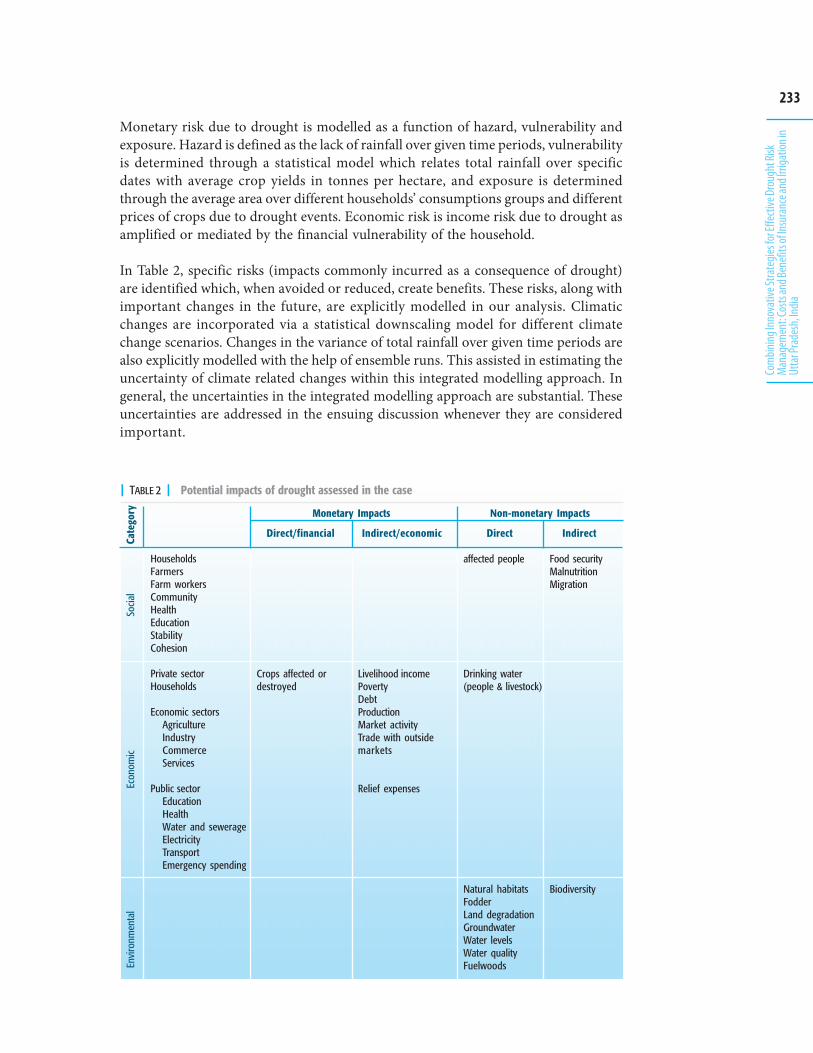
233
Com
bining
Inno
vativ
e Stra
tegie
s for
Effec
tive D
roug
ht Ri
skM
anag
emen
t: Cos
ts an
d Ben
efits
of In
sura
nce a
nd Irr
igatio
n in
Utta
r Pra
desh
, India
Monetary risk due to drought is modelled as a function of hazard, vulnerability andexposure. Hazard is defined as the lack of rainfall over given time periods, vulnerabilityis determined through a statistical model which relates total rainfall over specificdates with average crop yields in tonnes per hectare, and exposure is determinedthrough the average area over different households’ consumptions groups and differentprices of crops due to drought events. Economic risk is income risk due to drought asamplified or mediated by the financial vulnerability of the household.
In Table 2, specific risks (impacts commonly incurred as a consequence of drought)are identified which, when avoided or reduced, create benefits. These risks, along withimportant changes in the future, are explicitly modelled in our analysis. Climaticchanges are incorporated via a statistical downscaling model for different climatechange scenarios. Changes in the variance of total rainfall over given time periods arealso explicitly modelled with the help of ensemble runs. This assisted in estimating theuncertainty of climate related changes within this integrated modelling approach. Ingeneral, the uncertainties in the integrated modelling approach are substantial. Theseuncertainties are addressed in the ensuing discussion whenever they are consideredimportant.
HouseholdsFarmersFarm workersCommunityHealthEducationStabilityCohesion
Private sectorHouseholds
Economic sectorsAgricultureIndustryCommerceServices
Public sectorEducationHealthWater and sewerageElectricityTransportEmergency spending
Non-monetary ImpactsMonetary Impacts
| TABLE 2 | Potential impacts of drought assessed in the case
Socia
lEc
onom
icEn
viro
nmen
tal
Direct/financial Indirect/economic
Crops affected ordestroyed
Livelihood incomePovertyDebtProductionMarket activityTrade with outsidemarkets
Relief expenses
Drinking water(people & livestock)
affected people
Direct Indirect
Food securityMalnutritionMigration
Natural habitatsFodderLand degradationGroundwaterWater levelsWater qualityFuelwoods
Biodiversity
Cate
gory
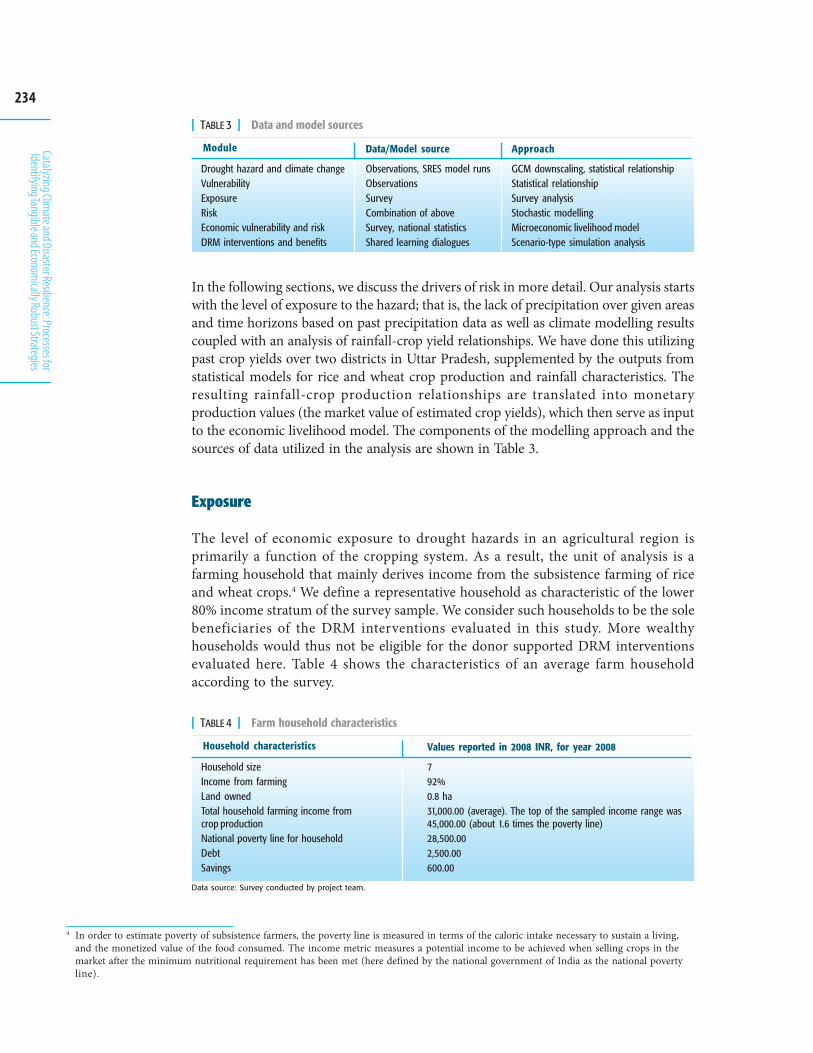
234
Catalyzing Climate and Disaster Resilience: Processes for
Identifying Tangible and Economically Robust Strategies
In the following sections, we discuss the drivers of risk in more detail. Our analysis startswith the level of exposure to the hazard; that is, the lack of precipitation over given areasand time horizons based on past precipitation data as well as climate modelling resultscoupled with an analysis of rainfall-crop yield relationships. We have done this utilizingpast crop yields over two districts in Uttar Pradesh, supplemented by the outputs fromstatistical models for rice and wheat crop production and rainfall characteristics. Theresulting rainfall-crop production relationships are translated into monetaryproduction values (the market value of estimated crop yields), which then serve as inputto the economic livelihood model. The components of the modelling approach and thesources of data utilized in the analysis are shown in Table 3.
Exposure
The level of economic exposure to drought hazards in an agricultural region isprimarily a function of the cropping system. As a result, the unit of analysis is afarming household that mainly derives income from the subsistence farming of riceand wheat crops.4 We define a representative household as characteristic of the lower80% income stratum of the survey sample. We consider such households to be the solebeneficiaries of the DRM interventions evaluated in this study. More wealthyhouseholds would thus not be eligible for the donor supported DRM interventionsevaluated here. Table 4 shows the characteristics of an average farm householdaccording to the survey.
Module Data/Model source
Drought hazard and climate changeVulnerabilityExposureRiskEconomic vulnerability and riskDRM interventions and benefits
Observations, SRES model runsObservationsSurveyCombination of aboveSurvey, national statisticsShared learning dialogues
| TABLE 3 | Data and model sources
Approach
GCM downscaling, statistical relationshipStatistical relationshipSurvey analysisStochastic modellingMicroeconomic livelihood modelScenario-type simulation analysis
Household characteristics Values reported in 2008 INR, for year 2008
Household sizeIncome from farmingLand ownedTotal household farming income fromcrop productionNational poverty line for householdDebtSavings
792%0.8 ha31,000.00 (average). The top of the sampled income range was45,000.00 (about 1.6 times the poverty line)28,500.002,500.00600.00
| TABLE 4 | Farm household characteristics
Data source: Survey conducted by project team.
4 In order to estimate poverty of subsistence farmers, the poverty line is measured in terms of the caloric intake necessary to sustain a living,and the monetized value of the food consumed. The income metric measures a potential income to be achieved when selling crops in themarket after the minimum nutritional requirement has been met (here defined by the national government of India as the national povertyline).
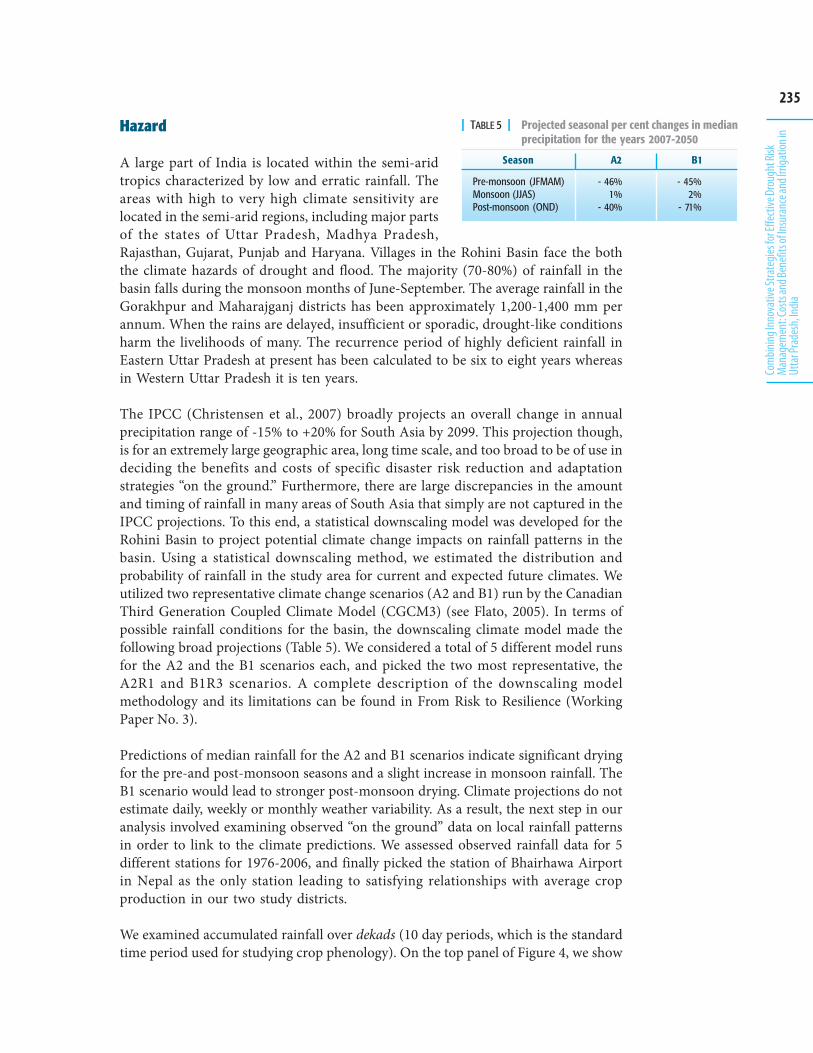
235
Com
bining
Inno
vativ
e Stra
tegie
s for
Effec
tive D
roug
ht Ri
skM
anag
emen
t: Cos
ts an
d Ben
efits
of In
sura
nce a
nd Irr
igatio
n in
Utta
r Pra
desh
, India
Hazard
A large part of India is located within the semi-aridtropics characterized by low and erratic rainfall. Theareas with high to very high climate sensitivity arelocated in the semi-arid regions, including major partsof the states of Uttar Pradesh, Madhya Pradesh,Rajasthan, Gujarat, Punjab and Haryana. Villages in the Rohini Basin face the boththe climate hazards of drought and flood. The majority (70-80%) of rainfall in thebasin falls during the monsoon months of June-September. The average rainfall in theGorakhpur and Maharajganj districts has been approximately 1,200-1,400 mm perannum. When the rains are delayed, insufficient or sporadic, drought-like conditionsharm the livelihoods of many. The recurrence period of highly deficient rainfall inEastern Uttar Pradesh at present has been calculated to be six to eight years whereasin Western Uttar Pradesh it is ten years.
The IPCC (Christensen et al., 2007) broadly projects an overall change in annualprecipitation range of -15% to +20% for South Asia by 2099. This projection though,is for an extremely large geographic area, long time scale, and too broad to be of use indeciding the benefits and costs of specific disaster risk reduction and adaptationstrategies “on the ground.” Furthermore, there are large discrepancies in the amountand timing of rainfall in many areas of South Asia that simply are not captured in theIPCC projections. To this end, a statistical downscaling model was developed for theRohini Basin to project potential climate change impacts on rainfall patterns in thebasin. Using a statistical downscaling method, we estimated the distribution andprobability of rainfall in the study area for current and expected future climates. Weutilized two representative climate change scenarios (A2 and B1) run by the CanadianThird Generation Coupled Climate Model (CGCM3) (see Flato, 2005). In terms ofpossible rainfall conditions for the basin, the downscaling climate model made thefollowing broad projections (Table 5). We considered a total of 5 different model runsfor the A2 and the B1 scenarios each, and picked the two most representative, theA2R1 and B1R3 scenarios. A complete description of the downscaling modelmethodology and its limitations can be found in From Risk to Resilience (WorkingPaper No. 3).
Predictions of median rainfall for the A2 and B1 scenarios indicate significant dryingfor the pre-and post-monsoon seasons and a slight increase in monsoon rainfall. TheB1 scenario would lead to stronger post-monsoon drying. Climate projections do notestimate daily, weekly or monthly weather variability. As a result, the next step in ouranalysis involved examining observed “on the ground” data on local rainfall patternsin order to link to the climate predictions. We assessed observed rainfall data for 5different stations for 1976-2006, and finally picked the station of Bhairhawa Airportin Nepal as the only station leading to satisfying relationships with average cropproduction in our two study districts.
We examined accumulated rainfall over dekads (10 day periods, which is the standardtime period used for studying crop phenology). On the top panel of Figure 4, we show
| TABLE 5 | Projected seasonal per cent changes in medianprecipitation for the years 2007-2050
- 46%1%
- 40%
Pre-monsoon (JFMAM)Monsoon (JJAS)Post-monsoon (OND)
Season A2
- 45%2%
- 71%
B1
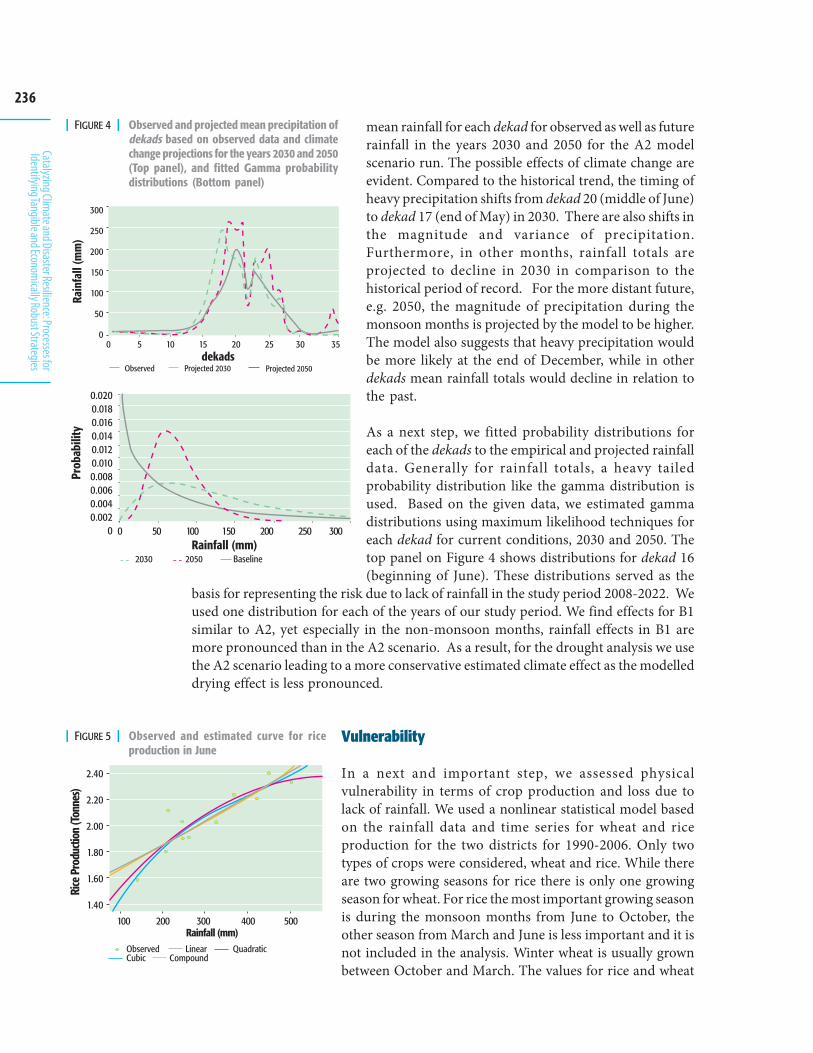
236
Catalyzing Climate and Disaster Resilience: Processes for
Identifying Tangible and Economically Robust Strategies
mean rainfall for each dekad for observed as well as futurerainfall in the years 2030 and 2050 for the A2 modelscenario run. The possible effects of climate change areevident. Compared to the historical trend, the timing ofheavy precipitation shifts from dekad 20 (middle of June)to dekad 17 (end of May) in 2030. There are also shifts inthe magnitude and variance of precipitation.Furthermore, in other months, rainfall totals areprojected to decline in 2030 in comparison to thehistorical period of record. For the more distant future,e.g. 2050, the magnitude of precipitation during themonsoon months is projected by the model to be higher.The model also suggests that heavy precipitation wouldbe more likely at the end of December, while in otherdekads mean rainfall totals would decline in relation tothe past.
As a next step, we fitted probability distributions foreach of the dekads to the empirical and projected rainfalldata. Generally for rainfall totals, a heavy tailedprobability distribution like the gamma distribution isused. Based on the given data, we estimated gammadistributions using maximum likelihood techniques foreach dekad for current conditions, 2030 and 2050. Thetop panel on Figure 4 shows distributions for dekad 16(beginning of June). These distributions served as the
basis for representing the risk due to lack of rainfall in the study period 2008-2022. Weused one distribution for each of the years of our study period. We find effects for B1similar to A2, yet especially in the non-monsoon months, rainfall effects in B1 aremore pronounced than in the A2 scenario. As a result, for the drought analysis we usethe A2 scenario leading to a more conservative estimated climate effect as the modelleddrying effect is less pronounced.
Vulnerability
In a next and important step, we assessed physicalvulnerability in terms of crop production and loss due tolack of rainfall. We used a nonlinear statistical model basedon the rainfall data and time series for wheat and riceproduction for the two districts for 1990-2006. Only twotypes of crops were considered, wheat and rice. While thereare two growing seasons for rice there is only one growingseason for wheat. For rice the most important growing seasonis during the monsoon months from June to October, theother season from March and June is less important and it isnot included in the analysis. Winter wheat is usually grownbetween October and March. The values for rice and wheat
| FIGURE 5 | Observed and estimated curve for riceproduction in June
��������������������������������������������������������������������
����
����
����
���
���
����
����������
����� �����������������
�� ��������������������������������������������������������������������
���
���
���
���
���
����
����
����������
��������������������������������������������������������������������������������������������������
�� ����� �������������� ��������������
������������������������������������� � �!���
����������������������������������������������
� �������������������������������������������������������������������������������������������������������������
����������
| FIGURE 4 | Observed and projected mean precipitation ofdekads based on observed data and climatechange projections for the years 2030 and 2050(Top panel), and fitted Gamma probabilitydistributions (Bottom panel)
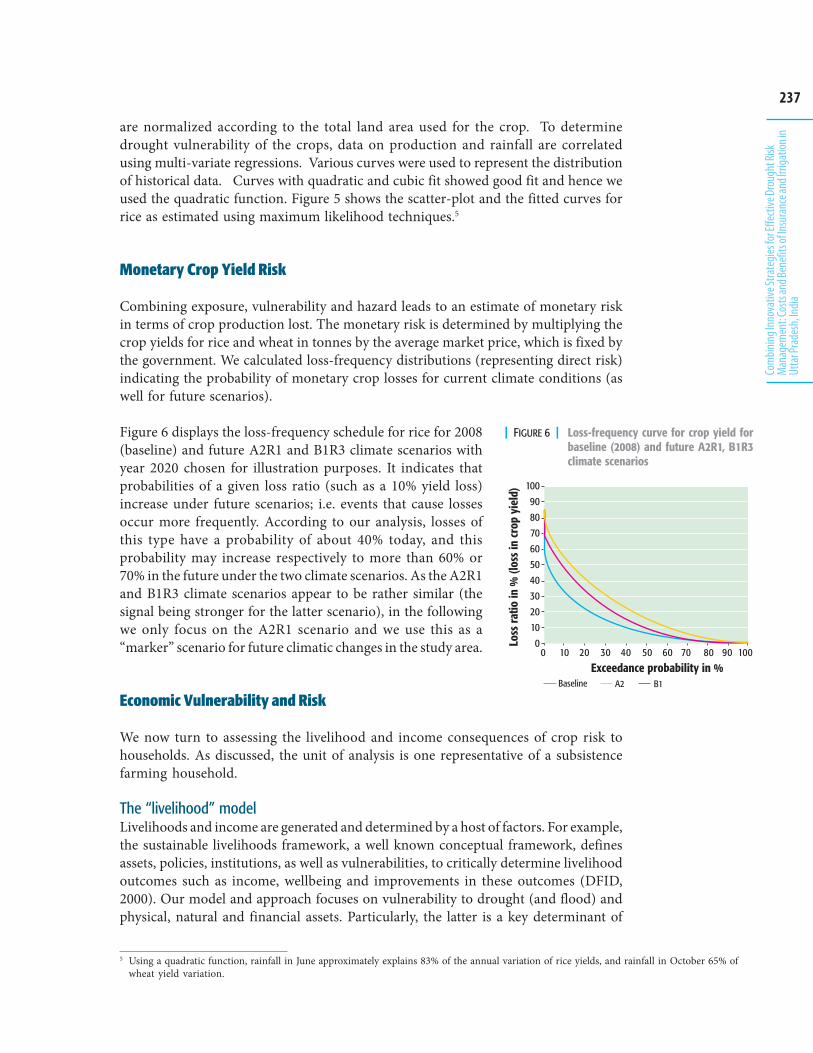
237
Com
bining
Inno
vativ
e Stra
tegie
s for
Effec
tive D
roug
ht Ri
skM
anag
emen
t: Cos
ts an
d Ben
efits
of In
sura
nce a
nd Irr
igatio
n in
Utta
r Pra
desh
, India
are normalized according to the total land area used for the crop. To determinedrought vulnerability of the crops, data on production and rainfall are correlatedusing multi-variate regressions. Various curves were used to represent the distributionof historical data. Curves with quadratic and cubic fit showed good fit and hence weused the quadratic function. Figure 5 shows the scatter-plot and the fitted curves forrice as estimated using maximum likelihood techniques.5
Monetary Crop Yield Risk
Combining exposure, vulnerability and hazard leads to an estimate of monetary riskin terms of crop production lost. The monetary risk is determined by multiplying thecrop yields for rice and wheat in tonnes by the average market price, which is fixed bythe government. We calculated loss-frequency distributions (representing direct risk)indicating the probability of monetary crop losses for current climate conditions (aswell for future scenarios).
Figure 6 displays the loss-frequency schedule for rice for 2008(baseline) and future A2R1 and B1R3 climate scenarios withyear 2020 chosen for illustration purposes. It indicates thatprobabilities of a given loss ratio (such as a 10% yield loss)increase under future scenarios; i.e. events that cause lossesoccur more frequently. According to our analysis, losses ofthis type have a probability of about 40% today, and thisprobability may increase respectively to more than 60% or70% in the future under the two climate scenarios. As the A2R1and B1R3 climate scenarios appear to be rather similar (thesignal being stronger for the latter scenario), in the followingwe only focus on the A2R1 scenario and we use this as a“marker” scenario for future climatic changes in the study area.
Economic Vulnerability and Risk
We now turn to assessing the livelihood and income consequences of crop risk tohouseholds. As discussed, the unit of analysis is one representative of a subsistencefarming household.
The “livelihood” modelLivelihoods and income are generated and determined by a host of factors. For example,the sustainable livelihoods framework, a well known conceptual framework, definesassets, policies, institutions, as well as vulnerabilities, to critically determine livelihoodoutcomes such as income, wellbeing and improvements in these outcomes (DFID,2000). Our model and approach focuses on vulnerability to drought (and flood) andphysical, natural and financial assets. Particularly, the latter is a key determinant of
� � �!��� "�
���#��$���������������
����������������������������������������$����������#������
���������������������������
�����������������������������������
| FIGURE 6 | Loss-frequency curve for crop yield forbaseline (2008) and future A2R1, B1R3climate scenarios
5 Using a quadratic function, rainfall in June approximately explains 83% of the annual variation of rice yields, and rainfall in October 65% ofwheat yield variation.
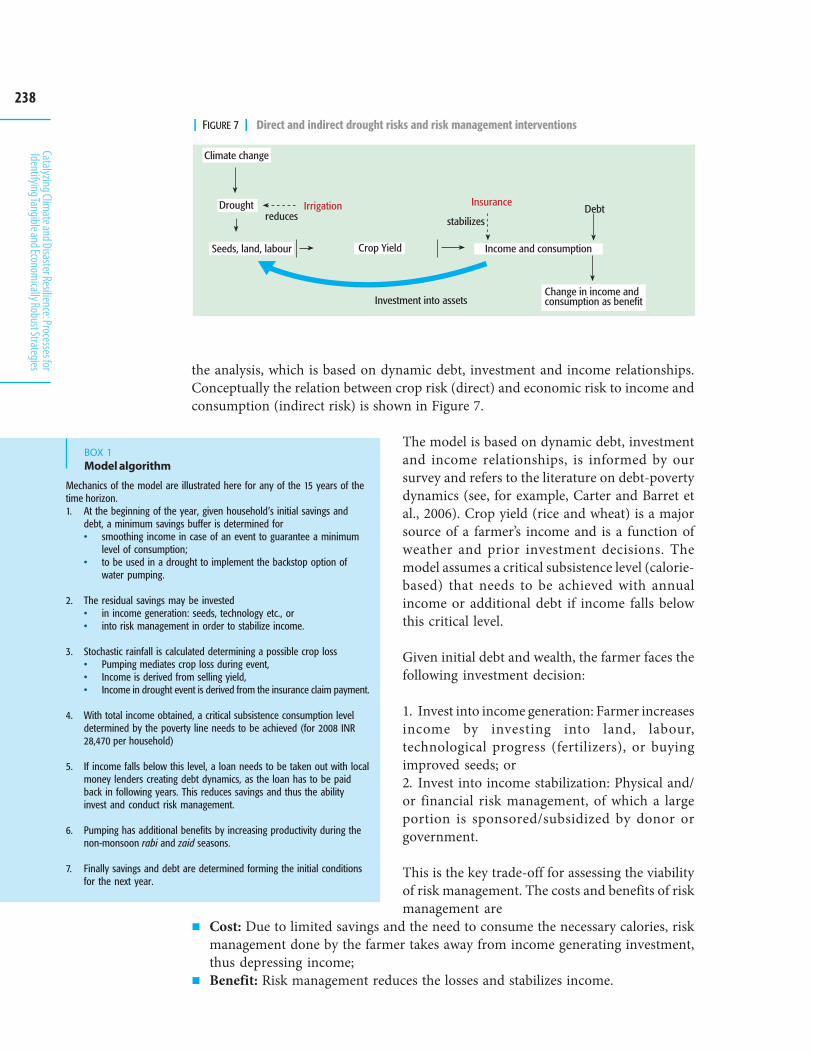
238
Catalyzing Climate and Disaster Resilience: Processes for
Identifying Tangible and Economically Robust Strategies the analysis, which is based on dynamic debt, investment and income relationships.
Conceptually the relation between crop risk (direct) and economic risk to income andconsumption (indirect risk) is shown in Figure 7.
The model is based on dynamic debt, investmentand income relationships, is informed by oursurvey and refers to the literature on debt-povertydynamics (see, for example, Carter and Barret etal., 2006). Crop yield (rice and wheat) is a majorsource of a farmer’s income and is a function ofweather and prior investment decisions. Themodel assumes a critical subsistence level (calorie-based) that needs to be achieved with annualincome or additional debt if income falls belowthis critical level.
Given initial debt and wealth, the farmer faces thefollowing investment decision:
1. Invest into income generation: Farmer increasesincome by investing into land, labour,technological progress (fertilizers), or buyingimproved seeds; or2. Invest into income stabilization: Physical and/or financial risk management, of which a largeportion is sponsored/subsidized by donor orgovernment.
This is the key trade-off for assessing the viabilityof risk management. The costs and benefits of riskmanagement are
Cost: Due to limited savings and the need to consume the necessary calories, riskmanagement done by the farmer takes away from income generating investment,thus depressing income;Benefit: Risk management reduces the losses and stabilizes income.
| FIGURE 7 | Direct and indirect drought risks and risk management interventions
BOX 1Model algorithm
Mechanics of the model are illustrated here for any of the 15 years of thetime horizon.1. At the beginning of the year, given household’s initial savings and
debt, a minimum savings buffer is determined for• smoothing income in case of an event to guarantee a minimum
level of consumption;• to be used in a drought to implement the backstop option of
water pumping.
2. The residual savings may be invested• in income generation: seeds, technology etc., or• into risk management in order to stabilize income.
3. Stochastic rainfall is calculated determining a possible crop loss• Pumping mediates crop loss during event,• Income is derived from selling yield,• Income in drought event is derived from the insurance claim payment.
4. With total income obtained, a critical subsistence consumption leveldetermined by the poverty line needs to be achieved (for 2008 INR28,470 per household)
5. If income falls below this level, a loan needs to be taken out with localmoney lenders creating debt dynamics, as the loan has to be paidback in following years. This reduces savings and thus the abilityinvest and conduct risk management.
6. Pumping has additional benefits by increasing productivity during thenon-monsoon rabi and zaid seasons.
7. Finally savings and debt are determined forming the initial conditionsfor the next year.
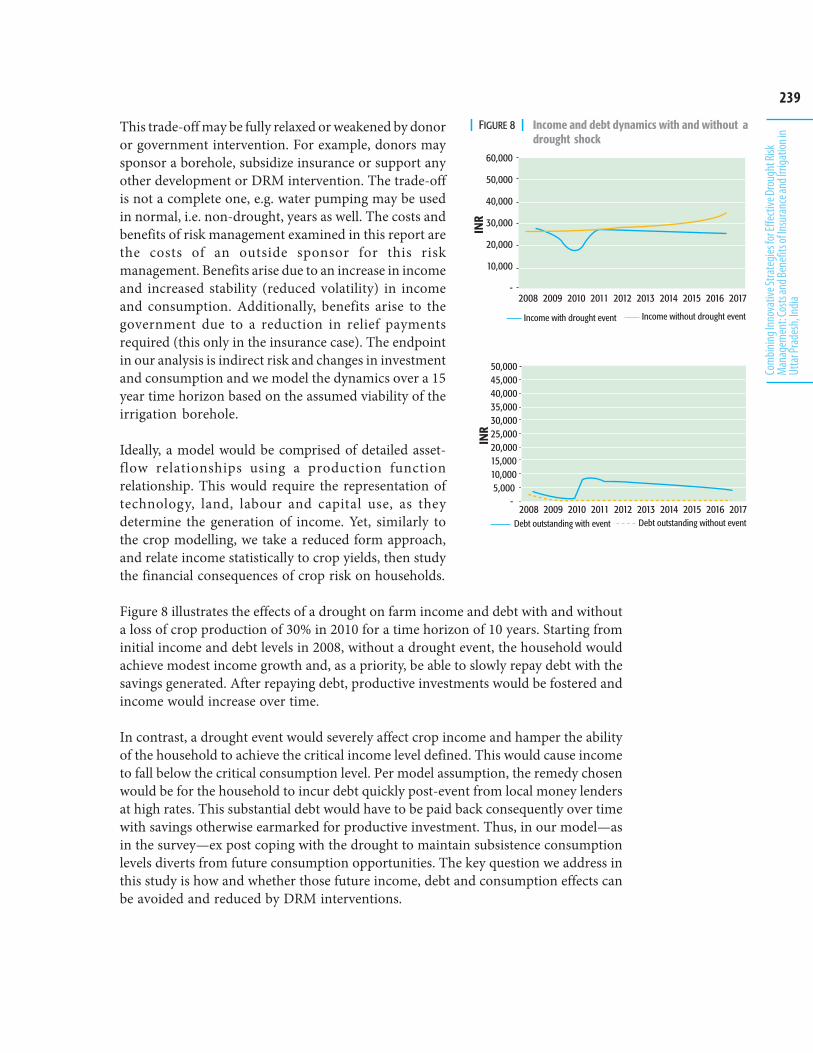
239
Com
bining
Inno
vativ
e Stra
tegie
s for
Effec
tive D
roug
ht Ri
skM
anag
emen
t: Cos
ts an
d Ben
efits
of In
sura
nce a
nd Irr
igatio
n in
Utta
r Pra
desh
, India
This trade-off may be fully relaxed or weakened by donoror government intervention. For example, donors maysponsor a borehole, subsidize insurance or support anyother development or DRM intervention. The trade-offis not a complete one, e.g. water pumping may be usedin normal, i.e. non-drought, years as well. The costs andbenefits of risk management examined in this report arethe costs of an outside sponsor for this riskmanagement. Benefits arise due to an increase in incomeand increased stability (reduced volatility) in incomeand consumption. Additionally, benefits arise to thegovernment due to a reduction in relief paymentsrequired (this only in the insurance case). The endpointin our analysis is indirect risk and changes in investmentand consumption and we model the dynamics over a 15year time horizon based on the assumed viability of theirrigation borehole.
Ideally, a model would be comprised of detailed asset-flow relationships using a production functionrelationship. This would require the representation oftechnology, land, labour and capital use, as theydetermine the generation of income. Yet, similarly tothe crop modelling, we take a reduced form approach,and relate income statistically to crop yields, then studythe financial consequences of crop risk on households.
Figure 8 illustrates the effects of a drought on farm income and debt with and withouta loss of crop production of 30% in 2010 for a time horizon of 10 years. Starting frominitial income and debt levels in 2008, without a drought event, the household wouldachieve modest income growth and, as a priority, be able to slowly repay debt with thesavings generated. After repaying debt, productive investments would be fostered andincome would increase over time.
In contrast, a drought event would severely affect crop income and hamper the abilityof the household to achieve the critical income level defined. This would cause incometo fall below the critical consumption level. Per model assumption, the remedy chosenwould be for the household to incur debt quickly post-event from local money lendersat high rates. This substantial debt would have to be paid back consequently over timewith savings otherwise earmarked for productive investment. Thus, in our model—asin the survey—ex post coping with the drought to maintain subsistence consumptionlevels diverts from future consumption opportunities. The key question we address inthis study is how and whether those future income, debt and consumption effects canbe avoided and reduced by DRM interventions.
| FIGURE 8 | Income and debt dynamics with and without adrought shock
��������#����������������������������������������������$
���
��%�����%�����%�����%�����%�����%�����%�����%�����%�����%�����������&
'������� ������(�)��*���������'������� ������(�)��*������
���
�%���
��%���
��%���
��%���
��%���
��%���
�������&��������#����������������������������������������������$
+������)��*��������(*�������+������)��*�����(*�������
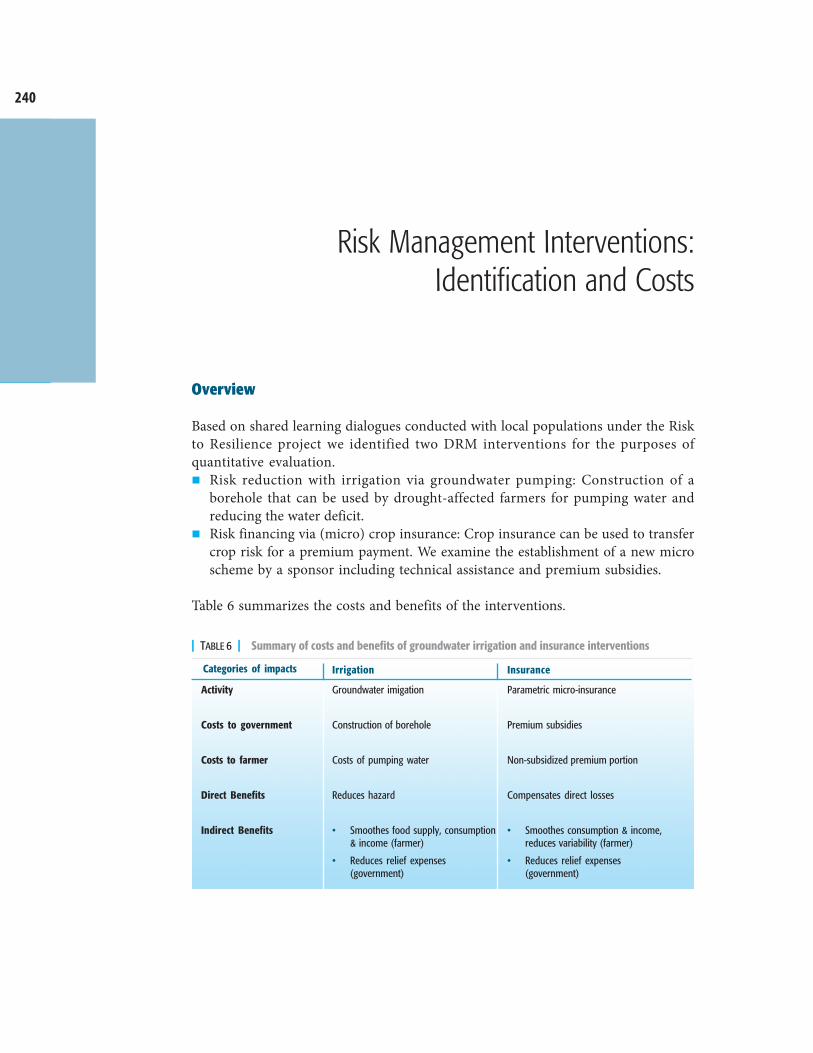
240
Catalyzing Climate and Disaster Resilience: Processes for
Identifying Tangible and Economically Robust Strategies
Risk Management Interventions:Identification and Costs
Overview
Based on shared learning dialogues conducted with local populations under the Riskto Resilience project we identified two DRM interventions for the purposes ofquantitative evaluation.
Risk reduction with irrigation via groundwater pumping: Construction of aborehole that can be used by drought-affected farmers for pumping water andreducing the water deficit.Risk financing via (micro) crop insurance: Crop insurance can be used to transfercrop risk for a premium payment. We examine the establishment of a new microscheme by a sponsor including technical assistance and premium subsidies.
Table 6 summarizes the costs and benefits of the interventions.
Categories of impacts Insurance
Activity
Costs to government
Costs to farmer
Direct Benefits
Indirect Benefits
Parametric micro-insurance
Premium subsidies
Non-subsidized premium portion
Compensates direct losses
• Smoothes consumption & income,reduces variability (farmer)
• Reduces relief expenses(government)
Irrigation
Groundwater imigation
Construction of borehole
Costs of pumping water
Reduces hazard
• Smoothes food supply, consumption& income (farmer)
• Reduces relief expenses(government)
| TABLE 6 | Summary of costs and benefits of groundwater irrigation and insurance interventions
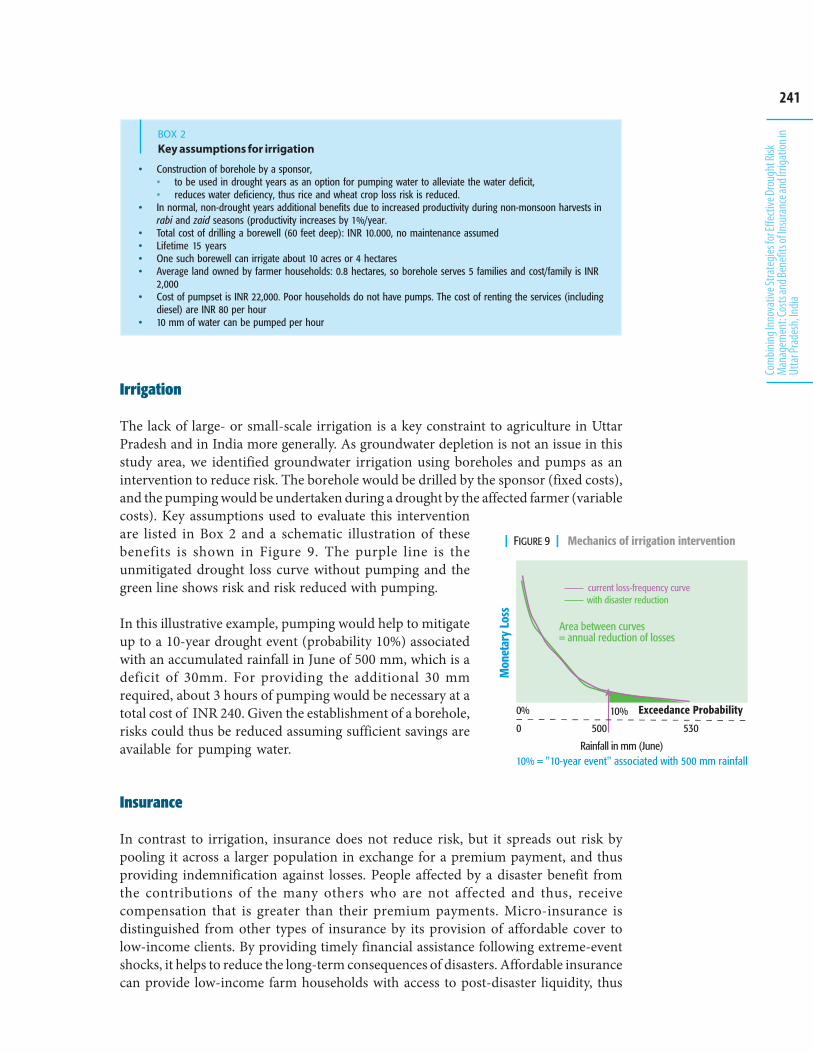
241
Com
bining
Inno
vativ
e Stra
tegie
s for
Effec
tive D
roug
ht Ri
skM
anag
emen
t: Cos
ts an
d Ben
efits
of In
sura
nce a
nd Irr
igatio
n in
Utta
r Pra
desh
, India
Irrigation
The lack of large- or small-scale irrigation is a key constraint to agriculture in UttarPradesh and in India more generally. As groundwater depletion is not an issue in thisstudy area, we identified groundwater irrigation using boreholes and pumps as anintervention to reduce risk. The borehole would be drilled by the sponsor (fixed costs),and the pumping would be undertaken during a drought by the affected farmer (variablecosts). Key assumptions used to evaluate this interventionare listed in Box 2 and a schematic illustration of thesebenefits is shown in Figure 9. The purple line is theunmitigated drought loss curve without pumping and thegreen line shows risk and risk reduced with pumping.
In this illustrative example, pumping would help to mitigateup to a 10-year drought event (probability 10%) associatedwith an accumulated rainfall in June of 500 mm, which is adeficit of 30mm. For providing the additional 30 mmrequired, about 3 hours of pumping would be necessary at atotal cost of INR 240. Given the establishment of a borehole,risks could thus be reduced assuming sufficient savings areavailable for pumping water.
Insurance
In contrast to irrigation, insurance does not reduce risk, but it spreads out risk bypooling it across a larger population in exchange for a premium payment, and thusproviding indemnification against losses. People affected by a disaster benefit fromthe contributions of the many others who are not affected and thus, receivecompensation that is greater than their premium payments. Micro-insurance isdistinguished from other types of insurance by its provision of affordable cover tolow-income clients. By providing timely financial assistance following extreme-eventshocks, it helps to reduce the long-term consequences of disasters. Affordable insurancecan provide low-income farm households with access to post-disaster liquidity, thus
• Construction of borehole by a sponsor,• to be used in drought years as an option for pumping water to alleviate the water deficit,• reduces water deficiency, thus rice and wheat crop loss risk is reduced.
• In normal, non-drought years additional benefits due to increased productivity during non-monsoon harvests inrabi and zaid seasons (productivity increases by 1%/year.
• Total cost of drilling a borewell (60 feet deep): INR 10.000, no maintenance assumed• Lifetime 15 years• One such borewell can irrigate about 10 acres or 4 hectares• Average land owned by farmer households: 0.8 hectares, so borehole serves 5 families and cost/family is INR
2,000• Cost of pumpset is INR 22,000. Poor households do not have pumps. The cost of renting the services (including
diesel) are INR 80 per hour• 10 mm of water can be pumped per hour
BOX 2Key assumptions for irrigation
| FIGURE 9 | Mechanics of irrigation intervention
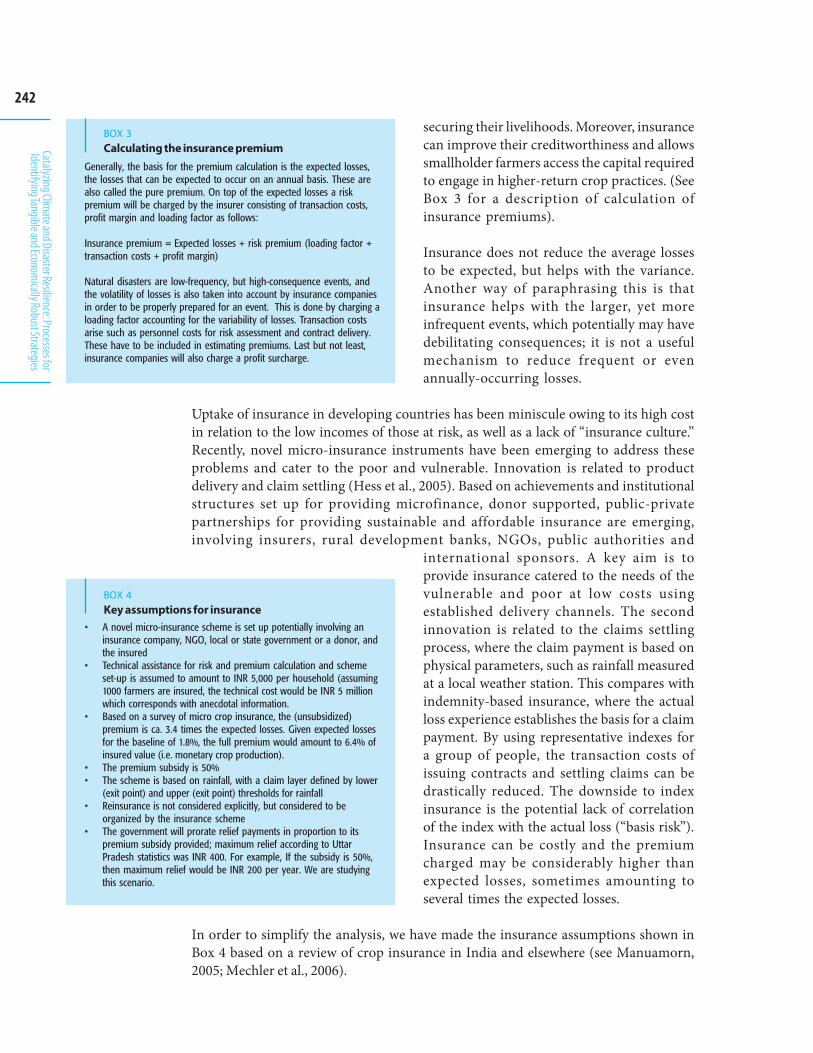
242
Catalyzing Climate and Disaster Resilience: Processes for
Identifying Tangible and Economically Robust Strategies
securing their livelihoods. Moreover, insurancecan improve their creditworthiness and allowssmallholder farmers access the capital requiredto engage in higher-return crop practices. (SeeBox 3 for a description of calculation ofinsurance premiums).
Insurance does not reduce the average lossesto be expected, but helps with the variance.Another way of paraphrasing this is thatinsurance helps with the larger, yet moreinfrequent events, which potentially may havedebilitating consequences; it is not a usefulmechanism to reduce frequent or evenannually-occurring losses.
Uptake of insurance in developing countries has been miniscule owing to its high costin relation to the low incomes of those at risk, as well as a lack of “insurance culture.”Recently, novel micro-insurance instruments have been emerging to address theseproblems and cater to the poor and vulnerable. Innovation is related to productdelivery and claim settling (Hess et al., 2005). Based on achievements and institutionalstructures set up for providing microfinance, donor supported, public-privatepartnerships for providing sustainable and affordable insurance are emerging,involving insurers, rural development banks, NGOs, public authorities and
international sponsors. A key aim is toprovide insurance catered to the needs of thevulnerable and poor at low costs usingestablished delivery channels. The secondinnovation is related to the claims settlingprocess, where the claim payment is based onphysical parameters, such as rainfall measuredat a local weather station. This compares withindemnity-based insurance, where the actualloss experience establishes the basis for a claimpayment. By using representative indexes fora group of people, the transaction costs ofissuing contracts and settling claims can bedrastically reduced. The downside to indexinsurance is the potential lack of correlationof the index with the actual loss (“basis risk”).Insurance can be costly and the premiumcharged may be considerably higher thanexpected losses, sometimes amounting toseveral times the expected losses.
In order to simplify the analysis, we have made the insurance assumptions shown inBox 4 based on a review of crop insurance in India and elsewhere (see Manuamorn,2005; Mechler et al., 2006).
Generally, the basis for the premium calculation is the expected losses,the losses that can be expected to occur on an annual basis. These arealso called the pure premium. On top of the expected losses a riskpremium will be charged by the insurer consisting of transaction costs,profit margin and loading factor as follows:
Insurance premium = Expected losses + risk premium (loading factor +transaction costs + profit margin)
Natural disasters are low-frequency, but high-consequence events, andthe volatility of losses is also taken into account by insurance companiesin order to be properly prepared for an event. This is done by charging aloading factor accounting for the variability of losses. Transaction costsarise such as personnel costs for risk assessment and contract delivery.These have to be included in estimating premiums. Last but not least,insurance companies will also charge a profit surcharge.
BOX 3Calculating the insurance premium
• A novel micro-insurance scheme is set up potentially involving aninsurance company, NGO, local or state government or a donor, andthe insured
• Technical assistance for risk and premium calculation and schemeset-up is assumed to amount to INR 5,000 per household (assuming1000 farmers are insured, the technical cost would be INR 5 millionwhich corresponds with anecdotal information.
• Based on a survey of micro crop insurance, the (unsubsidized)premium is ca. 3.4 times the expected losses. Given expected lossesfor the baseline of 1.8%, the full premium would amount to 6.4% ofinsured value (i.e. monetary crop production).
• The premium subsidy is 50%• The scheme is based on rainfall, with a claim layer defined by lower
(exit point) and upper (exit point) thresholds for rainfall• Reinsurance is not considered explicitly, but considered to be
organized by the insurance scheme• The government will prorate relief payments in proportion to its
premium subsidy provided; maximum relief according to UttarPradesh statistics was INR 400. For example, If the subsidy is 50%,then maximum relief would be INR 200 per year. We are studyingthis scenario.
BOX 4Key assumptions for insurance
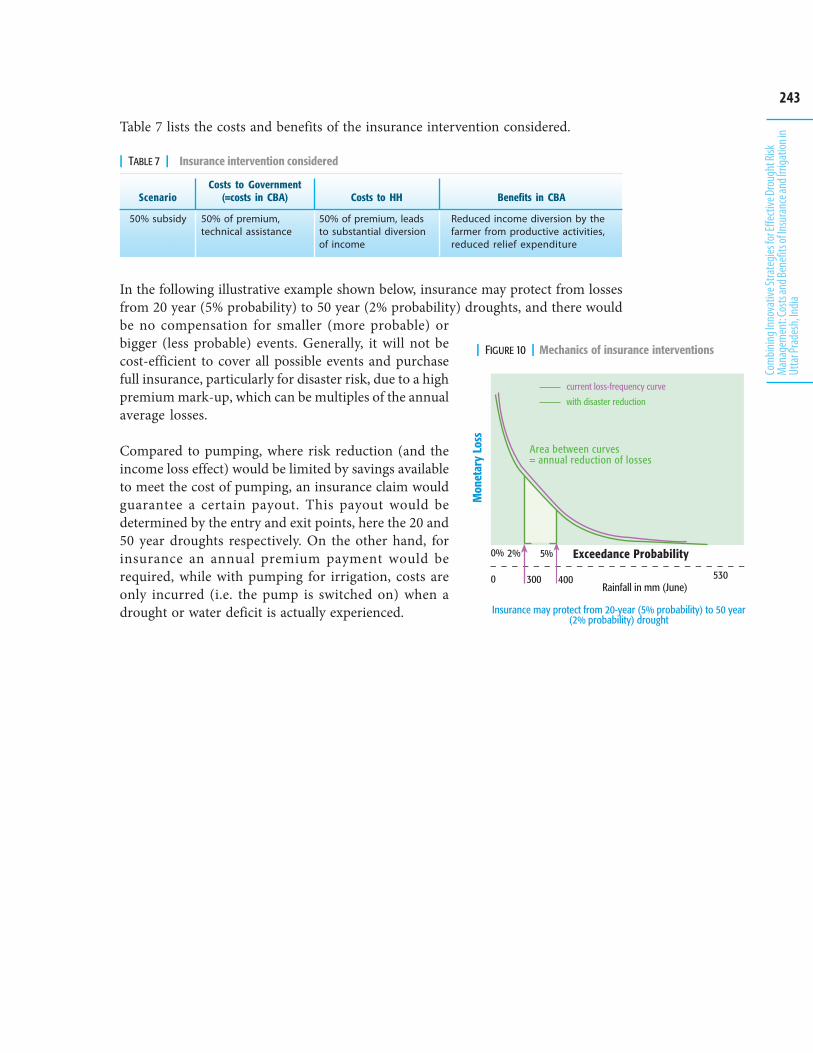
243
Com
bining
Inno
vativ
e Stra
tegie
s for
Effec
tive D
roug
ht Ri
skM
anag
emen
t: Cos
ts an
d Ben
efits
of In
sura
nce a
nd Irr
igatio
n in
Utta
r Pra
desh
, India
Table 7 lists the costs and benefits of the insurance intervention considered.
ScenarioCosts to Government
(=costs in CBA) Costs to HH Benefits in CBA
50% subsidy 50% of premium,technical assistance
Reduced income diversion by thefarmer from productive activities,reduced relief expenditure
50% of premium, leadsto substantial diversionof income
| TABLE 7 | Insurance intervention considered
In the following illustrative example shown below, insurance may protect from lossesfrom 20 year (5% probability) to 50 year (2% probability) droughts, and there wouldbe no compensation for smaller (more probable) orbigger (less probable) events. Generally, it will not becost-efficient to cover all possible events and purchasefull insurance, particularly for disaster risk, due to a highpremium mark-up, which can be multiples of the annualaverage losses.
Compared to pumping, where risk reduction (and theincome loss effect) would be limited by savings availableto meet the cost of pumping, an insurance claim wouldguarantee a certain payout. This payout would bedetermined by the entry and exit points, here the 20 and50 year droughts respectively. On the other hand, forinsurance an annual premium payment would berequired, while with pumping for irrigation, costs areonly incurred (i.e. the pump is switched on) when adrought or water deficit is actually experienced.
| FIGURE 10 | Mechanics of insurance interventions
+� ���������,���������-������&,����.�/��������!��,0�������,���.�/��������!��,0�����(*�
�/
"�������)��������� 1������!������������-�!� �
��������!� &-��2����,������
)��*��� � �������������
�������������
���
�/
3���-�!!�������.4���0
�/ ����������� ����������
� ��� ���
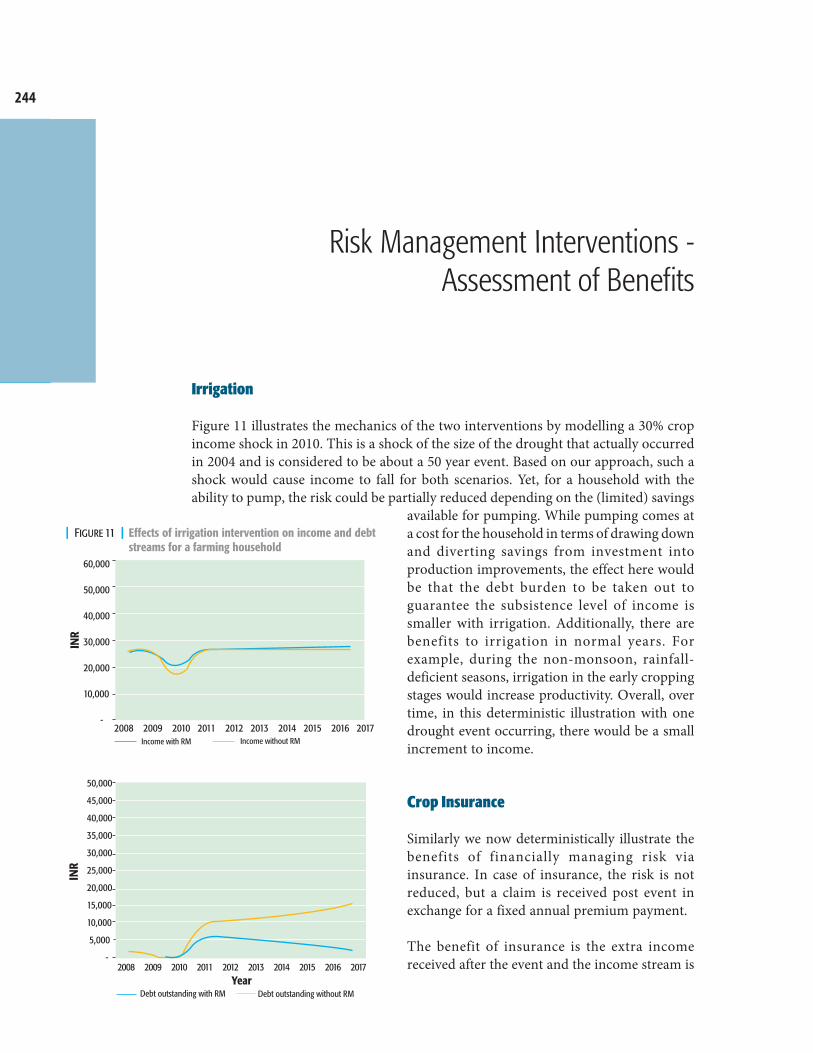
244
Catalyzing Climate and Disaster Resilience: Processes for
Identifying Tangible and Economically Robust Strategies
Risk Management Interventions -Assessment of Benefits
Irrigation
Figure 11 illustrates the mechanics of the two interventions by modelling a 30% cropincome shock in 2010. This is a shock of the size of the drought that actually occurredin 2004 and is considered to be about a 50 year event. Based on our approach, such ashock would cause income to fall for both scenarios. Yet, for a household with theability to pump, the risk could be partially reduced depending on the (limited) savings
available for pumping. While pumping comes ata cost for the household in terms of drawing downand diverting savings from investment intoproduction improvements, the effect here wouldbe that the debt burden to be taken out toguarantee the subsistence level of income issmaller with irrigation. Additionally, there arebenefits to irrigation in normal years. Forexample, during the non-monsoon, rainfall-deficient seasons, irrigation in the early croppingstages would increase productivity. Overall, overtime, in this deterministic illustration with onedrought event occurring, there would be a smallincrement to income.
Crop Insurance
Similarly we now deterministically illustrate thebenefits of financially managing risk viainsurance. In case of insurance, the risk is notreduced, but a claim is received post event inexchange for a fixed annual premium payment.
The benefit of insurance is the extra incomereceived after the event and the income stream is
����������#����������������������������������������������������������$
�%���
��%���
��%���
��%���
��%���
��%���
�������&
���
+������)��*�35 +������)��*����35
| FIGURE 11 | Effects of irrigation intervention on income and debtstreams for a farming household
���
�����������#����������������������������������������������������������������������$
��%���
��%���
��%���
��%���
��%���
��%���
��%���
��%���
��%���
��%���
��������&
'������� ������(�)��*����35'������� ������(�)��*�35 ���
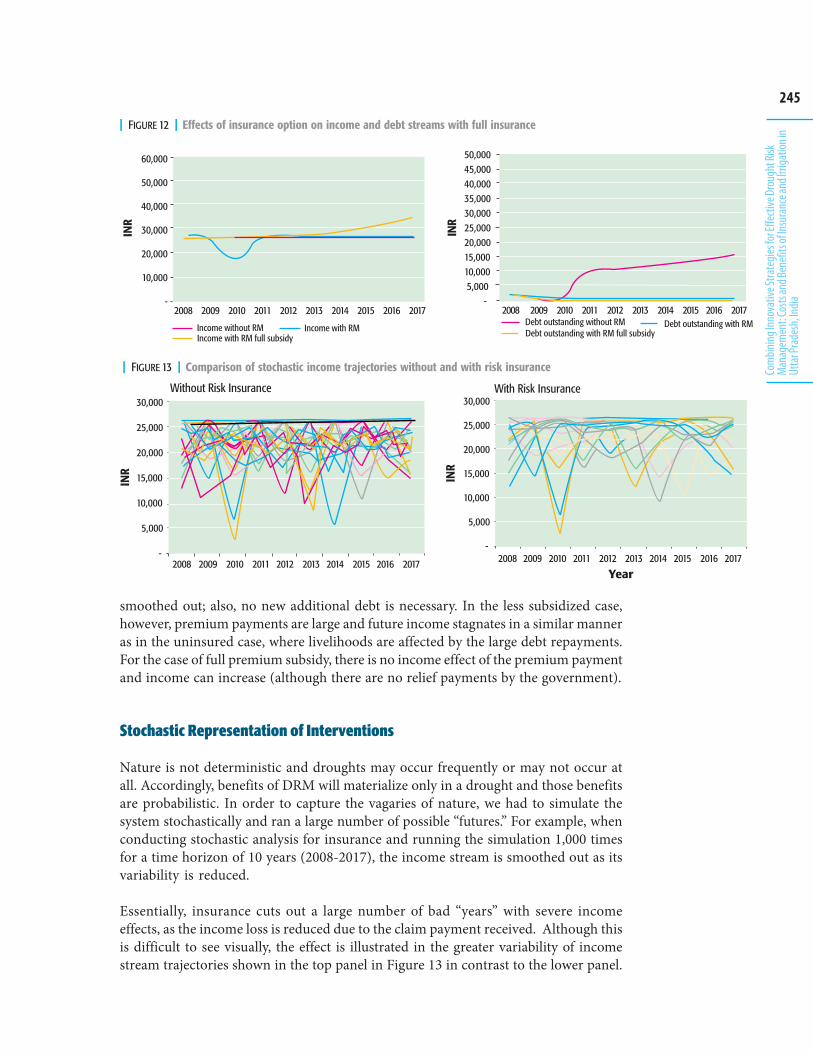
245
Com
bining
Inno
vativ
e Stra
tegie
s for
Effec
tive D
roug
ht Ri
skM
anag
emen
t: Cos
ts an
d Ben
efits
of In
sura
nce a
nd Irr
igatio
n in
Utta
r Pra
desh
, India
+������)��*�35�-�!!� �� ��,+������)��*����35 +������)��*�35
�%���
��%���
��%���
��%���
��%���
��%���
�������&����������#��������������������������������������������������������������$
���
| FIGURE 12 | Effects of insurance option on income and debt streams with full insurance
'������� ������(�)��*�35�-�!!� �� ��,'������� ������(�)��*����35 '������� ������(�)��*�35
�����������#���������������������������������������������������������������������$
��%�����%�����%�����%�����%�����%�����%�����%�����%�����%�����������&
���
| FIGURE 13 | Comparison of stochastic income trajectories without and with risk insurance
��%���
��%���
��%���
��%���
��%���
���%���
���������&���������#���������������������������������������������������������$
6��*�3� 7�+� ������
���
���
smoothed out; also, no new additional debt is necessary. In the less subsidized case,however, premium payments are large and future income stagnates in a similar manneras in the uninsured case, where livelihoods are affected by the large debt repayments.For the case of full premium subsidy, there is no income effect of the premium paymentand income can increase (although there are no relief payments by the government).
Stochastic Representation of Interventions
Nature is not deterministic and droughts may occur frequently or may not occur atall. Accordingly, benefits of DRM will materialize only in a drought and those benefitsare probabilistic. In order to capture the vagaries of nature, we had to simulate thesystem stochastically and ran a large number of possible “futures.” For example, whenconducting stochastic analysis for insurance and running the simulation 1,000 timesfor a time horizon of 10 years (2008-2017), the income stream is smoothed out as itsvariability is reduced.
Essentially, insurance cuts out a large number of bad “years” with severe incomeeffects, as the income loss is reduced due to the claim payment received. Although thisis difficult to see visually, the effect is illustrated in the greater variability of incomestream trajectories shown in the top panel in Figure 13 in contrast to the lower panel.
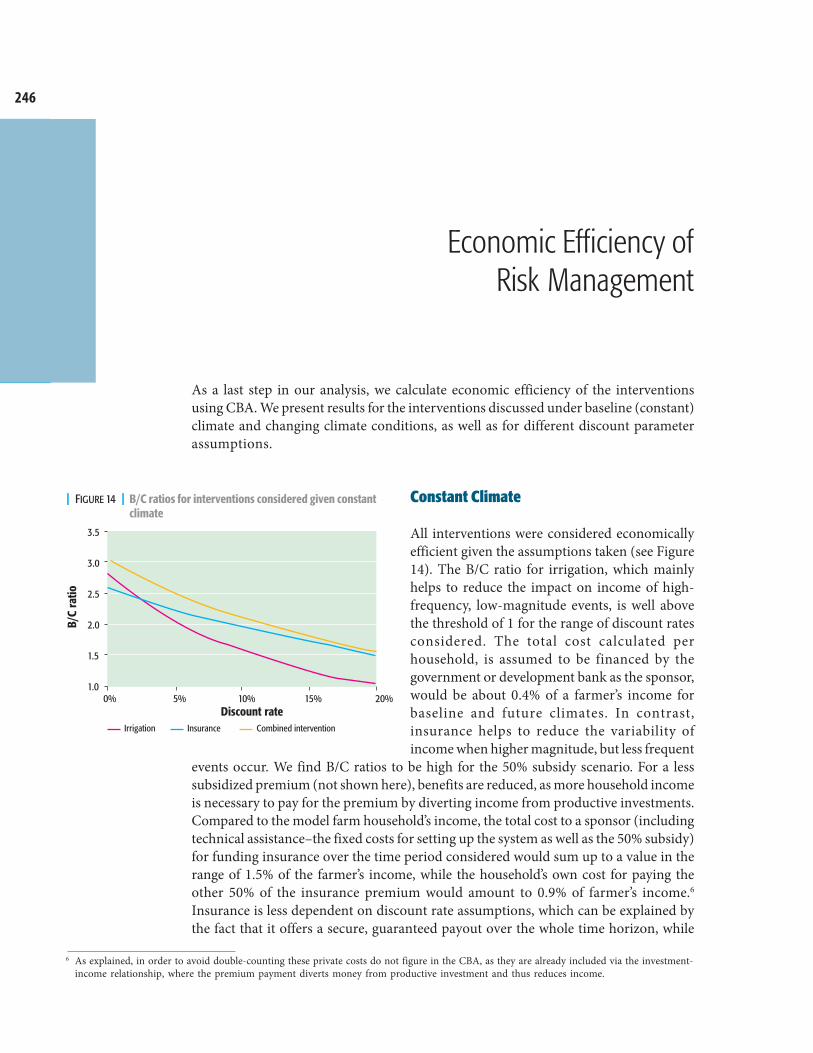
246
Catalyzing Climate and Disaster Resilience: Processes for
Identifying Tangible and Economically Robust Strategies
Economic Efficiency ofRisk Management
As a last step in our analysis, we calculate economic efficiency of the interventionsusing CBA. We present results for the interventions discussed under baseline (constant)climate and changing climate conditions, as well as for different discount parameterassumptions.
Constant Climate
All interventions were considered economicallyefficient given the assumptions taken (see Figure14). The B/C ratio for irrigation, which mainlyhelps to reduce the impact on income of high-frequency, low-magnitude events, is well abovethe threshold of 1 for the range of discount ratesconsidered. The total cost calculated perhousehold, is assumed to be financed by thegovernment or development bank as the sponsor,would be about 0.4% of a farmer’s income forbaseline and future climates. In contrast,insurance helps to reduce the variability ofincome when higher magnitude, but less frequent
events occur. We find B/C ratios to be high for the 50% subsidy scenario. For a lesssubsidized premium (not shown here), benefits are reduced, as more household incomeis necessary to pay for the premium by diverting income from productive investments.Compared to the model farm household’s income, the total cost to a sponsor (includingtechnical assistance–the fixed costs for setting up the system as well as the 50% subsidy)for funding insurance over the time period considered would sum up to a value in therange of 1.5% of the farmer’s income, while the household’s own cost for paying theother 50% of the insurance premium would amount to 0.9% of farmer’s income.6
Insurance is less dependent on discount rate assumptions, which can be explained bythe fact that it offers a secure, guaranteed payout over the whole time horizon, while
6 As explained, in order to avoid double-counting these private costs do not figure in the CBA, as they are already included via the investment-income relationship, where the premium payment diverts money from productive investment and thus reduces income.
| FIGURE 14 | B/C ratios for interventions considered given constantclimate
���
���
���
���
���
����/� ����������/� ������������������/� ������/������������������������/
!"#������
$���������������������������������+���(����� +� ������
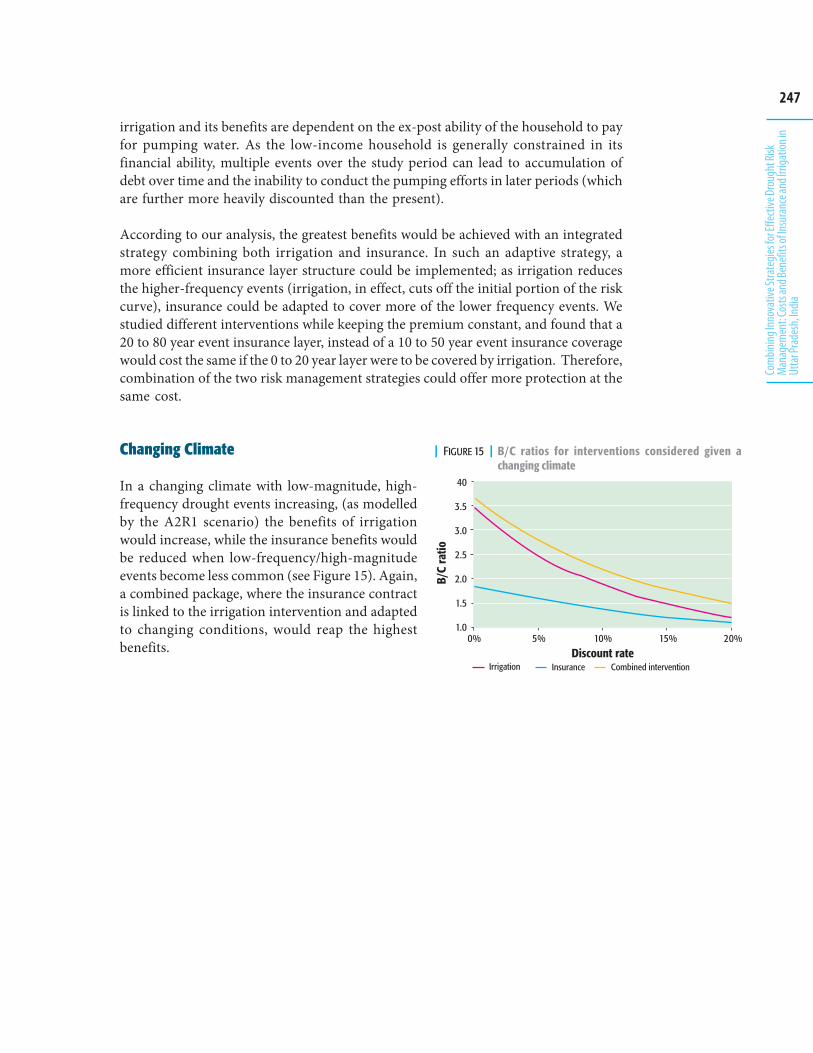
247
Com
bining
Inno
vativ
e Stra
tegie
s for
Effec
tive D
roug
ht Ri
skM
anag
emen
t: Cos
ts an
d Ben
efits
of In
sura
nce a
nd Irr
igatio
n in
Utta
r Pra
desh
, India
irrigation and its benefits are dependent on the ex-post ability of the household to payfor pumping water. As the low-income household is generally constrained in itsfinancial ability, multiple events over the study period can lead to accumulation ofdebt over time and the inability to conduct the pumping efforts in later periods (whichare further more heavily discounted than the present).
According to our analysis, the greatest benefits would be achieved with an integratedstrategy combining both irrigation and insurance. In such an adaptive strategy, amore efficient insurance layer structure could be implemented; as irrigation reducesthe higher-frequency events (irrigation, in effect, cuts off the initial portion of the riskcurve), insurance could be adapted to cover more of the lower frequency events. Westudied different interventions while keeping the premium constant, and found that a20 to 80 year event insurance layer, instead of a 10 to 50 year event insurance coveragewould cost the same if the 0 to 20 year layer were to be covered by irrigation. Therefore,combination of the two risk management strategies could offer more protection at thesame cost.
Changing Climate
In a changing climate with low-magnitude, high-frequency drought events increasing, (as modelledby the A2R1 scenario) the benefits of irrigationwould increase, while the insurance benefits wouldbe reduced when low-frequency/high-magnitudeevents become less common (see Figure 15). Again,a combined package, where the insurance contractis linked to the irrigation intervention and adaptedto changing conditions, would reap the highestbenefits.
| FIGURE 15 | B/C ratios for interventions considered given achanging climate
��
���
���
���
���
���
���
!"#������
$�������������/� �������/� �������������/� ��/� ��������/
���������������������+���(����� +� ������
248
Catalyzing Climate and Disaster Resilience: Processes for
Identifying Tangible and Economically Robust Strategies
Conclusions
We conducted a detailed forward looking, risk based cost-benefit analysis on theeconomic benefits of two risk management interventions suitable for a typical poor,farming household exposed to drought in rural Uttar Pradesh. Benefits were assessedin terms of income and consumption smoothing for current and future climates. Costof both risk reducing (irrigation) as well as risk-sharing instruments (micro cropinsurance) were evaluated.
We found that both of the options and the integrated package are economically efficientwithin the assumptions. Insurance seems less dependent on discount rate assumptions,as it offers a secure, guaranteed payout, while irrigation and its benefits are dependenton the ex-post ability of the household to pay for pumping water. A typical householdas modeled in our case study is financially vulnerable. Multiple adverse shocks overtime lead to accumulation of debt and to an inability to afford pumping in the future(leading to higher discount rate).
With a changing climate, irrigation benefits increase as average rainfall and rainfallvariability increases, while insurance benefits are reduced, as high intensity eventsdecrease. Finally, integrated physical (irrigation) and financial (insurance) interventionpackages return higher benefits at similar costs. This is a result of strategically targetinghigher frequency events (with irrigation) and lower frequency events (with insurance)with different approaches to disaster risk management. Consequently, it seems highlyimportant to foster the exploration of such integrated packages in a process involvingdifferent public and private actors.
Using this data and model intensive framework, we encountered a host ofmethodological hurdles, which introduced considerable uncertainty into theassessment process. One of the biggest challenges was to incorporate the differenttypes of information and estimation methods within one comprehensive modellingapproach. For example, rainfall variation pattern analysis requires statistical methods,while the generation of future scenarios has to be dealt within a simulationprogramming framework. Further, while assessing the risk and the net benefits of riskmanagement, results should be based on many possible risk factors, which also involvesconsiderable mathematical complexity. For example, our crop yield model is basedon rainfall only. Detailed crop simulation modelling (accounting for soil conditions,
249
Com
bining
Inno
vativ
e Stra
tegie
s for
Effec
tive D
roug
ht Ri
skM
anag
emen
t: Cos
ts an
d Ben
efits
of In
sura
nce a
nd Irr
igatio
n in
Utta
r Pra
desh
, India
cropping patterns etc.) was not used in this analysis due to significant data and resourcelimitations and unsatisfactory calibration of results.
Like any CBA, information on the costs and benefits of risk management strategies byitself is not sufficient for decision makers to make an informed decision. Use of CBA isoften useful as a key input within a more process-oriented framework. There are alwayslimitations to using a modelling approach for determining and assessing risk and riskmanagement strategies, and finally calculating the desirability of interventions, asdone for example, by a cost-benefit analysis. Models do not and cannot captureeverything. Systematic assessment and estimation of risks, however, provide importantdecision-making support, as it requires a process of identification and quantificationof the effects of various DRM strategies in reducing and sharing those risks. Suchanalysis conducted in collaboration with stakeholders and decision makers is likelyto lead to better-informed, equitable and eventually decisions that are acceptable towide array of stakeholders.
The study conducted may be useful for promoting stakeholder dialogue on investmentsand the design of schemes. Departments, agencies and NGOs working on groundwaterirrigation, crop insurance and drought relief in Uttar Pradesh and India can initiate atransparent and coordinated dialogue with the results of this case study. We suggestthe DRM strategies discussed can be put to use for the following applications:
Organizing data for assessing and monitoring the evaluated DRM strategies by theCrop Weather Watch Group (CWWG) and State Planning Department ofGovernment of Uttar Pradesh;Systematically assessing investments needs and tradeoffs in crop insurance andgroundwater irrigation management by Grameen (Rural) Banks, primaryagriculture cooperatives (PACs), Agriculture Insurance Company of India, privatebodies such as Birla Sunlife; departments of rural development—watersheddevelopment, agriculture and minor irrigation—groundwater recharge);Promoting micro-finance activities through non-government organizations withgovernment support (NABARD) in the form of matching funds;The Uttar Pradesh government may consider shifting its existing focus andinvestment away from minor (surface) irrigation to funding and supporting anintensive groundwater programme because of the huge groundwater potential. Itmay also benefit from experience from other states (for example, the Jyotirgramscheme in Gujarat), which provide a dedicated electricity connection at non-subsidized rates for groundwater pumping.
250
Catalyzing Climate and Disaster Resilience: Processes for
Identifying Tangible and Economically Robust Strategies
Bibliography
Carter, M. and Barrett, C. (2006). The economics of poverty traps and persistent poverty: An asset-basedapproach. Journal of Development Studies, 42 (2): 178 – 199
Christensen, J.H., et al. (2007) ‘Regional Climate Projections’ in S. Solomon, D. Qin, M. Manning, Z. Chen,M. Marquis, K.B. Avery, M. Tignor and H.L. Miller (eds), Climate Change 2007: The PhysicalScience Basis, Contribution of Working Group I to the Fourth Assessment Report of theIntergovernmental Panel on Climate Change. Cambridge, UK: Cambridge University Press.
Department of Agriculture and Cooperatives (DAC) (2004) ‘Annual Report 2003-04’. New Delhi:Directorate of Economics and Statistics, Department of Agriculture and Cooperatives,Government of India.
Department of Agriculture and Cooperatives (DAC) (2007) ‘Report of the Workshop on Setting up aMechanism for Continuous and Integrated Drought Management’, NASC, Pusa, Ministryof Agriculture, New Delhi (21 September). http://agricoop.nic.in/Drought%20Workshop%20new%20reportn.pdf
DFID (2000) Sustainable Livelihoods: current thinking and practice. London: UK Department forInternational Development.
FAO (2001) ‘Report of the Asia-Pacific conference on early warning, prevention, and preparedness andmanagement of disasters in floods and agriculture’, Chiang Mai, Thailand, 12-15 June 2001.Bangkok: FAO Regional Office for Asia and the Pacific (RAP), Publication No. 2001/14.
Flato, G. M. (2005) The Third Generation Coupled Global Climate Model (CGCM3). http://www.cccma.bc.ec.gc.ca/models/cgcm2.shtml.
Hess, U. (2003) Innovative Financial Services for Rural India. Monsoon-Indexed Lending and Insurance forSmallholders. Washington, D.C.: World Bank.
Government of India (various issues) Economic Survey. New Delhi: Planning Commission, Governmentof India.
Manuamorn, O.P. (2005) Scaling-Up Micro Insurance. Washington, D.C.: World Bank.Mechler, R., J. Linnerooth-Bayer and D. Peppiatt (2005) Disaster Insurance for the Poor? A Review of
Microinsurance for Natural Disaster Risks in Developing Countries. Geneva: Provention/IIASA.
PACS (Poorest Areas Civil Society Programme) (2004) Drought in India: Challenges & Initiatives. NewDelhi: The PACS Programme.
Shah, T. (2001) ‘Wells and Welfare in the Ganga Basin: Public Policy and Private Initiative in Eastern UttarPradesh, India’. Research Report 54. Colombo, Sri Lanka: International Water ManagementInstitute.
World Food Programme (2005) ‘Pilot Development Project – Ethiopia Drought Insurance 10486.0’,Projects for Executive Board approval. Rome: World Food Programme, WFP/EB.2/2005/8-A.
Moving from Policy to Practice:The Role of Cost-Benefit Analysis in
Pro-active Disaster Risk Reduction
8C H A P T E R
Fawad Khan (ISET)Ajaya Dixit (ISET-Nepal)
Syed Ayub Qutub (PIEDAR)Mamta Borgoyary (WII)Sunandan Tiwari (WII) &
The Risk to Resilience Study Team

252
Catalyzing Climate and Disaster Resilience: Processes for
Identifying Tangible and Economically Robust Strategies
253
Movin
g fro
m Po
licy t
o Pra
ctice
: Role
of Co
st-Be
nefit
Analy
sis in
Proa
ctive
Disa
ster R
isk Re
ducti
on
Key Issues at the Policy Level
It has been mostly in the wake of large disasters that disaster management policy hasdeveloped in India, Pakistan and Nepal. All three countries have had a reactive approachto natural disasters in which rescue and relief has been the key objective. Over time,various concerned government departments such as irrigation, water and power, as wellas local government have become involved in devising approaches to disaster managementas a part of their larger mandate. In recent years, and especially after the massiveearthquakes of 2001 and 2005 in Gujarat and Kashmir, very specialized apex levelinstitutions have been set up for disaster management in India and Pakistan.
Both India and Pakistan have constituted national disaster management authorities underthe aegis of their prime ministers. Nepal adopted the National Action Plan on DisasterManagement in Nepal in 1996. These apex agencies are entrusted with all that is related todisaster management, including the establishment of disaster management agencies at theregional and local levels. Despite elaborate plans and documentation, no disastermanagement framework has, however, reached the local or even the regional level pervasivelyenough to have effective risk reduction potential. Although there are elements of riskreduction, the thrust of their activities is on post-disaster relief. Although all of theseagencies are placed high in the government and have access to resources, their ability toperform during disasters is questionable. Communities in all three countries still believethat they have to fend for themselves and are solely responsible for risk reduction and relief.
These specialized hierarchical agencies, with little downward accountability, are not wellsuited to reducing vulnerability. They have little contact with communities at risk andspecialize in providing large structural solutions, solutions that suit the political economyof countries with weak governance. The case studies reveal that the causes of vulnerabilityspan many sectors. Building resilience, then, means changing the way we use water, practiceagriculture, build houses and provide other social services. These changes are best doneby responsible local authorities with access to communities. Disaster risk reduction needsto filter down into the everyday working of local authorities. The sectoral policiescurrently practiced seem to be untouched by such concerns and sometimes even underminevulnerability reduction. As an example, the Drought Emergency Recovery Assistanceprogramme in Pakistan was designed to reduce drought-induced poverty through publicworks and by providing diesel pumps for irrigation. In the long run, however, such awater management practice will contribute to the lowering of water tables, which will inturn increase vulnerability during future droughts. There is a great need to evaluate suchsectoral policies to understand their contribution to risk reduction.
254
Catalyzing Climate and Disaster Resilience: Processes for
Identifying Tangible and Economically Robust Strategies
In particular, there is a need to determine which package or combinations of strategies aremost effective for disaster risk reduction. The expected climate change complicates thisdemarcation. The cost-benefit analysis method, with its probabilistic risk, is well suited forthis purpose, but there do not seem to be enough resources or skills or wide enough mandatesto compare strategies that span many sectors for it to be effectively utilized at the local level.Complete cost-benefit analyses, like those performed for India’s flood and drought cases, needto be undertaken and advocated by apex level institutions such as planning commissions andother economic policy-making agencies.
Cost-benefit analyses are particularly effective if they started at the local level using sharedlearning dialogues to identify both the array of less commonly quantified benefits and costsfrom strategies that have been implemented by governments and are already known as wellpotential local risk reduction strategies to evaluate. Shared learning dialogues were used inthis Risk to Resilience study both specific new strategies to evaluate (many of which had notbeen recognized as playing a role in risk management) and also key factors to evaluate withinexisting strategies. For example, where new strategies are concerned, in several locations localauthorities that establish and enforce building codes had not realized that they play a concreterole in disaster risk reduction. They also need to be involved in the process of developingstrategies. Similarly, where identification of potential costs and benefits are concerned althoughcommunities in the Lai River basin could not fathom the massive infrastructure costs associatedwith government flood control projects, the communities in Nepal were able to use pluses andminuses to rank the risks and benefits of both flood control structures and community levelapproaches. Qualitative methods used to measure vulnerability are also necessary to targetinterventions, as cost-benefit analysis alone does not capture distributional aspects. Yet cost-benefit analysis can be one of the criteria for choosing risk reduction strategies.
Generally, a major risk with cost-benefit analysis lies in the fact that analyses conducted forproject preparation are not of great quality and do not capture many of the external socialand environmental costs. Cost-benefit analyses are usually pieced together as a formalityfor project approval and can only rarely be challenged by the affected populations. Unlessthe process is inclusive and transparent and project developers are held accountable, a cost-benefit analysis is not an effective tool for policy development. It is also difficult to undertakecost-benefit analyses of risk reduction strategies that are affected by climate change due tolack of solid data on the implications of such change at local levels. In some cases, such asdonor-sponsored risk reduction programmes where both financing and global technicalsupport can be made available, it may be possible to have all the conditions present toundertake a properly designed probabilistic cost-benefit analysis using future climate changescenarios as a starting point for identifying strategies. Since a lot of adaptation relatedactivities are externally funded, cost-benefit analyses can be used extensively for suchstrategies.
The case studies also indicate that formal mechanisms for continuous learning are eithervery weak or missing in India, Pakistan and Nepal. Academic institutions and public andnon-profit research organizations do not seem to be prepared to undertake research. Notonly do current policies and practices need to be analyzed and compared but ingeniousmechanisms for risk reduction also need investigation. The study of drought responses inUttar Pradesh (Chapter 7), for example, showed that providing a combination subsidizedmicro-insurance and boreholes for irrigation during periods of drought can haveeconomically beneficial outcomes for vulnerable populations living at the poverty line.More research into such mechanisms is needed and climate-based cost-benefit analysis is agood tool to start with.
255
Movin
g fro
m Po
licy t
o Pra
ctice
: Role
of Co
st-Be
nefit
Analy
sis in
Proa
ctive
Disa
ster R
isk Re
ducti
on
The following sections delineate the development and practice of disaster risk reductionpolicies in India, Pakistan and Nepal. The history and development of the variousinstitutions involved in disaster risk management and the current practices and keyissues in their implementation are discussed in some detail.
India
This section sketches the landscape of policies and institutions with specific referenceto disaster management in the flood context in India in order to determine how toundertake the cost-benefit analysis of flood risk reduction strategies. The aim is tounderstand the role of various institutions and sectoral programmes of relevantministries in flood risk reduction and to identify effective points of entry for catalyzingdisaster risk management. We begin with the general national context and follow itwith descriptions of key programmes and institutions. Then we examine theunderstanding, potential use and application of cost-benefit analysis. The findingsare based solely on secondary literature and on the results of the scoping exercisesundertaken for a detailed cost-benefit analysis of risk reduction strategies in India(see Chapters 6 and 7).
Key Characteristics of the Indian Context
The “Top-down” Planning ProcessIndia is one of the largest democracies in the world. Though the Planning Commissionpromotes a bottom-up planning process, it is often constrained by the inability oflow-level agencies to address local development concerns. The process is furtherconstrained by a lack of comprehensive data on ground realities, and by budgets andtime. As a result, planning is, in fact, often top-down. This situation holds true fordisaster management too.
Disjointed Institutions: Lack of CoordinationThe government accords great importance to large-scale disaster management. ItsDisaster Management Act of 2005 represented a paradigm shift from a “relief centric”to a proactive approach of prevention, mitigation and preparedness. This act provided
National Cases
256
Catalyzing Climate and Disaster Resilience: Processes for
Identifying Tangible and Economically Robust Strategies
for the constitution of the National Disaster Management Authority (NDMA) asapex body for laying down policies, plans and guidelines for disaster managementunder the aegis of the Ministry of Home Affairs (MHA) with the prime minister aschair. State and district-level disaster management authorities are chaired by the chiefminister and district magistrates respectively. Although various central ministriesand departments and state governments should function in a coordinated mannerunder the NDMA, budget constraints and entrenched sectoral approaches havehampered their efforts, resulting in a disjointed approach overall.
Mismatch between Physical and Administrative BoundariesAdministrative and physical boundaries seldom match. Flood control managementhas to be dealt with at the basin level, but each basin, especially the bigger ones, lieswithin many different administrative boundaries (block/tehsil, district, state andnational). As a result, most actions with a direct impact, especially on floods, are takenat the administrative level but their implications are at the basin level.
Mismatch between Community Needs and Government ProgrammesThere is a disjuncture between community needs and government programmes.Community needs for prevention, mitigation, communication, and resilientlivelihoods are cross-sectoral and interventions combine individual, community, andhigher-level actions, but the government’s flood management plans generally do notfocus on entire gamut of interventions. In particular, they neglect livelihood promotion,despite its potential to address the root cause of flood vulnerability.
Capacity Gaps at the Local LevelCommunity mobilization and capacity building programmes demand long timeframes. Government-supported programmes of this nature are difficult to sustain,partly because of inadequate resources or time constraints. The mobilization, educatingand training of community institutions, including gram panchayats (the lowest levelof government), requires a strong network of NGOs with a long-term commitment toarea development. Unfortunately very few NGOs work in flood-affected areas andmost of them provide only relief.
Ineffective Follow-up and Integration of Learning into PracticeSeveral committees, high-level working groups and task forces1 have been appointedto look into flood-related problems and suggest remedial measures. Theimplementation of recommendations has been rather slow and for social, financial,administrative and political reasons at best partial action has been taken on themajority of them. Some areas the government of Uttar Pradesh needs to follow-up onare listed below:
Undertake a realistic and scientific assessment of flood damage at the basin andsub-basin level. Currently available data is not by basin and sub-basin.Assess the performance of existing and future flood control works. The expertcommittee which reviewed the implementation of the recommendations of the
1 Policy statement of 1954, High Level Committee on Floods-1957 and policy statement-1958, Ministers’ Committee on Flood Control-1964,The Working Group on Flood Control for Five-Year Plans, Rashtriya Barh Ayog-1980, The Pritam Singh Committee report-1980, Report ofFM in the state of Bihar, Uttar Pradesh (UP), West Bengal and Orissa-1988, The Regional Task Forces -1996, The Expert Group on FM in UPand Bihar – 1999, Report of the Committee on Silting of Rivers in India-2002, Expert Committee to Review Recommendations of RashtriyaBarh Ayog-2003, and the Task Force on Flood Management/ Erosion Control-2004.
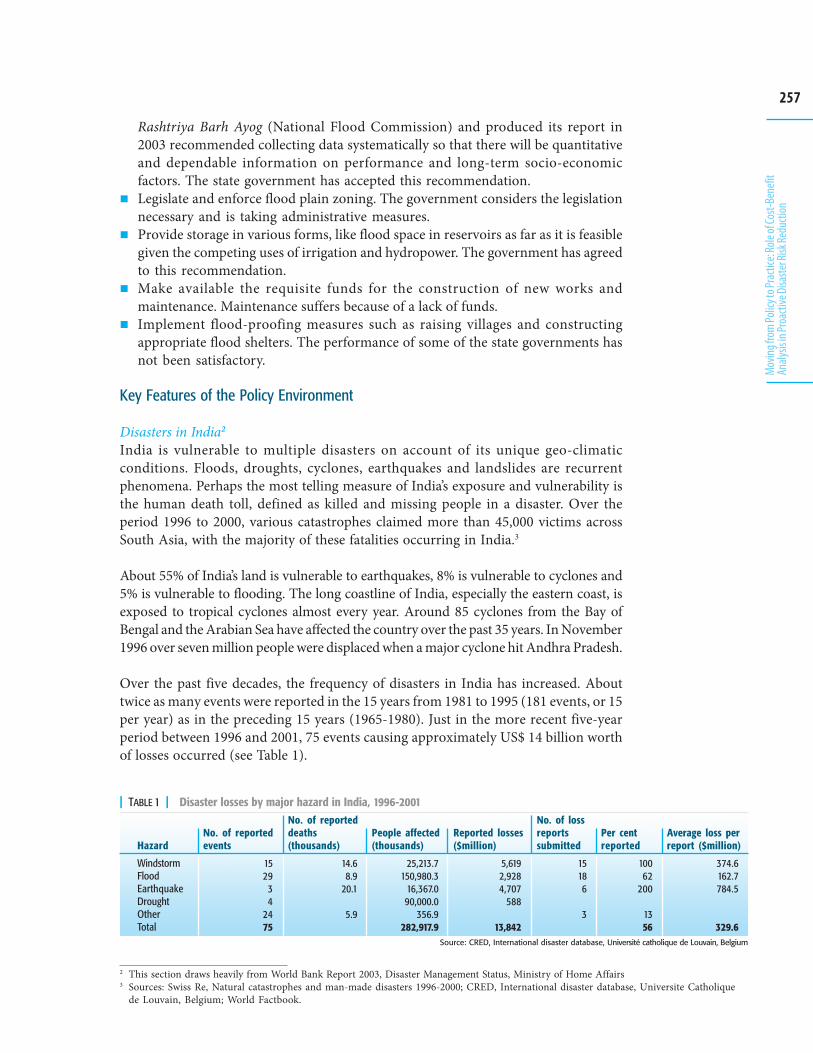
257
Movin
g fro
m Po
licy t
o Pra
ctice
: Role
of Co
st-Be
nefit
Analy
sis in
Proa
ctive
Disa
ster R
isk Re
ducti
on
Rashtriya Barh Ayog (National Flood Commission) and produced its report in2003 recommended collecting data systematically so that there will be quantitativeand dependable information on performance and long-term socio-economicfactors. The state government has accepted this recommendation.Legislate and enforce flood plain zoning. The government considers the legislationnecessary and is taking administrative measures.Provide storage in various forms, like flood space in reservoirs as far as it is feasiblegiven the competing uses of irrigation and hydropower. The government has agreedto this recommendation.Make available the requisite funds for the construction of new works andmaintenance. Maintenance suffers because of a lack of funds.Implement flood-proofing measures such as raising villages and constructingappropriate flood shelters. The performance of some of the state governments hasnot been satisfactory.
Key Features of the Policy Environment
Disasters in India2
India is vulnerable to multiple disasters on account of its unique geo-climaticconditions. Floods, droughts, cyclones, earthquakes and landslides are recurrentphenomena. Perhaps the most telling measure of India’s exposure and vulnerability isthe human death toll, defined as killed and missing people in a disaster. Over theperiod 1996 to 2000, various catastrophes claimed more than 45,000 victims acrossSouth Asia, with the majority of these fatalities occurring in India.3
About 55% of India’s land is vulnerable to earthquakes, 8% is vulnerable to cyclones and5% is vulnerable to flooding. The long coastline of India, especially the eastern coast, isexposed to tropical cyclones almost every year. Around 85 cyclones from the Bay ofBengal and the Arabian Sea have affected the country over the past 35 years. In November1996 over seven million people were displaced when a major cyclone hit Andhra Pradesh.
Over the past five decades, the frequency of disasters in India has increased. Abouttwice as many events were reported in the 15 years from 1981 to 1995 (181 events, or 15per year) as in the preceding 15 years (1965-1980). Just in the more recent five-yearperiod between 1996 and 2001, 75 events causing approximately US$ 14 billion worthof losses occurred (see Table 1).
2 This section draws heavily from World Bank Report 2003, Disaster Management Status, Ministry of Home Affairs3 Sources: Swiss Re, Natural catastrophes and man-made disasters 1996-2000; CRED, International disaster database, Universite Catholique
de Louvain, Belgium; World Factbook.
Hazard
WindstormFloodEarthquakeDroughtOtherTotal
No. of reportedevents
No. of reporteddeaths(thousands)
People affected(thousands)
Reported losses($million)
No. of lossreportssubmitted
Per centreported
Average loss perreport ($million)
| TABLE 1 | Disaster losses by major hazard in India, 1996-2001
Source: CRED, International disaster database, Université catholique de Louvain, Belgium
374.6162.7784.5
329.6
10062
200
1356
15186
3
5,6192,9284,707
588
13,842
25,213.7150,980.3
16,367.090,000.0
356.9282,917.9
14.68.9
20.1
5.9
1529
34
2475
258
Catalyzing Climate and Disaster Resilience: Processes for
Identifying Tangible and Economically Robust Strategies
These recurrent disasters have caused huge directlosses of public and private economic infrastructurein India. It is estimated that on an average directlosses attributable to disasters constituted about2% of India’s GDP and consumed up to 12% of thecentral government’s revenues between 1996 and2001. It is alarming that the reported direct lossesfrom natural catastrophes during the 15-year periodfrom 1981to 1995 ($13.4 billion) were more than fourtimes those registered during the previous 15 years($2.9 billion).
Disaster Management Policies and Programmes inIndiaThe government’s response to disaster hastraditionally been limited to calamity relief and haslargely been implemented through the five-year fiscalplanning cycle. This more or less reactive responseto disaster management can be broadly categorizedinto three types:5
Rescue and relief: The disaster management plansdeveloped by state and national authorities haveemphasized the prevention of loss of lives throughrescue and relief efforts and the provision of food,clothes, safe water and proper medical treatment.
Infrastructure restoration: The governmentaccords priority to the restoration to normaloperating conditions of basic infrastructure, likeroads, public buildings, airfields, ports, andcommunication networks.
Communication: Government authoritiescommunicate the impact of the disaster and the specific activities that are being (or needto be) undertaken to the larger community.
Disaster management has been the responsibility of the state, with funding supportfrom the central government. Three distinct categories of support have been providedfrom the centre: direct relief (including emergency water, food and shelter, drainageworks and seed); relief coupled with productive activities, such as work on plannedprojects; and the repair and reconstruction of government assets.
While there have been numerous ad hoc changes in the government’s approach todisaster funding over the last five decades, particularly with regard to the nature ofcentral supplementary transfers, the primary mechanisms for disaster funding, which
| FIGURE 1 | Number of disaster events and total populationaffected from 1960-2006.4
Adapted from: Swiss Re, Natural catastrophes and man-made disasters 1996-2000;CRED, International disaster database, Universite Catholique de Louvain, Belgium;World Factbook.
�����������������������������������������������������������
��������
�������� ���
� ��
���� ��������������
��������
�
�� ��
������
��� ������ ��� ����� �����
���
���
���
���
���
���
��
��
��
��
���
�����������������������������������������
�������� �������� ��������������� �������!
���!� ����
�� "������#$����
�����"��
�����"��
���"��
���"��
���"��
���"��
�"��
�����"�#
#��"��
��"���"��
���
�#�
�� �
Adapted from: CRED, International Disaster Database, Université catholique de Louvain,Belgium
| FIGURE 2 | Reported Catastrophe Losses in India, 1965-2001Nominal US$ Million adjusted for changes inexchange rates
4 CRED database5 WII- Review of Policies, 2005
259
Movin
g fro
m Po
licy t
o Pra
ctice
: Role
of Co
st-Be
nefit
Analy
sis in
Proa
ctive
Disa
ster R
isk Re
ducti
on
are gradually shifting now as the paradigm shift outlined in the next section proceeds,can be briefly summarized as:
The Calamity Relief Fund (CRF) meets the immediate relief needs of the victims ofcyclone, drought, earthquake, fire, flood and hailstorms. Under this arrangementeach state receives funds, 75% of which come from the central level in the form ofnon-planned grants. The state has to provide the remaining 25%. States may alsodraw on up to 25% of the central funds due in the following year, subject tosubsequent adjustment.State CRFs are administered by committees of officials associated with relief workor experience in the natural calamity field. CRF funds may be applied to existingcapital works, but only if required for the provision of immediate relief, such as therestoration of drinking water and shelter.Following a severe disaster, the central National Calamity Contingency Fund(NCCF) meets relief expenditures in excess of a state’s CRF fund, subject to oversightby the National Centre for Calamity Management (NCCM) constituted by theMinistry of Home Affairs.
The Paradigm Shift in Disaster Management in IndiaThe last decade has witnessed a paradigm shift in the government’s approach to disastermanagement. The calamity relief approach has been replaced by a disaster preparednessapproach integrated into the development process itself. This new strategy proceedsfrom the conviction that development cannot be sustainable unless disaster mitigationis built into development strategies. This new approach also stems from the belief thatinvestments in mitigation are much more cost effective than expenditure on relief andrehabilitation.6 The Tenth Plan (2002 to 2007) included a number of schemes that dealwith the prevention and mitigation of the impact of natural disasters.
The new approach has been translated into anational disaster management framework thatserves as a broad guide to be referred to at the stateand district levels. In this framework, the Ministryof Home Affairs is the apex body for disastermanagement for all natural disasters exceptdroughts for which the Ministry of Agriculture isthe apex body. The central government providesfinancial and logistical support to stategovernments. The new approach has involved:
1. The set-up of a national disaster management authority (NDMA) at the central level2. Promotion of the integration of disaster preparedness and mitigation into the
development process though the reorientation of existing rural development schemes3. Development of early warning systems, vulnerability maps, safe building by-laws,
and other preventive measures4. Promotion of community participation in designing and implementing
programmes and building the skills of communities
BOX 1Community Involvement in Disaster Management
The tsunami of 26 December 2004, which hit Samiyarpettai village inCuddalore District of Tamil Nadu, showed that adopting a strategy ofcommunity involvement is very effective in saving lives. Villagers fromSamiyarpettai were trained under the UNDP-GoI Disaster Risk ManagementProgramme that includes developing survival skills, establishing search andrescue teams, conducting mock drills, and promoting general disasterawareness. Only 22 lives were lost in the disaster, while in neighbouringvillages, like Pudukuppam, the death toll was much higher.
Source: Comprehensive Disaster Risk Management Framework, End of the CourseProject, Aanchal Garg 5/8 6/14/2005
6 Source: GoI Status Paper
260
Catalyzing Climate and Disaster Resilience: Processes for
Identifying Tangible and Economically Robust Strategies
5. Increasing awareness by using information and communication technologies andtargeting the education sector
6. Exploration of new mechanisms such as crop insurance for disaster risk reduction
In the following sections, we examine key institutional developments that demonstratethe existing approach to disaster management in India.
National Disaster Management AuthorityThe NDMA is the nodal agency for disaster management in India. It’s establishmentwas mandated under the 2005 National Disaster Management Act. It is mandated tocoordinate policies and relief and rehabilitation programmes on disaster management
and to promote disaster preparedness at all levelsfrom state to district. NDMA is responsible for allkinds of disasters. It is responsible for coordinatingfive areas:
1. Policies for and approaches to disasterreduction
2. The promotion of preparedness at all levels -state, district and block
3. Response4. Relief and rehabilitation5. The amendment of existing laws and procedure
In its approach to pre-disaster activities thegovernment puts an equal effort into developinginstitutional and human capital and investing inthe strengthening of physical infrastructure (seeBox 2)
Mainstreaming Disaster Management into the Development ProcessesThe government of India has adopted mitigation and prevention as essential componentsof its development strategy and each state is supposed to prepare a plan for disastermitigation in accordance with this central-level strategy. Existing development schemesare being reoriented in order to mainstream disaster preparedness either by preparingcommunities to cope with disasters by enhancing their ability to use available resourcesto meet basic needs during times of adversity or to adapt to disasters through bringingabout long-term changes in livelihood and economic systems, such as changing croppingpattern or land use. The main institutions responsible for mainstreaming disasterpreparedness into the development process are described here:
Ministry of Agriculture (MoA): Endorses projects focusing primarily on the technicalaspects of developing rain fed agriculture. These include the National WatershedDevelopment Project for Rain fed Areas (NWDPRA), the Indian Council of AgriculturalResearch’s model watershed projects, and the World Bank-assisted pilot project forwatershed development in rainfed areas.
Ministry of Rural Development (MoRD): Oversees projects focusing on waterharvesting through the construction of percolation tanks, contour bunds, and other
BOX 2NDMA’s Approach to Disaster Management
Institutional capital• Develop a multi-disaster surveillance system• Liaise with the Ministry of Home Affairs/Emergency Operations
Centre• Conduct vulnerability assessment through multi-hazard risk
zonation• Develop guidelines for earthquakes, flood and warning manuals• Produce a safety housing atlas
Human/social capital• Conduct social mobilization and awareness campaigns• Increase participation in decentralized planning• Enhance community capacity in multi-hazard prone districts
(through DMCs and DMTs by training communities to preparevillage inventories, build safe shelters, stockpile relief materialsand make evacuation plans
Physical capital• Build cyclone shelters, dams, barrages and flood shelters
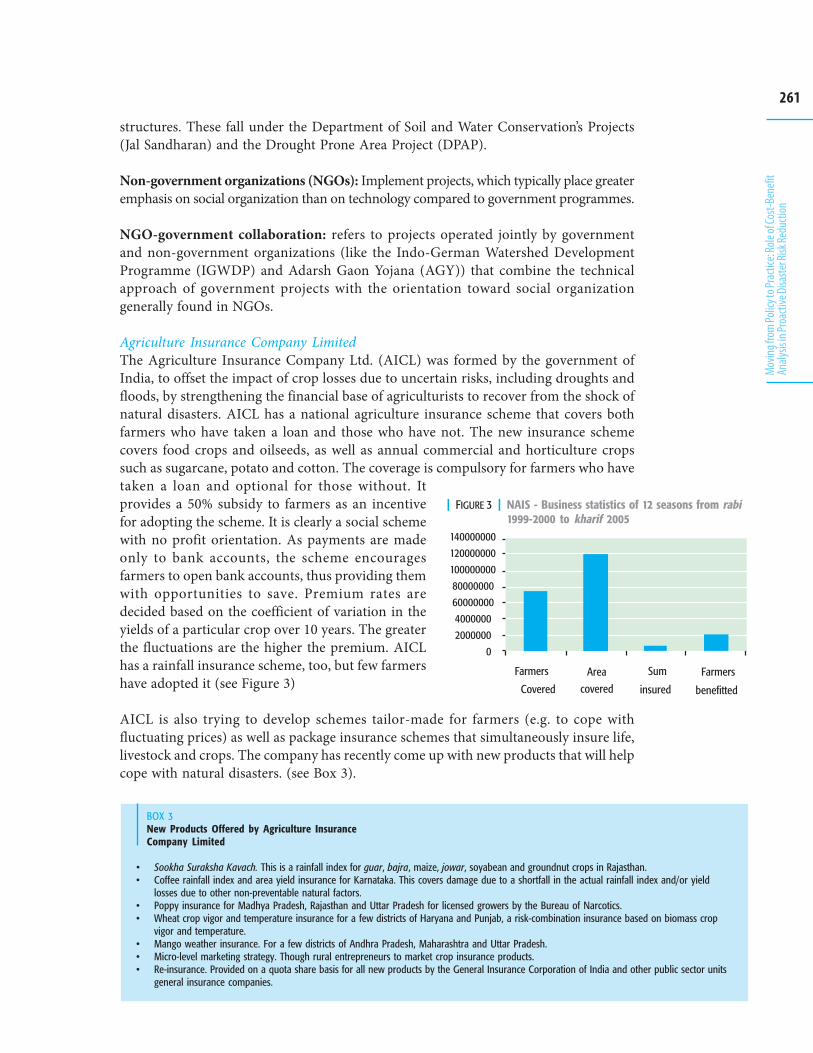
261
Movin
g fro
m Po
licy t
o Pra
ctice
: Role
of Co
st-Be
nefit
Analy
sis in
Proa
ctive
Disa
ster R
isk Re
ducti
on
structures. These fall under the Department of Soil and Water Conservation’s Projects(Jal Sandharan) and the Drought Prone Area Project (DPAP).
Non-government organizations (NGOs): Implement projects, which typically place greateremphasis on social organization than on technology compared to government programmes.
NGO-government collaboration: refers to projects operated jointly by governmentand non-government organizations (like the Indo-German Watershed DevelopmentProgramme (IGWDP) and Adarsh Gaon Yojana (AGY)) that combine the technicalapproach of government projects with the orientation toward social organizationgenerally found in NGOs.
Agriculture Insurance Company LimitedThe Agriculture Insurance Company Ltd. (AICL) was formed by the government ofIndia, to offset the impact of crop losses due to uncertain risks, including droughts andfloods, by strengthening the financial base of agriculturists to recover from the shock ofnatural disasters. AICL has a national agriculture insurance scheme that covers bothfarmers who have taken a loan and those who have not. The new insurance schemecovers food crops and oilseeds, as well as annual commercial and horticulture cropssuch as sugarcane, potato and cotton. The coverage is compulsory for farmers who havetaken a loan and optional for those without. Itprovides a 50% subsidy to farmers as an incentivefor adopting the scheme. It is clearly a social schemewith no profit orientation. As payments are madeonly to bank accounts, the scheme encouragesfarmers to open bank accounts, thus providing themwith opportunities to save. Premium rates aredecided based on the coefficient of variation in theyields of a particular crop over 10 years. The greaterthe fluctuations are the higher the premium. AICLhas a rainfall insurance scheme, too, but few farmershave adopted it (see Figure 3)
AICL is also trying to develop schemes tailor-made for farmers (e.g. to cope withfluctuating prices) as well as package insurance schemes that simultaneously insure life,livestock and crops. The company has recently come up with new products that will helpcope with natural disasters. (see Box 3).
| FIGURE 3 | NAIS - Business statistics of 12 seasons from rabi1999-2000 to kharif 2005
BOX 3New Products Offered by Agriculture InsuranceCompany Limited
• Sookha Suraksha Kavach. This is a rainfall index for guar, bajra, maize, jowar, soyabean and groundnut crops in Rajasthan.• Coffee rainfall index and area yield insurance for Karnataka. This covers damage due to a shortfall in the actual rainfall index and/or yield
losses due to other non-preventable natural factors.• Poppy insurance for Madhya Pradesh, Rajasthan and Uttar Pradesh for licensed growers by the Bureau of Narcotics.• Wheat crop vigor and temperature insurance for a few districts of Haryana and Punjab, a risk-combination insurance based on biomass crop
vigor and temperature.• Mango weather insurance. For a few districts of Andhra Pradesh, Maharashtra and Uttar Pradesh.• Micro-level marketing strategy. Though rural entrepreneurs to market crop insurance products.• Re-insurance. Provided on a quota share basis for all new products by the General Insurance Corporation of India and other public sector units
general insurance companies.
benefitted
140000000120000000100000000 80000000 60000000 4000000 2000000 0
Farmers Area Sum Farmers
Covered covered insured
262
Catalyzing Climate and Disaster Resilience: Processes for
Identifying Tangible and Economically Robust Strategies
Current Operational Environment
Key Actors in GovernmentThe Planning Commission is evolving a long-term strategic vision and deciding onpriorities for the country. It also envisages playing a key role in policy formulationin critical areas of human and economic development in an integrated manner. Itplans to focus on increasing the efficiency and utilization of allocations.
In January 2008, as mandated, the NDMA issued guidelines for flood managementprepared though extensive consultations with various stakeholders, includingrepresentatives from the government, international humanitarian organizations,multilateral and bilateral organizations, academics and private organizations. Theseguidelines will help both central government ministries and departments and stategovernments draw up flood management plans under the nodal agencies for floodmanagement, the Ministry of Home Affairs, the Ministry of Water Resource and theCentral Water Commission. These plans will be formulated and implemented bycentral government bodies, state governments and local bodies, including panchayatsand urban bodies, while compliance and enforcement of the same will be ensured bycommunities and other organizations. The plans will be reviewed and monitored bythe State Disaster Management Authorities (SDMAs) and the NDMA at the stateand national levels, respectively.
The UN system in IndiaA major emphasis of the UN in India has beenon incorporating drought risk reduction intothe Millennium Development Goal plandeveloping an understanding of the analyticaltools necessary for identifying vulnerablegroups and targeting drought risk reduction,development cooperation funds as well asaddressing the immediate, underlying and rootcauses of the impacts of disasters.Simultaneously, the focus is on increasing creditin order to disaster-proof livelihoods and onlivelihood diversification in order to protectagainst disaster losses. An illustrative exampleis the GoI-UNDP-Disaster Risk Managementprogramme (see Box 4).
International Humanitarian OrganizationsOrganizations such as the Indian Red CrossSociety, Tearfund, Oxfam, CARE-India, Eficor,Caritas-India, Christian Aid, World VisionIndia, CASA and ECHO have focused onproviding disaster aid in flood affected areas.These relief agencies provide food, clothing,medicine and other necessary items to affectedpopulations but they are increasingly
BOX 4GoI-UNDP DRM Programme
With the assistance of UNDP, USAID and the European Union, acomprehensive programme has been introduced in 169 districts in 17multi-hazard prone states: Assam, Arunachal Pradesh, Bihar, Delhi,Gujarat, Maharashtra, Meghalaya, Mizoram, Manipur, Nagaland, Orissa,Sikkim, Tamil Nadu, Tripura, Uttar Pradesh, Uttarakhand and West Bengal.
The states are assisted in drawing up state, district and block-leveldisaster management plans. Village disaster management plans are beingdeveloped in conjunction with Panchayati Raj Institutions and disastermanagement teams consisting of village volunteers are being trained inpreparedness and response functions such as search and rescue, first aid,relief coordination and shelter management. State and district-level multi-hazard resistant Emergency Operation Centres (EOCs) are also being setup under the programme state nodal agencies have identified equipmentdistrict and state EOCs need and are in the process of providing them.Orientation trainings for masons, engineers and architects in disasterresistant technologies have been initiated in these districts.
The mission of the programme is to reduce vulnerability to all types ofhazards, be they natural or man-made. Significant steps towardsvulnerability reduction have already been taken, including putting in placeprevention and mitigation measures and preparing for a rapid andprofessional response. With its massive awareness-generation campaignand its capacity building as well as the institutionalization of the entiremechanism through a techno-legal and techno-financial framework, theprogramme is gradually moving in the direction of sustainabledevelopment. The various prevention and mitigation measures outlinedabove are aimed at building up the capabilities of communities, voluntaryorganizations and government functionaries at all levels.
Particular stress is being laid on ensuring that these measures areinstitutionalized in a manner appropriate for handling the vast populationand the geographical area of the country. This is a major task. Theultimate goal is to make prevention and mitigation a part of everyday life.
263
Movin
g fro
m Po
licy t
o Pra
ctice
: Role
of Co
st-Be
nefit
Analy
sis in
Proa
ctive
Disa
ster R
isk Re
ducti
on
supporting preparedness programmes. As of yet, however, these programmes are notlinked to long-term development programmes.
Private OrganizationsIn the recent past, especially after the 2005 tsunami, private organizations have showngreater interest in disaster management activities, but their role has focused primarilyon emergency relief, recovery and reconstruction but not on addressing the underlyingand root causes of disaster impacts. Private organizations already play a significantrole with respect to insurance and catastrophe bonds. By providing technologicalsupport, they have the potential to also invest in the monitoring and surveillance ofhazards and preparedness programmes. Catalyzing substantial investment in riskreduction by the private sector, however, requires improved understanding of theassociated costs and benefits. Such assessments can, as a result play a critical roletoward involving the private sectors. In addition, the assessment process can assistprivate organizations in understanding the trade-offs involved between alternativeinterventions and thus assist them in prioritizing and targeting the disaster riskreduction activities they undertake more effectively.
Perceptions & Behavior of Communities in Flood AreasIn addition to government interventions and those by the private sector, communitiesoften undertake a variety of actions to reduce their risk from floods. These actionsand the perceptions could form a cost-effective basis for strengthening formal riskmanagement programs if, using CBA, they were consistently incorporated in the overalldevelopment and economic evaluation of such programs. While the range of strategiesand perceptions is too great to discuss in detail here, the examples below illustrate thevalue they could add:
Historically, people in eastern Uttar Pradesh and in other parts of India storedseeds to barter for grain after a disaster. Currently, however, only small farmersstore seeds, whereas large farmers purchase seeds from the market. Improvementsin seed storage at the local level could be a very cost-effective strategy for reducingflood risks.The people of Lakshmipur village in Maharajganj District of Uttar Pradesh believethat if they receive information about water levels during the flood season thenthey can take preventive actions. The information newspapers and the radiocurrently provide is not specific enough for them to gauge if their village is likely tobe affected or not, so they monitor water levels on their own. As a result, devolvingearly warning systems for floods from the region, district or block-level to thevillage level could be a cost-effective DRR strategy.Farmers in eastern Uttar Pradesh were interested in learning about suitablealternative crops that they could cultivate in order to minimize crop damage dueto floods and droughts. These could include:• Early-sowing, short duration crops that can be harvested before the onset of
the flood prone season (July-August)• Crops that can survive in waterlogged conditions
Seasonal migration is a common strategy that helps local communities that areregularly affected by floods to cope with the losses they incur. Strategies for supportingmigrants could be a highly cost-effective approach to flood risk mitigation.
264
Catalyzing Climate and Disaster Resilience: Processes for
Identifying Tangible and Economically Robust Strategies
Stakeholders’ Perceptions of Insurance IssuesPerceptions are also highly important in the evaluation of new strategies. In easternUttar Pradesh, for example, local perceptions regarding insurance raise fundamentalquestions that need to be evaluated in order to determine the effectiveness and benefitssuch schemes might have. Key perceptions that require evaluation include:
Farmers in eastern Uttar Pradesh and Orissa know little about crop insurance. Afew farmers take loans against their Kisan Credit Cards, which have an in-builtcrop insurance mechanism, but they are more interested in the amounts of theseloans than the insurance componentPayment for insured crop loans is made to farmers through often very politicallydriven official declarations. Compensation and exemptions from loans are notoften provided to those farmers who have been most affected by floods or droughtsBecause insurance agencies are generally unwilling to insure assets in areas thatare highly prone to disasters, the risk-spreading capabilities of communities inthese areas are minimal.Changing climatic scenarios throw related insurance mechanisms out of gear becauseit is difficult to estimate event probabilities and thus either losses or appropriatepremiums. It is problematic for insurance agencies to keep rescheduling their schemes.Demand-side structures and mechanisms for managing credit and insurance needto be promoted more than supply side structures and mechanisms.Existing insurance companies have not taken the initiative to raise the level ofawarenessPayment procedures are complicated: It requires numerous investigations andfarmers have to present certificates, which consumes time and money, and theysometimes have to mobilize influence to get the papers required.People interviewed were reluctant to go continue paying premiums without anyinterim benefits against their premium.
Data gapsThere are gaping holes in the data needed to do a complete hydrological analysis anda cost-benefit analysis of flood risk reduction strategies, though rainfall data can bebought by any agency in India. Because the density of rainfall stations is very low, it isimpossible to develop a true picture of the distribution of rainfall at the basin level.Individuals or non-governmental agencies cannot access river discharge data; theCentral Water Commission fiercely guards these. Even when one does get this data, itis not very useful as it is collected in just one point in the entire basin and, in the caseof the Rohini basin of Uttar Pradesh the only discharge gauging station has beenclosed since July 2006. Because relevant data from various agencies and departmentsis not available all in one place or in a usable form, the cost and time required toconduct a cost-benefit analysis is high.
Lack of Holistic Framework for Integration, Decision-making and AdvocacyIn the current context, when all primary stakeholders seem to be in favour ofembankments, the attempts of some civil society groups to force a re-think of thestrategies adopted to deal with floods have had little success. The reasons for thisfailure are many. Such groups are unable to show convincingly the disaggregatedimpacts of embankments and other disaster risk reduction strategies, they cannot
265
Movin
g fro
m Po
licy t
o Pra
ctice
: Role
of Co
st-Be
nefit
Analy
sis in
Proa
ctive
Disa
ster R
isk Re
ducti
on
engage effectively with relevant government departments, they are very critical of thegovernment strategy but have no scientific baseline study to prove their assertionsand they promote a single disaster risk reduction option rather than a package ofoptions. There is a need for an overarching framework that can highlight the trade-offs for each disaster risk reduction option, (or a package of them) and allows forclear-headed policy formulation.
Potential Role of Cost-Benefit Analysis in Disaster Risk Reduction Efforts in a Flood ContextA comprehensive cost-benefit analysis can help address many of the problems andconstraints outlined above. It can serve as a framework for organizing and analyzingdata in a manner that promotes a multi-stakeholder process in identifying andprioritizing various disaster risk reduction strategies. In particular, it has potentialfor being used in making decisions about investments in ministries and departmentsworking on flood management.
A cost-benefit analysis can also help international humanitarian and privateorganizations in making decisions about appropriate disaster risk reduction optionsby promoting dialogue with stakeholders.
Pakistan
This section reviews Pakistan’s policies for disaster risk reduction in order to ascertainthe potential application of information from risk-based cost-benefit analysis.
Key Characteristics of the Pakistan Context
Fluid PoliticsMore than sixty years after Independence, Pakistan still does not have a stabledemocratic political system characterized by multi-party representation, and smoothsuccessions of leaders and changes of governments. The government that took officeafter the general elections of 2008 has initiated a constitutional reform package thatseeks to restore the supremacy of the Parliament. In the previous eight years of military-dominated government, a number of institutions were set up for disaster management,such as the National Disaster Management Authority (NDMA) and the EarthquakeRelief and Reconstruction Authority (ERRA). The mandates and roles of theseorganizations will change under the new regime, but at present it is uncertain preciselyhow. As a result, the context is extremely fluid.
Disjointed InstitutionallyProgressive Centralization of Disaster ManagementPakistan is a federation of four provinces – Punjab, Sindh, North West FrontierProvinces (NWFP) and Balochistan - and three federally administered territories –Islamabad Capital Territory, Federally Administered Tribal Areas, and NorthernAreas. Azad Kashmir has its own state government.
For the first few decades after Independence, disaster management was considered aprovincial subject. The army was called in to carry out emergency flood protection
266
Catalyzing Climate and Disaster Resilience: Processes for
Identifying Tangible and Economically Robust Strategies
and rescue, for example, but operational command remained in the hands of thedeputy commissioner (district chief executive) and supervisory command was largelywith the provincial relief commissioner. The centralization of disaster managementstarted in the 1960s and accelerated in the 1970s. A federal Kohistan DevelopmentBoard (KDB) was established to absorb the huge international donor assistance afterthe Kohistan earthquake of December 1974. The government of NWFP was deemednot to have the capacity to undertake the scale of rehabilitation that was made possibleby donor support (Nadir, 1983). After the large floods of 1973 and 1976 in Punjab andSindh provinces respectively, the Federal Flood Commission (FFC) was created
With the establishment of the FFC, flood mitigation planning was centralized, butrelief operations remained at the district and provincial levels. In 1983 the NWFPCabinet rejected a proposal to replicate the KDB model as it implied a continuedupward delegation of rehabilitation functions (Nadir, 2007), but two decades later,after the catastrophic earthquake of October 2005 in Azad Kashmir and NWFP, reliefand rehabilitation planning and operations were centralized under the ERRA.
Operational rescue command has moved from the deputy commissioner in the fieldto the Chairman of the NDMA in the federal capital. To an extent, the centralizedmanagement of all the stages of disasters - from preparedness to rehabilitation - hasbeen made possible by more and better communications and transport. Some wouldargue the scale of recent disasters has also necessitated it. But these institutionalarrangements are out of joint with a de jure federal state. Researchers have documentedthe disempowering impact of federal government and army interventions on provincialand local disaster management capacities (Khan et al., 2007).
Sector-Based Institutions in a Multi-Hazard RealityAlthough people face multiple hazards, only some of which are natural, over the pastseveral decades, separate organizations have emerged for each main type of naturaldisaster and specific disaster events, such as the FFC for flood management and theERRA for the 2005 earthquake in Azad Kashmir and NWFP. Furthermore, sectoragencies and territorial units manage the preparedness, mitigation, relief andrehabilitation aspects of disaster management separately. Realizing that sucharrangements are flawed the government established the National DisasterManagement Authority (NDMA) in 2006. The NDMA however is a new organization,which exists largely on paper. At the field level, disaster response is still organized bysectors and segments.
There are different organizational entities to manage different aspects of a singlenatural hazard. For example, for rainstorms and for floods, both water-relateddisasters there are two separate organizations for early warning and for preparednessand mitigation planning. The Pakistan Meteorological Department (PMD), the Waterand Power Development Authority (WAPDA) and the FFC all have distinctinstitutional histories and mandates, but only the FFC has a mission that focusesdirectly on disaster management.
On paper, there are adequate protocols for cooperation between the involvedorganizations, but deficiencies have been repeatedly exposed when a heavy rainstorm
267
Movin
g fro
m Po
licy t
o Pra
ctice
: Role
of Co
st-Be
nefit
Analy
sis in
Proa
ctive
Disa
ster R
isk Re
ducti
on
causes a fast-rising flood, particularly in minor catchments.Such flaws were clear the case of the Lai River basin flood in2001 and also more recently in the 2006 and 2007 floods inseveral hill torrents in the North West Frontier Province.The PMD radar in Sialkot is useful for forecasting rainfalland run-off events in the watersheds of the main tributariesof the Indus River but not for the hill torrents in thenorthwest. Pakistan Space and Upper Atmosphere ResearchCommission (SUPARCO) satellite imagery is useful onlyfor forecasting large sea storms. While the MeteorologicalDepartment does issue flood-warning circulars on the basisof more general information, the UNDP and RuralDevelopment Policy Institute (RDPI) forum in JhangDistrict documented in 2003, there are several conceptualgaps in district flood fighting plans (Box 5).
Old Flood-Fighting Plans for Disasters that CrossJurisdictionsDistrict Flood-Fighting Plans (FFPs) are better on paper than in reality. Frequently,FFPs are just routine revisions on the previous year’s plans, merely updating thenames of contact officials, for example. This approach can result in serious omissions.For example, the WAPDA commissioned the major Chashma Right Bank Canal(CRBC) in D.I. Khan District in 2001. This canal cuts across the paths of several majorseasonal streams and has resulted in flooding along its west bank in several yearssince 2001 but WAPDA is not a part of the district’s flood-fighting plan sponsored bythe FFC (ADB, 2006). Overall, the FFP is just a reproduction of a document producedroutinely on an annual basis since the 1980s.
A similar issue exists with relief. The territorial units for rescue and relief are returnedto their bases when flood waters pass to the downstream district or province. Theresponsibility for relief then passes to the NDMA which then commissions otherorganizations for the actual delivery. This was demonstrated in the case of floodingafter cyclone Yemyeni in 2007, as the huge flood passed from Balochistan province towreck havoc in Sindh. The NDMA only complicated matters by quite arbitrarilyallocating districts for relief operations to designated NGOs.
Absence of Learning EnvironmentFormal Institutions Are Highly HierarchicalIn theory, a highly hierarchical culture is neither a necessary nor sufficient impedimentto learning. Witness the lack of learning in some markets. On the other hand, quite alot of learning goes on in some universities, colleges and schools, most of which arehierarchically arranged. In the government of Pakistan, however, with its strictprocedures and hierarchy, there is very little scope for inter-disciplinary or inter-sectoral learning as any interaction between departments has to be initiated at theapex level and all communication has to be conducted along the same “proper channel.”As a result, various organs remain airtight and there is little room for the cross-fertilization of knowledge and experience at the operational level.
BOX 5Critique of District Jhang, Flood Fighting Plan2003
A paper, “Alternative Perspective of DisasterManagement: A Policy Framework for DistrictGovernment Jhang”, by Amjad Bhatti, JournalistsResource Centre Islamabad was presented at theUNDP and RDPI forum. The author presented criticalobservations on the Flood Fighting Plan of Jhangdistrict which included dominance of an emergencyand relief management approach. The paperrecommended that disaster management, particularlyflood management in the district should be linkedwith the process of annual district developmentplanning within the ambit of district assembly. Theauthor recommended capacity building trainingworkshops for flood prone communities and districtdepartments and suggested preparation of five-yeardisaster preparedness plans for Jhang district.
Source: District policy workshop on disaster management, JhangDistrict, Punjab, Pakistan
268
Catalyzing Climate and Disaster Resilience: Processes for
Identifying Tangible and Economically Robust Strategies
Infrastructure Led DevelopmentThe idea that development is good in each and every way and its corollary thatinvestment in infrastructure is the key to development, have been successfully sold inPakistan. Leading political and executive decision-makers accept it as fact that mega-projects yield the most bang for the buck. In this paradigm, there is little room forlearning. Conservation is seen as an impediment to development. Institutionaldevelopment is neglected or thought to emerge naturally from the process of change.Mega-projects that mesh well with a command-and-control style of management dohave their opponents, but the motives of those opponents are questioned.Opportunities for corruption align well with this pattern of thinking.
Corruption and Avoiding DocumentationCorruption is pervasive and entrenched in Pakistan. Corrupt institutions havedeveloped policies and instruments that reinforce and perpetuate corruption. Lowgovernment salaries, lavish perks and privileges for selected elites, a plethora of directlyregulating rules for industry and commerce (many of which are mutually inconsistent),and non-transparent tendering processes are just some elements of this tainted system,while bribery and nepotism are its products. In this setting, managers avoid consistentdocumentation in order to escape accountability. It is nearly impossible to find mapsthat depict Pakistan’s entire developed infrastructure. Since each project has its ownseparate plan, questions like why the same drain has been built so many times areavoided. Without objective documentation, there can be little learning.
There are no systems for monitoring the outcomes or for evaluating the impacts ofprojects. In fact, traditional systems of supervision have decayed. For example, the useof the Planning Commission form (PC-IV) for project completion and satisfactoryoperation has largely been abandoned.
Weak Universities and Research Institutes with little Knowledge ManagementCapacityIn the first half-century after independence, Pakistani universities decayed as places oflearning for several reasons. Recently, however, along with a growth in the number ofuniversities and research institutions, there has been a concerted government andprivate sector effort to revive excellence in some universities. Some NGOs, such asFOCUS Humanitarian, PATTAN, RDPI and SCOPE, are working in disastermanagement and drawing lessons from their experiences, but there is still no researchinstitution with an explicit mission for disaster risk research or a university with thesubject of disaster management as part of its curriculum.
Disaster management agencies need to acquire a knowledge management orientation.There are a number of requirements for capitalizing on experiential learning. Theseinclude establishing linkages between university departments and research institutionsfor database development, monitoring outcomes, evaluating impacts, anddocumenting institutional histories.
Policy History and Key Features of the Policy EnvironmentPakistan has a well established macro-economic and development planning tradition.Prospective and medium term development frameworks are approved at the highest
269
Movin
g fro
m Po
licy t
o Pra
ctice
: Role
of Co
st-Be
nefit
Analy
sis in
Proa
ctive
Disa
ster R
isk Re
ducti
on
levels of government with the intent of providing the basis for all developmentplanning in the country. Currently, the long-term Vision 2030 released in 2007 and theMedium-Term Development Framework (MTDF) 2005-2010 are the key macro-policydocuments of the government in power. Pakistani’s Poverty Reduction Strategy Paper-II (PRSP-II) is being finalized. These macro-policy documents make little mention ofdisaster management in general, and disaster preparedness and resilience in particular.
Pakistan has also framed policies for specific sectors, such as communications, education,energy, and environment, and health and water, which have implications for disastermanagement, but the linkages are not explicit in most cases. For example, the policy ofsubsidizing tube well operations through a flat rate electricity charge has lead to thelowering of the water table in desertification-prone areas. Sector policies and legislationneed to be reviewed in order to align them with National Disaster Management Ordinance(NDMO) 2006, and, more generally, with sustainable development.
Cost-Benefit Analysis in Project FormulationPakistan’s public sector development policy has become increasingly project-drivenover time. In fact, has been observed that the MTDF and the Association for theDevelopment of Pakistan are no more than bundles of projects (Hunnam and Saeed,2007). Projects that cost more than a stipulated amount are required to prepare cost-benefit analyses, but this component of the PC-1 form is met quite mechanically.Costs are narrowly defined in terms of direct financial outlays. Externalities such associal and environmental costs are ignored. The estimated outlays on a project arecompared with notional benefits down the years at a standard discount rate (usually12%), and a crude benefit-cost ratio is presented to decision-makers. Any ratio over 1is taken as a signal that the public sector project in question is feasible. There is a tacitunderstanding that most of the benefit numbers are developed in the absence of (anyintention to levy) user charges.
History of Disaster Management Institutions & PoliciesBefore the October 2005 earthquake, the government was not organized in a mannerfor addressing prevention and response to disasters. The Calamity Act of 1958 wasthe first significant piece of Pakistani legislation designed to address disasters, but inpractice it only addressed disaster response, not the prevention of disasters, and nosystematic plan or organization was created to tackle a host of other issues concernedwith disaster management. In addition, the authority to respond to disasters wasassigned to the provincial level since it was believed that disasters primarily createdproblems at that level and below. Until 1970, Pakistan Civil Defence was assigned thetask of responding to disasters, but this institution7 consisted only of volunteers whoreceived limited training a mere two times each year.8 Following a cyclone in 1970 anEmergency Relief Cell (ERC) in the Cabinet Secretariat became responsible fororganizing the federal response to disasters.9 However, little change actually occurredin the management, preparation or planning for disasters.
7 NDMA National Disaster Risk Management Framework Pakistan, Government of Pakistan, March 2007.8 Qazi, Muhammed Usman, UNDP, personal communication, August 2, 2007.9 National Disaster Management Authority, National Disaster Risk Management Framework Pakistan, National Disaster Management
Authority, Government of Pakistan, March 2007.
270
Catalyzing Climate and Disaster Resilience: Processes for
Identifying Tangible and Economically Robust Strategies
Current Operating EnvironmentThis section seeks to relate policies concerning what is actually happening on theground: Who are the key actors? What really makes a difference in terms of disasterrisk reduction implementation and flow of funds? It looks at large-scale governmentinstitutions and the role cost-benefit analysis could play as a decision-making toolwithin them.
National Disaster Management Commission and AuthorityFollowing the 2005 earthquake, the government of Pakistan passed the NationalDisaster Management Ordinance 2006 to be implemented by a National DisasterManagement Commission (NDMC). This body was established in February 2006. Ithas made a five year plan to address disaster preparation and management, with anindicative budget of $15 million.10 In addition, the NDMC published a National DisasterRisk Management Framework to guide the system of disaster risk management. Itenvisages coordinating the national response to national-level disasters via a NationalEmergency Operations Centre (NEOC) and requires that the government makeavailable people and resources to engage in emergency responses.
The National Disaster Management Authority (NDMA) is assigned the task ofimplementing this framework. This mandate includes the establishment of disastermanagement authorities at the provincial, regional, district and municipal levels.11
While the document itself is commendable, the current focus on the ground remainson response and relief after disasters. The plans for vulnerability mapping have yet tobe implemented.
The NDMC and NDMA are attached to the Prime Minister’s Secretariat. The NDMA’spowers and functions duplicate to some extent the duties previously assigned to theEmergency Relief Cell of the Cabinet Division and the National Crisis ManagementCell in the Ministry of Interior. These units have not been disbanded nor their residualfunctions been specified. Indeed, the actual operational framework for disastermanagement is not transparent at all. The allocation of long-range responsibilitiesfor the programming and coordination of disaster management capacity buildingand extension across the country is even more unclear.
What is NDMA doing on the Ground?NDMA is a “small outfit” with 17 staff members, including a chairman, senior officer,advisor, Information Technology and Communications expert and technical advisor.It does not have any disaster risk reduction experts. The Chairman of NDMA insistedon a “small outfit” as, according to him, there is no need of NDMA during “normaltimes”. NDMA has a huge mandate for a handful of technical staff. NDMA and itsassociated organizations need to adopt a highly pragmatic and efficient (non-bureaucratic) management style to accomplish their mission.
Provincial disaster management authorities (PDMAs), district and municipal disastermanagement authorities (DDMAs) and tehsil (sub-district) and town management
10 Abbas, Hyder, “When Disaster Strikes,” Dawn Islamabad, Sci-tech World, August 4, 2007, p. 1.11 National Disaster Management Authority, National Disaster Risk Management Framework Pakistan, National
Disaster Management Authority, Government of Pakistan, March 2007.
271
Movin
g fro
m Po
licy t
o Pra
ctice
: Role
of Co
st-Be
nefit
Analy
sis in
Proa
ctive
Disa
ster R
isk Re
ducti
on
authorities (TMAs) have been conceptualized, but they have not been made operationalin the two years since the launch of NDMA. In Sindh, a PDMA was set up without firstcreating a provincial disaster management committee (PDMC) for legislation. Theconsequence is an ineffective and dormant PDMA unable to design and implementprovincial disaster risk management policy. All sub-authorities are linked to NDMAthrough a linear chain of command. The federal government, subject to approval oftheir disaster risk reduction plans, grants funds for these sub-authorities. Only thelowest tiers of DDMAs and TMAs have been conceptualized in a framework of multi-stakeholder partnerships. No multi-stakeholder partnership has materialized yet.
Other elements of NDMA’s mission include capacity building, training and awarenesssessions at the community, district, provincial and national levels. A few workshopson urban search and rescue (USAR), and pre-flood preparedness have been conductedand some PDMA staff trained, but NDMA has not managed to train a single rescueteam in two years. (Source: www.ndma.gov.pk)
NDMA is developing projects in each of its nine policy areas. One of the projects istitled “Vulnerability Mapping of Pakistan”. For this and some other projects, risk-based cost-benefit analysis could provide an important tool for analysis and policycommunications.
Can Risk-Based Cost-Benefit Analysis Help NDMA?The NDMA Framework does not explore the multiple dimensions of vulnerabilitysuch as social and political marginalization, lack of communication infrastructure,gender and ethnic discrimination, landlessness, all of which exacerbate the risks forvulnerable communities. Nor does it have space for the concept of development-induced disaster (RDPI, 2006). NDMA focus is on major national disasters and, eitherdeliberately or through oversight, it ignores emerging threats, such as climate change,saline water intrusion in the Indus Delta, andurban flooding (Comments during NDMALaunch Event, December 2006).
At present, NDMA has little use for a risk-basedcost-benefit analysis approach. It does not havethe in-house capacity to undertake or to absorbthe outputs of a cost-benefit analysis exercise.The fact that its mandate for major naturalhazards risk reduction ignores socialvulnerability could bias the terms of referencefor an outsourced risk-based cost-benefitanalysis assignment. It is not required to sharethe results of a cost-benefit analysis withcommunity stakeholders either.
The Earthquake Relief and Reconstruction Authority (ERRA)The mission of ERRA is to plan, coordinate, monitor and regulate activities for thereconstruction and rehabilitation of earthquake-affected areas; encourage self-reliancevia private public partnerships and community participation; and ensure financial
BOX 6Observations of Auditor-General, ERRA
Communities are having trouble reconstructing their houses owing to theabsence of proper construction guidelines the complexity of the buildingmethods specified and the rising prices of construction materials. In aninterview with the Risk to Resilience Study Team, the Auditor General of ERRAsaid, “Millions of dollars are presented to ERRA presuming that work will bedone. It is not being done! There is an absence of disaster risk reductioncapacity building through media. The DIY (do-it-yourself) Policy of ERRA isgood. However, there is an urgent need for a toll-free helpline for self-construction to be successful. A call centre with facilitators giving advice inPashto or Kashmiri is necessary. Many ERRA schemes have failed and severalmillion rupees of funds have lapsed owing to the lack of co-ordination amongexperts, implementers and end users.”
Source: PIEDAR Shared learning dialogue, 22/8/2007
272
Catalyzing Climate and Disaster Resilience: Processes for
Identifying Tangible and Economically Robust Strategies
transparency. ERRA is primarily relief-focused. Since its charter does not includereducing vulnerabilities and building capacities it cannot “build back better”.
The eleven sectors that ERRA has chosen to “build back better” are housing,livelihoods, health care, environment, tourism, telecommunications, education,transportation, agriculture, water supply and sanitation, and governance. But itsfocus is on cash grants and compensation rather than on building capacity anddeveloping resilience. For example, five billion Pakistani rupees have been disbursedas compensation for the loss of livelihoods, but little attention has been given tobuilding linkages to markets and providing training in livelihood opportunities.(Source: ERRA Progress Report, www.erra.gov.pk, 2007)
Could ERRA use Risk-Based Cost-Benefit Analysis?Given ERRA’s focus on the construction of quakeproof houses, schools and otherphysical infrastructure, there was an opportunity to establish construction standardsbased on a risk assessment of costs and benefits, but this opportunity has been missed.Over-designed structural specifications have been imposed, and environmental issuesand challenges ignored.
Financial transparency and accountability have not been maintained at the standardspromised when international donors pledged over six billion U.S. dollars (Box 6).Rather, the charter of ERRA states: “…no suit, prosecution, {or} other legal proceedingsshall lie against the authority, the council, the board, the Chairperson, or any member,officer, advisors, experts or consultants in respect of anything done in good faith”. Forthe financial provisions of ERRA, internal audit control has been adopted to ensurefinancial accountability. Nonetheless, NGOs and communities have made charges ofcorruption and poor administration. Some 80,000 applications were received in theoffices of deputy commissioners from claimants who had failed to receive even thefirst instalment of building compensation grants (Cheema. M, 2006).
ERRA has no mandate for effective disaster risk reduction. It missed the opportunityfor land use planning and urban planning in Muzaffarbad, Bagh and Balakot based onenvironmental factors and risk-based analysis of economic choices. There is norequirement for it to a present the economic rationale of its decision-making to thepublic. As a result, it has no need for a forward-looking risk-based cost-benefit analysistool. (ERRA Progress Report, www.erra.gov.pk, 2007)
Drought and Drought Emergency Recovery Authority (DERA)Pakistan does not have institutions dedicated to drought monitoring and droughtrisk reduction. The government has focused on crisis management and relief-basedpolicies for coping with droughts. Dr. Shahid Ahmed argues for formal, effective,efficient and transparent linkages between drought monitoring and mitigation agencies(Ahmad, 2007). In his report, “Institutional Arrangement and Policies for DroughtMitigation in Pakistan,” he identifies drought-monitoring institutions (such as thePakistan Metrological Department (PMD), the Drought and Environment MonitoringCentre, the Water and Power Development Authority and the Provincial IrrigationDrainage Authorities), drought research and development institutions (such as theArid-Zone Research Centre and the Pakistan Agriculture Research Centre) and
273
Movin
g fro
m Po
licy t
o Pra
ctice
: Role
of Co
st-Be
nefit
Analy
sis in
Proa
ctive
Disa
ster R
isk Re
ducti
on
drought-implementation agencies (such as the Department of Agriculture in Sindhand the Irrigation and Power Department in Balochistan). At present, their linkagesare informal, reactive, and unaccountable. Actions materialize long after droughtimpacts have become irreversible, at least during any realistic planning horizon.
Pakistan launched a federally administered drought mitigation programme calledThe Drought Emergency Recovery Authority (DERA) in 2001 in response to the severedrought of the late 1990s. From its inception DERA has been a reactive, relief-orientedprogramme which focuses on infrastructure development, temporary employment,and irrigation. It has not worked as a national apex organization for coordinatingdrought risk reduction activities with a clear vision and strategies for building droughtresilience by focusing on reducing vulnerability and developing the capacities oflivestock grazers although the loans from international financial institutions didrequest that such an authority be set up.
Even the most basic elements of drought risk reduction, such as the consequences oflowering of the water table have not been considered by DERA (IWRM, 2004).Balochistan Resource Management Programme (BRMP) has concluded that thecurrent programme of DERA is environmentally unsustainable owing to the miningof groundwater and the lowering of the water table; technically unsound owing toinappropriately designed and located delay action dams; operationally unviable owingto the lack of participation of water users and financially costly owing to the highoverhead and management costs of its schemes (IWRM, 2004).
The draft final report of BRMP recommends that any long-term strategy must includethe key disaster risk reduction practices listed below:
Water harvesting and conservation through traditional methods, such as karezes(lateral underground channels that tap the groundwater table), sailaba (flood waterconservation), and khuskhaba (rainwater harvesting).The establishment of year-round drought monitoring and early warning systems,the building of community awareness and the active participation at all levels ofNGOs and water users in drought mitigation schemes.Herd management and livestock extension services for adaptation.Soil and water conservation.Insurance, re-insurance and income diversification schemes.
Can DERA Benefit from Risk-Based Cost-Benefit Analysis?Risk-based cost-benefit analysis can help inform a holistic, integrated and well-defineddisaster risk reduction policy. The results could be used as a policy advocacy tool forsetting up an organization dedicated to drought preparedness, mitigation andadaptation. A well-conducted series of cost-benefit analysis exercises could be used todemonstrate the risks of groundwater mining to both decision-makers andcommunities. Such cost-benefit analysis exercises could be a component of an integratedwater resource management (IWRM) toolkit and programme. They could also helpcreate links with private insurance and re-insurance sectors. They could be adapted torun with downscaled climate models for the drought-affected regions of Pakistan.
274
Catalyzing Climate and Disaster Resilience: Processes for
Identifying Tangible and Economically Robust Strategies
Flood and the Federal Flood Commission (FFC)The FFC was formed in response to the massive floods of 1973 and 1976. It preparesand plays a major role in coordinating, financing and implementing the NationalFlood Protection Plans (NFPP). NFPP-IV, for the decade from 2007 to 2016, is beingreviewed by the Ministry of Water and Power (MOWP).
The government, ADB loans and project-based donor contributions fund the FFC.It has a highly centralized decision-making structure with a uniform template fordistrict flood-fighting plans. Having evolved from the Office of the Chief EngineeringAdvisor, it has a technical and engineering approach to flood management. Most ofthe professionals in FFC are engineers. There are no disaster specialists,geomorphologists or hydrologists.
The mission of the FFC is “effective flood management on a country wide basis withreference to main river systems of Pakistan” (Kamal, A. Superintending EngineerFFC). The aim is to develop integrated and standardized flood management plans.Most of its plans are structural and based on increasing flood resistance throughtechnological improvements. Chief Meteorologist Shaukat Ali Awan, FFD, PMD,thinks that FFC does not possess a complete flood hazard assessment of Pakistan.FFC has never carried out vulnerability and capacity assessments. In fact, Pakistandoes not even possess mechanisms for risk monitoring and risk mapping. Systematicsocio-economic and environmental loss analysis is not carried out after major orminor flood disasters. There are no educational programmes related to disasterrisk reduction in government schools and flood protection training programmesare not provided to the public. Large government organizations behave as thoughthere is no indigenous knowledge about flood coping mechanisms (interview byISDR accessed on 6/16/2008).
Since 2004, there has been some realization of the importance of communityparticipation and awareness in the formulation and implementation of floodprotection plans. A national NGO named PATTAN serves as a countrywide linkbetween communities living in the flood plains of Punjab and the FFC. However,multi-stakeholder partnerships in the NFPP are negligible. In fact, all provincialflood plans are approved or rejected at the discretion of FFC (Bari, S., personalcommunication, 4/7/2007).
Can Risk-Based Cost-Benefit Analysis Help FFC?The government should review the mission and strategy of FFC in view of the annualrecurrence of flood disasters and the massive havoc caused by cyclone Yemyeni inJuly and August 2007. The change must centre on developing a disaster risk reductionpolicy. FFC could follow up by making action plans which bridge the gaps betweenpolicy and practice, create better linkages among flood management institutions,and develop and implement best practices for flood risk resilience with the activeparticipation of communities at risk. The concept of risk-based choices has a role inthe formulation of policy, while cost-benefit analysis could be used to refine the actionplans.
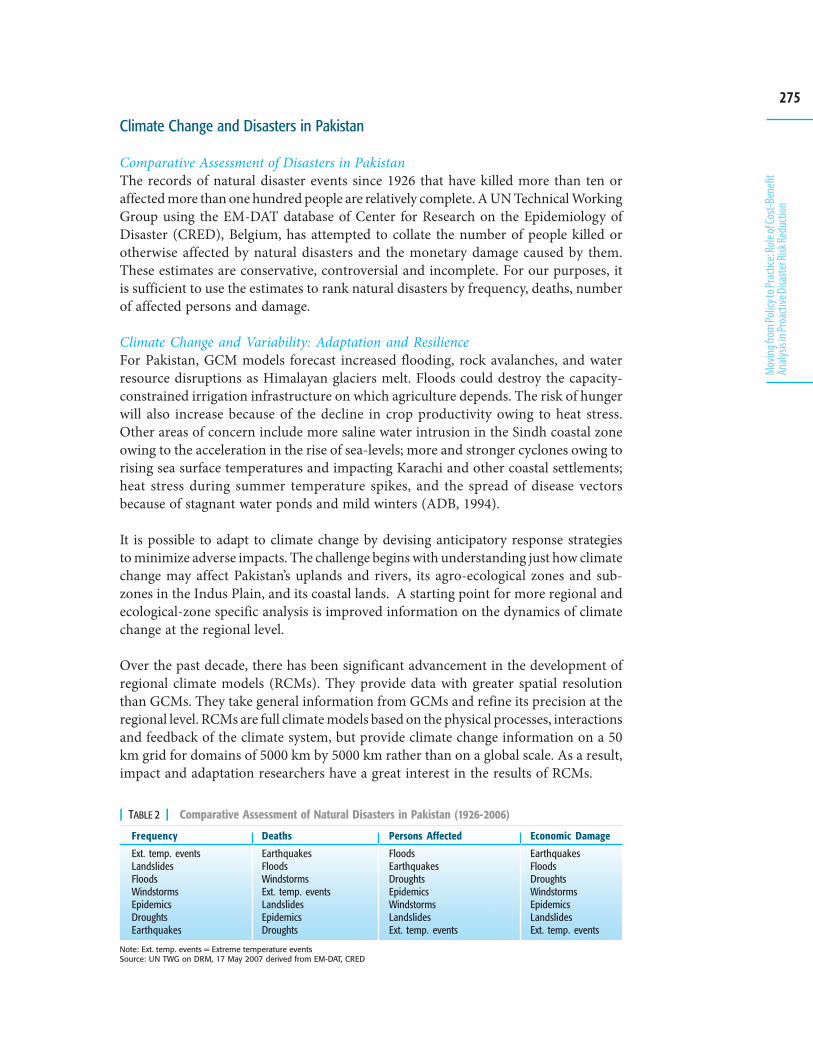
275
Movin
g fro
m Po
licy t
o Pra
ctice
: Role
of Co
st-Be
nefit
Analy
sis in
Proa
ctive
Disa
ster R
isk Re
ducti
on
Climate Change and Disasters in Pakistan
Comparative Assessment of Disasters in PakistanThe records of natural disaster events since 1926 that have killed more than ten oraffected more than one hundred people are relatively complete. A UN Technical WorkingGroup using the EM-DAT database of Center for Research on the Epidemiology ofDisaster (CRED), Belgium, has attempted to collate the number of people killed orotherwise affected by natural disasters and the monetary damage caused by them.These estimates are conservative, controversial and incomplete. For our purposes, itis sufficient to use the estimates to rank natural disasters by frequency, deaths, numberof affected persons and damage.
Climate Change and Variability: Adaptation and ResilienceFor Pakistan, GCM models forecast increased flooding, rock avalanches, and waterresource disruptions as Himalayan glaciers melt. Floods could destroy the capacity-constrained irrigation infrastructure on which agriculture depends. The risk of hungerwill also increase because of the decline in crop productivity owing to heat stress.Other areas of concern include more saline water intrusion in the Sindh coastal zoneowing to the acceleration in the rise of sea-levels; more and stronger cyclones owing torising sea surface temperatures and impacting Karachi and other coastal settlements;heat stress during summer temperature spikes, and the spread of disease vectorsbecause of stagnant water ponds and mild winters (ADB, 1994).
It is possible to adapt to climate change by devising anticipatory response strategiesto minimize adverse impacts. The challenge begins with understanding just how climatechange may affect Pakistan’s uplands and rivers, its agro-ecological zones and sub-zones in the Indus Plain, and its coastal lands. A starting point for more regional andecological-zone specific analysis is improved information on the dynamics of climatechange at the regional level.
Over the past decade, there has been significant advancement in the development ofregional climate models (RCMs). They provide data with greater spatial resolutionthan GCMs. They take general information from GCMs and refine its precision at theregional level. RCMs are full climate models based on the physical processes, interactionsand feedback of the climate system, but provide climate change information on a 50km grid for domains of 5000 km by 5000 km rather than on a global scale. As a result,impact and adaptation researchers have a great interest in the results of RCMs.
Frequency
Ext. temp. eventsLandslidesFloodsWindstormsEpidemicsDroughtsEarthquakes
Deaths
EarthquakesFloodsWindstormsExt. temp. eventsLandslidesEpidemicsDroughts
Persons Affected
FloodsEarthquakesDroughtsEpidemicsWindstormsLandslidesExt. temp. events
Economic Damage
EarthquakesFloodsDroughtsWindstormsEpidemicsLandslidesExt. temp. events
Note: Ext. temp. events = Extreme temperature eventsSource: UN TWG on DRM, 17 May 2007 derived from EM-DAT, CRED
| TABLE 2 | Comparative Assessment of Natural Disasters in Pakistan (1926-2006)
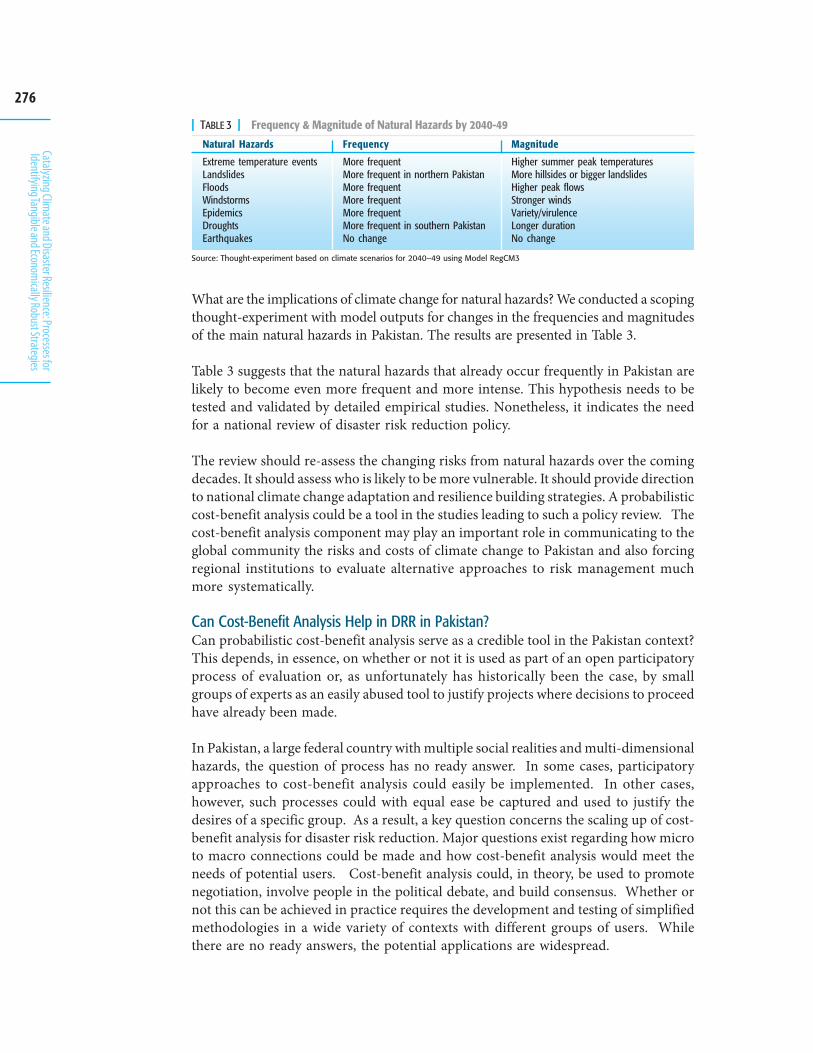
276
Catalyzing Climate and Disaster Resilience: Processes for
Identifying Tangible and Economically Robust Strategies
What are the implications of climate change for natural hazards? We conducted a scopingthought-experiment with model outputs for changes in the frequencies and magnitudesof the main natural hazards in Pakistan. The results are presented in Table 3.
Table 3 suggests that the natural hazards that already occur frequently in Pakistan arelikely to become even more frequent and more intense. This hypothesis needs to betested and validated by detailed empirical studies. Nonetheless, it indicates the needfor a national review of disaster risk reduction policy.
The review should re-assess the changing risks from natural hazards over the comingdecades. It should assess who is likely to be more vulnerable. It should provide directionto national climate change adaptation and resilience building strategies. A probabilisticcost-benefit analysis could be a tool in the studies leading to such a policy review. Thecost-benefit analysis component may play an important role in communicating to theglobal community the risks and costs of climate change to Pakistan and also forcingregional institutions to evaluate alternative approaches to risk management muchmore systematically.
Can Cost-Benefit Analysis Help in DRR in Pakistan?Can probabilistic cost-benefit analysis serve as a credible tool in the Pakistan context?This depends, in essence, on whether or not it is used as part of an open participatoryprocess of evaluation or, as unfortunately has historically been the case, by smallgroups of experts as an easily abused tool to justify projects where decisions to proceedhave already been made.
In Pakistan, a large federal country with multiple social realities and multi-dimensionalhazards, the question of process has no ready answer. In some cases, participatoryapproaches to cost-benefit analysis could easily be implemented. In other cases,however, such processes could with equal ease be captured and used to justify thedesires of a specific group. As a result, a key question concerns the scaling up of cost-benefit analysis for disaster risk reduction. Major questions exist regarding how microto macro connections could be made and how cost-benefit analysis would meet theneeds of potential users. Cost-benefit analysis could, in theory, be used to promotenegotiation, involve people in the political debate, and build consensus. Whether ornot this can be achieved in practice requires the development and testing of simplifiedmethodologies in a wide variety of contexts with different groups of users. Whilethere are no ready answers, the potential applications are widespread.
Natural Hazards
Extreme temperature eventsLandslidesFloodsWindstormsEpidemicsDroughtsEarthquakes
Frequency
More frequentMore frequent in northern PakistanMore frequentMore frequentMore frequentMore frequent in southern PakistanNo change
Magnitude
Higher summer peak temperaturesMore hillsides or bigger landslidesHigher peak flowsStronger windsVariety/virulenceLonger durationNo change
| TABLE 3 | Frequency & Magnitude of Natural Hazards by 2040-49
Source: Thought-experiment based on climate scenarios for 2040–49 using Model RegCM3
277
Movin
g fro
m Po
licy t
o Pra
ctice
: Role
of Co
st-Be
nefit
Analy
sis in
Proa
ctive
Disa
ster R
isk Re
ducti
on
Nepal
Climate induced disasters are a regular phenomenon in Nepal. In 2008, Nepalexperienced two major water related disasters. The first was the breach of Kosiembankments that affected 70,000 Nepalis and 3.5 million Biharis. Monsoon floodsled to massive devastation in the Mid and Far Western region. In both these and pastflood events, individuals and households adjusted to the hazards in several waysdepending on their economic conditions, education levels and social standings. Theimpacts on marginalized groups, including low-income families, widows, womenheaded households, the elderly, children, the disabled, families dependent on dailywages, those in debt and communities who were without access to basic services andinfrastructure, were largely negative. Their responses were similar to those made bymany other communities who have faced similar hazards. Their efforts at coping wereaimed at diversifying sources of income, including migrating, drawing upon a commonpool of resources, using social networks, drawing upon household savings of foodand fuel, and exploiting other assets.
On August 18, 2008 the eastern embankment of the Kosi River in Nepal Tarai wasbreached. Notably, the failure occurred when flow in that river was lower than thelong-term average flow for the month of August. Over the following weeks a disasterslowly unfolded as the Kosi River began flowing along one of its old courses east of itspresent one (See Box 1 in Chapter 1). According to the preliminary results of the inter-agency Kosi River Flood Impact assessment, a total of 66,500 individuals were displacedby the flood of which 42% were Indian nationals.12 The detailed damage assessment ofthe Kosi 2008 disaster was not available at the time of writing this report.
In another example, flash floods generated by monsoon rains between the 19th and 21st
of September, 2008, affected more than 200,000 people in Nepal’s Mid and Far westernRegions. More than 40 persons died and three months after the disaster more thanhalf of the population remains displaced. Though the flood water receded in a fewdays, irreversible damages to crops, houses and cattle resulted. Families joined handsto carryout those repairs that were within their capacity. They helped each other torepair houses and roofs and to improve drainage around the settlements. The responseof the state remained negligible. A few non-governmental organizations provided relief.
In both cases, hardships continued even five months after the disaster. Most of theaffected families from Kosi floods live in tents in relief camps established onembankments, canals banks and roads because these spaces were dry. Some peoplealso lived on neighbour’s rooftops. In many cases people sought help from local leaders,but support provided by such leaders was far too little. The response was better inKosi flood compared to that in the Mid and Far western floods.
Our research shows that in response to these events some families migrated to otherplaces in search of employment and some came back having developed skills likecarpet weaving; making plastic bags, buttons, brooms, switches or bangles; andrepairing bicycles. A few acquired skills in handling machines. Although local conditionsdid not encourage it, they also established local units and tried to earn a livelihood
12 OCHA situation report No. 5, 19 December 2008
278
Catalyzing Climate and Disaster Resilience: Processes for
Identifying Tangible and Economically Robust Strategies
outside of agriculture. Many others who were unable to obtain jobs ended up borrowingmoney and falling into the debt trap. Individuals in low-income brackets and thosewithout education were particularly vulnerable. Because of a lack of education and a lowlevel of awareness, many individuals develop fatalistic tendencies—jasto parchha testaitarchha (whatever happens in the course of time will be tackled as per one’s capacity).Some families suggest that God will protect them from the scourge of floods.
People point to the following four causes of flooding: (1) the disturbance of naturaldrainage by roads and canals (2) the breaching of embankments and spurs (3) theincrease in river discharge, including changes in river course and (4) the use of specificlocal measures that do not take the larger picture into consideration. Villagers considerfrequent and prolonged rainfall, thunderstorms and strong winds as signs of potentialflooding. Those living along riverbanks watch flow and water levels. When earlymonsoon floods wash away crops or damage farmland, farmers replant. Unless thereis substantial harm to the standing crops, farmers do not worry about standing waterin their plots. They consider the fine sediment deposited by the river to be beneficial.Bank erosion and land cutting on the other hand are harmful and sand casting severelyreduces land quality and agricultural productivity.
A family that loses its house normally takes shelter with a neighbour or relative.During floods many affected families shift to schools or Village DevelopmentCommittee (VDC) offices, which are built on higher lands. To earn a livelihood theywork on others’ farms. Some families remain in their villages waiting for external help.When flood waters do not drain quickly, villagers dig ditches to drain the stagnantwater. They even take drastic measures like breaching embankments and sections ofroads. Such a response is not unique. In North Bihar too, communities affected by waterlogging occasionally cut embankments to drain stagnant water. In August 1998, somevillagers in Parasi deliberately breached the Nepal-Gandak canal and a section of theroad along the canal because both had constrained drainage and prolonged inundation.
Safe storage of food, fuel and fodder before the onset of the monsoon is a commonprecautionary measure. The lack of safe drinking water and proper sanitation is amajor problem during and immediately after floods. To cope, families keep water inpots and store them in a place safe from flood water. Because the vessels are small andonly a little water can be stored, difficulties arise even so. Women often refrain fromeating to avoid defecation.
Actors and Activities: Fragmentation and DysfunctionFamilies face many difficulties due to floods. Responses by state agencies are stillrelief-based and similar to those during earlier flood hazards. This is especially true inNepal because of the institutional vacuum and dysfunction it has faced in recent times.Indeed, the state is conspicuous by its absence and its policies do not cater to individualneeds. The institutional erosion following the Maoist insurgency has worsened thesituation even since this study began. As of the end of 2004, the insurgency had causedthe deaths of more than 10,000 people. Violence, along with a political vacuum, hasundermined the social context as the national parliament, VDCs, District DevelopmentCommittees (DDCs) and municipalities were dissolved. Even after the ConstituentAssembly Election in 2008, uncertainty remains.
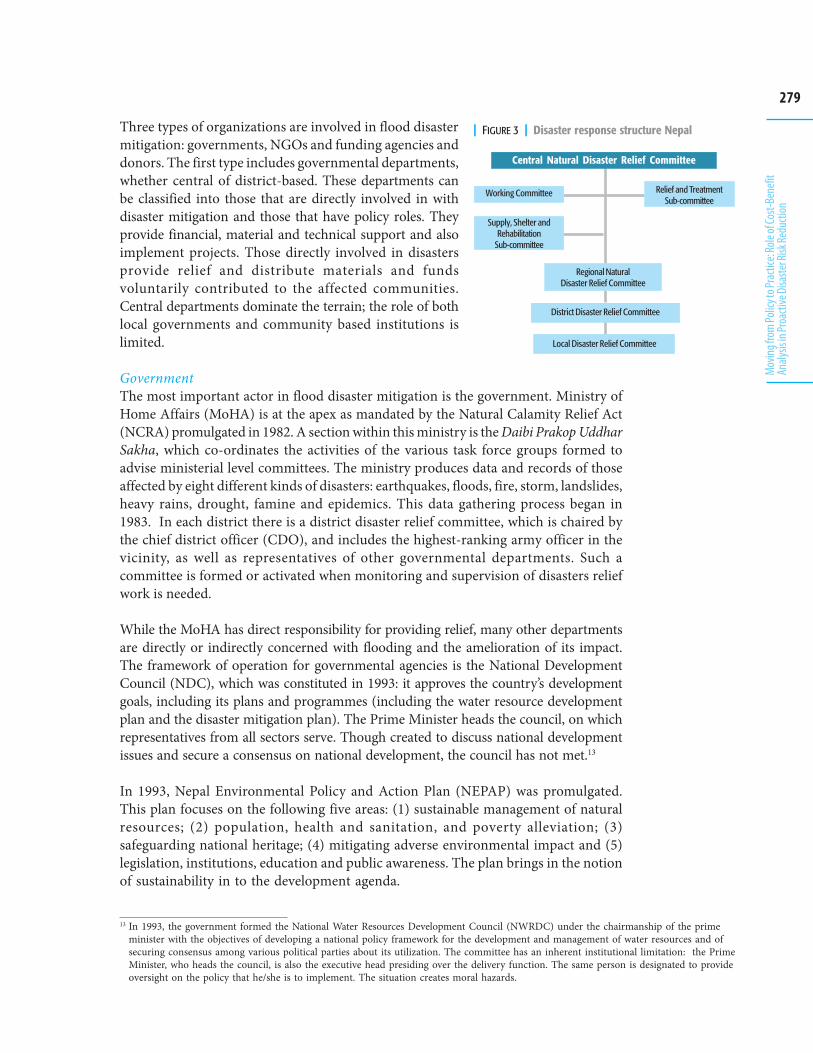
279
Movin
g fro
m Po
licy t
o Pra
ctice
: Role
of Co
st-Be
nefit
Analy
sis in
Proa
ctive
Disa
ster R
isk Re
ducti
on
Three types of organizations are involved in flood disastermitigation: governments, NGOs and funding agencies anddonors. The first type includes governmental departments,whether central of district-based. These departments canbe classified into those that are directly involved in withdisaster mitigation and those that have policy roles. Theyprovide financial, material and technical support and alsoimplement projects. Those directly involved in disastersprovide relief and distribute materials and fundsvoluntarily contributed to the affected communities.Central departments dominate the terrain; the role of bothlocal governments and community based institutions islimited.
GovernmentThe most important actor in flood disaster mitigation is the government. Ministry ofHome Affairs (MoHA) is at the apex as mandated by the Natural Calamity Relief Act(NCRA) promulgated in 1982. A section within this ministry is the Daibi Prakop UddharSakha, which co-ordinates the activities of the various task force groups formed toadvise ministerial level committees. The ministry produces data and records of thoseaffected by eight different kinds of disasters: earthquakes, floods, fire, storm, landslides,heavy rains, drought, famine and epidemics. This data gathering process began in1983. In each district there is a district disaster relief committee, which is chaired bythe chief district officer (CDO), and includes the highest-ranking army officer in thevicinity, as well as representatives of other governmental departments. Such acommittee is formed or activated when monitoring and supervision of disasters reliefwork is needed.
While the MoHA has direct responsibility for providing relief, many other departmentsare directly or indirectly concerned with flooding and the amelioration of its impact.The framework of operation for governmental agencies is the National DevelopmentCouncil (NDC), which was constituted in 1993: it approves the country’s developmentgoals, including its plans and programmes (including the water resource developmentplan and the disaster mitigation plan). The Prime Minister heads the council, on whichrepresentatives from all sectors serve. Though created to discuss national developmentissues and secure a consensus on national development, the council has not met.13
In 1993, Nepal Environmental Policy and Action Plan (NEPAP) was promulgated.This plan focuses on the following five areas: (1) sustainable management of naturalresources; (2) population, health and sanitation, and poverty alleviation; (3)safeguarding national heritage; (4) mitigating adverse environmental impact and (5)legislation, institutions, education and public awareness. The plan brings in the notionof sustainability in to the development agenda.
| FIGURE 3 | Disaster response structure Nepal
13 In 1993, the government formed the National Water Resources Development Council (NWRDC) under the chairmanship of the primeminister with the objectives of developing a national policy framework for the development and management of water resources and ofsecuring consensus among various political parties about its utilization. The committee has an inherent institutional limitation: the PrimeMinister, who heads the council, is also the executive head presiding over the delivery function. The same person is designated to provideoversight on the policy that he/she is to implement. The situation creates moral hazards.
Central Natural Disaster Relief Committee
Working Committee
Supply, Shelter andRehabilitation
Sub-committee
Relief and TreatmentSub-committee
Regional NaturalDisaster Relief Committee
District Disaster Relief Committee
Local Disaster Relief Committee
280
Catalyzing Climate and Disaster Resilience: Processes for
Identifying Tangible and Economically Robust Strategies
With support from UNDP and other donors the government is working on earthquakedisasters mitigation. The UN agency also provided support to strengthen disasterpreparedness capacities in the Kathmandu valley. The project’s major objective was tobuild capacity of the valley’s communities and municipalities to cope with earthquakerisk, and thus reducing the impact of a potential disaster.
In February 2008 a disaster management policy for Nepal was proposed. The ‘NationalStrategy for Disaster Risk Management’ (NSDRM)14 was submitted to the MoHA forapproval. Based on the Hyogo Framework for Action (HFA) and the MillenniumDevelopment Goals NSDRM proposes a road map until 2015.
In the water sector, the policy formulating body is the Water and Energy Commission(WEC) and its Secretariat (WECS), which are together meant to provide policy inputto the Ministry of Water Resources. The WEC’s mandate was defined in January 1999,when it was entrusted with a wide range of policy tasks. WECS was designated thecentral water planning and coordinating agency. The Water Resources Strategy of2001 suggested that ‘the WEC/WECS mandate needs to be further strengthened andthe organizational set up changed’.
Two departments of GoN are concerned with water-related activities, including floods:the Department of Hydrology and Meteorology (DHM), and the Department ofElectricity Development (DoED). DHM plays an important role in mitigating flooddisasters: it maintains a network of rainfall and flow gauging stations. The databasecompiled serves as a basis for the analysis of hazards. The department helped to co-ordinate a project supported by the Dutch government that lowered the water level ofthe Tsho Rolpa Glacier Lake to minimize the possibility of its breach. The lack ofsophisticated instruments needed to collect hydro-climatic data, and an insufficientbudget, are the main problems the department faces. The DoED issues licenses tohydropower projects and is concerned with their safety. Another concerned agency isthe para-statal Nepal Electricity Authority (NEA), which repaired the Kulekhanihydropower plant, damaged by the 1993 flood. Apart from this specific responsibility,the NEA plays no role in disaster mitigation.
The Department of Soil Conservation and Watershed Management (DSCWM) withinthe Ministry of Forest and Soil Conservation (MFSC) is also involved in disastermitigation. Its main objective is ‘to maintain the ecological balance by conserving theimportant watershed areas by reducing the incidence of natural disaster such as soilerosion, landslides and floods.’15 The DSCWM has a mandate to help people managewatershed resources and meet their basic needs for forest and food products throughenhancing land and agricultural productivity. The programme’s aim is to integrateforestry, agriculture, livestock, water, and land use practices in its effort to helpcommunities conserve and manage land and water. Its policy of forming user groupsaccords importance to mobilizing local communities and raising their level ofawareness about the need to implement conservation measures. Since its inception in
14 http://www.undp.org.np/pdf/NSDRMFinalDraft.pdf15 For discussions about the mandate of this department, see HMG (1991).
281
Movin
g fro
m Po
licy t
o Pra
ctice
: Role
of Co
st-Be
nefit
Analy
sis in
Proa
ctive
Disa
ster R
isk Re
ducti
on
1974, the Department has implemented many water conservation projects. Theircontribution to flood mitigation, however, has not been examined.
The Ministry of Local Development (MLD) is responsible for formulating strategiesregarding local development and for assisting in the institutional development oflocal governments. The MLD coordinates with the Rural Community InfrastructureWorks (RCIW) Programme, which provides technical, financial, and material supportto selected communities in twenty districts to build small-scale infrastructure. TheMLD does not directly implement disaster mitigation activities but development localgovernments in infrastructure provisions, including river training activities.
Activities related to water issues are of the Ministry of Water Resources. At theoperational level, it is mandated as the agency for carrying out planning and policy-making and projects related to the country’s water resources strategies. Twodepartments under its aegis are concerned with mitigating flood disaster: theDepartment of Irrigation (DoI) and the Department of Water-Induced DisasterPrevention (DWIDP).
Department of Irrigation (DoI): Nepal’s DoI celebrated its fiftieth anniversary in2003. The Department consists of five divisions, six central-level project offices, fiveregional directorates and 75 district-level offices. The DoI’s five major divisions arethe Planning, Design, Monitoring and Evaluation Division; the Surface WaterIrrigation Division; the Groundwater Irrigation Division; the Irrigation ManagementDivision; and the Flood Control, Environmental and Mechanical Division (FEMD).The DoI manages its river training activities through the last. The organization hastwo types of river training projects: national-level ones handled by the FEMD andlocal-level projects that district irrigation offices handle.16 The River Training Divisionof DOI undertakes flood control works such as the construction of small embankmentsand riverbank protection using gabion the mattress.
The DoI implements local-level flood mitigation activities through the District RiverTraining Coordination Committee (DRTCC). This committee used to be headed bythe District Development Committee (DDC) chairman, and its members includerepresentatives of major political parties as well as district-level representatives of theMinistry of Local Development (local development officer), and the Ministry of Home(chief district officer). The director-general of the DoI serves as a member-secretary ofthe DRTCC. Under this arrangement, local communities are expected to submit theirrequests to the DRTCC, which then considers supporting them, so that the DoI’sresources can be linked to local demands and activities suitably prioritized.Establishing such a link is essential because one feature of the monsoon season islobbying for implementing river training works: delegations from many flood-affectedvillages lobby government agencies before the onset of the monsoon, asking to haveriver control activities implemented in their locality. In response, district irrigationoffices (DIOs) survey stretches of river proposing rudimentary river training works
16 As of 1998, the Department of Irrigation had executed six river training projects: a) Rajapur Irrigation Project, b) East Rapti IrrigationProject, c) Bagmati River Training Project, d) Banganga, e) Extension of Right Embankment along Lalbakeya and f) Bakra Flood ProtectionProject. They all involved construction activities. See JICA (1999) for details.
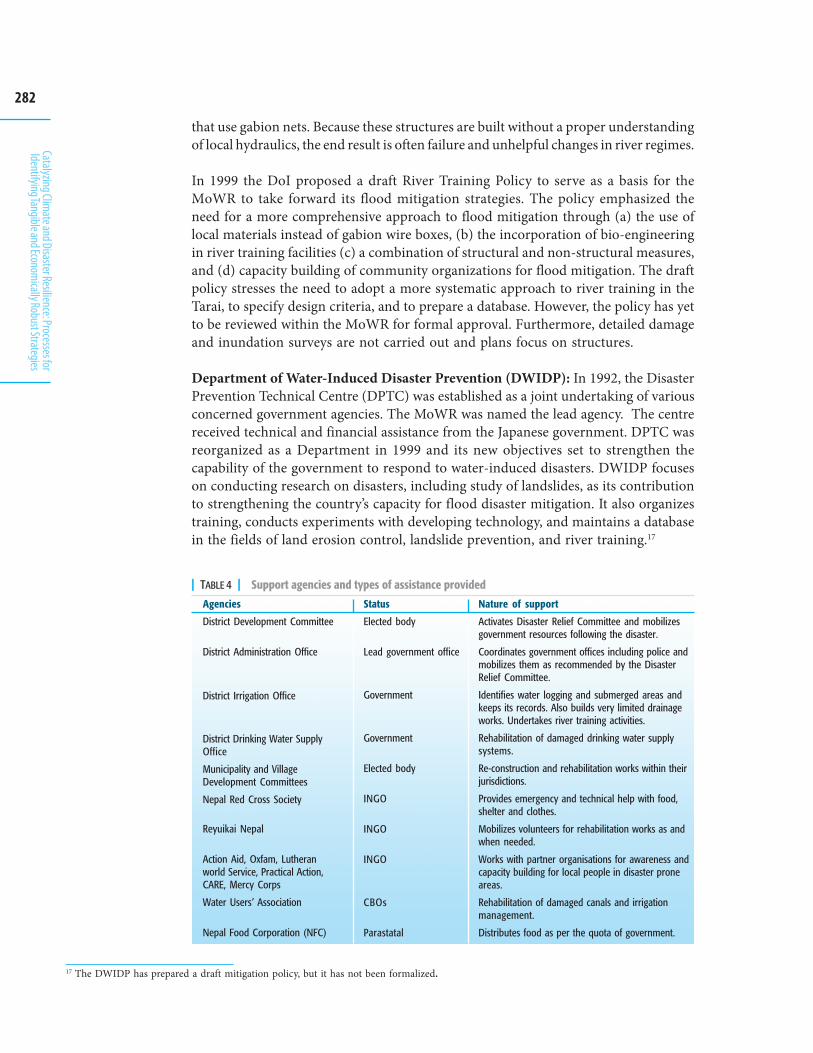
282
Catalyzing Climate and Disaster Resilience: Processes for
Identifying Tangible and Economically Robust Strategies
that use gabion nets. Because these structures are built without a proper understandingof local hydraulics, the end result is often failure and unhelpful changes in river regimes.
In 1999 the DoI proposed a draft River Training Policy to serve as a basis for theMoWR to take forward its flood mitigation strategies. The policy emphasized theneed for a more comprehensive approach to flood mitigation through (a) the use oflocal materials instead of gabion wire boxes, (b) the incorporation of bio-engineeringin river training facilities (c) a combination of structural and non-structural measures,and (d) capacity building of community organizations for flood mitigation. The draftpolicy stresses the need to adopt a more systematic approach to river training in theTarai, to specify design criteria, and to prepare a database. However, the policy has yetto be reviewed within the MoWR for formal approval. Furthermore, detailed damageand inundation surveys are not carried out and plans focus on structures.
Department of Water-Induced Disaster Prevention (DWIDP): In 1992, the DisasterPrevention Technical Centre (DPTC) was established as a joint undertaking of variousconcerned government agencies. The MoWR was named the lead agency. The centrereceived technical and financial assistance from the Japanese government. DPTC wasreorganized as a Department in 1999 and its new objectives set to strengthen thecapability of the government to respond to water-induced disasters. DWIDP focuseson conducting research on disasters, including study of landslides, as its contributionto strengthening the country’s capacity for flood disaster mitigation. It also organizestraining, conducts experiments with developing technology, and maintains a databasein the fields of land erosion control, landslide prevention, and river training.17
Agencies
District Development Committee
District Administration Office
District Irrigation Office
District Drinking Water SupplyOffice
Municipality and VillageDevelopment Committees
Nepal Red Cross Society
Reyuikai Nepal
Action Aid, Oxfam, Lutheranworld Service, Practical Action,CARE, Mercy Corps
Water Users’ Association
Nepal Food Corporation (NFC)
Status
Elected body
Lead government office
Government
Government
Elected body
INGO
INGO
INGO
CBOs
Parastatal
Nature of support
Activates Disaster Relief Committee and mobilizesgovernment resources following the disaster.
Coordinates government offices including police andmobilizes them as recommended by the DisasterRelief Committee.
Identifies water logging and submerged areas andkeeps its records. Also builds very limited drainageworks. Undertakes river training activities.
Rehabilitation of damaged drinking water supplysystems.
Re-construction and rehabilitation works within theirjurisdictions.
Provides emergency and technical help with food,shelter and clothes.
Mobilizes volunteers for rehabilitation works as andwhen needed.
Works with partner organisations for awareness andcapacity building for local people in disaster proneareas.
Rehabilitation of damaged canals and irrigationmanagement.
Distributes food as per the quota of government.
| TABLE 4 | Support agencies and types of assistance provided
17 The DWIDP has prepared a draft mitigation policy, but it has not been formalized.
283
Movin
g fro
m Po
licy t
o Pra
ctice
: Role
of Co
st-Be
nefit
Analy
sis in
Proa
ctive
Disa
ster R
isk Re
ducti
on
Local Level InstitutionsIn the past the State’s interests were expressed, realized and maintained throughstatutory decrees, most of which provided for the utilization of land resources as themain source of revenue.18 Embedded within this practice was the culture of “rentseeking,” wherein the state used its authority to maintain order by creating scarcityand continued to enhance its patronage-dispensing function. Its approach todecentralization and popular participation was bureaucratic. It perpetuated feudalpractices rather than fostering elements of good governance, a democratized society,decentralized economic (and consequently political) power, and uplifting theproductive features of society. The 1991 Constitution, while it provided a frameworkfor democratic governance at the macro level, was silent about many aspects of localgovernance and the devolution of political power (HDR, 1998). Following the principlesset forth in that Constitution, the parliament passed the Local Self-Governance Act of2055 (1999), which devolves power to local bodies so that they can mobilize local resourcesfor development.19 This act authorized DDCs, VDCs and municipalities to plan, makepolicies concerning, and implement local-level projects and programmes20 and madethem responsible for coordinating development activities in their own jurisdictions.
Despite this provision, many district offices still function as extensions of centralministries and departments, which implement activities mostly through project offices.Externally funded projects are handled directly by donors or by central governmentagencies. The various organizations at the district level have no effective mechanismto come together, discuss issues, share experiences and provide each other the assistanceand co-operation needed for implementation of flood disaster management. Asindicated by MLD’s experiences in small-scale infrastructure development, localinstitutions can play a significant role in facilitating community mobilization and incoordinating different organizations operating within their jurisdiction. Water userassociations, community based organizations, INGO and NGOs are other types oforganizations involved at the local level.
18 Before the unification of Nepal, all land belonged to the state, and farmers had to pay one half of the produce they grew to the government.After the rise of Gorkha, land was distributed as jagir and birta to maintain the army and revenue offices. After the advent of the Ranas, thedistribution of land to private individuals became commonplace. By 1950 about one third of the total forest and cultivated land was underbirta tenure, and of that, 75% belonged to members of the Rana family. Land is still in the hands of those who control the state and itsbureaucracy. Since 1950, it has been this group which exercises control over resources made available through foreign aid.
19 The 1990 Constitution of the Kingdom of Nepal included directive principles of the State in Article 25. Clause 4 states that it shall be the mainresponsibility of the State to maintain conditions suitable for enjoying the fruits of democracy through the wider participation of the peoplein the country’s governance and decentralization. But the Constitution did not include provisions for decentralization; for this, the LocalSelf-Governance Act was promulgated only in 2055 BS. According to this act, the government shall pursue the following principles andpolicies for the development of a system of local self-governance.a) Devolution of such powers, responsibilities, and means and resources as are required to make local bodies capable and efficient in local
self-governance;b) Building and development of institutional mechanisms and functional structures in local bodies capable of considering local people and
bearing responsibilities;c) Devolution of powers to collect and mobilize such means and resources as are required to discharge the functions, duties, responsibility
and accountability conferred on local bodies;d) Having local bodies oriented towards establishing a civil society based on democratic process, transparent practice, public
accountability, and people’s participation, in carrying out the functions devolved on them;e) For the purpose of developing local leadership, arrangement of effective mechanisms for making local bodies accountable to the people
in their own area; andf) Encouraging the private sector to participate in local self-governance in the task of providing basic services for sustainable development.
20 There are 75 districts, 3,912 villages and 58 municipalities. Elected representatives, who form development committees at each level, namely,district development committees (DCCs), village development committees (VDC), and municipalities, head these units.
284
Catalyzing Climate and Disaster Resilience: Processes for
Identifying Tangible and Economically Robust Strategies
Civil Society GroupsIn this milieu the experience of citizens and citizen groups in collective civic and politicalactions has been limited. Consequently, Nepali society’s response to mitigatinghardships caused by natural hazards was and still is limited to kinship arrangements;informal institutions provide immediate relief in the aftermath of a disaster.21 Theengagement of non-state actors such as NGOs did not flourish in the aftermath of the1951 political change. In fact, the Panchayat system of the 1960s focused oncentralization though decentralization was one of its tenets. A limited number ofsocial service organizations began functioning, but individuals close to the rulingestablishment headed them.22 A few citizen organizations played the role of civildissent but these groups were perceived to be a political threat to the Panchayat polity.23
Most NGOs are involved in the fields of education, health, income generation and skilldevelopment, and help provide drinking water and sanitation, promote agriculture,and uplift children and disabled persons (Hossain, 1998). Though local NGOs did notwork in disaster mitigation, international non-governmental organizations such asthe Red Cross Society, Oxfam, Action Aid and the Lutheran World Service did. Initially,these agencies focused on relief and rehabilitation because of the immediate needs inthe aftermath of a natural hazard. They have now recognized that their focus needs toshift to events between disasters rather than to the events after a disaster. Thisrecognition is reflected in the fact that Oxfam was one of the members of the regionalinitiative Duryog Nivaran that began in 1994 as a network of individuals andorganizations in Bangladesh, Nepal, India, Pakistan, and Sri Lanka which focus onresearch on and the dissemination and advocacy of disaster-related themes promotingan alternative perspective on disasters and vulnerability.24
At present, a few indigenous NGOs work in the field of disaster mitigation in Nepal.Agencies such as Oxfam, Practical Action and ActionAid have begun emphasizing theimportance of understanding linkages between societal vulnerability and naturalhazards.25 In 1995, Oxfam began supporting NGOs based in the Nepal Tarai to beginworking at the interface between vulnerability and natural hazards. This supportcoincided with the inception of its River Basin Programme that aims at flood disastermitigation. In 2001, the Disaster Preparedness Network (DPNet), a network oforganizations involved in community based disaster relief was formed.26 The member
21 One characteristic of Nepalis is a sense of voluntarism in providing support to people affected by natural disasters. Manandhar (1985)recounts two instances of voluntary action by local groups who responded to communities affected by landslides in Hyumat, Kathmandu,and by a fire in a village in Gorkha. Other institutional arrangements include guthis. While humanitarian support is crucial in the immediateaftermath of a hazardous event, long-term support needs to be based on organized institutional input.
22 Some INGOs, like the T. B. Eradication Association, Rotary Club, Nepal Family Planning Association, Nepal Red Cross Society and NepalChildren Association began working in Nepal during the panchayat years (Hossain, 1998). For a detailed and critical discussion of the roleand responsibilities of NGOs, see Bhattachan et al. (2001)
23 The proceedings of the seminar in 1983 provide interesting insight into this particular line of thinking. Banskota (1983) suggested that ‘localnon-governmental bodies and organizations are major alternative…. They will not only help the panchayat to get more done, but will helpthem to function more effectively in other activities like identifying needs, planning and managing other local affairs.’ His paper seemed tohint that NGOs could serve as catalysts and social auditors. But in the discussion session following the presentation, among the manyquestions raised was, “Are the NGOs, however, envisaged as a countervailing force to the panchayat bodies?’ See floor discussion, pp. 92,Foreign Aid and Development in Nepal, Proceeding of a Seminar October 4-5, 1983, Integrated Development System, Kathmandu.
24 The five themes are: understanding linkages with society, myths of science and technology, accountability, regional co-operation, andunderstanding vulnerability and capacity (Duryog Nivaran, 1995). The National Society for Earthquake Technology (NSET) has beenengaged in earthquake disaster mitigation since 1997. It produces scenarios, helps retrofit schools, and increase public awareness aboutsafety during earthquakes.
285
Movin
g fro
m Po
licy t
o Pra
ctice
: Role
of Co
st-Be
nefit
Analy
sis in
Proa
ctive
Disa
ster R
isk Re
ducti
on
organizations of the network attempt to address the causes of vulnerability and cometo a better understanding of natural hazards and preparedness.
Multi Lateral and Bilateral AgenciesThe 1951 political change in Nepal marked a change in the function of the centralizedauthority. Though the decades of 1950 and 1960 were marked by uncertainty in internalpolitics, the period did see the emergence of the institution of foreign aid in a worldpolarized between two ideological camps led on one side by the United States and onthe other by the former Soviet Union. The government of Nepal worked in cooperationwith the institution of foreign aid to dole out development projects—a task necessaryto neutralize the political dissatisfaction stemming from the aftermath of the 1960coup, to buy loyalties and to gain political mileage. The result was the usurping of thecustomary land and water management practices of Nepali villages on the one handand the erosion of the state as an institutional resource on the other. The influence ofdonors increased over time.
Many donor agencies are involved in disaster mitigation within sectoral developmentprogrammes. The UNDP, for instance, co-ordinated distribution of international reliefto victims in the aftermath of 1993 floods. More precisely it is the UN DisasterManagement Secretariat (UNDMS) located within the UNDP country office that assistsin coordinating the international response to disasters, including floods. Duringemergencies, the UNDMS acts as an information clearing house, receiving anddisseminating situation reports, needs assessments, donor pledges, and other pertinentinformation, to facilitate the coordination of emergency operations by differentgovernment agencies and donors. The Japanese government has provided support tothe DWIDP. In addition, the Office of Foreign Disaster Relief (OFDA), under the aegisof USAID, has provided support for some disaster mitigation activities since 1999.
Building ResilienceThe earliest state organized response to flood disaster mitigation in Nepal was in1954, when families affected by landslides and floods in the mid-hills were encouragedto resettle in the Chitwan valley. The same year, the Chitwan Valley DevelopmentBoard was created to establish an institutional basis for resettling the affected families.This response was the outcome of several factors, not simply the occurrence oflandslides and floods in 1954. The government had already identified the valley asideal for major land reclamation and development efforts. In 1953, one year before thelandslides, USAID had planned to conduct aerial, topographical, and soil surveys ofthe Rapti Valley (Skerry et al., 1991). The 1954 initiative fitted well into this plan.
The three decades from 1950 to 1980 were marked by the absence of an organizedresponse to mitigating disasters, including those caused by landslides and floods. Asearly as 1954, academic and journalistic writings recognized landslides and floods asa major problem for Nepal. Gurung (1993) cites an expatriate forester working inDepartment of Forest who wrote that sediment-laden rivers washed away the basis oflife-soil in Nepal. According to Khanal (1991), from 1955 to 1981, the national
25 Duryog Nivaran (1995) Ibid.26 DPNET receives support from agencies such as Action Aid, Care Nepal, Caritas, Japan Medical Association and Oxfam.
286
Catalyzing Climate and Disaster Resilience: Processes for
Identifying Tangible and Economically Robust Strategies
vernacular newspaper Gorakhpatra reported that 156 landslides had result in the lossof property and human lives.27 Although this 30 year period coincided with six of thegovernment’s national plans, none contained any programme to mitigate flooddisasters. Instead, a committee for disaster mitigation was constituted after each event,treating disasters on a case-by-case basis.28 The DoI did implement river trainingworks in response to mitigating flood, but these efforts involved the building of riverstructures like spurs and embankments and made little attempt to mitigate flooddisasters. It was not until the Ninth Plan that disaster relief was incorporated andcountry’s first disaster-related act was promulgated only in 1982.
The period from the early 1970s to early 1980s also coincided with the emergence andconsolidation of the theory of Himalayan environmental degradation, which suggestedthat upland deforestation was the reason behind lowland flooding. During this periodthe government focused on mitigating the harmful impacts of erosion by implementingwatershed conservation projects. The first effort in this respect began in 1968, when,with support from UNDP and FAO, the government began the pilot-scale TorrentControl Project in Trishuli watershed in central Nepal.29 Six years later, in 1974, thegovernment established the Department of Soil Conservation with the objective ofminimizing the degradation of watersheds. Although the department focused onminimizing the impacts of landslides and floods, disaster mitigation did not figureinto its responses. Furthermore, its efforts were biased towards the building of checkdams for controlling hill torrents.30
In the 1980s the social and economical challenges that Nepal was facing began toreceive greater academic attention. Blaikie et al’s Nepal in Crisis published in 1980highlighted this crisis. The book implicitly referred to disasters thus: “There arefrequent famines and the processes of erosion and ecological decline, coupled withcontinuing population growth will contribute to an increase in apparently ‘natural’disaster in the future.” Two years later, in 1982, the Natural Calamity and Relief Actwas promulgated in order for the government to be more organized in its efforts tomitigate the impacts of disasters. Though it is difficult to pinpoint the exact reason forits promulgation, it seems clear that several events including the earthquake of 1980led to its formulation.
In the years immediately preceding the passage of the National Calamity and ReliefAct Nepal had faced a number of disasters. In 1980, there was a major earthquake inBajhang in the Far-West. One year later in 1981, south Kathmandu faced a cloudburstthat devastated the Lele Valley, and floods washed over Dauretol Butwal. Thoughmany communities all over the country were hit by disasters, the response of the statewas at best ad hoc and sporadic. An indication of how the government in Kathmanduresponded to disasters in far away parts of the country is captured in geographerHarka Gurung’s account in Vignettes of Nepal published in 1980. Gurung reminisces
27 Karmachrya (1989) found that from 1970 to 1990 an average of 78 landslides occurred annually in the Central and Western developmentregions
28 According to Russel et al. (1991) ‘no information is available on how much has been spent on disaster mitigation. No single authority isresponsible for monitoring disaster mitigation activities.’
29 See Toutscher O. G. (1970) Erosion Control Surveys and Demonstration for the Management and Development of Trishuli Watershed,Project Report No 13, HMG/UBDP/FAO
30 An indication of this focus is reflected in a paper by Toutscher (1979) that deals mainly with the science of dealing with the design of torrentcontrol measures.
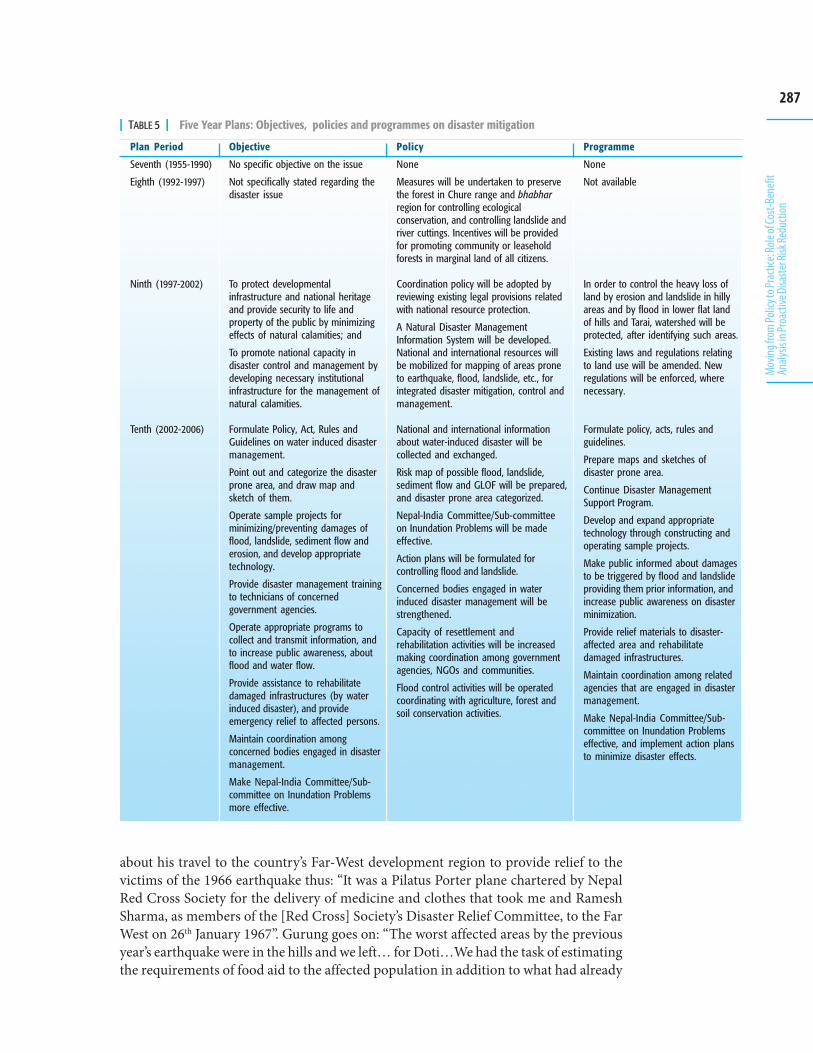
287
Movin
g fro
m Po
licy t
o Pra
ctice
: Role
of Co
st-Be
nefit
Analy
sis in
Proa
ctive
Disa
ster R
isk Re
ducti
on
about his travel to the country’s Far-West development region to provide relief to thevictims of the 1966 earthquake thus: “It was a Pilatus Porter plane chartered by NepalRed Cross Society for the delivery of medicine and clothes that took me and RameshSharma, as members of the [Red Cross] Society’s Disaster Relief Committee, to the FarWest on 26th January 1967”. Gurung goes on: “The worst affected areas by the previousyear’s earthquake were in the hills and we left… for Doti…We had the task of estimatingthe requirements of food aid to the affected population in addition to what had already
Plan Period
Seventh (1955-1990)
Eighth (1992-1997)
Ninth (1997-2002)
Tenth (2002-2006)
Objective
No specific objective on the issue
Not specifically stated regarding thedisaster issue
To protect developmentalinfrastructure and national heritageand provide security to life andproperty of the public by minimizingeffects of natural calamities; and
To promote national capacity indisaster control and management bydeveloping necessary institutionalinfrastructure for the management ofnatural calamities.
Formulate Policy, Act, Rules andGuidelines on water induced disastermanagement.
Point out and categorize the disasterprone area, and draw map andsketch of them.
Operate sample projects forminimizing/preventing damages offlood, landslide, sediment flow anderosion, and develop appropriatetechnology.
Provide disaster management trainingto technicians of concernedgovernment agencies.
Operate appropriate programs tocollect and transmit information, andto increase public awareness, aboutflood and water flow.
Provide assistance to rehabilitatedamaged infrastructures (by waterinduced disaster), and provideemergency relief to affected persons.
Maintain coordination amongconcerned bodies engaged in disastermanagement.
Make Nepal-India Committee/Sub-committee on Inundation Problemsmore effective.
Policy
None
Measures will be undertaken to preservethe forest in Chure range and bhabharregion for controlling ecologicalconservation, and controlling landslide andriver cuttings. Incentives will be providedfor promoting community or leaseholdforests in marginal land of all citizens.
Coordination policy will be adopted byreviewing existing legal provisions relatedwith national resource protection.
A Natural Disaster ManagementInformation System will be developed.National and international resources willbe mobilized for mapping of areas proneto earthquake, flood, landslide, etc., forintegrated disaster mitigation, control andmanagement.
National and international informationabout water-induced disaster will becollected and exchanged.
Risk map of possible flood, landslide,sediment flow and GLOF will be prepared,and disaster prone area categorized.
Nepal-India Committee/Sub-committeeon Inundation Problems will be madeeffective.
Action plans will be formulated forcontrolling flood and landslide.
Concerned bodies engaged in waterinduced disaster management will bestrengthened.
Capacity of resettlement andrehabilitation activities will be increasedmaking coordination among governmentagencies, NGOs and communities.
Flood control activities will be operatedcoordinating with agriculture, forest andsoil conservation activities.
Programme
None
Not available
In order to control the heavy loss ofland by erosion and landslide in hillyareas and by flood in lower flat landof hills and Tarai, watershed will beprotected, after identifying such areas.
Existing laws and regulations relatingto land use will be amended. Newregulations will be enforced, wherenecessary.
Formulate policy, acts, rules andguidelines.
Prepare maps and sketches ofdisaster prone area.
Continue Disaster ManagementSupport Program.
Develop and expand appropriatetechnology through constructing andoperating sample projects.
Make public informed about damagesto be triggered by flood and landslideproviding them prior information, andincrease public awareness on disasterminimization.
Provide relief materials to disaster-affected area and rehabilitatedamaged infrastructures.
Maintain coordination among relatedagencies that are engaged in disastermanagement.
Make Nepal-India Committee/Sub-committee on Inundation Problemseffective, and implement action plansto minimize disaster effects.
| TABLE 5 | Five Year Plans: Objectives, policies and programmes on disaster mitigation
288
Catalyzing Climate and Disaster Resilience: Processes for
Identifying Tangible and Economically Robust Strategies
been airdropped the previous autumn”. This, the first visit of the Red Cross, took placea full year after the disaster.
Typically, the support in 1967 was relief based, and the practice had not changed 13years later when a major earthquake hit the region again in 1980. According toManandhar (1985), “the first cartel of help in the form of food, clothing, and tents hadarrived with the help of the Red Cross. The local officials and the politicians were giventhe responsibility of these materials. While relief itself was received with support ofthe Society, the challenge was more with distribution of the materials to the needy.”Manandhar continues: “Favouritism was perhaps unavoidable and those who sidedwith the local politicians received the gift handsomely than others.… The poor, ofcourse, almost always got the worst deal.” Citing a local resident, the author notes,“We found some blankets, received as a form of relief for the victims, being sold acrossthe border in India.” The relief was used to solicit political and other types of support.This practice continues. It could be hypothesized that news of the embezzling of reliefmaterials did reach the corridors of powers in the capital, thereby creating incentivesto make more organized arrangements for distributing relief. The 1982 Act mentionsboth disaster relief and disaster preparedness and provided for the establishment ofthe Central Disaster Relief Committee under the Home Ministry. It was amendedthree times, in 1986, 1989 and in 1992. The amended version covers the preparednessand rehabilitation aspects of disaster management and broadens its scope to includeall disasters, including industrial accidents. The Act has envisaged an organizationalhierarchy for dealing with natural disasters: a central level committee consisting ofthe Home Minister, Defence Minister, Supplies Minister, Finance Minister, thesecretaries of these ministries, representatives from the army, NGOs, andrepresentatives from affected districts. The hierarchy of committees included a regionalcommittee, a district committee, and an ilaka-level committee. In its vision, dependingupon where a disaster occurs, committees at appropriate levels are activated. The Actcan be operationalized before or during a calamity to prevent or mitigate its effect orto provide relief and rehabilitation after a disaster occurs. A special disaster unit wascreated to function as the committee’s secretariat and long-term plans for disastermitigation were prepared. At the same time, a Natural Calamities Assistance Fundwas established under the chairmanship of the Home Minister.
A major earthquake that struck Nepal in the mid-1980s underscored the need for acomprehensive disaster mitigation policy. In 1988 the heads of state and governmentsof the SAARC countries at their meeting in Islamabad decided to undertake two studies,‘The Causes and Consequences of Natural Disaster’ and ‘The Protection andPreservation of the Environment’. As a part of this study, Nepal’s national report waspublished in 1990. Two years later, in 1992, Nepal’s revised Relief Act was amendedagain. Following the United Nation’s declaration of the International Decade forNatural Disaster Reduction (IDNDR) in 1994, Nepal established a national committeefor the IDNDR under the convenership of the Home Minister. Subsequently, a nationalaction plan for disaster mitigation was formulated but the lack of consistent co-ordination in its implementation suggested that it had serious teething troubles.
A year later, in 1995, the plan was modified. The following year, the governmentapproved it, naming it the ‘National Action Plan on Disaster Management in Nepal’.
289
Movin
g fro
m Po
licy t
o Pra
ctice
: Role
of Co
st-Be
nefit
Analy
sis in
Proa
ctive
Disa
ster R
isk Re
ducti
on
The plan actually comprised four plans: a disaster preparedness action plan, a disasterresponse plan, a disaster reconstruction and rehabilitation plan, and a disastermitigation plan (Rana, 1996). Each prioritized activities, delineated responsibilities,and stipulated time frames for monitoring and evaluation. Overall, the action planspecified (a) priority activities to be undertaken in the field of disaster management(including flood mitigation), (b) responsible agencies, and (c) time periods forcompletion.
In theory, Nepal has laws, policies, and departments to respond to floods and theirimpact, although its approach is the dominant, reactive one, executed only after anevent has occurred. There are two strands of response to flood disaster mitigation: theprovision of relief and water resource development and management. By and largeboth occur within the rubric of political governance and public policy formulation.Responses to flood disaster mitigation are top-down, bureaucratic and ad hoc.Conventional approaches have failed to deliver: because they fail to acknowledgedifferences in social, economic, administrative, cultural, legal, and technologicalenvironments. Until the Ninth Plan (1997-2002), the government was silent on flooddisaster mitigation, as Table 5 shows.
There is a discrepancy between the stated and actual roles of departments and betweenthe promised and provided support that victims receive in the aftermath of a flood. Ata fundamental level, these responses conceive of relationships among social, economic,administrative, cultural, legal, and technological environments in a linear andmechanistic sense, though in reality interactions among knowledge, resource basesand social organizations are equally important because the context itself is changedby their interactions. Recognizing these dynamics leads to a broader understandingof institutions as distinct from organizations.31 Institutions, in contrast toorganizations, demonstrate a pattern of values and behaviour within a socio-systemand their functioning is sustained over a period of time. In other words, humaninstitutions and physical components interact and influence each other throughfeedback loops over time.32
Conceiving of institutions in a broad sense results in a better understanding of thesocial dynamics that underlie responses to mitigating flood disasters. This is becauseinstitutions increase of benefits communities and families affected by floods by buildingon internal societal reliance and by negotiating with external support organizationsor the market. The success of communities also depends on how they collectivelyexercise civil power, and that, in turn, depends on their access to information,knowledge, and, above all, the availability of alternative courses of actions. Access toinformation or knowledge is crucial, but much work is needed to transform informationinto usable forms of knowledge and to make it available to communities.
The combined result of the processes described above is that responses to floodinghave not been effective. Flood-affected families, especially the poor, are left to fend forthemselves in the aftermath of floods. At the same time, the failure of governance has
31 This approach to institutional study acknowledges the interrelationship among knowledge, values, social organization, technology and thenatural resource base. For detailed discussions see Gyawali, et al. (1993)
32 Pelling (2003) refers to the concept of co-evolution by Norgard (1994) while discussing paradigms of risk in natural disaster discourse.
290
Catalyzing Climate and Disaster Resilience: Processes for
Identifying Tangible and Economically Robust Strategies
further exacerbated vulnerability. The response of state agencies to the 1998 disasterwas predictable: it was a one time, relief-based response. The ongoing political crisisin Nepal has made the challenges of flood disaster mitigation even more daunting.Responses need to bring synergy between the macro and the micro. Flood disastermitigation efforts must be anchored on the processes of empowering rural poor tomove beyond poverty. In this effort, the issues to consider are (a) a blend of politicaldevolution and actions for ensuring that there will be participatory decision-makingabout flood disaster mitigation measures; b) a mechanism for delivering services topoor families to enable them to access and rebuild household assets after a flood; (c)initiatives for natural resource management; and (d) the development of linkages withsocial auditors and catalysts who can facilitate and empower a community, buildingits capacity to demand services from state agencies and negotiate with the market toits advantage.
The devolution of responsibility for the management of common property resourcesto local levels is a key component of this process. Local participation must be fosteredso that the social capital created, particularly among poor families, is linked to thedynamic sectors of the economy. Participation needs to create space for the poor toexpress themselves, and the devolution of decision-making authority to give them thepower to determine ways to improve their lives. Empowering the poor is the foundationof rural poverty alleviation and, by extension, of overcoming the ills of flood disastersin a meaningful way. By engaging with civil society institutions, communities canaccess information that will be crucial to help them build their assets in the long-term.
Decentralization may reduce poverty where there is a reasonable level of concurrencebetween local leaders and their community as a whole in setting goals to raise incomesand build assets. These initiatives can be effective if social auditors actively questionthe role of the market and the approaches of state agencies. In the absence ofcontestation, however, the ability of poor rural families to overcome hardships islimited because the bureaucratic exigencies of state agencies hinder responsivemitigation. The dominant approach to flood disaster mitigation has serious problemswith accountability. And unless the state introduces favourable policy measures, marketinstitutions will have a very limited role in disaster mitigation.
Institutional innovations are prerequisites to helping the poor; but introducing ashift in approach is a daunting task. One challenge comes from the fact that the non-poor may monopolize institutions designed to meet the needs of the poor and influencethe policies of the state of the market and even of NGOs to their benefit, at the cost ofthe poor. Often, those who control one institution also control others. For instance,even after land redistribution, large landholding farmers may continue to enjoy betteraccess than the ex-landless not only to land but also to production, credit facilities,information and marketing networks, and because their livelihoods are more developedthey have more insurance against disaster risks.33 The central question is how thepoor and the weak can benefit from institutional processes in the first place and sustainthose benefits in the long-term.
33 See IFAD (2000)
291
Movin
g fro
m Po
licy t
o Pra
ctice
: Role
of Co
st-Be
nefit
Analy
sis in
Proa
ctive
Disa
ster R
isk Re
ducti
on
This question is a part of a long-term problem: even when decentralization and localgovernance structures do exist, political exigencies threaten to dismantle them andleave political voids. The dissolution of Nepal’s elected local bodies (DDCs, VDCsand municipalities) has had serious political as well as procedural ramifications forresource management approaches, including flood disaster mitigation. On May 22,2002, the government of Sher Bahadur Deuba dissolved both district and local-levelgovernments because their terms had expired. The dissolution of elected local bodieswas one of several quagmires Nepal faced at the time: a constitutional crisis, nopossibility of immediate elections to the national parliament and the ongoinginsurgency of the Maoists. In the absence of elected local bodies, even the relativelystraightforward distribution of relief was seriously hampered during the floods of the2002 monsoon.34
In 2003, the government of Prime Minister Surya Bahadur Thapa nominated mayors,chairpersons of DDC and other officials. Though it brought politicians in the place ofbureaucrats to manage local bodies, these representations lacked the democraticlegitimacy elections provide,35 the process reflects deep challenges for institutionalizingrepresentative local democracy in the country. Unlike the central government, whichfaced major dysfunctions in the decade following the restoration of democracy in1990, local-level institutions had seen two cycles of elections and seemed, until theywere dissolved, to have acquired some stability. Though the term of the local bodiesexpired in 2002, a provision to extend their tenure by one year did exist, but it was notused. Whatever the outcome of the impasse, Nepal must make provisions for devolvingpolitical and administrative powers to local institutions if governance is to beaccountable and representative.
Decentralization can make access to information easier, and turn the institution moresuitable to the local context and more sensitive to the needs of the community. As aresult, decision-making comes closer to local communities. Unfortunately, informationis very context specific.
In an ideal situation, as decentralized institutions become attuned to local needs, theybecome more transparent and accountable. In actual practice, however, the thingsplay out very differently: the outcome of decentralization depends upon its context.Before 1990, for example, during the Panchayat Period, decentralization becamesynonymous with administrative de-concentration, a process that saw a several-foldexpansion of the central bureaucracy rather than devolution of political power.36
Massive amounts of external funds were channelled through DDCs and VDCs, butthe majority of such interventions did not deliver, and their sustainability wasfundamentally in question. Politically, the Constitution of 1990 is silent on the criticaldomains of the devolution of power and local self-governance. As a result, localgovernment bodies such as DDCs and VDCs existed as extensions of the central
34 In the monsoon of 2002, many hill districts of Nepal faced disaster due to cloudburst. The print media reported shortcomings in theprovision of support to the victims beyond a one-time relief package See NWCF (2003) for a compilation of news reports about the reliefprovided.
35 The Ambassador of the Federal Republic of Germany to Nepal in a public speech said that in the absence of elected representatives, foreignaid could not be utilized. He added that nominated members are not true representatives of the people ‘Prajatantrik Soonyata ma sahayog koauchitya chhaina” See Kantipur Daily November, 22, 2003.
36 See Martinussen (1993) and Blaikie et al. (1980) for discussions on the growth of bureaucracy in Nepal in the post 1950 period.
292
Catalyzing Climate and Disaster Resilience: Processes for
Identifying Tangible and Economically Robust Strategies
administration rather than as autonomous institutions of local self-governmentaccountable to the electorate (HRD, 1998).
Nepal’s Local Self-Governance Act (LSGA) promulgated in 1999 did include adiscussion of local responsibilities, but is lack of political institutionalization, becausecontinuity has been broken, the question of how to institutionalize local bodiesquestion is particularly stark in the aftermath of the dissolution of the localgovernments.37 Despite the break in the electoral process, there are ongoing initiativesin managing forests, irrigation systems, community-level micro hydro plants, drinkingwater supply systems and, more recently, electricity distribution that bring to the forecertain aspects of substantive democracy. In a theoretical sense, these initiatives providea basis for pursuing community based flood disaster mitigation.
The involvement of flood-affected people, particularly the poor and marginalized, inlocal decision-making can make a difference in the distributional outcomes of floodmitigation activities within a village. Perhaps even the otherwise double-edged sword,relief, can become more humane and more effective, as arrangements for preparednessagainst floods can become responsive to local needs. While decentralization doeshave many benefits, local bodies will not necessarily be more accountable to the poorthan centralized ones because the relationship between a local-level government andthe community is a difficult one.38 If centralized agencies are removed from the poor,decentralized organizations face the risk of being taken over by local elites unlesssafeguards are introduced. Independent social auditors can serve as vanguards, hencethe emphasis that they contest the policy terrain and help mediate a balance of powerin society.
While conceiving of institutional measures to mitigate flood disasters, it is necessaryto examine interactions among governments, social auditors and markets as well astheir proposals for interventions. The key questions are whether the suggestedarrangements for mitigation reach, benefit and empower the poor and the affectedcommunities, and, in the process, enhance their capacity to benefit from macro-levelpolicies and whether participation in local institutions enables local communities toincrease their general wellbeing and acquire the capacity to negotiate with externalactors, whether they be NGOs, departments of state or the market. The role of suchinter-linkages has not been investigated systematically or woven into approaches toflood disaster mitigation. Doing so is the new challenge.
37 The government headed by Surya Bahadur Thapa in 2003 began nominating past elected representatives to the posts of mayor and districtgovernment chair. Though nominating political figures may have circumvented the void in local governance, it reflects a deep crisis facingNepal’s body politics as elected representation is non-existent.
38 The following arguments by Iyer (2003) encapsulate this difficulty: “In a parliamentary democracy people elect their representative to locallevel bodies, legislative assemblies, and parliament and their interest can be presumed to be taken care by these representatives. In this case,there is no question of any conflict between the state and the people, and there would be no need at all for any movement to empower thepeople.” But reality is main different. On a reflective note it can be suggested that parliamentary governance approaches focus on balancingpower among the executive, judicial and legislative functions. In South Asia, however this structural triad has not been successful in yieldinga power balance among social relations and particularly between the state and civil society (Moench et al., 2003). This contradiction isparticularly clear in the case of providing water-related services and flood mitigation. Only by introducing a balance of power amongdifferent interests as a key feature of governance will the process of flood mitigation become effective.

293
Movin
g fro
m Po
licy t
o Pra
ctice
: Role
of Co
st-Be
nefit
Analy
sis in
Proa
ctive
Disa
ster R
isk Re
ducti
on
Summary and Key Findings
The above sections elaborated the trajectory of institutional development in India,Pakistan and Nepal with regard to disaster management. All three countries arecurrently susceptible to natural disasters, and climate change scenarios predict thatthe incidence of natural disasters in the region will increase. Although the three sharea geographical area, the political scenario in each country is quite different. India isthe world’s largest democracy, Pakistan has just returned to civilian democratic ruleafter a long spell of military dictatorship, while Nepal has just put an end to itsmonarchy and is moving towards democracy. Despite these huge political differences,the countries’ approaches towards natural disaster management are quite similar.Their similarities are highlighted in the key findings arranged by country in the nextand the last sub-section.
Most of the disaster-related institutions in each country were formed in the wake oflarge events. Being home to the world’s largest river basins has forced each to addressthe risk of flooding. Departments such as irrigation, water and power are at theforefront of disaster reduction activities and have focused on constructing largeinfrastructure to harness the natural risk. Pakistan did devise specialized provincial-level organizations for flood control, but with time, these were converted to the FederalFlood Commission. With each progressive disaster, there was a tendency to createnew organizations with even more centralized power and funding.
At the same time there was a realization that calamity acts that dealt with the post-disaster situation needed to be replaced with policies that also help avert disaster andmitigate their impact. Nepal started developing such legislation after a massiveearthquake in the early 1980s. In 2005, with the help of international agencies, Indiaand Pakistan established agencies, national disaster management acts, andframeworks. These institutions are still nascent and it will take some time before theycan be effective on the ground.
In the meantime, the strict departmental/sectoral focus regarding various forms ofdisasters continues. There is a general disjunction between the functions of thesedepartments and the need for risk reduction. Issues remain in terms of administrativeand geographic jurisdictions, sectoral approaches to multi-hazard scenarios and the
294
Catalyzing Climate and Disaster Resilience: Processes for
Identifying Tangible and Economically Robust Strategies
general lack of coordination of disaster risk reduction. A rising sense of political andhumanitarian urgency with regard to disasters is leading towards a centralization ofdisaster risk management. For policy and resources, this may be the correct action,but to be effective, disaster risk reduction has to be managed at the local level.
There is also a shared lack of mechanisms for incorporating learning from experiencesinto future policies. Whenever there are lessons to be learnt, they are convenientlyignored. Government institutions at the planning level and other public, private ornon-profit organizations of learning have not yet turned their attention towardsresearch into proactive risk reduction.
Our cost-benefit analysis of some of the common risks across India, Pakistan andNepal shows key lessons that can be learnt by making such an analysis. One needs tobe able to identify and compare different approaches to risk reduction and recognizethat each case is unique. In one case we found that soft community based approachescan be more cost effective than hard, structural approaches. This is primarily due tothe side effects associated with embankments, such as loss of land due to water logging.When such costs are included in the analysis, it substantially reduces estimates of thenet economic benefit. In contrast, in that case many of the softer measures generateconsistent benefits and have few negative side effects. Net returns can also be low withsofter measures. For example, in the case of early warning on the Lai River in Pakistan,the existing investment in early warning has a low economic return because it providesinsufficient advanced warning (about 15 minutes) to enable people to move orotherwise protect economic assets and the system was designed with a heavy focus onexpensive hardware.
We found that both the process and the results were very useful in deriving cost-effective, pro-active disaster risk reduction activities. Identifying and analyzing optionswith all stakeholders not only increased the range of options but also lent transparencyand trust to the process. It allows for inter-sectoral dialogue and drew attention tostrategies that were not traditionally discussed. In one hypothetical case we discoveredthat the costs and benefits of the combination of a micro-insurance scheme andborehole irrigation would be more cost-effective than either one of them alone.
The new national frameworks of all three countries do include national disastermanagement institutions that could easily incorporate cost-benefit analysis and thusdevise effective pro-active disaster management. In fact, these institutions couldbecome home to such methods and tools. There is a dire need to evaluate the currentsectoral strategies to make sure they do not actually increase vulnerability. In particular,increasing use of groundwater in parts of Pakistan and constructing embankments inIndia and Nepal may actually be reducing the resilience of communities. On the otherhand, introducing some innovative financial products and decentralized household-level strategies may be economical than providing the traditional hard resilience toeveryone.
With climate change impending and the frequency of natural hazards projected toincrease there is a great need to further explore risk reduction strategies. In thediscussion at international level, policies related to climate change are increasingly
295
Movin
g fro
m Po
licy t
o Pra
ctice
: Role
of Co
st-Be
nefit
Analy
sis in
Proa
ctive
Disa
ster R
isk Re
ducti
on
emphasizing adaptation, and new funding is being allocated to developing countriesfor this purpose. With this new development, there is an increasing need to collectivelyand transparently devise strategies that will help poor nations deal with futurescenarios. Risk-based probabilistic cost-benefit analysis just may be one importanttool for making headway in this new field.
Very few mainstream interventions are being made to help countries cope with impactsof climate change and the inherent risks that it may bring. All three countries havenevertheless managed to move toward disaster management from reactive disasterrelief, at least in the policy arena. Below are the key policy findings about each country:
India
India passed the National Disaster Management Act in 2005 in the wake of theGujarat earthquake and other natural disasters in the recent decades. It is in theprocess of rolling out different components of this framework, but is still far fromreaching any degree of functionality at the local level.This act calls for pro-active disaster management instead of the relief-centricapproaches in practice. It foresees that the central apex body and sectoral statedepartments work make a coordinated effort in risk management. To implementthis approach will require massive resources, especially as even the sectoral approachto relief provision currently employed finds it difficult to work across administrativeboundaries and the new approach requires much more coordination.At the local level, it is important to develop the capacity for disaster risk reductionthrough NGOs, local institutions by pursuing capacity building programmes. Withthe exception of a few areas the means to build local capacity are lacking.There have been formal government led efforts to review past practices in floodcontrol and to improve disaster management approaches, but the findings andrecommendations of such exercises have not been incorporated and businessproceeds as usual.The Agricultural Insurance Company of India Limited has started weather-relatedrisk pooling through a crop insurance scheme that is mandatory for farmers whotake out agricultural loans and optional for others. Since the premium is subsidizedat 50%, it is more a social security scheme than a market based instrument.Knowledge about and uptake of this risk-sharing instrument seemed very low inour project areas because of a lack of awareness about such opportunities.Foreign actors such as UNDP have started massive disaster risk reduction activitiesat the local level. One such programme covers 169 districts in 17 states. Althoughgood results are expected from this programme there is no indication who willcontinue this programme in these states and replicate it in other state in the future.The weather-related data needed to project climate change is rarely available asweather stations are so sparsely placed. In additions, state policy puts restrictionon non-governmental individuals and entities from accessing river discharge andother data.There is no framework for integrating and evaluating various approaches to disastermanagement. For example, there is no platform for promoting alternative to thecurrent infrastructure-based solutions.
296
Catalyzing Climate and Disaster Resilience: Processes for
Identifying Tangible and Economically Robust Strategies
A comprehensive cost-benefit analysis can help address many of the problems andconstraints outlined above. It can serve as a framework for data organization andanalysis that can promote a multi-stakeholder process in identifying andprioritizing various disaster risk reduction strategies across ministries,departments and international humanitarian and private organizations. A process-oriented approach can also promote dialogue among stakeholders.
Pakistan
Pakistan has undergone a progressive centralization of disaster risk reduction dueto the creation of national level bodies such as the Federal Flood Commission(FFC), the Drought Emergency Recovery Authority and the National DisasterManagement Authority. The latter is to be established at the provincial and locallevels in the future but remains focused on the national level for now. The role ofexisting disaster-related organizations and linkages at the local level is still notclear for effective DRM.Pakistan has followed a sectoral approach to disaster management althoughhazards are multi-dimensional and often require multi-sectoral solutions. Forexample, in the Lai basin it is as important to prevent health risks from pollutedwaters as it is to manage the flood risk. Unfortunately, hierarchical governmentstructures prevent cross-sectoral approaches from being adopted.Devolved risk management organizations face jurisdictional issues, as disastersdo not follow administrative boundaries, whether we refer to large floods thatcross provinces or to those that occur at a very local level. To cite an example,storm water drainage from Islamabad floods the old city of Rawalpindi fewkilometres downstream, but the well-resourced Capital Development Authoritydoes not consider it a local issue and the municipalities in Rawalpindi do not havethe wherewithal to deal with such large-scale hazards. There are no mechanisms toovercome such jurisdictional overlaps and decide on an appropriate scale ofmanagement depending on the nature of the risk.For several reasons, Pakistan has not developed a learning environment and simplycontinues to implement past practices regardless of their ineffectiveness. First,there is little exchange or analysis of the limited information and data available.Data and development planning documents are kept well guarded to prevent publiccensure. Second, few organizations have the ability to carry out research on theeffectiveness of various approaches to and competing strategies for disastermanagement. No university and no public, private or non-profit research institutecaters to multi-disciplinary research into disaster management though the NationalDisaster Management Framework of 2005 envisages this.The result of the above gap is that Pakistan continues to focus on mega projects,whether they cater to overall development activities or those focused on disasterrisk reduction. The concept of soft, resilience-enhancing non-structural strategiesfor vulnerability reduction has yet to enter the formal planning process ordocuments of Pakistan.In the wake of the 2005 earthquake and growing awareness about the impacts ofclimate change at the global level, future planning documents like Pakistan’s Poverty
297
Movin
g fro
m Po
licy t
o Pra
ctice
: Role
of Co
st-Be
nefit
Analy
sis in
Proa
ctive
Disa
ster R
isk Re
ducti
on
Reduction Strategy Paper (PRSP) and other prospective plans are likely to includedisaster risk reduction as an explicit part of programming.There is much scope for the application of probabilistic cost-benefit analysis indisaster risk reduction in Pakistan. With climate change likely to result in chains ofimpacts within and across sectors of the economy and society, there is a need toprioritize impacts and risk management strategies to address them. Various policyoptions can benefit from using cost-benefit analysis to decide on their prioritizationand adoption.
Nepal
Although disaster relief is organized down to the district level, the management ofrisk is spread across various line agencies, these ranging from the DoI to the DWIDPto local governments. At the policy level, the Water and Energy Commission (WEC)is meant to provide policy guidance, but the Water Resource Strategy (2001) thatthe WEC needs to be strengthened and reorganized if it is to play an effective role inwater resource and risk management.Although the Local Governance Act of 2055 (1999) provides for the devolution ofthe power to plan and formulate policies to local bodies, most local offices act assubsidiaries of the central government because of the abundance of verticalprogrammes that are financed locally and through donors. Previous experience inthe local governance of natural resources show that there is a great potential foreffective disaster risk management at the local level.International NGOs such as Oxfam, Practical Action and ActionAid have startedworking in disaster risk reduction. Their efforts led to the development of a DisasterPreparedness Network, which involves local organizations in disaster reliefactivities.In times of disaster, the UNDP’s in-house Disaster Management Secretariat hasserved as an information clearinghouse, undertaking needs assessments, seekingdonor pledges, and coordinating of relief operations between government anddonor agencies.The Natural Calamity and Relief Act was promulgated in 1982 and revised in 1986,1989, 1992 and 1996 because of problems in its implementation. In 1995, it wasrenamed the National Action Plan on Disaster Management in Nepal. This planincludes disaster preparedness and mitigation along with plans for monitoringand evaluation. In reality, disaster became part of national planning for the firsttime only in the Tenth Plan (2002-2006).Decentralization and local governance of natural resources, especially commonpool resources, is essential for reducing the vulnerability of poor communitiesaffected by disasters. These steps will not only result in better management andgrowth in non-disaster situations but also lay the foundation for making riskreduction policies that protect those who are most affected.Further stronger linkages need to be forged with state departments, the marketand NGOs so communities can benefit from their activities.
298
Catalyzing Climate and Disaster Resilience: Processes for
Identifying Tangible and Economically Robust Strategies
Ahmed S. et al. (2007) ‘Institutional Arrangement and Policies for Drought Mitigation’.http://www.iwmi.cgiar.org/droughtassessment/files [accessed June 15,2007].
Asian Development Bank (2005) ‘Completion Report on Pakistan EmergencyAssistance and DIMRC’. http://www.adb.org [accessed December 2006].
Asian Development Bank (1994) Climate Change: Pakistan Case Study. Manila: AsianDevelopment Bank.
Awan, Shaukat Ali (2007) Interview at www.isdr.org/eng/mdgs-drr/nation [accessedJune 16, 2008].
Banskota, M., 1983: Foreign Aid and the Poor: Some Observations on Nepal’sExperience, in Foreign Aid and Development in Nepal, Proceedings of aseminar, October, Integrated Development Systems, Kathmandu.
Benson, C and E.J. Clay (2004) ‘Understanding the Economic and Financial Impacts ofNatural Disasters’. Disaster Risk Management Series Paper No. 4.Washington, D.C.: World Bank.
Bhattachan, K. B., et al. (eds.), 2001: NGO, Civil Society and Government in Nepal,Critical Examination of Their Roles and Responsibilities, CentralDepartment of Sociology and Anthropology, Tribhuvan University,Kathmandu and Friedrich-Ebert-Stiftung, Germany.
Blaikie, P., et al., 1980: Nepal in Crisis, Growth and Stagnation at the Periphery, DelhiOxford University Press, Bombay, Calcutta, Madras.
Cheema. M. (2006) ‘Relief Effort and Structural Problems’. http://www.risepak.com[accessed October 21, 2007].
Duryog Nivaran (2005) Tackling the Tide and Tremors: South Asia Disaster Report2005. Islamabad: RDPI.
Earthquake Reconstruction and Rehabilitation Authority (2007) ‘Progress Report’.Islamabad: Government of Pakistan. http://www.erra.gov.pk [accessedNovember 2007]
Earthquake Reconstruction and Rehabilitation Authority (2007) ‘ERRAOrganizational Chart’. http://www.erra.gov.pk [accessed November 2007].
Bibliography
299
Movin
g fro
m Po
licy t
o Pra
ctice
: Role
of Co
st-Be
nefit
Analy
sis in
Proa
ctive
Disa
ster R
isk Re
ducti
on
Federal Flood Commission (2007) ‘Annual Report’. http://www.pakistan.gov.pk[accessed October 2007].
Gurung, C. B., 1993: Engineering Geological Studies of Sildhunga Landslide in LamjungDistrict, Western Nepal, A Dissertation Submitted to Central Departmentof Geology Institute of Science and Technology, Tribhuvan University,Kathmandu.
Gyawali, D. et al., 1993: Rural-Urban Interlinkages: A Challenge for Swiss DevelopmentCooperation, A Case Study Based on Nepalese-Swiss DevelopmentExperiences, Interdisciplinary Consulting Group for Natural Resourcesand Infrastructure Management, Zurich and Interdisciplinary Analysis,Kathmandu.
HDR, 1998: Nepal Human Development Report 1998, Nepal South Asia Centre,Kathmandu.
HMG of Nepal Water and Energy Commission Secretariat, 2002: Water ResourcesStrategy Nepal, January, Water and Energy Commission Secretariat,Kathmandu.
Human Rights Commission of Pakistan (2005) ‘State of Human Rights in Azad Jammuand Kashmir’. Fact Finding Mission. Lahore: Human Rights Commissionof Pakistan.
Hussain, A., 1997: Overcoming Poverty, May, The Report of the Task Force on PovertyEradication.
IFAD, 2001: Rural Poverty Report 2001, Published for International Fund ForAgricultural Development, Oxford University Press, Oxford New York.
IFRC (2002) World Disasters Report 2002: Focus on Reducing Risk. Geneva: InternationalFederation of the Red Cross and Red Crescent.
Integrated Water Resources Management (2004) ‘Balochistan Resource ManagementProgramme’. Final Draft Report. http://www.waterinfo.net.pk/pdf/[accessed November 28, 2007].
International Crisis Group (2006) ‘Pakistan: Political Impact of Earthquake’. PolicyBriefing, Islamabad, Brussels: ICG. http://www.crisisgroup.org [accessedFebruary 2007].
IWRM, 2004: Crossing Boundaries, Regional Capacity Building on IWRM and Genderand Water in South Asia, Project Document, 29 September, Prepared bySaci Waters, Hyderabad, CWR, Chennai, IRMA, India, PostgraduateInstitute of Agriculture, University of Peradeniya, Sri Lanka, BCAS, IWFM,Dhaka and IWE, Netherland, Submitted to DCO/OZ and Water SupportUnit, Directorate General for International Cooperation, Ministry ofForeign Affairs, The Hague, The Netherlands.
Iyer, R.R., 2003: Water Perspectives, Issues, Concerns: Sage Publishers, New Delhi.JICA, 1999: The Study on Flood Mitigation Plan for Selected Rivers in the Terai Plain in
the Kingdom of Nepal, Draft Final Report, Vol. II, Main Report, February,Japan International Cooperation Agency, Department of Irrigation,Ministry of Water Resources, The Kingdom of Nepal, Nippon, Koei Co.Ltd. Nepal.
300
Catalyzing Climate and Disaster Resilience: Processes for
Identifying Tangible and Economically Robust Strategies
Kale, V. S. (ed.), 1998: Memoir 41, Flood Studies in India, Geological Society of India,Bangalore.
Kamal.A (2005) ‘Pakistan: Lai Nullah Basin Flood Problem Islamabad-RawalpindiCities’. http://www.apfm.info [accessed July 2007].
Kantipur Daily November, 22, 2003.Karmachrya, M., 1989: Landslides in Nepal in the Period 1970-1080, Submitted to
Central Department of Geology, Faculty of Science, TU, In PartialFulfilment of the Requirements For Master’s Level in Geology, Kathmandu.
Khan F., et al. (2007) ‘From Risk to Resilience in Pakistani Hazardscapes: Lai Basin andMuzaffarabad Tehsil’. Scoping Paper, July 2007
Khan S., et al. (2007) ‘The Army’s Role in Humanitarian Assistance’. SDPI Researchand News Bulletin 14(1).Khanal, R.K., 1991: Historic Landslides of NepalDuring 1902-1990 A.D. Extent and Economic Significance, December,Thesis submitted to Central Department of Geology, Faculty of Scienceand echnology, Tribhuvan University, Kathmandu..
Local Self-Governance Act 1993Loureiro M. (2006) ‘Social Safety Nets: Before and After October 2005’, The Friday
Times. http://www.risepak.com/ [accessed October 13, 2007].Manandhar, R. and Rylander, R., 1985: Pokernomics Essaays on Economics, Development
and Self-Reliance, Perspectives On Nepal, East West Publishers, Denison,Texas and Kathmandu, Nepal.
Martinussen, J., 1993: Local Authorities in Nepal, An Assessment of their Present Positionand Proposals for Strengthening of Democracy at the Local Level, Preparedfor Ministry of Local Development, National Planning Commission, HMGof Nepal and Danish Ministry of Foreign Affairs/DANIDA, LocalDevelopment Training Academy, Kathmandu.
Moench, M., et al., 2003: The Fluid Mosaic, Water Governance in the Context ofVariability, Uncertainty and Change, A Synthesis Paper, Nepal WaterConservation Foundation, Kathmandu, Nepal and the Institute for Socialand Environmental Transition, Boulder, Colorado, USA.
Moench, M. and A. Dixit (eds) (2004) Adaptive Capacity and Livelihood Resilience:Adaptive Strategies for Responding to Floods and Droughts in South Asia.Boulder: Institute for Social and Environmental Transition; Kathmandu:ISET-Nepal.
Nadir Khan, Jan (1983) ‘Kohistan Development Board: Project Completion Report’National Disaster Management Authority (2007) ‘Overview of the 8th October
Earthquake’. http://www.ndma.gov.pk/8octeq.html [accessed January 28,2007].
National Disaster Management Authority (2007) ‘Organizational Chart’ http://www.ndma.gov.pk [accessed November 2007].
Norgaard, R. B., 1994: Development Betrayed, The End of Progress and A Co-evolutionary Revisioning of the Future, Routledge, London and New York.
NWCF, 2003: Reconceptualising Flood Mitigation in Tarai, Nepal Water ConservationFoundation, Kathmandu.
301
Movin
g fro
m Po
licy t
o Pra
ctice
: Role
of Co
st-Be
nefit
Analy
sis in
Proa
ctive
Disa
ster R
isk Re
ducti
on
Pelling, M. (ed.), 2003: Natural Disasters and Development in A Globalising World,Routledge, Taylor and Francis Group, London and New York.
Rana, S. J. B., 1995: Towards a Safer World in the 21st Century- Nepalese Context, inAnnual Disaster Review 1994, Ministry of Water Resources, Water InducedDisaster Prevention Technical Centre, Lalitpur.
Rural Development Policy Institute (RDPI) (2005) ‘Earthquake Relief and RecoveryProcesses and Principles’. Technical Brief. Islamabad, Pakistan: RuralDevelopment Policy Institute Russel, N. et al., 1991: Nepal Country Study,in Disaster Mitigation in Asia and the Pacific, Asian Development Bank,Manila, Philippines.
Sahni P. and M. Ariyabandu (eds) (2003) Disaster Risk Reduction in South Asia. NewDelhi: Prentice-Hall of India Private Limited.
Sarewitz and Pielke (2005) ‘Rising Tide’, The New Republic Online, 17 January http://sciencepolicy.colorado.edu/admin/publication_files/resource-1694-2005.01.pdf [accessed November 17, 2007].
Shared learning dialogue with FFC Superintending Engineer Kamal A. on 4 July 2007Shared learning dialogue by Risk to Resilience Team with Federal Government on 22
August 2007.Shared learning dialogue by Risk to Resilience Team with District Government on 27
August 2007.Shared learning dialogue with Brigadier (retired) Jan Nadir Khan, former Chairman,
Kohistan Development Project on 29 August 2007.SIWI, 2000: European Parliament, Directorate General for Research, Water and
Development in the Developing Countries, Working Paper, DevelopmentSeries, DEVE 100 EN, Stockholm International Water Institute, Sweden.
Skerry, C. A., et al., 1991: Four Decades of Development, The History of U. S. Assistanceto Nepal 1951-1991, The United States Agency for InternationalDevelopment, Kathmandu.
Syed, Faisal S., S. Mehmood, N. Rehman, M. M. Sheikh, A. M. Khan (2007) ‘ClimateChange Scenarios for 2050s and 2080s over South Asia using RegionalClimate Model RegCM3’. Draft DR-8. Islamabad, Pakistan: Global ChangeImpact Studies Centre.
Tautscher, O. G., 1970: Surveys and Demonstration for the Management and Developmentof the Trisuli Watershed, Report on Erosion Control, Project Report No.13, June, Kathmandu.
Tautscher, O., 1979: Torrent and Erosion Control, in Journal of the Nepal ResearchCentre, Vol. 2-3, Sciences, Nepal Research Centre, Kathmandu.
Tearfund (2003) ‘Natural Disaster Risk Reduction: The policy and practice of selectedinstitutional donors’. Tearfund Research Report.
The Kashmir Earthquake, A Quick Look Report (2005) Mid-America EarthquakeCenter. http://www.reliefweb.int/rw/RWB.NSF/db900SID/ [accessed July2007].
Twigg, J. (2004) ‘Disaster Risk Reduction: Mitigation and Preparedness in Developmentand Emergency Programming’. Good Practice Review No. 9. London:Overseas Development Institute.

302
Catalyzing Climate and Disaster Resilience: Processes for
Identifying Tangible and Economically Robust Strategies
UNDP (2004) Reducing Disaster Risk: a challenge for development. Geneva: UNDP.UN-ISDR (2004) Living with Risk: A global review of disaster reduction initiatives.
Geneva: United Nations International Strategy for Disaster Reduction.Wisner, B., P. Blaikie, T. Cannon, and I. Davis (eds) (2004) At Risk: Natural Hazards,
People’s Vulnerability and Disaster. London and New York: Routledge.World Disaster Report (2000) Geneva: International Federation of Red Cross and
Red Crescent Societies. http://www.ifrc.org/docs [accessed February2007].
World Disasters Report (2003) Geneva: International Federation of Red Cross andRed Crescent Societies. http://www.ifrc.org/docs [accessed February2007].
Reflections on the Value ofthe Cost-Benefit Analysis Process
9C H A P T E R
Marcus Moench (ISET) &The Risk to Resilience Study Team

304
Catalyzing Climate and Disaster Resilience: Processes for
Identifying Tangible and Economically Robust Strategies
305
Refle
ction
s on t
he Va
lue of
the C
ost-B
enefi
t Ana
lysis P
roce
ss
The analyses presented in the chapters above clearly document that disaster riskreduction can generate economic returns that are both positive and competitive withother channels for public investment. All forms of risk reduction do not generateequally high returns, however. In fact, when indirect costs and negative impacts(disbenefits) are considered, some forms of risk management, such as the constructionof embankments for flood control, may not be economically efficient at all. The factthat the cost of an embankment may outweigh its benefits does not imply thatinfrastructure-based flood control strategies are inherently inappropriate. Instead, itpoints toward the need for selecting strategies carefully and for implementing them inways that both respond to local conditions and reflect the costs, benefits and disbenefitsassociated with them. As the Pakistan case study demonstrates, even strategies thatgenerally have high benefit-cost ratios, such as early warning systems, can generatenegative returns if they are not carefully designed in ways that minimize costs andaccount for the maintenance and operational inputs required to ensure sustainability.
Conclusions
306
Catalyzing Climate and Disaster Resilience: Processes for
Identifying Tangible and Economically Robust Strategies
As many of the chapters in this report have emphasized, much of the value inconducting a cost-benefit analysis lies in the process. If a cost-benefit analysis iscarried out appropriately (that is in a transparent and participatory manner) theprocess of conducting it forces analysts, policy-makers and other actors involved todo two things: first, specify the precise links between an intervention and the reductionsin risk it is intended to generate; and, second, to evaluate whether or not the dataavailable substantiates those links. Furthermore, because the data on hazards and thebenefits of risk reduction are generally insufficient to fully quantify those links, theprocess of conducting a cost-benefit analysis makes participants consider and reach acommon understanding about the assumptions made. These points highlight thefundamental importance of the process of the cost-benefit analysis.
A second key value in conducting a cost-benefit analysis relates to the identification oftangible interventions and their relationship to specific risks. Groups, such as policy-makers, development actors, and academics, often talk in broad terms of the need for“adaptation” to climate change or of the role of “disaster risk reduction” withoutreally considering the complex relationship between an intervention or set ofinterventions on the ground and the risks they are intended to mitigate. The technicaland economic effectiveness of a project designed to control flooding by constructingembankments, for example, depends heavily on a wide variety of factors including: (1)the frequency and magnitude of actual flood events and how they relate to the types ofevents anticipated in the project design; (2) the operational lifetime of the embankmentsand its relationship to the design lifespan; (3) the actual cost of constructing thesystem and how it relates to the cost projected at the time the system is designed; (4)the degree to which externalities, such as water-logging behind embankments, wereeffectively identified and addressed in the design; (5) the nature and cost of the systemsof maintenance and whether or not they are implemented regularly; (6) the nature ofthe assets in both protected and otherwise affected areas and how they evolve; and (7)what reductions in assets and other losses are actually incurred with the embankmentsystem in place as opposed to what losses would have been incurred had the systemnot been constructed.
The Value of the Cost-BenefitAnalysis Process
307
Refle
ction
s on t
he Va
lue of
the C
ost-B
enefi
t Ana
lysis P
roce
ss
Evaluating the technical and economic effectiveness of an embankment system requiresunderstanding and evaluating each of the above seven factors. Since, in virtually allcases, particularly in developing country contexts, there simply is not enough data toaccomplish such an evaluation in a fully quantitative manner, important assumptionsmust be made. How accurate these assumptions eventually prove to be determines thevalidity of the analysis and, ultimately, the technical and economic effectiveness of theintervention.
In general there will be no basis for understanding cost-benefit relationships—andthus for informed decision-making—unless these assumptions are transparent andsubject to intense scrutiny. Conducting cost-benefit analyses in an open andtransparent manner enables assumptions to be evaluated and helps lay out clearly therelationship between proposed interventions and their intended impacts. This isfundamental to informed decision-making.
A closely related point is the need early in the process to clarify and agree upon theobjectives, information needs and data situation among the stakeholders. The type ofenvisaged product is closely linked to its potential users. A cost-benefit analysis maybe conducted for informational purposes, as a pre-project appraisal, as a full-blownproject appraisal or as an ex-post evaluation. Purposes, resource and timecommitments and expertise required differ significantly for these products. Forexample, information required is substantially different between cases involving adevelopment bank or a municipality, between small-scale and large-scale investments,planning physical infrastructure or capacity building measures, and betweenmainstreaming risk in cost-benefit analysis versus cost-benefit analysis for disasterrisk management. At a very early stage, interested parties need to achieve consensuson the scope and breadth of the cost-benefit analysis to be undertaken. In our project,we pursued this for our case studies through a combination of scoping exercises,shared learning dialogues and qualitative assessment prior to any decision onundertaking a more comprehensive cost-benefit analysis. Furthermore, even afterquantitative analyses were completed, it was essential to review results in the light ofqualitative information that cost-benefit analysis is not designed to consider. Suchinformation may relate to cultural values or the distribution of benefits betweendifferent groups within society. As a result, approaches that start with qualitativeforms of evaluation before proceeding to more quantitative forms and then return toqualitative analysis are, we believe, central the role cost-benefit analysis could play asa decision support tool.
308
Catalyzing Climate and Disaster Resilience: Processes for
Identifying Tangible and Economically Robust Strategies
Estimating risk and the costs and benefits of disaster risk reduction is inherentlycomplex. Disaster events are in essence probabilistic events; consequently, benefitsdue to risk management arise only when disasters occur. Benefits should be assessedin terms of probability multiplied by the consequences, leading to an estimate of risk.However, the treatment of risk in cost-benefit analysis (and disaster risk managementgenerally) is often ad-hoc and assessments focus on past events rather than potentialfuture disasters, possibly resulting in an underestimation of damages and anunderinvestment in preventive measures.
The need to account for climate change when assessing future hazard intensity andfrequency adds considerable complexity and resource demands. Climate modellingand downscaling are key input requirements but the results of models are inherentlyuncertain and depend on numerous assumptions. In many cases, this may makeprojections of future event probabilities highly uncertain, undermining the analyticalbasis for estimating the costs and benefits of investments in risk reduction. Atminimum, assumptions and uncertainties must be sufficiently communicated andunderstood in order to properly interpret results derived in a cost-benefit analysis.
Furthermore, general methodological challenges affect the analysis. Valuation of health,environmental, cultural and many other aspects is extremely difficult. In some cases,such as human life, challenges in the assignment of monetary values are compoundedby inherent ethical issues. An additional challenge is accounting for indirect impactsof disaster (e.g. increased prevalence of diseases post-disaster, higher transport costsdue to loss of infrastructure, increased costs due to business interruption) and howthey may be reduced through interventions. Indirect damages can be substantial andsometimes even exceed direct impacts, yet due to methodological limitations, socialand indirect economic effects are rarely included in the analysis. As a result,assessments primarily focus only on direct impacts, leading to a partial picture ofpotential disaster impacts to be avoided and an incomplete cost-benefit analysis.
Challenges and Limitations of Cost-Benefit Analysis for Assessing
Disaster Risk Reduction
309
Refle
ction
s on t
he Va
lue of
the C
ost-B
enefi
t Ana
lysis P
roce
ss
Vulnerability and Distributional Analysis
The fact that conventional approaches to cost-benefit analysis do not address distributionalissues is an additional significant limitation in the cost-benefit analyses of disaster riskreduction options conducted for this report. As Chapter 5 on the qualitative analysis of thecosts and benefits of different strategies for flood risk reduction in Nepal illustrates, somestrategies have major distributional implications. In the case of flood control structures, forexample, individuals living within protected areas often benefit while those who live in adjacentunprotected areas suffer. In fact, such discrepant impacts are part and parcel of floodingsince water prevented from flowing in one area still needs to drain somewhere. While, insome cases, the benefits may still exceed the costs, clear winners and losers generally exist.
Similar, although somewhat more subtle, distributional effects may be present with otherdisaster risk reduction strategies as well. In the case of drought mitigation strategies, forexample, it has often been argued that constructing wells for groundwater irrigationdisproportionately benefits the relatively affluent because they have more land and can affordto purchase pumps and fuel. The case of insurance is similar. The history of financial serviceinstitutions in India suggests that skill in negotiating with bureaucracies and knowledge ofrights are critical factors in obtaining insurance payouts. Such subtle distributional impactswere not documented in the case studies conducted for this report but the potential isimportant to recognize and highlights the inadequacies of conventional cost-benefit analyses.It is necessary to introduce complementary processes that address the differential dimensionsof vulnerability and the distributional implications of strategies in order to generate a moreholistic basis for decision-making.
The vulnerability analyses conducted as part of the case studies documented in this report,along with the vulnerability index developed by several of the project participants as part ofour overall methodology (see Chapter 2 in this volume and Risk to Resilience Working PaperNumber 2), represent an initial step in this direction. However, additional research is neededto develop tools that enable us to integrate vulnerability and economic analysis. Since theobjective of most investments in disaster risk reduction and adaptation to climate change isto assist vulnerable communities, tools that clearly identify who benefits and who bears thecost of interventions to reduce or spread risk are critical to inform decision-making. Such toolsmay enable decision-makers to understand how the costs and benefits of different strategiesare distributed in relation to any key target group (women-headed households, wealthy,hazard exposed, etc.). Consideration of distributional issues requires a substantial expansionbeyond the conventional focus of cost-benefit analysis, which is only on the economic returnsof an intervention to society as a whole.
310
Catalyzing Climate and Disaster Resilience: Processes for
Identifying Tangible and Economically Robust Strategies
The policy context across South Asia highlights the importance of processes thatenable the costs and benefits of alternative approaches and their distributionalimplications to be evaluated transparently.
Detailed analysis of the policy context in India, Nepal and Pakistan clearly shows thecentralized policy-making environment as far as disasters and climate change areconcerned. There is substantial rhetoric about the need for community participationin disaster risk reduction but, in most cases, actual participation is limited. Initiativesto reduce disaster risk, particularly when implemented in response to specific disasterevents, are often influenced by populist or other considerations rather than by theirtrue role in risk reduction. Another limitation is that the policy environments in allthree countries limit learning. As discussed in more detail below, key points fromanalysis of policies in each of the involved countries confirm these observations andpoint toward the role participatory approaches to cost-benefit analysis could play.
Pakistan
Pakistan’s approach to disaster risk reduction has become progressively centralizedsince it created several national-level bodies such as the Federal Flood Commission,the Earthquake Rehabilitation and Reconstruction Authority, and the NationalDisaster Management Authority. The latter is eventually to be established at theprovincial and local levels, but it remains focused on the national level for now. A lackof clarity regarding the role of existing disaster-related organisations and their linkagesat the local level still exists and needs to be resolved if disaster risk management is tobe effective. The effects of centralization are compounded by the government’s sectoralapproach to disaster management despite the fact that hazards are multi-dimensionaland often require multi-sectoral solutions. The Lai Basin case study highlighted theimportance of preventing the health risks associated with polluted flood waters ratherthan simply managing the direct risk of flooding. However, since cross-sectoralapproaches are not implemented, doing so has proved difficult. With devolved riskmanagement organisations, jurisdictional issues arise as disasters do not followadministrative boundaries. This applies to floods across provinces and as well to
The Policy Context
311
Refle
ction
s on t
he Va
lue of
the C
ost-B
enefi
t Ana
lysis P
roce
ss
those that occur at a very local level. For example, storm-water drainage fromIslamabad floods the old city of Rawalpindi just a few kilometers downstream, but thewell resourced Capital Development Authority does not consider it a local issue andthe Rawalpindi municipality does not have the wherewithal to deal with such large-scale hazards. Mechanisms to overcome such jurisdictional issues are limited, so rarelyis there an appropriate scale of management, reflecting the nature of the risk.
Where Pakistan is concerned, several factors contribute to the lack of learning and thecontinuation of past practice, however flawed. First, there is little exchange or analysisof information and data, whatever little is available. Data and even future developmentplanning documents are kept well-guarded to prevent public censure. Second, feworganisations have the capacity to carry out research on the effectiveness of variousapproaches or on competing strategies for disaster management. No university and nopublic, private or non-profit research institute caters to multi-disciplinary research ondisaster management. A National Institute for Disaster Management is envisaged in theNational Disaster Management Framework of 2005, but has yet to be established and itis far from clear how it would effectively transmit learning across sectors and scales.Consequently, Pakistan continues to emphasize mega projects, whether they promoteoverall development activities or focus on disaster risk reduction. The concepts of softresilience and non-structural strategies for vulnerability reduction are limited in theformal planning process or documents of Pakistan. There have been some recent effortstowards risk pooling of farmers through the “Crop Loan Insurance Scheme” approvedby the Government in July 2008. This plan supports small farmers to mitigate risk fromnatural disaster-related damage to major crops including wheat, rice, sugarcane andcotton. However, this initiative is recent, and has yet to yield results.
In the wake of the 2005 earthquake and growing awareness on climate change at theglobal level, there is potential for Pakistan to include disaster risk reduction as anexplicit part of its national planning and related documents, such as the PovertyReduction Strategy Paper. The application of probabilistic cost-benefit analysis maysupport this fiscal planning. At the same time, as discussed extensively above, it mayalso contribute to learning and provide a framework for cross-sectoral and cross-scale learning. With climate change likely to result in chains of impacts within andacross sectors of the economy and society, it is necessary to prioritize impacts and riskmanagement strategies.
India
In the wake of the Gujarat earthquake and other recent natural disasters, India passeda National Disaster Management Act in 2005. It is slightly ahead of Pakistan in rollingout different components of the framework, but still far from functioning adequatelyat the local level. The Act calls for proactive disaster management instead of the relief-centric approaches that have dominated past practice. It foresees coordination of riskmanagement by its central apex body and sectoral state departments. Implementationof this approach will require massive effort and resources. Even with the currentpractice of sectoral approaches to relief provision, it has been difficult to work across
312
Catalyzing Climate and Disaster Resilience: Processes for
Identifying Tangible and Economically Robust Strategies
administrative boundaries. At the local level, it is important to have developed thecapacity for disaster risk reduction through NGOs, local institutions and capacitybuilding programs but, with the exception of few areas, little effort has been made toscale up or replicate. One exception is the work of the UNDP: the global agency hasstarted major local level disaster risk reduction activities in 169 districts in 17 states.Although good results are expected from this initiative there is no indication of whowill continue this programme in these states and replicate it elsewhere in the future.Decentralisation is being attempted but the ability to sustain the effort is open toquestion.
India has made some progress in fostering a learning environment. The NationalInstitute of Disaster Management (NIDM) established over a decade ago has played amajor role in training disaster managers at the state and central levels, but it is relativelysmall in relation to the scale of training and knowledge management needed.Furthermore, its main focus is on disaster management organisations rather than onthe many organisations in other sectors whose activities are equally central to disasterrisk reduction. Limitations of state efforts toward learning in disaster risk reductionare evident in the case of floods. There have been formal government-led efforts toreview past practices in flood control and to improve disaster management approaches,but the findings and recommendations of such exercises have not been incorporated.It generally has been “business as usual”, particularly within sector-specific agencies.Furthermore, there is a lack of framework for integrating and evaluating differentapproaches to disaster management.
Organizations working in India have identified and are working with the governmentto pilot major alternative approaches to disaster risk management. The UNDP-supported programme mentioned above is a case in point. A variety of programmesto manage risk through the development of innovative financial mechanisms are alsoemerging. The Agricultural Insurance Company of India Limited, for example, hasstarted weather-related risk pooling through a crop insurance scheme that ismandatory for farmers who take out agricultural loans and optional for others. Thepremium is subsidized up to 80%, and as such, it may be considered more of a socialsecurity scheme than a market based instrument. The uptake of and knowledge aboutthis risk-sharing instrument seemed very low in the Uttar Pradesh case study area.Even in these pilot efforts, the ability to learn is hindered by the absence of a platformand framework for promoting or systematically evaluating alternatives to currentapproaches. Learning is also affected by the limited availability of and access to data.Weather-related data to be used for predicting climate change, for example, is rarelyavailable at the local level in vulnerable areas such as eastern Uttar Pradesh because itis sparsely recorded. In addition, non-governmental individuals and entities arerestricted from accessing river discharge and other data.
In addition to inadequate attention to learning, the Uttar Pradesh flood case studyalso highlights a number of other limitations in the policy environment. First, there isa lack of coordination amongst the sectoral government agencies involved in differentaspects of flood management. Each has its own independent agenda which does nottake into account common concerns. Second, administrative and physical boundariesoften do not match: flood management must be at the basin level, but most river
313
Refle
ction
s on t
he Va
lue of
the C
ost-B
enefi
t Ana
lysis P
roce
ss
basins fall within several administrative boundaries. Most actions directly concernedwith floods thus are designed and implemented at the administrative level thoughtheir implications are felt at the basin level. Third, there appears to be a disjuncturebetween community needs and government programmes. While a cross-sectoralapproach is required to address the basic needs of communities in flood prone areas,government flood management plans generally do not focus on the entire gamut ofneeds and potential interventions. In particular, livelihood promotion, which has thepotential to address root causes of flood vulnerability, is often not considered. Mostrural development activities are designed at the national level and are common acrossthe country, lacking mechanisms to respond to local contexts and specificities. Forexample, there are no specific features of rural development activities for flood proneareas. Despite the need for employing participatory bottom-up planning approacheswhen preparing official disaster management plans, in practice local people are rarelyinvolved. Fourth, capacity of local level institutions is weak and needs to bestrengthened. State institutions are often ill-equipped to implement local-level optionsand may not always be the most appropriate body. While civil society organisationshave experience of working with communities and facilitating innovative approaches,they may not have the reach or the capacity to operate at large scales. Both civil societyorganizations and state must shift from their existing “relief ” focus to a focus on long-term sustainable development.
A comprehensive participatory approach to cost-benefit analysis can help addressmany of the problems and constraints outlined above. It can serve as a framework fordata organisation and analysis that can promote a multi-stakeholder process inidentifying and prioritizing various disaster risk reduction strategies across ministries,departments and international humanitarian and private organizations. A process-oriented approach can also promote dialogue among stakeholders.
Nepal
Although disaster relief in Nepal is organized down to the district level, the managementof risk is scattered across various line agencies which range from the Department ofIrrigation to Soil Conservation and Water Management to local governments.National policies have been revised to better consider disaster risk management. Forinstance, the Water Resource Strategy (2001) called for strengthening and reorganizingthe Water and Energy Commission (WEC), which is supposed to provide policyguidance, so that it can play a more effective role in water resource and riskmanagement. The Natural Calamity and Relief Act was promulgated in 1982 andrevised in 1986, 1989, 1992 and 1996. After many implementation problems, it wasrenamed in 1995 as the National Action Plan on Disaster Management in Nepal. Thisplan includes disaster preparedness and mitigation, along with plans for activitiesincluding monitoring and evaluation. Despite these acts, disasters have not receivedsubstantial attention at the highest policy levels until relatively recently. Disaster-related issues were incorporated for the first time in the Tenth Plan (2002-2006).
Where implementation of disaster risk management and related activities is concerned,the Local Governance Act of 2055 (1999) provides for the devolution of powers to
314
Catalyzing Climate and Disaster Resilience: Processes for
Identifying Tangible and Economically Robust Strategies
local bodies to plan and formulate policies. Despite this legislation, most local officesact as subsidiaries of the central government because programmes are financedvertically whether financed by the government or donors. The role of internationalorganizations in supporting disaster risk management in Nepal is much larger than itis in either India or Pakistan. International NGOs such as OXFAM and Action Aidhave established a Disaster Preparedness Network involving local organisations indisaster relief activities. In times of disaster the UNDP’s in-house Disaster ManagementSecretariat has served as an information clearinghouse by undertaking needsassessments, seeking donor pledges, and coordinating relief operations.
Experience in the local governance of natural resources shows that there is a greatpotential for effective disaster risk management at the local level but at present thispotential is not effectively reflected in the policy environment. As the array of strategiesfor risk management documented in the Nepal case study illustrate, decentralisationand the local governance of natural resources, especially common resources, is essentialfor reducing the vulnerability of poor communities affected by natural disasters. Localgovernance will not only result in good management and growth in non-disastersituations but also lay the foundations for making risk reduction policies that protectthose who are most affected.
At present, consistent frameworks for evaluating alternative approaches to disasterrisk management are limited in Nepal. As in the India and Pakistan contexts, theadoption of participatory processes for the cost-benefit analysis of different riskmanagement strategies could contribute substantially to strengthening the policyenvironment at both local and national levels in several ways. For instance, the resultsgenerated will highlight returns to different strategies in ways that draw attention atpolicy levels. In addition, the process of conducting participatory cost-benefit analysisshould in itself draw actors together and help to identify points of entry for action atdifferent levels in ways that help organisations cross sector boundaries and encouragethe devolution of responsibility to those levels with the greatest comparative advantagefor actual implementation.
315
Refle
ction
s on t
he Va
lue of
the C
ost-B
enefi
t Ana
lysis P
roce
ss
Each of the case studies conducted for this project generated key insights that aredirectly relevant to the management of disaster risks under changing climaticconditions. These insights are summarized briefly below.
Uttar Pradesh Flood Management
The Uttar Pradesh case study on flood management suggests that decentralized, people-centred approaches to managing flood risk are likely to be more economically robustand to generate more widespread benefits for local populations than centralized floodcontrol structures. While flood control structures will remain important in somecontexts, the core need is to invest much more heavily in decentralized, people-centredapproaches and in the maintenance of existing structures rather than to constructnew ones.
The case study projects that flood impacts in the Rohini Basin will increase in thefuture (to 2050) due to climate change. Small floods will occur more frequently (abouttwice as frequent than present), while the rare but intense floods may remain relativelyconsistent. These changes will result in a two-fold increase in future average annualeconomic loss due to floods.
An historical analysis of embankments following a cost-benefit analysis basedprimarily on direct structural engineering costs shows a high benefit-cost ratio,indicating economically efficient performance. When conservative estimates ofdisbenefits, more realistic costs and actual structural performance are incorporated,however, the ratio decreases substantially. Given the many uncertainties involved, itcannot be concluded that the Rohini River embankments have been cost-effective.Furthermore, the benefits from constructing new embankments depend heavily onthe accuracy of future climate change projections. If the floods that actually occurexceed the maximum threshold flows for which embankments are designed, then majordisasters are likely to occur. Since with climate change the magnitude of future floodsis highly uncertain, the economic efficiency of embankments and other strategies thatdepend on similar design thresholds is equally uncertain. This said, analysis indicates
Insights from Cases
316
Catalyzing Climate and Disaster Resilience: Processes for
Identifying Tangible and Economically Robust Strategies
that proper embankment maintenance, even under climate change projections, iseconomically efficient although economic performance will decline.
In contrast to embankments, the economic efficiency of the people-centred strategydoes not decline due to projected climate change impacts. Moreover, due to the lack ofa large upfront investment as is necessary for embankments, the results are notparticularly dependent on the discount rate because benefits are greater than costsevery year and even accrue in non-flood years. The resilience-focused approach of thepeople-centred strategy means that the increased flood risk projected as a consequenceof climate change does not reduce overall benefits.
Uttar Pradesh Drought Management
Key conclusions from the study on drought management in Uttar Pradesh indicatethat climate change may cause an increase in the frequency of droughts. In UttarPradesh, the non-monsoon eight months receive only 20-30% of the total annualrainfall. Model result suggests that non-monsoon rainfall will decline by as much as40% as climate change proceeds. This change in rainfall will likely have significantadverse consequences on the rural livelihoods in the state.
Our analysis shows that reducing drought risk by constructing borewells forgroundwater irrigation and by spreading risk through the introduction of ahypothetical subsidized crop micro-insurance programme both yield benefit-costratios of greater than one. Although most groundwater development in India hasbeen through private sector initiatives, in the case we evaluated, borewell constructionwould be subsidized by public resources in order to target particularly poor andvulnerable communities, yet pumping activities, as is current practice, would be paidby the households themselves. However, the lack of disposable income on the part ofpoor households reduces the benefits of groundwater irrigation as people cannotafford to pump regularly; they only irrigate if rain fails at critical stages of crop growth.
The hypothetical insurance scheme is hardly affordable by those at risk and would bebeneficial only if about half of the premium is subsidized. However, if we look at thesubstantial cost of government disaster relief post event vis-à-vis the cost of insurancepremium to be paid by the government for both household and state level financialsecurity, it is comparable in magnitude. Since the insurance scheme considershouseholds close to the poverty line, the subsidy is justified as a poverty reductioninvestment.
Returns would be particularly high if a combination of both the evaluated strategieswere implemented simultaneously reducing and transferring risk. In this case, borewellswould cover the risk of high-frequency, low-intensity droughts while insurance wouldcover part of the losses from crop failures caused by large, less frequent droughts.This combination gives a better cost-benefit ratio than either of the two interventionsalone. In the case of climate change, when drought becomes more frequent, this thirdstrategy will intensify benefits. It is, however, important to recognize that the benefitsof insurance (relative to the cost) decline under the climate change scenarios evaluated.
317
Refle
ction
s on t
he Va
lue of
the C
ost-B
enefi
t Ana
lysis P
roce
ss
That is, because of difficulties in projecting the probability of loss events and thelikelihood that such events will increase in frequency, the viability of insurance as amechanism for addressing drought risks appears likely to decline as climate changeproceeds.
Although complex in nature due to a fully probabilistic approach and the requirementfor numerous simplifying assumptions, the Uttar Pradesh drought study reveals twomain conclusions. First, achieving economically efficient returns to investments requiresingenuity in formulating disaster risk reduction strategies. Second, strategies must betargeted according to specific needs.
Rawalpindi–Lai Basin Flood Management
All four interventions considered for flood risk reduction in the Lai Basin generatefavorable benefit-cost ratios. This finding reflects the high value of almost anyintervention to reduce disaster risks in urban contexts. Even so, different strategiesgenerate very different returns. For instance, concrete paving of the channel in themidsection is far less beneficial than channel improvement in the lower reaches of theLai. Because the Lai is short and the equipment expensive, the early warning systemimplemented is less beneficial than improving basic services such as health, water andsanitation. Although it is not cost effective, the low level of investment required madethe early warning system the most viable project for the government. A more effectiveand cheaper strategy might be to provide early warnings using short messaging serviceson cell phones.
Many conservationists and Rawalpindi locals would like to see the Lai River restoredto its natural state. The cost-benefit analysis shows that although the results arepositive, the cost of ecological restoration of the Lai flood plain (which would requirerelocation of people out of the flood plain and opening up space around the river forvegetation growth) is the most expensive of all four strategies. The issues of untreatedsewage from both Islamabad and Rawalpindi and solid waste from the localities aroundthe Lai also need to be investigated. Moreover, Pakistan’s archaic land acquisitionlaws tend to benefit the rich and discriminate against the poor. Most people livingalong the Lai rent their houses, but tenants are not compensated for flood-relateddamages. In addition, many of the houses encroach on public property, making themillegal; the owners of these houses cannot claim benefits. In terms of the cost of land,the Capital Development Authority has a mandate to develop new housing and, infact, owns large tracts of land for low-cost housing. If the houses along the Lai wereexchanged for units upstream, the prospect of relocation would become very feasibleas the authorities would only have to pay for land development and not for the cost ofthe land. This would have to be done, though, under a special project with more pro-poor policies and procedures.
Overall, the Lai Basin case study documents the economic value of most interventionsto reduce risks in urban contexts. Such investments generate strong returns due tothe high density of people and assets found in urban areas.
318
Catalyzing Climate and Disaster Resilience: Processes for
Identifying Tangible and Economically Robust Strategies
Nepal Qualitative Case Study
The assessment conducted in the Nepal case study area along the lower Bagmati Riverclearly demonstrates that there are both winners and losers from current investmentsin addressing flood risks by constructing embankments. Structural measures such asembankments and spurs provide short-term benefits to a few communities but havenegative consequences downstream and in other unprotected areas. People-centredinvestments such as early warning, raising the plinth level of housing, boats, and so onhave fewer costs to offset benefits they generate and appear far more resilient to changesanticipated as a consequence of climate change. It is unclear, however, if these strategieswill be able to mitigate flood risks sufficiently to reduce losses as climate changeproceeds.
In a context where embankments, spurs and other structural measures are the focusof government and policy-making organisations, our qualitative methodology forevaluating the costs and benefits of alternative strategies provides new insights. Ithelped to identify (1) the types of costs and benefits associated with different floodmanagement techniques; (2) the relative magnitudes of these costs and benefits; and(3) their distribution. While the method does not provide sufficient information toevaluate the overall economic viability of different strategies, it does provide criticalinformation to indicate major areas where additional analysis is needed for informeddecision-making.
The information generated while conducting a qualitative benefit-cost assessmentprovides many of the same insights that would be generated by a more quantitativeapproach. It highlights both the direct and indirect costs and the benefits associatedwith each type of risk reduction intervention. In addition, unlike the quantitative cost-benefit analysis, this methodology allows us to evaluate the differential distributionof costs and benefits to different sections of the population in a data-deficientenvironment. However, the magnitude of the costs and benefits identified are difficultto compare. In many ways, a qualitative analysis can lay the groundwork for a morequantitative evaluation without replacing it. If a full cost-benefit analysis is requiredfor project purposes, this methodology strongly complements it by identifying andthus enabling the inclusion of many costs and benefits that are often excluded asexternalities in standard economic techniques.
319
Refle
ction
s on t
he Va
lue of
the C
ost-B
enefi
t Ana
lysis P
roce
ss
Down-scaling outputs from general circulation models (GCM) as a basis for estimatingthe costs and benefits of different risk reduction strategies under different climatechange scenarios is a challenging process. It is, however, essential for any approach tocost-benefit analysis that requires probabilistic information on the frequency andintensity of future drought, storm or flood events. Chapter 3 outlines the innovativemethodology developed under this programme for down-scaling GCM scenarios tolocal basins in South Asia where data are limited. We employed a simple, analogue-type statistical down-scaling technique to examine potential precipitation changes inthe Rohini Basin up to 2050. We utilized output from the Canadian Third GenerationCoupled Global Climate Model (CGCM3-T47), because a study by Kripilani et al.(2007) found this model to be one of six that proved capable of replicating key historicalfeatures of the South Asian monsoon system and because accessing data from thismodel was relatively easy. We chose the A2 and B1 scenarios to drive our down-scaling model because these represent the upper and lower boundaries of estimates ofgreenhouse gas emissions. The CGCM3 is run in ensemble mode, with a total of fivemodel runs each for the A2 and for the B1 scenarios publicly available, and we utilizedoutput from each run to drive our model. The outputs were used in both the UttarPradesh drought and flood analyses. Down-scaling was also attempted in the LaiBasin. Data at the local level, however, were insufficient and of too uncertain qualityto allow for the results to be incorporated in the cost-benefit analysis in this case.
Incorporating down-scaled results from different climate change scenarios inanalysing the costs and benefits of different risk management strategies has bothmajor advantages and major limitations. In general, our model’s down-scalingprojections show similar trends to the broad IPCC (2007) projections for the SouthAsian region. We project an increase in precipitation during the monsoon monthsfrom June to August and a decrease in precipitation from December to February. Ourprojections differ from the IPCC projections for the periods from March to May andfrom September to November in that we see decreases in precipitation in these seasonswhile IPCC projections foresee increase. The scenario of increase in climate variabilitywe generate is consistent with IPCC projections. Table 1 summarizes our down-scalingscenarios.
Evaluating the Impacts ofClimate Change
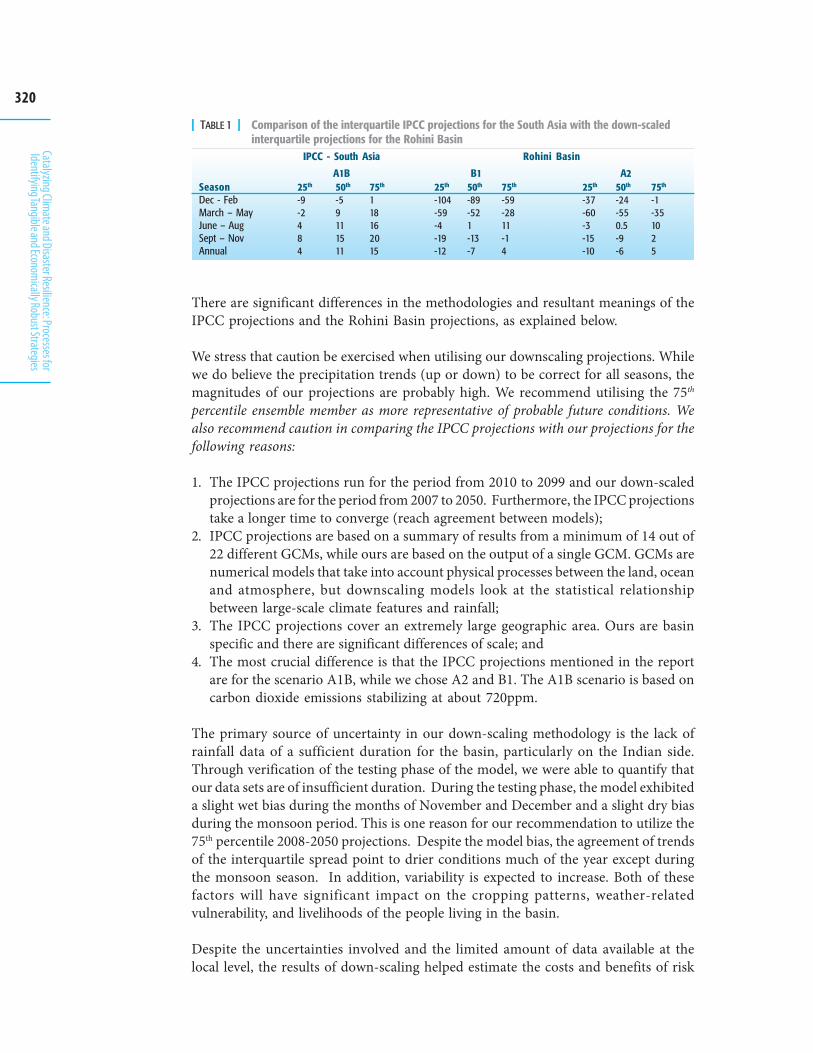
320
Catalyzing Climate and Disaster Resilience: Processes for
Identifying Tangible and Economically Robust Strategies
There are significant differences in the methodologies and resultant meanings of theIPCC projections and the Rohini Basin projections, as explained below.
We stress that caution be exercised when utilising our downscaling projections. Whilewe do believe the precipitation trends (up or down) to be correct for all seasons, themagnitudes of our projections are probably high. We recommend utilising the 75th
percentile ensemble member as more representative of probable future conditions. Wealso recommend caution in comparing the IPCC projections with our projections for thefollowing reasons:
1. The IPCC projections run for the period from 2010 to 2099 and our down-scaledprojections are for the period from 2007 to 2050. Furthermore, the IPCC projectionstake a longer time to converge (reach agreement between models);
2. IPCC projections are based on a summary of results from a minimum of 14 out of22 different GCMs, while ours are based on the output of a single GCM. GCMs arenumerical models that take into account physical processes between the land, oceanand atmosphere, but downscaling models look at the statistical relationshipbetween large-scale climate features and rainfall;
3. The IPCC projections cover an extremely large geographic area. Ours are basinspecific and there are significant differences of scale; and
4. The most crucial difference is that the IPCC projections mentioned in the reportare for the scenario A1B, while we chose A2 and B1. The A1B scenario is based oncarbon dioxide emissions stabilizing at about 720ppm.
The primary source of uncertainty in our down-scaling methodology is the lack ofrainfall data of a sufficient duration for the basin, particularly on the Indian side.Through verification of the testing phase of the model, we were able to quantify thatour data sets are of insufficient duration. During the testing phase, the model exhibiteda slight wet bias during the months of November and December and a slight dry biasduring the monsoon period. This is one reason for our recommendation to utilize the75th percentile 2008-2050 projections. Despite the model bias, the agreement of trendsof the interquartile spread point to drier conditions much of the year except duringthe monsoon season. In addition, variability is expected to increase. Both of thesefactors will have significant impact on the cropping patterns, weather-relatedvulnerability, and livelihoods of the people living in the basin.
Despite the uncertainties involved and the limited amount of data available at thelocal level, the results of down-scaling helped estimate the costs and benefits of risk
25th
-9-2484
50th
-59111511
75th
118162015
25th
-104-59-4-19-12
50th
-89-521-13-7
75th
-59-2811-14
25th
-37-60-3-15-10
50th
-24-550.5-9-6
75th
-1-351025
A2B1A1B
IPCC - South Asia Rohini Basin
SeasonDec - FebMarch – MayJune – AugSept – NovAnnual
| TABLE 1 | Comparison of the interquartile IPCC projections for the South Asia with the down-scaledinterquartile projections for the Rohini Basin
321
Refle
ction
s on t
he Va
lue of
the C
ost-B
enefi
t Ana
lysis P
roce
ss
reduction in the Rohini Basin, with implications for the identification of appropriatestrategies. In the Rohini Basin drought case, the economic viability of insurancemechanisms appears likely to decline as climate change proceeds. Hence, otherstrategies such as increasing reliance on groundwater irrigation or other physicalcourses of action for risk reduction are likely to be increasingly important. In addition,when incorporated in cost-benefit analyses of flood management options, down-scalingscenario results suggest that people-centred strategies are more likely to generaterobust economic returns than long-term structural measures for flood control.
322
Catalyzing Climate and Disaster Resilience: Processes for
Identifying Tangible and Economically Robust Strategies
Summary
As the cases presented in this report clearly illustrate, disaster risk reduction can“pay”. Whether or not disaster risk management generates returns that justify publicinvestment, however, depends on the details of the specific strategy implemented. Inorder to generate positive economic returns at a level that competes effectively withother avenues for public investment, risk management strategies need to be tailoredto specific contexts. They also need to reflect the best possible knowledge regardingthe impacts of climate change on regions. These impacts can fundamentally changethe returns to different strategies and their resilience as conditions change. As aresult, despite the inherent uncertainties in projecting the impacts of climate changeat local levels, evaluation is essential.
Overall, when conducted though an open and transparent process cost-benefit analysisprovides a useful tool for supporting decision-making and policy development fordisaster risk reduction. However, the limitations and complexities in applying cost-benefit analysis should also be considered. This is particularly true for weather relateddisasters where climate change processes make it difficult to characterize futureconditions.
In the Uttar Pradesh flood study, the simplified estimation of the costs and benefits ofembankments seemed relatively straightforward, but it was challenged by issues oflack of proper embankment maintenance and assumptions needed to estimatecategories of losses (e.g. housing, crops, wages) under changing climatic conditions.The costs and benefits of people-centred strategies are very difficult to assess, asassumptions are made not only at the household level but also with regard tocompound impacts of multiple interventions. Add to this the great uncertainty in thedata, in the assumptions and analysis, as well as in the intervention disbenefits, and itis clear that results of cost-benefit analyses are themselves highly uncertain. Thisuncertainty is even more pronounced when climate change is taken into consideration.To draw reasonable and reliable conclusions, final numbers must be treated in termsof order of magnitude.
323
Refle
ction
s on t
he Va
lue of
the C
ost-B
enefi
t Ana
lysis P
roce
ss
In addition to helping evaluate the economic returns to different strategies, if conductedin a participatory transparent manner, cost-benefit analysis can make a substantivecontribution to the identification, the evaluation and ultimately to the implementationof approaches to disaster risk management under changing climatic conditions. Inparticular, the process of conducting an open and transparent cost-benefit analysiscan enable the organisations involved to clearly identify the assumptions underlyingproposed strategies and the degree to which available data actually substantiate theireffectiveness. By bringing multiple stakeholders to the table around a tangible, policyrelevant activity, the process can also serve as a catalyst and provide a framework fordifferent organisations and sectors to contribute substantively to the evaluation ofdifferent strategies. This process begins to address the challenges inherent incoordinating activities across sectors and scales. It could also contribute to the creationof a learning environment particularly because cost-benefit analysis outcomes—thatis, the returns estimated for different strategies—have direct relevance for theallocation of public finances either at a national level or within organisations. As aresult, unlike in many other arenas where coordination is needed, organisations andsectors should have a strong incentive to participate and to learn from past experience.
A major limitation of conventional approaches to cost-benefit analysis is that ithistorically has not been designed to capture distributional issues of who benefits andwho loses, nor non-monetisable aspects of disaster risk reduction interventions. Forthis reason, it should not be viewed as a stand-alone decision-making metric, butinstead be used in conjunction with vulnerability-based stakeholder-driven processes.Conventionally, cost-benefit analysis focuses on evaluating the overall economicreturns to an investment at a societal level. It does not assist in the targeting of activitiestoward particularly vulnerable or at-risk communities. As a result, to complementconventional approaches, qualitative evaluation provides insights into the perceptionsand needs of diverse stakeholders as well as the varied benefits and impacts of potentialdisaster risk reduction strategies on different locations and communities. Elementssuch as equity, gender, and historical perspectives are best understood throughqualitative methods. The inclusion of vulnerability analysis in our methodology andin each of the case studies presented here represents an initial step in this direction.However, the development of techniques that clearly illustrate the distribution ofcosts and benefits according to wealth, hazard exposure, gender and other factors isessential if cost-benefit analysis is to become more generally useful as a tool to supportdecision-making.
The real benefit from cost-benefit analysis for the analysis of disaster risk reductionand climate adaptation options lies in the framework and the open, transparent,participatory process used. The approach provides a logical and transparent frameworkfor organizing and reviewing assumptions. It also provides a way for key stakeholdersto evaluate trade-offs and the implications of their own assumptions. This isparticularly important for evaluating the implications of climate change for localareas. Cost-benefit analysis combined with the down-scaling of results from climatechange scenarios can help operationalize and promote dialogue between ministries,
324
Catalyzing Climate and Disaster Resilience: Processes for
Identifying Tangible and Economically Robust Strategies
departments and organisations to promote the integration of their policies andprogrammes. The process of conducting a cost-benefit analysis is particularly effectivewhen it proceeds systematically from initial qualitative evaluation to quantificationand then returns to qualitative analysis. This sequence enables: First the identificationof potential risk management strategies and the likely cost and benefit areas: Second,the production of detailed quantitative estimates of those costs and benefits; andThird, the systematic evaluation of quantitative estimates in the light of the oftenmany and important factors where the data required for quantification are lacking orwhere quantification is inherently impossible.


9 7 8 9 9 3 7 2 1 2 7 4 8
Economically Robust Strategies
Disaster Resilience