Catalytic converters and - EPA Archives · Catalytic converters and ... nutrients/water ... Slides...
12
Transcript of Catalytic converters and - EPA Archives · Catalytic converters and ... nutrients/water ... Slides...

1
Catalytic converters and checkerspot butterflies:
air quality impacts of vehicular ammonia
emissions
Stuart B. WeissStuart B. Weiss
Creekside Center for Earth Creekside Center for Earth
ObservationsObservations
NThe biggest global change The biggest global change
nobody (almost) has ever nobody (almost) has ever
heard ofheard of
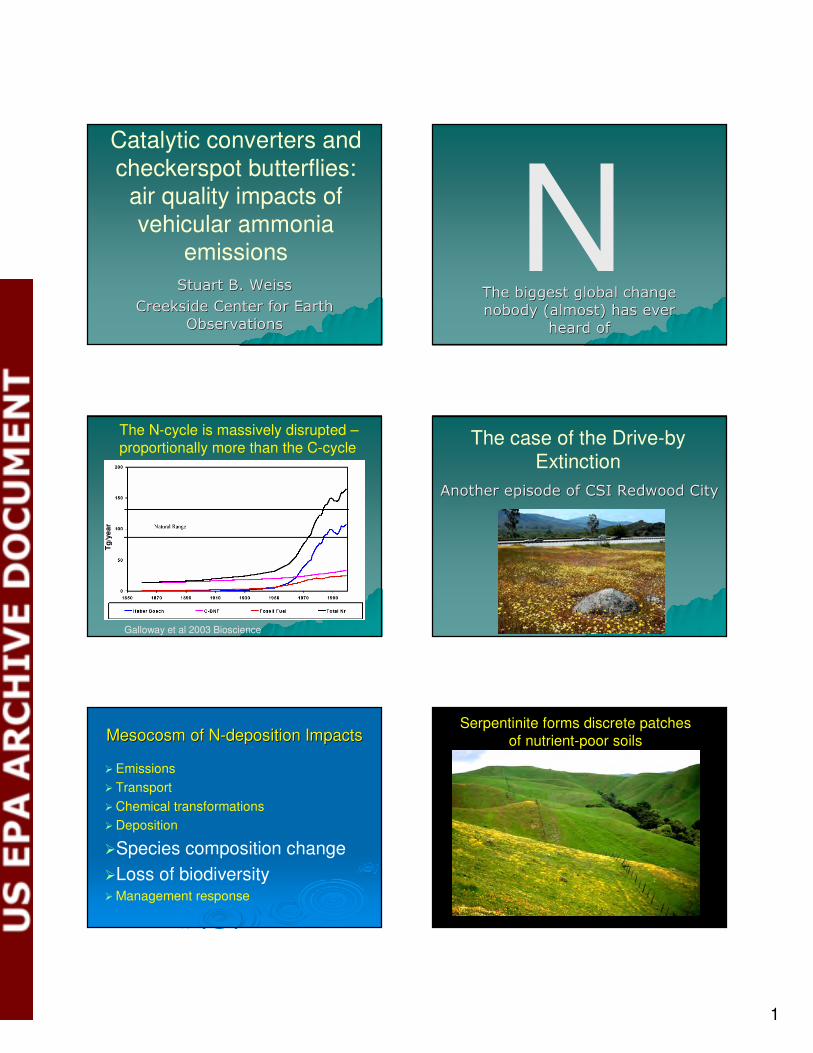
The N-cycle is massively disrupted –proportionally more than the C-cycle
Tg
/ye
ar
Galloway et al 2003 Bioscience
The case of the Drive-by Extinction
Another episode of CSI Redwood CityAnother episode of CSI Redwood City
Mesocosm of NMesocosm of N--deposition Impactsdeposition Impacts
� Emissions
� Transport
� Chemical transformations
� Deposition
�Species composition change
�Loss of biodiversity� Management response
Serpentinite forms discrete patches of nutrient-poor soils

2
Charismatic meso-invertebrate
Hostplants and Nectar Sources Charismatic microflora
3
Charismatic mega-vertebrate
Well mapped,
Population biology of the butterfly well understood
Needs large areas with
diverse topography
(topoclimate, microclimate)
5000+ acres on Coyote Ridge
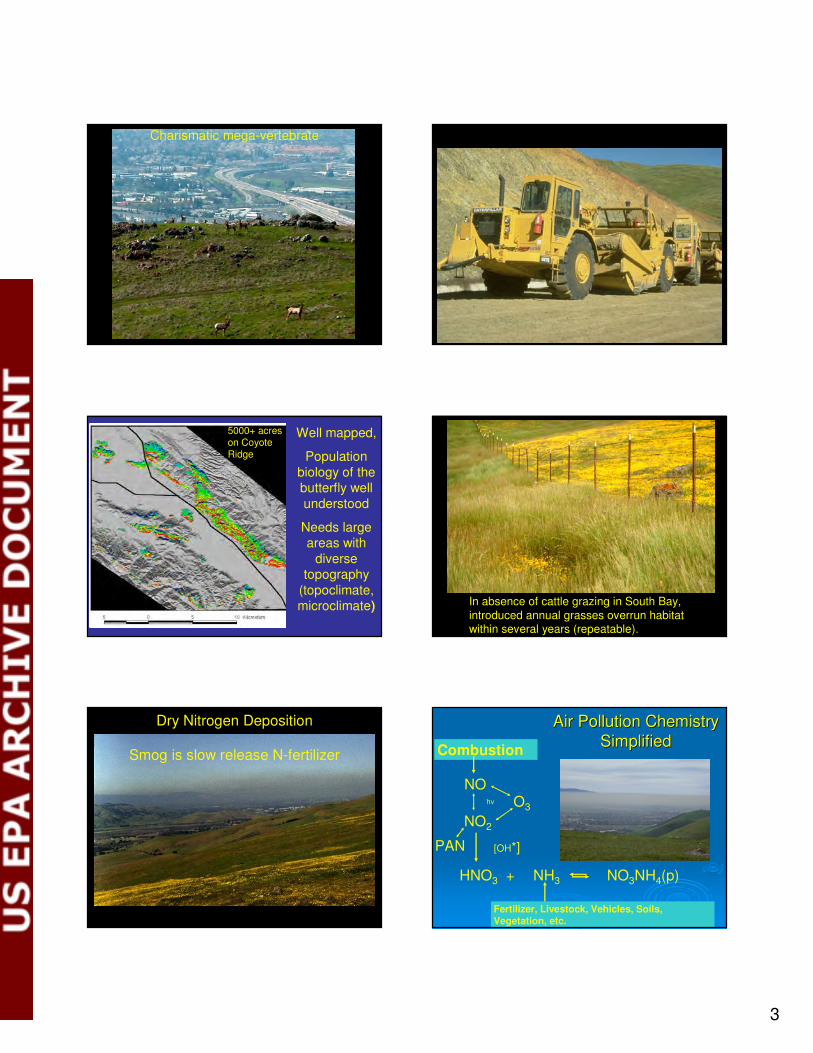
In absence of cattle grazing in South Bay, introduced annual grasses overrun habitat within several years (repeatable).
Dry Nitrogen Deposition
Smog is slow release N-fertilizer
Air Pollution ChemistryAir Pollution Chemistry
SimplifiedSimplified
O3
NO2
HNO3 +
hv
NH3
NO
[OH*]
NO3NH4(p)
Combustion
Fertilizer, Livestock, Vehicles, Soils, Vegetation, etc.
PAN

4
Metcalf Energy Center
124 tons NOx
per year
<116 tons NH3
per year
Worst-case scenario modeling, all emissions as HNO3
Former-future Cisco World HQ
230 tons NOx/year, ~20 tons ammonia
Incipient Coyote Valley Urbanization
Widening Highway 101
250 acres, Kirby Canyon Trust, long-term lease131 acres MEC, $1.4 million management endowment – SVLC540 acres (2005) for highway mitigation + ~$700,000 endowment, management by SCCOSA80 acres (2002-2004) strategic freeway frontage, ~$650,000 endowment from 2 other power plants - SVLCMitigation marketSanta Clara County HCP/NCCP
Coyote Valley Specific Plan
Conservation So Far
Dry deposition – Dominant in California
Operation Flower Power

5
Dry deposition – Dominant in California
CongressmanJerry McNerney (2005)
Edgewood Natural PreserveEdgewood Natural Preserve
Proposed for golf course
1981-1994 “Epic”battle to stop it
“Natural Preserve”status in 1994
Hands off management of serpentine grassland
9,000 larvae in 1997, 9,000 larvae in 1997, The last larva in 2002The last larva in 2002 Passive Sampling
Dr. Andrzej Bytnerowicz, USDA FS Riverside, CA
1-3 EW5 RCAQ
4 JRSJAQ
6 Tulare
7-8 KC
Nov-April wet season May-Oct dry season

6
EW400E
EWEastEWWest
Highway 280 carries 114,000 vehicles per day (2003)
Mostly LDV (includes SUV)
All results are completely compatible with known emissions sources, atmospheric transport and chemistry (come back to later)
July 2002 – June 2003 (monthly bars) July 9 2002 - Jul 1 2003
0
5
10
15
20
EW
-Wes
t
EW-E
ast
EW
-400
E JR
RCA
Q TH
KC-L
ow
KC-H
igh
kg
-N/h
a HNO3
NH3
NO2
Simple deposition model, monthly average deposition velocities for wet and dry season.
HNO3>NH3>>NO2>>>NONH3 deposition to Italian ryegrass canopy measured = 16.7 mm/s (Sommer, S. G. & Jensen, E. S. 1991. Journal of
Environmental Quality 20, 153-156.)
Transects
0
0.2
0.4
0.6
0.8
1
1.2
1.4
1.6
1.8
2
-200 0 200 400 600
W Meters from I-280 E
log(C
ove
r+1
)
Plantago
Lolium
Edgewood 2001Edgewood 2001� Lolium cover higher on thicker soils (more
nutrients/water available), Plantago opposite
3
10
30
100

7
0.25
0.3
0.35
0.4
0.45
0.5
0.55
0.6
0.65
0.7
Avg %
N (
Acid
ifie
d)
-400 -200 0 200 400 600
distance from center (est.)
-7
-6
-5
-4
-3
-2
-1
0
1
Avg
d1
5N
(A
cid
ifie
d)
-400 -200 0 200 400 600
distance from center (est.)
50
75
100
125
150
175
200
Avg C
:N R
atio (
Acid
ifie
d)
-400 -200 0 200 400 600
distance from center (est.)
% N Lolium
1.5
2
2.5
3
Avg %
C (
Acid
ifie
d)
-400 -200 0 200 400 600
distance from center (est.)
C/N Ratio Lolium
d15N Lolium
% C Soil
10 hectares of degraded habitat = 2.5 cows….
Restoration ExperimentsRestoration Experiments
�� SmallSmall--scale (700 mscale (700 m22), replicated), replicated
�� Fire Fire –– Three strikes and your outThree strikes and your out……spring spring
burns workburns work
�� Goat grazing Goat grazing –– Expensive, not selective Expensive, not selective
nor effectivenor effective
�� Mowing Mowing –– Effective, known costs and Effective, known costs and technologytechnology
�� Seeding Seeding PlantagoPlantago appears unnecessaryappears unnecessary
Well-timed weed whacking
Passes the “O-test”
0
5
10
15
20
25
Control Mowed
% c
ov
er
2001200220032004
0
10
20
30
40
50
60
70
Control Mowed
% c
ov
er
Plantago
Lolium

8
2003
2005
2006
Reintroduction in 2007
Regulatory ecosystem
White-rayed Pentachaeta at long-term risk? Only known occurrence west of 280 across from Edgewood Preserve, absent less than 75 meters from freeway except on rock lenses !
!
!
!!
!
!
!
!
!!!
!
!
!
!
!
!
!
!
!!!
!
!
!!
!!!!!
!
!
!
!
!
!
!
!
!
!
!
!
!!!
!
!!!!!
!!
!
!
!!!!
!
!
!
!!!
!
!
!
!
!
!
!
!
!
!
!!
!
!
!
!
!
!
!
!!
!!
!
!
!!
!
!
!
!
!
!
!!!
!
!!!
!!
!!
!!
!
!!!!
!
!
!
!
!
!
!!
! !
!
!!
!
!
!
!
!!
!
!!
!
!
!
!!! !!!!
!!!!!!
!
!
!
!
!!!!
!!!
!!
!
!
!
!
!
!
!
!
!
!
!!!
!
!
!
!
!
!
!
!
!
!
! !
!
!!
!
!
!
!!
!!!
!
! !!!!
!
!
!
!
!
!
!
!
!
! !!
! !!!
!
!
!!
!!
!!!!!!!!!!!!
!!
!
!!!
!
!!
!!
!!!
!
!
!
!!
!
!
!!
!!!
!
!
!
!
!!
!!
!!!
!
!
!
!
!
!
!
!
!
!
!
!!
!
!
!
!
!
!
!
!
!!
!
!
!!
!!!
!
!
!
!!!!!!!
!
!
!!
!!
!!!
!
!!!!
!
!
!!
!
!
!
!
!
!
!!
!
!
!
!
!
!!
!!
!
!
!
!
!
!
!
!!
!
!
!
!
!!!!
!!!!!
!!
!!
!!
!
!
!!
!
!!
!
!!
!
!!!!!
!
!
!
!!
!
!
!
!
!
!!!!!!
!!
!!!!!!!!!!!!!
!!
!!!!!!!!!!!!!!!!!!!!!!!!!!!!
!!
!
!!!!!
!
!
!
!
!!!!!!
!!!!!!!!!
!!!! !!!!!!
!!!!!
!!!
!!
!
!
!
!!
!!
!
!
!!!!
!
!!
!
!
!!!
!!
!
!
!
!
!!
!
!
!!
!!!
!!! !!
!
!
!!
!
!
!
!
!
!
!
!!!!
!
!!!!
!
!!!!!!!!!
!!
!
!
!
!!
!
!
!
!
!
!
!!
!!!
!!!!
!!!
!
!
!!
!!
!
!!!!!!!!!!!!!!!!!!!!!!!!!!
!
!!!!
!
!!!!
!
!!!!!
!
!!!!!!
!
!
!
!
!!!!!
!
!
!!
!!
!!
!
!!
!!
!
!
!
!
!
!
!
!!!!!!
!!!!!!!
!!
!!!!!
!
!
!
!
!!!!!!!!!
!
!!!
!!!
!
!!!!!!!!!!!!!!!!!!!!!!
!
!!!
!!
!!!!!!!!
!!
!! !
!
!
!
!
!
!!!!!!
!!!
!
!
!
!
!!!!!!
!
!!!!
!
!!
!
!
!!!!!!!!!!!!!!!!!!
!!!!
!!!
!
!
!!!!!!!!!!!!
!!
!!
!!
!!!
!
!
!!!
!
!!!
!!!
!
!!!!
!
!!
!
!!!!
!
!!!!!
!
!
!
!
!!
!
!
!!!! !!!
!
!!
!
!
!
!!
!
!
!!
!!
!
!
!
!
!
!
!
!
!
!
!
!
!
!!!
!
!
!
!!
!
! !
!
!
!
!
!
!
!
!!!
!
!
!
!
!!!!
!
!
!
!
!
!
!
!!!
!
!!!!
!
!
!!!
!!!
!
!!!!!!
!!!
!
!
!
!
!!
!
!
!
!
!
!!
!
!
!
!
!
!
! !
!
!
!
!
!
!
!
!
!
!!!
!
!
!
!!!!
!
!
!!
!
!
!!
!
!!
!
!!!!!
!
!
!!!!!!!!!!!
!
!!
!
!
!
!!
!
!
!
!
!
!
!!
!!!!!!
!!!
!
!!
!
!
!
!
!
!
!!!
!
!
!
!!
!
!
!
!
!
!
!!!!
!!!!! !!!!
! !!
!
!
!
!
!
!
!
!
!
!!!
!
!!!
!
!
!
!!!
!
!!
!
!
!
!!!!!!!!
!
!!
!
!
!!!!!
!!!!!!!!!!!!!!!!
!
!
!
!
!
!
!
!
!!!!!!!!!!!!!!
!
!
!!!
!
!
!
!
!
! !
!!
!
!
!
!!!
!
!!!
!
!
!
!!!
!!
!!!!
!
!!!
!
!!
!
!!
!!
!!!
! !!!
!
!
!
!
!!
!!
!
!
!
!!!
!
!
!!
!
!
!
!!
!
!
!!
!!!!!!!!!!!!!
!
!
!
!
!
!!
!
!
!
!
!
!!!
!
!
!
!
!!!!!!!!!!!!!!!!!!!!
!!!
! !!!!
!!
!
!! !
!
!
!
!
!
!
!
!!
!
!
!
!
!! !
!
!
!
!
!
!
!
!
!
!
!
!
!
!
!
!!
!
!
!
!
!
!
!
!!
!!!
!
!!!
!
!!
!
!
!
!
!
!
!
!!!!
!!
!
!
!
!!
!
!
!
!
!
!
!
!
!
!
!
!
!!
!!!
!
!!!
!
!
!!
!
!!
!
!
!!!!!!!
!
!!
!
!!!!!!!!!!
!
!!!!!!!!!!!!!!!!!!!!!!!!!!!!
!!!!!!!!!!!!!!!!!!!!!!!!!!!!!!!!!!!!!!!!!!!!
!!!!!!!!!!!!!!!!! !!!!!!!!!!!!!!!!!!!!!!!!!!!!!!!!!!!!!!!!!!!!!!!
!!
!
!
!
!
!
!
!
!
!!
!!
!!
!!
!!
!!
!!
!
!!
!
!
!
!
!!!
!
!
!
!
!
!!!!!
!
!!!!!!
!
!!
!!
!!
!!
!!!!
!
!!!!!!!
!
!!!!
!
!!
!
!!!!!!!!!!
!
!
!
!!!!!!!!!!
!!!
!
!
!!
!!!!!!!
!!
!!
!!
!
!
!!
!!!!!!!!!
!!!
!
!
!!
!!!!!
!
!
!
!
!!
!
!!!
!
!
!
!!!
!!!
!
!!
!!!
!
!
!
!
!
!!!!
!!
!!
!
!
!
!
!
!!
!!!!
!
!
!!
!
!!!!!!!!!!
!!
!!!!
!!
!!!!!
!!
!
!
!
!
!
!
!
!!!!
!
!
!
!!
!!!!!!!
!
!
!
!!
!!
!
!
!!
!
!
!
!
!
!
!
!!!!!!!!
!
!!!!!
!!
!!!!!!!!!! !
!
!!!!!
!
!!
!
!
!!
!!
!!!!!!!!!!
!
!
!
!!
!!
!
!
!
!!
! !
!
!
!!
!!!
!!!
!!!
!
!!
!!!
!!!!!!!
!!!!!!
0 100 200 300 40050Kilometers
.
T&E Taxa N−dep 5 kg−N ha−1 year−1
T&E Species Mean N-dep
0
50
100
150
200
250
0 5 10 15 20
kg-N ha-1
year-1
Co
un
t
99/225 listed T&E plant species > 5 kg-N ha-1 yr-1
�Weiss 2006 CEC PIER Report
Biogeochemical phenomenon

9
San Jose AQ NH3 5.9 ppb in December
July 2002 – June 2003 (monthly bars)
July 9 2002 - Jul 1 2003
0
5
10
15
20
EW
-Wes
t
EW-E
ast
EW-4
00E JR
RCA
Q TH
KC-L
ow
KC-H
igh
kg
-N/h
a HNO3
NH3
NO2
Chemical climateChemical climate
I = PAT
� Impact = Population X Affluence X Technology
� Population: Number of vehicles
� Affluence: speed and size of vehicles
� Technology: emissions systems
?
60
Grams NOx per km
Fleet Emissions
0.00
0.50
1.00
1.50
2.00
0 20 40 60 80 100 120kph
g N
Ox/k
m
603510
?
75
CARB Emissions Reduction MethodologyCARB Emissions Reduction Methodology
20002000--20052005
Ammonia from Cars?
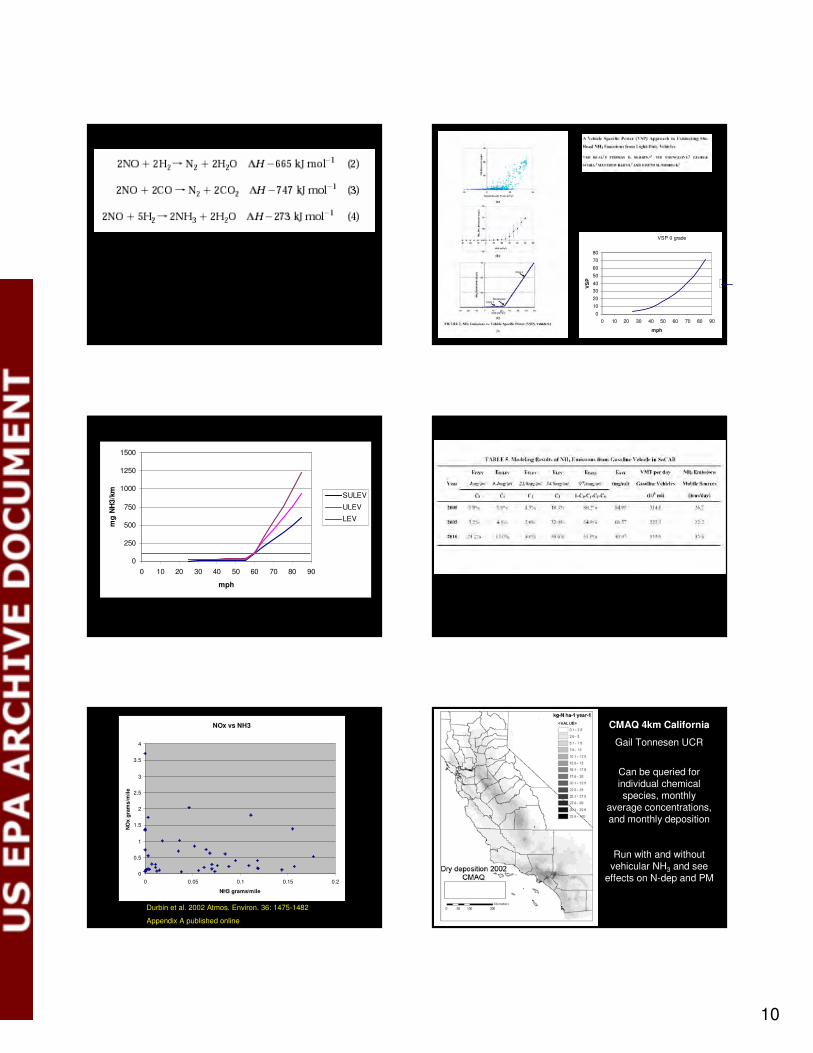
� 1990+ catalytic converters over-reduce NOx when running fuel rich
� Function of Vehicle Specific Power
� 1.8 - 6+ Mg/km/year for Highway 280
� Highly variable from vehicle to vehicle, 10% of vehicles produce 50% of emissions
Baum et al. 2001 Env. Sci. Tech 35: 3635-3741
Roadside laser on freeway on ramp, 46-55 mph
94 +/- 8 mg-NH3 km-1
SoCAB tons/day Vehicles: 44 Livestock: 27-30All Sources: 165-218
10
VSP 0 grade
0
10
20
30
40
50
60
70
80
0 10 20 30 40 50 60 70 80 90
mph
VS
P
0
250
500
750
1000
1250
1500
0 10 20 30 40 50 60 70 80 90
mph
mg
NH
3/k
m
SULEV
ULEV
LEV
NOx vs NH3
0
0.5
1
1.5
2
2.5
3
3.5
4
0 0.05 0.1 0.15 0.2
NH3 grams/mile
NO
x g
ram
s/m
ile
Durbin et al. 2002 Atmos. Environ. 36: 1475-1482
Appendix A published online
CMAQ 4km California
Gail Tonnesen UCR
Can be queried for individual chemical species, monthly
average concentrations, and monthly deposition
Run with and without vehicular NH3 and see
effects on N-dep and PM

11
Chemical Climate Change
Total cumulative dose over 40 years =
hundreds of kg-N ha-1
More immediate than climate change, driving
weed invasions
4 km CMAQ map provides basis for
regional and subregional analyses
Is available
0 10 20 30 40 505
Kilometers
Dry deposition 2002 CMAQ
not for release08/2005
kg−N ha−1 year−1
0.1 − 2.5
2.6 − 5
5.1 − 7.5
7.6 − 10
10.1 − 12.5
Trends in NO2 Annual Average in Select California
Counties
0.00
0.02
0.04
0.06
0.08
1980
1982
1984
1986
1988
1990
1992
1994
1996
1998
pp
m N
O2
Santa Clara
San Mateo
San Francisco
Alameda
Los Angeles
Orange
SanBernardino
Fresno
Kern
Sacramento
2001 California Almanac of Emissions and Air Quality
EPA Standard
NOx Emissions
0
20
40
60
80
100
120
140
160
180
1975 1980 1985 1990 1995 2000 2005 2010
To
ns/d
ay Santa Clara
San Mateo
San Francisco
Problem is not going away soon
2001 California Almanac of Emissions and Air Quality
Agenda: Make it better
� CARB study – meeting with Jerry Hill
� How did we get here, what is current impact on health and welfare, and where are we going?
� EPA funding?
� Run CMAQ w/o vehicular ammonia, effect on N-deposition and PM
� Ammonia monitoring network (passive)
� Detailed freeway study along I-280, modeling, measurement, and calibration
� Other freeway sites, CAFOs, etc.


![I.Gasser,M. Rybicki,Universit¨atHamburg€¦ · combustion in the catalytic converters friction in the catalytic converters due to honeycomb structure ˜x[m] y˜[m] 0 0.1-0.1 0 0.5](https://static.fdocuments.net/doc/165x107/603df1c8240db44e03022001/igasserm-rybickiuniversitathamburg-combustion-in-the-catalytic-converters.jpg)