Catalytic Conversion of Glycerol to Value-Added Liquid...
166
Catalytic Conversion of Glycerol to Value-Added Liquid Chemicals A Thesis Submitted to the College of Graduate Studies and Research in partial fulfilment of the requirements for the degree of Master of Science in the Department of Chemical Engineering University of Saskatchewan Saskatoon, Saskatchewan By Kapil Dev Pathak Copyright Kapil Dev Pathak November 2005 All Rights Reserved
Transcript of Catalytic Conversion of Glycerol to Value-Added Liquid...

Catalytic Conversion of Glycerol to Value-Added Liquid Chemicals
A Thesis Submitted to the College of Graduate Studies and Research
in partial fulfilment of the requirements for the degree of
Master of Science
in the Department of Chemical Engineering
University of Saskatchewan
Saskatoon, Saskatchewan
By
Kapil Dev Pathak
Copyright Kapil Dev Pathak November 2005
All Rights Reserved

i
COPYRIGHT
The author has agreed that the Libraries of the University of Saskatchewan may
make this thesis freely available for inspection. Moreover, the author has agreed that
permission for extensive copying of this thesis for scholarly purposes may be granted by the
professor(s) who supervised this thesis work recorded herein or, in their absence, by the
Head of the Department of Chemical Engineering or the Dean of the College of Graduate
Studies. Copying or publication or any other use of the thesis or parts thereof for financial
gain without written approval by the University of Saskatchewan is prohibited. It is also
understood that due recognition will be given to the author of this thesis and to the
University of Saskatchewan in any use of the material of the thesis.
Request for permission to copy or to make other use of material in this thesis in
whole or parts should be addressed to:
Head
Department of Chemical Engineering
University of Saskatchewan
57 Campus Drive
Saskatoon, Saskatchewan
S7N 5A9
Canada
ii
ABSTRACT
Glycerol is one of the by-products of transesterification of fatty acids for the
production of bio-diesel. Value-added products such as hydrogen, wood stabilizers and
liquid chemicals from catalytic treatment of glycerol can improve the economics of the
bio-diesel production process. Catalytic conversion of glycerol can be used for
production of value-added liquid chemicals. In this work, a systematic study has been
conducted to evaluate the effects of operating conditions on glycerol conversion to
liquid chemical products in the presence of acid catalysts.
Central composite design for response surface method was used to design the
experimental plan. Experiments were performed in a fixed-bed reactor using HZSM-5,
HY, silica-alumina and γ-alumina catalysts. The temperature, carrier gas flow rate and
weight hourly space velocity (WHSV) were maintained in the range of 350-500 oC, 20-
50 mL/min and 5.40-21.60 h -1, respectively.
The main liquid chemicals detected in liquid product were acetaldehyde, acrolein,
formaldehyde and hydroxyacetone. Under all experimental conditions complete glycerol
conversion was obtained over silica-alumina and γ-alumina. A maximum liquid product
yield of approximately 83 g/100g feed was obtained with these two catalysts when the
operating conditions were maintained at 380 oC, 26 mL/min and 8.68 h-1. Maximum
glycerol conversions of 100 wt% and 78.8 wt% were obtained in the presence of HY
and HZSM-5 at temperature, carrier gas flow rate and WHSV of 470 oC, 26 mL/min and
8.68 h-1. HY and HZSM-5 produced maximum liquid product of 80.9 and 59.0 g/100 g
feed at temperature of 425 and 470 oC, respectively.
Silica-alumina produced the maximum acetaldehyde (~24.5 g/100 g feed) whereas
γ-alumina produced the maximum acrolein (~25 g/100 g feed). Also, silica-alumina

iii
produced highest formaldehyde yield of 9g/100 g feed whereas HY produced highest
acetol yield of 14.7 g/100 g feed. The effect of pore size of these catalysts was studied
on optimum glycerol conversion and liquid product yield. Optimum conversion
increased from 80 to 100 wt% and optimum liquid product increased from 59 to 83.3
g/100 g feed when the pore size of catalyst was increased from 0.54 in case of HZSM-5
to 0.74 nm in case of HY, after which the effect of pore size was minimal.

iv
ACKNOWLEDGMENT
I wish to express my gratitude to Dr. A. K. Dalai and Dr. N.N. Bakhshi whose
guidance throughout my graduate program has contributed immensely to the success of
this work. I am also indebted to other members of the advisory committee, Drs. R. Evitts
and H. Wang for their helpful discussions and suggestions.
I thank Messrs. T. Wallentiny, R. Blondin and D. Cekic of the Chemical
Engineering Department for their technical assistance at various stages of this work and
K. Thoms of the Department of Chemistry for his help with the GC-MS analysis. I
express my sincere appreciation to all the members of the Catalysis and Chemical
Reaction Laboratories, especially Dr. D. Ferdous for all the useful discussions and
suggestions.
The financial assistance from the Natural Resources Canada and Canada
Research Chair (CRC) Program is gratefully acknowledged.

v
DEDICATION
This work is dedicated to
My Parents

vi
TABLE OF CONTENTS
COPYRIGHT i
ABSTRACT ii
ACKNOWLEDGMENT iv
DEDICATION v
TABLE OF CONTENTS vi
LIST OF TABLES x
LIST OF FIGURES xii
ABBREVIATIONS xv
1 INTRODUCTION 1
1.1 Research objectives 2
1.1.1 Phase I: Catalysts characterization 3
1.1.2 Phase II: Catalyst performance evaluation 3
1.1.3 Phase III: Effect of physiochemical properties on catalysts’ activity 3
2 LITERATURE REVIEW 4
2.1 Glycerol production and consumption 4
2.2 Glycerol as by-product of biodiesel 4
2.2.1 Biodiesel potential in Canada 6
2.2.2 Making biodiesel a competitive fuel 7
2.3 Value added products from glycerol 7
2.3.1 Production of hydrogen and syn-gas from glycerol 8
2.3.2 Production of liquid chemicals from glycerol 10
2.4 Chemistry of glycerol cracking 12

vii
2.5 Selection of catalyst for catalytic conversion of glycerol 14
2.5.1 Structure and catalytic properties of HZSM-5 14
2.5.2 Structure and catalytic properties of Y- zeolite 16
2.5.3 Structure and catalytic properties of silica-alumina 17
2.5.4 Structure and catalytic properties of γ-alumina 17
2.6 Catalyst Deactivation 19
3 EXPERIMENTAL 20
3.1 Catalysts for glycerol treatment 20
3.2 Catalyst characterization 21
3.2.1 Temperature programmed desorption (TPD) 21
3.2.2 Powder X-ray diffraction (XRD) 22
3.2.3 BET surface area, pore size and pore volume 23
3.2.4 Scanning electron microscopy (SEM) 23
3.2.5 Fourier transformed infrared spectroscopy (FTIR) 23
3.3 Experimental program 24
3.3.1 Statistical design of experiments 24
3.3.1.1 Test of significance of the model 28
3.3.1.2 Test of significance of individual model coefficients 28
3.4 Experimental setup for catalytic conversion of glycerol 28
3.5 A typical experimental run 31
3.6 Analysis of products 32
3.6.1 Gas product analysis 32
3.6.2 Typical gas product analysis 33
3.6.3 Liquid product analysis 33
3.6.4 Typical liquid product analysis 34
4 RESULTS AND DISCUSSION 35
4.1 Catalyst characterization 35
4.1.1 Temperature programmed desorption (TPD) 35

viii
4.1.2 X-Ray diffraction (XRD) 37
4.1.3 BET surface area and pore size 37
4.1.4 Scanning electron microscope (SEM) 96
4.1.5 Fourier transformed infrared spectroscopy (FTIR) 40
4.2 Catalyst performance studies on glycerol conversion, liquid, gas and char yield and acetaldehyde, acrolein, formaldehyde and acetol yields 42
4.2.1 Statistical analysis of experimental data for glycerol conversion 43
4.2.2 Statistical analysis of experimental data for liquid product yield 51
4.2.3 Statistical analysis of experimental data for product yield of liquid components 60
4.2.3.1 Acetaldehyde yield 61
4.2.3.2 Acrolein yield 67
4.2.3.3 Formaldehyde yield 72
4.2.3.4 Acetol yield 78
4.2.4 Statistical analysis of experimental data for gas product yield 83
4.2.5 Statistical analysis of experimental data for char and residue product yield 88
4.3 Effect of physiochemical properties of catalysts on optimum glycerol conversion, liquid product yield and acetaldehyde, acrolein, formaldehyde and acetol yields 93
4.3.1 Effect of catalyst acidity 93
4.3.2 Effect of catalyst pore size 96
4.4 Implication of experimental results 99
5 CONCLUSIONS AND RECOMMENDATIONS 103
5.1 Conclusions 103
5.2 Recommendations 104
6 REFERENCES 106
7 APPENDICES 112
Appendix A: Experimental results for glycerol conversion over HZSM-5 112

ix
Appendix B: Experimental results for glycerol conversion over HY 115
Appendix C: Experimental results for glycerol conversion over silica-alumina 118
Appendix D: Experimental results for glycerol conversion over γ-alumina 121
Appendix E: Liquid, gas and char product yield results 124
Appendix F: Acetaldehyde, acrolein, formaldehyde and acetol yields over
different catalysts 127
Appendix G: ANOVA Table for different responses 131
Appendix H1: Calibration curves for flow meter and syringe pump 139
Appendix H2: GC calibration curves for gaseous and liquid products 140
Appendix H3: Sample calculations for mass balance 149

x
LIST OF TABLES
Table 3.1 Design of experiments obtained from Design expert Software 6.0.1 27
Table 4.1 BET surface area, pore size and pore volume of different catalysts 39
Table 4.2 Reproducibility experimental results for liquid, gas and char yield from
glycerol conversion over HZSM-5 45
Table 4.3 Reproducibility of experimental results for product yields of different
liquid chemicals over HZSM-5 45
Table 4.4 Significant model coefficients to predict glycerol conversion over
HZSM-5 and HY 46
Table 4.5 Predicted and experimental maximum glycerol conversion over
HZSM-5 and HY at optimum conditions 50
Table 4.6 Significant model coefficients to predict liquid product yield over
different catalysts 54
Table 4.7 Predicted and experimental maximum liquid product yield under
optimum conditions using different catalysts 59
Table 4.8 Significant model coefficients to predict acetaldehdye yield over
different catalysts 62
Table 4.9 Optimum operating conditions for maximum acetaldehyde yield using
different catalysts 66
Table 4.10 Significant model coefficients to predict acrolein yield over 68
Table 4.11 Optimum operating conditions for maximum acrolein yield using
different catalysts 71
Table 4.12 Significant model coefficients to predict formaldehdye production over
different catalysts 73
Table 4.13 Optimum operating conditions for maximum formaldehyde yield using
different catalyst 77
Table 4.14 Significant model coefficients to predict acetol yield over different
catalysts 79
Table 4.15 Optimum operating conditions for maximum acetol yield using
different catalysts 82

xi
Table 4.16 Significant model coefficients to predict gas product yield over
different catalysts 84
Table 4.17 Optimum operating condition for minimum gas product yield over
different catalysts 87
Table 4.18 Significant model coefficients to predict char and residue over different 89
Table 4.19 Predicted and experimental minimum char and residue yield under
optimum conditions over different catalysts 92
Table 4.20 Total acidity and optimum production of acetaldehyde, acrolein,
formaldehyde and acetol 94
Table 4.21 Boiling points of different components present in liquid product 102
Table 4.22 Estimation of possible value addition based on bulk prices of
chemicals produced in catalytic treatment of glycerol 102

xii
LIST OF FIGURES
Figure 2.1 Distribution of glycerol uses 6
Figure 2.2 Proposed reaction pathways for acetaldehyde and acrolein yield
during supercritical treatment of glycerol 13
Figure 2.3 Typical structure of silica-alumina and the origin of Lewis and
Bronsted acidity 18
Figure 4.1 Temperature programmed desorption (TPD) profiles of different catalysts 36
Figure 4.2 X-ray diffraction patterns for different catalysts 38
Figure 4.3 Pore size distribution for different catalysts 38
Figure 4.4 FTIR spectra of different catalysts in pyridine region 41
Figure 4.5 Time on stream study for different catalysts 44
Figure 4.6 Surface response for glycerol conversion: (a) effect of temperature
and WHSV at carrier gas flow rate of 35 mL/min using HZSM-5;
(b) effect of temperature and carrier gas flow rate at WHSV of 13.50 h -1
using HZSM-5; (c) effect of carrier gas flow rate and temperature at
WHSV of 13.50 h -1 using HY; (d) effect of WHSV and temperature
at carrier gas flow rate of 35 mL/min using HY 47
Figure 4.7 Proposed reaction pathways for catalytic conversion of glycerol 52
Figure 4.8: Response surface for liquid product yield (L): (a) effect of temperature
and carrier gas flow rate at WHSV of 13.50 h -1 using HZSM-5;
(b) effect of temperature and WHSV at carrier gas flow rate of 35 mL/min
using HZSM-5; (c) effect of temperature and carrier gas flow rate at
WHSV of 13.50 h -1 using HY; (d) effect of temperature and WHSV
at carrier gas flow rate of 35 mL/min using HY 55
Figure 4.9 Response surface for liquid product (L): (a) effect of temperature and
carrier gas flow rate at WHSV of 13.50 h -1 using silica-alumina;
(b) effect of temperature and WHSV at carrier gas flow rate of 35 mL/min
using silica-alumina; (c) effect of temperature and carrier gas flow rate
at WHSV of 13.50 h -1 using γ-alumina; (d) effect of temperature and
WHSV at carrier gas flow rate of 35 mL/min using γ-alumina 57

xiii
Figure 4.10 Response surface for acetaldehyde yield: (a) effect of temperature and
WHSV at carrier gas flow rate at of 35 mL/min using HZSM-5;
(b) effect of temperature and WHSV at carrier gas flow rate at of 35
mL/min using HY; (c) effect of temperature and carrier gas flow rate at
WHSV of 13.50 h -1 using silica-alumina; (d) effect of temperature and
carrier gas flow rate at WHSV of 13.50 h -1 using γ-alumina 63
Figure 4.11 Response surface for acrolein yield: (a) effect of temperature and
WHSV at carrier gas flow rate at of 35mL/min using HZSM-5;
(b) effect of temperature and WHSV at carrier gas flow rate of 35 mL/min
using HY; (c) effect of temperature and WHSV at carrier gas flow rate
of 35 mL/min using silica-alumina; (d) effect of temperature and carrier
gas flow rate at WHSV of 13.50 h -1 using γ-alumina 69
Figure 4.12 Response surface for formaldehyde yield: (a) effect of temperature and
carrier gas flow rate at WHSV of 13.50 h -1 using HZSM-5; (b) effect of
temperature and WHSV at carrier gas flow rate of 35 mL/min using HY;
(c) effect of temperature and carrier gas flow rate at WHSV of 13.50 h -1
using silica-alumina; (d) effect of temperature and WHSV at carrier
gas flow rate of 35 mL/min using γ-alumina 74
Figure 4.13 Response surface for acetol yield: (a) effect of temperature and
WHSV at carrier gas flow rate at of 35 mL/min using HZSM-5;
(b) effect of temperature and WHSV at carrier gas flow rate of 35
mL/min using HY; (c) effect of temperature and WHSV at carrier gas
flow rate of 35 mL/ min using silica-alumina; (d) effect of temperature
and WHSV at carrier gas flow rate of 35 mL/min using γ-alumina 80
Figure 4.14 Response surface for gas production: (a) effect of temperature and
WHSV at carrier gas flow rate at of 35 mL/min using HZSM-5;
(b) effect of temperature and WHSV at carrier gas flow rate of 35 mL/min
using HY; (c) effect of temperature and WHSV at carrier gas flow
rate of 35 mL/ min silica-alumina; (d) effect of temperature and WHSV
at carrier gas flow rate of 35 mL/min using γ-alumina 85

xiv
Figure 4.15 Response surface for char and residue: (a) effect of temperature and
WHSV at carrier gas flow rate at of 35 mL/min using HZSM-5;
(b) effect of temperature and WHSV at carrier gas flow rate of 35 mL/min
using HY; (c) effect of temperature and WHSV at carrier gas flow
rate of 35 mL/min using silica-alumina; (d) effect of temperature and
WHSV at carrier gas flow rate of 35 mL/min using γ-alumina 90
Figure 4.16 Effect of total acidity of catalysts on the optimum (a) glycerol
conversion (b) optimum liquid product yield 95
Figure 4.17 Effect of pore size on (a) optimum glycerol conversion (b) optimum
liquid product yield 97
Figure 4.18 Effect of catalyst pore size on optimum yield of acetaldehyde,
acrolein, formaldehyde and acetol 98
Figure 4.19 Scanning electron micrographs for (a) fresh HZSM-5 (b) spent
HZSM-5 (c) fresh HY (d) spent HY 99
Figure 4.20 Scanning electron micrographs for (a) fresh silica-alumina (b) spent
silica-alumina (c) fresh γ-alumina (d) spent γ-alumina 100

xv
ABBREVIATIONS
ANOVA Analysis of Variance
C Carrier Gas Flow Rate, mL/min
CR Char and Residue Yield, g/100 g feed
CT Char and Residue Collected, g
F Glycerol Fed, g
G Gas Product Yield, g/100 g feed
GT Gas Collected, g
L Liquid Product Yield, g/100 g feed
LT Total Liquid Product Including Unconverted Glycerol, g
RSM Response Surface Methodology
T Temperature, oC
TPD Temperature Programmed Desorption
W Weight Hourly Space Velocity, h -1
X Glycerol Conversion, wt%
XRD X-ray Diffraction
SEM Scanning Electron Microscope
FTIR Fourier Transformed Infrared Spectroscopy

1
1 INTRODUCTION
Limited resources of conventional fuels such as petrodiesel have led to the search
for alternative fuels. Recently, there has been a growing concern about the increasing air
pollution caused by the combustion of petrodiesel. In addition, depleting resources of
conventional fuels has caused an increase in its price. Biodiesel is an alternative fuel
produced from renewable sources such as vegetable oil. It has a proven performance for
air pollution reduction. However, the price of biodiesel is presently more as compared to
petrodiesel (Haas, 2005).
Biodiesel is produced through transesterification reaction in which fatty acids
present in vegetable or animal oil are reacted with alcohols. Glycerol is produced as a
by-product in this reaction (Dalai et al., 2000). Higher cost of biodiesel is primarily due
to the raw material cost (Zhang et al., 2003). The economics of biodiesel production may
be improved if value-added products such as hydrogen, synthesis gas or liquid chemicals
may be produced from by-product glycerol. Also, increased production of biodiesel
could lead to glut of glycerol in the market. This may cause the price of glycerol to fall
by as much as 50 percent (Claude, 1998).
The production of value-added chemicals from glycerol may lead to a decrease
in biodiesel prices. Furthermore, it will improve glycerol market. Production of value
added chemicals from glycerol is a cracking reaction. Possible methods for utilization of
glycerol are pyrolysis, steam gasification and catalytic cracking. Pyrolysis is heating of
glycerol to a high temperature in the absence of air. The high temperature makes

2
pyrolysis an energy intensive method of transforming glycerol. Stream gasification is the
co-feeding glycerol with steam. This again needs energy for steam generation. Catalytic
cracking has a unique advantage in that the reaction occurs at low temperatures. Thus,
catalytic cracking is a less energy intensive process.
Thiruchitrambalam et al. (2004) reported that glycerol can be completely
converted into H2 rich syn-gas using pyrolysis at 800 oC in a fixed bed reactor. Cortright
et al. (2002) reported the production of H2 from aqueous phase carbohydrate reforming
of glycerol over Pt/Al2O3 catalysts. H2 yield of 64.8 mol% from glycerol was reported in
this work. Buhler et al. (2002) reported the production of allyl alcohol, acetaldehyde,
acrolein, methanol CO, CO2 H2 from the treatment of glycerol under supercritical
conditions. A low glycerol conversion (0.4-31 wt%) was reported in this work. An
extensive review of literature has been done (see Chapter 2) for value-added products
from glycerol and on the available cracking catalysts such as zeolites, silica-alumina and
γ-alumina.
It appears from literature that there has been no study on the production of liquid
chemicals from catalytic conversion of glycerol at low temperature and atmospheric
pressure. Thus there is a knowledge gap that needs to be filled. This has led to the
following research objectives for the present work.
1.1 Research objectives
The main objective of this work was to study the potential of production of value-
added liquid chemicals such as acetaldehyde, acrolein, formaldehyde and acetol from
glycerol via cracking reaction using HZSM-5, HY, silica-alumina and γ-alumina. These
catalysts were chosen because of their wide range of pore size, total acidity and BET
surface area. Furthermore, HZSM-5, HY and γ-alumina are crystalline whereas silica-

3
alumina is non crystalline material. The overall objective was achieved in the various
phases of research program as described below:
1.1.1 Phase I : Catalyst character ization
The objective of this phase was to study the physiochemical properties of
HZSM-5, HY, silica-alumina and γ-alumina. To achieve this objective, catalysts were
characterized using different techniques such as temperature programmed desorption of
NH3, X-ray diffraction, BET surface area analysis, SEM and FTIR.
1.1.2 Phase I I : Catalyst per formance evaluation
The objective of this research phase was to study the effects of operating
parameters such as temperature, carrier gas flow rate and WHSV on glycerol
conversion, liquid, gas and char yield using HZSM-5, HY, silica-alumina and γ-alumina
catalysts. The operating conditions were optimized to maximize the glycerol conversion,
liquid product yield and yields of liquid chemicals such as acetaldehyde, acrolein,
formaldehyde and acetol for each of the above mentioned catalysts.
1.1.3 Phase I I I : Effect of physiochemical proper ties on catalysts’ activity
In this phase, the effects of catalysts’ physiochemical properties on optimum
glycerol conversion, liquid product yield and yields of acetaldehyde, acrolein,
formaldehyde and acetol were evaluated.
Chapter 2 presents a comprehensive literature review on glycerol uses and
different acid catalysts used for cracking of glycerol. Experimental design and details of
product identification and catalyst characterization are discussed in Chapter 3. Chapter 4
presents the discussion on the experimental results. The conclusions and
recommendations from this work are given in Chapter 5.

4
2 LITERATURE REVIEW
The main aim of this work is to study the potential of production of value-added
liquid chemicals from glycerol. Therefore, a review of the literature has been done to
find out the reported processing methods of glycerol to value-added products. A detailed
review of literature based on sources of glycerol, products obtained from glycerol and
structure and catalytic properties of various acid catalysts is presented in this section.
2.1 Glycerol production and consumption
Glycerol is produced in soap industry from direct saponification. Olechemical
industry is a major source of glycerol production where it is obtained from fat splitting
of glycerides and bio-fuels such as biodiesel. Claude (1998) has indicated various uses
of glycerol in cosmetic, soap, pharmaceutical, food and tobacco industry as shown in
Figure 2.1. The soap and cosmetic industry constituted 28 % whereas polyglycerols,
esters, food and drinks and resale constituted up to 47 % of glycerol utilization. Glycerol
is a topic of research recently and the researchers are keen to find out its alternate
applications for fuels and chemicals (Garcia et al., 1995; Neher et al., 1995; Buhler et
al., 2000; Cortright et al., 2002).
2.2 Glycerol as by-product of biodiesel
Glycerol is a by-product during transesterification of fatty acids to produce
biodiesel (Dalai et al., 2000). Biodiesel is a mixture of fatty acid esters. Typical reaction
to produce biodiesel is given by the following equation:

5
Others 10%
Paper 1%
Esters 13%
Polyglycerols 12%
Tobacco 3%
Cellulose films 5%
Food and drinks 8%
Alkyd resins 6%
Cosmetic/soap and pharmaceuticals 28%
Resale 14%
Figure 2.1: Distr ibution of glycerol uses as of 1995 (Claude, 1998)

6
)1.2(GlycerolestersacidFattyAlcoholdesTriglyceri +→+
Typical feed stocks for biodiesel production are canola and soy oil (Prakash, 1998).
Alcohols used are methanol, ethanol or a mixture of these. During the trans-
esterification reaction about 10 wt% (of fatty acid) glycerol is produced. Production of
glycerol is expected to increase with increase in production of biodiesel (Haas, 2005).
2.2.1 Biodiesel potential in Canada
Prakash (1998) reported that the production of canola and soy oils in 1996 in
Canada was 1,153 million tons and 166,000 tons, respectively. It was assumed that if 10
wt% of canola and soy oil could be used for the production of biodiesel it would result in
277 million liters of biodiesel per year. Furthermore, 108 million liters of biodiesel could
be obtained from tall oil (a by-product from the treatment of pine pulp). This would add
up to a total biodiesel production to 385 million liters per year which in turn would lead
to the production of 38.5 million liters of glycerol per year in the Canadian glycerol
market.
The federal government of Canada has planned to produce 500 million liters of
biodiesel per year by the year 2010 to meet the Kyoto protocol (Smith, 2004). With 10
wt% production of glycerol, this would lead to ~50 million liters of glycerol/year in the
Canadian market. Xu et al. (1996) reported that increasing demand for biodiesel may
create a glut of glycerol, which could become available as a feedstock at low or negative
cost. However, for biodiesel to economically compete with petrodiesel its price must
come down.

7
2.2.2 Making biodiesel a competitive fuel
A number of strategies have been proposed to improve the economics of
biodiesel production and make it a viable fuel. Government subsidies could help to
improve the economic competitiveness of biodiesel, however, it is desirable to minimize
the dependence on such supports (Haas, 2005). Raw material cost leads to high price of
biodiesel. The price of biodiesel is strongly influenced by the price of alcohol, one of the
reactant in trans-esterification reaction (Bungay, 2004) and the purity of reactants
(Barnwal, 2005). Use of less expensive feed stocks such as animal fat (Peterson et al.,
1997; Ma et al., 1998) and restaurant grease has been proposed for biodiesel production.
Recently, soapstock, a byproduct of refining of vegetable oils has been used as a
feedstock for biodiesel (Haas, 2005). In addition to that, glycerol can be processed to
value added products. Value can be added to glycerol by utilizing it in existing
applications and at the same time finding novel ways to utilize glycerol such as fuels
(H2, syn-gas) and value-added liquid chemicals such as aldehydes and ketones.
Utilization of glycerol to produce value-added secondary products would improve the
economics of biodiesel. In the following sections a detailed study of the reported work
on value-added products from glycerol is presented.
2.3 Value-added products from glycerol
Glycerol can be converted to value-added products by pyrolysis, steam
gasification and catalytic treatment. The literature review on pyrolysis and steam
gasification of glycerol with different process conditions such as temperature and steam
to glycerol ratio is discussed in this section. Also, catalytic conversion of glycerol into

8
value-added chemicals using different catalyst such as nickel and platinum is discussed
in this section.
2.3.1 Production of hydrogen and syn-gas from glycerol
The available literature on production of hydrogen and syn-gas from glycerol by
pyrolyis and steam gasification is discussed in this section.
Chaudhari and Bakhshi (2002) reported the production of hydrogen and syn-gas
from pyrolysis of glycerol in a fixed bed reactor. Pyrolyis was performed with and
without a carrier gas (nitrogen). One set of experiments was performed at 400 and
500 oC and glycerol flow rate of 2.0 g/h without using any carrier gas. It was reported
that the operation was quite difficult without using carrier gas because of char formation
in the feed inlet.
Another set of pyrolysis experiments was performed in a fixed bed reactor with
the nitrogen flow rate of 50 mL/min over a temperature range from 350 to 700 oC and
glycerol flow rate from 2.2 to 4.0 g/h. It was reported that complete conversion of
glycerol occurred at 700 oC. Furthermore, gas yield obtained was 50 wt% but no liquid
product was observed. The residue was 6.3 wt% whereas the remaining mass percent
was char.
Chaudhari and Bakhshi (2002) also performed steam gasification of glycerol
with steam flow rate of 2.5, 5 and 10 g/h at 600 and 700 oC with glycerol flow rate of 4
g/h. It was reported that approximately 80 wt% of glycerol was converted when steam
flow rate of 10 g/h at 700 oC was used. Furthermore, 92.3 mol% syn-gas with H2/CO
ratio of 2 was produced. Gaseous product was around 70 wt%. It was reported that syn-
gas can be further converted to hydrogen by water-gas shift reaction which can be used

9
in fuel cell applications. Syn-gas can also be converted to green diesel using Fischer-
Tropsch reaction (Chaudhari and Bakhshi, 2002).
Steam gasification of glycerol was performed by Stein and Antal (1983) and
Chaudhari and Bakhshi (2002). Results of Chaudhari and Bakhshi (2002) showed that
steam gasification of glycerol does not produce liquid product at 600 and 700 oC in a
fixed bed reactor. These results are in contrast with results of Stein and Antal (1983),
who reported that steam gasification of glycerol produced liquid product consisting of
acrolein and acetaldehyde at 600 to 675 oC in a laminar flow reactor.
Xu et al. (1996) reported carbon catalyzed gasification of the organic feed stocks
such as glycerol, glucose, whole biomass feed stocks (bagasse liquid extract and sewage
sludge) and cellobiose using supercritical water. Catalysts used were spruce wood
charcoal, macademia shell charcoal, coal activated carbon and coconut shell activated
carbon. The range of parameters investigated for gasification was temperature from 500
to 600 oC, WHSV 14.6 to 22.2 h -1 and pressure 251 to 340 MPa. It was reported that
glycerol was easily and completely gasified to 54.3 mol% hydrogen rich gas with low (2
mol%) yield of CO. The presence of catalyst had little effect on the gas composition.
Cortright et al. (2002) reported the production of hydrogen from sorbitol,
glycerol and ethylene glycol at temperatures of 227 oC and 225 oC and under high
pressure in a single-reactor aqueous-phase reforming process. Platinum supported on γ-
alumina was used as catalyst. Hydrogen yield was reported to be higher using sorbitol,
glycerol and ethylene glycol than that of glucose. The hydrogen yields from glycerol
reforming were 64.8 and 57 mol% at 225 and 265 oC, respectively. Liquid products
consisted of ethanol, 1,2-propanediol, acetic acid, ethylene glycol, acetaldehyde, 2-
propanol, propionic acid, acetone, propionaldehyde and lactic acid.

10
Huber et al. (2003) reported the production of H2 from glycerol, sorbitol and
ethylene glycol by aqueous phase reforming at temperature near 227 oC and pressures of
2.58 and 5.14 MPa in presence of Sn promoted Raney-Ni catalyst. The feed
concentration was 1 to 5 wt% in water. It was reported that addition of tin decreased the
rate of methane formation. Gas composition was 66 mol% of H2 and 32 mol% CO2,
when glycerol was used as feed.
Czernik et al. (2000) reported catalytic steam reforming of bio-oil derived
fraction and crude glycerol (a by-product from trans-esterification of vegetable oil with
methanol) in a fluidized bed reactor to produce hydrogen. Commercial Ni catalyst was
used. Superheated steam was used to fluidize the catalyst. The temperature of crude
glycerol was maintained at 60-80 oC and it was reported that at lower viscosity in this
temperature range it was easy to pump and atomize glycerol. Glycerol was fed at 78 g/h
with a steam rate of 145 g/h and WHSV of 1600 h-1. Concentration of major gas
products was found to be constant but methane production increased from 500 parts per
million (ppm) to 2200 ppm when the run time was increased from 0 to 250 min.
Hydrogen yield was around 77 wt% and it was suggested that hydrogen yield can be
increased if higher amount of steam is used. The conversion of carbon monoxide in the
gas through water-gas shift to CO2 and H2 would increase the hydrogen yield to 95 wt%.
2.3.2 Production of liquid chemicals from glycerol
In this section the available literature on production of liquid chemicals from
glycerol is presented.
Buhler et al. (2002) reported the production of value added chemical such as
methanol, acetalydehyde, acrolein, allyl alcohol, acetone, ethanol, carbon dioxide,

11
carbon monoxide and hydrogen from glycerol under supercritical conditions. The
temperature range investigated was 349 to 475 oC and pressure was maintained at 25, 35
and 45 MPa. The reaction was carried out in tubular reactor with reaction time in the
range from 32 to 165 s. It was reported that the decomposition of glycerol primarily
followed ionic mechanism at low temperature and high pressure and free radical
mechanism at high temperature and low pressure. The amount of acetaldehyde and
formaldehyde decreased with increase in temperature whereas amount of allyl alcohol
and methanol increased with increase in temperature.
McMorn et al. (1999) reported oxidation of glycerol using hydrogen peroxide in
liquid phase reaction at temperature of 20 and 70 oC. Products from this process
included, formic acid esters of glycerol and mixture of acetals. In addition to that trace
amounts of hydroxyacetone, glyceraldehyde and glyceric acid were also identified.
Garcia et al. (1995) reported the oxidation of aqueous solution of glycerol at
60 oC under atmospheric pressure and pH of 2, 7 and 11. The catalysts used in the study
were Pd and Pt promoted with Bi on active charcoal. The glyceric acid yield of 30, 55
and 77 wt% was obtained at pH of 7, 9 and 11, respectively using Pd catalyst. 70 wt%
yield of glyceric acid was obtained at 90-100 wt% conversion of glycerol under basic
conditions. It was reported that the selectivity towards oxidation of secondary alcohol
group was improved by promoting Pt with metals such as Bi and resulted in
dihydroxyacetone yield of 30 wt% at 60 wt% conversion. Fordham et al. (1995) reported
further oxidation of glyceric acid to hydroxypyruvic and tartronic acids at 50 oC and
atmospheric pressure. Pt promoted with Bi, supported on activated carbon, was used as
catalyst. It was reported that oxidation of primary and secondary alcohol group resulted
in formation of tartonic and hydroxypyruvic acid, respectively. The maximum yield of

12
83 wt% at 90 wt% conversion of glyceric acid was obtained for tartonic acid at pH of
9-11.
Neher et al. (1995) reported that acrolein can be produced from dehydration of
glycerol in the liquid (temperature from 180 to 340 oC and pressure of 70 bar) as well as
gas phase (temperature from 250 to 340 oC). HZSM-5 was used as catalyst for feed of
glycerol-water mixture (glycerol content 10 to 40 wt%) was Acrolein yield of 65% was
reported at 15 to 25 wt% glycerol conversion.
2.4 Chemistry of glycerol cracking
Thermal cracking of the oxygenated compounds such as glycerol has complex
chemistry (Wang et al., 1996). A large numbers of primary and secondary products were
generated through many different pathways. It was also reported that the partial thermal
cracking of oxygenated hydrocarbons would produce hydrogen, carbon monoxide,
carbon dioxide, methane and coke by primary decomposition reactions.
Antal et al. (1985) reported that the decomposition of glycerol in supercritical
water follows two major pathways. At lower temperature, heterolytic acid catalyzed
carbonium ion mechanism resulted in formation of acrolein by elimination of water from
glycerol. At higher temperatures (above 600 oC) however, homolytic cleavage of C-C
bond resulted in the formation of acetaldehyde. Experiments were performed using
NaHSO4 as catalyst at 500 oC.
Buhler et al. (2002) reported that the free radical reaction pathway dominated at
lower pressure and high temperature. Formation of gaseous product was favoured at
higher temperatures and it was as a result of free radical reaction pathway. The proposed
reaction pathways by Buhler et al. (2002) for the formation of acetalydehyde and
acrolein are shown in Figure 2.2.

13
Figure 2.2: Proposed reaction pathways for acetaldehyde and acrolein yield dur ing
supercr itical treatment of glycerol (Buhler et al., 2002)
C-C homolytic cleavage
CH3
C=O
CH2OH
CHOH
CH2OH
CH-OH
CH2
CH3
-H2O
Route 1
Route 2
C-C homolytic cleavage
-OH
Acetaldehyde
.
-H2O
CH2OH
CHOH
CH2OH
CH-OH
CH
CH2-OH
CHO
CH2
CH2OH
CHO
CH
CH2
-H2O
CH2OH
CHOH
CH2OH
Glycerol
Glycerol Acrolein
CHO

14
2.5 Selection of catalyst for catalytic conversion of glycerol
The role of acidic catalysts for deoxygenation, cracking and enhanced
hydrocarbon formation is well reported in literature (Gates, 1979). The production of
value-added chemicals from glycerol is a cracking reaction where bigger glycerol
molecule is broken down into smaller molecules. Cracking reactions catalyzed by acid
surfaces proceed by carbonium ion intermediates. Some of the more common cracking
catalysts are HZSM-5, HY, silica-alumina and γ-alumina. In this section the structure
and catalytic properties of these catalysts are described.
2.5.1 Structure and catalytic proper ties of HZSM-5
Zeolites are porous crystalline aluminosilicates composed of AlO4 and SiO4
tetrahedra which form three dimensional networks linked through oxygen atoms. The
composition of zeolites can be represented by empirical formula expressed as
Mn+x/n(AlO2
-)x(SiO2)y.mH2O
where, M is a cation with charge n+, m is the number of water molecules of
crystallization, x+y is the number of tetrahedra in the unit cell. The basic tetrahedral
units combine to form square and hexagonal plane faces, which combine further to form
sodalite cages and hexagonal cubes (Bhatia, 1989).
The basic unit of ZSM-5 zeolite is composed of 5 silica-alumina tetrahedra
linked into a pentagon. These pentagons are linked together by the sharing of oxygen
atoms. The basic units join together to form secondary building units (SBU) in the form
of chain and sheet building unit. The sheet structure is repeated in the third dimension to
form linear channels of slightly elliptical cross-section (0.56x0.54 nm). Further channels
occur in the other two dimensions, one sinusoidal with cross-section (0.55x0.51 nm) and
the other a tortuous system created by the overlapping of the first two (Bhatia, 1989).

15
Particular composition of given ZSM-5 zeolite (eg. type of cation M, the value of
y/x) determine most of the properties of ZSM-5. For example, ion exchange capacity,
catalytic activity and water sorption vary with the Al content (Olson et al., 1981).
Hydrophobic nature of ZSM-5 is dependent on Si/Al ratio, however the properties such
as X-ray diffraction pattern, framework density, pore size and pore volume are
independent of the composition (Chen, 1976).
The catalytic activity of ZSM-5 is attributed to strong acid sites and three
dimensional intersecting channels (Bhatia, 1989). The acid sites in ZSM-5 lie on inter
crystalline surface on the zeolite (Jacobs et al., 1981). The unique pore size and high
surface area makes ZSM-5 useful as shape selective catalyst (Falamaki et al., 1997;
Grieken et al., 2000). High silica to alumina ratio for ZSM-5 makes it stable under
hydrothermal treatment (Kumar et al., 2002). The three dimensional structure remains
intact at severe conditions of temperature. The catalyst pretreatment conditions have
significant impact on acidity and acidic site distribution (Vedrine et al., 1982).
ZSM-5 is altered by ion-exchange with various cations to increase its activity
and selectivity. Examples include exchange of Na+ with H+ to yield HZSM-5. HZSM-5
is also referred to as protonated form of ZSM-5. HZSM-5 has superior acidity as
compared to other forms of ZSM-5 such as Na-ZSM-5, B-ZSM-5 or Mg-ZSM-5 (Furrer,
1988).
It has been reported that a wide variety of organic compounds could be
transformed into hydrocarbons over zeolite catalyst typically over HZSM-5. HZSM-5
was reported to be an effective catalyst for completely converting feeds such as alcohols
and methanol to 42-45 mol% C6-C10 hydrocarbons at 371 oC and atmospheric pressure.
Major deoxygenation route was reported to be dehydration (Derouane et al., 1978).

16
ZSM-5 with its intermediate pore size sorbs molecules as large as o- and m-xylene
(~0.69 nm) while larger molecules such as 1,3,5-trimethylbenzene (~0.78 nm) are not
able to penetrate the small pores. Also, larger molecules result in catalyst deactivation by
forming coke and HZSM-5 catalyst resists coking by inhibiting larger molecules into the
catalyst.
2.5.2 Structure and catalytic proper ties of Y- zeolite
Y-zeolite is a natural crystalline aluminosilicate zeolite with chemical
composition [Na2Ca][Al2Si4O12].H2O. Y-zeolites is formed when the secondary building
units combine through hexagonal faces forming a hexagonal ring. Pore diameter (0.74
nm) of 12-membered ring Y-zeolite is large enough to allow access to bulky molecules
such as (C4H9)3N, isoparaffins, cyclohexane and aromatics (Campbell, 1983).
Microporous acidic Y-zeolite was reported to be an effective catalyst for transformation
of m-xylene through disproportionation reaction which was attributed to the presence of
strong Bronsted acid sites and higher micro pore volume (Molina et al., 1994). HY was
selected in addition to HZSM-5 to investigate the effect of pore size and structure on the
product yields from catalytic conversion of glycerol.
The pore size and definite shape of zeolites imparts shape selective properties to
them. The product selectivity occurs when the pore opening of the zeolite is such that it
admits only certain molecules and large molecules are excluded. Also, product
selectivity occurs if among all the product formed only those with proper dimension can
diffuse out and appear as products. Larger molecules are retained inside the pores of
catalyst and converted into smaller molecules or to carbonaceous deposits within the
pores causing pore blockage.

17
2.5.3 Structure and catalytic proper ties of silica-alumina
The structure of silica-alumina is silica tetrahedral lattice in which some of the
silicon atoms have been replaced by aluminum atoms. The silicon atoms in silica are
bonded to four oxygen atoms whereas in alumina, aluminum atoms are bonded to only
three oxygen atoms. This imbalance is resolved forcibly by silica by accommodating
each aluminum atom in its four fold coordination using hydrogen atom derived from
residual water content. The two possible structures of silica-alumina are shown in Figure
2.3.
Silica-alumina is amorphous solid and has both Bronsted and Lewis acidity
(Katikaneni et al., 1995). Silica-alumina possesses cracking efficiencies for several
reactions such as m-xylene isomerization, cumene cracking and heptane cracking (Sato
et al., 2001).
2.5.4 Structure and catalytic proper ties of γ-alumina
γ-alumina is an important industrial material and finds vast applications in
refining and petrochemsitry. γ-alumina was used as catalyst in the dehydration of
alcohols and in Clauss process (Digne et al., 2004). The precise crystallographic
structure of γ- alumina is still under debate. Detailed review of literature on the structure
of γ- alumina was done by Wolverton et al. (2000) and Gutiérrez et al. (2001). Surface
properties of γ-alumina make it useful as microporous catalyst (Pinto et al., 2004).

18
Si O Si O Si O � � � OH� � � � �O Si O Al O Si O O O
Si O Si O Si O � � � O� � ��� � �O Si O Al O Si O O O
Lewis acidity Bronsted acidity Figure 2.3: Typical structure of silica-alumina and the or igin of Lewis and Bronsted
acidity (Campbell, 1983)
+ H
-

19
2.6 Catalyst Deactivation
Catalytic conversion often leads to a number of undesirable side reactions. As a
result of these reactions a carbonaceous deposit referred to as coke is produced on the
catalyst (Nam et al., 1987). Coke reduces the catalytic activity for desired reaction and
thus substantially reduces rate of conversion and/or selectivity of the catalyst.
Deactivation of ZSM-5 occurs primarily due to fouling which is gradual covering of
catalyst surface with coke. The catalyst activity is reduced due to decrease in active
surface area and increased diffusion resistance which is due of physical coverage of
active sites or plugging (full or partial) of the pores of the catalyst (Furrer, 1988).
Formations of polyalkylaromatics such as polyethylbenzene, which are the reported coke
precursors, have been inhibited over ZSM-5 (Chandrawar et al., 1982).

20
3 EXPERIMENTAL
This chapter describes the design and construction of experimental setup for
catalytic conversion of glycerol. Preparation of catalyst and experimental procedure are
described in this section. Statistical design of experiments and the techniques used to
analyze the liquid and gas products from the experiments are also described in detail in
this section.
3.1 Catalysts for glycerol conversion
In this work, four catalysts namely HZSM-5, HY, silica-alumina and γ-alumina
were used for the production of value added liquids from glycerol.
Y-zeolite was procured from Zeolyst International, Netherlands. Y-zeolite was
treated with 1M solution of ammonium chloride at 80 oC, then dried at 110 oC and
calcined at 550 oC for 4 hours to get the HY form.
Silica-alumina catalyst was procured from Aldrich St. Louis, MO, USA. Silica-
alumina was calcined at 550 oC for 4 hours prior to use in the experiments.
γ-alumina was procured from Sud Chemicals, India. It was calcined at 550 oC for
4 hours before use in the reactions.
HZSM-5 was prepared by hydrothermal treatment of silica and alumina source in
presence of an organic template in an autoclave (supplied by Parr Inc, IL, USA)
according to method described in literature (Argauer and Landolt, 1972). The detailed
synthesis procedure is reported elsewhere (Sang et al., 2004).
21
The chemicals used in the preparation were terta ethyl orthosilicate as silica
source (Sigma-Aldrich St. Louis, MO, USA), sodium aluminate as aluminum source
(Fisher Scientific Company, New Jersey, USA), tetra propyl ammonium bromide as
organic template (Aldrich, St. Louise, MO, USA), NaOH to maintain pH and conc.
H2SO4.
3.2 Catalyst character ization
Catalysts were characterized to measure the properties such as pore size, surface
area, structure and acidity and thus understand the performance of the catalyst. The
different techniques used included: temperature programmed desorption (TPD), powder
X-ray diffraction (XRD), BET surface area analyis, scanning electron microscope and
fourier transformed infrared (FTIR) spectroscopy. These techniques have been briefly
described in the following sections.
3.2.1 Temperature programmed desorption (TPD)
Temperature programmed desoption was used to determine the number and
strength of acid sites of the catalysts. The catalyst was saturated under a flow of
ammonia after which the temperature of the sample was gradually increased and the
amount of ammonia desorbed was recorded as a function of time. The temperature at
which ammonia desorbs is associated with a particular type of acid site.
The TPD analysis was performed using CHEMBET 3000 (manufactured by
Quantachrome Corporation, FL, USA). About 0.1 g of the catalyst sample was placed in
U shaped quartz tube. The tube was then placed in an electrically heated furnace. The
sample tube was heated from room temperature to 400 oC with heating rate of 10 oC per

22
min under the flow (20 mL/min) of NH3 (1000 ppm NH3 in N2, supplied by Praxair,
Mississauga, ON, Canada). The temperature was maintained at 400 oC for one hour after
which the U tube was allowed to naturally cool down to 35 oC. Then the U tube was
heated to 1050 oC at heating rate of 10 oC per min in argon gas (supplied by Praxair,
Mississauga, ON, Canada) flow (20 mL/min). The TPD plot was logged using on-line
data acquisition system.
3.2.2 Powder X-ray diffraction (XRD)
X-ray diffraction was used to identify the structure of the zeolite catalysts. It is
also useful to determine if the material under investigation was crystalline or amorphous.
Powdered sample of the calcined catalyst was bombarded with x-rays at various angles.
Intensity of the reflected x-rays depends on the relative arrangement of atoms in the
crystal. The angle of x-rays reflected from crystal depends on the dimensional
characteristics of the lattice. Each material has a unique x-ray diffraction pattern. In case
of ZSM-5 ion exchange with other cations yields essentially the same pattern with minor
shift in relative intensity (Argauer and Landolt, 1972).
The XRD measurements were made with a Rigaku diffractometer (Rigaku
Company, Tokyo, Japan) using Cu-K � radiation filtered by a graphite monochromator at
40 KeV and 123 mA. The powdered samples were smeared on a glass slide with
methanol and dried at room temperature. The X-ray diffractograms were recorded from
4o to 80o at a speed of 5o (2θ) per min.

23
3.2.3 BET surface area, pore size and pore volume
The BET surface area, pore size and pore volume measurements of the catalysts
were done using a Micromeritics adsorption equipment (ASAP 2000, manufactured by
Micromeritics Instruments Inc., Norcross, GA, USA) using N2 gas (99.995% pure,
supplied by Praxair, Mississauga, ON, Canada). BET analysis was performed on
calcined catalyst. Each analysis required about 0.5 to 1.0 g of catalyst sample. Before the
analysis catalyst sample was treated for 4 hours at 200 oC at a pressure of 5x10⁻⁴ torr to
ensure that there was no adsorbed moisture on the catalyst surface. The adsoption and
desorption isotherms used in the evaluation of BET surface area were obtained at the
boiling temperature of nitrogen (-195 oC). These values are characteristic of a given
catalyst sample and are reproducible.
3.2.4 Scanning electron microscopy (SEM)
Scanning electron microscope features of fresh and spent catalysts were studied
by using a Phillips SEM 505 scanning electron microscope. The SEM instrument was
operated at 300 KeV/SE and 50o inclination. Prior to analysis, all the samples were gold
coated in a sputter coating unit (Edward Vacuum Components Ltd. Sussex, England).
The micrographs were recorded using photographic techniques. The images were
captured at magnification of 1:20,000.
3.2.5 Four ier transformed infrared spectroscopy (FTIR)
The IR measurements were made in the hydroxyl group and pyridine regions
using Perkin Elmer Infrared spectrophotometer (Model spectrum GX). Pyridine vapors
were adsorbed on the catalyst sample at 170 oC for 45 min, the sample was then allowed

24
to cool to room temperature and the spectra were recorded. All the spectra were obtained
in the region 400-4000 cm-1 were differential absorption spectra with 2 cm-1 resolution.
On the basis of the pyridine band between 1440 and 1640 cm-1, the presence of Bronsted
and Lewis acid sites was identified.
3.3 Exper imental program
The scope of this experimental work was to study the potential of production of
value-added liquid chemicals from the glycerol in a fixed bed micro reactor at
atmospheric pressure. The effects of operating parameters such as temperature, carrier
gas flow rate and weight hourly space velocity (WHSV) were investigated on glycerol
conversion and liquid product yield. The operating parameters were optimized for
maximum glycerol conversion and liquid product yield. The catalysts were characterized
to understand the effect of fundamental properties such as pore size, surface area,
crystallinity and acidity on the performance of catalysts in terms of glycerol conversion
and total liquid product.
3.3.1 Statistical design of exper iments
Design-Expert version 6.0.1, Stat-ease Inc., Minneapolis, USA was used for
statistical design of experiments (DoE) and the same software was used for the analysis
of experimental data. DoE is an organized approach that connects experiments in a
rational manner giving more precise information in fewer experiments as compared to
conventional design of experiments where one factor was varied at a time. One of the
useful outcomes of DoE is response surface maps of experimental region.

25
Response surface method (RSM) is a collection of statistical and mathematical
techniques useful for empirical modeling and analysis of problems (Noordin et al.,
2004). RSM is especially useful when the response is influenced by several variables
and the objective is to optimize the response. RSM also quantifies the relation among
one or more measured response and the vital input factors (Thomas et al., 1997). Each
factor is studied at a number of factor levels. In this research work, central composite
inscribed (CCI) design was used to generate response surfaces.
The phases of the DoE approach are listed below:
1. Identification of the factors that may affect the outcome of the experiment or the
response.
2. Choice of an appropriate experimental design for response surface modeling.
3. Determination of the experiments that need to be conducted.
4. Performing the experiments and collection of the data.
5. Data fitting and generation of plots that describe the trends of results and to draw
conclusions.
Factorial design of experiments is more popular than other types of experimental design
such as crossed and mixture. The design region is represented as a cube with possible
combinations of factors (low and high) at the corners of this cube. Central composite
design types are based on this cube with experimental points at corners, centers of faces
and center of edges. The cubic designs are popular because they are symmetrical and
straight forward to model which in turn facilitates easy interpretation of the results.
Choice of the design is finally a tradeoff between the information required and the
number of experiments to be conducted. The number of experimental runs is determined
by the following equation:

26
622 ++= kN k (3.1)
Where, k is the number of factors in the design.
For three factor design k = 3, thus the number of experiments is 20 (Design Expert 6.0.1
manual). A template of design experiments is given in Table 3.1. In this design the
effects of operating condition (factors) such as temperature, carrier gas flow rate and
WHSV can be studied on the responses such as glycerol conversion and various liquid
product, char and gas yields.
Once the experiments have been conducted the collected data are analyzed to
quantify the relationship between one or more of the measured response and the input
factors. Steps to analyze the collected data are summarized as follows:
1. Input of the response (eg. glycerol conversion in Table 3.1) to be analyzed into
the design expert software
2. Choice of a transformation if desired.
3. Selection of the appropriate model to be used. The fit summary button displays
the F-test, lack of fit test and other measures that could be helpful in selecting
the appropriate model.
4. Performing the analysis of variance (ANOVA), post-ANOVA analysis of
individual coefficients and case statistics for analysis of residuals and outlier
detection.
5. Studying various diagnostic plots to statistically validate the model.
6. Generation of model graphs such as 3D plots and contours for interpretation of
the results.

27
Table 3.1: Design of exper iments obtained from Design Expert Software 6.0.1
EXP # Temperature
(oC )
Carrier gas flow rate
(mL/min)
WHSV (h -1)
Glycerol conversion (wt%)
1 380 26 8.68
2 425 35 13.50
3 425 35 13.50
4 380 26 18.32
5 500 35 13.50
6 470 26 18.32
7 470 44 18.32
8 470 44 8.68
9 350 35 13.50
10 380 44 18.32
11 425 35 13.50
12 425 35 13.50
13 470 26 8.68
14 425 35 5.40
15 380 44 8.68
16 425 50 13.50
17 425 35 13.50
18 425 20 13.50
19 425 35 13.50
20 425 35 21.60

28
3.3.1.1 Test of significance of the model
Least square technique is used to fit a model equation containing the input
variables (factors) by minimizing the residual errors. Residual error is measured as the
sum of squares of deviations between the actual and estimated responses. Test of
significance of the model is performed using ANOVA by calculating the F-ratio. F-ratio,
also called the variance ratio, is the ratio of variance due to effect of model and variance
due to error term. F-ratio is also described as the ratio of regression mean square and
mean square error. A good model must be significant. The test of significance is
performed with the help of P-values. If the P-value is less than 0.05, the model is
significant and vice-versa.
3.3.1.2 Test of significance of individual model coefficients
This test is performed by determination of probability value (P-value) for
individual model coefficients. The insignificant model coefficients are deleted through
backward elimination.
3.4 Exper imental setup for catalytic conversion of glycerol
Catalytic conversion of glycerol was performed in a down flow fixed bed reactor
at atmospheric pressure. A schematic diagram of the experimental setup is shown in
Figure 3.1. The reactor consisted of an Inconel® 625 tube 530 mm in length with internal
diameter of 9.5 mm, external diameter of 12.5 mm and fitted with Swagelok™ fittings at
both ends. Feed was introduced through a 110 mm long feed line at feed inlet located at
55 mm from top flange of reactor. Near the feed inlet a T- joint was provided to have
carrier gas flow into the reactor. Nitrogen was used as carrier gas (supplied by Praxair,
Mississauga, ON, Canada). The flow of carrier gas was controlled

29
2
Figure 3.1: Schematic diagram for exper imental set up for catalytic conversion of glycerol 1. Syringe pump 2. Temperature controller 3. Temperature indicator 4. Electric Furnace 5. Fixed bed reactor 6Liquid collector 7. Condenser 8. Sampler 9. Gas collector 10. Brine solution 11. Check valve 12. Nitrogen cylinder 13. Mass flow controller, V- valve
3
4
5
6
7 8
11
9
V
10
12
13
1
29

30
using a needle valve and the flow meter (supplied by Sierra Instruments Inc, California,
USA) was used to record the carrier gas flow rate. Calibration of the flow meter was
done using a bubble flow meter. The calibration curve for the flow meter is shown in
Appendix H1. Catalyst was loaded into the reactor over a stainless steel mesh covered
with quartz wool inserted at 280 mm from top flange of reactor. The catalyst was diluted
using silicon carbide (80 mesh) particles (supplied by Exolon-Esk, Tonawanda, New
York, USA). Dilution was done to maintain a constant bed height of 70 mm for all the
experiments. The reactor was vertically mounted into an electrically heated annular
furnace. The reactor was fitted with K-type thermocouple (accuracy ± 2-3 oC) in contact
with outer wall of reactor. Reactor temperature was controlled by series SR22
microprocessor based tuning PID controller (supplied by Shimaden Co. Ltd., Tokyo,
Japan). Another K-type thermocouple was buried into the catalyst bed using a stainless
steel thermo-well.
Feed was pumped using a programmable syringe pump, Genie (supplied by Kent
Scientific Corporation). The calibration curve for the pump is given in Appendix H1.
The pump was capable of dispensing the feed at uniform rate, accurate up to three
decimal places. The reactor was fitted with ice cooled condenser at the exit where most
of the liquid products were collected and gas products were collected over saturated
brine solution in a gas collector.
The setup was fitted with a gas sampler. It was used to continuously sample
product gas when carrying out the deactivation studies of the catalysts. Initially, there
was some problem with the syringe pump needle. The pump was fitted with 22 gage
needle. It was found that there was high pressure drop in the needle of pump. This
caused the pump to choke and it was not able to dispense any feed. Needles of bigger
31
opening were tried and finally 16 gage needle was found to be working satisfactorily to
dispense desired flow rates of the feed.
3.5 A typical exper imental run
The reactor was cleaned, dried and then loaded with the catalyst and sealed with
Swagelok™ fitting at both ends. An anti-seal (supplied by Kleen Flo Tumbler, Montreal,
Canada) was used to prevent sealing of joints at high temperature. After recording the
reactor weight it was mounted into the annular furnace and the feed line and condenser
were connected. Carrier gas (nitrogen) flow was established through the reactor at
desired flow rate. Set point temperature was reached in 30 to 50 min while the flow of
nitrogen was maintained through the reactor. Once the set point temperature reached
injection of feed was started at a constant flow rate of 5.4 g/h. The run time of each
experiment was 60 min. Run time of 60 min for experiments was chosen based on the
time on stream study of the catalyst when the feed was pumped continuously for 90 min
and it was found that there was no significant change in glycerol conversion as measured
by the analysis of liquid product. After the 60 min run time carrier gas flow rate was
maintained for 2 more min to flush the entire products from the reactor.
The liquid and gaseous products were passed through a Na-Cl - ice condenser
where most of the liquid product was condensed and product gases were collected over a
saturated brine solution. The amount of liquid and char produced was determined by the
difference in weight of liquid collector and reactor before and after the reaction. The
volume of produced gas was measured from the calibrated scale attached to the liquid
collector. Samples calculations for mass balance are given in Appendix H3.

32
3.6 Analysis of products
The gas products from the experiments were analyzed using gas chromatographs
HP 5880 and HP 5890. Liquid products were analyzed using Varian 3400 and Fison
GC/MS 8000 series. The detailed discussion on methodology for these analyses is
described below.
3.6.1 Gas product analysis
The gas products were analyzed using two gas chromatographs (GCs). H2, CO
and CO2 were analyzed using an HP 5890 fitted with a thermal conductivity detector
(TCD) having Carbosive S II column (3000 m, i.d. 3.18mm) with helium (supplied by
Praxair, Mississauga, ON, Canada) as carrier gas. The program conditions were: initial
temperature of 40 oC, initial temperature hold time of one min, heating rate of 12
oC/min, final temperature of 200 oC, final temperature hold time of one min and detector
temperature of 250 oC.
Hydrocarbons such as CH4, C2+ were analyzed using HP 5880 GC. This GC was
equipped with a flame ionization detector (FID) and Chromosorb 102 column (1.8 m,
i.d. 3.18 mm). Helium was used as the carrier gas. Air and hydrogen (supplied by
Praxair, Mississauga, ON, Canada) mixture was used to ignite the FID. HP 5880 was
programmed using following conditions: initial temperature of 40 oC, initial temperature
hold time of 3 min, column heating rate of 10 oC/min, final temperature of 200 oC, final
hold time of 2 min and detector temperature of 250 oC. The GCs were calibrated using
the standard gas mixtures (see Appendix H2).

33
3.6.2 Typical gas product analysis
A gas sample of 700 µL was injected into the TCD of HP 5890 GC using
Gastight # 1001 syringe (supplied by Hamilton Co. Reno, Nevada). It took
approximately 15 min to detect hydrogen, nitrogen, carbon monoxide and carbon
dioxide. The GC oven was then allowed to cool to its initial temperature of 40 oC before
another injection was made. Also, a gas sample of 700 µL was injected into the FID of
HP 5880 GC. The analysis of gas sample in HP 5880 took approximately 21 min where
hydrocarbons including methane were analyzed. The peak areas from the GCs were used
to calculate number of moles of each component present in gas mixture at standard
temperature and pressure (STP). The volume of the gas and composition of gas were
calculated on nitrogen free basis (see Appendix H3).
3.6.3 Liquid product analysis
The compounds present in the liquid product obtained from catalytic conversion
of glycerol were identified using GC-MS and quantified using Varian 3400 GC. The GC
was equipped with the stabilwax (cross bonded, 30 m long, i.d. 0.25mm) capillary
column. The GC-MS was programmed using: initial temperature of 40 oC, initial
temperature hold time of 5 min, heating rate of 5 oC/min, final temperature of 200 oC,
final temperature hold time of 15 min and the detector temperature of 220 oC. Split ratio
in the injector was 1:20 at 220 oC. The residence time of the compounds identified by
GC-MS matched closely when pure compounds were injected into Varian 3400 GC. The
standard solutions of pure compounds were prepared and calibration curves were plotted
for each of the liquid compounds (see Appendix H2).

34
3.6.4 Typical liquid product analysis
The liquid product from the experiments contained low boiling point chemicals
such as acetaldehyde and acrolien. Some of the compounds including acrolein were
unstable at room temperature, so the product liquid from experiments was always kept
refrigerated. The product liquid sample was diluted with 2 parts of water and mixed
thoroughly. A sample of 0.4 µL of this mixture was injected using Microliter # 95
syringe (supplied by Hamilton Co. Reno, Nevada) into the FID of Varian 3400 GC. The
analysis of liquid product sample took approximately 52 min where compounds such as
acetalydehyde, acrolien, acetone, acetol, allyl alcohol and formaldehyde etc. were
identified. The peak areas were used to calculate the wt% of the components in the
liquid product (see Appendix H3).

35
4 RESULTS AND DISCUSSION
4.1 Catalyst character ization
The catalysts used in the present research work were HZSM-5, HY, silica-
alumina and γ-alumina. Physiochemical properties of these catalysts were studied using
TPD, XRD, BET surface area, pore size, SEM and FTIR measurement techniques.
Detailed results from catalyst characterization are described in the following section.
4.1.1 Temperature programmed desorption (TPD)
Temperature programmed desorption was carried out to study the acidic
properties of different catalysts (Figure 4.1). Ammonia as basic molecule was adsorbed
on acid centers of the catalysts. The increase in temperature for ammonia desorption
corresponds to increase in the strength of acidity of catalysts. From the literature it is
seen that there are three ranges for the desorption of ammonia, namely, 20-200, 200-350
and 350-550 oC, which correspond to weak, intermediate and strong acid centers,
respectively (Lewandowski and Sarbak, 2000). If the desorption peak intensity is high
then the number of acid sites is large and vice versa.
The TPD curve for HZSM-5 consists of two major peaks (see Figure 4.1). First
peak at 250 oC corresponds to the intermediate acid sites whereas the peak beyond
400 oC corresponds to strong acid centers. Also, the intensity of the peak at 250 oC was
more as compared to the one beyond 450 oC. This indicates that in HZSM-5 the number
of intermediate acid sites is more as compared to strong acid centers, which are

36
0 200 400 600 800 1000 1200
Temperature, oC
Inte
nsity
, a.u
.
γ-Al2O3
silica-alumina
HZSM-5
HY
Figure 4.1: Temperature programmed desorption (TPD) profiles of different catalysts

37
similar to those reported in literature (Anderson et al., 1979; Katikaneni et al., 1998).
The TPD curve for HY has only one peak at temperature less than 200 oC, which
indicates the presence of weak-intermediate acid sites. TPD curve for silica-alumina
consisted of a peak at temperature less than 200 oC, however the intensity was more as
compared to that for HY. This indicates that the number of weak acid sites present in
silica-alumina was more as compared that of HY. This observation is similar to those
reported in literature (Rajagopal et al., 1992; Rinaldi et al., 2004; Akpanudoh et al.,
2005). The TPD profile for γ-alumina shows the presence of weak acid centers (peak at
~130 oC) as well as strong acid centers (peak at ~620 oC) in this catalyst.
4.1.2 X-Ray diffraction (XRD)
X-ray diffraction was carried out to identify the crystalline structure of different
catalysts. The X-ray patterns for HZSM-5, HY, silica-alumina and γ-alumina are shown
in Figure 4.2. Presence of crystalline structure was observed in the case of HZSM-5, HY
and γ-alumina whereas no crystalline structure was observed for silica-alumina (Szostak,
1992; Zhong et al., 2001; Rinaldi et al., 2004).
4.1.3 BET surface area and pore size
The results of BET analysis for different catalysts are shown in Table 4.1. BET
surface area analysis with HY was repeated and the results were reproducible. The BET
surface areas for HZSM-5 and silica-alumina are comparable as observed from Table
4.1. The highest surface area (625 m2/g) was observed for HY whereas γ-alumina
showed the lowest surface area (235 m2/g). The pore size of catalysts ranged from 0.54
to 11.2 nm. HZSM-5 has the smallest pore size (0.54 nm) and γ-alumina has biggest
pore size (11.2 nm) among the catalysts chosen. HZSM-5 and HY were microporous

38
0
3500
0 20 40 60 80 1002-theta
Sig
nal,
a.u.
� -Al2O3
HY
HZSM-5
Silica-alumina
Figure 4.2: X-ray diffraction patterns for different catalysts
0
0.04
0.08
0.12
0.16
0.2
0 20 40 60 80 100
Pore Diameter, nm
Por
e vo
lum
e, m
L/g
HZSM-5
HY
Alumina
silica-alumina
Figure 4.3: Pore size distr ibution for different catalysts

39
Table 4.1: BET sur face area, pore size and pore volume of different catalysts
Catalyst BET surface area (m2/g)
Average Pore size (nm)
Pore volume (mL/g)
HZSM-5
319 0.54 0.16
HY
625 ± 11 0.74 ± 0.04 0.42 ± 0.03
Silica-alumina
321 3.15 0.77
� -alumina
235 11.2 0.67

40
materials (pore size < 2 nm) whereas, silica-alumina and γ-alumina were mesoporous
materials with pore size from 2-50 nm (Katikaneni et al., 1998; Bhatia, 1989; Satterfield,
1991). The surface area for HY matched with as reported by supplier (655 m2/g). The
surface area measurements for other catalysts also matched with those reported by the
supplier. Figure 4.3 shows the pore size distribution for different catalysts. It was
observed that HY, silica-alumina and γ-alumina have narrow pore size distribution as
compared to HZSM-5.
4.1.4 Four ier transformed infrared spectroscopy (FTIR)
Pyridine adsorption was used to detect the presence of Bronsted and Lewis acid
sites present in the catalysts (see Figure 4.4). HZSM-5 and HY have Bronsted (indicated
by B in Figure 4.4) as well as Lewis acid sites (indicate by L) which are shown by the
presence of peak at 1560 cm-1 and 1510 cm-1, respectively. Similar observations were
made by Adjaye et al. (1996) and Anand et al. (2003). γ-alumina has mainly Lewis
acidity as indicated by the presence of peak at 1650 cm-1 whereas silica-alumina mainly
has Bronsted acidity as shown by the presence of peak at 1560 cm-1. These observations
are in agreement with those reported in literature (Plyuto et al., 1999; Dabbagh et al.,
2005).

41
1400 1450 1500 1550 1600 1650 1700
Wavenumber, cm-1
Abs
orpt
ion
HZSM-5
HY
Silica-alumina
γ-Al2O3
BL
L
L
Figure 4.4: FTIR spectra of different catalysts in pyr idine region

42
4.2 Catalyst per formance studies on glycerol conversion, liquid, gas and char yield and acetaldehyde, acrolein, formaldehyde and acetol yields
In this work the performances of different catalysts such as HZSM-5, HY, silica-
alumina and γ-alumina in terms of glycerol conversion, liquid, gas and char yield and
acetaldehyde, acrolein, formaldehyde and acetol yield are described.
The preliminary experiments performed over HZSM-5 at 400 oC with 0.5 g of
catalysts in a fixed bed reactor indicated that there is a potential to produce value added
liquid chemicals from glycerol. Interestingly more that 90 wt% of the products were
liquid with remarkably low yields of gas (4 to 6 wt%) and char. The glycerol conversion
was only 46 wt%. The compounds identified in the liquid product were acetaldehyde,
acrolein, acetone, acetol, acetic acid, propanoic acid, phenol, formaldehyde, isopropyl
alcohol, allyl alcohol, glycerol formal and water. The gas product consisted of CO, CO2,
and hydrocarbons such as CH4. Furthermore, Thiruchitrambalam et al. (2004) reported
that H2 rich syn-gas can be produced from pyrolysis of glycerol at 800 oC varying carrier
gas flow rate from 30 to 70 mL/min.
Based on these preliminary experiments and the work reported in literature
(Thiruchitrambalam et al., 2004; Cortright et al., 2002; Buhler et al., 2002) the
temperature range of 350 to 500 oC, carrier gas flow rate of 20 to 50mL/min and WHSV
of 5.40 to 21.60 h -1 were chosen for investigation in this research work. WHSV is
defined as the ratio of glycerol feed flow rate (maintained constant at 5.40 g/h) to
catalysts wt. The WHSV range of 5.40 to 21.60 h -1 corresponds to catalyst weight range
from 1 to 0.25 g.

43
4.2.1 Statistical analysis of exper imental data for glycerol conversion
Glycerol conversion was calculated from the following equation:
)1.4(100*1
−=F
UX
Where, X = Glycerol conversion, wt%
U = Unconverted glycerol in liquid product, g
F = Glycerol fed, g
The experimental results for glycerol conversion over different catalysts are given in
Appendices A, B, C and D.
The time-on-stream study was conducted with all catalysts. No significant
decrease in glycerol conversion was observed for a run time of 90 min (see Figure 4.5).
Based on this study a run time of 60 minutes was chosen for each experiment. Material
balance for all experiments using different catalysts was in the range from 90 to 96
percent. A few experiments were repeated for all catalysts under identical conditions.
The results were reproducible within ± 4 %. Table 4.2 and 4.3 show the reproducibility
of experimental results for liquid, gas and char yields and product yields of different
liquid chemicals from glycerol conversion over HZSM-5.
Based on the variance analysis (see Appendix G; Table G1) linear model
(empirical) was used to predict glycerol conversion over HZSM-5 with R2 value of 0.96.
The model coefficients to predict glycerol conversion (within the range of operating
parameters) over this catalyst are given in Table 4.4. The coefficients of model terms
would indicate if the corresponding factor has statistically significant effect on the
glycerol conversion. For instance, in Table 4.4 the coefficients for interaction of
temperature and carrier gas flow rate, temperature and WHSV and carrier gas flow rate

44
Figure 4.5: Time-on-stream study for different catalysts
0.0
20.0
40.0
60.0
80.0
100.0
30 60 90
Run time, min
Gly
cero
l con
vers
ion,
wt%
HZSM-5
HY
silica-alumina
gamma-alumina

45
Table 4.2: Reproducibility of exper imental results for liquid, gas and char yield from glycerol conversion over HZSM-5
Operating conditions Percentage of total Products
(wt%) EXP #
T (oC)
CGF (mL/min)
WHSV (h-1)
Glycerol fed (g)
Conversion (wt%)
Total liquid
product (g)
Gas product
(g)
Char and residue
(g)
Total product
(g) Gas Liquid Char and residue
Mass Balance (wt%)
2 425 35 13.50 4.99 52.6 4.34 0.04 0.13 4.51 0.82 96.30 2.88 91.7
3 425 35 13.50 5.10 46.3 4.37 0.03 0.22 4.62 0.84 94.50 4.66 94.8
11 425 35 13.50 5.15 44.0 4.57 0.04 0.22 4.57 0.86 93.30 4.53 94.2
Table 4.3: Reproducibility of exper imental results for product yields of different liquid chemicals over HZSM-5
Experiment number Compound wt % 2 3 11
Acetaldehyde 7.59 8.51 8.72
Acetone 0.47 0.53 0.21
Acrolein 5.04 5.89 7.00
Formaldehyde 7.47 8.51 7.72
IPA 0.26 0.49 0.25
Allyl Alcohol 8.32 6.77 6.42
Acetol 16.80 15.21 14.94
Acetic Acid 1.04 1.14 0.81
propionic Acid 2.84 2.45 2.21
Glycerol Formal 1.82 2.63 2.45
Phenol 0.23 0.29 0.15
Water 23.53 29.73 29.27
Unknowns 24.59 17.86 19.84
Total 100.00 100.00 100.00

46
Table 4.4: Significant model coefficients to predict glycerol conversion over HZSM-5 and HY
*Glycerol conversion over HZSM-5,
)2.4(*55.1*19.0*33.081.61 WCTX +−+−= **Glycerol conversion over HY,
)3.4(**0.03**0.01*03-8.27E - *0.13-
*0.01*03-2.04E-*46.4*51.2*07.232.4062
22
WCWTT*CW
CTWCTX
+++−++−=
Where, X = glycerol conversion, wt%
T = temperature, oC
C = carrier gas flow rate, mL/min
W = weight hourly space velocity, h -1
Glycerol conversion (wt%) Factors
HZSM-5* **HY
Intercept -61.81 -406.32
T 0.33 2.07
C -0.19 2.51
W 1.55 -4.46
T2 0 -2.04E-03
C2 0 0.01
W2 0 -0.13
T*C 0 -8.27E-03
T*W 0 0.01
C*W 0 0.03

47
36.7 52.6 68.6 84.5
100.5
Con
vers
ion,
wt%
350
425 463
500
5.40 9.45
13.50 17.55
21.60
T, oC
W, h-1
(d)
388
Figure 4.6: Sur face response for glycerol conversion: (a) effect of temperature and
WHSV at carr ier gas flow rate of 35 mL/min using HZSM-5; (b) effect of temperature and car r ier gas flow rate at WHSV of 13.50 h -1 using HZSM-5; (c) effect of carr ier gas flow rate and temperature at WHSV of 13.50 h -1 using HY; (d) effect of WHSV and temperature at carr ier gas flow rate of 35 mL/min using HY
12.2 30.7 49.1 67.6
86.1
Con
vers
ion,
wt%
350 388
425 463
500
5.40 9.45
13.50 17.55
21.60
W, h -1 T, oC
(b)
54.1
67.5 80.8
94.1
107.5
Con
vers
ion,
wt%
350 388
425 463
500
20.0 27.5
35.0 42.5
50.0
T, oC
C, mL/min
(c)
500
21.8 35.5 49.1 62.8
76.4
388
425 463
20.0 27.5
35.0 42.5
50.0
T, oC
C, mL/min
Con
vers
ion,
wt%
(a)
350

48
are zero. This indicates that the interaction of temperature and carrier gas flow rate,
temperature and WHSV and carrier gas flow rate are statistically insignificant for
glycerol conversion. In the following discussion, table of significant coefficients will be
given to predict the corresponding response. The empirical equations are generated as
shown in equations 4.2 and 4.3.
The response surface to describe glycerol conversion over HZSM-5 is shown in
Figure 4.6 (a) and (b). There was no significant change in glycerol conversion with
change in the carrier gas flow rate within the range studied at a constant temperature as
shown in Figure 4.6 (a). This was because HZSM-5 has intermediate and strong acid
sites. Glycerol molecule would have strongly adsorbed on the acid surface to undergo
cracking (Gates 1979). Thus, within the operating temperature range (350 to 500 oC),
carrier gas flow rate and hence residence time would not affect glycerol conversion in
case of HZSM-5. On the other hand, it would appear that the operating temperature has
significant effect on glycerol conversion. For example, glycerol conversion increased
from 13.6 to 86.1 wt% when the temperature was increased from 350 to 500 oC at
WHSV of 5.40 h -1 when carrier gas flow rate was maintained constant at 35 mL/min as
shown in Figure 4.6 (b). This could be due to diffusion limitations because of small pore
size of HZSM-5. Therefore, glycerol conversion in this case was strongly dependent on
temperature.
A quadratic model (see Appendix G; Table G1) was used to predict the glycerol
conversion over HY. The model coefficients are shown in Table 4.4. In this case
temperature, carrier gas flow rate and WHSV have significant effect on glycerol
conversion. The surface response to describe glycerol conversion over HY is shown in
Figure 4.6 (c) and (d). Glycerol conversion increased from 59 to 98 wt% when the

49
temperature was increased from 350 to 500 oC at carrier gas flow rate of 20 mL/min and
WHSV of 13.50 h -1. However, maximum conversion (100 wt%) was achieved at 470 oC
and medium carrier gas flow rate of 26 mL/min. Glycerol conversion more than 100
wt% was predicted at 500 oC and carrier gas flow rate of 20 mL/min from the model to
maintain the continuity of the response surface as shown in Figure 4.6 (c). Glycerol
conversion increased from 36.7 to 100 wt% with the increase in temperature from 350 to
500 oC at WHSV of 5.40 h -1 and carrier gas flow rate of 35 mL/min as shown in 4.6 (d).
Higher glycerol conversion was achieved with HY as compared to HZSM-5 which could
be due to somewhat larger pore size of the HY catalyst. Complete conversion of glycerol
was attained from silica-alumina and γ-alumina which indicates that in addition to pore
size, total acidity of the catalyst played important role on glycerol conversion.
Numerical optimization was performed to find out the optimum operating
conditions for maximum glycerol conversion. Variable simplex was used as the
optimization technique (Design Expert 6.0.1 manual). The optimum operating
conditions for predicted and experimental maximum glycerol conversion are shown in
Table 4.5. Low deviation between the predicted and experimental glycerol conversion
confirmed that the model can predict the glycerol conversion accurately. It was observed
that under similar operating conditions, higher glycerol conversion was obtained with
HY than that with HZSM-5 as shown in Table 4.5. In the case of HY, complete
conversion was attained in all experiments that were performed at temperatures greater
than 470 oC. The minimum temperature giving the highest conversion was chosen for
the optimization of operating conditions in case of HY.

50
Table 4.5: Predicted and exper imental maximum glycerol conversion over HZSM-5 and HY at optimum conditions
Glycerol conversion (wt%) Catalyst Temperature (oC)
Carrier gas flow rate
(mL/min)
WHSV (h -1)
Predicted Experimental
HZSM-5 470 26 8.68 77.2 78.8
HY 470 26 8.68 100 100

51
4.2.2 Statistical analysis of exper imental data for liquid product yield
Liquid product yield (g/100 g feed) was calculated using the following equation:
)4.4(100*)1(
−−
=F
XFLL T
Where, L = Liquid product yield, g/100 g feed
LT = Total liquid (including unconverted glycerol), g
F = Glycerol fed, g
X = Fractional glycerol conversion
Liquid product yield under experimental conditions using different catalysts was in the
range from 11 to 85 g/100g feed (see Appendix E1). Experimental results showed that
the liquid product yield was higher over silica-alumina and γ-alumina than that over
HZSM-5 and HY.
A possible reaction pathway for the catalytic conversion of glycerol is given in
Figure 4.7. Free radical pathways dominate mainly at high temperature whereas ionic
pathways dominate at low temperature (Buhler et al., 2002). It was proposed that liquid
product (including acetaldehyde, acrolein, formaldehyde and acetol) was formed
primarily through ionic pathways, which dominate over the free radical pathways at low
temperature. Therefore liquid product yield should be favored at low temperature.
However, in case of HZSM-5 and HY, in addition to reaction temperature, the pore size
has significant effect on liquid product yield. Higher temperature was required to
overcome the diffusion limitations imposed by smaller pore size of these catalysts. A
trend of increasing glycerol conversion with increase in temperature was observed with
these catalysts (see Figure 4.6). Liquid product yield is a function of glycerol conversion

52
Figure 4.7: Proposed reaction pathways for catalytic conversion of glycerol
Hydrocarbons + CO
Oxidation
CO2
Acetaldehyde + Formaldehyde
+H3O (Ionic pathway)
-H2O
CH2OH CH-OH2
+ CH2OH
-H2O CH2OH CH+ CH2OH
CH2 CH CHO Acrolein
-H2O
CH2OH2+
CH-OH CH2OH
(Free Radical)
CH2OH CHOH CH2OH
Condensation
Coke
Acetol
Thermal/ catalytic treatment

53
as shown Equation 4.4. Therefore, higher temperature seems to favor the liquid product
yield with these catalysts with relatively large amount of micropores.
The model coefficients to predict liquid product yield using different catalysts is
given in Table 4.6. The surface response for liquid product yield in case of HZSM-5 and
HY is shown in Figure 4.8. In case of HZSM-5, temperature, carrier gas flow rate and
WHSV were significant parameters to predict liquid product yield (see Appendix G;
Table G2). Liquid product yield increased from 4.3 to 66.4 g/100 g feed with increase in
temperature from 350 to 500 oC when carrier gas flow rate was maintained constant at
20 mL/min as shown in Figure 4.8 (a). At WHSV of 5.40 h -1 liquid product yield
increased from 1 to 69.6 g/100 g feed with increase in temperature from 350 to 500 oC
as shown in Figure 4.8 (b).
Reduced quadratic model was used to predict (R2 value of 0.95) liquid product
yield using HY. In this case, temperature and WHSV were significant parameters to
predict liquid product yield whereas the effect of carrier gas flow rate was insignificant
(see Appendix G; Table G2). For example, as shown in Figure 4.8 (c) liquid product
yield was around 46.8 g/100 g feed and did not change with variation in carrier gas flow
rate from 20 to 50 mL/min at 350 oC. As shown in Table 4.6, large coefficient for
temperature term accounts for the significant effect of temperature on liquid product
yield. It was observed that at WHSV of 5.40 h -1, the liquid product yield increased to
72 g/100 g feed at 463 oC and with further increase in temperature to 500 oC it decreased
to 64.2 g/100 g feed as shown in Figure 4.8 (d). This decrease in liquid product yield at
higher temperature was marked by increase in the gas product yield.

54
Table 4.6: Significant model coefficients to predict liquid product yield over different catalysts
Liquid product yield (g/100 g feed)
Factors
HZSM-5 HY Silica-alumina � -alumina
Intercept -81.25 -397.93 -256.85 105.49
T 0.34 2.15 -0.42 -0.01
C -0.37 0 -2.64 -0.02
W -1.08 -2.33 -5.26 -0.84
T2 0 -2.52E-03 0 -2.19E-04
C2 0 0 0 -8.59E-03
W2 0 -20 0 -0.02
T*C 0 0 5.66E-03 2.67 E-03
T*W 0 0.02 0.01 3.32 E-03
C*W 0 0 0.03 -0.03

55
Figure 4.8: Response sur face for liquid product yield (L): (a) effect of temperature
and carr ier gas flow rate at WHSV of 13.50 h -1 using HZSM-5; (b) effect of temperature and WHSV at car r ier gas flow rate of 35 mL/min using HZSM-5; (c) effect of temperature and carr ier gas flow rate at WHSV of 13.50 h -1 using HY; (d) effect of temperature and WHSV at carr ier gas flow rate of 35 mL/min using HY
1.0 18.2 35.3
52.5
69.6
L, g
/ 100
g fe
ed
350 388
425 463
500
5.40 9.45
13.50 17.55
21.60
T, oC
W, h -1
15.5 31.8 48.0
64.2
80.5
L, g
/100
g fe
ed
350 388
425 463
500
5.40 9.45
13.50 17.55
21.60
T, oC W, h -1
350
46.8 55.1 63.4 71.8
80.1
L, g
/100
g fe
ed
388 425
463
500
20.0 27.5
35.0 42.5
50.0
T, oC
C, mL/min
(b)
(c) (d)
4.3
19.8 35.3
50.8
66.4
L, g
/100
g fe
ed
350 388
425 463
500
20.0 27.5
35.0 42.5
50.0
C, mL/min
(a)
T, oC

56
The response surface to predict (R2 value of 0.88) liquid product yield using
silica-alumina is shown in Figure 4.9 (a) and (b). It was interesting to observe that at
lower temperature of 350 oC increase in carrier gas flow rate from 20 to 50 mL/min
liquid product yield was almost 78 g/ 100 g feed, while at higher temperature of 500 oC
there was a sharp increase in liquid product yield from 65 g/ 100 g feed at 20 mL/min to
82 g/100 g feed at 50 mL/min. With increase in carrier gas flow rate (decrease in
residence time) higher liquid product yield is obtained because feed molecule would not
get sufficient time to undergo cracking to produce gas products. Furthermore, at WHSV
of 5.40 h -1 with the increase in temperature from 350 to 500 oC liquid product yield
decreased from 79.9 to 62.1 g/100 g feed when carrier gas flow rate was maintained
constant at 35 mL/min. It could be due to the cracking of liquid products to gas products
at higher temperature as evident from the possible reaction pathways (see Figure 4.7).
A quadratic model was significant to predict liquid product yield using γ-alumina
with R2 value of 0.84 (see Appendix G; Table G2). In this case temperature and WHSV
were statistically significant parameters whereas carrier gas flow rate was insignificant.
Liquid product yield decreased from 84 to 75.8 g/100 g feed when the temperature was
increased from 350 to 500 oC and WHSV was maintained constant at 5.40 h -1 as shown
in Figure 4.9 (c). Also, the liquid product yield decreased from 80 to 73 g /100 g feed
when temperature was increased from 350 to 500 oC at carrier gas flow rate of 50
mL/min and WHSV of 13.50 h -1 as shown in Figure 4.9 (d).
In the case of silica-alumina and γ-alumina, the presence of large pore size offers
negligible diffusional limitations to feed molecules. Therefore, liquid product yield with
these catalysts was favored at low temperature as shown in Figure 4.9.

57
Figure 4.9: Response sur face for liquid product yield (L): (a) effect of temperature
and carr ier gas flow rate at WHSV of 13.50 h -1 using silica-alumina; (b) effect of temperature and WHSV at carr ier gas flow rate of 35 mL/min using silica-alumina; (c) effect of temperature and carr ier gas flow rate at WHSV of 13.50 h -1 using γ-alumina; (d) effect of temperature and WHSV at car r ier gas flow rate of 35 mL/min using γ-alumina
65.0 70.7 76.3
82.0
87.6
L, g
/100
g fe
ed
350 388
425 463
500
20.0 27.5
35.0
42.5
50.0
C, mL/min T, oC
62.1 68.0 74.0 79.9
85.8
L, g
/100
g fe
ed
350 388
425 463
500
5.40 9.45
13.50 17.55
21.60
T, oC
W, h -1
73.3 76.2 79.1 82.1
85.0
L, g
/100
g fe
ed
350 388
425 463
500
20.0 27.5
35.0 42.5
50.0
T, oC
C, mL/min
75.8 78.3 80.9
83.4
85.9
L, g
/100
g fe
ed
350 388
425 463
500
5.40 9.45
13.50 17.55
21.60
T, oC
W, h -1
(b)
(d)
(a)
(c)

58
Numerical optimization was carried out to find the optimum conditions for
maximum liquid product yield using different catalysts. The predicted and experimental
liquid product yield at optimum operating conditions with different catalysts is shown in
Table 4.7. It was interesting to observe that maximum liquid product yield was obtained
at a lower temperature of 380 oC using silica-alumina and γ-alumina, whereas for
HZSM-5 and HY higher temperature was required for liquid product yield. For example,
liquid product yield of 80.9 g/100 g feed was obtained in case of HY at 425 oC, 50
mL/min and WHSV of 13.50 h-1 as compared to 64 g/ 100 g feed of liquid product yield
at 470 oC, 26 mL/min and WHSV of 8.68 h-1 in case of HZSM-5.
In summary, silica-alumina and γ-alumina were the best catalysts to obtain
maximum liquid product yield (~83 g/100 g feed) at temperature as low as 380 oC. HY
was the second best catalyst with comparable liquid product yield (~81 g/100 g feed) at
higher temperature of 425 oC. Furthermore, liquid product yield using silica-alumina and
γ-alumina varied between a narrow range from 71 to 84 and 78 to ~86 g/100 g feed,
respectively (see Appendix E1). The product yield of individual liquid components such
as acetaldehyde, acrolein, formaldehyde and acetol is further optimized and discussed in
the following section.

59
Table 4.7: Predicted and exper imental maximum liquid product yield under optimum conditions over different catalysts
Liquid product yield
(g/ 100g feed) Catalyst Temperature
(oC) Carrier gas flow
rate (mL/min)
WHSV (h -1)
Predicted Experimental
HZSM-5 470 26 8.68 64.4 59.0
HY 425 50 13.50 82.8 80.9
Silica-alumina 380 26 8.68 83.4 83.5
� -alumina 380 44 8.68 83.3 83.6

60
4.2.3 Statistical analysis of exper imental data for product yield of liquid components
Identification of the liquid product composition was a major challenge. Special
efforts were made in order to develop a methodology for identification of the liquid
product constituents. In this work up to 90 wt% of the liquid products were identified. It
was interesting to observe that four major chemicals constituted up to as much as 60 wt%
of the liquid product. These chemicals were acetaldehyde (ethanal), acrolein
(2-propenal), formaldehyde (methanal) and acetol (hydroxy acetone). Other chemicals
present in the liquid product included acetone (di-methyl ketone), acetic acid (ethanoic
acid), propionic acid, glycerol formal (mixture of 5-hydroxy-1,3-dioxane (60%) and 4-
hydroxymethyl-1,3-dioxolane (40%)), isopropyl alcohol (2-propanol) and phenol
(hydroxybenzene). It was observed that water was one of the products as well. The
composition of liquid product obtained from glycerol conversion over HZSM-5, HY,
silica-alumina and γ-alumina is given in Appendices A, B, C and D, respectively.
As acetaldehyde, acrolein, formaldehyde and acetol were the major chemicals
present in the liquid product, it was of interest to study the effect of operating conditions
on product yields of these chemicals over different catalysts.
The proposed reaction pathways for production of these chemicals are shown in
Figure 4.7. It was proposed that at lower temperature, liquid products such as
acetaldehyde, acrolein, formaldehyde and acetol were formed predominantly by ionic
pathways. It was also proposed that acetaldehyde and formaldehyde were formed by free
radical pathways as well. Gaseous product such as CO, CO2, CH4 and C2+ hydrocarbons
were formed through free radical pathways which dominate over the ionic pathways at
higher temperature. Coke formation was the result of condensation and polymerization.

61
4.2.3.1 Acetaldehyde yield
Acetaldehyde was one of the valuable chemical present in the liquid product.
Acetaldehyde yield under experimental conditions is given in Appendix F1. As much as
21 g/100 g feed of acetaldehyde was detected in liquid product. Model coefficients to
predict acetaldehyde yield using different catalysts are given in Table 4.8. The effect of
operating conditions on acetaldehyde yield with different catalysts is shown in Figure
4.10.
Buhler et al. (2002) proposed formation of acetaldehyde mainly through free
radical pathways during supercritical treatment of glycerol. However, in this research
work it is proposed that the formation of acetaldehyde takes place through free radical as
well as ionic pathways. Therefore, the maximum acetaldehyde yield should occur at
intermediate temperatures (425 to 470 oC). Furthermore, catalyst pore size and total
acidity have important effect on acetaldehyde yield. HZSM-5 and HY have smaller pore
sizes as compared to silica-alumina and γ-alumina. Therefore, in case of catalysts such
as HZSM-5 and HY higher temperature was needed for maximum acetaldehyde yield.
The higher temperature would increase the rate of mass transfer in the small pores. High
temperature in case of these catalysts favored liquid product yield (see Figure 4.8) which
lead to the higher acetaldehyde yield.
In the case of HZSM-5, HY and γ-alumina, temperature and WHSV were
significant whereas in the case of silica-alumina temperature and carrier gas flow rate
were significant parameters to predict acetaldehyde yield (see Appendix G; Table G3).
An increasing trend of acetaldehyde yield with the increase in temperature in cases of
HZSM-5 and HY are shown in 4.10 (a) and (b). This observation is in line with the
proposed reaction pathways as explained earlier.

62
Table 4.8: Significant model coefficients to predict acetaldehdye yield over different catalysts
Acetaldehyde yield (g/100 g feed)
Factors
HZSM-5 HY Silica-alumina � -alumina
Intercept -20.40 -79.83 10.24 98.93
T 0.07 0.36 0.06 -0.49
C -0.09 0 -1.07 0.36
W 0.24 -0.57 0 -0.20
T2 0 -3.73E-04 0 6.30E-04
C2 0 0 0.02 -4.95E-03
W2 0 -0.06 0 0
T*C 0 0 0 0
T*W 0 4.72E-03 0 0
C*W 0 0 0 0

63
Figure 4.10: Response sur face for acetaldehyde yield: (a) effect of temperature and
WHSV at carr ier gas flow rate at of 35 mL/min using HZSM-5; (b) effect of temperature and WHSV at carr ier gas flow rate at of 35 mL/min using HY; (c) effect of temperature and carr ier gas flow rate at WHSV of 13.50 h -1 using silica-alumina; (d) effect of temperature and carr ier gas flow rate at WHSV of 13.50 h -1 using γ-alumina
350
-3.5 0.1 3.8
7.4
11.0
Ace
tald
ehyd
e, g
/100
g f
eed
388 425
463 500
5.40 9.45
13.50 17.55
21.60
T, oC
W, h -1
(a) (b)
(c)
-6.3 -0.3 5.8
11.8 17.9
Ace
tald
ehyd
e, g
/100
g f
eed
350 388
425 463
500
5.40 9.45
13.50 17.55
21.60
T, oC W, h -1
13.0 16.3 19.6
22.9 26.3
Ace
tald
ehyd
e, g
/100
g f
eed
350 388
425 463
500
20.0 27.5
35.0 42.5
50.0
T, oC
C, mL/min
5.7 8.3 11.0 13.7
16.4
Ace
tald
ehyd
e, g
/100
g f
eed
350 388
425 463
500
5.40 9.45
13.50 17.55
21.60
T, oC
W, h -1
(d)

64
In the case of HY, high temperature and medium WHSV seem to favor
acetaldehyde yield. For example, acetaldehyde yield has increasing trend with increase
in temperature. Maximum acetaldehyde yield (17.9 g/100 g feed) occurred at 500 oC and
WHSV of 13.50 h -1 as shown in Figure 4.10 (b). It was proposed that both acetaldehyde
and formaldehyde formed through free radical as well as ionic pathways. In case of HY,
it was observed that high temperature favored formation of acetaldehyde. This could be
due to decrease in formaldehyde yield with increase in temperature of 425 oC (see
Figure 4.12 (b)).
In the case of silica-alumina, acetaldehyde yield increased from 13 to 23.2 g/100
g feed with increase in temperature from 350 to 500 oC at carrier gas flow rate of 20
mL/min. It was observed that maximum acetaldehyde yield (24.5 g/100 g feed) occurred
at temperature of 470 oC, carrier gas flow rate 44 mL/min and WHSV of 18.32 h -1 as
shown in Figure 4.10 (c). These observations support the proposed possible reaction
pathways where acetaldehyde formation is favored at intermediate temperature. In case
of silica-alumina (large pore size) there are less diffusion limitations as compared to
HZSM-5 and HY and therefore acetaldehyde formation is favored at intermediate
temperature.
In the case of γ-alumina, it was observed that there was no significant change in
acetaldehyde yield with increase in temperature from 350 to 425 oC at all WHSVs and
acetaldehyde yield was constant at about 6 g/100 g feed as shown in Figure 4.10 (d).
With further increase in temperature to 500 oC there was sharp increase in acetaldehyde
yield and it was 16.4 g/100 g feed at WHSV of 5.40 h -1. Furthermore, with increase in
WHSV from 5.40 to 21.60 h -1 at 500 oC, acetaldehyde yield decreased from 16.4 to 13.7
g/100 g feed. Thus, it seemed that WHSV was a significant parameter only at higher

65
temperatures. It was observed that high temperature (500 oC) was needed for maximum
acetaldehyde yield. This was because low temperature in this case seems to favor the
formation of formaldehyde. For example, formaldehyde yield showed an increasing
trend with increase in temperature up to 425 oC, however with further increase in
temperature it showed a decreasing trend as shown in Figure 4.12 (d).
The predicted and experimental maximum acetaldehyde yield at optimum
conditions with different catalysts is shown in Table 4.9. It was observed that silica-
alumina produced maximum acetaldehyde (24 g/100 g feed) at 470 oC, carrier gas flow
rate of 44 mL/min and WHSV of 18.32 h -1. HY produced 17.8 g/100 g feed
acetaldehyde at temperature of 500 oC, carrier gas flow rate of 35 mL/min and WHSV of
13.50 h -1. At this temperature γ-alumina produced ~15 g/100 g feed of acetaldehyde.
Maximum acetaldehyde obtained using HZSM-5 was ~ 11g/100 g feed at 470 oC, carrier
gas flow rate of 26 mL/min and WHSV of 8.68 h -1.
To summarize, silica-alumina was the best catalyst for maximum acetaldehyde
yield at temperature of 470 oC, carrier gas flow rate of 35 mL/min and WHSV of
13.50 h -1.

66
Table 4.9: Optimum operating conditions for maximum acetaldehyde yield over different catalysts
Acetaldehyde yield
(g/ 100g feed) Catalyst Temperature
(oC) Carrier gas flow
rate (mL/min)
WHSV (h -1)
Predicted Experimental
HZSM-5 470 26 8.68 8.9 11.2
HY 500 35 13.50 17.6 17.8
Silica-alumina 470 44 18.32 21.8 24.5
� -alumina 500 35 13.50 14.8 15.1

67
4.2.3.2 Acrolein yield
Acrolein was another major chemical detected in the liquid product. It is used as
a fungicide in agriculture industry. Under the experimental conditions acrolein present in
the liquid product ranged from 1 to 25 g/100 g feed (see Appendix F2). The model
coefficients and response surface to predict acrolein yield are given in Table 4.10 and
Figure 4.11, respectively.
In this research work it is proposed that acrolein was formed through ionic
pathways (see Figure 4.7). At lower temperature ionic pathways dominate over free
radical pathways. Therefore, the formation of acrolein might be favored at low
temperature. However, in the case of HZSM-5 and HY, due to small pore size as
compared to silica-alumina and γ-alumina high temperature favors acrolein production.
In case of silica-alumina and γ-alumina, large pore sizes offer negligible diffusion
limitations and hence acrolein yield over these catalysts is favored at low temperatures
as proposed by reaction pathways. The observed trends for acrolein yield using different
catalysts are discussed in this section.
A linear model was statistically significant to predict acrolein yield in case of
HZSM-5. It was observed that temperature, carrier gas flow rate and WHSV have
significant effect on acrolein yield (see Appendix G; Table G4). Acrolein yield increased
gradually with increase in temperature and it was 8.8 g/100 g feed at 500 oC and WHSV
of 5.4 h -1 as shown in Figure 4.11 (a). It was observed that at low WHSV of 5.40 h -1
temperature has a strong effect as compared to that at WHSV of 21.60 h -1.
In the case of HY, temperature and WHSV were major factors to predict acrolein
yield over HY. In this case, high temperature seems to favor acrolein yield. For example,

68
Table 4.10: Significant model coefficients to predict acrolein yield over different catalysts
Acrolein yield (g/100 g feed)
Factors
HZSM-5 HY Silica-alumina � -alumina
Intercept -11.25 -124.15 88.59 63.42
T 0.05 0.65 0.19 -0.18
C -0.09 0 -1.36 0.79
W -0.27 -1.48 0.37 -2.62
T2 0 -8.23E-04 0 0
C2 0 0 0 0
W2 0 -0.08 0 0
T*C 0 0 -3.25 E-03 0
T*W 0 -7.95 E-03 0 0.01
C*W 0 0 0 -0.05

69
Figure 4.11: Response sur face for acrolein yield: (a) effect of temperature and
WHSV at carr ier gas flow rate at of 35mL/min using HZSM-5; (b) effect of temperature and WHSV at car r ier gas flow rate of 35 mL/min using HY; (c) effect of temperature and WHSV at carr ier gas flow rate of 35 mL/min using silica-alumina; (d) effect of temperature and carr ier gas flow rate at WHSV of 13.50 h -1 using γ-alumina
350
(a)
-3.0 0.0 2.9
5.9
8.8
Acr
olei
n, g
/100
g f
eed
388 425
463 500
5.40 9.45
13.50 17.55
21.60
T, oC
W, h -1
-7.3 -1.8 3.6
9.0
14.4
Acr
olei
n, g
/100
g f
eed
350 388
425 463
500
5.40 9.45
13.50 17.55
21.60
T, oC W, h -1
350
(c)
3.7 8.1
12.5 17.0 21.4
Acr
olei
n, g
/100
g f
eed
388 425
463 500
5.40 9.45
13.50 17.55
21.60
T, oC
W, h -1
10.1 11.9 13.8 15.7 17.6
Acr
olei
n, g
/100
g f
eed
350 388
425 463
500
20.0 27.5
35.0 42.5
50.0
T, oC
C, mL/min
(d)
(b)

70
at 500 oC with increase in WHSV from 5.40 to 21.60 h -1 acrolein yield increased from 4
to 13.8 g/ 100 g feed as shown in Figure 4.11 (b).
In the case of silica-alumina, temperature, WHSV and interaction of temperature
and carrier gas flow rate were significant parameters to predict acrolein yield. It was
observed that acrolein yield decreased from 8.1 to 3.7 g/100 g feed with increase in
temperature from 350 to 500 oC at WHSV of 5.40 h -1 as shown in Figure 4.11 (c).
Acrolein yield increased from 3.7 to 21.4 g/100 g feed at 350 oC with increase in WHSV
from 5.40 to 21.60 h -1. Low temperature and high WHSV seems to favor acrolein yield
in this case. For example, at 500 oC when WHSV was increased from 5.40 to 21.60 h -1
acrolein yield increased from 4 to 9.5 g/100 g feed.
In the case of γ-alumina, temperature, interaction of temperature and carrier gas
flow rate, interaction of carrier gas flow rate and WHSV were significant factors to
predict acrolein yield. It was observed that acrolein yield decreased from 17.6 to 12
g/100 g feed with increase in temperature from 350 to 500 oC at carrier gas flow rate of
50 mL/min as shown in Figure 4.11 (d). It was also observed that low temperature and
high carrier gas flow rate seemed to favor acrolein yield in this case.
The predicted and experimental maximum acrolein yield at optimum conditions
with different catalysts is shown in Table 4.11. It was observed that maximum acrolein
(~ 25 g/100 g feed) was produced with γ-alumina at 380 oC, WHSV of 8.68 h -1 and
carrier gas flow rate of 44 mL/min. At the same temperature and high WHSV of
18.32 h -1 and medium carrier gas flow rate (26 mL/min) acrolein produced was ~19
g/100 g feed. However, with HY and HZSM-5 less acrolein was produced even at higher
temperature of 470 oC as shown in Table 4.11.

71
Table 4.11: Optimum operating conditions for maximum acrolein yield over different catalysts
Acrolein yield (g/100 g feed)
Catalyst Temperature (oC)
Carrier gas flow rate
(mL/min)
WHSV (h -1)
Predicted Experimental
HZSM-5 470 26 8.68 7.3 9.8
HY 470 44 18.32 13.4 15.4
Silica-alumina 380 26 18.32 18.8 18.8
� -alumina 380 44 8.68 23.8 25.3

72
To summarize, γ-alumina was the best catalyst to obtain maximum acrolein yield
(25.3 g/100 g feed) at temperature of 380 oC, carrier gas flow rate of 44 mL/min and
WHSV of 8.68 h-1.
4.2.3.3 Formaldehyde yield
Formaldehyde constituted up to 9 g/100 g feed of the liquid product (see
Appendix F3). The model coefficients to predict formaldehyde yield with different
catalysts are given in Table 4.12.
It was proposed that formaldehyde was formed through ionic as well as free
radical pathways. Similar to acetaldehyde yield, formation of formaldehyde was favored
at intermediate temperature (from 425 to 470 oC). Interestingly, for the large pore size
catalysts such as silica-alumina and γ-alumina optimum temperature for maximum
formaldehyde formation was as low as 380 oC. It was because further increase in
temperature favored formation of acetaldehyde as discussed in 4.2.3.1 and it caused
decrease in formaldehyde yield with these catalysts. The proposed reaction pathways
and the effect of pore size of different catalysts on formation of formaldehyde are
discussed below.
In the case of HZSM-5, temperature and carrier gas flow rate were significant
parameters to predict formaldehyde yield (see Appendix G; Table G5). It was observed
that formaldehyde yield increased with increase in temperature at all carrier gas flow
rates and it was 4.3 g/100 g feed at 500 oC and 20 mL/min as shown in Figure 4.12 (a). It
was because in case HZSM-5, liquid product yield has increasing trend with increase in
temperature as shown in Figure 4.8 (a) and (b).

73
Table 4.12: Significant model coefficients to predict formaldehdye production over different catalysts
Formaldehyde yield (g/100 g feed)
Factors
HZSM-5 HY Silica-alumina � -alumina
Intercept -40.37 -137.57 -38.15 -8.23
T 0.16 0 0.27 0
C 0.03 0 0.15 0.60
W 0.62 0.88 -2.03 0.41
T2 -1.59E-04 -7.6E-04 -4.13E-04 0
C2 0 0 0 -7.99E-03
W2 -0.02 -0.03 0 -0.12
T*C 0 0 0 0
T*W 0 0 4.59E-03 0
C*W 0 0 0 0
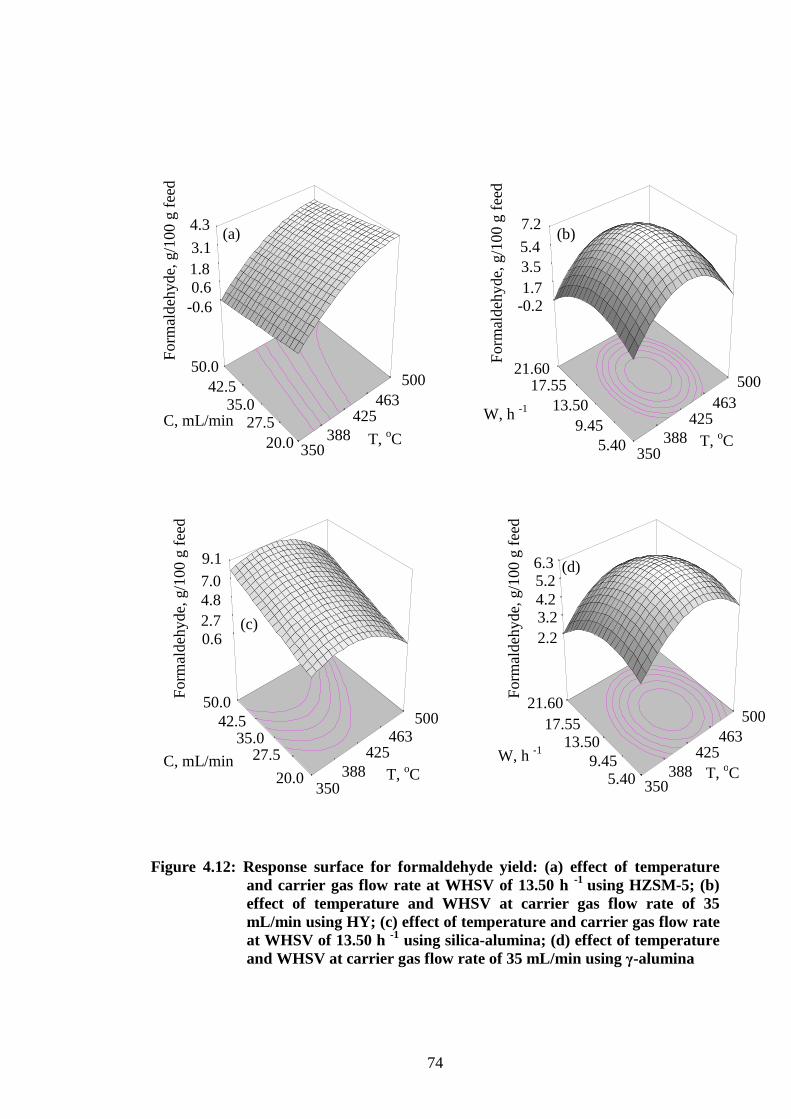
74
Figure 4.12: Response sur face for formaldehyde yield: (a) effect of temperature and carr ier gas flow rate at WHSV of 13.50 h -1 using HZSM-5; (b) effect of temperature and WHSV at car r ier gas flow rate of 35 mL/min using HY; (c) effect of temperature and carr ier gas flow rate at WHSV of 13.50 h -1 using silica-alumina; (d) effect of temperature and WHSV at carr ier gas flow rate of 35 mL/min using γ-alumina
(a)
C, mL/min
For
mal
dehy
de, g
/100
g f
eed
W, h -1
(b)
(c)
(d)
W, h -1
-0.6 0.6 1.8 3.1
4.3
For
mal
dehy
de, g
/100
g f
eed
350 388
425 463
500
20.0 27.5
35.0 42.5
50.0
T, oC
-0.2 1.7 3.5 5.4
7.2
350 388
425 463
500
5.40 9.45
13.50 17.55
21.60
T, oC
0.6 2.7 4.8 7.0
9.1
For
mal
dehy
de, g
/100
g f
eed
350 388
425 463
500
20.0
35.0 42.5
50.0
T, oC
C, mL/min 27.5
2.2 3.2 4.2 5.2 6.3
For
mal
dehy
de, g
/100
g f
eed
350 388
425 463
500
5.40 9.45
13.50 17.55
21.60
T, oC

75
In the case of HY, interaction of temperature and WHSV was significant
parameter to predict formaldehyde yield (see Appendix G; Table G5). It was observed
that intermediate temperature of 425 to 470 oC and WHSV from 13.50 to 17.55 h -1
favored formaldehyde yield as shown in Figure 4.12 (b). In case of HY, glycerol
conversion was as high as 98 wt% when the operating temperature was 425 oC. It seems
that the diffusion limitations are overcome at this temperature. Therefore, with further
increase in temperature formation of formaldehyde takes place as per the proposed
reaction pathways. For example, it was observed that with increase in operating
temperature up to 425 oC at WHSV of 5.40 h -1 and carrier gas flow rate of 35 mL/min
formation of formaldehyde has increasing trend. However, with further increase in
temperature formation of formaldehyde has a decreasing trend. This indicated that
higher temperature would favor acetaldehyde formation in case of HY as observed in
Figure 4.10 (b).
In the case of silica-alumina, temperature and carrier gas flow rate were
significant factors to predict formaldehyde yield. It was observed that at 350 oC
formaldehyde yield increased from 0.6 to 8.1 g/100 g feed with increase in carrier gas
flow rate from 20 to 50 mL/min as shown in Figure 4.12 (c). Furthermore, at 500 oC
when the carrier gas flow rate was increased from 20 to 50 mL/min formaldehyde yield
increased from 0.6 to 4.8 g/100 g feed. From the above observation it seems that
temperature (from 350 to 425 oC) and high carrier gas flow rate (50 mL/min) favored
formaldehyde yield in case of silica-alumina. Further increase in temperature favored
acetaldehyde formation in this case as shown in Figure 4.12 (c).
The response surface to predict formaldehyde yield in case of γ-alumina is
shown in Figure 4.12 (d). Formaldehdye yield has an increasing trend with increase in

76
temperature up to 425 oC and carrier gas flow rate of 35 mL/min. However with further
increase in temperature to 500 oC, formaldehyde yield has a decreasing trend. This could
be due to increased production of acetaldehyde at higher temperature in case of γ-
alumina as shown in Figure 4.12 (d).
The predicted and experimental maximum formaldehyde yield at optimum
conditions with different catalysts is shown in Table 4.13. It was observed that
maximum formaldehyde (~ 9 g/100 g feed) was produced with silica-alumina at 380 oC,
WHSV of 8.68 h -1 and carrier gas flow rate of 44 mL/min. With HY and HZSM-5
formaldehyde yield was less (from 3 to 7 g/100 g feed) even at temperature as high as
470 oC.

77
Table 4.13: Optimum operating conditions for maximum formaldehyde yield over different catalyst
Formaldehyde yield
(g/ 100g feed) Catalyst Temperature
(oC) Carrier gas flow
rate (mL/min)
WHSV (h -1)
Predicted Experimental
HZSM-5 470 26 18.32 3.6 3.8
HY 425 35 13.50 7.2 7.5
Silica-alumina 380 44 8.68 9.2 8.9
� -alumina 380 26 13.50 5.2 5.4

78
4.2.3.4 Acetol yield
Acetol (hydroxyl-acetone) finds applications in cosmetic industry as skin tanning
agent. Acetol detected in the liquid product ranged from 1 to 9 g/100 g feed (see
Appendix F4). The model coefficients to predict acetol yield with different catalysts is
shown in Table 4.14.
It was proposed that acetol was formed through ionic pathways which are
feasible at lower temperature. Therefore, the formation of acetol should be favored at
low temperature.
It was observed that temperature and WHSV were significant factors to predict
acetol yield in case of HZSM-5 (see Appendix G; Table G6). Acetol yield increased
with increase in temperature and it was 11.1 g/100 g feed at 500 oC at WHSV of 5.4 h -1
as shown in Figure 4.13 (a). It was because the liquid product yield has an increasing
trend with increase in temperature (see Figure 4.8 (a)) due to smaller pore size of
HZSM-5 which would lead to higher acetol yield with increase in temperature.
In the case of HY temperature and interaction of WHSV and temperature were
significant parameters to predict acetol yield. It was observed that with simultaneous
increase in temperature and WHSV acetol yield was 12 g/100 g feed at 500 oC and
WHSV of 21.60 h -1 as shown in Figure 4.13 (b).
In the case of silica-alumina, temperature and interaction of WHSV and carrier
gas flow rate were significant parameters to predict acetol formation. It was observed
that the acetol yield decreased from 8.2 to 0.5 g/100 g feed with increase in temperature
from 350 to 500 oC at WHSV of 21.60 h -1 shown in Figure 4.13 (c). Also at WHSV of

79
Table 4.14: Significant model coefficients to predict acetol yield over different catalysts
Acetol yield (g/100 g feed)
Factors
HZSM-5 HY Silica-alumina � -alumina
Intercept -19.57 -87.99 49.17 18.54
T 0.06 +0.42 -0.05 -0.04
C 0 0.16 0.74 0
W -0.13 -0.57 -1.74 0.25
T2 0 -5.68E-04 0 0
C2 0 0 0 0
W2 0 -0.09 0 0
T*C 0 0 0 0
T*W 0 7.20E-03 0 0
C*W 0 0 0.05 0

80
Figure 4.13: Response sur face for acetol yield: (a) effect of temperature and WHSV
at car r ier gas flow rate at of 35 mL/min using HZSM-5; (b) effect of temperature and WHSV at carr ier gas flow rate of 35 mL/min using HY; (c) effect of temperature and WHSV at car r ier gas flow rate of 35 mL/ min using silica-alumina; (d) effect of temperature and WHSV at carr ier gas flow rate of 35 mL/min using γ-alumina
-1.1 1.2 3.6 5.9 8.2
Ace
tol,
g/10
0 g
feed
350 388
425 463
500
5.40 9.45
13.50 17.55
21.60
T, oC
W, h -1
(c) (d) 9.8
-0.3 2.2 4.8 7.3
Ace
tol,
g/10
0 g
feed
350 388
425 463
500
5.40 9.45
13.50 17.55
21.60
T, oC W, h -1
-0.4 2.4 5.3 8.2
11.1
Ace
tol,
g/10
0 g
feed
350 388
425 463
500
5.40 9.45
13.50 17.55
21.60
T, oC
W, h -1
(a)
-3.2
0.9 5.0 9.2 13.3
Ace
tol,
g/10
0 g
feed
350 388
425 463
500
5.40 9.45
13.50 17.55
21.60
T, oC
W, h -1
(b)

81
5.40 h -1 acetol yield decreased from 6.3 to 0.6 g/100 g feed when temperature was
increased from 350 to 500 oC.
Temperature and WHSV were significant factors to predict acetol yield in the
case of γ-alumina. It was observed that acetol yield decreased from 9.8 to 3 g/100 g feed
with increase in temperature from 350 to 500 oC when WHSV was maintained constant
at 21.60 h -1 as shown in Figure 4.13 (d).
Observed trends for acetol formation in case of silica-alumina and γ-alumina are
explained by the proposed reaction pathways. It was proposed that acetol was formed
through ionic pathways which dominate at lower temperature. Thus, with the large pore
size (absence of diffusion limitations) catalysts such as silica-alumina and γ-alumina,
low temperature favored acetol formation.
The predicted and experimental maximum acetol yield at optimum conditions
with various catalysts is shown in Table 4.15. Maximum acetol (~ 15 g/100 g feed) was
produced with HY at 470 oC and WHSV of 18.32 h -1. At the same temperature, carrier
gas flow rate and WHSV of 8.68 h -1, ~9 g/100 g feed of acetol was produced in case of
HZSM-5 Interestingly, with silica-alumina and γ-alumina acetol yield was comparable
to that for HY at lower temperature of 380 oC, carrier gas flow rate 44 mL/min and
WHSV of 18.32 h -1.
In conclusion, HY was the best catalyst for maximum acetol yield at temperature
of 470 oC, carrier gas flow rate of 44 mL/min and WHSV of 18.32 h -1.

82
Table 4.15: Optimum operating conditions for maximum acetol yield over different catalysts
Acetol yield
(g/ 100g feed) Catalyst Temperature
(oC) Carrier gas flow
rate (mL/min)
WHSV (h -1)
Predicted Experimental
HZSM-5 470 44 8.68 8.8 8.9
HY 470 44 18.32 14.2 14.7
Silica-alumina 380 44 18.32 8.4 8.8
� -alumina 380 35 18.32 8.8 8.5

83
4.2.4 Statistical analysis of exper imental data for gas product yield
The main objective of this research work was to maximize the liquid
product yield, thus a lower range (350 to 500 oC) of temperature was chosen.
However, it was observed that small amount of gas was produced along with
liquid and char product. The gas product mainly consisted of CO, CO2, CH4 and
C2+ hydrocarbons (see Appendix A, B, C and D). In this research, the gas
product yield (g/100 g feed) was calculated as follows:
)5.4(100*
=F
GG T
Where, G = Gas product yield, g/100 g feed
GT = Gas collected, g
F = Glycerol fed, g
Gas product yields over different catalysts are given in Appendix E2.
The model coefficients to predict gas product yield using different catalysts are
given in Table 4.16. Temperature and WHSV were significant factors to predict gas
production using different catalysts (see Appendix G; Table G7). It was proposed that
gaseous products such as CO, CO2, CH4 and hydrocarbons were formed by free radical
pathways (see Figure 4.7) which dominate at high temperature. A general trend of
increased gas product yield at high temperature was observed for different catalysts.
This is explained by the proposed reaction pathways where gaseous products are formed
by predominantly free radical pathways.
The surface response to predict gas product yield using HZSM-5 is shown in
Figure 4.14 (a). Low amount of gas product (from 0.2 to 3 g/100 g feed) was obtained
using HZSM-5. It was observed that at WHSV of 5.40 h -1 when the temperature was

84
Table 4.16: Significant model coefficients to predict gas product yield over different catalysts
Gas product yield (g/100 g feed)
Factors HZSM-5 HY Silica-alumina � -alumina
Intercept -2.65 19.98 -156.67 -5.38
T 0.01 -0.07 0.37 0.03
C 0 0 2.73 0
W -0.09 -1.25 4.23 -0.15
T2 0 1.46E-04 0 0
C2 0 0 0 0
W2 0 0.04 0 0
T*C 0 0 -5.53E-03 0
T*W 0 -6.81E-04 -8.15 E-03 0
C*W 0 0 -0.03 0

85
Figure 4.14: Response sur face for gas production: (a) effect of temperature and
WHSV at carr ier gas flow rate at of 35 mL/min using HZSM-5; (b) effect of temperature and WHSV at carr ier gas flow rate of 35 mL/min using HY; (c) effect of temperature and WHSV at carr ier gas flow rate of 35 mL/ min silica-alumina; (d) effect of temperature and WHSV at carr ier gas flow rate of 35 mL/min using γ-alumina
(a)
Gas
pro
duct
, g/1
00g
feed
W, h -1
(b)
Gas
pro
duct
, g/1
00g
feed
0.5
5.3
10.1 15.0 19.8
350 388
425 463
500
5.40 9.45
13.50 17.55
21.60
T, oC
W, h -1 350
(d)
Gas
pro
duct
, g/1
00g
feed
3.0 4.9 6.7 8.6
10.4
388 425
463 500
5.40 9.45
13.50 17.55
21.60
T, oC
W, h -1
-0.53 0.24 1.01
1.78
2.55
Gas
pro
duct
, g/1
00g
feed
350 388
425 463
500
5.40 9.45
13.50 17.55
21.60
W, h -1 T, oC
0.4 3.7 7.1
10.4 13.7
350 388
425 463
500
5.40 9.45
13.50 17.55
21.60
T, oC
(c)

86
increased from 350 to 500 oC the gas product yield increased from 0.24 to 2.55 g/100 g
feed and from 0.4 to 13.7 g/100 g feed for HZSM-5 and HY, respectively (see Figure
4.14 (b). Also at 500 oC gas product yield was almost 7 g/100 g feed even with decrease
in WHSV from 21.60 to 13.50 h -1 however with further increase in WHSV to 5.40 h -1
gas product increased to 13.7 g/ 100 g feed. It would appear that temperature was the
main parameter to predict gas product yield in case of HY.
Surface responses for gas product yield in the case of silica-alumina and γ-
alumina are shown in Figure 4.14 (c) and (d). It was observed that at WHSV of 5.40 h -1
when temperature was increased from 350 to 500 oC gas product yield increased from
0.5 to 19.8 g/100 g feed and from 3.0 to 10.4 g/100 g feed for silica-alumina and γ-
alumina, respectively. Furthermore, for γ-alumina the gas product decreased from 10.4
to 7 g/100 g feed when WHSV was increased from 5.40 to 21.60 h -1 at 500 oC.
The predicted and experimental gas product yields at optimum conditions with
different catalysts are shown in Table 4.17. Under optimum conditions to maximize the
liquid product yield, gas product yield ranged from 2 to 6 g/100 g feed. Silica-alumina
and γ-alumina produced higher gas product yield at low temperature of 380 oC as
compared to HZSM-5 and HY.

87
Table 4.17: Optimum operating condition for minimum gas product yield over different catalysts
Gas product yield
(g/ 100g feed) Catalyst Temperature
(oC) Carrier gas flow
rate (mL/min)
WHSV (h -1)
Predicted Experimental
HZSM-5 470 26 8.68 1.9 1.8
HY 425 50 13.50 3.4 5.9
Silica-alumina 380 26 8.68 1.3 2.6
� -alumina 380 44 8.68 6.0 6.3

88
4.2.5 Statistical analysis of exper imental data for char and residue product yield
Char is one of the by-products of cracking reaction (Gates 1979). It was desired
to minimize the char and residue in this research work. It was proposed that formation of
coke could be the result of direct condensation followed by polymerization of glycerol
molecule on the acidic surface (see Figure 4.7). In this research work char and residue
yield (g/100 g feed) was calculated as follows:
)6.4(100*��
����=
F
CC T
R
Where, CR = Char and residue product yield, g/100 g feed
CT = Char and residue collected, g
F = Glycerol fed, g
Char and residue product yield over different catalysts is given in Appendix E3.
The model coefficients to predict char and residue yield in case of different
catalysts are shown in Table 4.18. The response surfaces to predict char and residue
yield using different catalysts are shown in Figure 4.15.
In the case of HZSM-5 it was observed that char and residue yield decreased
from 8.0 to 1.2 g/100 g feed with decrease in WHSV from 5.40 to 21.60 h -1 at 500 oC as
shown in Figure 4.15 (a). In case of HY, char and residue yield decreased from 10.4 to 7
g/100 g feed when temperature was increased from 350 to 500 oC at WHSV of 21.60 h -1
as shown in Figure 4.15 (b). More char and residue yield was obtained at high
temperature in case of silica-alumina than HY. For example, at 500 oC with increase in
WHSV from 5.40 to 21.60 h -1, the char and residue yield decreased from 10.1 to 4.2
g/100 g feed as shown in Figure 4.15 (c). In the case of γ-alumina, at WHSV of 21.60 h -
1 char and residue yield increased from 3.8 to 7.1 g/100 g feed with increase in

89
Table 4.18: Significant model coefficients* to predict char and residue over different catalysts
* see Appendix G; Table G8
Char and residue (g/100 g feed)
Factors HZSM-5 HY Silica-alumina � -alumina
Intercept 82.23 37.34 13.14 12.69
T -0.17 -0.02 3.90E-03 -0.03
C -0.88 -0.62 0 -0.08
W -3.60 -1.46 -0.33 -0.36
T2 0 0 0 0
C2 0 0 0 0
W2 -0.05 0 0 0
T*C 2.36E-03 0 0 4.31E-04
T*W 4.97E-03 0 0 1.62E-03
C*W 0 -0.05 0 -8.12E-03

90
Figure 4.15: Response sur face for char and residue: (a) effect of temperature and
WHSV at car r ier gas flow rate at of 35 mL/min using HZSM-5; (b) effect of temperature and WHSV at carr ier gas flow rate of 35 mL/min using HY; (c) effect of temperature and WHSV at carr ier gas flow rate of 35 mL/min using silica-alumina; (d) effect of temperature and WHSV at carr ier gas flow rate of 35 mL/min using γ-alumina
(a)
2.7 5.3
7.9 10.5
13.1
350 388
425 463
500
5.40 9.45
13.50 17.55
21.60
T, oC W, h -1
Cha
r an
d R
esid
ue, g
/100
g f
eed
5.2 6.5
7.8
9.1 10.4
Cha
r an
d re
sidu
e, g
/100
g f
eed
350 388
425 463
500
5.40 9.45
13.50 17.55
21.60
T, oC
W, h -1
4.2 5.6 7.1
8.6 10.1
Cha
r an
d re
sidu
e, g
/100
g f
eed
350 388
425 463
500
5.40 9.45
13.50 17.55
21.60
T, oC W, h -1
3.8
4.6 5.5
6.3
7.1
Cha
r an
d re
sidu
e, g
/100
g f
eed
350 388
425 463
500
5.40 9.45
13.50 17.55
21.60
T, oC W, h -1
(b)
(c) (d)

91
temperature from 350 to 500 oC as shown in Figure 4.15 (d).
In the present research work, it was desirable to minimize char and residue yield
while producing maximum liquid product. The optimum operating condition to
minimize the char and residue using different catalyst is shown in Table 4.19.
In conclusion, HZSM-5 produced minimum char at higher temperature. This was
because of it unique pore size which resist char production (Sang et al., 2004).

92
Table 4.19: Predicted and exper imental minimum char and residue yield under optimum conditions over different catalysts
Char and residue yield (g/ 100g feed)
Catalyst Temperature (oC)
Carrier gas flow rate
(mL/min)
WHSV (h -1)
Predicted Experimental
HZSM-5 470 26 8.68 3.6 4.2
HY 425 50 13.50 4.5 6.0
Silica-alumina 380 26 18.32 5.7 6.2
� -alumina 380 44 8.68 4.7 4.2

93
4.3 Effect of physiochemical proper ties of catalysts on optimum glycerol conversion, liquid product yield and acetaldehyde, acrolein, formaldehyde and acetol yields
In this section the effects of catalyst physiochemical properties on glycerol
conversion, liquid product yield and acetaldehyde, acrolein, formaldehyde and acetol
yields are discussed.
4.3.1 Effect of catalyst acidity
Acidity of the catalysts has major effect on the glycerol conversion, liquid
product yield and acetaldehyde, acrolein, formaldehyde and acetol yields. The observed
trend of total acidity (see Table 4.20) from most to least acidic was HZSM-
5>HY>silica-alumina>γ-alumina. The effect of total acidity on glycerol conversion is
given in Figure 4.16 (a). Glycerol conversion did not change significantly (~100 wt%)
when the total acidity was increased from 1.7x10 4 to 5.5x10 4 a.u. However, it decreased
to 78.8 wt% when total acidity was increased further to 7.0x10 4 a.u. (HZSM-5). It was
because during the cracking reaction the glycerol molecules were adsorbed on the
surface of catalysts. After the reaction the products were not easily desorbed from
relatively strong acid sites. This resulted in lower glycerol conversion in case of
HZSM-5.
A similar trend was observed for the liquid product yield (see Figure 4.16(b)).
Liquid product yield varied in the range from 80.9 to 83.6 g/100 g feed when the total
acidity increased from 1.7x10 4 to 5.5x10 4 a.u. Liquid product yield decreased
significantly when the total acidity increased to 7.0x10 4 a.u. This was because liquid
product yield was a function of glycerol conversion (see Equation 4.4). The decrease in
glycerol conversion is responsible for decrease in liquid product yield at higher acidity.

94
Table 4.20: Total acidity and optimum production of acetaldehyde, acrolein, formaldehyde and acetol
Optimum liquid components (g/100 g feed)
Catalyst Total acidity
(a.u.) Acetaldehyde Acrolein Formaldehdye Acetol
HZSM-5 70248 11.2 9.8 3.8 8.9
HY 55295 17.8 15.4 7.5 14.7
Silica-alumina 21518 24.5 18.6 8.9 8.8
� -alumina 17529 15.1 25.4 5.4 8.5

95
60
80
100
120
10000 20000 30000 40000 50000 60000 70000 80000
Total acidity, a.u.
Con
vers
ion,
wt %
40
60
80
100
10000 20000 30000 40000 50000 60000 70000 80000
Total acidity, a.u.
Liq
uid
prod
uct,
g/10
0 g
feed
Figure 4.16: Effect of total acidity of catalysts on the optimum (a) glycerol conversion (b) optimum liquid product yield
(a)
(b)
96
straight forward trend was observed between formation of individual liquid components
and total acidity. However, trend of increasing acetaldehyde, acrolein and formaldehyde
yield with decrease in total acidity was observed (see Table 4.20).
4.3.2 Effect of catalyst pore size
The effects of pore size on glycerol conversion and liquid product yield are given
in Figure 4.17 As shown in this figure, glycerol conversion and liquid product yield
depends not only on acidity but also on the pore sizes of the catalysts. However,
excessive pore size does not have any significant effect on glycerol conversion and
liquid product yield as evident from Figure 4.17 (a) and (b).
The effect of pore size on the production of acetaldehyde, acrolein, formaldehyde
and acetol is shown in Figure 4.18. Pore size had different effects on individual liquid
components. For example, maximum acetaldehyde yield was obtained at 3.15 nm
(silica-alumina). On the other hand, maximum acrolein and acetol yield were obtained
for catalysts with average pore sizes of 11.2 nm (γ-alumina) and 0.74 nm (HY),
respectively (see Figure 4.18). Moreover maximum formaldehyde yield was obtained at
0.74 nm and no significant change in formaldehyde yield was obtained with further
increase in pore size.
4.3.3 Scanning electron microscope (SEM)
Catalysts were characterized using SEM before the reaction. The images
obtained for different catalysts before and after the reaction are shown in Figure 4.19
and 4.20. It was observed that there was coke deposition and agglomeration of catalyst
particles after the reaction. Interestingly, there was not much difference in surface
texture in case of HZSM-5 before and after the reaction.

97
0.54
0.74 3.15 11.2
40
60
80
100
120
0 2 4 6 8 10 12Pore Size, nm
Gly
cero
l Con
vers
ion,
wt%
0.54
11.20.74 3.15
40
60
80
100
0 2 4 6 8 10 12Pore Size, nm
Liq
uid
prod
uct,
g/10
0 g
feed
Figure 4.17: Effect of pore size on (a) optimum glycerol conversion (b) optimum
liquid product yield
(b)
(a)

98
0
5
10
15
20
25
30
0 2 4 6 8 10 12
Pore size, nm
g/10
0 g
feed
Acetaldehyde
Acrolein
Acetol
Formaldehyde
Figure 4.18: Effect of catalyst pore size on optimum yield of acetaldehyde, acrolein,
formaldehyde and acetol

99
a) Fresh HZSM-5 b) Spent HZSM-5
a) Fresh HY b) Spent HY Figure 4.19: Scanning electron micrographs for (a) fresh HZSM-5 (b) spent
HZSM-5 (c) fresh HY (d) spent HY

100
(a) Fresh silica-alumina (b) Spent silica-alumina
(c) Fresh gamma alumina (d) Spent gamma alumina
Figure 4.20: Scanning electron micrographs for (a) fresh silica-alumina (b) spent
silica-alumina (c) fresh γ-alumina (d) spent γ-alumina

101
4.4 Implication of exper imental results
The findings of this research indicate that glycerol can be used for the production
of acetaldehyde, acrolein, formaldehyde and acetol. Main use of acetaldehyde is in
silvering of mirrors. In addition, it is also used as intermediate in the synthesis of other
chemicals such as acetic acid and n-butyl alcohol, perfumes and solvent in rubber
industry. Acrolein is used primarily as intermediate in the manufacture of acrylic acid.
Another important application of acrolein is as aquatic algaecide
(http://www.inchem.org). Formaldehyde is used in plastic industry for the production of
bakelite. In addition, it is widely used in manufacture of inks and wrinkle free clothing
(http://www.the-innovation-group.com). Acetol (hydroxyl-acetone) is used in cosmetic
industry as main constituent of skin tanning creams.
The separation of individual liquid components is important to impart market
value to them. Individual liquid components can be separated using distillation column
as the boiling point data for the components present in liquid product has wide range as
shown in Table 4.21.
A study was also carried out to estimate (see Table 4.22) the possible value
addition to glycerol by production of liquid chemicals. In this study price differential
was calculated based on the bulk prices (Chemical Market Reporter, 2005) of glycerol
and major components present in the liquid product, excluding the production and
capital cost. It was interesting to observe that based on the optimum production of
components for $100 input there was a potential to produce about $182 in return. Thus,
there is strong potential to produce value added liquid chemicals from glycerol using
catalytic treatment.

102
Table 4.21: Boiling points of different components present in liquid product
Table 4.22: Estimation of possible value addition based on bulk pr ices of chemicals
produced in catalytic treatment of glycerol
Basis: 100 Kg of glycerol
Selling price of glycerol = 0.40*100 = $40.00
Selling price of products = $112.61 Value addition = (112.61 – 40.00)/40.00*100 = 182 %
Components Boiling point (oC)
Freezing Point (oC)
Acetaldehyde 21 -40 Acetic acid 117-118 40 Acetol 145-146 56 Acetone 56 -17 Allyl alcohol 96-98 22 Acrolein (2-propenal) 53 -29 Formaldehyde -19 -- Glycerol formal 192-193 93 IPA 82 12 Phenol 182 79 Propionic acid 141 54 Water 100 0
Components
Price, A ($/Kg)
Optimum production of components, B
(Kg)
Price calculation for products,
C = A*B/100*100 ($)
Glycerol 0.40 Acetaldehyde 1.30 24.50 31.85 Acrolein 2.57 25.30 65.02 Formaldehyde 0.60 8.90 5.35 Acetol 0.72 14.44 10.40
Total = 73.14
Total = 112.61
103
5 CONCLUSIONS AND RECOMMENDATIONS
5.1 Conclusions
1. Complete conversion of glycerol was obtained with silica-alumina and γ-alumina
at all experimental conditions. The optimum operating conditions to obtain the
maximum glycerol conversion over HZSM-5 (78.8 wt%) and HY (100 wt%)
were 470 oC, 26 mL/min and WHSV of 8.68 h -1.
2. Silica-alumina and γ-alumina produced the highest liquid product yield (~ 83 g/
100 g feed) at 380 oC, WHSV of 8.68 h -1 and carrier gas flow rate of 26 and 44
mL/min respectively.
3. The highest liquid product yields over HY (80.9 g/100 g feed) was obtained at
temperature of 425 oC, carrier gas flow rate of 50 mL/min and WHSV of 13.50
h -1 and over HZSM-5 (59.0 g/100 g feed) at temperature of 470 oC, carrier gas
flow rate of 26 mL/min and WHSV of 8.68 h -1.
4. The highest acetaldehyde yield (24.5 g/100 g feed) was obtained with silica-
alumina at the optimum conditions of temperature 470 oC, carrier gas flow rate
44 mL/min and WHSV 18.32 h -1.
5. The highest acrolein yield (25.3 g/100 g feed) was obtained with γ-alumina at the
optimum conditions of temperature 380 oC, carrier gas flow rate 44 mL/min and
WHSV 8.68 h -1.

104
6. The highest formaldehyde yield (~9 g/100 g feed) was obtained with silica-
alumina at the optimum conditions of temperature 380 oC, carrier gas flow rate
44 mL/min and WHSV 8.68 h -1.
7. The highest acetol yield (14.7 g/100 g feed) was obtained with HY at the
optimum conditions of temperature 470 oC, carrier gas flow rate 44 mL/min and
WHSV 18.32 h -1.
8. The gas product yield obtained under optimum conditions for maximum liquid
product yield ranged from 2 to 6 g/ 100 g feed.
9. The char and residue yield obtained under optimum conditions for maximum
liquid product ranged from 3 to 6g/ 100 g feed.
10. Optimum conversion increased from 80 to 100 wt% and optimum liquid product
increased from 59 to 83.3 g/100 g feed when the pore size of catalyst was
increased from 0.54 in case of HZSM-5 to 0.74 nm in case of HY; beyond which
the effect pore of size was minimal.
5.2 Recommendations
1. Crude glycerol should be used as feed under the optimized conditions for each
catalyst.
2. Catalyst such as H-mordenite (pore size 0.67 nm) with pore size in between
HZSM-5 and HY should be used to evaluate the effects of pore size on optimum
glycerol conversion as well as liquid product yield.
3. Kinetic study should be performed to evaluate the rates of reactions for
formation of acetaldehyde, acrolein, formaldehyde and acetol.

105
4. Process specific catalyst can be designed for the catalytic conversion of crude
glycerol to selectively produce acetaldehyde, acrolein, formaldehyde and acetol.
5. Pilot plant study of the catalytic treatment of glycerol should be performed.
6. A process should be developed to separate individual components from the liquid
product.

106
6 REFERENCES
Akpanudoh, N.S., K. Gobin and G. Manos, “Catalytic Degradation of Plastic Waste to Liquid Fuels Over Commercial Catalysts: Effect of Polymer to Catalyst Ratio/Acidity Content” , Journal of Molecular Catalysis A: Chemical 235, 67-73 (2005).
Adjaye, J. D., S.P.R. Katikaneni and N.N. Bakhshi, “Catalytic Conversion of Biofuel
to Hydrocarbons: Effect of Mixtures of HZSM-5 and Silica-Alumina Catalysts on Product Distribution” , Fuel Processing Technology 48, 115-143 (1996).
Anand, R., R. Maheshwari, K.U. Gore, S.S. Khaire and V.R. Chumbhale,
“ Isopopylation of Naphthalene Over Modified Faujasites: Effect of Steaming Temperature on Activity and Selectivity” , Applied Catalysis A: General 249, 265-272 (2003).
Anderson, J.R., K. Foger, T. Mole, R.A. Rajadhyaksha and J. V. Sanders, “Reactions
on ZSM-5-type Zeolite Catalysts” , Journal of Catalysis 58, 114 (1979). Antal, M.J., W.S.L. Mok, J.C. Roy and A.T. Raissi, “Pyrolytic Sources of
Hydrocarbons from Biomass” , Journal of Analytical and Applied Pyrolysis 8, 291-303 (1985).
Argauer, R.J. and R. Landolt, “Crystalline Zeolite ZSM-5 and Method Of Preparing
the Same”, US Patent 3702886, (1972). Barnwal, B.K. and M.P. Sharma, “Prospects of Biodiesel Production from Vegetable
Oils in India” , Renewable and Sustainable Energy Reviews 9, 363-378 (2005). Bhatia, S., “Zeolite Catalysts Principles and Applications” , CRC Press, Florida
(1989), pp. 15-17; pp. 84; pp. 87. Buhler, W., E. Dinjus, H.J. Ederer, A. Kruse and C. Mas, “ Ionic Reactions and
Pyrolysis of Glycerol as Competing Reaction Pathways in near- and Supercritical Water” , Journal of Supercritical Fluids 22, 37–53 (2002).
Bungay, H.R., “Confessions of a Bioenergy Advocate” , Trends in Biotechnology 22,
67-71 (2004).

107
Campbell, I., “Principles of Reactions on Solid Catalysts Biomass Catalysts and Liquid Fuels” , Holt, Rinehart and Winston Publishing Corporation, (1983), pp. 106-121.
Chandrawar, K.H, S.B. Kulkarni and P. Ratnaswamy, “Alkylation of Benzene and
Ethanol over ZSM-5 Zeolites” , Applied Catalysis 4, 287 (1982). Chaudhari, S. T. and N. N. Bakhshi, “Steam Gasification of Chars and Bio-oil” ,
Report to Bioenergy Development Program Renewable Energy Branch, Energy, Mines and Resources Canada, Ottawa, Canada, February (2002), pp. 396-436.
Chen, N.Y. “Hydrophobic Properties of Zeolites” , Journal of Physical Chemistry 80,
60 (1976). Claude, S., “Research on New Outlets for Glycerol – Recent Developments in
France”, 52nd International Congress and Expo of DGF, Magdeburg, Germany, September 13-15 (1998).
Cortright, R.D, R.R. Davda and J.A. Dumesic, “Hydrogen from Catalytic Reforming
of Biomass-Derived Hydrocarbons in Liquid Water” , Nature 418, 964-967 (2002). Czernik, S., R. French, C. Feik and E. Chornet, “Production of Hydrogen from
Biomassderived Liquids” , Proceedings of the 2000 DOE Hydrogen Program Review (2000).
Dabbagh, H., M. Yalfani and B. Davis, “An XRD and Fourier Transformed Infrared
Spectroscopy Investigation of Single and Mixed γ-alumina and Thorium Oxide” , Journal of Molecular Catalysis A: Chemical 238, 72-77 (2005).
Dalai, A.K., N.N. Bakhshi, X. Lang, M.J. Reaney, P.B. Hertz and J. Munson,
“Production of Diesel Fuel Lubricity Additives from Various Vegetable Oils” , Annual Interim Report for Canodev Research Inc. April (2000).
Derouane, E.G., J.B. Nagy, P.Dejaifve, J.H.C. Van hoof, B.P. Speckman, J.C.
Vedrine, C. Naccache, “Elucidation of the Mechanism of Conversion of Methanol and Ethanol to Hydrocarbons on a New Type of Synthetic Zeolite” Journal of Catalysis 53, 40 (1978).
Digne, M., P. Sautet, P. Raybaud, P. Euzenc, H. Toulhoat, “Use of DFT to Achieve a
Rational Understanding of Acid–Basic Properties of γ -alumina Surfaces” , Journal of Catalysis 226, 54–68 (2004).
Falamaki, C., M. Edrissi, M. Sohrabi, “Studies on the Crystallization Kinetics of
Zeolite ZSM-5 With 1,6-Hexanediol as a Structure-Directing Agent ” , Zeolite 19, 2 (1997).

108
Fordham, P, M. Besson and P. Gallezot, “Selective Catalytic Oxidation of Glyceric Acid to Tartronic and Hydroxypyruvic Acids” , Applied Catalysis A: General 133, LI79-LI84 (1995).
Furrer, R.M., Master’s Thesis “Direct Conversion of Plant Tall Oils and De-pitched
Tall Oil to Fuels and Chemicals Using HZSM-5 Catalyst” , University of Saskatchewan (1988).
Gutiérrez, G., A. Taga and B. Johansson, “Theoretical structure determination of γ-
Al2O3” , Physical Reviews B 65, 012101 (2001). Garcia, R, M Besson and P Gallezot, “Chemoselective Catalytic Oxidation of
Glycerol with Air on Platinum Metals” , Applied Catalysis A: General 127, 165-176 (1995).
Gates, B.C., J.R. Kazert and G. Schuit, “Chemistry of Catalytic Processes” , McGraw
Hill (1979), pp. 5-7; pp. 85-89. Grieken, R., J.L Van Sotelo, J.M Menendez and J.A. Melero, “Anomalous
Crystallization Mechanism in the Synthesis of Nanocrystalline ZSM-5”, Microporous and Mesoporous Materials 39, 135-147 (2000).
Haas, M.J., “ Improving Economics of Biodiesel Production Through the Use of Low
Value Lipids as Feedstocks: Vegetable Oil Soapstack” , Fuel Processing Technology 86, 1087-1096 (2005).
http://www.canola-council.org/ as on 25/5/2004. http://www.chemicalmarketreporter.com accessed July 2005. http://www.inchem.org/documents/ehc/ehc/ehc127.htm accessed July 2005. http://www.the-innovation-group.com/ChemProfiles/Formaldehyde.htm accessed July 2005. Huber, G.W., J.W. Shabaker and J.A. Dumesic, “Raney Ni-Sn Catalyst for H2
Production from Biomass-Derived Hydrocarbons” , Science 30, 2075 (2003). Jacobs, P., H.K. Beyer and J. Valyon, “Properties of the End Members in the
Pentasil-Family of Zeolites: Characterization as Adsorbents” , Zeolites 1, 161-168 (1981).
Katikaneni, S.P.R., J.D. Adjaye and N.N. Bakhshi, “Studies on the Catalytic
Conversion of Canola Oil to Hydrocarbons, Influence of Hybrid Catalysts and Steam”, Energy Fuels 9, 599-609 (1995).

109
Katikaneni, S.P.R., J.D. Adjaye, R. O. Idem and N. N. Bakhshi, “Performance of Various Cracking Catalysts in the Conversion of Canola Oil to Fuels and Chemicals in a Fluidized Bed Reactor” , JAOCS 75, 381-391 (1998).
Kumar, N., V. Nieminen, K. Demirkan, T. Salmi, D.Y. Murzin and E. Laine, “Effect
of Synthesis Time and Mode of Stirring on Physico-Chemical and Catalytic Properties of ZSM-5 Zeolite Catalysts” , Applied Catalysis A: General 235, 113 (2002).
Lewandowski, M. and Z. Sarbak, “The Effects of Boron Addition to
Hydrodesulphurization and Hydrodenitrogenation Activity of NiMo/Al2O3 catalysts” , Fuel 79, 487 (2000).
Ma, F. and M.A. Hanna, “Biodiesel Production: a Review”, Bioresource Technology
70, 1-15(1999). McMorn, P., G. Roberts and G.H. Hutchings, “Oxidation of Glycerol with Hydrogen
Perxode Using Silicalite and Aluminophosphate Catalysts” , Catalysis Letters 63, 193-197 (1999).
Molina, R., A. Schutz and G. Poncelet, “Transformation of m-xylene over
Aluminium Pillared Clays and Ultrastable Zeolite Y” , Journal of Catalysis 145, 79 -85 (1994).
Nam, I. and G.F. Froment, “Catalyst deactivation by site coverage through multi site
reaction mechanisms”, Journal of Catalysis, 108, 271 (1987). Neher, A., T. Haas, D. Arntz. H. Klenk and W. Girke, “Process for the Production of
Acrolein” , US Patent 5387720, (1995). Noordin, M.Y., V.C. Venkatesh, S. Sharif, S. Elting and A. Abdullah, “Application
of Response Surface Methodology in Describing the Performance of Coated Tools When Turning AISI 1045 Steel” , Journal of Material Processing Technology 145, 46-58 (2004).
Oslon, D.H., G.T. Kokotalio, S.L. Lawton and W.M. Meier, “Crystal Structure and
Structure Related Properties of HZSM-5”, Journal of Physical Chemistry 85, 2238-43 (1981).
Peterson, C., G. Moller, R. Haws, X. Zhang, J. Thompson and D. Reece,
“Optimization of a Batch Type Ethyl Ester Process from Ethyl Ester Process Scale-Up and Biodegradability of Biodiesel” , report for the United States Department of Agriculture (1997).
Pinto, H. P., R. M. Nieminen and Simon D. Elliott, “Ab initio Study of γ-Al2O3
Surfaces” , Physical Review B 70, 125402 (2004).

110
Plyuto, Y.V., I. Babich, L. Sharanda, A. Marco de Wit and J. Mol, “Thermolysis of Ru(acac)3 Supported on Silica and Alumina” , Thermochimica Acta 335, 87-91 (1999).
Prakash, C.B., “A Critical Review of Biodiesel as a Transportation Fuel in Canada,
Report to Transportation System Branch”, Air Pollution Prevention Directorate, Environment Canada, March 25 (1998).
Prasad, Y.S., N.N. Bakhshi, J.F. Matthews and R.L. Eager, “Catalytic Conversion of
Canola Oil to Fuels and Chemical Feed Stock, Part I. Effect of Process Conditions on Performance of HZSM-5 Catalyst” , Canadian Journal of Chemical Engineering 64, 278-284 (1986).
Rajagopal, S., T. L. Grimm, D. J. Collins and R. Miranda, “Denitrogenation of
Piperidine on Alumina, Silica, and Silica-Aluminas: The Effect of Surface Acidity” , Journal of Catalysis 137, 453-461 (1992).
Reding, G., T. Maurer and B. Czarnetzki, “Comparing Synthesis Routes to Nano-
Crystalline Zeolite ZSM-5”, Microporous and Mesoporous Materials 57, 83-92 (2003).
Rinaldi, R. and U. Schuchardt, “Factor Responsible for the Activity of Alumina
Surfaces in Catalytic Epoxidation of Cis-Cyclooctene with Aqueous H2O2” , Journal of Catalysis 227, 109-116 (2004).
Sang, S., F. Chang, A. liu, C. He, Y. He and L. Xu, “Difference of ZSM-5 Zeolites
Synthesized with Various Templates” , Catalysis Today 93-95, 729-734 (2004). Sato, S., R. Takahashi, T. Sodesawa, C. Kobayashi, A. Miura and K. Ogura,
“Variations in Structure and Acidity of Silica-Alumina During Steaming Process” , Physical Chemistry Chemical Physics 3, 885-891 (2001).
Satterfield, C. N., “Heterogeneous Catalysis in Industrial Practice 2nd ed.” , McGraw
Hill (1991), pp. 143. Smith, C., “Biodiesel Revolution Gathering Momentum”, www.straight.com
accessed on August 10, 2005 Stein, Y.S. and M.J. Antal Jr., “A Study of the Gas-Phase Pyrolysis of Glycerol” ,
Journal of Analytical and Applied Pyrolysis 4, 283-296 (1983). Szostak, R., “Handbook of Molecular Sieves” , Van Nostrand Reinhold New York
(1992), pp. 519. Thiruchitrambalam, V., Master’s Thesis “Hydrogen and Syn gas Production from
Glycerol Using Pyrolysis and Steam Gasification” , University of Saskatchewan (2004).
111
Thomas, M., Y. Beauchamp, Y. A. Youssef and J. Masounave, “An Experimental
Design for Surface Roughness and Built-up Edge Formation in Lathe Dry Turning” , International Journal of Quality Science 2, 3 167-180 (1997).
Védrine, J. C., A. Auroux, P. Dejaifve, V. Ducarme, H. Hoser and S. Zhou,
“Catalytic and Physical Properties of Phosphorus-modified ZSM-5 Zeolite” , Journal of Catalysis 73, 147-160 (1982).
Wang, D., D. Montané and E. Chornet, “Catalytic Steam Reforming of Biomass-
Derived Oxygenates: Acetic Acid and Hydroxyacetaldehyde”, Applied Catalysis A: General 143, 245-270 (1996).
Wolverton, C. and K. C. Hass, “Phase Stability and Structure of Spinel-based
Transition Aluminas” , Physical Reviews B 63, 024102 (2000). Xu, X., Y. Matsumura, J. Stenberg and M.J. Antal, Jr., “Carbon-Catalyzed
Gasification of Organic Feedstocks in Supercritical Water” , Ind. Eng. Chem. Res. 35, 2522-2530 (1996).
Zhang, Y., M. A. Dube, DD. McLean and M. Kates, “Biodiesel Production from
Waste Cooking Oil: 2. Economic Assessment and Sensitivity Analysis” , Bioresource Technology 90, 229-240 (2003).
Zhong, Li, K. Xie and R. C.T. Slade, “Studies on the Interaction CuCl and HY
Zeolite for Preparing Hetergeneous Cu Catalyst” , Applied catalysis A: General 202, 107-115 (2001).

112
7 APPENDICES
Appendix A: Exper imental results for glycerol conversion over HZSM-5
Table A1: Compar ison of liquid, gas and char product under different exper imental conditions for glycerol conversion over HZSM-5 Experimental Conditions Wt% of total Products Exp #
T (oC)
CGF (mL/min)
WHSV (h -1)
Glycerol fed (g)
Conversion (wt%)
Total Liquid Product
(g)
Gas Product
(g)
Char and
residue (g)
Total Product
(g) Gas Liquid Char and
residue
Un- accounted
(wt%)
Mass balance (wt%)
1 380 26 8.68 4.87 41.0 4.05 0.02 0.38 4.45 0.50 90.97 8.54 8.60 91.4
2 425 35 13.50 4.92 52.6 4.34 0.04 0.13 4.51 0.82 96.30 2.88 8.30 91.7
3 425 35 13.50 4.89 46.3 4.37 0.03 0.22 4.62 0.74 94.50 4.76 5.50 94.5
4 380 26 18.32 4.53 27.0 3.84 0.01 0.25 4.1 0.27 93.63 6.10 9.50 90.5
5 500 35 13.50 4.57 60.8 4.09 0.09 0.11 4.29 2.17 95.26 2.56 6.10 93.9
6 470 26 18.32 4.40 56.8 3.92 0.05 0.12 4.09 1.20 95.87 2.93 7.00 93.0
7 470 44 18.32 5.00 68.3 4.06 0.06 0.41 4.53 1.42 89.54 9.04 9.40 90.6
8 470 44 8.68 4.61 67.6 3.85 0.08 0.28 4.21 1.81 91.53 6.66 8.70 91.3
9 350 35 13.50 4.94 24.9 4.28 0.02 0.3 4.6 0.36 93.11 6.53 6.90 93.1
10 380 44 18.32 4.89 28.2 4.32 0.02 0.18 4.52 0.45 95.57 3.98 7.60 92.4
11 425 35 13.50 5.09 44.0 4.57 0.04 0.22 4.57 0.86 93.30 4.53 5.10 94.9
13 470 26 8.68 4.65 78.8 3.98 0.08 0.2 4.26 1.93 93.40 4.70 8.40 91.6
14 425 35 5.40 4.27 73.3 3.17 0.14 0.31 3.62 3.80 87.60 8.60 5.39 94.6
15 380 44 8.68 4.05 37.2 3.21 0.02 0.38 3.61 0.62 88.86 10.52 10.80 89.2
16 425 50 13.50 4.60 45.2 3.8 0.05 0.34 4.19 1.08 90.79 8.12 8.90 91.1
18 425 20 13.50 4.57 57.7 4.07 0.04 0.11 4.22 0.97 96.42 2.61 7.70 92.3
20 425 35 21.60 4.75 39.2 4.05 0.04 0.35 4.45 1.04 91.08 7.87 6.30 93.7
112

113
Table A2: Composition of liquid product from glycerol conversion over HZSM-5
Experiment number Compound
(wt %) 1 2 3 4 5 6 7 8 9 10 11 13 14 15 16 18 20
Acetaldehyde 4.98 7.59 8.51 2.90 17.59 13.46 13.09 14.06 2.15 1.76 8.72 17.35 17.41 2.67 5.00 11.45 5.67
Acetone 0.22 0.47 0.53 0.89 0.84 0.78 0.70 0.44 1.57 0.36 0.21 1.16 1.14 0.42 0.23 0.60 0.25
Acrolein 4.80 5.04 5.89 2.43 10.10 7.46 10.33 10.91 1.65 1.05 7.00 15.24 14.12 2.63 2.40 11.33 3.99
Formaldehyde 5.00 7.47 8.51 3.35 6.62 8.27 7.38 4.46 2.93 2.65 7.72 5.27 5.02 2.15 5.71 6.01 7.89
IPA 0.20 0.26 0.49 0.46 0.23 0.34 0.25 0.24 0.82 0.20 0.25 0.26 0.16 0.23 0.20 0.25 0.45
Allyl Alcohol 4.31 8.32 6.77 5.33 3.71 5.82 5.52 1.99 1.60 5.28 6.42 2.56 0.33 2.14 5.92 4.63 12.03
Acetol 13.51 16.80 15.21 13.38 17.16 16.34 18.06 15.15 5.30 10.82 14.94 14.39 13.04 12.17 15.91 12.81 16.93
Acetic Acid 1.19 1.04 1.14 0.96 0.49 0.85 0.48 0.55 0.62 0.83 0.81 0.61 0.19 0.93 0.96 0.82 0.90
Propionic Acid 3.45 2.84 2.45 3.06 1.50 2.52 1.46 1.72 2.09 2.44 2.21 1.83 1.47 2.86 2.91 2.38 2.41
Glycerol Formal 5.00 1.82 2.63 5.41 2.13 1.53 1.07 1.84 4.86 3.10 2.45 1.13 1.69 4.57 2.50 3.35 2.62
Phenol 0.39 0.23 0.29 0.31 0.04 0.18 0.10 0.05 0.22 0.24 0.15 0.14 0.04 0.38 0.27 0.16 0.27
Water 46.96 23.53 29.73 42.26 28.63 27.00 26.74 32.43 41.89 50.41 29.27 27.00 32.50 50.65 33.83 25.28 30.78
Unknowns 10.00 24.59 17.86 19.24 10.96 15.48 14.81 16.16 34.30 20.86 19.84 13.06 12.90 18.21 24.17 20.94 15.81
Total 100.00 100.00 100.00 100.00 100.00 100.00 100.00 100.00 100.00 100.00 100.00 100.00 100.00 100.00 100.00 100.00 100.00
113

11
4
Tab
le A
3: C
ompo
siti
on o
f ga
s pr
oduc
t fr
om g
lyce
rol c
onve
rsio
n ov
er H
ZSM
-5
Exp
erim
enta
l Con
ditio
ns
CO
C
O2
CH
4 C
2+
EX
P #
T
(o C
) C
GF
(mL
/min
) W
HSV
(
h -1)
Gas
Pro
duct
(g
) ga
s m
L/g
fe
ed
mol
%
1 38
0 26
8.
68
0.02
3.
1 61
.5
26.8
2.
2 9.
4
2 42
5 35
13
.50
0.04
5.
0 53
.3
29.9
2.
6 14
.3
3 42
5 35
13
.50
0.03
4.
8 59
.9
20.0
2.
4 17
.6
4 38
0 26
18
.32
0.01
1.
6 60
.2
25.6
2.
8 11
.4
5 50
0 35
13
.50
0.09
13
.0
54.3
17
.3
4.3
24.1
6 47
0 26
18
.32
0.05
7.
5 55
.7
19.4
2.
8 22
.0
7 47
0 44
18
.32
0.06
8.
5 48
.7
24.5
3.
5 23
.3
8 47
0 44
8.
68
0.08
11
.1
53.2
22
.7
3.6
20.5
9 35
0 35
13
.50
0.02
1.
7 -
87.4
-
12.5
10
380
44
18.3
2 0.
02
2.1
- 83
.9
- 16
.1
11
425
35
13.5
0 0.
04
5.4
53.7
20
.1
2.6
23.6
13
470
26
8.68
0.
08
12.3
55
.5
18.3
4.
0 22
.2
14
425
35
5.40
0.
14
7.7
59.5
13
.0
4.6
23.1
15
380
44
8.68
0.
02
4.0
68.4
14
.2
- 17
.4
16
425
50
13.5
0 0.
05
6.5
51.4
30
.4
1.9
16.3
18
425
20
13.5
0 0.
04
6.0
50.2
26
.3
3.0
20.8
20
425
35
21.6
0 0.
04
5.9
39.8
41
.3
1.8
17.2
114

115
Appendix B: Exper imental results for glycerol conversion over HY Table B1: Compar ison of liquid, gas and char product under different exper imental conditions for glycerol conversion over HY
Experimental Conditions Wt% of total Products
Exp # T (oC)
CGF (mL/min)
WHSV (h -1)
Glycerol fed (g)
Conversion (wt%)
Total Liquid Product
(g)
Gas Product
(g)
Char and
residue (g)
Total Product
(g) Gas Liquid Char and
residue
Un- accounted
(wt%)
Mass balance (wt%)
1 380 26 8.68 5.18 79.1 4.17 0.21 0.51 4.88 4.2 85.4 10.4 5.8 94.2
2 425 35 13.50 4.89 92.7 3.84 0.18 0.41 4.43 4.0 86.7 9.3 9.4 90.6
3 425 35 13.50 5.5 95.3 4.47 0.18 0.32 4.97 3.6 89.9 6.4 9.6 90.4
4 380 26 18.32 4.59 59.2 3.8 0.06 0.35 4.21 1.5 90.2 8.3 8.3 91.7
5 500 35 13.50 4.91 98.0 3.69 0.37 0.43 4.49 8.3 82.1 9.6 8.6 91.4
6 470 26 18.32 4.68 95.7 3.84 0.23 0.26 4.32 5.2 88.8 6.0 7.7 92.3
7 470 44 18.32 5.04 95.8 3.86 0.28 0.41 4.55 6.1 84.9 9.0 9.7 90.3
8 470 44 8.68 5.24 99.6 4.23 0.35 0.17 4.76 7.5 88.9 3.6 9.2 90.8
9 350 35 13.50 5.29 66.7 4.5 0.06 0.41 4.97 1.2 90.5 8.2 6.0 94.0
10 380 44 18.32 5.26 76.3 3.96 0.08 0.75 4.79 1.7 82.6 15.6 8.9 91.1
13 470 26 8.68 4.61 100.0 3.57 0.43 0.35 4.35 9.9 82.1 8.0 5.6 94.4
14 425 35 5.40 4.53 99.3 3.37 0.47 0.31 4.15 11.3 81.2 7.5 8.4 91.6
15 380 44 8.68 4.79 88.0 3.82 0.17 0.38 4.37 3.9 87.4 8.7 8.8 91.2
16 425 50 13.50 5.29 98.5 4.36 0.20 0.32 4.88 4.2 89.3 6.6 7.8 92.2
18 425 20 13.50 4.78 95.1 3.89 0.15 0.42 4.47 3.5 87.1 9.4 6.5 93.5
20 425 35 21.60 4.8 71.1 3.98 0.12 0.35 4.45 2.7 89.4 7.9 7.3 92.7
115

116
Table B2: Composition of liquid product from glycerol conversion over HY
Experiment number Compound
(wt %) 1 2 3 4 5 6 7 8 9 10 11 13 14 15 16 18 20
Acetaldehyde 10.40 14.60 16.19 5.36 24.08 19.71 19.09 19.35 5.48 7.73 18.23 21.52 12.79 15.80 17.15 12.04 10.40
Acetone 0.20 0.49 0.48 0.10 1.05 0.64 0.68 1.11 0.11 0.24 0.87 0.90 0.31 0.41 0.39 0.35 0.20
Acrolein 15.68 17.08 17.73 7.76 16.27 18.46 17.10 16.38 11.78 9.26 15.05 13.88 15.41 17.01 19.10 12.26 15.68
Formaldehyde 8.76 6.72 9.84 7.99 4.71 5.53 5.95 6.58 7.67 10.67 6.52 9.55 1.99 10.57 8.83 8.06 8.76
IPA 0.33 0.29 0.41 0.28 0.20 0.24 0.34 0.26 0.11 0.41 0.32 0.68 0.52 0.40 0.34 0.30 0.33
Allyl Alcohol 1.35 0.92 1.26 1.30 0.69 0.94 0.95 0.53 1.52 1.76 0.40 0.37 1.17 1.25 0.92 0.92 1.35
Acetol 12.72 12.51 17.05 12.15 15.77 14.32 20.36 12.78 11.50 15.22 9.94 7.23 14.51 17.85 12.37 12.79 12.72
Acetic Acid 0.66 0.14 0.08 0.62 0.04 0.09 0.09 0.64 0.88 0.89 0.69 1.39 0.42 0.66 0.50 0.46 0.66
Propionic Acid 1.87 0.53 0.24 1.80 0.04 0.28 0.33 0.03 2.26 2.21 0.40 0.81 1.22 0.24 0.46 1.47 1.87
Glycerol Formal 2.87 1.01 0.98 2.19 0.26 0.42 0.46 0.24 3.87 3.18 0.18 0.48 2.40 0.88 1.19 1.35 2.87
Phenol 0.16 0.11 0.07 0.21 0.10 0.09 0.11 0.09 0.28 0.21 0.11 0.12 0.09 0.08 0.10 0.10 0.16
Water 31.08 29.65 23.28 36.98 29.88 28.77 28.06 31.01 27.88 29.59 32.66 36.58 31.55 26.61 28.00 31.27 31.08
Unknowns 13.92 15.96 12.40 23.24 6.92 10.48 6.50 11.00 26.64 18.61 14.62 6.49 17.63 8.25 10.66 18.63 13.92
Total 100.00 100.00 100.00 100.00 100.00 100.00 100.00 100.00 100.00 100.00 100.00 100.00 100.00 100.00 100.00 100.00 100.00
116

11
7
T
able
B3:
Com
posi
tion
of
gas
prod
uct
from
gly
cero
l con
vers
ion
over
HY
Exp
erim
enta
l Con
ditio
ns
CO
C
O2
CH
4 C
2+
EX
P #
T
(o C)
CG
F
(m
L/m
in)
WH
SV
(h-1
)
Gas
Pro
duct
(g)
gas
mL
/g f
eed
mol
%
1 38
0 26
8.
68
0.21
24
.1
39.3
47
.8
1.1
11.2
2 42
5 35
13
.50
0.18
25
.7
59.1
11
.7
4.5
24.7
3 42
5 35
13
.50
0.18
23
.4
61.5
10
.0
4.3
24.0
4 38
0 26
18
.32
0.06
9.
8 63
.0
10.2
1.
6 25
.2
5 50
0 35
13
.50
0.37
57
.4
55.4
6.
6 12
.3
25.7
6 47
0 26
18
.32
0.23
35
.6
59.0
7.
1 8.
7 25
.1
7 47
0 44
18
.32
0.28
36
.1
49.8
21
.7
7.1
21.4
8 47
0 44
8.
68
0.35
49
.7
52.0
7.
7 10
.3
29.8
9 35
0 35
13
.50
0.06
8.
0 65
.2
9.9
1.3
23.7
10
380
44
18.3
2 0.
08
10.3
54
.9
20.5
1.
6 23
.0
13
470
26
8.68
0.
43
67.7
54
.8
8.8
9.2
27.3
14
425
35
5.40
0.
47
75.1
57
.3
10.0
6.
9 25
.7
15
380
44
8.68
0.
17
24.5
61
.6
11.2
2.
1 25
.1
16
425
50
13.5
0 0.
20
27.5
62
.8
8.9
4.5
23.7
18
425
20
13.5
0 0.
15
23.8
64
.8
6.7
4.1
24.4
20
425
35
21.6
0 0.
12
17.8
65
.8
8.3
3.3
22.5
117

118
Appendix C: Exper imental results for glycerol conversion over silica-alumina
Table C1: Compar ison of liquid, gas and char product under different exper imental conditions for glycerol conversion over silica-alumina
Experimental Conditions Wt% of total Products Exp # T
(oC) CGF
(mL/min) WHSV (h -1)
Glycerol fed (g)
Conversion (wt%)
Total Liquid Product
(g)
Gas Product
(g)
Char and
residue (g)
Total Product
(g) Gas Liquid Char and
residue
Un- accounted
(wt%)
Mass balance (wt%)
1 380 26 8.68 5.42 99.9 4.53 0.15 0.31 4.99 3.0 90.8 6.2 8.0 92.0
2 425 35 13.50 5.00 100.0 3.87 0.35 0.34 4.55 7.6 85.0 7.4 8.9 91.1
4 380 26 18.32 5.27 100.0 4.37 0.21 0.3 4.88 4.2 89.6 6.2 7.5 92.5
5 500 35 13.50 5.06 99.7 3.73 0.57 0.37 4.67 12.2 79.9 7.9 7.7 92.3
6 470 26 18.32 5.32 100.0 4.03 0.60 0.29 4.92 12.3 81.9 5.9 7.5 92.5
7 470 44 18.32 5.12 100.0 4.36 0.09 0.22 4.67 1.9 93.4 4.7 8.8 91.2
8 470 44 8.68 4.61 99.7 3.3 0.60 0.44 4.24 14.2 77.8 8.0 7.9 92.1
9 350 35 13.50 4.71 98.4 3.8 0.16 0.34 4.3 3.6 88.5 7.9 8.8 91.2
10 380 44 18.32 4.94 100.0 4.13 0.18 0.25 4.56 4.0 90.5 5.5 7.7 92.3
11 425 35 13.50 4.39 100.0 3.5 0.36 0.3 4.15 8.3 84.4 7.2 5.6 94.4
13 470 26 8.68 5.23 100.0 3.47 0.87 0.5 4.84 17.9 71.8 10.3 7.5 92.5
14 425 35 5.40 4.48 100.0 3.4 0.35 0.43 4.18 8.3 81.4 10.3 6.7 93.3
15 380 44 8.68 5.05 100.0 4.00 0.38 0.33 4.65 6.8 86.1 7.1 8.0 92.0
16 425 50 13.50 4.2 100.0 3.38 0.24 0.25 3.87 6.2 87.3 6.5 7.8 92.2
18 425 20 13.50 4.71 100.0 3.63 0.25 0.47 4.35 5.7 83.5 10.8 7.7 92.3
20 425 35 21.60 4.61 99.1 3.77 0.21 0.25 4.23 4.9 89.2 5.9 8.3 91.7
118

119
Table C2: Composition of liquid product from glycerol conversion over silica-alumina
Experiment number Compound
(wt %) 1 2 4 5 6 7 8 9 10 11 13 14 15 16 18 20
Acetaldehyde 17.71 25.59 23.68 27.64 28.05 28.75 29.54 12.44 17.96 21.47 24.59 27.80 19.61 27.47 26.57 20.82
Acetone 0.28 1.22 0.69 7.90 8.09 1.79 2.09 0.79 1.21 1.12 0.66 2.15 1.32 2.19 2.30 1.74
Acrolein 21.27 14.62 22.64 10.20 10.73 14.58 8.51 19.99 19.76 15.80 9.27 12.19 17.36 19.55 17.16 20.20
Formaldehyde 8.09 10.39 2.41 4.45 4.74 8.01 7.23 7.47 9.52 8.01 4.70 8.36 11.27 11.41 7.77 6.76
IPA 0.46 0.25 0.59 0.09 0.36 0.18 0.14 0.38 0.47 0.30 0.18 0.21 1.10 0.31 0.35 0.33
Allyl Alcohol 0.75 0.24 5.11 0.22 0.21 0.25 0.23 0.90 0.73 0.38 0.23 0.21 0.01 0.06 0.07 0.57
Acetol 12.44 2.88 1.00 0.43 0.92 3.07 0.54 9.69 10.53 6.88 4.04 0.34 5.45 2.56 6.37 9.56
Acetic Acid 0.57 0.09 0.03 0.90 0.71 0.97 1.44 0.73 0.51 0.88 0.52 1.47 0.75 0.48 0.78 0.54
Propionic Acid 0.31 0.20 0.69 0.04 0.04 0.02 0.04 0.46 0.07 0.02 0.01 0.02 0.01 0.02 0.02 0.07
Glycerol Formal 1.73 0.19 0.55 0.22 0.15 0.13 0.16 2.08 0.81 0.87 0.51 0.48 0.19 0.14 0.59 1.18
Phenol 0.11 0.17 0.00 0.13 0.11 0.16 0.11 0.22 0.14 0.19 0.11 0.16 0.19 0.11 0.14 0.16
Water 21.80 35.05 25.84 34.63 32.46 32.82 40.70 31.16 28.50 35.14 37.32 37.18 31.83 31.44 29.65 26.72
Unknowns 14.48 9.12 16.76 13.14 13.44 9.26 9.26 13.68 9.80 8.94 17.86 9.43 10.91 4.25 8.23 11.37
Total 100.00 100.00 100.00 100.00 100.00 100.00 100.00 100.00 100.00 100.00 100.00 100.00 100.00 100.00 100.00 100.00
119

120
Table C3: Composition of gas product from glycerol conversion over silica-alumina
Experimental Conditions H2 CO CO2 CH4 C2+ EXP # T
(oC) CGF
(mL/min) WHSV (h -1)
Gas product
(g)
Gas mL/g feed mol %
1 380 26 8.68 0.15 19.8 - 75.3 10.0 1.9 12.7
2 425 35 13.50 0.35 49.7 - 69.5 11.6 3.2 15.7
4 380 26 18.32 0.21 28.8 - 76.0 9.0 1.9 13.0
5 500 35 13.50 0.57 86.5 - 62.2 4.4 10.4 18.9
6 470 26 18.32 0.60 86.3 3.2 65.5 6.5 10.1 17.9
7 470 44 18.32 0.09 12.5 - 66.5 9.5 6.2 16.9
8 470 44 8.68 0.60 95.4 - 60.0 8.7 7.8 23.3
9 350 35 13.50 0.16 22.9 - 69.5 18.6 0.9 11.0
10 380 44 18.32 0.18 26.4 - 74.3 9.7 1.7 14.4
11 425 35 13.50 0.35 56.9 - 69.3 11.6 3.3 15.8
13 470 26 8.68 0.87 124.8 - 57.2 7.1 13.0 22.5
14 425 35 5.40 0.35 56.1 - 69.3 11.6 3.2 15.8
15 380 44 8.68 0.32 43.8 - 69.0 15.1 1.3 14.5
16 425 50 13.50 0.24 41.4 - 71.8 9.8 2.4 16.0
18 425 20 13.50 0.25 37.8 - 67.6 9.3 3.7 19.3
20 425 35 21.60 0.21 31.3 - 65.4 14.2 2.4 17.9
120
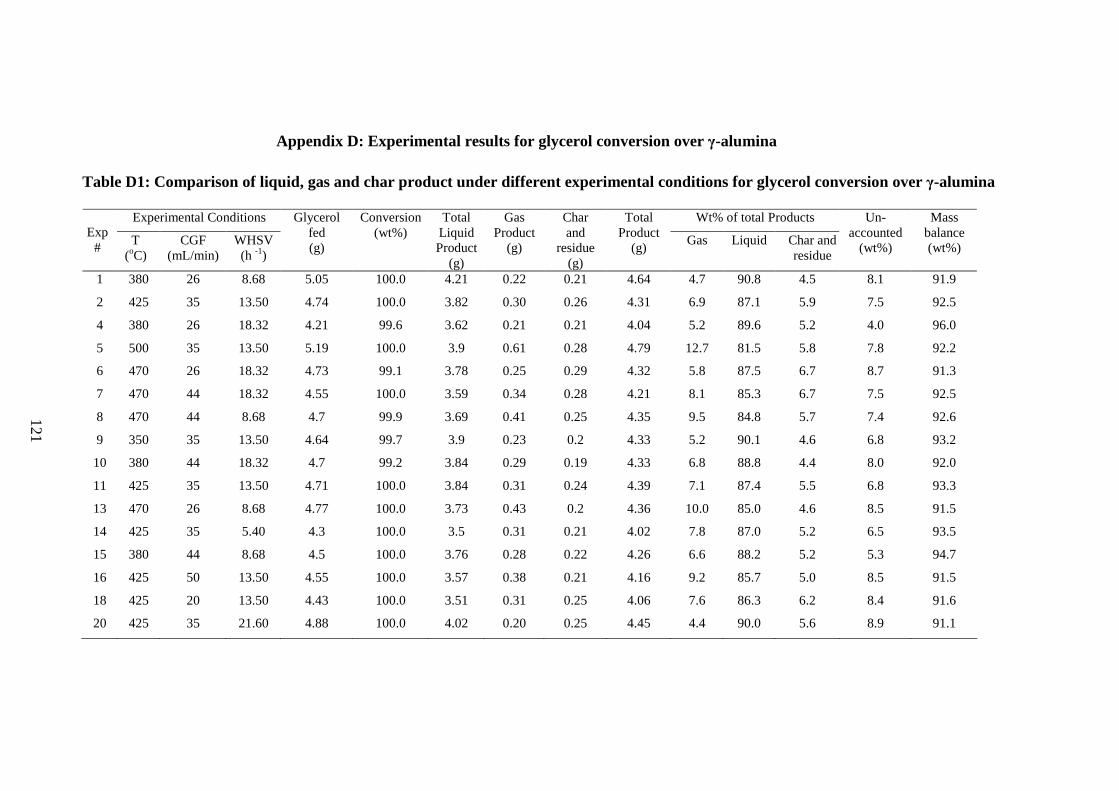
121
Appendix D: Exper imental results for glycerol conversion over γ-alumina
Table D1: Compar ison of liquid, gas and char product under different exper imental conditions for glycerol conversion over γ-alumina
Experimental Conditions Wt% of total Products Exp # T
(oC) CGF
(mL/min) WHSV (h -1)
Glycerol fed (g)
Conversion (wt%)
Total Liquid Product
(g)
Gas Product
(g)
Char and
residue (g)
Total Product
(g) Gas Liquid Char and
residue
Un- accounted
(wt%)
Mass balance (wt%)
1 380 26 8.68 5.05 100.0 4.21 0.22 0.21 4.64 4.7 90.8 4.5 8.1 91.9
2 425 35 13.50 4.74 100.0 3.82 0.30 0.26 4.31 6.9 87.1 5.9 7.5 92.5
4 380 26 18.32 4.21 99.6 3.62 0.21 0.21 4.04 5.2 89.6 5.2 4.0 96.0
5 500 35 13.50 5.19 100.0 3.9 0.61 0.28 4.79 12.7 81.5 5.8 7.8 92.2
6 470 26 18.32 4.73 99.1 3.78 0.25 0.29 4.32 5.8 87.5 6.7 8.7 91.3
7 470 44 18.32 4.55 100.0 3.59 0.34 0.28 4.21 8.1 85.3 6.7 7.5 92.5
8 470 44 8.68 4.7 99.9 3.69 0.41 0.25 4.35 9.5 84.8 5.7 7.4 92.6
9 350 35 13.50 4.64 99.7 3.9 0.23 0.2 4.33 5.2 90.1 4.6 6.8 93.2
10 380 44 18.32 4.7 99.2 3.84 0.29 0.19 4.33 6.8 88.8 4.4 8.0 92.0
11 425 35 13.50 4.71 100.0 3.84 0.31 0.24 4.39 7.1 87.4 5.5 6.8 93.3
13 470 26 8.68 4.77 100.0 3.73 0.43 0.2 4.36 10.0 85.0 4.6 8.5 91.5
14 425 35 5.40 4.3 100.0 3.5 0.31 0.21 4.02 7.8 87.0 5.2 6.5 93.5
15 380 44 8.68 4.5 100.0 3.76 0.28 0.22 4.26 6.6 88.2 5.2 5.3 94.7
16 425 50 13.50 4.55 100.0 3.57 0.38 0.21 4.16 9.2 85.7 5.0 8.5 91.5
18 425 20 13.50 4.43 100.0 3.51 0.31 0.25 4.06 7.6 86.3 6.2 8.4 91.6
20 425 35 21.60 4.88 100.0 4.02 0.20 0.25 4.45 4.4 90.0 5.6 8.9 91.1
121

12
2
Tab
le D
2: C
ompo
siti
on o
f liq
uid
prod
uct
from
gly
cero
l con
vers
ion
over
γ-a
lum
ina
E
xper
imen
t num
ber
Com
poun
d
(wt %
)
1 2
4 5
6 7
8 9
10
11
13
14
15
16
18
20
Ace
tald
ehyd
e 10
.62
9.13
5.
95
20.0
7 12
.08
12.2
9 14
.97
10.0
1 6.
95
10.9
4 14
.61
10.5
1 9.
18
9.88
8.
13
8.12
Ace
tone
2.
46
2.39
0.
40
3.41
1.
52
1.54
1.
78
2.20
1.
76
2.20
5.
16
2.60
1.
60
1.95
3.
01
2.21
Acr
olei
n 19
.88
15.5
5 18
.17
15.1
5 18
.01
13.7
0 15
.40
16.9
0 12
.12
16.6
9 14
.43
11.5
8 30
.23
21.6
4 16
.34
21.1
2
Form
alde
hyde
6.
57
3.76
4.
72
6.97
3.
97
5.18
6.
00
6.44
4.
79
6.81
4.
85
4.78
6.
28
5.28
2.
88
4.68
IPA
0.
24
0.17
0.
19
0.27
0.
20
0.22
0.
23
0.20
0.
14
0.44
0.
21
0.33
0.
10
0.20
0.
14
0.18
All
yl A
lcoh
ol
0.57
0.
46
1.15
0.
38
0.60
0.
43
0.33
0.
52
1.05
0.
50
0.34
0.
33
1.56
0.
67
0.52
0.
80
Ace
tol
4.98
7.
32
13.0
4 0.
75
0.90
4.
15
5.36
4.
39
10.4
7 2.
48
2.35
1.
59
10.3
1 9.
74
6.87
12
.26
Ace
tic A
cid
0.62
0.
49
0.81
0.
66
0.46
0.
53
0.79
0.
56
0.68
0.
79
0.67
0.
60
0.90
0.
48
0.47
0.
49
Pro
pion
ic A
cid
0.02
0.
05
0.08
0.
04
0.02
0.
03
0.04
0.
02
0.02
0.
02
0.03
0.
01
0.11
0.
06
0.03
0.
03
Gly
cero
l For
mal
0.
39
0.35
1.
23
0.13
0.
38
0.21
0.
36
0.41
0.
82
0.35
0.
19
0.17
0.
48
0.49
0.
32
0.66
Phe
nol
0.60
0.
43
0.72
0.
23
0.32
0.
27
0.47
0.
56
0.51
0.
66
0.39
0.
37
0.61
0.
39
0.34
0.
39
Wat
er
31.8
8 33
.31
22.5
4 35
.56
30.8
9 35
.17
37.8
2 34
.26
31.9
7 32
.74
38.4
3 37
.62
32.0
2 29
.13
30.7
5 28
.07
Unk
now
ns
21.1
8 26
.57
30.9
9 16
.39
30.6
6 26
.27
16.4
3 23
.54
28.7
3 25
.37
18.3
5 29
.51
6.62
20
.09
30.2
0 20
.99
Tot
al
100.
00
99.9
8 99
.99
100.
00
100.
00
99.9
9 99
.98
100.
00
100.
00
100.
00
100.
00
100.
00
100.
00
100.
00
100.
00
100.
00
122

123
Table D3: Composition of gas product from glycerol conversion over γ-alumina
Experimental Conditions CO CO2 CH4 C2+ EXP # T
(oC) CGF
(mL/min) WHSV (h -1)
Gas Product (g)
Gas mL/g feed mol %
1 380 26 8.68 0.22 31.0 71.9 16.4 1.9 9.8
2 425 35 13.50 0.30 45.4 66.4 16.1 3.3 14.3
4 380 26 18.32 0.21 36.1 73.0 16.0 1.9 9.1
5 500 35 13.50 0.61 88.0 65.8 9.9 9.0 15.2
6 470 26 18.32 0.25 37.7 65.8 15.9 4.7 13.5
7 470 44 18.32 0.34 54.4 67.6 13.2 5.4 13.7
8 470 44 8.68 0.41 62.8 64.6 15.2 5.4 14.8
9 350 35 13.50 0.23 34.9 72.7 15.5 2.0 9.8
10 380 44 18.32 0.30 44.4 69.8 18.4 2.0 9.9
11 425 35 13.50 0.31 46.9 66.4 15.8 3.4 14.4
13 470 26 8.68 0.43 65.3 63.7 15.4 5.6 15.2
14 425 35 5.40 0.31 51.0 65.4 16.4 3.2 14.8
15 380 44 8.68 0.28 44.9 72.4 15.9 1.9 9.7
16 425 50 13.50 0.38 59.9 67.5 15.0 2.9 14.6
18 425 20 13.50 0.31 49.1 68.1 15.8 3.3 12.8
20 425 35 21.60 0.20 28.6 69.8 14.8 3.0 12.4
123

124
Appendix E: L iquid, gas and char product yield results
Appendix E1: L iquid product yield under different exper imental conditions using different catalysts
Experimental Conditions Liquid product (g/100 g feed) Exp # T
(oC) CGF
(mL/min) WHSV (h -1)
HZSM-5 HY Silica-alumina �-alumina
1 380 26 8.68 24.2 59.6 83.5 83.4
2 425 35 13.50 40.8 71.2 77.4 80.6
3 425 35 13.50 35.6 76.6 -- --
4 380 26 18.32 11.8 42.0 82.9 85.6
5 500 35 13.50 50.3 73.2 73.4 75.1
6 470 26 18.32 45.9 77.8 75.8 79.0
7 470 44 18.32 49.5 72.4 85.2 78.9
8 470 44 8.68 51.1 80.3 71.3 78.4
9 350 35 13.50 11.5 51.8 79.1 83.7
10 380 44 18.32 16.5 51.6 83.6 80.9
11 425 35 13.50 33.8 -- 79.7 81.5
13 470 26 8.68 64.4 77.4 66.3 78.2
14 425 35 5.40 47.5 73.7 75.9 81.4
15 380 44 8.68 16.4 67.7 79.2 83.6
16 425 50 13.50 27.8 80.9 80.5 78.4
18 425 20 13.50 46.8 76.4 77.1 79.0
20 425 35 21.60 24.5 54.0 80.9 82.0
124

125
Appendix E2: Gas product yield (g/100 g feed) under different exper imental conditions using different catalysts
Experimental Conditions Gas product (g/100 g feed) Exp #
T (oC)
CGF (mL/min)
WHSV (h -1)
HZSM-5 HY Silica-alumina �-alumina
1 380 26 8.68 0.49 3.96 2.71 4.34
2 425 35 13.50 0.75 3.64 6.90 6.41
3 425 35 13.50 0.70 3.27 -- --
4 380 26 18.32 0.22 1.41 3.93 5.04
5 500 35 13.50 1.97 7.60 11.28 11.70
6 470 26 18.32 1.09 4.81 11.30 5.26
7 470 44 18.32 1.20 5.52 1.70 7.47
8 470 44 8.68 1.65 6.68 13.10 8.74
9 350 35 13.50 0.32 1.15 3.31 4.87
10 380 44 18.32 0.41 1.59 3.64 6.17
11 425 35 13.50 0.79 -- 8.11 6.62
13 470 26 8.68 1.78 9.33 16.56 9.10
14 425 35 5.40 3.28 10.38 7.79 7.21
15 380 44 8.68 0.49 3.55 7.52 6.27
16 425 50 13.50 0.98 3.84 5.74 8.44
18 425 20 13.50 0.88 3.14 5.27 6.93
20 425 35 21.60 0.84 2.50 4.45 4.02
125

126
Appendix E3: Char and residue yield (g/100 g feed) under different exper imental conditions using different catalysts
Experimental Conditions Char and residue
(g/100 g feed) Exp #
T (oC)
CGF (mL/min)
WHSV (h -1)
HZSM-5 HY Silica-alumina �-alumina
1 380 26 8.68 7.80 9.85 5.72 4.16
2 425 35 13.50 2.64 8.38 6.80 5.49
3 425 35 13.50 4.50 5.82 -- --
4 380 26 18.32 5.52 7.63 5.69 4.99
5 500 35 13.50 2.41 8.76 7.31 5.39
6 470 26 18.32 2.73 5.56 5.45 6.13
7 470 44 18.32 8.20 8.13 4.30 6.15
8 470 44 8.68 6.07 3.24 9.54 5.32
9 350 35 13.50 6.07 7.75 7.22 4.31
10 380 44 18.32 3.68 14.26 5.06 4.04
11 425 35 13.50 4.32 -- 6.83 5.10
13 470 26 8.68 4.30 7.59 9.56 4.19
14 425 35 5.40 7.26 6.84 9.60 4.88
15 380 44 8.68 9.38 7.93 6.53 4.89
16 425 50 13.50 7.39 6.05 5.95 4.62
18 425 20 13.50 2.41 8.79 9.98 5.64
20 425 35 21.60 7.37 7.29 5.42 5.12
126

127
Appendix F: Acetaldehyde, acrolein, formaldehyde and acetol yields over different catalysts
Appendix F1: Acetaldehyde yield (g/100 g feed) under different exper imental conditions using different catalysts
Experimental Conditions Acetadehdye (g/100 g feed) Exp #
T (oC)
CGF (mL/min)
WHSV (h -1)
HZSM-5 HY Silica-alumina �-alumina
1 380 26 8.68 1.2 6.2 14.8 8.9
2 425 35 13.50 3.1 10.4 19.8 7.4
3 425 35 13.50 3.0 12.4 -- --
4 380 26 18.32 0.3 2.3 19.6 5.1
5 500 35 13.50 8.8 17.6 20.3 15.1
6 470 26 18.32 6.2 15.3 21.3 9.5
7 470 44 18.32 6.5 13.8 24.5 9.7
8 470 44 8.68 7.2 15.5 21.1 11.7
9 350 35 13.50 0.2 2.8 9.8 8.4
10 380 44 18.32 0.3 4.0 15.0 5.6
11 425 35 13.50 2.9 -- 17.1 8.9
13 470 26 8.68 11.2 14.1 16.3 11.4
14 425 35 5.40 6.7 15.9 21.1 8.6
15 380 44 8.68 0.4 8.7 15.5 7.7
16 425 50 13.50 1.4 12.8 22.1 7.8
18 425 20 13.50 5.4 13.1 20.5 6.4
20 425 35 21.60 1.4 6.5 16.8 6.7
127

128
Appendix F2: Acrolein yield (g/100 g feed) under different exper imental conditions using different catalysts
Experimental Conditions Acrolein (g/100 g feed) Exp #
T (oC)
CGF (mL/min)
WHSV (h -1)
HZSM-5 HY Silica-alumina �-alumina
1 380 26 8.68 1.2 9.4 17.8 16.6
2 425 35 13.50 2.1 12.2 11.3 12.5
3 425 35 13.50 2.1 13.6 -- --
4 380 26 18.32 0.3 3.3 18.8 15.6
5 500 35 13.50 5.1 11.9 7.5 11.4
6 470 26 18.32 3.4 14.4 8.1 14.2
7 470 44 18.32 5.1 12.4 12.4 10.8
8 470 44 8.68 5.6 13.2 6.1 12.1
9 350 35 13.50 0.2 6.1 15.8 14.2
10 380 44 18.32 0.2 4.8 16.5 9.8
11 425 35 13.50 2.4 -- 12.6 13.6
13 470 26 8.68 9.8 11.7 6.2 11.3
14 425 35 5.40 6.8 10.2 9.3 9.4
15 380 44 8.68 0.4 10.4 13.8 25.3
16 425 50 13.50 0.7 13.8 15.7 17.0
18 425 20 13.50 5.3 14.6 13.2 12.9
20 425 35 21.60 1.0 6.62 16.3 17.3
128

129
Appendix F3: Formaldehyde yield (g/100 g feed) under different exper imental conditions using different catalysts
Experimental Conditions Formaldehdye (g/100 g feed) Exp #
T (oC)
CGF (mL/min)
WHSV (h -1)
HZSM-5 HY Silica-alumina �-alumina
1 380 26 8.68 1.2 5.2 6.8 5.5
2 425 35 13.50 3.0 4.8 8.0 3.0
3 425 35 13.50 3.0 7.5 -- --
4 380 26 18.32 0.4 3.4 2.0 4.0
5 500 35 13.50 3.3 3.5 3.3 5.2
6 470 26 18.32 3.8 4.3 3.6 3.1
7 470 44 18.32 3.7 4.3 6.8 4.1
8 470 44 8.68 2.3 5.3 5.2 4.7
9 350 35 13.50 0.3 4.0 5.9 5.4
10 380 44 18.32 0.4 5.5 8.0 3.9
11 425 35 13.50 2.6 -- 6.4 5.6
13 470 26 8.68 3.4 5.1 3.1 3.8
14 425 35 5.40 0.7 7.0 6.3 3.9
15 380 44 8.68 0.4 1.4 8.9 5.3
16 425 50 13.50 1.6 8.6 9.2 4.1
18 425 20 13.50 2.8 6.8 6.0 2.3
20 425 35 21.60 1.9 4.4 5.5 3.8
129

13
0
App
endi
x F
4: A
ceto
l yie
ld (
g/10
0 g
feed
) un
der
diff
eren
t ex
peri
men
tal c
ondi
tion
s us
ing
diff
eren
t ca
taly
sts
Con
ditio
ns
Ace
tol (
g/10
0 g
feed
) E
xp
#
T
(o C
) C
GF
(m
L/m
in)
WH
SV
(h
-1)
HZ
SM
-5
HY
Si
lica-
alum
ina
� -alu
min
a
1 38
0 26
8.
68
3.27
7.
58
10.4
4.
2
2 42
5 35
13
.50
6.9
8.91
2.
2 5.
9
3 42
5 35
13
.50
5.4
13.1
--
--
4 38
0 26
18
.32
1.6
5.1
0.8
11.2
5 50
0 35
13
.50
8.6
11.5
0.
3 0.
6
6 47
0 26
18
.32
7.5
11.1
0.
7 0.
7
7 47
0 44
18
.32
8.9
14.7
2.
6 3.
3
8 47
0 44
8.
68
7.7
10.3
0.
4 4.
2
9 35
0 35
13
.50
0.6
6.0
7.7
3.7
10
380
44
18.3
2 1.
8 7.
9 8.
8 8.
5
11
425
35
13.5
0 5.
0 --
5.
5 2.
0
13
470
26
8.68
9.
3 7.
7 2.
7 1.
8
14
425
35
5.40
7.
7 5.
3 0.
3 1.
3
15
380
44
8.68
2.
0 9.
8 4.
3 8.
6
16
425
50
13.5
0 4.
4 14
.4
2.1
7.6
18
425
20
13.5
0 6.
0 9.
5 4.
9 5.
4
20
425
35
21.6
0 4.
1 6.
9 7.
7 10
.1
130

131
Appendix G: ANOVA Table for different responses
Table G1: Analysis of var iance showing the effect of var iables on glycerol conversion over HZSM-5 and HY
Source Of Variation
Sum Of Squares
Degree Of Freedom
Mean Square F Value Prob>F
HZSM-5 Model 3680.89 3 1226.96 27.77 < 0.0001 T 2884.48 1 2884.48 65.29 < 0.0001 C 39.83 1 39.83 0.90 0.3565 W 756.58 1 756.58 17.21 0.0008 Residual 706.9 16 44.18 Pure Error 53.76 5 10.75 Total 4387.90 19
HY Model 2634.46 9 292.72 35.80 < 0.0001 A 1458.65 1 1458.65 178.39 < 0.0001 C 72.28 1 72.28 8.84 0.0140 W 555.84 1 555.84 67.98 < 0.0001 T2 238.40 1 238.40 29.16 0.0003 C2 15.63 1 15.63 1.91 0.1968 W2 134.91 1 134.91 16.50 0.0023 T*C 86.46 1 86.46 10.57 0.0087 T*W 69.03 1 69.03 8.44 0.0157 C*W 9.46 1 9.46 1.16 0.3073 Residual 81.77 10 8.18 Pure Error 5.44 5 1.09 Total 2716.23 19

132
Table G2: Analysis of var iance showing the effect of var iables on L iquid product
yield over different catalysts
Source Of Variation
Sum Of Squares
Degree Of Freedom
Mean Square F Value Prob>F
HZSM-5 Model 3661.86 3 1220.62 47.14 < 0.0001 T 3145.24 1 3145.24 121.46 < 0.0001 C 146.66 1 146.66 5.66 0.0301 W 369.96 1 369.96 14.29 0.0016 Residual 414.34 16 25.90 Pure Error 27.19 5 5.44 Total 4076.20 19
HY Model 2208.34 5 441.67 28.46 < 0.0001 T 1107.62 1 1107.62 71.38 < 0.0001 W 404.57 1 404.57 26.07 0.0002 T2 365.74 1 365.74 23.57 0.0003 W2 299.41 1 299.41 19.29 0.0006 T*W 85.81 1 85.81 5.53 0.0339 Residual 217.25 14 15.52 Pure Error 21.27 5 4.25 Total 2425.59 19
Silica-alumina Model 330.64 6 55.11 17.63 < 0.0001 T 118.25 1 118.25 37.84 < 0.0001 C 19.98 1 19.98 6.39 0.0252 W 92.85 1 92.85 29.71 0.0001 T*C 40.50 1 40.50 12.96 0.0032 T*W 48.02 1 48.02 15.37 0.0018 C*W 11.04 1 11.04 3.53 0.0827 Residual 40.63 13 3.13 Pure Error 2.87 5 0.57 Total 371.27 19
� -alumina Model 99.94 9 11.10 36.39 < 0.0001 T 83.68 1 83.68 274.20 < 0.0001 C 0.14 1 0.14 0.45 0.5211 W 1.96 1 1.96 6.41 0.0322 T2 2.65 1 2.65 8.69 0.0163 C2 6.53 1 6.53 21.38 0.0012 W2 1.99 1 1.99 6.54 0.0309 T*C 6.56 1 6.56 21.48 0.0012 T*W 2.95 1 2.95 9.66 0.0125 C*W 7.51 1 7.51 24.62 0.0008 Residual 2.75 9 0.31 Pure Error 0.45 5 0.090 Total 102.69 18

133
Table G3: Analysis of var iance showing the effect of var iables on acetaldehyde yield over different catalysts
Source Of Variation
Sum Of Squares
Degree Of Freedom
Mean Square F Value Prob>F
HZSM-5 Model 164.74 3 54.91 41.40 < 0.0001 T 137.62 1 137.62 103.76 < 0.0001 C 9.25 1 9.25 6.97 0.0178 W 17.87 1 17.87 13.48 0.0021 Residual 21.22 16 1.33 Pure Error 0.015 5 3.0E-03 Total 185.97 19
HY Model 346.09 5 69.22 77.15 < 0.0001 T 286.30 1 286.30 319.12 < 0.0001 W 11.10 1 11.10 12.37 0.0038 T2 7.69 1 7.69 8.58 0.0117 W2 17.37 1 17.37 19.37 0.0007 T*W 8.22 1 8.22 9.16 0.0097 Residual 11.66 13 0.90 Pure Error 3.15 5 0.63 Total 357.75 18
Silica-alumina Model 120.92 3 40.31 7.97 0.0018 T 93.40 1 93.40 18.46 0.0006 C 3.45 1 3.45 0.68 0.4212 C2 24.07 1 24.07 4.76 0.0444 Residual 80.94 16 5.06 Pure Error 4.78 5 0.96 Total 201.85 19
� -alumina Model 90.15 5 18.03 46.27 < 0.0001 T 51.18 1 51.18 131.34 < 0.0001 C 0.31 1 0.31 0.80 0.3854 W 12.20 1 12.20 31.31 < 0.0001 T2 22.69 1 22.69 58.22 < 0.0001 C2 2.26 1 2.26 5.79 0.0305 Residual 5.46 14 0.39 Pure Error 1.24 5 0.25 Total 95.60 19

134
Table G4: Analysis of var iance showing the effect of var iables on acrolein yield over different catalysts
Source Of Variation
Sum Of Squares
Degree Of Freedom
Mean Square F Value Prob>F
HZSM-5 Model 98.25 3 32.75 17.76 < 0.0001 T 66.26 1 66.26 35.93 < 0.0001 C 9.02 1 9.02 4.89 0.0419 W 22.98 1 22.98 12.46 0.0028 Residual 29.50 16 1.84 Pure Error 0.088 5 0.018 Total 127.75 19
HY Model 204.97 5 40.99 43.28 < 0.0001 T 82.05 1 82.05 86.63 < 0.0001 W 18.54 1 18.54 19.57 0.0006 T2 39.02 1 39.02 41.19 < 0.0001 W2 49.31 1 49.31 52.06 < 0.0001 T*W 23.32 1 23.32 24.63 0.0002 Residual 204.97 5 40.99 Pure Error 1.58 5 0.32 Total 218.23 19
Silica-alumina Model 224.33 4 56.08 25.17 < 0.0001 T 167.74 1 167.74 75.29 < 0.0001 C 0.39 1 0.39 0.18 0.6811 W 42.86 1 42.86 19.24 0.0005 T*C 13.34 1 13.34 5.99 0.0272 Residual 33.42 15 2.23 Pure Error 1.17 5 0.23 Total 257.75 19
� -alumina Model 128.89 5 25.78 3.63 0.0257 T 40.23 1 40.23 5.67 0.0320 C 3.74 1 3.74 0.53 0.4797 W 0.18 1 0.18 0.025 0.8773 T*W 41.22 1 41.22 5.81 0.0303 C*W 43.52 1 43.52 6.14 0.0266 Residual 99.32 14 7.09 Pure Error 0.59 5 0.12 Total 228.21 19

135
Table G5: Analysis of var iance showing the effect of var iables on formaldehyde
yield over different catalysts
Source Of Variation
Sum Of Squares
Degree Of Freedom
Mean Square F Value Prob>F
HZSM-5 Model 24.83 5 4.97 22.72 < 0.0001 T 18.36 1 18.36 83.99 < 0.0001 C 1.19 1 1.19 5.44 0.0352 W 0.66 1 0.66 3.03 0.1036 T2 1.46 1 1.46 6.66 0.0218 W2 3.54 1 3.54 16.18 0.0013 Residual 3.06 14 0.22 Pure Error 0.12 5 0.024 Total 27.89 19
HY Model 41.62 4 10.40 5.18 0.0080 T 0.51 1 0.51 0.26 0.6207 W 1.15 1 1.15 0.57 0.4608 T2 33.29 1 33.29 16.58 0.0010 W2 9.56 1 9.56 4.76 0.0454 T*W 41.62 4 10.40 5.18 0.0080 Residual 30.12 15 2.01 Pure Error 7.36 5 1.47 Total 71.73 19
Silica-alumina Model 54.77 5 10.95 12.10 0.0001 T 9.49 1 9.49 10.49 0.0060 C 25.73 1 25.73 28.43 0.0001 W 1.88 1 1.88 2.07 0.1718 T2 9.91 1 9.91 10.95 0.0052 T*W 7.76 1 7.76 8.58 0.0110 Residual 12.67 14 0.90 Pure Error 2.24 5 0.45 Total 67.44 19
� -alumina Model 9.93 4 2.48 8.09 0.0013 C 1.55 1 1.55 5.04 0.0414 W 1.28 1 1.28 4.16 0.0608 C2 5.63 1 5.63 18.35 0.0008 W2 2.28 1 2.28 7.42 0.0165 Residual 4.30 14 0.31 Pure Error 0.63 4 0.16 Total 14.23 18

136
Table G6: Analysis of var iance showing the effect of var iables on acetol yield over different catalysts
Source Of Variation
Sum Of Squares
Degree Of Freedom
Mean Square F Value Prob>F
HZSM-5 Model 112.08 2 56.04 75.76 < 0.0001 T 106.76 1 106.76 144.32 < 0.0001 W 5.32 1 5.32 7.19 0.0158 Residual 12.58 17 0.74 Pure Error 2.44 5 0.49 Total 124.66 19
HY Model 162.85 6 27.14 23.52 < 0.0001 T 38.30 1 38.30 33.19 < 0.0001 C 27.96 1 27.96 24.23 0.0003 W 2.72 1 2.72 2.35 0.1490 T2 18.55 1 18.55 16.07 0.0015 W2 61.69 1 61.69 53.46 < 0.0001 T*W 19.13 1 19.13 16.57 0.0013 Residual 15.00 13 1.15 Pure Error 13.54 5 2.71 Total 177.86 19
Silica-alumina Model 114.14 4 28.54 7.34 0.0018 T 67.32 1 67.32 17.32 0.0008 C 0.77 1 0.77 0.20 0.6616 W 4.37 1 4.37 1.12 0.3059 C*W 41.68 1 41.68 10.72 0.0051 Residual 58.30 15 3.89 Pure Error 8.02 5 1.60 Total 172.44 19
� -alumina Model T 64.59 2 32.30 6.85 0.0066 W 44.46 1 44.46 9.43 0.0069 Residual 80.15 17 4.71 Pure Error 8.53 5 1.71 Total 144.75 19

137
Table G7: Analysis of var iance showing the effect of var iables on gas product yield over different catalysts
Source Of Variation
Sum Of Squares
Degree Of Freedom
Mean Square F Value Prob>F
HZSM-5 Model 5.76 2 2.88 12.95 0.0004 T 3.47 1 3.47 15.61 0.0010 W 2.29 1 2.29 10.30 0.0051 Residual 3.78 17 0.22 Pure Error 5.48E-03 5 1.09E-03 Total 9.54 19
HY Model 108.22 5 21.64 36.95 < 0.0001 T 52.11 1 52.11 88.97 < 0.0001 W 40.24 1 40.24 68.70 < 0.0001 T2 1.22 1 1.22 2.08 0.1712 W2 15.13 1 15.13 25.82 0.0002 T*W 0.17 1 0.17 0.29 0.5973 Residual 8.20 14 0.59 Pure Error 0.092 5 0.018 Total 116.42 19
Silica-alumina Model 236.06 6 39.34 21.60 < 0.0001 T 107.21 1 107.21 58.85 < 0.0001 C 4.40 1 4.40 2.41 0.1443 W 45.53 1 45.53 25.00 0.0002 T*C 38.63 1 38.63 21.21 0.0005 T*W 24.50 1 24.50 13.45 0.0028 C*W 15.79 1 15.79 8.67 0.0114 Residual 23.68 13 1.82 Pure Error 1.43 5 0.29 Total 259.75 19
� -alumina Model 37.13 2 18.56 13.39 0.0003 T 29.99 1 29.99 21.63 0.0002 W 7.14 1 7.14 5.15 0.0365 Residual 23.56 17 1.39 Pure Error 0.058 5 0.012 Total 60.69 19

138
Table G8: Analysis of var iance showing the effect of var iables on char and residue yield over different catalysts
Source Of Variation
Sum Of Squares
Degree Of Freedom
Mean Square F Value Prob>F
HZSM-5 Model 66.96 6 11.16 8.81 0.0006 T 9.30 1 9.30 7.34 0.0179 C 17.27 1 17.27 13.62 0.0027 W 3.83 1 3.83 3.02 0.1056 W2 20.41 1 20.41 16.11 0.0015 T*C 7.03 1 7.03 5.55 0.0349 T*W 9.12 1 9.12 7.19 0.0188 Residual 16.47 13 1.27 Pure Error 2.52 5 0.50 Total 83.43 19
HY Model 47.74 4 11.94 5.13 0.0083 T 13.25 1 13.25 5.70 0.0306 C 0.21 1 0.21 0.089 0.7699 W 4.37 1 4.37 1.88 0.1904 C*W 29.92 1 29.92 12.87 0.0027 Residual 34.87 15 2.32 Pure Error 4.49 5 0.90 Total 82.61 19
Silica-alumina Model 38.52 3 12.84 20.55 < 0.0001 T 0.38 1 0.38 0.60 0.4498 C 8.64 1 8.64 13.82 0.0021 W 30.77 1 30.77 49.26 < 0.0001 Residual 9.37 15 0.62 Pure Error 0.010 5 2.01E-03 Total 47.89 18
� -alumina Model 5.19 6 0.87 7.41 0.0013 T 2.24 1 2.24 19.17 0.0007 C 0.045 1 0.045 0.39 0.5446 W 0.73 1 0.73 6.24 0.0267 T*C 0.23 1 0.23 2.01 0.1797 T*W 0.97 1 0.97 8.34 0.0127 C*W 0.97 1 0.97 8.34 0.0127 Residual 1.52 13 0.12 Pure Error 0.096 5 0.019 Total 6.71 19

139
Appendix H1: Calibration curves for flow meter and syr inge pump
y = 1.0558x + 3.6268
R2 = 0.99
0
20
40
60
80
100
0 10 20 30 40 50 60 70 80 90Flowmeter Reading
Flo
w r
ate
mL
/h
Figure: Calibration curve for flow meter
y = 0.9889x
R2 = 0.99
2
4
6
8
2 3 4 5 6 7 8
Pump reading, mL/h
Flo
w r
ate,
mL
/h
Figure: Calibration curve for syringe pump

140
Appendix H2: GC calibration curves for gaseous and liquid products
y = -3E-15x2 + 4E-10x
R2 = 0.99
1.0E-06
3.0E-06
5.0E-06
7.0E-06
9.0E-06
- 7,000 14,000 21,000 28,000 35,000
Average Peak Area, a.u.
H2,
g m
ole
Figure: GC calibration curve for hydrogen
y = 9E-12x
R2 = 0.99
1.0E-06
3.0E-06
5.0E-06
7.0E-06
9.0E-06
1.1E-05
- 200,000 400,000 600,000 800,000 1,000,000
Average Peak Area, a.u.
N2, g
mol
e
Figure: GC calibration curve for nitrogen
y = 7E-12x
R2 = 0.99
0.0E+00
8.0E-07
1.6E-06
2.4E-06
3.2E-06
4.0E-06
- 100,000 200,000 300,000 400,000 500,000Average Peak Area, a.u.
CO
2, g
mol
e
Figure: GC calibration curve for carbon di-oxide

141
y = 1E-11x
R2 = 0.99
0.0E+00
5.0E-06
1.0E-05
1.5E-05
2.0E-05
2.5E-05
0 500000 1000000 1500000 2000000 2500000
Average Peak Area, a.u.
CO
, g m
ole
Figure: GC calibration curve for carbon monooxide
y = 9E-18x2 + 5E-12x
R2 = 0.99
0.0E+00
2.0E-07
4.0E-07
6.0E-07
8.0E-07
- 20,000 40,000 60,000 80,000 100,000 120,000
Average Peak Area, a.u.
CH
4, g
mol
e
Figure: GC calibration curve for methane
y = -1E-18x2 + 3E-12x
R2 = 0.99
0.0E+00
5.0E-08
1.0E-07
1.5E-07
2.0E-07
- 10,000 20,000 30,000 40,000 50,000 60,000 70,000
Average Peak Area, a.u.
C2H
4, g
mol
e
Figure: GC calibration curve for ethene

142
y = 4E-18x2 + 3E-12x
R2 = 0.99
0.0E+00
5.0E-08
1.0E-07
1.5E-07
2.0E-07
2.5E-07
- 10,000 20,000 30,000 40,000 50,000 60,000 70,000 80,000
Average Peak Area, a.u.
C2H
6, g
mol
e
Figure: GC calibration curve for ethane
y = 9E-20x2 + 2E-12x
R2 = 0.99
0.0E+00
5.0E-08
1.0E-07
1.5E-07
2.0E-07
2.5E-07
- 20,000 40,000 60,000 80,000 100,000
Average Peak Area, a.u.
C3H
6, g
mol
es
Figure: GC calibration curve for ethyne
y = 3E-18x2 + 2E-12x
R2 = 0.96
0.0E+00
3.0E-08
6.0E-08
9.0E-08
1.2E-07
1.5E-07
- 10,000 20,000 30,000 40,000 50,000 60,000 70,000 80,000
Average Peak Area, a.u.
C3H
8, g
mol
e
Figure: GC calibration curve for propane

143
y = 9E-20x2 + 2E-12x
R2 = 0.9931
0.0E+00
5.0E-08
1.0E-07
1.5E-07
2.0E-07
2.5E-07
- 20,000 40,000 60,000 80,000 100,000
Average Peak Area, a.u.
C3H
6, g
mol
e
Figure: GC calibration curve for propylene
y = 2E-12x - 2E-09
R2 = 0.99
0.0E+00
3.0E-08
6.0E-08
9.0E-08
1.2E-07
1.5E-07
- 20,000 40,000 60,000 80,000 100,000Average Peak Area, a.u.
C4H
8, g
mol
e
Figure: GC calibration curve for butane
y = 2E-12x + 9E-10
R2 = 0.99
0.0E+00
1.0E-08
2.0E-08
3.0E-08
4.0E-08
5.0E-08
6.0E-08
0 7000 14000 21000 28000 35000
Average Peak Area, a.u.
1-B
uten
e, g
mol
es
Figure: GC calibration curve for 1-butene
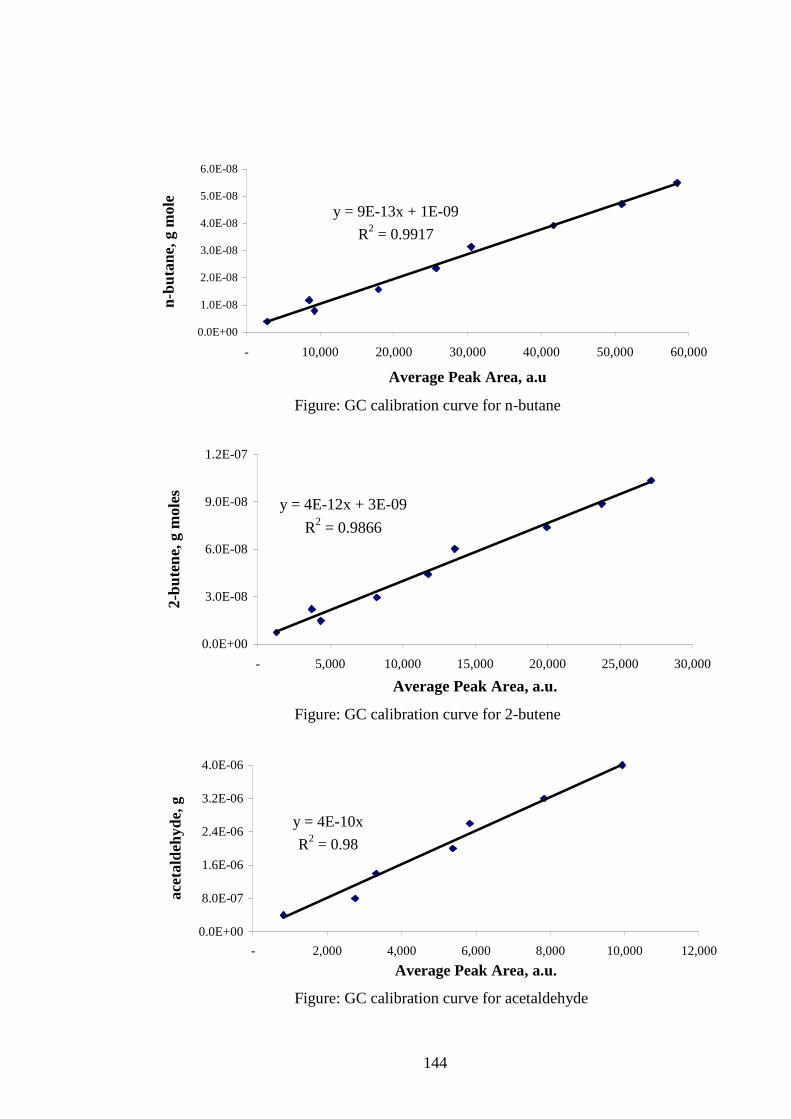
144
y = 9E-13x + 1E-09
R2 = 0.9917
0.0E+00
1.0E-08
2.0E-08
3.0E-08
4.0E-08
5.0E-08
6.0E-08
- 10,000 20,000 30,000 40,000 50,000 60,000
Average Peak Area, a.u
n-bu
tane
, g m
ole
Figure: GC calibration curve for n-butane
y = 4E-12x + 3E-09
R2 = 0.9866
0.0E+00
3.0E-08
6.0E-08
9.0E-08
1.2E-07
- 5,000 10,000 15,000 20,000 25,000 30,000
Average Peak Area, a.u.
2-bu
tene
, g m
oles
Figure: GC calibration curve for 2-butene
y = 4E-10x
R2 = 0.98
0.0E+00
8.0E-07
1.6E-06
2.4E-06
3.2E-06
4.0E-06
- 2,000 4,000 6,000 8,000 10,000 12,000
Average Peak Area, a.u.
acet
alde
hyde
, g
Figure: GC calibration curve for acetaldehyde

145
y = 2E-10x
R2 = 0.98
0.0E+00
8.0E-07
1.6E-06
2.4E-06
3.2E-06
4.0E-06
- 5,000 10,000 15,000 20,000 25,000
Average Peak Area, a.u.
acro
lein
, g
Figure: GC calibration curve for acrolein
y = 1E-09x
R2 = 0.99
0.0E+00
8.0E-07
1.6E-06
2.4E-06
3.2E-06
4.0E-06
- 500 1,000 1,500 2,000 2,500 3,000
Average Peak Area, a.u.
For
mal
dehy
de, g
Figure: GC calibration curve for formaldehyde
y = 4E-10x
R2 = 0.99
0.0E+00
2.0E-06
4.0E-06
6.0E-06
8.0E-06
- 5,000 10,000 15,000 20,000 25,000Average Peak Area, a.u.
Ace
tol,
g
Figure: GC calibration curve for acetol

146
y = 2E-10x
R2 = 0.99
0.0E+00
8.0E-07
1.6E-06
2.4E-06
3.2E-06
4.0E-06
- 5,000 10,000 15,000 20,000 25,000Average Peak Area, a.u.
Ally
l alc
ohol
, g
Figure: GC calibration curve for allyl alcohol
y = 2E-10x
R2 = 0.99
0.0E+00
8.0E-07
1.6E-06
2.4E-06
3.2E-06
4.0E-06
- 5,000 10,000 15,000 20,000 25,000
Average Peak Area, a.u
acet
one,
g
Figure: GC calibration curve for acetone
y = 2E-10x
R2 = 0.98
0.0E+00
8.0E-07
1.6E-06
2.4E-06
3.2E-06
4.0E-06
- 5,000.0 10,000.0 15,000.0 20,000.0 25,000.0
Average Peak Area, a.u
IPA
, g
Figure: GC calibration curve for Isopropyl alcohol (IPA)

147
y = 1E-10x
R2 = 0.99
0.0E+00
9.0E-07
1.8E-06
2.7E-06
3.6E-06
4.5E-06
- 9,000 18,000 27,000 36,000 45,000Average Peak Area, a.u.
Phe
nol,
g
Figure: GC calibration curve for phenol
y = -5E-15x2 + 3E-10x
R2 = 0.99
0.0E+00
9.0E-07
1.8E-06
2.7E-06
3.6E-06
4.5E-06
- 3,000 6,000 9,000 12,000 15,000 18,000
Average Peak Area, a.u.
AA
, g
Figure: GC calibration curve for Acetic Acid (AA)
y = 2E-10x
R2 = 0.9829
0.0E+00
9.0E-07
1.8E-06
2.7E-06
3.6E-06
4.5E-06
- 5,000 10,000 15,000 20,000 25,000 30,000
Average Peak Area, a.u.
PA
, g
Figure: GC calibration curve for Propionic Acid (PA)

148
y = 3E-10x
R2 = 0.98
0.0E+00
9.0E-07
1.8E-06
2.7E-06
3.6E-06
4.5E-06
- 3,000 6,000 9,000 12,000 15,000 18,000
Average Peak Area, a.u.
Gly
cero
l, g
Figure: GC calibration curve for glycerol
y = 3E-10x
R2 = 0.98
0.0E+00
9.0E-07
1.8E-06
2.7E-06
3.6E-06
4.5E-06
- 3,000 6,000 9,000 12,000 15,000
Average Peak Area, a.u.
Gly
c. F
orm
l, gl
Figure: GC calibration curve for glycerol formal (Glyc. Forml.)

149
Appendix H3: Sample calculations for mass balance
The calculations shown here are based on experiment 2 using HZSM-5
Feed glycerol (input) = 4.92 g
Mass balance calculations:
Total liquid product collected (including unconverted glycerol) = 4.34 g
Weight of gas = 3.68E-2 g
Weight of char and residue = 0.20 g
Total product (output) = 4.58 g
Mass balance = 100 - (input-output)/input*100
= 100 - (4.92-4.58)/4.92*100 = 93.02 wt%
Liquid product analysis:
Moisture content in the liquid product = 11.98 wt%
Table Calculation of liquid product composition
Components Peak areas from GC (a.u.)
Components (g)
Acetaldehyde 7883 0.103 Acetone 969 0.006
Acrolein 10478 0.068
Formaldehyde 3106 0.101
IPA 547 0.004
Allyl Alcohol 17286 0.113
Acetol 17462 0.227
Acetic Acid 1479 0.014
Propionic Acid 5909 0.038
Glycerol Formal 2524 0.025
Phenol 941 0.003
Glycerol 166219 1.623
Total area (known) 234803
Total area of all peaks from GC = 268425

150
Unknowns = (1- total known area/ total area of all peaks)*100
= (1- 234803/268425)*100 = 12.5 wt%
Un-converted glycerol = 1.62 g
Glycerol conversion = (1- un-converted glycerol/glycerol fed)*100
= (1 - 1.62/4.92)*100 = 67.01 wt%
Gas product analysis:
Total volume of gas collected (excluding N2) = 0.02 L
Volume of injection = 500 µL
Table: Calculations for product gas composition and weight
Component Peak areas from GC
Moles in injected volume
Moles in total gas volume
Mole % excluding N2
Weight (g)
CO 11591 1.16E-07 5.79E-04 5.33E+01 1.62E-02 CO2 8135 6.51E-08 3.25E-04 2.99E+01 1.43E-02 CH4 1135 5.69E-09 2.84E-05 2.61E+00 4.55E-04 C2H4 2902 8.70E-09 4.35E-05 3.99E+00 1.22E-03 C2H6 546 1.64E-09 8.20E-06 7.54E-01 2.46E-04 C3H6 10303 2.01E-08 1.03E-04 9.47E+00 4.33E-03 N2 1742526 1.74E-05 8.71E-02
Total wt = 3.68E-2