Catalog2015 16
179
National Diagnostics Life Sciences Catalog 2015-16 Electrophoresis Histology Liquid Scintillation Reactive Oxygen Assays Electro-Optical Solvents nationaldiagnostics.com (800) 526-3867
-
Upload
agtc-bioproducts-ltd -
Category
Documents
-
view
296 -
download
0
description
National Diagnostics Catalogue 2015-16
Transcript of Catalog2015 16

National DiagnosticsLife Sciences Catalog
2015-16
ElectrophoresisHistologyLiquid ScintillationReactive Oxygen AssaysElectro-Optical Solvents
nat ionaldiagnos t ics .com(800) 526-3867

Copyright © 2015 by National Diagnostics, Inc.
To Contact Technical ServicesWe encourage you to call our technical service department with any questions about National Diagnostics products or any molecular biology application.
USA:800-526-3867e-mail: [email protected]
Europe:44 (0) 1482 646022e-mail:
To Contact Customer Service Our customer service department can be reached by phone, fax, or e-mail.
United States305 Patton DriveAtlanta, Georgia 30336
Toll-free: 800-526-3867Georgia: 404-699-2121Fax: 404-699-2077e-mail:[email protected]
EuropeUnit 4 Fleet Business ParkItlings Lane, HessleEast Riding of Yorkshire HU139LX
Phone:44 (0) 1482 646020Fax: 44 (0) 1482 646013e-mail:[email protected]
Distributors WorldwidePlease see the back cover for information regarding our global net work of distributors.
Visit us on the webwww.nationaldiagnostics.com
National Diagnostics
National Diagnostics is a principle world source for chemicals and related products for scientific
research. We are particularly proud of the innovations we have made to improve laboratory safety
and the environmental responsibility of research. The National Diagnostics label on any product is
an assurance of the highest level of quality and that all raw materials and finished products adhere
to the most stringently controlled specifications. We place an emphasis on minimizing hazards and
incorporating environmentally friendly features wherever possible. In combination with our exceptional
technical and customer service staff, these products allow our customers to pursue scientific research in
the knowledge that they are using the best, most reliable and safest products available.
OUR SPECIALTIESWe specialize and have thrived in five areas of life science research:
• Electrophoresis
• Histology
• Liquid Scintillation Counting
• Electro-Optical
• Oxygen Assay
OUR BRANDSNational Diagnostics’ most recognizable brands include:
• ProtoGel - The orginial Laemmli solution for protein separation.
• UreaGel - The number one DNA/RNA solution.
• Histo-Clear - The very first xylene substitute.
• Ecoscint - The original biodegradable liquid scintillation cocktail
• Opti-Clear - Award-winning clearing solvent
Our dedication to quality applies to these, and all National Diagnostics products. The most demanding
standards in the industry apply to the more than 150 products we manufacture.
GUARANTEENational Diagnostics, Inc. guarantees its products to be of the finest quality at the time of shipment.
All materials shipped are guaranteed to meet the specifications indicated. A full refund, replacement
or credit will be issued for any product which does not perform as specified due to a manufacturing
defect. The limit of all claims relating to National Diagnostics, Inc. products shall be the invoice price
of the product.
35 YEARS OF INNOVATION

USA: 1-800-526-3867 EUROPE: 44 (0) 1482 646020~22 www.nat ionaldiagnos t ics .com
Getting the most from your National Diagnostics Life Sciences Catalog
Product SectionsEach color coded product section organizes products within basic categories. Product entries are accompanied by extensive cross-referencing to theoretical and practical discussions in the application sections. A table of related products is also presented.
Application SectionsIn addition to detailing the use of National Diagnostics products in the laboratory, the application sections of this catalog contain a wealth of practical and theoretical information useful to the experienced researcher. Furthermore, there are discussions of fundamental principles intended as a primer for beginning students.
Protocols
Hundreds of diagramsand illustrations
RelatedProductsCross References
Alphabetical Product Index and Product Number IndexFound at the back of the catalog, these indices provide order numbers, page numbers, and other quick ordering information.
InformationTables
Theoretical andPractical Discussions
ApplicationsCross References
Ordering Information
ContactInformation
RelatedProductsTable
ThoroughDescriptionof the Product
Product Namesin AlphabeticalOrder within a Category
Section Headings
Electrophoresis
Liquid Scintillation
Electro-Optical Solventst
t
t
t
Histologyt
Prod
ucts
App
licat
ions
Prod
ucts
App
licat
ions
Prod
ucts
App
licat
ions
Prod
ucts
App
licat
ions
Prod
ucts
Indi
ces
Reactive Oxygen Assays

Electrophoresis Products ......................................................................... 4Applications .................................................................. 32
Histology Products ....................................................................... 98Applications ................................................................ 106
Oxygen Radical Chemical Assays ................... 120
Liquid Scintillation Products ..................................................................... 124Applications ................................................................ 146
Electro-Optical Solvents .................................... 160
Indices ...................................................................... 164
Gel Matrices 6
Buffer Solutions 16
Detection, Visualization and Sample Preparation 19
Gel Assessories 29
Ultra-Pure Reagents 30
The Fundamentals of Electrophoresis 32Nucleic Acids 33Proteins 34The Dynamics of Gel Electrophoresis 35
Sample Mobility 35Electrophoresis System Dynamics 35Ohm’s Law 35
The Matrix 36Buffers 38
Homogeneous Buffer Systems 39Multiphasic Buffer Systems 39Isotachophoresis 40Buffer Additives 40
The Electrophoresis Apparatus 41
Gel Electrophoresis of DNA and RNA 42Denaturing Polyacrylamide Gel Electrophoresis of DNA & RNA 43Sample Preparation 43
Denaturing DNA samples 43Determining sample concentration 43Gel Preparation 43Run Conditions 44Buffer 44Buffer Gradients 44
Applications of Denaturing PAGE of DNA and RNA 44Molecular Weight Determination 44
Manual Sequencing 44Maxam & Gilbert Sequencing 45Sequencing - Sanger Method 46Gel Electrophoresis for DNA Sequencing 46Automated Sequencers 47Differential Display 48Genomic Analysis 48RNA Mapping 49S1 Mapping 49Ribonuclease Protection 50Primer Extension 50Analysis of DNA/Protein Interactions 51
DNase I footprinting 51Methylation Interference Assay 53Uracil Interference Assay 53
Native Polyacrylamide Gel Electrophoresis of DNA 54Sample Preparation 54Gel Preparation 54
Applications of Native DNA PAGE 55PCR Analysis 55Mobility Shift Assay 57Conformational Analysis 58
Heteroduplex Analysis 58SSCP Analysis 59
Agarose Gel Electrophoresis of DNA and RNA 60Preparation of Agarose Gels 60Preparation of Denaturing Agarose Gels 61
Applications of Agarose Gel Electrophoresis 61 Restriction Digest Mapping 61DNA/RNA Purification from Agarose Gels 62Low Melting Agarose 62Glass Powder Elution 62Electroelution 62In Gel Enzyme Reactions 63Pulsed Field and Field Inversion Gel Electrophoresis 64RNA Electrophoresis 65Preparation of RNA Samples 65Gel Electrophoresis of RNA 65
Gel Electrophoresis of Proteins 66Denaturing Protein Electro-phoresis: SDS-PAGE 67
Sample Preparation 67Gel Preparation - Denaturing Protein Gels 67Gradient Gels 69
Applications of Denaturing Protein Electrophoresis 70Measuring Molecular Weight 70Gradient SDS Gels 70Peptide Mapping 70Analytical gels for peptide mapping: 71Protein Purification using Denaturing Electrophoresis 71Protein Precipitation 72
Native Protein Electrophoresis 74Ferguson Plots 74Native Gradient Gels 74Sample Preparation - Native Protein Electrophoresis 74Cell and Tissue Disruption 74Gel Preparation - Native Protein Gels 75Native Gradient Gels 75
Applications of Native Protein Gels 75Activity Stains 75Immuno-Electrophoresis / Immuno-Diffusion 76Two Dimensional Electrophoresis 77
Isoelectric Focusing 77
Post Electrophoretic Analysis...To See or Not to See! 78DNA and RNA Detection 79
Staining of Nucleic Acids 79Blotting Nucleic Acids - Northerns and Southerns 80Transfer Techniques 80Autoradiography 83
Post-Electrophoretic Protein Detection 84Fixing Proteins on Gels 84Staining Proteins in Gels 84Guide Strip Technique 87Staining of Proteins Immobilized on Membranes 87Immunological Detection of Proteins 88Enzyme Linked Immunosorbent Assay (ELISA) 89Western Blotting 89
Troubleshooting Denaturing DNA-PAGE Gels 92
Troubleshooting Agarose DNA Gels 93
Troubleshooting Denaturing Protein Gels 94
Useful Information for Electrophoresis 95
Suggested Reading 96
Electrophoresis Products
Electrophoresis Applications
ContentsElectrophoresis Applications (continued)

Opti-Clear Solvent Overview 160
Product Information 161
Product Index 164
Subject Index 168
Histology ProductsHistological Clearing Agents 98
Tissue Preparation 100
Safer Aldehyde Disposal 102
Mounting Media 103
Histological Stains 104
Histology Fundamentals 106Fixation 107
Aldehyde-Based Fixatives 107Other Fixatives 108Factors Affecting Fixation 108Working Safely with Fixatives 108Safe Disposal of Aldehyde Waste 108
Decalcification 109Processing Fixed Tissue 109
Dehydration 109Clearing 109Embedding 110
Sectioning 110Frozen Sections 110Artifacts in Histologic Sections 111
Staining 111The Chemistry of Dyes 111Why dyes produce color 112The Chemistry of Staining 112Staining Procedures 112
Mounting 113
Advanced Histological Techniques 114Immunohistochemistry 115
Antibody Binding 115Detection systems 115
Electron Microscopy 116Fixation 117Processing 117Sectioning 117Staining 117
Useful Information for the Histology Laboratory 118
Suggested Reading in Histology 119
Reactive Oxygen Assays 120
Fundamentals of Oxygen Radical Chemistry 122
Biodegradable Scint i l lat ion Cocktai ls 126
Traditional Scintillation Cocktails 131
Scintillation Cocktails for HPLC Flow Detectors 134
Sample Oxidation Solutions 137
Tissue/Gel/Filter Solubilization 138
Radiation Safety 140
Accessories for Scintillation Counting 142
Autoradiography Image Enhancement 144
Scintillators 145
Fundamentals of Liquid Scintillation Counting 146Radioactive Emissions 147
Characteristics of Useful Isotopes 147The Use of Isotopes in Research 147
Measurement of Radiation and Isotope Quantitation 147Ionization Detection 148Scintillation Detection 148
Mechanism of Liquid Scintillation Counting 148Liquid Scintillation Signal Interpretation 149
Patterns of Light Emission 149Pulse Analysis 150Counting Efficiency 150Quenching 150
The Complete Scintillation Cocktail 151Sample Capacity 152
Chemiluminescence and Static Electricity 152Waste Disposal Issues 152
LSC Applications 153Counting Discrete Samples 154
Sample Neutralization (Elimination of Chemiluminescence) 154Decolorizing 154TLC Plates 155Counting Samples on Cellulose-Ester Filters 155Counting Tissue Samples 155Counting 14CO2 156Samples in Polyacrylamide Gels 156
Flow Liquid Scintillation 156Liquid Scintillation and Radiation Safety 157
Troubleshooting Liquid Scint i l lat ion Experiments 158
Useful Information for Liquid Scintillation Counting 159
Suggested Reading in Liquid Scintillation Counting 159
Liquid Scintillation Products
Electro-Optical Solvents
Indices
Histology Applications
Liquid Scintillation Applications
Oxygen Radical Chemical Assays

Electrophoresis Products
6 USA: 1-800-526-3867EUROPE: 441 482 646022
Elec
trop
hore
sis
Pro
duct
s
GEL MATRICES
PROTEIN SEPARATION... . . . . . . . . . . . . . . . . . . . . . . . . . . . . . .6 - 9ProtoGel pg 6
30% or 40% stabilized 37.5:1 solution of acrylamide/bisacrylamide - ideal for the separation of proteins and polypeptides.
ProtoGel Quick-Cast pg 7
Ready-to-use premixed system making it possible to cast an SDS-PAGE gel in twenty minutes.
AccuGel 29:1 pg 8
Ready-to-use monomer solution for the preparation of electrophoresis gels for Protein separation.
AcrylaGel and Bis-AcrylaGel pg 9
AcrylaGel is a 30% stabilized, ready-to-use acrylamide solution. Bis-AcrylaGel is a ready-to-use, 2% solution of methylene bisacrylamide.
PAGE GELS FOR DNA and RNA... . . . . . . . . . . . . . .10 - 13UreaGel 6 and 8 pg 10
Simply mix 4 parts of bottle one with 1 part of bottle two to formulate 19:1 denaturing DNA gels of constant percentage.
UreaGel Systems pg 10 - 11
Three bottle systems to cast 19:1 or 29:1 denaturing gels from 4% up to 20% quickly and conveniently.
SequaGel MD pg 12
For the detection of minor mutational differences in SSCP analysis and Heteroduplex analysis.
SequaGel XR pg 12
National Diagnostics’ proprietary extended read matrix.
AccuGel 19:1 and AccuGel 29:1 pg 13
Ready-to-use monomer solutions for the preparation of electrophoresis gels for DNA or RNA.
AcrylaGel and Bis-AcrylaGel pg 13
AcrylaGel is a 30% stabilized, ready-to-use acrylamide solution. Bis-AcrylaGel is a ready-to-use, 2% solution of methylene bisacrylamide.
AGAROSE ... . . . . . . . . . . . . . . . . . . . . . . . . . . . . . . . . . . . . . . . . . . . . . . . .14 - 15AquaPor LE pg 14
High quality, general purpose agarose ideal for most routine applications
AquaPor LM pg 14
Low melting temperature agarose combining excellent handling characteristics with scrupulous quality certifications.
AquaPor 3:1 pg 15
A specialty agarose providing excellent resolution of small DNA fragments.
AquaPor HR pg 15
High resolving, high strength, low melting agarose providing for the analysis and recovery of closely spaced DNA.
AquaPor ES pg 15
An ultra high strength/low EEO agarose for the separation of megabase size DNA fragments.
Electrophoresis Products
l FASTER, EASIER, AND SAFER With National Diagnostics ready-to-use matrix solutions, the time-consuming process of weighing, mixing, and filtering different reagents to prepare stock solutions is eliminated. You can now prepare the same gels faster, easier, and safer.
l STABLE AND RELIABLEThe National Diagnostics label on any product is an assur-ance of the highest level of quality and that all raw mate-rials and finished products adhere to the most stringently controlled specifications. Proprietary stabilization and purification methods produce the most reliable gel solutions on the market.
l REPRODUCIBLE RESULTSNational Diagnostics’ products are selected and prepared specifically for electrophoretic applications, assuring supe-rior results and reproducibility. You can trust that your results will be consistent from one electrophoretic run to another.
GEL MATRICES l B U F F E R S l V I S U A L I Z A T I O N l A C C E S S O R I E S l R E A G E N T S

Electrophoresis Products
7USA: 1-800-526-3867EUROPE: 441 482 646022
ElectrophoresisP
roducts
VISUALIZATION AND SAMPLE PREP
GEL ACCESSORIES
ULTRA-PURE REAGENTS
ULTRA-PURE REAGENTS....................................30 - 31Acrylamide - Ultra Pure pg 30
Ammonium Persulfate - Ultra Pure pg 30
Bis - Ultra Pure (N,N’ - methylene bisacrylamide) pg 30
Boric Acid - Ultra Pure pg 30
DATD - Ultra Pure(N,N’ - diallyltartardiamide) pg 30
Dextran Sulfate - Ultra Pure pg 30
Dithiothreitol (DTT) - Ultra Pure pg 30
EDTA - Ultra Pure(Disodium ethylenediamine - tetraacetate dihydrate) pg 30
Reagent Alcohol pg 30
Formamide - Ultra Pure pg 30
Glycerol - Ultra Pure pg 31
Glycine - Ultra Pure pg 31
2-Mercaptoethanol - Ultra Pure pg 31
Riboflavin - Ultra Pure pg 31
SDS - Ultra Pure (Sodium Dodecylsulfate) pg 31
SDS Solution (20%) pg 31
TEMED (redistilled) - (N,N,N’,N’ - tetramethylethylene diamine) pg 31
Tricine - Ultra Pure (N-Tris(hydroxymethyl methylglycine)) pg 31
Tris - Ultra Pure (Tris(hydroxymethyl) aminomethane) pg 31
Tween-20 - Ultra Pure pg 31
Urea - Ultra Pure pg 31
Water - DEPC treated, sterile pg 31
GEL ACCESSORIES . . . . . . . . . . . . . . . . . . . . . . . . . . . . . . . . . . . . . . . .29Gel Dry Film pg 29
GelDry Film is a specially designed drying film for polyacrylamide gels.
Glass Bond pg 29
Temporarily affixes the PAGE gel to one of the glass casting plates.
Glass Free pg 29
Coats glass casting plates for easy release of polyacrylamide gels.
Ion Exchange Resin pg 29
Mixture of anionic and cationic resins. Ideal for deionizing acrylamide solutions.
VISUALIZING PROTEIN..............................................19ProtoStain Blue pg 19
Safer, more sensitive colloidal Coomassie stain
ProtoBlue Safe pg 20
Eco-safe colloidal Coomassie stain.
Sterling Rapid Silver Stain pg 20
Silver staining in a faster and more convenient format
POWDERED STAINS.... . . . . . . . . . . . . . . . . . . . . . . . . . . . . . . . . . . . . . . . . . .21Amido Black pg 21
Bromophenol Blue pg 21
Coomassie Blue R-250 pg 21
Coomassie Blue G-250 pg 21
WESTERN BLOTTING..... . . . . . . . . . . . . . . . . . . . . . . . . . . . . . . . . . . . . . . .22ProtoGlow ECL pg 22
Horseradish Peroxidase visualization system
ProtoBlot Rapid Western Transfer Buffer pg 23
ProtoLift Western Stripping Buffer pg 23
BLOTTING BUFFERS.... . . . . . . . . . . . . . . . . . . . . . . . . . . . . . . . . . . . . . . . . . .24Tris Buffered Saline 10X (+/- TWEEN) pg 24
ProtoBlock System pg 24
PBS (10X) Phosphate Buffered Saline pg 24
Tris-Glycine Electroblotting Buffer (10X) pg 24
PROTEIN STANDARDS....... . . . . . . . . . . . . . . . . . . . . . . . . . . . . . . . . . . . .25Insite Markers pg 25
ProtoMetrics pg 25
ProtoMarkers pg 25
PROTEIN ELECTROPHORESIS AND BLOTTING...........16MOPS-SDS Running Buffer pg 16
MES-SDS Running Buffer pg 16
Tris-Glycine-SDS PAGE Buffer(10X) pg 16
ProtoGel Buffers pg 16
5X Protein Loading Buffer pg 16
Protein Loading Buffer Blue (2X) pg 16
Tris-Tricine-SDS PAGE Buffer(10X) pg 16
Tris-Glycine Electroblotting Buffer (10X) pg 17
PBS (10X)-Phosphate Buffered Saline pg 17
Tris Buffered Saline 10X (+/- TWEEN) pg 17
STOCK SOLUTIONS..... . . . . . . . . . . . . . . . . . . . . . . . . . . . . . . . . . . . . . . . . .17EDTA, 0.5M Sterile pg 17
Potassium Chloride, 1M Sterile pg 17
Sodium Chloride, 0.9% or 1M Sterile pg 17
Tris HCl 1M pH 7.2, 7.4 or 7.6 pg 17
DNA/RNA ELECTROPHORESIS...............................18TAE Buffer (50X) pg 18
TBE Buffer(10X or 5X) pg 18
TTE Glycerol Tolerant Buffer (20X) pg 18
Triple Dye Loading Buffer (6X) pg 18
UreaGel Loading Buffer pg 18
DNA/RNA BLOTTING...... . . . . . . . . . . . . . . . . . . . . . . . . . . . . . . . . . . . . .18TE Buffer (100X) pg 18
Denaturation Solution pg 18
Neutralization Solution pg 18
SSC Buffer (20X) pg 18
BUFFER SOLUTIONSPREPARING PROTEIN SAMPLES FOR PAGE.............26ProtoGel Sample Prep Kit pg 26
ND Protein Precipitation Kit pg 26
Protein Loading Buffer Blue (2X) pg 26
V I S U A L I Z I N G D N A a n d R N A . . . . . . . . . . . . . 27 - 28Nuclistain pg 27
Positive stain for the detection of DNA and RNA in gels
Autofluor pg 28
High resolution autoradiographic image intensifier
Bromophenol Blue pg 28
Bromocresol Green pg 28
Xylene Cyanole FF pg 28

Electrophoresis Products - Gel Matrices for Protein Separation
8 USA: 1-800-526-3867EUROPE: 441 482 646022
Elec
trop
hore
sis
Pro
tein
Gel
s
The use of National Diagnostics’ ProtoGel Resolving Buffer and ProtoGel Stacking Buffer will ensure the purity and performance of your Laemmli gels. ProtoGel Buffer forms gels of 0.375 M Tris-HCl and 0.1% SDS, pH 8.8. Pro-toGel Stacking Buffer forms gels of 0.125 M Tris-HCl and 0.1% SDS, pH 6.8.
Storage: ProtoGel Resolving Buffer and ProtoGel Stacking Buffer are stable for 24 months when stored tightly capped in a dark area at room temperature (20oC).
l Traditional Laemmli Buffer Systeml 18 Megohm Water/0.2 Micron FiltrationProtoGel Buffers
ProtoGel forms an electrophoresis matrix that is ideal for the separation of proteins and polypeptides. Available in either 30% or 40% concentration, ProtoGel is a stabilized, ready-to-use acrylamide/methylene bisacrylamide solution (37.5:1 ratio), manufactured from the highest quality materials, from which virtually all impurities have been removed. ProtoGel has zero acrylic acid content, eliminating the fixed charges that cause band streaking. Ad-ditionally, oxidation products such as aldehydes have been removed by a selective adsorption process. With ProtoGel, you can trust that your results will be consistent one electrophoretic run to the next.
Storage: ProtoGel is stable for 24 months when stored tightly capped in a dark area at room temperature (20oC).
37.5 : 1 Acrylamide to Bisacrylamide Stabilized SolutionAvailable in Either 30% or 40% ConcentrationOptimized for SDS-PAGE (Laemmli gels) of ProteinsConsistently Crystal Clear Gels, Zero FluorescenceStabilized for Long Shelf Life
l
l
l
l
l
ProtoGel 30% EC-890 450 ml 1 Liter (1-3) 1 Liter (4 +)
ProtoGel 40% EC-891 450 ml 1 Liter (1-3) 1 Liter (4 +)
ProtoGel Resolving Buffer (4X) [pg 18] EC-892 450 ml 1 Liter (1-3) 1 Liter (4 +)
ProtoGel Stacking Buffer (4X) [pg 18] EC-893 200 ml
Tris-Glycine-SDS Buffer (10X) [pg 18] EC-870 1 Liter 4 Liter (1-3) 4 Liter (4+)
Product Name Cat. No. Size
ProtoGel
APPLICATIONS
Gel preparation:
Native protein Gels ............76
Denaturing protein gels ............. 69
Gradient gels ......................70
Molecular wt. determination .....68
2-D Electrophoresis. ...................79
Western blotting ........................ 91
Peptide Mapping ......................72
Protein Purification .................... 73
Every lot of ProtoGel is HPLC certified.
30% Acrylamide
No Acrylic Acid
0.8% Bisacrylamide
®
Gel Matrices for Protein Electrophoresis
Product Name Cat. No. Size

Electrophoresis Products - Gel Matrices for Protein Separation
9USA: 1-800-526-3867EUROPE: 441 482 646022
ElectrophoresisP
rotein Gels
ProtoGel Quick-Cast cuts the time required to cast a protein electrophoresis gel by 75%, and the number of steps by 2/3. Simply measure out the amount needed, add initiators and cast the gel. No mixing, no multiple measurements; just initiate, cast, and be ready to run in 20 minutes. With the reduced casting time, western blots can be finished within a regular working day:
Casting (prep and polymerization) 30 minutes Electrophoresis 1 hr Transfer (including prep time) 1.5 hr Blocking and Probing: 3 hrs Washing 1.5 hrs Detection 30 min Total Time 8 hr
Economical and Convenient One Bottle Systemfor Casting SDS-PAGE Gels
Ready to Run in 25 Minutes!
Ideal for Western Blotting Applications
Precast Convenience at a Fraction of the Price
l
l
l
l
ProtoGel Quick-Cast 12% EC-895 100 ml (13 gels) 450 ml (60 gels)
Product Name Cat. No. Size
ProtoGel Quick-Cast 12%®
APPLICATIONS
Gel preparation:
Native protein Gels ........... 76
Denaturing protein gels ......69
Gradient gels ......................70
Molecular wt. determination .....72
2-D electrophoresis ...................79
Western blotting ........................ 91
Peptide Mapping ......................72
Protein Purification .................... 73
Method of Use:
ProtoGel Quick-Cast contains the monomers and buffer components to produce a 12% gel.
1. Measure out the volume of ProtoGel Quick-Cast needed to fill the cassette - typically 10ml for one mini-gel, 15ml for two.
2. Add 100 microliters of fresh 10% APS and 10 microliters of TEMED per 10ml ProtoGel Quick-Cast Mix briefly and pour into the gel cassette.
3. Insert comb and allow to polymerize at room temperature for 20 minutes.
ProtoGel Quick-Cast gels are run in standard 1X Tris-Glycine SDS. Electrical parameters will vary from apparatus to apparatus, but typically gels are run at 170V for 60 minutes
ProtoGel Quick-Cast gels require no special handling after the run. Simply stain according to standard protocols.
Ideal for Western Blotting
kDa
75
50
35
25
15
10
Western blot analysis on total rat lung extract using anti-Flo-tillin antibody at 1:5000 dilution. Different dilutions of rat lung extract were resolved on a ProtoGel Quick-Cast gel and transferred to PVDF membrane.
ProtoGel Quick-Cast Loading Buffer (2X)
ProtoGel Quick-Cast Loading Buffer (2X) EC-910 5 x 1ml
Developed for ProtoGel Quick-Cast 12%. Optimized to provide
sharper bands and improved resolution. The combination of Pro-
toGel Quick-Cast and Quick-Cast Loading Buffer offers the fastest,
easiest way to run high quality gels.

Electrophoresis Products - Gel Matrices for Protein Separation
10 USA: 1-800-526-3867EUROPE: 441 482 646022
Elec
trop
hore
sis
Pro
tein
Gel
s
AccuGel 29:1 is a ready-to-use monomer solution for the preparation of electrophoresis gels for SDS-PAGE of proteins and the nondenaturing electrophoresis of DNA. AccuGel 29:1 contains 29 grams of acrylamide per gram MBA. Available in 30% or 40% concentration, AccuGel 29:1 is especially useful for protein scientists interested in the separation of smaller proteins by SDS-PAGE.
Storage: AccuGel 29:1 is stable for 24 months when stored tightly capped in a dark area at room temperature (20OC).
AccuGel 29:1 30% or 40%, 29:1 Acrylamide:Bisacrylamide SolutionStabilized for a Two Year Shelf LifeConsistently Crystal Clear GelsFor SDS-PAGE and Native DNA Electrophoresis
l
l
l
l
AccuGel 29:1 (30%) EC-851 450 ml 1 Liter (1-3) 1 Liter (4 +)
AccuGel 29:1 (40%) EC-852 450 ml 1 Liter (1-3) 1 Liter (4 +)
Product Name Cat. No. Size
TM
AccuGel 19:1 is also available. See page 15.
29:1 versus 37.5 :1Which Acrylamide to Bis ratio is better for protein electrophoresis?
Both 29:1 and 37.5:1 gels are used in protein electrophoresis. The more commonly used 37.5:1 ratio represents the formulation in the original dena-turing SDS-PAGE system of Laemmli (Nature, 1970). Despite the primacy of 37.5:1 in the literature, the 29:1 ratio has developed its own following with many committed practitioners.
National Diagnostics has carried out a study comparing the performance of gels cast with AccuGel 29:1 to similar gels cast with our 37.5:1 solution, ProtoGel (EC-890). In this study the 29:1 ratio provided very slightly im-proved resolution of small proteins (<20kD) and the 37.5:1 ratio provided very slightly improved resolution of larger proteins (>80kD). These differences were very small, and in our opinion, either ratio will work well for the vast majority of SDS-PAGE applications.
APPL ICATIONS
Gel preparation:
Native protein Gels ............76
Denaturing protein gels ..............69
Gradient gels ......................70
Molecular wt. determination .....68
2-D Electrophoresis. ...................79
Western blotting ........................ 91
Peptide Mapping ......................72
Protein Purification .................... 73

Electrophoresis Products - Gel Matrices for Protein Separation
11USA: 1-800-526-3867EUROPE: 441 482 646022
ElectrophoresisP
rotein Gels
AcrylaGel is a ready-to-use, 30% acrylamide solution in distilled/deionized water. Because acrylamide in its crystalline form is subject to self-polymer-ization, the purity and consistency of polymerized AcrylaGel is superior to that obtainable with powdered acrylamide.
AcrylaGel can be crosslinked with Bis-AcrylaGel, a ready-to-use, 2% solution of methylene bisacrylamide with the same advantages as the AcrylaGel acrylamide solution. However, any powdered crosslinking reagent can also be used with AcrylaGel.
Storage: AcrylaGel and Bis-AcrylaGel are stable for 24 months when stored tightly capped in a dark area at room temperature (20oC).
Acrylamide and Bisacrylamide Stabilized Solutions18 megOhm Deionization, 0.2 Micron FiltrationAldehyde Free and Acrylic Acid FreeStabilized for a Two Year Shelf Life
Acry laGel and B is -Acry laGel
Gel preparation:
Denaturing DNA gels .........45
Native DNA gels ...............56
Native protein Gels ........... 76
Denaturing protein gels ..... 69
Uracil interference .................... 55
Methylation interference .......... 55
l
l
l
l
AcrylaGel EC-810 450 ml 1 Liter (1-3) 1 Liter (4 +)
Bis-AcrylaGel EC-820 450 ml 1 Liter (1-3) 1 Liter (4 +)
Product Name Cat. No. Size
APPL ICATIONS
TM
TM
Safe Sensitive Protein VisualizationSee page 21 for more information.
ProtoStain BlueEco-Fr iendly Col lo idal Coomass ie S ta in
ProtoStain Blue Colloidal Coomassie Blue G-250 stain is a premixed non-hazardous solution specially formulated for rapid, sensitive detection of pro-teins and safe, nonhazardous disposal. ProtoStain Blue is the most sensitive Colloidal Coomassie stain on the market, with the ability to detect less than 1ng of BSA. ProtoStain Blue contains no methanol, acetic acid, phosphoric acid or other hazardous components.
TM
Product Name Cat. No. Size
ProtoStain Blue EC-727 1 Liter

Electrophoresis Products - Gel Matrices for DNA & RNA Separation
12 USA: 1-800-526-3867EUROPE: 441 482 646022
Elec
trop
hore
sis
DN
A/R
NA
Gel
s
The UreaGel 29:1 System allows researchers to easily and safely produce denaturing gels of the popular 29:1 acrylamide:bis-acrylamide formula in concentrations up to 20% monomer. These gels are ideal for analysis of RNA or DNA. The UreaGel 29:1 System consists of UreaGel 29:1 Concentrate, UreaGel Buffer and UreaGel Diluent. UreaGel 29:1 Concentrate contains 241.7g acrylamide, 8.3g methylene bisacrylamide per liter in 7.5M urea in a deionized aqueous solution. UreaGel Diluent consists of a deionized aqueous solution of 7.5M urea. UreaGel Buffer contains 0.89M Tris-Borate, 20mM EDTA and 7.5M urea at pH 8.3.
Storage: UreaGel 29:1 Concentrate, Diluent and Buffer are stable for one year when stored tightly capped in a dark area at room temperature.
UreaGel 29:1 Denaturing Gel System
UreaGel 29:1 System EC-829 1 Liter Kit 2.2 Liter Kit (1-3) 2.2 Liter Kit (4 +)
UreaGel 29:1 Concentrate EC-828 450 ml 1 Liter (1-3) 1 Liter (4 +)
Product Name Cat. No. Size Denaturing PAGE -
DNA/RNA45 ...........................45
Sequencing:
Sanger method ................. 48
Maxam & Gilbert ............. 47
Automated sequencers ......49
Differential display ....................50
DNase I footprinting ................. 53
RNA mapping ........................... 51
S-1 mapping ....................... 51
RNAse protection. ..............52
Uracil interference .............55
Methylation
interference ........................ 55
APPL ICATIONS
Casts 29:1 Denaturing Gels for RNA or DNA analysisEasily Cast up to 20% GelsCertified Nuclease FreeConsistently Crystal Clear Gels
l
l
l
l
®
Gel Matrices for DNA/RNA Electrophores i sTM
SequaGel
UreaGels 6 and 8 each consist of UreaGel Monomer Solution and UreaGel Complete Buffer Solution. The UreaGel Monomer Solution contains urea, as well as acrylamide and bis-acrylamide in the standard 19:1 ratio. UreaGel Complete Buffer Solution contains TBE and TEMED. Upon combining these two solutions, the researcher adds ammonium persulfate to form a crystal clear electrophoresis matrix with corresponding percent acrylamide (6 or 8) containing 1X TBE (89 mM Tris Base, 89 mM Boric Acid, 2 mM EDTA, pH 8.3) and 6M Urea. Easy to use and reliable, UreaGel 6 and 8 are well-re-garded favorites of molecular biologists the world over.
UreaGel 6 and 8®
UreaGel-6 EC-836 450 ml 1 Liter (1-3) 1 Liter (4 +)
UreaGel-8 EC-838 450 ml 1 Liter (1-3) 1 Liter (4 +)
Product Name Cat. No. Size
Ready-To-Use 19:1 Denaturing DNA Gel SolutionsCertified Nuclease FreeConsistently Crystal Clear GelsTwelve Month Shelf Life at Room Temperature
l
l
l
l
®
TM
SequaGel
New!

Electrophoresis Products - Gel Matrices for DNA & RNA Separation
13USA: 1-800-526-3867EUROPE: 441 482 646022
ElectrophoresisD
NA
/RN
A Gels
UreaGel Sequencing System
The UreaGel Sequencing System consists of UreaGel Concentrate, UreaGel Diluent, and UreaGel Buffer. This system provides a convenient, dependable means for researchers to prepare gels of varying percentage. With the Urea-Gel Sequencing System the researcher readily prepares any commonly used gel formulation up to 20% monomer (19:1 acrylamide/bisacrylamide). Liter bottles of UreaGel Concentrate contain 237.5 grams of acrylamide, 12.5 grams of methylene bisacrylamide, and 7.5M urea in a deionized aqueous solution. UreaGel Diluent is supplied in 450 ml and 1 liter bottles containing 7.5M urea in deionized water. UreaGel Buffer is supplied in 100 ml and 200 ml bottles containing 0.89M Tris-Borate-20mM EDTA buffer pH 8.3 (10X TBE) and 7.5M urea.
Casts 19:1 Denaturing Gels up to 20% MonomerDNase & RNase FreeConsistently Crystal Clear GelsTwelve Month Shelf Life at Room Temperature
Storage: UreaGel Concentrate, UreaGel Diluent, and UreaGel Buffer are stable for one year when stored tightly capped, in a dark area at room temperature (20°C).
UreaGel Sequencing System* EC-833 1 Liter Kit *Includes UreaGel Diluent, Concentrate, and Buffer 2.2 Liter Kits (1-3) 2.2 Liter Kits (4 +)
UreaGel Diluent EC-840 450 ml 1 Liter (1-3) 1 Liter (4 +)
UreaGel Concentrate EC-830 450 ml 1 Liter (1-3) 1 Liter (4 +)
UreaGel Buffer EC-835 100 ml 200 ml (1-3) 200 ml (4 +)
TBE 10X [pg 20] EC-860 1 Liter 4 Liters (1-3) 4 Liters (4 +)
Ammonium Persulfate [pg 32] EC-504 25 grams 100 grams TEMED [pg 33] EC-503 25 ml
Online:www.nationaldiagnostics.com
l
l
l
l
Product Name Cat. No. Size
Tank B u f f e r
u l T r a -P u r e I n I T I a T o r s
®SequaGel
TM
Denaturing PAGE -
DNA/RNA45 ...........................45
Sequencing:
Sanger method ................. 48
Maxam & Gilbert ............. 47
Automated sequencers ......49
Differential display ....................50
DNase I footprinting ................. 53
RNA mapping ........................... 51
S-1 mapping ....................... 51
RNAse protection. ..............52
Uracil interference .............55
Methylation
interference ........................ 55
APPL ICATIONS

Electrophoresis Products - Gel Matrices for DNA & RNA Separation
14 USA: 1-800-526-3867EUROPE: 441 482 646022
Elec
trop
hore
sis
DN
A/R
NA
Gel
s
SequaGel MD permits minor mutational differences in DNA sequences to be detected as a high resolution relative mobility (Rf) shift. SequaGel MD is a proprietary formulation, supplied as a 2X stock, designed to resolve sequence related differences by SSCP (Single Strand Conformational Polymorphism) and heteroduplex analysis. For a detailed discussion of these techniques please see page 60 in the Electrophoresis Applications section of this catalog.
SequaGel MD For the Detection of Minor Mutational DifferencesPoint Mutation AnalysisSSCP AnalysisHeteroduplex Analysis
Heteroduplex analysis ..............60 SSCP analysis ............................ 61
l
l
l
l
APPLICATIONSSequaGel MD Monomer Solution EC-845 200 ml (1-3) 200 ml (4+)
SequaGel MD Heteroduplex Kit EC-847 1 Kit
SequaGel MD SSCP Kit EC-846 1 Kit
Triple Dye Loading Buffer (6X) EC-855 1.2 ml
SequaGel MD SSCP Stop Solution EC-848 1.2 ml
Product Name Cat. No. Size
SequaGel MD Monomer Solution (200ml) SSCP Stop Solution (1.2ml)
SequaGel MD Monomer Solution (200ml) Triple Dye Loading Buffer (1.2ml)
®
SequaGel XR
National Diagnostics’ SequaGel XR is specially formulated to produce greater resolution and longer read lengths. SequaGel XR’s optimized, proprietary formulation prevents aberrant band inversions and yields sharp, clear, highly resolved bands. SequaGel XR provides more information by allowing greater separation between bands near the top of the gel. This effect, similar to a wedge gel, is achieved with standard spacers. SequaGel XR is shipped as a two component system consisting of the SequaGel XR Monomer Solution and UreaGel Complete Buffer. UreaGel Complete Buffer Solution contains TBE and TEMED. No dilutions are necessary in this easy to use system. The researcher simply combines the two solutions, adds ammonium persulfate, and casts the gel. SequaGel XR is also available in the form of a 50% stock solution, SequaGel XR Concentrate.
Extended Range Gel Solution for DNA ElectrophoresisHigher ResolutionIdeal for LICOR SequencersAvailable as a Premixed 2 Bottle Kit or Concentrate
l
l
l
l
SequaGel XR EC-842 450 ml 1 Liter (1-3) 1 Liter (4 +)
SequaGel XR Concentrate EC-843 100 ml 450 ml (1-3) 450 ml (4 +)
Product Name Cat. No. Size
®
Denaturing PAGE -
DNA/RNA45 ...........................45
Sequencing:
Sanger method ................. 48
Maxam & Gilbert ............. 47
Automated sequencers ......49
Differential display ....................50
DNase I footprinting ................. 53
RNA mapping ........................... 51
S-1 mapping ....................... 51
RNAse protection. ..............52
Uracil interference .............55
Methylation
interference ........................ 55
APPL ICATIONS

Electrophoresis Products - Gel Matrices for DNA & RNA Separation
15USA: 1-800-526-3867EUROPE: 441 482 646022
ElectrophoresisD
NA
/RN
A Gels
AccuGel 19:1 and AccuGel 29:1 are ready-to-use monomer solutions for the preparation of electrophoresis gels for DNA or RNA. AccuGel 19:1 contains 19 grams of acrylamide per gram of methylene bisacrylamide (MBA) cross-linker; AccuGel 29:1 contains 29 grams of acrylamide per gram MBA. AccuGel 19:1 ratio is intended for the denaturing electrophoresis of DNA and AccuGel 29:1 is intended for native DNA electrophoresis and SDS-PAGE of proteins.
Storage: AccuGel 19:1 and AccuGel 29:1 are stable for 24 months when stored tightly capped in a dark area at room temperature (20oC).
AccuGel 19:1 andAccuGel 29:1
Nondenaturing PAGE-DNA ......56
Denaturing PAGE-DNA/RNA ....45
Gel preparation:
Denaturing DNA gels .........45
Native DNA gels ...............56
Gel electrophoresis of
PCR products ..............................58
Ribonuclease protection .......... 52
Uracil interference .................... 55
Sequencing:
Sanger method ................. 48
Maxam & Gilbert ............. 47
Automated sequencers ......49
Premixed Acrylamide:Bisacrylamide SolutionsStabilized for a Two Year Shelf LifeConsistently Crystal Clear GelsCertified Nuclease Free
l
l
l
l
APPLICATIONSAccuGel 19:1 (30%) EC-849 450 ml 1 Liter (1-3) 1 Liter (4 +)
AccuGel 19:1 (40%) EC-850 450 ml 1 Liter (1-3) 1 Liter (4 +)
AccuGel 29:1 (30%) EC-851 450 ml 1 Liter (1-3) 1 Liter (4 +)
AccuGel 29:1 (40%) EC-852 450 ml 1 Liter (1-3) 1 Liter (4 +)
Product Name Cat. No. Size
TM
AcrylaGel is a ready-to-use, 30% acrylamide solution in distilled/deionized water. AcrylaGel can be crosslinked with Bis-AcrylaGel, a ready-to-use, 2% solution of methylene bisacrylamide with the same advantages as the AcrylaGel acrylamide solution. However, any powdered crosslinking reagent can also be used with AcrylaGel.
Storage: AcrylaGel and Bis-AcrylaGel are stable for 24 months when stored tightly capped in a dark area at room temperature (20oC).
Acrylamide and Bisacrylamide Stabilized Solutions18 megOhm Deionization, 0.2 Micron FiltrationCertified Nuclease FreeStabilized for a Two Year Shelf Life
AcrylaGel and Bis-AcrylaGel
Gel preparation:
Denaturing DNA gels .........45
Native DNA gels ...............56
Native protein Gels ........... 76
Denaturing protein gels ..... 69
Uracil interference .................... 55
Methylation interference .......... 55
l
l
l
l
AcrylaGel EC-810 450 ml 1 Liter (1-3) 1 Liter (4 +)
Bis-AcrylaGel EC-820 450 ml 1 Liter (1-3) 1 Liter (4 +)
Product Name Cat. No. Size
APPL ICATIONS
TM
TM
AccuGel 29:1 is also suitable for protein applications. See page 10.
TM

Electrophoresis Products - Gel Matrices - Agarose
16 USA: 1-800-526-3867EUROPE: 441 482 646022
Elec
trop
hore
sis
Aga
rose
Mat
rices
AquaPor LM GTAC is a low melting temperature agarose for both large and small DNA fragments. For large fragments up to 25 kb, a 1% AquaPor LM solution forms a gel strong enough to be handled without fracturing. For separation of smaller fragments from 20 bp to 1000 bp, AquaPor LM pos-sesses low viscosity so that 3% or 4% gels can be made. DNA fragments separated in AquaPor LM may be immediately used for enzymatic manipu-lation in the presence of remelted agarose. Extra advantages: AquaPor LM is GTAC certified to be DNase, RNase, and protease free. AquaPor LM is certified for in-gel PCR (re)amplification and in-gel ligation, and will not affect transformation efficiencies.
Easy-to-Handle Low Melt AgaroseAnalysis/Recovery of Large and Small Fragments
AquaPor LM GTAC
Agarose gel electrophoresis ......62
Preparing agarose gels ............. 62
Purifying DNA/RNA ................ -64
In gel ligation ..............................65
In gel PCR amplification .............65
In gel restriction digestion .........65
Restriction digest mapping .........63
l
l
AquaPor LM GTAC EC-204 25 g 100 g (1 - 3) 100 g (4 +)
Product Name Cat. No. Size
APPL ICATIONS
AquaPor LE GTAC is a high quality, general purpose agarose gel material ideal for most routine applications. Low EEO reduces diffusion of smaller fragments and results in sharper, more clearly defined bands. High gel strength facilitates ease of use and handling of gels. AquaPor LE is certified to contain no detectable DNase, RNase, or protease. It makes an excellent matrix for resolution of nucleic acids as well as high molecular weight proteins. AquaPor LE may be used confidently for Southern, Northern, and Western blotting, as well as in-gel hybridizations.
Molecular Biology Grade AgaroseLow Electroendosmosis
AquaPor LE GTAC
Agarose gel electrophoresis ......62
Preparing agarose gels ............. 62
Southern blotting ........................84
Northern blotting ......................83
Purifying DNA/RNA-Agarose ......
64
Restriction digest mapping .........63
Agarose electrophoresis-RNA ........
67
Immuno-Electrophoresis ............ 78
Radial Immuno-Diffusion .......... 78
l
l
AquaPor LE GTAC EC-202 25 g 100 g (1 - 3) 100 g (4 +) 500 g
Product Name Cat. No. Size
APPL ICATIONS
National Diagnostics AquaPor Agaroses are extremely reliable and convenient to work with. They dissolve easily with low boil over to produce clear, strong gels. National Diagnostics’ agarose is the most rigorously tested in the industry. Each AquaPor scrupulously adheres to stringently controlled specifications. All AquaPor agaroses are Genetic Technology Analysis Certified (GTAC). Every procedure for which an AquaPor is intended has been tried and tested, and every AquaPor Agarose is certified DNase, RNase, and protease free.
AquaPor GTAC Agarose
AquaPor LE AquaPor LM AquaPor HR AquaPor ES AquaPor 3:1
EEO (-mr) <0.12 <0.05 <0.12 <0.05 <0.07
Gel Strength >1200 @ 1.0% >450 @ 1.0% >400 @ 1.5% >1700 @ 1.0% >1200 @ 1.0% (g/cm2) >1100 @ 3.0% >3200 @ 1.5% >6500 @ 4.0%
Gel Temp <36 @ 1.0% <27 @ 1.5% <36 @ 1.5% <40 @ 1.5% <40 @ 4% (oC)
Melt Temp <89 @ 1.0% <65 @ 1.5% <80 @ 1.5% <89 @ 1.5% <92@ 4% (oC)
Sulfate (%) <0.20 <0.20 <0.20 <0.20 <0.20
DNase,RNase, None None None None NoneProtease
TMTM

Electrophoresis Products - Gel Matrices - Agarose
17USA: 1-800-526-3867EUROPE: 441 482 646022
ElectrophoresisA
garose Matrices
The very low EEO of AquaPor ES will significantly reduce electrophoresis times for Pulsed Field Gel (PFG) applications, and also increase band sharpness. The extremely high gel strength makes it possible to cast gels as low as 0.3% which remain intact through staining, destaining, photographic documentation, and blotting. These low percentage gels may be used for the electrophoretic separation of DNA fragments as large as 50 kb, and macromolecular protein complexes from 500 kDa to 10 MDa size.
Ultra High Strength/Low EEO AgaroseBlotting of MegaBase DNA
AquaPor ES GTAC
Agarose gel electrophoresis ......62
Preparing agarose gels ............. 62
PFGE/FIGE ................................66
l
l
AquaPor ES GTAC EC-203 25 g 100 g (1 - 3) 100 g (4 +)
Product Name Cat. No. Size
APPL ICATIONS
AquaPor HR GTAC is our highest resolving agarose, specifically manufac-tured for optimal electrophoretic separation of small DNA fragments, PCR products, and proteins. AquaPor HR will resolve DNA down to 2% size difference. Uniform particle size minimizes boil over. Additionally, the high quality of this agarose has allowed the certification of AquaPor HR for PCR (re)amplification directly in the presence of the remelted gel. AquaPor HR is GTAC certified to be DNase, RNase, and protease free, and certified for in-gel PCR.
High Strength, High Resolution AgaroseAnalysis/Recovery of Small DNA
AquaPor HR GTAC
Agarose gel electrophoresis ......62
Preparing agarose gels ............. 62
Purifying DNA/RNA-Agarose ......
64
Gel electrophoresis of
PCR Products .............................57
Restriction digest mapping .........63
Agarose electrophoresis-RNA ........
67
DNase I footprinting ..................53
l
l
AquaPor HR GTAC EC-205 25 g 100 g (1 - 3) 100 g (4 +)
Product Name Cat. No. Size
APPL ICATIONS
AquaPor 3:1 GTAC is a molecular biology grade agarose specifically man-ufactured to yield strong gels for fine resolution of small DNA. It makes an excellent matrix for resolution of small fragment DNA and RNA. AquaPor 3:1 may be used confidently for Southern and Northern blotting, as well as DNase footprinting and RT-PCR. AquaPor 3:1 is GTAC certified to be DNase, RNase, and protease free.
Small Fragment DNA and RNART-PCR
AquaPor 3:1 GTAC
Agarose gel electrophoresis ......62
Preparing agarose gels ............. 62
Restriction digest mapping .........63
Agarose electrophoresis - RNA......
67
l
l
AquaPor 3:1 GTAC EC-206 25 g 100 g (1 - 3) 100 g (4 +)
Product Name Cat. No. Size
APPL ICATIONS

Electrophoresis Products - Buffers for Proteomics
18 USA: 1-800-526-3867EUROPE: 441 482 646022
Elec
trop
hore
sis
Pro
teom
ics
Buf
fers
5X Protein Loading Buffer
Protein Loading Buffer Blue (2X) is a reducing sample preparation buffer for
SDS-polyacrylamide gel electrophoresis (SDS-PAGE). Loading Buffer Blue (2X)
contains bromophenol blue as a tracking dye, in solution with 0.5M Tris-HCl
(pH 6.8), 4.4% (w/v) SDS, 20% (v/v) glycerol, 2% (v/v) 2-mercaptoethanol,
in distilled/deionized water.
5X Protein Loading Buffer EC-887 10 x 1ml Tris-Glycine-SDS PAGE Buffer (10X)Tris-Glycine-SDS-PAGE Buffer (10X) is a concentrated solution for use as the
running buffer in SDS-PAGE of proteins. Each bottle contains 0.25M Tris base,
1.92M glycine, and 1% (w/v) SDS.
Tris-Glycine-SDS PAGE Buffer (10X) EC-870 1 Liter 4 Liters (1-3) 4 Liters (4 +)
PROTEIN ELECTROPHORESIS BUFFERS
Tris-Tricine-SDS PAGE Buffer (10X)A concentrated solution of Tris-Tricine-SDS. Intended for use as the running buffer
in SDS polyacrylamide gel electrophoresis (PAGE) for resolving smaller proteins (
5kD to 20kD) that cannot be resolved with the traditional Laemmli buffer system.
Tris-Tricine-SDS PAGE Buffer (10X) EC-869 1 Liter
The quality of the buffers determines the electrical parameters of electrophoresis and the structure and solubility of the biomolecules under study. Buffer quality is as important for electrophoresis results as the gel matrix itself. Produced to the most exacting standards in the industry, National Diagnostics’ buffers are stable and pure. They eliminate weighing and mixing, save time, and help ensure reproducible results.
Buffer Solutions
ProtoGel BuffersNational Diagnostics’ ProtoGel Resolving Buffer and ProtoGel Stacking Buffer
will ensure the purity and performance of your Laemmli gels. ProtoGel Resolving
Buffer forms gels of .375 M Tris-HCl and 0.1% SDS, pH 8.8. ProtoGel Stacking
Buffer forms gels of .125 M Tris-HCl and 0.1% SDS, pH 6.8.
4X ProtoGel Resolving Buffer EC-892 450 ml 1 Liter (1-3) 1 Liter (4 +) 4X ProtoGel Stacking Buffer EC-893 200 ml
TM
l Stringent Quality Control l 18 Megohm Water l 0.2 Micron Filtrationl Save Money l Save Time l Improve Results
Protein Loading Buffer Blue (2X)
5X Protein Loading Buffer is a reducing sample buffer for SDS-polyacrylamide
gel electrophoresis (SDS-PAGE). 5X Protein Loading Buffer contains Tris-HCl
(pH 8.5), Lithium Dodecyl Sulfate, 50% glycerol, EDTA, DTT and tracking dye
in distilled/deionized water.
Protein Loading Buffer Blue (2X) EC-886 10 x 1ml
MOPS-SDS Running Buffer (20X)Ideal running buffer for high resolution SDS-PAGE applications. When diluted, the
buffer contains 50mM Tris, 50mM MOPS, 0.1% SDS and 1mM EDTA.
MOPS-SDS Running Buffer (20X) EC-867 450 ml 1 Liter
MES-SDS Running Buffer (20X)Popular buffer formula using the highest quality components and processed through
rigorous production and quality control standards. When diluted, the buffer
contains 50mM Tris, 50mM MES, 0.1% SDS and 1mM EDTA.
MES-SDS Running Buffer (20X) EC-868 450 ml 1 Liter
ProtoGel Quick-Cast Loading Buffer (2X)
ProtoGel Quick-Cast Loading Buffer (2X)EC-896 5 x 1ml
Recommended for use with ProtoGel Quick-Cast 12%. Provides sharpest bands
and improved resolution.
Electrophoresis Products - Buffers for Genomics
19USA: 1-800-526-3867EUROPE: 441 482 646022
ElectrophoresisG
enomics B
uffers
Online:www.nationaldiagnostics.com
PBS (10X) Phosphate Buffered SalineProduced as a 10X concentrate, National Diagnostics’ PBS is a clear, RNase free
solution. After dilution to 1X, PBS has the following electrolyte concentrations:
137 mM NaCl; 2.7 mM KCl; 10mM Phosphate Buffer.
PBS (10X) CL-253 450 ml 1 Liter 4 Liters
Tris-Glycine Electroblotting Buffer (10X)Tris-Glycine Electroblotting Buffer (10X) is a concentrated solution of the standard
tank buffer for Western electroblotting procedures. To prepare 1 liter of working
strength buffer, add 100 ml of Tris-Glycine Electroblotting Buffer to 200 ml of methanol
and 700 ml of distilled/deionized water. Tris-Glycine Electroblotting Buffer (10X)
contains 0.25M Tris base and 1.92M glycine.
Tris-Glycine Electroblotting Buffer(10X) EC-880 1 Liter 4 Liters (1-3) 4 Liters (4 +)
EDTA0.5M solution. Autoclaved.
EDTA EC-900 1 Liter
Potassium Chloride1M solution. Autoclaved.
Sodium Chloride 0.9% EC-901 1 Liter 1M EC-902 1 Liter
Tris-HClPopular formulation of Tris hydrochloride. Available in 1M solutions at pH 7.2,
7.4 and 7.6.
Tris-HCl pH 7.2 EC-922 1 Liter pH 7.4 EC-923 1 Liter pH 7.6 EC-925 1 Liter
STOCK BUFFER SOLUTIONS
Potassium Chloride EC-903 1 Liter
Sodium ChlorideFormulated in both 1M and 0.9 percent editions. Autoclaved.
Ultra-pure, clear, autoclaved RNase free solution. After dilution to 1X, TBS has
the following concentrations: 25 mM Tris; 138 mM NaCl and 2.7mM potassium
chloride.
TBS (10X) Tris Buffered Saline
Same outstanding quality as our TBS buffer with added Tween-20 component.
When diluted to 1X, TBST has the following concentrations: 25 mM Tris; 138 mM
NaCl, 2.7mM potassium chloride and 0.05% Tween-20.
TBST (10X)Tris Buffered Saline w/ Tween-20
TBS (10X) EC-881 1 Liter
TBST (10X) EC-882 1 Liter
PROTEIN BLOTTING BUFFERS
Potassium Acetate 1M EC-908 1 Liter 5M EC-909 1 Liter
Potassium AcetateUltrapure, autoclaved solutions. Available in two concentrations.
Sodium Acetate pH 4.5 EC-905 200 ml pH 5.2 EC-906 200 ml pH 7.0 EC-907 200 ml
Sodium Acetate3M solutions optimized for genomic precipitation. Autoclaved and ultrapure.
Available in pH 4.5, 5.2, and 7.0.
Electrophoresis Products - Protein Visualization
20 USA: 1-800-526-3867EUROPE: 441 482 646022
Elec
trop
hore
sis
Pro
tein
Vis
ualiz
atio
n
TE Buffer (100X)TE Buffer is an autoclaved 100X concentrated solution of 1M Tris-HCl, pH 8, with 0.1
M Na2EDTA. This buffer is the standard for DNA and RNA purification, processing
and storage. National Diagnostics’ TE buffer is produced to the same exacting
standards that have made all our buffers trusted by molecular biologists worldwide.
Triple Dye Loading Buffer (6X)With three tracking dyes (bromophenol blue, xylene cyanole, and Orange G), Triple
Dye Loading Buffer (6X) is a nondenaturing loading buffer for native polyacrylamide
and agarose gel applications. Triple Dye Loading Buffer contains 50% (w/v) sucrose
and 40mM Tris base in distilled, deionized water.
TBE Buffer (10X or 5X)National Diagnostics’ TBE Buffer is a concentrated buffer solution of Tris-Borate-ED-
TA in distilled/deionized water. TBE is ready-to-use as a 10X or 5X concentrate.
When diluted, the 1X solution contains 0.089M Tris base, 0.089M boric acid
(pH 8.3) and 2mM Na2EDTA.
TBE Buffer 10X EC-860 1 Liter 4 Liters (1-3) 4 Liters (4 +)
TBE Buffer 5X EC-861 1 Liter 4 Liters (1-3) 4 Liters (4 +)
TE Buffer 100X EC-862 25 ml
Triple Dye Loading Buffer 6X EC-855 1.2 ml
Denaturation SolutionNational Diagnostics’ Denaturation Solution is a ready-to-use buffer solution of
sodium chloride and sodium hydroxide in distilled/deionized water. It is especially
designed for use in Southern and Northern Blotting, and in situ hybridization
procedures. Denaturation Solution contains 1.5M sodium chloride and 0.5M sodium
hydroxide.
Denaturation Solution EC-875 1 Liter (1-3) 1 Liter (4 +)
Neutralization SolutionNational Diagnostics’ Neutralization Solution is a ready-to-use sodium chlo-
ride-Tris buffer solution. It is especially designed for use in Southern and Northern
Blotting, and in situ hybridization procedures. Neutralization Solution contains 3M
sodium chloride and 0.5M Tris in distilled/deionized water.
Neutralization Solution EC-876 1 Liter (1-3) 1 Liter (4 +)
SSC Buffer (20X)SSC Buffer (20X) is a concentrated solution of sodium chloride-sodium citrate
in distilled/deionized water. SSC Buffer is widely used in nucleic acid blotting
and hybridization protocols. SSC Concentrate (20X) is already in solution, which
eliminates the weighing, mixing, and adjusting of pH necessary with powdered
buffers. The 20X formulation allows for easy dilutions to all needed concentrations.
SSC Buffer Concentrate (20X) contains 3M sodium chloride and 0.3M sodium
citrate (pH 7.0).
SSC Buffer (20X) EC-873 1 Liter 4 Liters
DNA/RNA BLOTTING
TTE Glycerol Tolerant Buffer (20X)National Diagnostics’ TTE Glycerol Tolerant Buffer (20X) is a concentrated Tris-Tau-
rine-EDTA buffer solution in distilled/deionized water. TTE (20X) eliminates the
band distortion associated with DNA samples in glycerol. National Diagnostics’
TTE Glycerol Tolerant Buffer (20X) is supplied in 1 liter bottles, containing 1.78M
Tris base, 0.57M Taurine, and 10mM Na2EDTA.
TTE Glycerol Tolerant Buffer (20X) EC-871 1 Liter (1-3) 1 Liter (4 +)
DNA/RNA ELECTROPHORESIS
TAE Buffer (50X)TAE Buffer (50X) is a concentrated solution of 2M Tris-Acetate and 100mM
Na2EDTA in distilled/deionized water (pH 8.3 at 1X concentration). TAE Buffer
is used for agarose DNA electrophoresis.
TAE Buffer 50X EC-872 1 Liter (1-3) 1 Liter (4 +)
UreaGel Loading Buffer UreaGel Loading Buffer is a denaturing loading buffer for UreaGel and other
denaturing polyacrylamide gel applications. UreaGel Loading Buffer contains
95% Formamide, 18mM EDTA, SDS, Xylene Cyanol and Bromophenol Blue.
UreaGel Loading Buffer EC-857 10 x 1 ml
MESA RNA Electrophoresis Buffer EC-911 1 L
MESA RNA Electrophoresis Buffer An RNase-free buffer (MOPS/EDTA/Sodium acetate) for RNA electrophoresis.
Used as both the tank and gel buffer for denaturing RNA agarose electrophoresis .
20X SSPE
Denhardt’s Solution EC-915 50 ml
Denhardt’s SolutionComponent of hybridization solutions for Northern and Southern blotting. Increases
speed and sensitivity of hybridization reactions.
20X SSPE EC-910 1 L
Washing buffer for Northern and Southern blotting. DNase and RNase free.

Electrophoresis Products - Protein Visualization
21USA: 1-800-526-3867EUROPE: 441 482 646022
ElectrophoresisP
rotein Visualization
Whether you are working with stains, radioactivity, fluorescence, chemiluminescence or bioluminescence, our products can help improve your results. National Diagnostics offers a range of vi-sualizing agents and enhancers to make detection more sensitive with increased efficiency.
Electrophoresis Detection and Visualization Systems
ProtoStainTM Blue
Wash gel 3 times for 10 minutes with deionized
water on an orbital shaker.
Add enough staining solution to completely cover the gel (20 - 50 ml). Bands containing more than 1µg of protein will be detected within 15 minutes. (For maximum sensitivity incubate the gel in stain for at least 4-5 hours.)
Fast Protocol - No mixing or measuring
• Fastest, Most Sensitive Coomassie Stain• Ready to Use: No Measuring or Mixing• Detects As Little As 1ng of BSA
ProtoStain Blue is a colloidal Coomassie Blue G-250 solution that is a safer, more sensitive method for detecting proteins on electrophoresis gels. Bands begin to appear in only 15 minutes, and ProtoStain Blue has the ability to detect down to 1ng denatured BSA.
ProtoStain Blue is safe and nonhazardous, containing no methanol, acetic acid or phosphoric acid.
Nanogram Sensitivity
12% ProtoGel, loaded with indicated dilutions of BSA and Ovalbumin, and stained with ProtoStain Blue.
Staining proteins in gels .............86 Colloidal Coomassie ..................87
APPL ICATIONS
ProtoStain Blue EC-727 1 Liter
Product Name Cat. No. Size

Electrophoresis Products - Protein Visualization
22 USA: 1-800-526-3867EUROPE: 441 482 646022
Elec
trop
hore
sis
Pro
tein
Vis
ualiz
atio
n
SterlingTM Rapid Silver Stain
The Sterling Silver Staining System offers high sensitivity silver staining faster and more conveniently than any other kit. The unique chemistry of Sterling allows staining using only one solution. Simply fix a polyacrylamide gel using our unique fixative, wash, and place the gel in the staining solution. Bands will appear in 5-10 minutes. The Sterling Silver Staining System stains 18 mini-gels.
Detects Sub-Nanogram Levels of DNA or 5ng of ProteinFix, Wash and Stain in One HourEasy System with Fewer Reagents and One Stain
l l
l
APPLICATIONSSilver staining proteins ...............89 Silver staining DNA ....................82 Sterling Kit EC-720 1 kit (1-3)
1 kit (4+)
Product Name Cat. No. Size
Compared to similar stains, the more finely controlled colloidal structure of ProtoBlue Safe improves both the sensitivity and the universality of staining. ProtoBlue Safe is less prone to high background caused by trace residual SDS in the gel.
Costs Less than Regular Coomassie
Nonhazardous DisposalUsed stain solution is not hazardous waste (as defined by United States Title 40 Code of Federal Regulations (40 CFR 261.24(a)). Sink disposal of ProtoBlue Safe is permitted in most locations.
Long Shelf Life - ProtoBlue Safe is stable for two years stored at room temperature in a cool, dry place.
ProtoBlue Safe EC-722 450 ml 1 Liter 4 Liter
Eco-Friendly, Ultra Sensitive Colloidal Coomassie G-250 Stain
ProtoBlueTM Safe®
Coomassie is a registered trademark of Imperial Chemical Industries, PLC.
Laboratories typically spend twice as much per gel in methanol and acetic acid for staining and destaining with regular Coomassie than for ProtoBlue Safe (including ethanol cost). In addition, ProtoBlue Safe is much faster, more sensitive, and can be poured down the drain after use.
Product Name Cat. No. Size
®

Electrophoresis Products - Protein Visualization
23USA: 1-800-526-3867EUROPE: 441 482 646022
ElectrophoresisP
rotein Visualization
Coomassie Blue R-250 is a sensitive stain for protein detection in PAGE gels. Coomassie staining gives blue bands on a clear background, with a sensitivity of 50-100 ng/band.
Coomassie Blue R-250
Coomassie Blue G-250 is a useful stain for protein detection in PAGE gels. Coomassie staining gives blue bands on a clear background, with a sensi-tivity of 100 - 500 ng/band. The G-250 dye is converted to a leuco form below pH 2-3. The leuco form regains color on protein binding, and is the basis for the Bradford Protein Assay.
Coomassie Blue G-250
Amido BlackAmido Black was one of the first dyes used to detect proteins on electropho-retic gels. It is not as sensitive as Coomassie Blue R-250 for most proteins, but it can be a better stain for some acidic peptides which stain poorly in Coomassie.
Amido Black 10B HS-601 25 g
Product Name Cat. No. Size
Coomassie Blue R-250 HS-604 10 g
Product Name Cat. No. Size
Coomassie Blue G-250 HS-605 10 g
Product Name Cat. No. Size
Powdered Stains
Bromophenol Blue Bromophenol Blue is used as a tracking dye, because its charge/mass ratio allows it to comigrate with smaller macromolecules through PAGE and Aga-rose gels. The dye undergoes a color shift to yellow at acidic pH.
Bromophenol Blue HS-603 10 g
Product Name Cat. No. Size
®
®
Coomassie is a registered trademark of Imperial Industries, PLC.®
Electrophoresis Products - Protein Visualization
24 USA: 1-800-526-3867EUROPE: 441 482 646022
Elec
trop
hore
sis
Pro
tein
Vis
ualiz
atio
n
Western Blotting
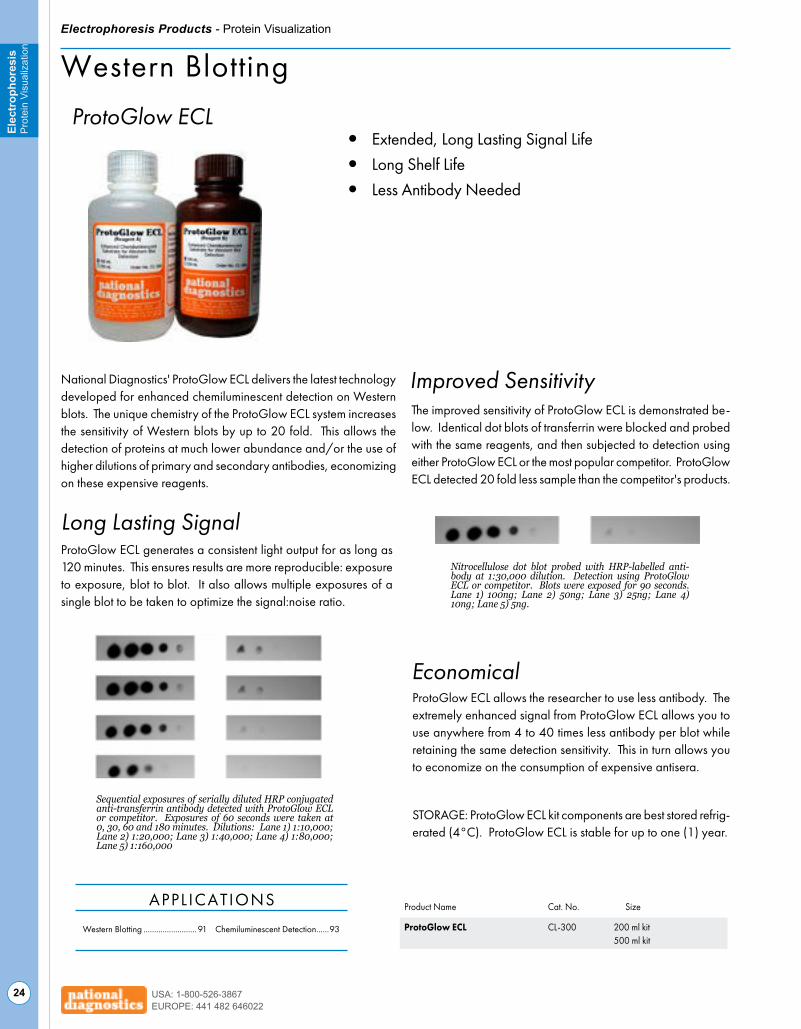
National Diagnostics' ProtoGlow ECL delivers the latest technology developed for enhanced chemiluminescent detection on Western blots. The unique chemistry of the ProtoGlow ECL system increases the sensitivity of Western blots by up to 20 fold. This allows the detection of proteins at much lower abundance and/or the use of higher dilutions of primary and secondary antibodies, economizing on these expensive reagents.
Improved Sensitivity
Economical
The improved sensitivity of ProtoGlow ECL is demonstrated be-low. Identical dot blots of transferrin were blocked and probed with the same reagents, and then subjected to detection using either ProtoGlow ECL or the most popular competitor. ProtoGlow ECL detected 20 fold less sample than the competitor's products.
ProtoGlow ECL generates a consistent light output for as long as 120 minutes. This ensures results are more reproducible: exposure to exposure, blot to blot. It also allows multiple exposures of a single blot to be taken to optimize the signal:noise ratio.
Nitrocellulose dot blot probed with HRP-labelled anti-body at 1:30,000 dilution. Detection using ProtoGlow ECL or competitor. Blots were exposed for 90 seconds. Lane 1) 100ng; Lane 2) 50ng; Lane 3) 25ng; Lane 4) 10ng; Lane 5) 5ng.
Sequential exposures of serially diluted HRP conjugated anti-transferrin antibody detected with ProtoGlow ECL or competitor. Exposures of 60 seconds were taken at 0, 30, 60 and 180 minutes. Dilutions: Lane 1) 1:10,000; Lane 2) 1:20,000; Lane 3) 1:40,000; Lane 4) 1:80,000; Lane 5) 1:160,000
Product Name Cat. No. Size
ProtoGlow ECLExtended, Long Lasting Signal LifeLong Shelf LifeLess Antibody Needed
l
l
l
Long Lasting Signal
ProtoGlow ECL allows the researcher to use less antibody. The extremely enhanced signal from ProtoGlow ECL allows you to use anywhere from 4 to 40 times less antibody per blot while retaining the same detection sensitivity. This in turn allows you to economize on the consumption of expensive antisera.
STORAGE: ProtoGlow ECL kit components are best stored refrig-erated (4°C). ProtoGlow ECL is stable for up to one (1) year.
ProtoGlow ECL CL-300 200 ml kit 500 ml kit
Western Blotting ......................... 91 Chemiluminescent Detection ......93
APPL ICATIONS

Electrophoresis Products - Protein Visualization
25USA: 1-800-526-3867EUROPE: 441 482 646022
ElectrophoresisP
rotein Visualization
Extended, Long Lasting Signal LifeLong Shelf LifeLess Antibody Needed
ProtoBlot Rapid Western Blotting Buffer (10X)
Blot in Half the Time of Conventional Electroblotting BuffersVery High Efficiency TransferNeutral pH
l
l
l
Simple and effective, the ProtoBlot Rapid Western Blotting Buffer halves the time needed to blot your gels. Blots that normally take an hour to complete can now be done within 30 minutes. Less heating occurs, and the compo-sition is less harsh, leading to better preservation of epitopes. The efficiency of transfer is very high, improving the signal/noise ratio.
ProtoBlot Rapid Western Blotting Buffer (10X) EC-878 1 L
Product Name Cat. No. Size
ProtoLift TM Western Stripping Buffer
Strip PVDF Blots in 10 minutesContains Zero Harsh DetergentsNon-Acidic
l
l
l
The ProtoLift Western Stripping Buffer is a more effective system for stripping your PVDF Western Blots. Antibodies can be stripped from blots within 10 minutes. Target proteins are not stripped from the membrane, so blots can be stripped with ProtoLift Western Stripping Buffer multiple times without loss of signal.
Note: ProtoLift Western Stripping Buffer is not recommended for nitrocellu-lose blots.
ProtoLift Western Stripping Buffer EC-889 100 ml
Product Name Cat. No. Size
Western Blotting ......................... 91
Stripping blots .............................93
Colloidal Coomassie Staining ...86
APPL ICATIONS
Western Blotting ......................... 91
Wet Transfer ................................92
Colloidal Coomassie Staining ...86
APPL ICATIONS
TM

Electrophoresis Products - Protein Visualization
26 USA: 1-800-526-3867EUROPE: 441 482 646022
Elec
trop
hore
sis
Pro
tein
Vis
ualiz
atio
n
Protein Blotting Buffers
Produced as a 10X concentrate, National Diagnostics’ PBS is a clear, RNase free solution. After dilution to 1X, PBS has the following electrolyte concentrations: 137 mM NaCl; 2.7 mM KCl; 10mM Phosphate Buffer.
PBS(10X) Phosphate Buffered Saline
Western blotting ........................ 91
Product Name Cat. No. Size APPL ICATION
Tris-Glycine Electroblotting Buffer (10X) is a concentrated solution for use as the tank buffer in Western electroblotting procedures. Each bottle of Tris-Glycine Electroblotting Buffer (10X) contains 0.25M Tris base and 1.92M glycine. To prepare 1 liter of working strength buffer, add 100 ml of Tris-Glycine Electroblotting Buffer to 200 ml of methanol and 700 ml of distilled/deionized water.
Tris-Glycine Electroblotting Buffer (10X)
Western blotting ........................ 91Tris-Glycine Electroblotting Buffer(10X) EC-880 1 Liter 4 Liters (1-3) 4 Liters (4 +)
Product Name Cat. No. Size
APPL ICATION
ProtoBlock solution contains a broad spectrum of proteins, protein analogs, detergents, and buffers which are designed to minimize endogenous back-grounds. ProtoBlock solution may be used for Western Blotting, Southern Blotting, immunoassays, and in situ hybridization.
ProtoBlock System Protein Blocking Solution for ImmunoassaysEliminates Endogenous Background
ProtoBlock System CL-252 1 System
Product Name Cat. No. Size
Ultra pure, clear, autoclaved RNase free solution. After dilution to 1X, TBS has the following concentrations: 25 mM Tris; 138 mM NaCl and 2.7mM potas-sium chloride.
TBS (10X) EC-881 1 Liter
Product Name Cat. No. Size
Same outstanding quality as our TBS buffer with added Tween-20 component. When diluted to 1X, TBST has the following concentrations: 25 mM Tris, 138 mM NaCl, 2.7mM potassium chloride and 0.05% Tween-20.
TBST (10X) EC-882 1 Liter
Product Name Cat. No. Size
l
l
TBS (10X) Tris Buffered Saline
TBST (10X) Tris Buffered Saline w/ Tween-20
PBS(10X) CL-253 450 ml 1 Liter 4 Liters

Electrophoresis Products - Protein Visualization
27USA: 1-800-526-3867EUROPE: 441 482 646022
ElectrophoresisP
rotein Visualization
Protein Standards
National Diagnostics’ ProtoMarkers consist of seven (7) purified proteins. Six markers are permanently labeled with high-contrast blue dye. One protein is labeled with high-contrast red dye to facilitate accurate positioning on the gel. ProtoMarkers protein standards range in size from approximately 20 kD to 190 kD, covering the most common protein molecular weights.
ProtoMarkers are supplied in quantities of 0.5 ml per vial. Each vial contains sufficient material for 100 mini-gels.
ProtoMarkers Proteins Stained with High Definition Blue DyeRed Protein Band Included for Easy OrientationHigh Contrast, High Intensity Labeling
l
l
l
ProtoMarkers EC-898 0.5 ml
Product Name Cat. No. Size
TM
Gel electrophoresis of
proteins .......................................69
Molecular wt. determination .....72
2-dimensional
electrophoresis ...........................79
Western blotting ........................ 91
APPL ICATIONS
17
22
29
47
70
86
190
kDa
ProtoMetrics
National Diagnostics’ ProtoMetrics Protein Markers consist of 9 precisely sized recombinant proteins of 10, 15, 25, 35, 50, 75, 100, 150, and 225 kDa.
The ProtoMetrics Protein Markers are supplied in quantities of 0.5 ml per vial. Each vial contains sufficient material for 100 mini-gels.
Engineered for Exact MobilitiesSharpest, most precise bands for electrophoresis and blotting
l
l
ProtoMetrics EC-899 0.5 ml
Product Name Cat. No. Size
kDa
225
150
100
75
*50
35
25
15
10
*Gel run using 5 microliters of ProtoMetrics, stained with Coomassie Blue. Note the high intensity 50kD reference band.
TM
National Diagnostics’ Insite Markers contain both visible markers for orien-tation during the run and high precision protein standards (10 - 225 kD) that appear with fluorescent detection. This allows both confident monitoring of the run and precise assignment of protein molecular weights.
The Insite Markers are supplied in a 0.5 ml vial. Each vial contains sufficient material to run between 50 and 100 mini-gels.
Insite MarkersTwo Sets of Markers in One
Prestained Markers Provide Orientation During the Run
Engineered Molecular Weight Standards Appear in Fluorescent Detection
l
l
l
Insite Markers EC-897 0.5 ml
Product Name Cat. No. Size
With fluorescent detection visible markers disappear and engineered standards come forward
kDa
225150100
75
50
35
25
15
10
TM
kDa
190
8659
50
35
26
17
Gel electrophoresis of
proteins .......................................69
Molecular wt. determination .....72
2-dimensional
electrophoresis ...........................79
Western blotting ........................ 91
APPL ICATIONS
Gel electrophoresis of
proteins .......................................69
Molecular wt. determination .....72
2-dimensional
electrophoresis ...........................79
Western blotting ........................ 91
APPL ICATIONS

Electrophoresis Products - Protein Sample Preparation
28 USA: 1-800-526-3867EUROPE: 441 482 646022
Elec
trop
hore
sis
Sam
ple
Pre
para
tion
28
Preparing Protein Samples for PAGE
Removes interfering contaminants Concentrates dilute samples Prevents gel failuresSimple and Inexpensive
l
l
l
l
ProtoGel SamplePrep Kit
Unpurified and purified samples in SDS-PAGE.
PurificationContaminants in the sample such as high salt or urea lead to blurred bands or smiling gels in SDS-PAGE. With the ProtoGel Sample Prep Kit, interfering substances from upstream applications can no longer gain entry to the well. Contaminants are washed away with a simple method. The sample loaded contains only pure protein and loading buffer with no contaminants remaining to impede reproducible, high-resolution results.
In addition to purification, proteins previously too dilute for SDS-PAGE can now be concentrated prior to electrophoresis with a simple method. The ProtoGel Sample Prep Kit concentrates proteins as dilute as 25ng/100µl. The patented ProtoGel Sample Prep Kit casts the finest net of any recovery system, concentrating all proteins in high yield regardless of identity. With the ProtoGel Sample Prep Kit, the purity and concentration of your SDS-PAGE samples are both under your control.
Concentration
Lanes 1 and 3 are unconcen-trated. Lanes 2 and 4 are con-centrated.
ProtoGel Sample Prep Kit EC-884 1 Kit
Product Name Cat. No. Size
Sample Preparation ................... 69
APPL ICATIONS
ND Protein Precipitation Kit EC-888 1 Kit - Precipitates 50 ml
Product Name Cat. No. Size
More effective and much more universal than other methods, the ND Protein Precipitation Kit represents a major breakthrough in the recovery of proteins from complex solutions. (Patent Pending)
The ND Protein Precipitation Kit is universal, mild and easy to use. The ND Protein Precipitation Kit allows the high yield collection of all proteins in solution. Additionally, it casts the finest net of any procedure, precipitating even the most dilute proteins and recovers proteins that would be missed by other methods.
l Rapid Recovery and Concentration of Proteinsl Recovery of All Proteins from Complex Mixturesl Precipitates as Little as 100ng of BSA at 0.25µg/ml
ND ProteinPrecipitation Kit
1 2 3 4
Electrophoresis Products - DNA/RNA Visualization
29USA: 1-800-526-3867EUROPE: 441 482 646022
ElectrophoresisD
NA VisualizationRemoves interfering contaminants
Concentrates dilute samples Prevents gel failuresSimple and Inexpensive
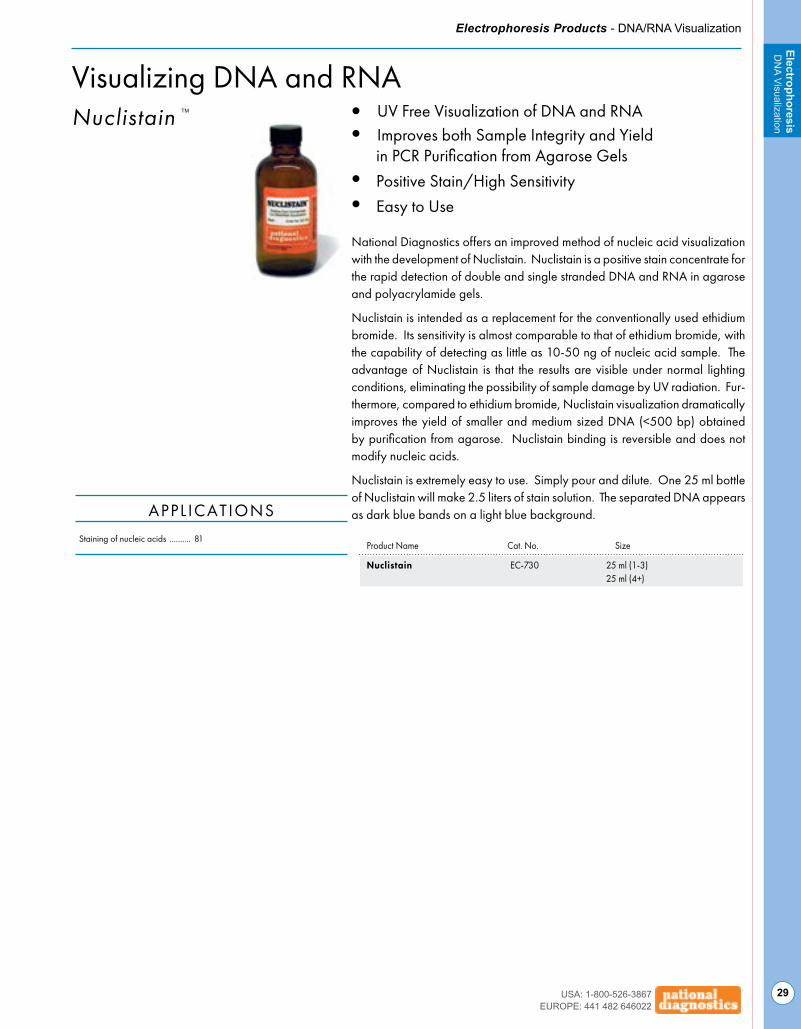
Visualizing DNA and RNA
National Diagnostics offers an improved method of nucleic acid visualization with the development of Nuclistain. Nuclistain is a positive stain concentrate for the rapid detection of double and single stranded DNA and RNA in agarose and polyacrylamide gels.
Nuclistain is intended as a replacement for the conventionally used ethidium bromide. Its sensitivity is almost comparable to that of ethidium bromide, with the capability of detecting as little as 10-50 ng of nucleic acid sample. The advantage of Nuclistain is that the results are visible under normal lighting conditions, eliminating the possibility of sample damage by UV radiation. Fur-thermore, compared to ethidium bromide, Nuclistain visualization dramatically improves the yield of smaller and medium sized DNA (<500 bp) obtained by purification from agarose. Nuclistain binding is reversible and does not modify nucleic acids.
Nuclistain is extremely easy to use. Simply pour and dilute. One 25 ml bottle of Nuclistain will make 2.5 liters of stain solution. The separated DNA appears as dark blue bands on a light blue background.
Nuclistain UV Free Visualization of DNA and RNAImproves both Sample Integrity and Yield
Staining of nucleic acids .......... 81
APPL ICATIONS
l
l
l
l
Nuclistain EC-730 25 ml (1-3) 25 ml (4+)
Product Name Cat. No. Size
TM
in PCR Purification from Agarose GelsPositive Stain/High SensitivityEasy to Use

Electrophoresis Products - DNA/RNA Visualization
30 USA: 1-800-526-3867EUROPE: 441 482 646022
Elec
trop
hore
sis
DN
A Vi
sual
izat
ion
30
Xylene Cyanole FFXylene Cyanole is a tracking dye for DNA Electrophoresis.
Bromophenol BlueBromophenol Blue is used as a tracking dye, because its charge/mass ratio allows it to comigrate with smaller macromolecules through PAGE and Aga-rose gels. The dye undergoes a color shift to yellow at acidic pH.
Bromocresol Green Bromocresol Green is used as a tracking dye for DNA electrophoresis in agarose.
Xylene Cyanole FF HS-608 25 g
Product Name Cat. No. Size
Bromocresol Green HS-602 5 g
Product Name Cat. No. Size
Bromophenol Blue HS-603 10 g
Product Name Cat. No. Size
Autofluor represents the first water soluble scintillation phosphor to be de-veloped and applied directly for use as an autoradiographic image inten-sifier. Autofluor rapidly penetrates acrylamide gel systems and maximizes energy transfer from labeled compound to phosphor. Autofluor contains no dimethylsulfoxide or aromatic solvents. Therefore, the hazards of use related to these materials are eliminated. The band distortion that is associated with using nonaqueous enhancers is also eliminated.
The Autofluor procedure is the shortest and easiest procedure yet developed for enhancement and visualization of beta-emitters. In an independent test1 comparing eight different fluorographic methods for the detection of 35S-la-beled proteins in polyacrylamide gels, Autofluor was the most effective. With Autofluor, the dpm/mm2 required to half-saturate the x-ray film was 1/8 that required by autoradiography alone.
l High Resolution Autoradiographic Image Intensifierl Rapid enhancement of low energy beta-emitters such as 3H, 14C, and 35Sl For polyacrylamide gels, paper chromatography, and TLC platesl Water based, odorless, contains no DMSO
3H 14C
AutofluorPPO-DMSO
3H 14C
Autoradiography .......................85
Southern blotting .......................84
Northern blotting .......................83
Staining of nucleic acids .......... 81
Staining proteins in gels .............86
Autofluor
APPLICATIONS
Autofluor LS-315 1 Liter (1-3) 1 Liter (4 +)
Product Name Cat. No. Size
TM
The gel (7%, 1mm) in the illustration at left was dehydrated in DMSO (dimethylsulfoxide) for one hour, then impregnated in PPO-DMSO for one hour and precipitated and dried. The right gel was impregnated with Autofluor for one hour and dried. Both gels were exposed for 24 hours at -76°C on Kodak XR-5 X-OMat film. The single tritiated band contains 5000 dpm. Note the higher degree of resolution and band discrimination with Autofluor vs PPO-DMSO.

Electrophoresis Products - Gel Accessories
31USA: 1-800-526-3867EUROPE: 441 482 646022
ElectrophoresisG
el Accessories
GelDry Film GelDry Film is a specially designed drying film to be used in air-drying procedures for polyacrylamide gels. GelDry Film will yield gels that are perfectly preserved, with no wrinkles, pox, or blemishes. Compatible with all current makes of air gel drying systems, GelDry Film is supplied as 11 x 12 cm sheets or 22.5 x 22.5 cm sheets.
Glass Bond allows polyacrylamide gels to be affixed to one of the glass plates used for casting electrophoresis gels. The glass plate is chemically modified so that the gel becomes covalently bound to the glass, enabling it to be manipulated without danger of the gel ripping or slipping off the plate. Glass Bond is especially convenient for treating large sequencing plates, as subsequent manipulation can be performed without fear of ripping or dis-rupting the gel. On plates treated with Glass Bond, the gels dry down to a smooth plastic film without the use of a gel dryer, thus autoradiography can easily be performed. A total of 6.25 liters of bonding solution (enough for over 100 applications on 40 X 40 cm glass plates) can be made from one 25 ml bottle of Glass Bond.
Glass Bond
National Diagnostics has specialized in providing the best and most convenient electrophoresis reagents for over 25 years. Our unique experience in this field ensures the quality of all materials. Our accessory reagents and supplies are selected and prepared specifically for electrophoretic applications, assuring superior results and reproducibility.
Gel Accessories
Gel Dry Film - 11 x 12 cm EC-612 50 sheets Gel Dry Film - 22.5 x 22.5 cm EC-622 50 sheets
Product Name Cat. No. Size
Glass Bond EC-620 25 ml
Product Name Cat. No. Size
TM
TM
National Diagnostic’s Glass Free coats glass casting plates for easy release of polyacrylamide gels. Glass Free prevents the cast gel from binding to the removable upper glass casting plate. Glass Free—used in conjunction with Glass Bond—guarantees whole, manageable electrophoretic gels time after time. Glass Free is reusable and has a shelf life of two years.
Glass Free
Glass Free EC-621 450 ml
Product Name Cat. No. Size
TM
Electrophoresis grade Ion Exchange Resin is a mixture of anionic and cationic resins specially prepared for the deionization of electrophoretic gel monomer solutions prior to initiation.
Ion Exchange Resin(mixed bed) - ULTRA PURE
Wet mesh ..............................16-50
Moisture content ..................... 55%
Maximum Temperature ......... 60oC
Capacity................... 0.55 meq/ml
Ion Exchange Resin EC-408 100 g
Product Name Cat. No. Size

Electrophoresis Products - Reagents
32 USA: 1-800-526-3867EUROPE: 441 482 646022
Elec
trop
hore
sis
Rea
gent
s
For those cases where our wide array of pre-mixed Electrophoresis solutions do not provide the exact matrix or buffer required, National Diagnostics powdered reagents allow you to formulate your gels with confidence in the purity and reliability of key ingredients. National Diagnostics reagents are manufactured to the most stringently controlled specifications.
Ultra-Pure Reagents
Purity………………………………… > 99.9%Aldehyde Content……………… < 0.001%Conductivity (50% solution)………… 20 µmho
Purity.................................> 99.9%Conductivity (2% solution)......100 µmho
National Diagnostics’ Acrylamide has been specially purified to produce consistent gel matrices for the most demanding requirements. Reproducible polymerization makes consistent electrophoretic behavior easy to attain.Molecular Weight…………………… 71.08pH…………………………………………… 6.5Acrylic Acid………………………< 0.001%
Acrylamide - ULTRA PURE
Acrylamide EC-201 100 g 500 g 1 kg
Ammonium Persulfate - ULTRA PURE
Exceeds ACS Standards. Low absorbed water results in consistent initiation.
Molecular Weight…………………… 228.2 Purity……………………………………… > 98%
Ammonium Persulfate EC-504 25 g 100 g
BIS - ULTRA PURE(N,N´ - methylene bisacrylamide)
Specially purified crosslinking agent for general electrophoretic use.
BIS EC-301 25 g
OD280 (1% solution)………………………… < 0.2Acrylic Acid………………………… < 0.001%
Boric Acid - ULTRA PURE
Boric Acid EC-609 500 g
Molecular Weight…………………… 61.83Color……………………………… < 10 APHASO4…………………………………… < 4 ppm
pH (1% solution)………………… 5.1 + 0.5Cl…………………………………… < 0.4 ppmFe……………………………………… < 2 ppm
Dextran Sulfate ULTRA PURE
Aids in formation of networks (high localized concentrations of probes) during hybridization, thus expediting the annealing process.
Molecular Weight………………… 500,000 Purity……………………………………… > 99%
Dextran Sulfate EC-877 50 g 250 g
Dithiothreitol (DTT)ULTRA PURE
Specially purified of trace metals and other impurities.
Dithiothreitol (DTT) EC-601 1 g 5 g
EDTA - ULTRA PUREDisodium ethylenediamine - tetraacetate dihydrate
EDTA EC-610 100 g 500 g
Molecular Weight…………………… 372.26Fe………………………………………… < 0.01%Color…………< 10 APHA (0.5M solution)Heavy Metals……………………… < 10 ppm
Purity……………………………………… > 99%Insolubles…………………………… < 0.005%pH (5% solution)………………… < 4.0-6.0
Molecular biology grade, denatured ethanol (5% Methanol)
Reagent Ethanol - ULTRA PURE
Reagent Ethanol HS-300 1 Liter 4 Liter 20 Liter
Crosslinker with a 1,2-diol structure that may be oxidized by periodic acid.
DATD - ULTRA PURE(N,N´ - diallyltartardiamide)
DATD EC-303 25 g
Ready-to-use. Deionized and packed under nitrogen.
Formamide - ULTRA PURE
Formamide EC-608 200 ml 450 ml
Molecular Weight…………………… 45.04Conductivity…………………… < 25 µmhoHeavy Metals……………………… < 5 ppm
Purity…………………………………… > 99%Color……………………………… < 10 APHA

Electrophoresis Products - Reagents
33USA: 1-800-526-3867EUROPE: 441 482 646022
ElectrophoresisR
eagents
Glycerol - ULTRA PURE
Glycerol EC-606 450 ml
Molecular Weight…………………… 92.09pH……………………………………… neutralA280…………………………………… < 0.05
Assay………………………………> 99.7%Color……………………………< 10 APHA
Purified by novel chelation chromatography.
Glycine - ULTRA PURE
Glycine EC-405 250 g 1 kg
Molecular Weight…………………… 75.07Heavy Metals……………………< 20 ppm
OD280 (1M solution)………………… < 0.15
Triple distilled and stored under nitrogen.
2-Mercaptoethanol - ULTRA PURE
Molecular Weight……………………… 78.1Molarity…………………………………… 14.2Meta-hydroxy-diethyldisulfide… 0.5% max
Water……………………………… 0.5% maxPurity…………………………………… > 98%Color……………………… < 30 (max) APHA
2-Mercaptoethanol EC-603 50 ml
Riboflavin - ULTRA PURESingle crystalline species for greater reproducibility.
Riboflavin EC-501 25 g
Molecular Weight………………… 376.37 Purity…………………………………… > 99%
SDS - ULTRA PURE(Sodium dodecylsulfate)
SDS EC-604 100 g 1 kg
Molecular Weight………………… 288.38OD280.(3% solution)……………… < 0.1Lead (Pb)………………………… < 0.0002%
Purity……………………………… > 99% FASC12Sulfate……………………………… > 99%Phosphate (PO4)……………… < 0.0001%
Fractionally distilled to remove all trace metals and amine impurities.
TEMED (redistilled) - ULTRA PURE(N, N, N´, N´ - tetramethylethylene diamine)
TEMED EC-503 25 ml
Molecular Weight…………………… 16.21Refr. Index…………… 1.1480 +/– 0.003
Boiling Range………………… 119-121CCPurity…………………………………… > 99%
Tricine - ULTRA PURE(N-Tris (hydroxymethylmethylglycine))
Tricine EC-407 100 g
Molecular Weight…………………179.17Heavy Metals……………………< 20 ppm
Purity……………………………………> 99%
Purified of ammonia and amine contaminants.
Tris - ULTRA PURE[Tris(hydroxymethyl)aminomethane]
Tris EC-406 250 g 1 kg
Molecular Weight…………………121.14OD280 (1M Solution)………………< 0.15Mg……………………………………< 1 ppmAs……………………………………… < 5 ppm
Purity………………………………… > 99.9%Pb……………………………………… < 1 ppmFe……………………………………… < 1 ppmCu……………………………………… < 1 ppm
Tween-20* - ULTRA PURE
Tween-20 EC-607 200 ml 1 liter
Urea - ULTRA PURE
Recrystallized to remove ammonia.
Urea EC-605 250 g 1 kg
Molecular Weight…………………… 60.06OD280.(5M Solution)……………… < 0.05Fe……………………………………… < 1 ppm
Biuret test…………………………… negativeHeavy Metals…………………… < 0.5 ppmCNO…………………………………< 5 ppm
SDS Solution (20%)Purified to remove colored contaminants that interfere with spectrophotometric analysis. Zero free sulfates eliminate non-specific binding.
SDS Solution (20%) EC-874 100 ml 450 ml
Water - DEPC Treated, SterileCertified Nuclease Free, Deionized and Autoclaved
Water, Sterile DEPC Treated EC-625 1Liter
DNAse……………………………negative RNAse……………………………negative
Conductivity………………< 5micromhoMetals……………………………< 5 ppm

34 USA: 1-800-526-3867EUROPE: 441 482 646022
Electrophoresis Applications - Fundamental Principles of ElectrophoresisEl
ectr
opho
resi
sA
pplic
atio
ns
1 Fundamental Principles of Electrophoresis
1.1 BIOMOLECULES Nucleic Acids / Proteins
1.2 THE MECHANICAL AND ELECTRICAL DYNAMICS OF GEL ELECTROPHORESIS
Sample Mobility / Electrophoresis System Dynamics
1.3 THE MATRIX Polyacrylamide / Agarose
1.4 BUFFERS HomogeneousBufferSystems/Multiphasic
BufferSystems/Isotachophoresis/BufferAdditives
1.5 THE APPARATUS Standard Designs / Running Parameters
The Fundamentals of Electrophoresis...Life in the Fast Lane
Techniques for separating mixtures of biological substances are of central importance to life science research. Many techniques have been developed taking advantage of differences in chemistry, biology, charge, or size to separate the molecular forms found in biological samples. Of these methods, gel electrophoresis has few
rivals for the small-scale separation of proteins or nucleic acids. Because of its high resolution and sensitivity, elec-trophoresis is universally practiced throughout the fields of molecular biology, biochemistry and biology.
At its most fundamental level, gel electrophoresis involves applying an electric field to a mixture of biological mol-ecules which causes them to migrate through a matrix, or gel. For most electrophoresis techniques, separation then occurs on the basis of molecular size. The larger molecules have more difficulty moving through the gel. Mixture components separate into discrete ‘bands’, the smaller forms having more mobility through the gel. Patterns of such bands are then visualized for a variety of analytical purposes. A number of techniques also exist to extract and purify the nucleic acid or protein from an individual band.

35USA: 1-800-526-3867EUROPE: 441 482 646022
Electrophoresis Applications - Fundamental Principles of ElectrophoresisElectrophoresis
Applications
1.1 The BiomoleculesOf the four kinds of biological macromolecules: nucleic acids, proteins, carbohydrates, and lipids, electrophoresis is generally employed to analyze nucleic acids or proteins. In order to understand their behavior in electrophoresis systems, it is necessary to have a firm grasp of the structure of these molecules.
1.1.1 Nucleic AcidsLike many biological molecules nucleic acids are polymers, long mole-cules formed of repeating units. With nucleic acids, the repeating unit is the nucleotide. A nucleotide consists of a five carbon sugar, a nitrogen containing base and a phosphate group. The two primary kinds of nucleic acids, deoxyribonucleic acid (DNA) and ribonucleic acid (RNA), possess slightly different sugars in their respective nucleotides and a different set of four bases which may be contained by their nucleotides.
DNAnucleotide
RNAnucleotide
Figure 1.1.1a The nucleotides of DNA and RNA.
Figure 1.1.1b The set of bases which may be presented in the nucleotides of DNA and RNA.
adenine thymine (DNA ONLY)
uracil(RNA ONLY)
guanine cytosine
Figure 1.1.1c The structure of a section of an RNA molecule.
Of great importance to electrophoresis is the ionization of the phosphate groups, giving nucleic acids a large net negative charge. Because each nucleotide is ionized, the charge to mass ratio of two different nucleic acid molecules will very closely agree.
Figure 1.1.1d Because each nu-cleotide carries a negative phosphate group, the charge to mass ratios of different nucleic acid molecules are nearly identical.
Figure 1.1.1e Because DNA mole-cules are negatively charged, electric force causes DNA to migrate toward the positive pole.
DNA and RNA each contain four possible nucleotides corresponding to the set of four possible bases (adenine, guanine, thymine and cytosine for DNA; adenine, guanine, uracil, and cytosine for RNA). Each base exhibits a particular affinity for one of the other three bases, based on
hydrogen bonding symmetries. The nitrogen base adenine “base pairs” with thymine (or uracil in RNA). Guanine “base pairs” with cytosine. Because of base pairing, DNA or RNA can exist as single stranded or double stranded variants. The double stranded form consists of two complementary strands joined by base pairing.
Figure 1.1.1f The base pairing of two complementary strands allows nucleic acid molecules to assume a double stranded form.
Figure 1.1.1g Base pairing is not limited to double stranded variants, but can also occur within the same molecule. The resulting conformations can lead to electrophoresis results that are difficult to interpret.
Base pairing can also occur in single stranded DNA or RNA. A section containing one sequence of nucleotides will often loop back and base pair with a complementary section on the same chain. This will affect the 3 dimensional structure of the molecule, with implications for elec-trophoretic separations. In general, long strands of DNA or RNA will be found in a base-paired conformation, either double stranded or single stranded with internal pairing. Unpaired, or “denatured” nucleic acids are only found in solution under special conditions which destabilize the base pairs.
Figure 1.1.1h Formamide and urea accomplish the denaturation of DNA or RNA by forming new hydrogen bonds with the bases of the nucleic acid molecules, disrupting the hydrogen bonds that lead to base pairing.
Electrophoresis of double stranded DNA or RNA is referred to as native gel electrophoresis. Electrophoresis of single stranded DNA or RNA occurs under denaturing conditions. Formamide and urea are the two most common agents which accomplish chemical denaturation. These substances act to disrupt the hydrogen bonding between the nitrogen bases, thereby removing the effects of base pairing. Usually some com-bination of formamide, urea, and heat is employed over the process of denaturing electrophoresis from sample preparation to running the gel. The purposes of denaturing conditions are to ensure single stranded molecules and to prevent conformational changes due to base pairing between different sections of the same DNA or RNA molecule. Dena-turing electrophoresis conditions allow for a consistent relationship between molecular size and mobility through the gel.
Formamide EC-608 Deionized and packed under nitrogen. Ready-to-use. (pg. 32)
Denaturing Agents
Urea EC-605 Lowest possible ammonia content enhancing long term stability. (pg. 33)

36 USA: 1-800-526-3867EUROPE: 441 482 646022
Electrophoresis Applications - Fundamental Principles of ElectrophoresisEl
ectr
opho
resi
sA
pplic
atio
ns
Figure 1.1.2a Amino acids are the basic structural units of proteins. An amino acid consists of an amine group, carboxyl group, hydrogen atom, and a side-chain group bonded to a central carbon atom.
1.1.2 ProteinsLike nucleic acids, proteins are polymers. While with nucleic acids the repeating unit is the nucleotide, with proteins, the analogous repeating unit is the amino acid. Amino acids consist of a central carbon which carries an amino group, a carboxyl group, a hydrogen, and a side chain group. Amino acids are distinguished by the properties of their side chains.
Nonpolar, Non-ionizable
Polar, Non-ionizable
AcidicBasic
Alanine ValineLeucine Isoleucine
Proline
Tryptophan
PhenylalanineMethionine
GlycineSerine Threonine Tyrosine Cysteine
Glutamine Asparagine
Lysine
ArginineHistidine Aspartic acid Glutamic acid
Figure 1.1.2b Amino acids are classified according to the properties of their side-chains.
Single chain proteins generally range from 50 to 1000 amino acids in length. When describing protein structure, biologists distinguish prima-ry, secondary, tertiary, and quaternary levels of structure. A protein’s primary structure is the actual sequence of amino acids. The secondary structure refers to local bends, kinks and spirals along the chain. Ter-tiary structure refers to the shape of the entire polypeptide chain, and quaternary structure is used to describe proteins which consist of more than one polypeptide chain.
Figure 1.1.2c The levels of protein structure.
primary structure
secondary structure
tertiary structure
quaternary structure
sidechain
A protein’s state of ionization depends on the nature of its amino acids and the chemical environment. In neutral, aqueous solution (pH = 7), a protein with a preponderance of basic amino acids, lysine, arginine, or histidine, will have an overall positive charge. Conversely, a protein with many acidic amino acids, glutamic acid or aspartic acid, will have an overall negative charge in neutral solution.
Figure 1.1.2d A protein with many basic side chains will have a positive charge at physiological pH.
Figure 1.1.2e A protein with many acidic side chains will have a negative charge at physiological pH.
Because the state of ionization depends on the pH of the environment, almost all proteins placed in a basic environment will accrue a negative charge, losing hydrogen ions as a function of acid/base equilibrium. A protein placed in an acidic environment will tend to become positively charged. Nondenaturing protein electrophoresis is generally carried out in a weakly basic environment. In this environment, most proteins will become negatively charged and migrate towards the positive plate. Denaturing protein electrophoresis, in the presence of sodium dodecyl sulfate (SDS), also causes proteins to obtain a negative charge through emulsification by negatively charged dodecyl sulfate ions (see section 1.4.4, surfactants).
Figure 1.1.2f Emulsification by sodium dodecyl sulfate gives proteins a net negative charge. Different proteins in the same SDS solution are imparted with approximately the same charge to mass ratio, an advantage of SDS-PAGE elec-trophoresis.
The pH where a protein is electrically neutral overall is a function of the type and number of the protein’s ionizable groups. At this pH, called the isoelectric point (pI) of the protein, it will not migrate in an electric field. Because the distribution of ionizable groups is different among proteins, they differ in their isoelectric points. This difference is a powerful tool for electrophoretic separation, used in isoelectric focusing (see section 3.3.1).
Isoelectric Point
Figure 1.1.2g A protein’s state of ionization is determined by the nature of its side chains and the pH of the solution environment. At the pH that is its isoelectric point, a protein has equal numbers of positive and negative charges and does not migrate in an electric field.
SDS Solution 20% EC-874 Saves time and provides more reproducibility than making up SDS solution in the lab. (pg. 33)
SDS 20% Solution or ULTRA-PURE Powder
SDS - ULTRA PURE EC-604 Guaranteed free of sulfates and colored contaminants. (pg. 29)

37USA: 1-800-526-3867EUROPE: 441 482 646022
Electrophoresis Applications - Fundamental Principles of ElectrophoresisElectrophoresis
Applications
1.2 The Mechanical and Electrical Dynamics of Gel ElectrophoresisThe term ‘electrophoresis’ refers simply to the movement of particles by an electric force. The first electrophoresis experiments were carried out on molecules in a conductive buffer solution, where the only force acting on the sample was the electric field. The vast majority of current laboratory techniques are performed in a matrix perfused by an aqueous solution of buffer salts. The addition of a matrix (or gel) stabilizes the system against solution turbulence, and extends the range of geometries available to the user. The primary purpose of the matrix, however, is to introduce a sieving action which allows separations based on molecular size.
1.2.1 Sample MobilityWithin an electrophoresis gel, a protein or nucleic acid molecule experi-ences electric force proportional to its effective charge, Q, and the electric field strength, E . The biomolecule will move with a constant velocity because the electric force on the molecule is met by an opposite force due to the frictional resistance, f, of the matrix.
If electrophoresis occurred in free solution, rather than within a gel, the force of frictional resistance, f, upon biomolecules would follow Stokes’ law:
f = 6πrυη
where r is the radius of the particle moving with velocity υ through a me-dium of viscosity η. The electromotive force on a molecule, proportional to its charge, is thus opposed by the frictional force f , proportional to its mass. Mobility in free solution would then be the same for molecules of the same charge to mass ratio. Stokes’ law, however, is not sufficient to describe the frictional force within a gel matrix. In addition to the viscos-ity of the medium, also determining frictional resistance are the density and effective “pore size” of the matrix. The result of this combination of factors is that among molecules of the same charge to mass ratio, larger molecules move more slowly in gel electrophoresis and electrophoretic separation occurs by size. In techniques such as denaturing DNA or RNA electrophoresis or SDS-PAGE protein electrophoresis, conditions are maintained so that the charge to mass ratio is virtually equal among sample molecules and separation occurs in a predictable manner based on the size of the molecules.
Figure 1.2.1a The gel electrophoresis of samples having identical charge to mass ratios results in fractionation by size. Although experiencing greater electric force because of their greater charge, the larger molecules reach force equilibrium with the opposing frictional resistance at a slower speed, thus their lower electrophoretic mobility.
v
v
v
effect on the migration of sample molecules. Higher ionic strength in the solution reduces the effective charge of the sample molecules. There-fore, low ionic strength solutions generally correspond to high rates of migration. Electrophoresis in higher ionic strength solutions generally gives slower rates of migration but produces sharper bands. A problem occurs, however, with high ionic strength buffers, when excessive power generation causes the gel temperature to increase. This temperature increase leads to a decrease in the viscosity of the medium, which then leads to increased current and further heating. Buffer evaporation, sample denaturation, and convective mixing are typical problems which can result in this scenario.
1.2.2 Electrophoresis System DynamicsThe apparatus in gel electrophoresis constitutes an electrical/thermody-namic system. The apparatus receives energy from the power source and releases energy as heat. The figure below shows a stylized repre-sentation of a typical vertical slab gel apparatus. The gel, perfused with buffer solution and held between two glass plates, has been clamped in position, its upper end is immersed in the buffer solution of the upper electrode chamber. The lower end of the gel is immersed in the lower electrode chamber, which contains buffer solution as well.
Figure 1.2.2a A gel electrophoresis apparatus is essentially a resistor (the gel) connected to a voltage source, creating a simple DC circuit. The voltage drop across the gel provides the motive force which drives the buffer and sample ions through the gel.
After samples are introduced into the sample wells at the top of the matrix, the electric field between the electrode chambers causes them to migrate toward the lower chamber. The electrophoresis apparatus can be viewed as a simple DC circuit composed of one voltage source and three resistors in series, the resistors being the upper chamber, the gel, and the lower chamber. Because the cross-section of each electrode chamber is much greater than the cross-section of the gel slab, and because the chambers are shorter in length as well, the vast majority of the resistance in the circuit derives from the gel slab. For this reason it is sufficient to consider the gel slab as the only resistor in the circuit, where the vast majority of power is expended. An exception to this rule occurs if buffer salts are inadvertently absent from one or both of the electrode chambers.
Ohm’s Law Relates the Electrical ParametersOhm’s law describes the relationship between the voltage, V, the current, I, and the resistance, R, in a DC circuit. A greater voltage produces a greater proportional current through a given resistor:
V = I R
A variation of Ohm’s law describes how small changes in electrical current can produce large changes in the expenditure of power, P:
P = I V = I 2 R
Two additional factors determining sample mobility are the ionic strength of the surrounding solution and the temperature of the gel. To maintain physiological pH and control the net charge on biological molecules in electrophoresis, the solution perfusing the gel matrix contains buffer ions. The ionic strength of this buffer will have a strong

38 USA: 1-800-526-3867EUROPE: 441 482 646022
Electrophoresis Applications - Fundamental Principles of ElectrophoresisEl
ectr
opho
resi
sA
pplic
atio
ns
Although the electrical current through the gel consists of both migrat-ing buffer ions and sample molecules, the vast majority of the current is represented by the buffer ions. As voltage is applied, the cations in solution migrate toward the negative electrode in the upper chamber, and the anions (and negatively charged sample molecules) migrate toward the positive electrode in the lower chamber.
Several factors must be in balance for gel electrophoresis to proceed toward good results. Of major concern is the management of the heat generated by current flow. While small buffer ions, for example, might be more effective in preventing interactions among sample molecules, very mobile ions create a much more conductive buffer. Excessive current flow will be accompanied by excessive heat generation, which can cause convection currents, solution evaporation, or in the case of agarose electrophoresis the melting of the matrix itself. The management of heat is a major reason for the choice of bulky, organic ions, such as Tris base or glycine. (See section 14 for a more detailed treatment of electrophoresis buffers.)
Because temperature regulation is especially critical in both polyacryl-amide and agarose electrophoresis of DNA and RNA, this type of elec-trophoresis is most often carried out under conditions of constant power (or constant current with agarose electrophoresis, for historical reasons). In denaturing PAGE electrophoresis, a relatively high temperature must be established and maintained to prevent the renaturation of sample molecules, but the temperature cannot be allowed to get too high. Con-stant power conditions (or constant current) provide the most precise regulation of heat generation. A small variation in buffer concentration can be managed under conditions of constant power but would lead to a total failure under conditions of constant voltage.
Constant voltage conditions, however, are generally employed in the SDS-PAGE electrophoresis of proteins. Here, the generally smaller apparatus has less difficulty exchanging heat with the environment, and sample denaturation is not nearly as temperature sensitive. In this scenario, the advantages of directly controlling the field strength via constant voltage conditions outweigh those of directly controlling the power generation.
1.3 The MatrixIn gel electrophoresis the matrix forces sample components to separate by size, as they move through its porous structure. The matrix provides greater resistance to the movement of larger molecules. It also performs additional functions including the reduction of convection currents and the inhibition of sample diffusion, encouraging the separated compo-nents to remain as sharp, distinct bands. Furthermore, the matrix serves as a solid medium upon which samples can be fixed and detected in post-electrophoretic analysis.
A suitable matrix should be chemically inert during electrophoresis. It should be easy to prepare and to modify. Two materials, polyacrylamide and agarose, have proven themselves to satisfy these requirements very well, performing all the above functions, each having advantages within a specific set of applications.
1.3.1 The Polyacrylamide MatrixPolyacrylamide gels are formed by the polymerization of acrylamide in aqueous solution in the presence of small amounts of a bifunctional crosslinker. The crosslinker is usually methylenebisacrylamide (bis, or MBA). The copolymerization of acrylamide with methylenebisacryl-amide produces a mesh-like network in three dimensions, consisting of acrylamide chains with interconnections formed from the methylenebi-sacrylamide. A variety of crosslinkers are available in addition to bis. These include piperazine diacrylate (PDA), N,N’-bisacrylylcystamine
(BAC), and N,N’-diallyltartardiamide (DATD). PDA is used to reduce silver stain backgrounds in SDS-PAGE gels. BAC and DATD are both disruptable cross-linkers which enable gels to be solubilized.
Acrylamide N,N´- methylenebisacrylamide
TEMED
Ammonium Persulfate
The Polyacrylamide MatrixFigure 1.3.1a The polymerization of a polyacrylamide matrix with methylenebi-sacrylamide cross-linking.
For discussions of the composition of polyacrylamide gels, a standard nomenclature has been widely adopted. In this nomenclature, T rep-resents the total percentage concentration (w/v) of monomer (acrylamide plus crosslinker) in the gel. The term C refers to the percentage of the total monomer represented by the crosslinker. For example, an 8%, 19:1 (acrylamide:bisacrylamide) gel would have a T value of 8% and a C value of 5%.
Upon the introduction of catalyst, the polymerization of acrylamide and methylene bisacrylamide proceeds via a free-radical mechanism. The most common system of catalytic initiation involves the production of free radicals by ammonium persulfate in the presence of the tertiary aliphatic amine N,N,N’,N’-tetramethylethylenediamine (TEMED). Another catalytic system involves the generation of free radicals via a photochemical process using a very small amount of riboflavin in the presence of TEMED. In both catalytic systems, the presence of excess oxygen will inhibit the polymerization elongation process and can lead to shorter average chain length. For this reason, if the casting solution has been excessively agitated, deaeration under vacuum with a magnetic stirrer is suggested prior to addition of initiators.
For certain applications, polyacrylamide has definite advantages com-pared to agarose. In an agarose gel, the pore size is large, so molecular sieving, i.e. separation by size, will not occur for smaller DNA fragments and most proteins. Additionally, by altering the total concentration of monomer in the gel and the ratio of acrylamide to bis, the pore size with a polyacrylamide gel can be altered in a reproducible manner. The small and reproducible pore size in polyacrylamide gels results in superior resolution: a 0.1% difference in size (1 base difference in a 1kb molecule) can be detected. Also, because acrylamide and bis are synthetic chemicals, there are virtually no batch to batch differences (It should be mentioned that batch to batch differences with agarose are overcome with the highest quality agaroses, such as National Diagnos-tics’ AquaPor agaroses).
Control of the pore size of a polyacrylamide gel is accomplished by changing the T and C values. With increasing T, the pore size decreases in a nearly linear relationship. Higher percentage gels (higher T), with smaller pores, are used to separate smaller molecules. The relationship

39USA: 1-800-526-3867EUROPE: 441 482 646022
Electrophoresis Applications - Fundamental Principles of ElectrophoresisElectrophoresis
Applications
of C to pore size is more complex. Generally, the minimum pore size occurs when C is about 5% (a 19:1 gel). Decreasing C results in a more open pore structure because there are fewer crosslinker molecules. In-creasing C beyond 5% also increases the pore size. This appears to be because of nonhomogeneous bundling of strands in the gel.
Researchers have settled on C values of 5.0% (19:1 acrylamide/bis) for most forms of denaturing DNA and RNA electrophoresis and 3.3% (29:1) for most native DNA and RNA gels. For SDS-PAGE electrophoresis of proteins, the standard C value that has been adopted is 2.6% (37.5:1). The table below gives recommended acrylamide/bis ratios and gel percentages for different molecular size ranges.
Table 1.3.1a Matrix formulations for various applications.
Acrylamide:M-BA
Ratio Gel %
NativeDNA/RNA
(bp)Protein
(kd)
19:1
“
“
“
“
29:1
“
“
“
“
“
37.5:1
“
“
“
4
6
8
10
12
5
6
8
10
12
20
6
8
10
12
100-1500
60-600
40-500
30-300
20-150
200-2000
80-800
60-400
50-300
40-200
<40
.
.
.
.
100-200
40-150
20-100
15-70
8-60
>150
50-200
30-125
20-100
10-70
<30
60-200
50-150
25-100
15-80
DenaturedDNA/RNA
(bp)
70-500
40-400
20-200
15-150
10-100
70-800
50-500
30-300
20-200
15-125
<40
.
.
.
.
Polyacrylamide Gel ApplicationsRecommended applications for each formulation are shown in bold
ProtoGel EC-89030% solution of Acrylamide and BisAcrylamide, 37.5:1 ratio. Filtered, Deionized, and Stabilized. (pg. 8)
AccuGel 19:1 EC-85040% solution of Acrylamide and BisAcrylamide, 19:1 ratio. Filtered, Deionized, and Stabilized. (pg. 15)
AccuGel 29:1 EC-85240% solution of Acrylamide and BisAcrylamide, 29:1 ratio. Filtered, Deionized, and Stabilized. (pg. 10)
AcrylaGel EC-810 30% stock solution of Acrylamide. Eliminates the need for handling toxic Acrylamide powder. (pg. 11)
Bis-AcrylaGel EC-820 2% stock solution of Bisacrylamide, molecular biology grade. Filtered, Deionized, and Sta-bilized. (pg. 11)
Ready-to-Use Acrylamide Products and Catalytic Initiators
UreaGel-6 EC-836 Convenient system for casting 19:1 6% dena-turing gels with Acrylamide, Bis, TEMED, TBE and urea. (pg. 12)
UreaGel Sequencing Sys. EC-833 Three bottle system to conveniently formulate 19:1 acrylamide/bisacrylamide sequencing gels, up to 20%. (pg. 13)
TEMED EC-503 Our TEMED is distilled twice to remove all inhibitory and fluorescent compounds. (pg. 33)
Ammonium Persulfate EC-504 >98% pure molecular biology grade. Low absorbed water for consistent polymerization. (pg. 32)
1.3.2 The Agarose MatrixA natural colloid extracted from seaweed, agarose is a linear poly-saccharide made up of the repeating unit agarobiose, which consists of alternating units of 1,3-linked β-D-galactopyranose and 1,4-linked 3,6-anhydro-α-L-galactopyranose. Gels prepared from agarose have a substantially larger pore size than polyacrylamide gels. Agarose gels can be prepared faster than polyacrylamide but have lower resolution, especially for smaller molecules. For this reason, agarose gels have limited application for the electrophoresis of small nucleic acid frag-ments and most proteins. However, for the electrophoretic separation of larger nucleic acid molecules (>400 bp), agarose presents an excellent choice. It is easier to handle and safer to prepare than polyacrylamide.
A potentially significant problem in agarose electrophoresis is electro-endosmosis (EEO). Electroendosmosis in electrophoresis refers to the flow of water under the influence of an electric field due to immobilized charge groups on the matrix, primarily sulfate and carboxyl groups. While the sulfate and carboxyl groups cannot migrate, their counter ions do migrate, moving toward the cathode, causing a net flow of water through osmosis in that direction. In the past, this problem often led to badly smeared bands. Fortunately, purification methods have been developed which nearly eliminate this problem in modern agarose electrophoresis. The use of a high quality electrophoresis grade agarose, such as a member of National Diagnostics’ AquaPor agarose family of products, will prevent electroendosmosis effects. Through the careful modulation of polymer length and helical parameters, the varieties of National Diagnostics’ agaroses are manufactured to display the charac-teristics suited for different electrophoresis applications.
Agarobiose
Figure 1.3.2a Agarobiose is the basic unit of the agarose polymer.
Figure 2.4.2a Restriction mapping involves treatment of a DNA fragment with restriction enzymes both singly and in combination. The electrophoresis of cleavage products yields a map of the DNA in terms of restriction sites.AquaPor LE EC-202 High quality, general purpose agarose ideal for most routine applications. Low EEO. DNase & RNase free. Unique low boil-over formulation. (pg. 16)
AquaPor LM EC-204 Low melting agarose. Certified for in-gel ligation and PCR. DNase & RNase free. Highest gel strength available in a low-melting agarose. (pg. 16)
AquaPor ES EC-203 AquaPor ES is a premium, ultra high strength, ultra low EEO agarose. Ideal for Pulsed Field Gel Electrophoresis (PFGE). (pg. 17)
National Diagnostics AquaPor Agarose
AquaPor 3:1 EC-206 Fine resolution of small DNA fragments. Yields strong gels with low UV background. Low viscosity makes pouring high% gels much easier. (pg. 17)
AquaPor HR EC-205 AquaPor HR combines high resolution with low melting. Resolves DNA down to 2% size difference (or 4 bp below 200 bp). DNase & RNase free. (pg. 17)

40 USA: 1-800-526-3867EUROPE: 441 482 646022
Electrophoresis Applications - Fundamental Principles of ElectrophoresisEl
ectr
opho
resi
sA
pplic
atio
ns
1.4 BuffersIn its simplest form, a buffered solution contains a mixture of a weak acid and its conjugate base.
The position of acid/base equilibrium is represented by the acid disso-ciation constant, Ka. This number is large if the acid is stronger and equilibrium tends toward dissociation. It is small for an equilibrium that tends toward proton capture. Buffers used in life science tend to range from 10-4 to 10-10 in their Ka values.
Ka is usually expressed as its negative logarithm, pKa:
A buffer with a Ka of 10-2 has a pKa of 2, favoring dissociation. A buffer with a Ka of 10-12 has a pKa of 12, favoring proton capture.
After a few math operations the expression for the dissociation quotient assumes a very useful form, the Henderson-Hasselbalch equation:
The formula states that the pH of a buffered solution will differ from the buffer’s pKa by an amount which is determined by the ratio of the base to the acid forms in solution. If these concentrations are equal then the pH = pKa. If the concentration of the base form is greater than the acid then the pH > pKa. If the concentration of acid form is greater than the base then pH < pKa.
A buffer maintains nearly constant pH by absorbing protons released by other sources in solution or releasing protons if another species is depleting them. For example, a small amount of strong acid introduced to pure water causes the pH to plummet five or six points. However, if that same amount of strong acid is introduced to a concentrated buffer solution, it merely causes the change of some of the buffer’s weak base form to the weak acid form. By the Henderson Hasselbalch equation, to drop the pH of the solution a full point below the pKa, enough base would have to be consumed for the concentration of the acid form to become ten times greater than the base. If the buffer is sufficiently concentrated, the small amount of strong acid in this example would barely alter the pH. In electrophoresis, the buffer is able to maintain a relatively constant pH as long as either the acid or the base do not become exhausted.
The Henderson-Hasselbalch equation gives information in addition to how the pH is a function of the relative predominance of acid base forms of a buffer. For certain instances, it is useful to think of this equation the other way around. In predicting the state of ionization of minor solution components, for example, it can be useful to think of the relative predominance of various forms as a function of an externally determined pH. An instructive example might be a solution whose pH is maintained by a concentrated buffer. The degree of ionization of a minor component in this solution, such as a protein, would depend on the pH of its environment, determined by the buffer. Suppose an ionizable group upon a protein has a pKa of 11, an amine group, for example, which might be either the nonionized amine form (base) or the ammonium ion form (acid). If the solution is buffered to a stable pH of 8, the Henderson-Hasselbalch equation tells you that the ammo-nium ion form will predominate at a ratio of 1000 to 1. This concept is essential to understanding how buffers control the state of ionization
of sample molecules.
In addition to controlling the pH of the gel, which prevents damage to the sample molecules and controls the ionization state of the molecules, the buffer system also carries the majority of the current through the gel. For a homogeneous system like denaturing PAGE electrophoresis of DNA, in which the type and concentration of buffers in the tank and gel are the same, the buffer prevents wide swings in pH and controls the conductivity of the gel. For the native electrophoresis of proteins, the buffer pH has the added function of controlling the state of ioniza-tion of the samples. In this second case, even slight changes in pH can result in large effects on the relative mobility of sample components. In a multiphasic system, such as SDS-PAGE electrophoresis of proteins, where buffers in the tank and gel are different, the considerations of buffer design can take on an even greater level of complexity.
In all cases, the ionic strength of the buffer in the gel must be sufficient to keep the sample in solution and to provide sufficient buffering capac-ity. Higher concentrations of gel buffer will tend to slow the diffusion of samples, and result in sharper bands. The benefits of higher buffer concentrations must, however, be balanced against the fact that the more concentrated the buffer in the gel, the higher the electrical conductivity. With higher concentration, at a given voltage, the current will be greater and more heat will be generated. Because of the problems caused by excessive heating, high buffer concentrations must be accompanied by a low voltage gradient.
Several factors to consider when choosing a buffer include:
1) pKa value - A buffer should be chosen with a pKa that is very close to the desired pH, preferably within a half point. The buffer will have the greatest capacity both to absorb or release protons with the acid and the base form well represented in solution. It should be noted that pKa is not constant for all conditions but is a function of the total ionic strength and the temperature, so the stoichiometry should be modeled after actual running conditions. Amines are particularly susceptible to changes in pKa with temperature, because, with amines, there is no net increase in ions in solution with the dissociation of ammonium species, so there is little inherent entropy change due to changes in the ordering of water molecules in the solution. This leads to an increase in the significance of the entropy change due to heat flow (the ratio of enthalpy change to temperature) in determining the position of equilibrium.
Usually, in native protein electrophoresis, basic proteins are best sepa-rated at acid pH. However, the vast majority of proteins have isoelectric points below 7.5 and are best separated in slightly alkaline conditions, pH 8-9. This pH range has also proven efficacious for most forms of DNA electrophoresis. Thus, buffers with a pKa in the range of 7-9 are best suited for most electrophoretic applications.
2) Formal charges of buffer species - Generally, buffers which form ions of high charge magnitude (+2, +3, -3, etc.) are more difficult candi-dates with which to work. This type of buffer yields high ionic strength without providing high buffering capacity. At relatively low concen-trations, the gel conducts too much current. Furthermore, with ions moving quickly through the gel, the buffer may become depleted. One of the reasons tris-borate is a popular buffer for electrophoresis is that both tris base and borate are uncharged part of the time at the desired pH, which reduces their electrophoretic mobility. Reduced mobility of the buffer ions allows for high concentrations of the buffer solution to be employed with the consequent benefits to buffering capacity and sample stability without producing unacceptably high conductivity. It should be further mentioned that the relative electrophoretic mobility of buffer components is a major concern in the design of multiphasic systems, which are discussed in detail in a following section.
3) Molecular size - In addition to its low charge, Tris base moves slowly in electrophoresis because of its relatively large molecular size. Having a low charge to mass ratio, Tris moves much more slowly than
HA H+ + A-
Ka = [H+][A-][HA]
pKa = - log Ka
pH = pKa + log [basic form][acidic form]

41USA: 1-800-526-3867EUROPE: 441 482 646022
Electrophoresis Applications - Fundamental Principles of ElectrophoresisElectrophoresis
Applications
small ions such as chloride or phosphate. Buffer ions are not sieved by the matrix, so their migration rates are determined solely by their charge to mass ratio.
These three factors are by no means exhaustive. Other factors to consider when choosing a buffer would include toxicity, solubility, UV absorp-tion and the possibility of interaction with other species present in the solution. Among the most commonly used electrophoresis buffers are those shown in the table below:
Commonly Used Electrophoresis Buffers
Buffer Molecular Weight pKa ∆pKa/°C
Acetic Acid
Boric Acid
Citric Acid
Glycine
MOPS
Phosphoric Acid
Taurine
Tricine
Tris
60.05
61.83
192.1
75.07
209.26
98
125.1
179.18
121.1
4.8
9.23
6.4 (pK3)
9.8
7.2
7.2 (pK2)
9.1
8.15
8.06
-0.0002
-0.002
0
-0.03
-0.006
-0.003
-
-0.021
-0.028
Table 1.4a Characteristics of buffer salts used in electrophoresis.
1.4.1 HomogeneousBufferSystemsIn a homogeneous buffer system, the identity and concentration of buffer components are the same in the gel and the tanks. Most forms of DNA and RNA electrophoresis generally use homogeneous buffer systems. Electrophoresis of proteins is most often performed under multiphasic conditions, where tank and gel buffers differ.
In a homogeneous system the buffer performs the functions of protecting the samples and carrying the current. Problems most often arise with homogeneous systems if the ionic strength is for some reason different in the gel versus either of the tanks. Most often this occurs due to the inadvertent omission of a component, a mistake in stoichiometric calcu-lations, or precipitation in a stock solution (10X TBE is especially prone to this problem). One consequence of a concentration gradient between the tank and the gel, is a “salt wave” which migrates through the gel during electrophoresis. Accompanying this concentration gradient will be changes in the electrical parameters leading to localized distortions in the band pattern.
1.4.2 MultiphasicBufferSystemsEmploying gel and buffer discontinuities to produce sharp separation among sample components, multiphasic electrophoresis design can improve the resolution of electrophoresis (especially protein electro-phoresis). The system employs a separating gel in which the sample is fractionated, above which has been added a low percentage stacking gel. In the stacking gel, sample components are stacked into very thin, sharp zones prior to the final separation. To illustrate the principles of multiphasic systems, we shall examine the most prominent application of this type, the SDS-PAGE electrophoresis of proteins. Multiphasic SDS-PAGE protein electrophoresis is often referred to as the Laemmli system after the researcher who perfected the design. At the beginning of the experiment, the buffer compositions are different in the stacking gel, the separation gel, and the tank. The stacking gel contains a Tris-HCl buffer at pH 6.8. The separation gel contains a higher concentration Tris-HCl buffer at pH 8.8. The tanks contain Tris-glycine at pH 8.8.
As electrophoresis begins both Cl- and glycinate ions begin to migrate through the stacking gel. Because the pH is several points lower in the stacking gel than the pKa2 of glycine, the vast majority of glycine mol-ecules are zwitterionic at any moment and their mobility is very low. Because the mobility of the chloride ions is greater than the glycine, the chloride ions (leading ions) begin to migrate away from the glycine (trailing ions). The chloride ions don’t move far before they leave behind an area of unbalanced positive counter ions. A steep voltage gradient develops, the Kohlrausch discontinuity, which pulls the glycine along so that the chloride and glycine ions become successive fronts moving at the same speed. The ion fronts sweep through the sample molecules. Being intermediate in their mobility between chloride and glycine, the sample molecules are carried along becoming ‘stacked’ into very thin, distinct layers in order of electrophoretic mobility.
When the interface between the stacking and separation gels is reached by the moving boundary region, the pH changes abruptly (as well as the pore size). At the higher pH a much higher percentage of glycine will be in the ionized state, and its mobility will be increased commensurately. The mobility of sample molecules is decreased by the sieving of the new, higher percentage matrix. The glycine accelerates past the stacked layers of sample molecules and the process of unstacking in the separating gel begins. From this point on, the electrophoretic separation occurs under conditions of constant pH and voltage that are indistinguishable from homogeneous PAGE.
Figure 1.4.2a At t h e start of multiphasic SDS-PAGE protein electro-phoresis the anions are chloride (green) in the stacking and resolving gels and glycine (orange) in the tanks.
Figure 1.4.2c Electro-phoresis in the resolving gel is indistinguishable from ordinary homoge-neous buffer systems.
Figure 1.4.2b With the establishment of the Kohl-rausch boundary in the stacking gel, the proteins are stacked into a thin layer between the leading chlo-ride ions and the trailing glycine molecules.

42 USA: 1-800-526-3867EUROPE: 441 482 646022
Electrophoresis Applications - Fundamental Principles of ElectrophoresisEl
ectr
opho
resi
sA
pplic
atio
ns
1.4.3 IsotachophoresisIsotachophoresis is a method of electrophoresis which employs the basic principles of the stacking gel phase of multiphasic systems discussed in the preceding section. Employing nonsieving media, often low percent-age polyacrylamide, isotachophoresis in its simplest form can be thought of as a stacking gel alone, without the separation gel. The principles are the same. With applied electric field, like charged ions begin to separate by electrophoretic mobility. As the faster component begins to move away, a region of unbalanced counter-ions forms behind it. Associated with this region of unbalanced counter ions is a zone of higher voltage, a Kohlrausch discontinuity, which pulls the next fastest component along at the same speed. Although, technically, isotachophoresis separates samples by electrophoretic mobility, the layers of sample molecules move at the same speed.
While generally not achieving the resolution of other forms of electro-phoresis, isotachophoresis has been successfully employed for difficult samples, such as very small peptides, not amenable to traditional tech-niques. Isotachophoresis has also shown great promise for the analysis of complex mixtures of molecules of different classes.
1.4.4 BufferAdditivesIn most forms of electrophoresis the solution perfusing the gel matrix typically contains one or more substances in addition to the buffer salts. Serving the purpose of modifying the properties of sample molecules, these additives can be categorized as hydrogen bonding agents, surfac-tants, or reducing agents.
Hydrogen bonding agentsUrea or formamide can be introduced into electrophoresis samples prior to loading or into the gel buffer itself in order to cleave hydrogen bonds. These substances disrupt hydrogen bonds by occupying the bonding sites themselves. Hydrogen bonds are dipole-dipole attractions that occur between polar, hydrogen containing functional groups such as amine or hydroxyl groups. Hydrogen bonding has a major influence on the conformation and solubility of biological molecules. It is frequently necessary to include one or both of these substances to standardize sample conformation or to solubilize samples.
In denaturing DNA and RNA electrophoresis, formamide plus heat in the sample preparation stage followed by urea in the gel buffer are employed to disrupt the hydrogen bonding relationships central to base pairing. By substituting their own hydrogen bonding relationships with sample molecule functional groups, formamide and urea cause the separation of the complementary strands in double stranded DNA and RNA and, furthermore, disrupt the kinks and loops in single stranded species brought about by self-annealing. The resulting molecules are long and straight, and the influence of small differences in conformation on electrophoretic mobility is minimized. Because of the importance of this technique in electrophoresis, the terms ‘urea gel’ and ‘denaturing gel’ are often used interchangeably in the laboratory.
Urea can be employed in protein gels if the sample molecules are insol-uble or aggregated, although detergents can also be used. A downside to the use of urea with proteins can be the formation of cyanate ions which will react with some proteins, although Tris buffers will effectively protect the protein samples. If Tris buffers cannot be used, pre-running the gel for 30-40 minutes before adding samples or treating the urea with ion exchange resin before mixing the gel solution can also effectively solve this problem.
SurfactantsA crucial initial step in the electrophoretic separation of proteins is the solubilization of the sample molecules. This is especially true if there are extensive nonpolar interactions. Although urea in high concentration
was often employed in the past for this purpose, researchers now often have recourse to the use of nonionic, anionic, or cationic detergents.
Figure 1.4.4a SDS is the detergent most com-monly employed in protein electrophoresis.
Nonionic detergents, such as Tween-20 or Triton X-100, are generally less strongly denaturing than anionic or cationic detergents. Researchers use nonionic surfactants to preserve enzyme activity or some delicate immunological properties that anionic or cationic detergents would destroy. Generally, Tween-20 or Triton X-100 are added sparingly to the gel buffer (0.1%). These substances can also be employed in a 1% solution for the pretreatment of samples. A major drawback with non-ionic detergents is that, unlike charged surfactants, these detergents produce no consistent charge to mass ratio among sample molecules for electrophoresis. For this reason, the molecular weight of proteins cannot be directly determined by one electrophoretic run. In general, electrophoresis results are more difficult to interpret than results from electrophoresis that has been carried out in the presence of charged surfactants such as SDS (sodium dodecyl sulfate).
By far the most commonly employed detergent additive in protein electrophoresis is the anionic surfactant SDS (sodium dodecyl sulfate). Proteins under treatment with SDS become completely blanketed by negatively charged dodecyl sulfate anions, unwinding to assume an ex-tended conformation. The number of bound detergent molecules is quite large, approaching half the number of amino acid residues. As a result, the intrinsic charge of treated proteins becomes overwhelmed by the charge of the surfactant molecules, and even proteins of widely divergent structure have a virtually uniform charge to mass ratio. Electrophoresis of such samples results in strict separation by molecular weight. Protein electrophoresis using SDS is treated in depth in section 3.1.
Although rarely necessary, cationic surfactants such as CTAB, cetyltrime-thylammonium bromide, can be used for the electrophoresis of samples posing difficulties for SDS-PAGE. Such cases include the electropho-resis of either extremely acidic or extremely basic samples. Being very negatively charged, extremely acidic samples can exhibit poor binding with SDS. The problem with extremely basic samples is that addition of SDS can lead to precipitation. The use of CTAB as an alternative carries the same benefit of SDS in that a uniform charge to mass ratio among sample molecules is produced, although the apparatus will need to be adjusted to allow samples to migrate toward the negative pole rather than the positive pole.
Reducing AgentsDisulfide bonds between or within sample protein molecules can lead to the formation of aggregates as well as play a role in the binding of the subunits of many proteins. It is usually desirable to cleave disulfide linkages prior to the protein electrophoresis. For this reason, disulfide bond reducing agents, such as 2-mercaptoethanol or dithiothreitol, are typically present in sample buffers. These substances can also be added to the cathode tank. However, 2-mercaptoethanol or dithiothreitol are typically not added to the gel casting solution because their presence inhibits gelation.
2-Mercaptoethanol
Dithiothreitol
Figure 1.4.4b 2-Mercaptoethanol or Dithoiothreitol are often employed in protein sample buffers to cleave disulfide linkages.

43USA: 1-800-526-3867EUROPE: 441 482 646022
Electrophoresis Applications - Fundamental Principles of ElectrophoresisElectrophoresis
Applications
1.5 The Electrophoresis ApparatusA gel electrophoresis apparatus must allow the researcher to maintain a uniform electric field across the gel, provide cooling to prevent thermal artifacts, and allow access to the gel for sample loading and monitor-ing the run. Two types of apparatus are in common use: vertical and horizontal. Vertical gel systems are further subdivided into slab gels and tube gels. In general, agarose gels are run in the horizontal format, while acrylamide gels are run vertically.
1.5.1 The Horizontal Gel SystemIn its simplest form, a horizontal gel apparatus consists of a box which is divided into two compartments by a platform in the middle (Figure 1.5.1a). The gel is placed on this platform, and buffer is added until the gel is fully submerged. Electrodes in each compartment supply the electric field. The resulting current flows through both the gel and the buffer over the gel, so the thickness of these must be controlled for fully reproducible results. Cooling is provided by the buffer which surrounds the gel, and this buffer is often recirculated to prevent the development of a pH gradient and also to aid in temperature control. Access to the gel is through the overlaying buffer. Samples are loaded through this buffer layer, and the apparatus has a clear lid to allow the run to be monitored.
One major limitation of the horizontal apparatus is that, since the two compartments are connected by a layer of buffer, it is not possible to use discontinuous buffer systems. Another limitation is that the gels are cast in trays which are not covered. Because atmospheric oxygen has full access to the upper surface of the gel, acrylamide will not polymerize in this system. For agarose gels, the simplicity and ease of use of the horizontal system often make this system the best choice.
Casting a horizontal agarose gel(A complete protocol is provided in Section 2.4.1) Horizontal gels are cast in trays which have removable ends. The ends are installed (often the ends are simply adhesive tape), and the molten agarose solution is poured into the tray. A comb is inserted so that the teeth penetrate the gel to within 1-2mm of the bottom of the tray. The overall gel thickness is generally 0.5-1cm. The gel is allowed to cool, the comb is removed, and the gel is mounted in the apparatus.
Figure 1.5.1a The Horizontal Gel Electrophoresis Apparatus. The gel rests on a platform which divides the apparatus into two chambers. Note that the buffer level is higher than the surface of the gel, so the two buffer chambers are connected. Samples loaded into the wells will migrate toward the positive electrode.
Negativeelectrode
Positiveelectrode
GelSample wells
1.5.2 Vertical Gel Systems
Slab gelsA typical vertical apparatus used for sequencing is shown in Figure 1.5.2a. This system shows the components common to all vertical slab systems. The gel is cast between two glass plates, separated by spacers, typically <2mm thick. The gel is mounted in the system so that the top is in contact with the negative electrode chamber, and the bottom is in contact with the positive electrode chamber. Unlike the horizontal system, the only connection between the buffer chambers is through the
gel. This allows precise and reproducible control of the voltage gradi-ent. Because of the high resistance of the thin gel, the apparatus must have provisions for cooling. In the system shown, the front of the gel cassette is exposed to the air, while the back of the gel is held against a metal plate which dissipates heat rapidly. In some systems, the upper buffer chamber extends almost to the bottom of the gel, and the upper buffer is used for cooling. The relatively small amount of current carried through the gel means that buffer recirculation is generally not required.
Figure 1.5.1b shows a standard “mini”gel apparatus. Such gels, generally 10cm x 10cm or smaller, have become the standard for many applications, because of their ease of preparation and handling, and short run times. As with the “full size” system, the gels are cast between glass plates, but in the mini-gel system, the cassettes are mounted onto a “U” shaped frame, so that the cassettes themselves form the sides of the negative electrode chamber. This assembly is placed in a tank of buffer which contains the positive electrode. This means that the gels are effectively submerged in buffer during the run, providing optimal cooling.
In general, vertical slab gels are loaded through the top, under a layer of buffer. The gels are monitored during the run through the front glass plate. The fact that the body of the gel in these systems cannot be accessed until the end of the run can be an inconvenience, and some sample recovery techniques used on horizontal gels are not available for vertical gels.
Casting a vertical slab gelVertical gels are cast in a cassette made up of two glass plates separated by spacers which run along the sides of the plates. The bottom of the cassette is sealed by some temporary means (tape, agarose, or a gasket). The gel monomer solution is treated to initiate polymerization, and poured into the cassette. A comb is inserted into the top of the cassette to form the sample wells, and the gel is allowed sufficient time to po-lymerize. After polymerization, the bottom of the gel is unsealed, and the cassette is mounted in the apparatus.
Tube GelsTube gels were used frequently in the development of gel electropho-resis. Although they are still used for some applications (most notably for isoelectric focusing as part of 2D electrophoresis, Section 3.3.1), tube gels have been superseded by slab gels for most applications. Tube gels are cast (as the name implies) in glass tubes of 1-3mm diameter. The gels are run in a box which is divided into two chambers horizontally. The horizontal partition has gasketed mounting holes for the tube gels. The upper and lower chambers are filled with buffer, and current ap-plied. The principle limitation of this system is that only one sample can be loaded per gel.
Figure 1.5.2b The vertical mini-gel apparatus.
Negativeelectrodechamber
Gels
Positiveelectrodechamber Retaining
clip
Gel plates
S a m p l e wells
Figure 1.5.2a The Vertical Gel Electrophoresis Apparatus.
Sample wells
Gel plates
Gel
Positiveelectrodechamber
Cooling plate
Retaining clip
Negativeelectrodechamber

44 USA: 1-800-526-3867EUROPE: 441 482 646022
Electrophoresis Applications - Gel Electrophoresis of DNA and RNAEl
ectr
opho
resi
sA
pplic
atio
ns
DNA Electrophoresis...Straight Up or with a Twist
The separation of nucleic acids by gel electrophoresis is theoretically straightforward. In aqueous solution, DNA and RNA derive their charge from the phosphate groups that occur with each nucleotide in their backbone. This fundamental structure does not vary with changes in base sequence. For this reason, nucleic acids possess an effectively constant charge to mass ratio. As such, their relative rates
of migration in a sieving medium depend only upon molecular mass and conformational shape. In most cases, double stranded nucleic acids are rod shaped, and separation occurs on the basis of molecular mass alone, the exception being double stranded DNA with a mismatched base (or bases) leading to a bent rod conformation and altered electrophoretic mobility. In native conditions single stranded DNA or RNA folds into a variety of conformations, and such conformational differences can serve as the basis of electrophoretic separation as well. However, most electrophoresis of single stranded nucleic acids is performed under denaturing conditions, which disrupt the folded structure of these molecules, and lead to separation on the basis of molecular weight alone.
Electrophoresis of nucleic acids requires a gel matrix with a relatively open pore structure. Nucleic acids are generally larger than proteins. The RNA which codes an average sized protein (50,000 daltons or 450 amino acids) must contain 1350 nucleotides and possess a molecular weight of over 400,000 daltons. The gene for this protein, including introns, would extend into millions of daltons in size.
DNA or RNA molecules containing less than one thousand bases are best resolved on polyacrylamide gels because of the superior resolution of this medium. Polyacrylamide can separate fragments differing by a single base pair. The uniform, small pore sizes available in polyacrylamide gels allow for the resolution of bands which differ in size by as little as 0.1% (1 base in over 1000). By far the most common use of Polyacrylamide Gel Electrophoresis (PAGE) of nucleic acids has been the sequencing of DNA, in which single stranded DNA molecules are separated under denaturing conditions. PAGE is also widely used under native conditions, to analyze PCR products or restriction digest products under 1000 bases in length. For the larger fragments which will not enter a polyacrylamide matrix, agarose must be used. Agarose gels have the capacity to fractionate DNA or RNA molecules millions of bases in size.
While PAGE offers the advantages of fast runs, high resolution, and rapid staining of thin gels, as well as the thermal stability required by denaturing conditions, the utility of PAGE is limited in situations where large molecules must be run or samples must be recovered after electrophoresis. In these cases, agarose is the matrix of choice.
2 Gel Electrophoresis of DNA and RNA
2.1 DENATURING POLYACRYLAMIDE GEL ELECTROPHORESIS OF DNA AND RNA
Overview / Sample Preparation / Gel Preparation / Run Conditions / Molecular Weight Determination / Manual Sequencing / Automated Sequencers / DifferentialDisplay/GenomicAnalysis/RNAMapping / DNA-Protein Interactions
2.2 NATIVE POLYACRYLAMIDE GEL ELECTROPHORESIS OF DNA
Overview / Sample Preparation / Gel Preparation / PCR Analysis / Mobility Shift Assay / DNA-RNA PurificationfromPAGEGels
2.3 CONFORMATIONAL ANALYSIS Heteroduplex Analysis / SSCP Analysis
2.4 AGAROSE ELECTROPHORESIS OF DNA AND RNA
Overview / Preparation of Agarose Gels / Restriction Digest Mapping / DNA-RNA PurificationfromAgaroseGels/InGelEnzymeReactions / Pulsed Field & Field Inversion Gel Electrophoresis (PFGE & FIGE) / RNA Electrophoresis

45USA: 1-800-526-3867EUROPE: 441 482 646022
Electrophoresis Applications - Gel Electrophoresis of DNA and RNAElectrophoresis
Applications
2.1 Denaturing Polyacrylamide Gel Electrophoresis of DNA & RNA
The electrophoretic analysis of single stranded nucleic acids is complicat-ed by the secondary structures assumed by these molecules. Separation on the basis of molecular weight requires the inclusion of denaturing agents which unfold the DNA or RNA strands and remove the influence of shape on their mobility. Nucleic acids form structures stabilized by hydrogen bonds between bases. Denaturing requires disrupting these hydrogen bonds. The most commonly used DNA denaturants are urea and formamide. Each of these forms hydrogen bonds with the DNA bases, “saturating” H-bond sites and preventing the formation of inter-base bonds (Figure 2.1.a).
Both formamide and urea effectively lower the melting point of the DNA molecules, allowing the structures to fall apart at lower temperatures. Generally, concentrations of urea or formamide are chosen to give melting temperatures around 50 °C, and gels are run at that tempera-ture. RNA is often denatured with harsher agents, because RNA tends to form stronger structures. RNA denaturation is discussed in section 2.4.6 on RNA electrophoresis.
Figure 2.1a The denaturation of DNA by urea.
2.1.1 Sample PreparationDenaturing DNA samplesDNA samples for denaturing gel electrophoresis must be denatured prior to loading to avoid time dependent denaturation artifacts on the gel. This is usually carried out by diluting the sample into 95% formamide and heating to 95°C (see Protocol 2.1.5c on DNA sequencing for a formula for the loading buffer). Loading the proper amount of DNA is critical for good results. Too little DNA will not be detected, while overloading lanes leads to smearing of bands. Acrylamide gels have a relatively high sample capacity—up to 10 µg can be loaded per lane in many cases.
Determining sample concentrationThe concentration of DNA in the sample may be determined in several ways. The most straightforward is to make use of the absorbance at 260nm of the nucleotide bases. Pure DNA at a concentration of 50 µg/ml has an A260 of 1.0 (Concentration is linear with absorbance by Beer’s Law). The purity of the DNA may be checked at the same time: pure DNA has a ratio of A260/ A280 of 1.8. A lower ratio indicates protein con-tamination; a higher ratio indicates substantial RNA content. Lower concentrations of DNA may be assayed by taking advantage of the fact that the fluorescence of DNA/ethidium bromide complexes is propor-tional to the concentration of DNA in the sample. Levels of DNA as low as 10 ng can be quantified in a 10µl volume by diluting the DNA into buffer or water containing 0.5µg/ml ethidium bromide. CAUTION: ETHIDIUM BROMIDE IS A POWERFUL MUTAGEN. Comparing the fluorescence of serial dilutions of sample with the fluorescence of known standards allows the determination of the DNA concentration in the original sample.
2.1.2 Gel PreparationDenaturing gels for sequencing are poured between two glass plates separated by spacers. The spacers are typically no more than 0.2mm in thickness. The extreme thinness of the gel allows air bubbles to be trapped in the gel during pouring. Such bubbles are very hard if not impossible to remove. Because oxygen inhibits the polymerization process, even a small bubble can create a hole in the gel which is large enough to prevent the use of several lanes. Bubbles can be avoided by using scrupulously clean plates, by siliconizing one plate, and by vigilance during the casting process.
Protocol 2.1.2a
Denaturing Gel Preparation Using National Diagnostics’ UreaGel 6
1. Clean glass plates thoroughly. Use a laboratory detergent, and scrub with a gloved hand or a paper towel. Rinse thoroughly with tap water; observe the flow of water over the plate (Unclean areas often cause distortions in the flow). Wipe the plate with a glass cleaner and rinse thoroughly with distilled water. Rinse with ethanol and wipe dry.
2. Apply Glass Free™ to one glass plate to ensure the gel will release from one plate after electrophoresis. This also will reduce the tendency of the treated plate to trap air bubbles.
3. Assemble the cassette. Use the clamps provided with the apparatus, if available. If clamps are not provided, use binder clips, one every 20 cm along both edges. Place the cassette on a level surface which is shorter than the plates, so that the top and bottom of the gel extend beyond the surface. A thick book works well.
4. Add 80ml of UreaGel 6 Monomer Concentrate and 20ml UreaGel Com-plete Buffer to a thick-walled Erlenmeyer flask.
5. If desired the solution may be degassed for two minutes . Apply a vac-uum (an aspirator is sufficient) while stirring or shaking. Bring to room temperature before polymerization.
6. Add 800 µl FRESHLY PREPARED 10% Ammonium Persulfate , swirl gently to mix, and cast the gel. TO CAST: with the gel lying flat, pour gel solution into the gap between the short and long plates, along the entire width of the gel. Capillary action will draw the solution into the cassette. Pour solution steadily to keep the top gap filled, and tilt the cassette 10-20° to encourage flow toward the bottom. Tap the cassette with a rubber stopper rapidly to keep bubbles from being trapped. If the plates are clean, the solution will flow from top to bottom smoothly in a line across the cassette. When the solution has reached the end of the cassette, return the gel to a level position, and insert the comb, flat edge first. Allow the gel to polymerize one to two hours.
NOTE: After two hours of polymerization wrap each end of the gel cassette with clear plastic wrap. This is important to keep the ends of the gel from drying and to maintain sample well integrity. Appropriately wrapped gels may be stored for up to 48 hours at room temperature.
7. Mount the gel in the running apparatus. Fill the upper chamber with buffer and remove the gel comb. Replace the comb with the teeth facing the gel, and insert until the teeth just penetrate the gel (no deeper than 1mm). Fill the lower chamber.
8. Prerun the gel for 15-30 minutes before loading the samples, or as rec-ommended for the apparatus used. For small (35ml, 20X40X0.02cm) gels use 30-35 Watts. For large (70ml, 40X40X0.02cm) gels use 55-65 Watts. The gel temperature should be between 45-50°C.
UreaGel-6 EC-836 Convenient system for casting 19:1 6% dena-turing gels with Acrylamide, Bis, TEMED, TBE and urea. (pg. 12)
Ready-to-Use Gel System for 6% Denaturing Gels
TBE 10X EC-860 Formulated with 18 MegOhm water. 0.2 micron filtration. Costs the same as bench-made buffers. (pg. 20)

46 USA: 1-800-526-3867EUROPE: 441 482 646022
Electrophoresis Applications - Gel Electrophoresis of DNA and RNAEl
ectr
opho
resi
sA
pplic
atio
ns
2.1.3 Run Conditions
TemperatureThe most critical parameter in denaturing DNA-PAGE is gel tempera-ture. Highly concentrated urea (6-7M) is the most commonly used denaturant, but to be fully effective the temperature must be main-tained above 40°C. Denaturing PAGE gels are generally run with the temperature in the range of 45-60°C, which is maintained by running the gel at constant power (wattage), as opposed to constant voltage or current. Because power measures the energy transferred through the gel (Section 1.2.2) maintaining constant power provides constant heat output and thus a stable temperature. It is crucial that denaturing gels be pre-run for at least 30 minutes prior to loading to bring the gel up to operating temperature.
DenaturantsSome nucleic acid molecules are particularly difficult to denature. Se-quences with a high guanine and cytosine content have more hydrogen bonds than adenine and thymine rich sequences (Section 1.1.1) and require more vigorous denaturation. Sequences which can fold back on themselves (Section 1.1.1) are also difficult to denature fully, because the two complementary sequences are “tethered,” increasing the likelihood of their re-annealing after denaturing. Difficult samples such as these may require gel temperatures in the 60-80°C range, which can give fuzzy bands, distorted gels and may lead to cracked plates. Alternatively, formamide—a more active denaturant—may be included in the gel at concentrations up to 40%. This strategy is often used in DNA sequencing to alleviate “GC compressions”; regions of poor resolution caused by high GC content regions in the sample.
BufferAnother important consideration in running denaturing PAGE is buf-fer selection. Some buffers used in molecular biology, most notably Tris-acetate EDTA (TAE), are easily exhausted. This means that they lose buffering capacity during the run, resulting in pH shifts at the ends of the gel. Tris-borate EDTA (TBE) is the buffer of choice for denaturing PAGE of nucleic acids. It has a high buffering capacity and can be run at high voltage for hours without exhaustion. Its only drawbacks are that it can interfere with some DNA recovery protocols, and that it forms complexes with glycerol which can distort gel patterns. If glycerol is required as part of a sample preparation, Tris-taurine EDTA (TTE) buffer is recommended. TTE has buffering capabilities similar to TBE, but shows no artifacts in the presence of glycerol.
BufferGradientsGradients of buffer concentration can be employed to compress regions of the gel, thus providing more information per run. Fragment mobility is proportional to the logarithm of the molecular weight, so for 10 base fragments which differ by one base in length, the difference in mobility is 4%. For a one base difference at 100 bases, it is 0.3%, and at 500 bases, one base difference gives only a 0.03% difference. Thus, at the bottom of a 40cm gel, a one base difference in length will give band separations of 1-2cm, while 100 base fragments, having migrated 20cm, will separate from 101 base fragments by only 0.1cm. Clearly, compressing the pattern at the bottom of the gel, so as to allow longer runs without losing the smaller bands, will allow greater resolution of the larger fragments in the sample. This is accomplished by lowering the resistance across the lower portion of the gel which leads to a lessening of the voltage drop across this region. In the lower voltage gradient, bands will migrate more slowly. Small bands will thus migrate rapidly through the upper portion of the gel, and then slow down as they approach the end. This allows longer runs, which facilitates resolution of the larger bands on the gel.
The drop in resistance at the bottom of the gel can be accomplished by use of wedge spacers, which are wider at the bottom, increasing the cross sectional area of the gel. More often, however, a buffer gradient is used, with a higher conductivity buffer in the lower buffer chamber. (Protocols are given in Section 2.1.5, Protocol 2.1.5d, DNA sequencing)
Applications of Denaturing PAGE of DNA and RNA
2.1.4 Molecular Weight Determination
Molecular weight determination is the most basic use of denaturing polyacrylamide gel electrophoresis. Samples are run versus standards of known molecular weight, and a calibration curve of relative mobility (or distance migrated) versus the logarithm of the size is established. Size can be expressed as molecular weight or number of bases. It is important to bear in mind that sequences of identical length may vary in GC content, and therefore in weight. Additionally, strong base pairing, hairpins and other residual secondary structure may perturb the mobility of a given fragment. Accurate molecular weight determination is best undertaken using size standards which are derived from the same DNA as the sample such as overlapping PCR products, cleavage fragments or synthetic products.
2.1.5 Manual Sequencing
OverviewIn traditional gel-based sequencing, DNA sequences are determined by a two step process. In the first step the sample DNA is used, either directly or as a template, to generate sets of fragments. Each set contains multiple lengths of DNA, all of which end in one (or sometimes two) of the four nucleotide bases. These fragments are generally radiolabeled to facilitate detection. In the second step, the fragments are separated on a denaturing PAGE gel. Each band on the gel represents a position in the DNA sequence, and each position appears only in the fragment set which terminates in the correct base(s). Autoradiography is performed on the gel to visualize the bands. Figure 2.1.5a shows the generation of fragments by two methods, and the gel pattern which results from electrophoretic separation of these fragments.
Sanger Sequencing
Maxam and Gilbert Sequencing
Figure 2.1.5a The two methods of conducting sequencing analysis. The Maxam and Gilbert method employs a set of cleavage reactions to generate the necessary fragments while the Sanger method employs a polymerase.

47USA: 1-800-526-3867EUROPE: 441 482 646022
Electrophoresis Applications - Gel Electrophoresis of DNA and RNAElectrophoresis
Applications
Of the two methods used to generate the fragments for sequencing gel analysis, the Maxam & Gilbert chemical cleavage method was the first to be widely used. Although no longer predominating, Maxam & Gilbert sequencing possesses significant advantages in certain applications. The four sets of reactions involved in this method cleave the DNA at specific bases or base sets to produce four sets of fragments. No prior knowledge of the DNA sequence is required as the sample DNA is itself processed into fragments. Maxam & Gilbert chemistry is thus useful for analyzing fragments of completely unknown sequence and is essential for footprinting protocols (Section 2.1.9).
Sanger dideoxy terminator sequencing is more commonly used than the Maxam and Gilbert reactions. Although it requires prior knowledge of at least 15-20 bases of the sample sequence, it is far less laborious and more reliable, particularly for long substrate sequences. In this system, the sample DNA is used as a template for a DNA polymerase, typically a bacteriophage polymerase (T4 or T7). Four polymerase reactions are set up for each substrate, each containing enzyme, primer and sample DNA, along with dNTP’s. In addition, each reaction contains one of the four dideoxy NTP’s. Dideoxy nucleotides do not have a 3’ OH. They are linked to the growing DNA chain through their 5’ OH, and the chain stops there for lack of a 3’ OH to link to the next base. Each reaction contains one of the four bases as a dideoxy NTP, thus each reaction will contain only fragments which terminate at that base. Proper balance of the levels of DNA, primer, enzyme, ddNTP and dNTP allow reactions which can give readable sequence out to 1500 bases from the primer. In most dideoxy sequencing, 35S labeled dNTP(s) are included in the polymerase reactions to label the fragments produced. Alternatively, 33P dNTP’s, 32P labeled primers, or fluorescent labelling can be used.
Maxam & Gilbert SequencingThere are four chemical cleavage reactions at the core of the Maxam and Gilbert sequencing system. Figure 2.1.5c shows an example from these reactions, the reaction cleaving specifically at guanine. The other three reactions cleave at G+A, C+T, or C. Guanine and cytosine, therefore, give bands in two lanes, adenine and thymine in only one. An example of the gel pattern produced is presented in Figure 2.1.5b. The DNA to be sequenced must first be end labeled, at one end only. This is accomplished by kinase treatment with 32P ATP, which labels both ends, followed by restriction digestion and isolation of the two la-beled fragments (Protocol 2.1.10a). Alternatively, digestion of a plasmid containing a clone of the DNA of interest with an appropriate enzyme can yield a unique labeling site. Plasmid vectors containing the rare site for Tth111I, which leaves a single 5’ base overlap, have been generated for this purpose. Cleavage with Tth111I leaves a G at one end and a C at the other in these vectors. By filling in the gap with Klenow polymerase fragment in the presence of dGTP or dCTP, one end or the other can be labeled specifically. Labeled DNA is first precipitated to remove any salts which might interfere in the cleavage reactions. It is then modified, cleaved and run on a denaturing gel for analysis. NB: THE HYDRAZINE AND DMS USED IN THESE PROTOCOLS ARE TOXIC AND VOLATILE. KEEP TUBES SEALED AND WORK IN A HOOD.
Protocol 2.1.5a
Maxam and Gilbert Sequencing Reactions
1. Precipitate the substrate: To the 32P labeled DNA, add 0.1 vol. 3M sodium acetate and 1 vol. Isopropanol. Precipitate at -70°C for 10 minutes, and centrifuge at max RPM in a microcentrifuge for 5 minutes to collect the DNA. Wash the pellet twice with 1 ml cold 70% ethanol to remove all salt. Redissolve the DNA in 45 µl of sterile water. Count one microliter of the solution in scintillation cocktail to confirm >5x10³ cpm total counts.
2. Aliquot 10µl of the DNA solution into each of 4 tubes. Label the tubes C, G, C+T, G+A.
3. Reactions: C: Add 10µl 2.5M NaCl and mix well. Add 30µl of hydrazine (toxic!)
and incubate at 25°C for 7-9 minutes. G: Add 200µl of: 50mM sodium cacodylate, pH 8, 1mM EDTA. Mix
well and add 1µl dimethyl sulfate (DMS) (Toxic!) and incubate at 25°C for 4-5 minutes.
C+T: Add 10µl H2O and mix well. Add 30µl hydrazine and incubate at 25°C for 7-9 minutes.
G+A: Add 25µl of formic acid, mix well and incubate at 25°C for 4-5 minutes.
4. Stop the reactions:
Stop buffers: G reaction: Add 50µl of:1.5M sodium acetate pH 7, 1M mercaptoethanol,
100µg/ml tRNA. All other reactions: Add 200µl of 0.3M sodium acetate, pH 7, 0.1mM
EDTA, 25µg/ml tRNA.
Ethanol precipitation: Add 750µl of Ethanol, and transfer reactions to a -70°C bath for 5
minutes. Collect DNA by microcentrifugation for 5 minutes. Discard the supernatants as appropriate for DMS or hydrazine waste. Rinse the pellets twice with 70% ethanol. Redissolve the pellets in 300µl of water, add 30µl of 3M sodium acetate and 1ml of ethanol. Pellet DNA and wash twice with 70% ethanol. Allow the pellets to air dry.
5. Piperidine cleavage reactions: Resuspend pellets in 75µl of 10% piperidine, and transfer to screw top
tubes. It is essential that the tubes used for the piperidine reaction seal well in order to ensure that the reaction goes to completion. Incubate the tubes at 90°C for 30 minutes. Cool the tubes, centrifuge briefly to collect the condensate, and evaporate to dryness in a speedvac. Redissolve the pellet in 40µl of water and dry again. Repeat the rehydration and drying once more to ensure that all of the piperidine has been removed. The samples are now ready for denaturing PAGE. (Sections 2.1.2, 2.1.3, 2.1.5).
Figure 2.1.5b In a Maxam and Gilbert gel, the identity of guanine or cytosine in the sequence can be assigned most easily because two of the four reaction sets cleave at those bases alone. Adenine or thymine are slightly more difficult, being represent-ed by those bands in the G+A or C+T lanes which do not appear, respectively, in the G or C lanes.
Figure 2.1.5c Maxam and Gilbert DNA sequencing reaction specific for Guan-idine residues. The Guanine base is first modified with Dimethyl Sulfate (DMS), which makes the chain susceptible to cleavage by piperidine, destroying the Guan-idine residue and releasing a labeled fragment for electrophoresis.
DMS
Piperidine
G

48 USA: 1-800-526-3867EUROPE: 441 482 646022
Electrophoresis Applications - Gel Electrophoresis of DNA and RNAEl
ectr
opho
resi
sA
pplic
atio
ns
Protocol 2.1.5c
Dideoxy Sequencing (Taq Polymerase)
1. Anneal the primer:
Dissolve 0.5pmoles of M-13 substrate in 10µl of Taq buffer: 50mM Tris HCl, pH 9.0, 15mM MgCl2. Add 0.5pmole of primer in 1µl of water or TE buffer. Incubate at 65°C for 10 minutes, then allow to cool to room tem-perature over 30 minutes. This is most easily accomplished by placing the tube in a 100ml beaker of water at 65°C and allowing the beaker to cool on the benchtop.
2. Set up the termination reactions:
Aliquot 2.5µl of A,C,G and T termination mixtures into appropriately la-beled tubes. The termination mixtures contain 8µM of the dNTP targeted for termination, 800µM each the other 3 dNTP’s, and 0.1mM EDTA. In addition, each mixture contains one ddNTP, as follows:
A: 125µM ddATP C: 50µM ddCTP G: 20µM ddGTP T: 100µM ddTTP
3. Labeling reaction (initial primer extension):
Add 2µl of a mixture of 1.6µM each of all 4 dNTP’s, 1µl 10mCi/ml 35S-dATP, and 2 Units of Taq polymerase (diluted in Taq buffer to 2U/µl). Place in a 40-45°C water bath for 3-5 minutes. Do not start the reaction at 45°- this may denature some primer-template complexes.
4. Termination:
Add 3.5µl of labeling reaction to each termination tube. Mix well and incu-bate at 60°C for 5-10 minutes. Add 4µl of loading dye (95% Formamide, 20mM EDTA, 0.05% each Bromophenol Blue and Xylene Cyanole), and heat to 95°C for 2 minutes prior to loading on a denaturing PAGE gel.
Gel Electrophoresis for DNA SequencingDenaturing PAGE gels for DNA sequencing generally employ 6-8 M urea as denaturant and TBE as buffer system. They are poured as described in Section 2.1.2. After a 2 - 2.5 hour run, a 6% polyacrylamide sequenc-ing gel will give 200-250 bases of readable sequence starting at or close to the end of the primer. A number of variations, enhancements and improvements to the basic PAGE gel have been developed to increase the number of bases which can be read from one gel.
The pattern of sample loading can be important. The best method is to load in a pattern such as GATCGTAC, in which each reaction is loaded twice, and each reaction borders on every other reaction once. At the top of the gel, where bands are compressed, this allows unambiguous assignment of order and thus base position. Loading in this pattern can extend readability by up to 50 bases, while at the same time diminishing errors in reading throughout the sequence.
Significantly more sequence information can be derived from a set of reactions by “double loading”. Portions of the samples are loaded into half the wells in the gel, and the gel is run for 1-2 hours. The power is turned off, and the remaining portions of the samples are loaded into the remaining lanes. Running the gel for 1-2 more hours gives runs of 2 and 4 hours, which will allow sequence to be read from the primer out to 350-400 bases.
The use of a wedge gel or a buffer gradient system can extend read length by up to 30%. Wedge gels, cast with spacers wider at the bottom of the gel, work well but are inconvenient to dry. Buffer gradient gels are more difficult to pour, but easier to handle after the run. Both options work by decreasing the electrical resistance in the bottom portion of the gel. Wedge gels have a wider cross sectional area at the bottom, while buffer gradient gels have a higher salt content in that area. The decreased resistance causes the voltage drop across the lower portion of the gel to be diminished. The DNA molecules in this region are subjected to less
Sequencing - Sanger MethodIn Sanger dideoxy terminator sequencing, the sample DNA is used as a template for a DNA polymerase. Four polymerase reactions are carried out involving enzyme, primer and sample DNA, along with dNTP’s. Each reaction also contains one of the four dideoxy NTP’s. When a dideoxy NTP is added, chain lengthening terminates because ddNTP nucleotides lack 3’ hydroxyl groups by which to form the next phosphodiester bond. Each reaction contains one of the four bases as a dideoxy NTP, thus each reaction results in fragments terminating at that base. The four reactions produce four collections of fragments with lengths reflecting the sequence positions of each of the four respective bases. Numerous commercial kits are available for Sanger sequencing. These kits provide excellent and consistent results without the need for the researcher to titrate dideoxy mixtures for maximum efficiency. An outline of the method is presented here. However, it is strongly recommended that the user follow the protocol provided with their particular kit.
For optimum performance, dideoxy sequencing requires a single strand-ed substrate. The most prevalent artifact associated with dideoxy se-quencing is the appearance of BAFL’s (Bands Across Four Lanes), which are due to polymerase “pause” sites, at which the enzyme tends to fall off of the DNA, resulting in a non-dideoxy termination. This effect is exaggerated when the polymerase is required to process double stranded DNA. Single stranded substrates are generally prepared by cloning the DNA of interest into vectors derived from the bacteriophage M-13. Phage M-13 replicates its DNA in the bacterium in double stranded form, allowing easy cloning manipulations, but its phage form contains circular single stranded DNA.
Protocol 2.1.5b
Purifying SS M-13 DNA
1. Precipitate the phage with Polyethylene Glycol (PEG):
Remove bacteria from 1.5 ml of culture by centrifuging at 12 - 14 K RPM in a microcentrifuge.
Transfer the supernatant to a fresh tube, containing 0.2 ml 2.5M NaCl + 20% PEG 8000 and mix well. Incubate 15 minutes at room temperature.
Pellet the phage particles in a microcentrifuge at 14K RPM 15 minutes at 4°C.
Remove supernatant with a pipette, being careful not to disturb the very small phage pellet.
Briefly centrifuge the tube to bring residual supernatant to the bottom and remove it with a pipette.
2. Purify the DNA:
Vortex the pellet in 50µl T10E1 buffer. Add 50µl phenol equilibrated with Tris pH 8.0. Vortex 30 seconds - 1 minute. Separate the phases in a microcentrifuge at 14K RPM for 2 minutes. Recover the upper phase, being careful not to disturb the interface layer.
(Note: leaving some of the supernatant over the phenol phase ensures a cleaner preparation.)
Add 300µl Ethanol and 15µl 3M sodium acetate, pH 5.2. Mix well and incubate at room temperature for 15 minutes.
Collect the DNA in a microcentrifuge at 14K RPM 20 minutes at 4°C. Remove the supernatant and wash the pellet twice with 70% ethanol. Proceed with primer annealing: 1.5 ml of culture should yield > 5µg of
DNA, sufficient for 1-2 sequencing reactions.
Figure 2.1.5d In Sanger sequencing four reactions are run, each designed to terminate the growing DNA chain at one of the four bases (the G reaction is shown in detail). The result is four col-lections of fragments whose comparative lengths indicate the positions of the four bases (the sequence) of the DNA under study.

49USA: 1-800-526-3867EUROPE: 441 482 646022
Electrophoresis Applications - Gel Electrophoresis of DNA and RNAElectrophoresis
Applications
force, so they slow down relative to bands in the upper portion of the gel. The net effect is to “compress” the bands as they migrate into the bottom of the gel, allowing longer runs and more readable sequence per gel. A similar, although less marked effect may be obtained simply by filling the upper chamber with 0.5X TBE, and the lower with 2X TBE. The pre-run gradient will not be as continuous as one poured into the gel, and some information may be lost at particularly steep points in the gradient.
Protocol 2.1.5d
Pouring a Buffer Gradient Denaturing Gel
1. Prepare 2 gel solutions, containing the desired concentration of Acryl-amide/Bis-Acrylamide and Urea. One solution should contain TBE at 0.5X, and one at 2.5X (containing 10% sucrose). Add Bromophenol Blue to the 2.5X TBE solution to 0.001% (just sufficient to give a visibly blue tint). The volume of each solution should be 75% of the amount needed to completely fill the gel cassette.
2. Add APS and TEMED to the two solutions to initiate polymerization.
3. In a 25ml pipette, draw up first 12.5 ml of 0.5X TBE gel solution, then 12.5ml of Blue 2.5X TBE gel solution, for a total of 25ml.
4. Draw 2 - 3 air bubbles through the pipette, to mix the two solutions at the interface.
5. Fill the cassette with the solution in the pipette. Fill the remainder of the cassette with the 0.5X TBE gel solution.
6. Allow to polymerize 2 hours, and run with 0.5X TBE in the upper buffer chamber, and 1X TBE in the lower chamber.
In some situations, the information read from a gel is of sufficient length, but insufficient quality. Substrates with a high G-C content will tend to retain enough secondary structure, even in 6M Urea at 55°C, to cause anomalous gel migrations. On the gel, this is observed as multiple bands in G or C lanes that are too close together for accurate reading. These regions are known as G-C compressions, and they can be very hard to resolve. Inclusion of a stronger denaturant in the gel alleviates most, if not all, GC compression problems. The denaturant of choice is forma-mide, which is strongly denaturing to DNA, uncharged, and easily mis-cible with high concentrations of urea in water. Gels with 6M urea and 40% formamide are typically formulated to resolve GC compressions. Formamide solutions must be made fresh, using deionized formamide.
Another source of difficulty in reading sequencing gels is the inclusion of glycerol in samples run on gels containing TBE. Glycerol, often used to stabilize the polymerase in the sequencing reactions, forms a complex with the borate in TBE. This creates a “salt wave” of altered conductivity, which migrates through the gel with the DNA, distorting a narrow range of DNA sizes. This problem is alleviated by using non-borate buffers, such as TTE, in gels used to run glycerol containing samples.
2.1.6 Automated SequencersAutomated sequencing systems make use of fluorescent dye labeling, in combination with laser scanning and computerized data acquisition and processing to carry out the electrophoresis of up to 96 sequencing reactions on a single gel, and read over 1,000 bases from each reaction. A single run on an automated sequencer can thus produce as much data as 40 manual gels.
Reactions for automated sequencing use the same Sanger dideoxy chemistry as manual sequencing systems. The key difference lies in how the fragments are labeled for later detection. Instead of radiola-beling, highly fluorescent dye molecules are linked either to the primer (dye-primer) or the dideoxy NTP’s (dye terminator). Excess dye is removed in a post-reaction cleanup step, and the products are separated on a denaturing polyacrylamide gel as used for manual sequencing. The gel is run while mounted on a detector, which constantly scans a laser across all lanes at the bottom of the gel. When a labeled band crosses this detection zone, its fluorescence is detected and recorded. The pattern of fluorescent flashes over time is interpreted into a DNA sequence using a computer.
One of the strengths of this system is that multiple colors of fluorescent dye are available (note that many of these dyes are fluorescent in the UV or IR regions, so the term “color” is used as a shorthand for “fluorescent at a different wavelength”. In general, a different color is used for each ddNTP reaction. As a result, all 4 reactions can be run on a single lane. Each band is identified with a position in the DNA by its elution time, and with a base by its color.
Although automated sequencing uses unique labeling and processing techniques, the electrophoretic separation at its core is essentially the same as that for manual sequencing. The key differences are in the much higher standard of purity required, and the focus on larger DNA fragments. Automated runs may take as long as 12 hours to complete. The gel must remain intact and unaltered during that time, at elevated temperatures. Additionally, the use of laser scanning means that ultra low levels of contaminant will show up as elevated background fluo-rescence. Also, gel results are processed according to parameters set in the computer software, which must be reproducible from gel to gel. All of this demands that the acrylamide, urea and buffers used be of exceptionally high purity.
For most automated sequencers, the best matrices are modifications of the traditional 19:1 manual sequencing gels. The need for modification arises because, while manual sequencing generally aims to read 400 bases at most from a reaction, automated sequencing in some machines allows over 1000 bases to be read. In these machines, a more open pore structure is required to allow the resolution of the larger fragments.
Figure 2.1.6a An automated DNA sequence produced on an ABI 377 equipped with 36 cm WTR plates running at 2X speed for 7 hours.
UreaGel-6 EC-836 Convenient system for casting 19:1 6% dena-turing gels. Contains acrylamide, bis, TEMED, TBE and urea. (pg. 12)
TBE 10X EC-860 Formulated with 18 MegOhm water. 0.2 micron filtration. Costs less than bench-top buffers. (pg. 20)
Products for Manual and Automated Sequencing
SequaGel XR EC-842 SequaGel XR gives the longest reads of any matrix on the Li-Cor 4000 and 4200 sequenc-ers. (pg. 14)

50 USA: 1-800-526-3867EUROPE: 441 482 646022
Electrophoresis Applications - Gel Electrophoresis of DNA and RNAEl
ectr
opho
resi
sA
pplic
atio
ns
2.1.7 DifferentialDisplayDifferential display is a powerful technique for detecting and quanti-tating changes in gene expression patterns between differently treated cells. Fragments of those genes which are induced or suppressed can be identified and isolated for further analysis, with no prior knowledge of the sequences involved. The technique is PCR based, and yields results in only 1 - 3 days.
Differential display is a variation of standard PCR, allowing the am-plification of a large population of fragments, rather than the specific amplification of one band. Specificity is reduced in two ways. First, random primers are used at one end of the amplification. A mixture of all possible hexamers (46=4096 primers) is used. This allows many different molecules to be amplified.
The second drop in specificity is provided by using the poly A tail present on the vast majority of RNA species. A poly dT primer is used to prime on this tail. The 3’ end of the poly dT primer has a pair of non T bases, which is sufficient to “anchor” the primer to the end of the coding sequence (Figure 2.1.7a). There are thus 32 = 9 different possible primers at this end.
Amplifications run with random hexamers and the poly dT primers on cDNA (that is, DNA copied from mRNA) taken from treated and untreated cells, gives a pattern of bands, each of which represents an amplified fragment of an expressed gene. A fragment which appears in one sample but not the other is either induced or suppressed by the treatment. Such bands may be cut out and re-amplified (using the same primer set as in the original reaction) for further analysis including sequencing, cloning, probe synthesis, etc.
Differential display is covered by patents owned by GenHunter. Gen-Hunter recommends the use of UreaGel-6 for differential display anal-ysis: GenHunter Corporation - 624 Grassmere Park Dr. - Nashville, TN 37211 - (800) 311-8260 - [email protected].
mRNA Pool
Reverse Transcription
Amplification
Figure 2.1.7a Differential dis-play is a PCR based technique that generates a characteristic set of DNA fragments from the messenger RNA pool within a cell. The use of random hexamers (brown) in combination with oligo-dT primers (blue) allows the amplification of a population of DNA species which changes with the composition of the starting RNA pool. Differential display is a powerful tool for the analysis of gene expression.
2.1.8 Genomic AnalysisDenaturing Polyacrylamide gel electrophoresis, coupled with variations of PCR amplification, provides a powerful set of tools for “fingerprint-ing” of genomic DNA. Two popular techniques are Random Amplifi-cation of Polymorphic DNA (RAPD), and Amplified Fragment Length Polymorphism (AFLP). In both of these techniques, nonspecific PCR is used to emphasize differences between genomic DNA samples.
RAPD, the more simple of the two techniques, uses PCR primers which are substantially shorter than the usual 17-21 bases. These short (8-12 base) primers will anneal to multiple sites on the DNA sample. When these annealing sites are within 1000 bases, and properly oriented (figure 2.1.8a), amplification occurs. Provided that the amplification conditions are well controlled, the population of fragments generated will reflect the source of the substrate DNA, and analysis on a denaturing poly-acrylamide gel will provide a fingerprint for that individual genotype.
AFLP, while more involved, has been shown in some cases to be more reliable and to generate more useful data than RAPD. These advantages arise because AFLP combines a more specific PCR system with restriction analysis, giving better control over the size and identity of the fragments generated. To carry out AFLP analysis, the researcher first digests the genomic DNA with two restriction enzymes. Generally, one “six-cutter” and one “four-cutter” are used, to generate a maximum number of opti-mally sized fragments. After digestion, 20-40 base adapters are ligated onto the ends of the digested fragments. These adapters allow the use of 17-20mer specific primers in the amplification step, which greatly enhances the reproducibility of the technique. The ligation reaction is then diluted and used as a substrate for PCR amplification.
The amplification step of AFLP uses primers which contain 14-18 bases designed to anneal to the ligated adapters. These primers also contain 2-4 additional bases at their 3’ ends. These additional bases must match the sequence of a ligated genomic restriction fragment if that fragment is to be amplified. The number of 3’ additional bases will thus help determine the number of fragments observed after AFLP amplification (longer extensions will find fewer matching fragments), and the choice of those bases will determine the pattern of fragments seen. Denaturing gel electrophoresis will provide a readily analyzed pattern of amplified fragments. Given that a library of primers is possible for any single set of adapters, a very specific fingerprint can be developed for any genomic sample.
SelectiveBases
Complementary
SelectiveBases Not
Complementary
AFLPPrimer
Adapter RestrictionSite
Amplification
No Amplification
Figure 2.1.8a AFLP is a dependable, robust means of genetic fingerprinting. Ge-notypic variations detected by this technique include the location of restriction sites and also polymorphisms adjacent to these restriction sites. The amplified fragments are electrophoresed on a denaturing PAGE gel to yield the AFLP fingerprint.

51USA: 1-800-526-3867EUROPE: 441 482 646022
Electrophoresis Applications - Gel Electrophoresis of DNA and RNAElectrophoresis
Applications
S1 mapping can also find intron sites (Figure 2.1.9b). In this case, the probe is derived from genomic DNA, and again labeled so that the labeled 3’ end falls within a coding portion of the gene. Any intron in this construct will not find a homologous region in the RNA, and will be cleaved by the S1 nuclease. In this case, the size of the labeled remainder reflects the distance from the label site to the splice site.
2.1.9 RNA MappingIn studies of transcriptional regulation, it is often necessary to determine the structure and/or amount of a given RNA species. Several techniques have been developed making use of the fact that some nucleases will only digest single stranded DNA or RNA. Duplexes are resistant to digestion. By hybridizing samples with labeled single stranded probes, the amount of probe complementary material in the sample mixture can be assayed, as well as the probe sequence involved. Such assays can be carried out on complex mixtures of RNAs, as the labeled probe will only hybridize to the target RNA sequence. The most common uses for these techniques are to find transcription start sites and splice sites, and to quantitate specific RNAs.
S1 Mapping Nuclease S1 will digest only ssDNA or ssRNA. If a duplex of DNA and/or RNA strands has single stranded overhangs or unhybridized internal loops, these will be digested away. The remaining intact nu-cleic acid fragments represent regions of identity between two strands of the duplex. If one of the strands is labeled at one end, the length of labeled fragment remaining after hybridization and nuclease digestion reflects the point on the probe where the two sequences diverge. This is the basis for S1 mapping of transcriptional start sites (Figure 2.1.9a). A probe is chosen that is complementary to the RNA, and extends past the anticipated start site. The 5’ end is 32P labeled, and chosen to fall within the coding region of the mRNA, so that it will be protected from digestion. After hybridization, the 3’ overhang of the probe is digested away, and the size of the remainder of the probe is accurately determined on a denaturing PAGE Gel. The distance between the known labeling site and the new end of the probe gives the transcriptional start site to within 1 base.
Protocol 2.1.9a
S-1 Mapping
NB: ALL REAGENTS AND GLASSWARE MUST BE RNase FREE OR DEPC TREATED.
1. Probe preparation:
S1 mapping requires a probe which is labeled at only one end. This can be accomplished in a number of ways, depending upon the available starting materials. Asymmetric restriction digestion of a cloned substrate can be manipulated to produce only one recessed 3’ end, which can be extended by Klenow fragment in the presence of labeled dNTP’s. Alter-natively, an end labeled oligonucleotide may be extended with Klenow fragment, and the duplex cleaved with a restriction enzyme to produce the required probe. However the probe is produced, it is generally purified on an alkaline agarose gel (Section 2.4.1). Use a 1.2% low-melting gel. Locate the labeled band by autoradiography (Section 4.1.2), excise and trim it with the aid of a Geiger counter to remove excess agarose.
Melt the excised band at 65°C, and add an equal volume of TE buffer. Add 10µg of tRNA, extract with 2x1volume of phenol (Tris equilibrated to pH 8). Ethanol precipitate the supernatant with 0.1 vol of 3M sodium acetate and 2 volumes of ethanol. Redissolve the pellet in 100µl of 0.3M sodium acetate.
2. Hybridization:
Add 1x10⁵ counts of labeled probe to 20-25µg of RNA at 4°C. Add suf-ficient 0.3M sodium acetate to bring the volume to 100µl. Add 300µl of ethanol, pellet and wash the precipitated DNA with 70% ethanol. Allow the pellet to air dry. Redissolve the pellet in 20µl of S1 buffer: 80% formamide, 40mM PIPES pH6.5, 400mM NaCl, 1mM EDTA. Heat to 65°C for 10 minutes and let stand overnight at room temperature.
3. S1 Nuclease Digestion:
Add 300µl of: 0.3M NaCl, 5mM ZnSO4, 50mM sodium acetate, pH 4.5; containing 300-500 Units of S1 nuclease and 6µg calf thymus DNA (denatured). Incubate at 30°C for 30-60 minutes. Stop the reaction with 100µl of: 4M ammonium acetate, 25mM EDTA, 40µg/ml tRNA. Add 1 ml ethanol, precipitate the DNA and redissolve in 5µl of TE. Analyze 4µl on a denaturing PAGE gel (Section 2.1.2).
Figure 2.1.9a S1 mapping of a transcription start site. The length of the labeled probe fragment remaining after digestion reflects the distance between the 5’ end of the probe and the 5’ end of the RNA (the start site). Lanes: 1) Experimental, 2) Probe control, 3) Sequence ladder.
Figure 2.1.9b S1 mapping of an intron site. The nuclease digests the unhybridized intronic DNA. The size of the labeled fragment remaining indicates the distance between the 5’ end of the probe and the intron position. Lanes as in figure 2.1.9a.
Labeled Probe
mRNA
S1 Digestion
Full Length Probe
Digested Probe
31 2
Labeled Probe
mRNA
S1 Digestion
Full Length Probe
Digested Probe
31 2
UreaGel-6 EC-836 Convenient system for casting 19:1 6% dena-turing gels. Contains acrylamide, bis, TEMED, TBE and urea. (pg. 12)
Ammonium Persulfate EC-504 Exceeds ACS Standards. Low absorbed water results in consistent initiating capabil-ities. (pg. 32)
TE Buffer (100X) EC-862 100X Concentrated solution of 1M Tris-HCl, pH 8, with 100mM EDTA. 0.2 micron filtration. (pg. 20)
Products for S1 Mapping
TBE 10X EC-860 Formulated with 18 MegOhm water. 0.2 micron filtration. Costs less than bench-top buffers. (pg. 20)
Tris - ULTRA PURE EC-406Purified to remove ammonia and amine contaminants. Specifications include >99.9% purity. (pg. 33)
EDTA - ULTRA PURE EC-610 Molecular biology grade EDTA. Specifications include low insolubles (<0.005%) and >99% purity. (pg. 32)
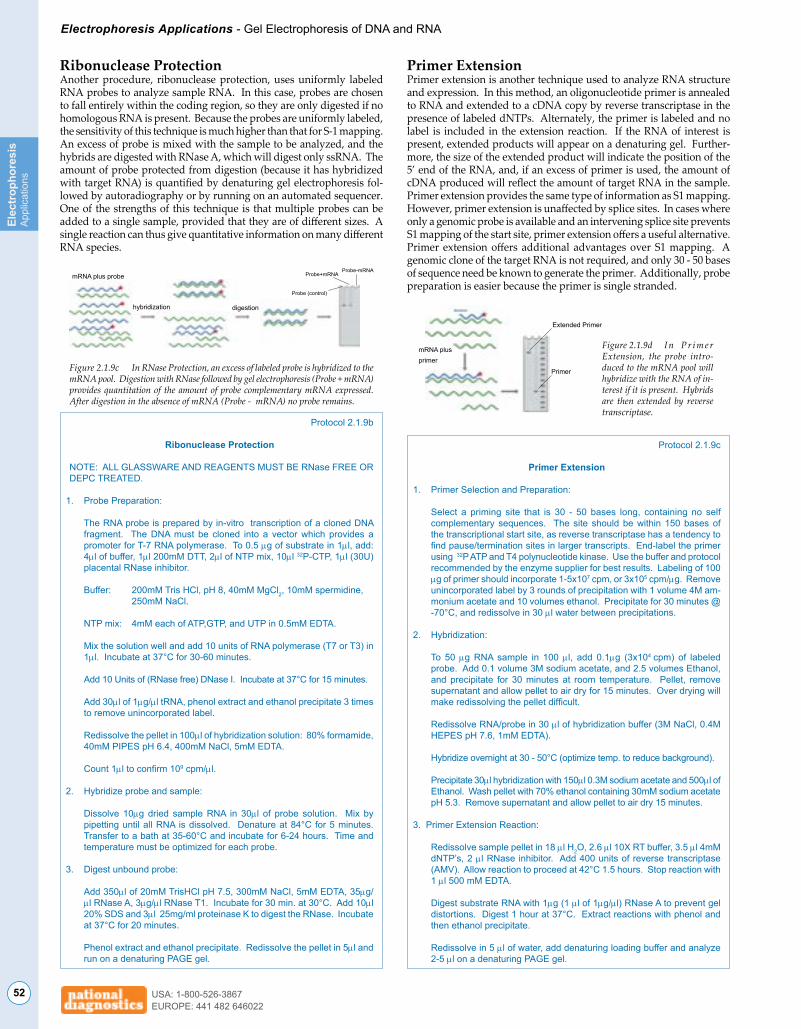
52 USA: 1-800-526-3867EUROPE: 441 482 646022
Electrophoresis Applications - Gel Electrophoresis of DNA and RNAEl
ectr
opho
resi
sA
pplic
atio
ns
Ribonuclease ProtectionAnother procedure, ribonuclease protection, uses uniformly labeled RNA probes to analyze sample RNA. In this case, probes are chosen to fall entirely within the coding region, so they are only digested if no homologous RNA is present. Because the probes are uniformly labeled, the sensitivity of this technique is much higher than that for S-1 mapping. An excess of probe is mixed with the sample to be analyzed, and the hybrids are digested with RNase A, which will digest only ssRNA. The amount of probe protected from digestion (because it has hybridized with target RNA) is quantified by denaturing gel electrophoresis fol-lowed by autoradiography or by running on an automated sequencer. One of the strengths of this technique is that multiple probes can be added to a single sample, provided that they are of different sizes. A single reaction can thus give quantitative information on many different RNA species.
Primer ExtensionPrimer extension is another technique used to analyze RNA structure and expression. In this method, an oligonucleotide primer is annealed to RNA and extended to a cDNA copy by reverse transcriptase in the presence of labeled dNTPs. Alternately, the primer is labeled and no label is included in the extension reaction. If the RNA of interest is present, extended products will appear on a denaturing gel. Further-more, the size of the extended product will indicate the position of the 5’ end of the RNA, and, if an excess of primer is used, the amount of cDNA produced will reflect the amount of target RNA in the sample. Primer extension provides the same type of information as S1 mapping. However, primer extension is unaffected by splice sites. In cases where only a genomic probe is available and an intervening splice site prevents S1 mapping of the start site, primer extension offers a useful alternative. Primer extension offers additional advantages over S1 mapping. A genomic clone of the target RNA is not required, and only 30 - 50 bases of sequence need be known to generate the primer. Additionally, probe preparation is easier because the primer is single stranded.
Protocol 2.1.9b
Ribonuclease Protection
NOTE: ALL GLASSWARE AND REAGENTS MUST BE RNase FREE OR DEPC TREATED.
1. Probe Preparation:
The RNA probe is prepared by in-vitro transcription of a cloned DNA fragment. The DNA must be cloned into a vector which provides a promoter for T-7 RNA polymerase. To 0.5 µg of substrate in 1µl, add: 4µl of buffer, 1µl 200mM DTT, 2µl of NTP mix, 10µl 32P-CTP, 1µl (30U) placental RNase inhibitor.
Buffer: 200mM Tris HCl, pH 8, 40mM MgCl2, 10mM spermidine, 250mM NaCl.
NTP mix: 4mM each of ATP,GTP, and UTP in 0.5mM EDTA.
Mix the solution well and add 10 units of RNA polymerase (T7 or T3) in 1µl. Incubate at 37°C for 30-60 minutes.
Add 10 Units of (RNase free) DNase I. Incubate at 37°C for 15 minutes.
Add 30µl of 1µg/µl tRNA, phenol extract and ethanol precipitate 3 times to remove unincorporated label.
Redissolve the pellet in 100µl of hybridization solution: 80% formamide, 40mM PIPES pH 6.4, 400mM NaCl, 5mM EDTA.
Count 1µl to confirm 109 cpm/µl.
2. Hybridize probe and sample:
Dissolve 10µg dried sample RNA in 30µl of probe solution. Mix by pipetting until all RNA is dissolved. Denature at 84°C for 5 minutes. Transfer to a bath at 35-60°C and incubate for 6-24 hours. Time and temperature must be optimized for each probe.
3. Digest unbound probe:
Add 350µl of 20mM TrisHCl pH 7.5, 300mM NaCl, 5mM EDTA, 35µg/µl RNase A, 3µg/µl RNase T1. Incubate for 30 min. at 30°C. Add 10µl 20% SDS and 3µl 25mg/ml proteinase K to digest the RNase. Incubate at 37°C for 20 minutes.
Phenol extract and ethanol precipitate. Redissolve the pellet in 5µl and run on a denaturing PAGE gel.
mRNA plus probe
hybridization digestion
Figure 2.1.9c In RNase Protection, an excess of labeled probe is hybridized to the mRNA pool. Digestion with RNase followed by gel electrophoresis (Probe + mRNA) provides quantitation of the amount of probe complementary mRNA expressed. After digestion in the absence of mRNA (Probe - mRNA) no probe remains.
Probe (control)
Probe-mRNAProbe+mRNA
Protocol 2.1.9c
Primer Extension
1. Primer Selection and Preparation:
Select a priming site that is 30 - 50 bases long, containing no self complementary sequences. The site should be within 150 bases of the transcriptional start site, as reverse transcriptase has a tendency to find pause/termination sites in larger transcripts. End-label the primer using 32P ATP and T4 polynucleotide kinase. Use the buffer and protocol recommended by the enzyme supplier for best results. Labeling of 100 µg of primer should incorporate 1-5x10⁷ cpm, or 3x10⁵ cpm/µg. Remove unincorporated label by 3 rounds of precipitation with 1 volume 4M am-monium acetate and 10 volumes ethanol. Precipitate for 30 minutes @ -70°C, and redissolve in 30 µl water between precipitations.
2. Hybridization: To 50 µg RNA sample in 100 µl, add 0.1µg (3x10⁴ cpm) of labeled
probe. Add 0.1 volume 3M sodium acetate, and 2.5 volumes Ethanol, and precipitate for 30 minutes at room temperature. Pellet, remove supernatant and allow pellet to air dry for 15 minutes. Over drying will make redissolving the pellet difficult.
Redissolve RNA/probe in 30 µl of hybridization buffer (3M NaCl, 0.4M HEPES pH 7.6, 1mM EDTA).
Hybridize overnight at 30 - 50°C (optimize temp. to reduce background).
Precipitate 30µl hybridization with 150µl 0.3M sodium acetate and 500µl of Ethanol. Wash pellet with 70% ethanol containing 30mM sodium acetate pH 5.3. Remove supernatant and allow pellet to air dry 15 minutes.
3. Primer Extension Reaction: Redissolve sample pellet in 18 µl H2O, 2.6 µl 10X RT buffer, 3.5 µl 4mM
dNTP’s, 2 µl RNase inhibitor. Add 400 units of reverse transcriptase (AMV). Allow reaction to proceed at 42°C 1.5 hours. Stop reaction with 1 µl 500 mM EDTA.
Digest substrate RNA with 1µg (1 µl of 1µg/µl) RNase A to prevent gel distortions. Digest 1 hour at 37°C. Extract reactions with phenol and then ethanol precipitate.
Redissolve in 5 µl of water, add denaturing loading buffer and analyze 2-5 µl on a denaturing PAGE gel.
mRNA plus primer
Extended Primer
Primer
Figure 2.1.9d I n P r i m e r Extension, the probe intro-duced to the mRNA pool will hybridize with the RNA of in-terest if it is present. Hybrids are then extended by reverse transcriptase.

53USA: 1-800-526-3867EUROPE: 441 482 646022
Electrophoresis Applications - Gel Electrophoresis of DNA and RNAElectrophoresis
Applications
2.1.10 Analysis of DNA/Protein InteractionsThe binding of proteins to specific DNA sites is an important mechanism of cellular regulation. Numerous techniques have been developed to analyze the interactions of regulatory proteins with DNA. Three tech-niques are presented below which analyze the site of protein binding on the DNA (“Footprint” Analysis).
A DNA binding protein will attach itself only to a specific, characteristic sequence on the DNA, and once bound, such a protein occludes the access by other proteins to the binding site. This regional protection is known as a protein’s “footprint.” The footprint of a particular bind-ing protein may be accurately determined by treating a DNA-protein complex with the enzyme DNase I at low concentrations. DNase I will introduce “nicks” (single strand cuts) in the double stranded DNA, everywhere but in the footprint region. If the DNA is end labeled with 32P, the labeled fragments produced will end at a range of sites which covers the entire starting DNA molecule, excluding the footprint area (Figure 2.1.10a). Separation of these fragments on a denaturing gel yields a ladder of fragments with a gap corresponding to the footprint site. A Maxam & Gilbert sequencing ladder run as a control will allow assignment of the footprint with 1-2 base accuracy.
In addition to mapping the site of the footprint, it is possible to deter-mine which residues within the site are important for binding. This is done using uracil or methylation interference. In these techniques, the nucleotides in the binding site are modified at an average of one site per molecule. This is done either with a methylation reaction which modifies guanine and adenine residues, or by synthesis in the presence of dUTP which substitutes uracil for thymine. The modified fragments are bound to the protein and run on a mobility shift assay (Section 2.2.4) which separates bound DNA from unbound DNA. Bound and unbound fractions are separately treated with reagents which cleave the DNA at the modified bases. As with DNase I mapping, end labeled DNA is used, and the resulting fragment lengths reflect the positions of modified bases. Bases which are not found to be modified in the bound fraction are important for protein binding.
DNase I footprinting
Figure 2.1.10a A method for determining the location of a protein binding site, DNase I Footprinting Analysis involves endonuclease treatment of an end labeled DNA fragment bound to a protein. Limited digestion yields fragments terminating everywhere except in the footprint region, which is protected from digestion.
DNase I
BindingProtein
Label
FootprintRegion
Maxam & GilbertSequencing
Ladder
FootprintRegion
AquaPor LE EC-202 General purpose agarose, AquaPor LE, com-bines excellent performance, gel strength and low background. (pg. 16)
Related Products
UreaGel-6 EC-836 Convenient system for casting 19:1 6% dena-turing gels with Acrylamide, Bis, TEMED, TBE and urea. (pg. 12)
Protocol 2.1.10a
DNase I Footprinting
1. Preparation of DNA substrate:
DNA to be analyzed must be cloned in such a way as to present a restriction site for an enzyme leaving a 5’ overhang (3’ recessed OH) 50-150 bp from the putative binding site. This site is labeled by “filling in” the recessed site with 32P-dNTP’s using DNA polymerase. The probe is then cut from the remaining plasmid by a second restriction enzyme, 150 bases on the opposite side of the binding site. This releases a 200-300 bp probe, labeled at one end (see figure below).
c o n t i n u e d
Digest 5-10 picomoles of plasmid (10-20µg of a 3000bp construct) with an enzyme which will leave a recessed 3’ end 50-150bp from the binding site.
Ethanol precipitate the DNA, and wash 1X with 70% Ethanol.
Add 50 µl of 1X Klenow buffer containing 50 µCi of each 32P dNTP. Add 10 units of Klenow fragment in < 2 µl, and incubate 30 minutes at 25°C.
Klenow buffer : 50mM Tris HCl, pH 7.6 12mM MgCl2 1mM DTT 50 µg/ml BSA Chase reaction with 5 µl of 2mM each dCTP, dGTP, dTTP, dATP, to
ensure complete polymerization.
Ethanol precipitate twice with 0.1 vol 3M sodium acetate and 3 volumes of ethanol, or purify with a spin column or glass powder elution to remove unincorporated label.
Cut with a restriction enzyme to release a 200-300 bp end labeled probe.
Run probe on a 1.5-2% Agarose gel (Section 2.4.1) and recover fragment by electroelution (Section 2.4.3). Further purification may be necessary to ensure consistent results. Ion exchange mini columns provide good results.
If volume is >50µl, ethanol precipitate the probe, and reconstitute in 50 µl TE buffer.
Figure 2.1.10b Preparing the DNA substrate for DNase footprinting analy-sis. A circular construct containing the protein binding site is linearized with a restriction endonuclease, yielding two free ends, which are both labeled. One end is then cut away in a second round of restriction digestion, leaving an end labeled probe which carries the binding site.
Restrictionsite
Restrictionsite
Protein Binding Site
Cleavage
Label ends using Klenow fragment
Cleavage

54 USA: 1-800-526-3867EUROPE: 441 482 646022
Electrophoresis Applications - Gel Electrophoresis of DNA and RNAEl
ectr
opho
resi
sA
pplic
atio
ns
Interpretation:Figure 2.1.10c shows an electrophoresis gel of idealized results. Bands correspond to DNase I cleavage sites. As the amount of protein present increases, the footprint area is progressively protected from cleavage. The concentration of protein required to give 50% protection can be math-ematically related to the equilibrium constant for protein binding. See CPMB Section 12.4 for a complete discussion of this method of analysis.
2. Bind Protein to DNA Probe:
Mix 105 cpm of probe with 200 µl of DNase Footprinting Buffer: 10mM Tris HCl, pH 7.5 4mM MgCl2 1mM CaCl2 150mM KCl 2mM DTT 100 µg/ml BSA 2mg/ml calf thymus DNA pH 7.5 (adjust buffer if necessary)
Add 20 µl protein sample. A series of dilutions covering 4-5 orders of magnitude will allow calculation of the binding affinity.
Prepare a blank tube with 20 µl of assay buffer
Incubate 30-45 minutes, at equilibration temperature.
The optimum time and temperature must be determined for each DNA/probe combination.
3. DNase I Treatment:
DNase treatment proceeds for only 2 minutes, so stop solution and a dry ice Ethanol bath must be prepared before beginning the treatment.
Stop Solution: 6.5 ml ethanol 50 µl 1mg/ml tRNA 0.5 ml ammonium acetate saturated solution
Cool to -70°C prior to use. Prepare DNase I solution:
The amount of DNase I required will vary depending upon the purity, age and storage conditions used for the enzyme. Start with 0.1 mg/ml DNase I and adjust to get an average of 1 nick per DNA molecule.
Dissolve DNase I in assay/equilibration buffer without BSA or calf thymus DNA. To each 200 µl sample of protein/DNA, add 5 µl DNase I solution.
Reproducible pipetting is essential at this stage if different DNA/protein ratios are to be compared.
Incubate at equilibration temperature exactly 2 minutes, then add 800 µl Stop Solution @ -70°C.
Precipitate DNA at -70°C for 30 minutes. Wash pellet with 70% Ethanol twice, and remove all supernatant. Air dry or speedvac 10 minutes.
Redissolve pellet in 6 µl of loading buffer, and run on a standard dena-turing PAGE gel.
Figure 2.1.10c An electrophoresis gel showing successive DNase footprinting reactions conducted with increasing titrations of binding protein.
UreaGel-6 EC-836 Convenient system for casting 19:1 6% dena-turing gels. Contains acrylamide, bis, TEMED, TBE and urea. (pg. 12)
Ammonium Persulfate EC-504 Exceeds ACS Standards. Low absorbed water results in consistent initiating capabil-ities. (pg. 32)
Autofluor LS-315 Water soluble scintillation phosphor for use as an autoradiographic image intensifier. (pg. 30)
Convenient Products for Denaturing Electrophoresis
TBE 10X EC-860 Formulated with 18 MegOhm water. 0.2 micron filtration. Costs less than bench-top buffers. (pg. 20)
Glass Free EC-621 Coats glass plates to prevent binding of poly-acrylamide gels, allowing easy disassembly of the cassette. (pg. 31)

55USA: 1-800-526-3867EUROPE: 441 482 646022
Electrophoresis Applications - Gel Electrophoresis of DNA and RNAElectrophoresis
Applications
Methylation Interference AssayUracil Interference Assay
These two analytical methods are presented in parallel, because they assay for similar information based on similar reactions. In both cases, the DNA is analyzed for nucleotides which are important for protein binding. The approach taken is to end label the DNA probe, so that cleavage of the DNA will yield labeled fragments whose size indicates the cleavage position, as in DNase I footprint analysis. The probe is treated to generate modified bases at about 1 base per DNA molecule. Binding protein is added to the modified DNA. If the base which was modified on a given DNA molecule was critical for binding, that mol-ecule will be left unbound. Bound and unbound populations of DNA are separated on mobility shift assay gels (Section 2.2.4). The two pop-ulations are then treated to cleave the DNA at the modified bases, and run on a denaturing PAGE gel. Modifications to bases important for protein binding will lead to the absence of cleavage fragments ending at such bases from the bound fraction of DNA. Cleavage at these sites will produce fragments seen only in the unbound DNA (Figure 2.1.10d).
The two techniques differ in the base(s) targeted, and in the method used to modify and cleave the DNA. The methylation interference assay is the simpler of the two, involving a chemical modification of Guanines and Adenines with Dimethylsulfate to produce N-7 methyl G or N-3 methyl A residues. These residues are subject to cleavage by piperidine. The complexity of this method is somewhat increased by the need to isolate an end labeled probe with which to work. In the Uracil interference anal-ysis DNA is synthesized in the presence of dUTP to incorporate Uracil residues in place of thymine, at a rate of 0.5-1 thymine substitutions per molecule. This can be accomplished by PCR with one labeled primer, thus probe generation may be easier than for methylation interference. Cleavage at Uracil residues requires a two step procedure, in which Uracil glycosylase removes the Uracil base, creating apyrimidinic sites which are then cleaved by piperidine.
Protocol 2.1.10c
Methylation Interference AssayUracil Interference Assay
Probe Preparation for Methylation Interference:
Generate a probe labeled at one end from a plasmid construct digested with enzymes to produce one 5’ overhang on a probe of 100-300 bp. (see Protocol 2.1.10a, DNase I footprinting)
Prepare and purify fragment as described.
Methylate 106 cpm of probe in 200 µl of reaction buffer: 50mM sodium cacodylate pH 7.9 1mM EDTA
Add 1µl of DMS to start the reaction.
React for 5 minutes at room temperature.
Stop the reaction with 50 µl of: 1.5M sodium acetate, pH 7.2 1mM BME 0.25 µg/ml tRNA
Precipitate the DNA with 750µl of ethanol, at -70°C (dispose of super-natant as DMS toxic waste).
Wash pellet by redissolving in 300µl 0.3M sodium acetate, then precip-itate with 900 µl ethanol. Repeat this step twice.
Proceed to mobility shift analysis.
Probe Preparation for Uracil Interference:
Probe for this procedure is generated by PCR amplification in the presence of one labeled and one unlabeled primer, with dUTP present at 25% of the concentration of the dTTP. Primers should be selected to provide a region of amplification which is 200-300 bp in length, and contains the protein binding site. Label the primer(s) with 32P ATP and polynucleotide kinase. Use the buffer and protocol recommended by the enzyme manufacturer. Purify the probe by gel electrophoresis or spin columns prior to use. For PCR guidelines, see Section 2.2.3. Purify the PCR products by native gel electrophoresis (Section 2.2.5). Proceed to mobility shift analysis.
Mobility Shift Analysis:
This step is the same for both protocols, and is described in Section 2.2.4. At the end of the analysis, locate the bands by autoradiography, and cut out the bound (upper) and unbound (lower) DNA bands. Purify the DNA from the gel slices (section 2.2.5).
Cleavage Reactions:
Uracil glycosylase (Uracil interference only)
Remove the Uracil bases by treating the DNA with 0.02 U/µl Uracil glycosylase in 1X Taq polymerase buffer (from PCR reaction, Section 2.2.3). Incubate at 37°C 1 hour.
Precipitate DNA with 0.1 vol 0.3M sodium acetate and 3 volumes of ethanol.
Proceed with piperidine cleavage.
Piperidine Reaction: (both assays)
Redissolve precipitated DNA in 0.1 ml of 1M piperidine.
Heat to 95°C for 30 minutes. Remove tubes to -70°C.
Lyophilize frozen samples to dryness.
Redissolve in 0.1 ml water.
Repeat lyophilization and rehydration three times.
Analyze bound and unbound samples on a 6% denaturing polyacrylamide gel.
Labeledsubstrate
BaseModification
Modifiedbases
Binding site
ProteinbindingNot essential
for binding
Mobility shiftassay
Cleavage at modified basesFragments
representing cleavage at a base essential for protein binding are only present in the unbound sample.
Figure 2.1.10d In uracil or meth-ylation interference assay, bases critical for protein binding will not appear as bands in the bound population.
Bound Population
Unbound Population
Unbound due to binding equilibrium (also present in bound population)
Modified base prevents binding(not found in bound population)

56 USA: 1-800-526-3867EUROPE: 441 482 646022
Electrophoresis Applications - Gel Electrophoresis of DNA and RNAEl
ectr
opho
resi
sA
pplic
atio
ns
The proportionality of log mw with mobility holds within certain limits. The very smallest molecules are not sieved effectively by the gel and all migrate at the same rate. Similarly, the largest DNA molecules cannot determine a path through the gel, and all molecules above this size migrate at the same near zero rate.
The mobility of double stranded DNA may also be affected by the sequence of bases. Certain sequences lead to bending of the helical structure, which can cause anomalously slow migration of the fragment. (Such altered mobilities serve as a basis for separation in Heteroduplex Analysis (Section 2.3.1)). These anomalies cause problems for the de-termination of fragment molecular weight by native PAGE, which can be much more reliably assigned with denaturing PAGE.
DNA PAGE gels are generally run in TBE Buffer, which has a high buff-ering capacity. TAE may also be used, but its lower buffering capacity leads to buffer exhaustion and pH changes in the gel during protracted runs. The voltages used are relatively low, around 5V/cm. With higher voltage, larger DNA molecules show a disproportionate increase in mobility, leading to a compression of bands in the higher size range.
2.2.1 Sample PreparationSample preparation for native PAGE is straightforward. Since the DNA does not need to be denatured, the concern is mainly with buffer content, density and visibility. The salt concentration of the sample should be no greater than the 200mM salt concentration in the running buffer, because gross imbalances in salt content between sample and gel can lead to salt waves, band distortions and smearing. The density of the sample mixture is adjusted to ensure that the samples remain in the wells prior to electrophoresis. Generally sucrose or ficoll is used for this purpose, as these uncharged compounds will not run into the gel or interfere during electrophoresis. Glycerol should not be used, because it forms complexes with the Borate in TBE buffer. These complexes can migrate into the gel and distort the band pattern.
2.2 Native Polyacrylamide Gel Electrophoresis of DNAIn the absence of denaturants, double stranded DNA retains its double helical structure, which gives it a rodlike form as it migrates through a gel (for non-denaturing electrophoresis of single stranded DNA, see section 2.3.2, SSCP Analysis). Double stranded DNA of up to 1000 bp can be separated on polyacrylamide gels. DNA over 1kb is generally fractionated on agarose gels (Section 2.4). As with single stranded DNA, double stranded DNA has a uniform negative charge density imparted by the phosphate linkages in its nucleotide backbone. As a result it has a free solution mobility (in the absence of any sieving matrix) which is independent of the size of the molecule. In a sieving medium, though, such as polyacrylamide or agarose, the relative mobility of any given molecule is determined by its ability to find a path through the gel pores. This is a linear function of the effective radius of the molecule, which can be empirically demonstrated to be related to the log of the molecular weight. Thus, on a gel of particular porosity, the migration rate of a given fragment is inversely proportional to the log of its mo-lecular weight (log mw).
Finally, tracking dyes are added, typically xylene cyanole and bromophe-nol blue. These dyes migrate through the gel unsieved. The table below presents the DNA fragment sizes which co-migrate with these dyes in various percentage 29:1 PAGE gels.
Comb
Spacer Plates
Casting Solution
Figure 2.2.2a An exploded view of a gel cassette.
2.2.2 Gel PreparationNative PAGE gels are prepared by mixing an Acrylamide/Bisacrylamide monomer concentrate (AccuGel 19:1 or 29:1), buffer concentrate and water to achieve the desired gel concentration. TEMED and Ammonium Persulfate are added to initiate polymerization and the solution is poured into a cassette. The comb is then inserted. The cassette is formed by two glass plates separated by spacers, typically 0.5-1mm in thickness, and sealed at the bottom (Figure 2.2.2a). A more detailed discussion of the electrophoresis apparatus can be found in Section 1.5. The polym-erization process takes 1-2 hours to complete.
1. Prepare solution of monomer, buffer and water as per table below.2. De-gas if desired.3. Add 0.8ml of 10% APS and 0.1ml TEMED per 100ml solution.4. Pour gel.
Gel %
Effective Separation Ranges (bp) and Tracking Dye Co-Migration vs. Gel Percentage (Native 29:1 Acrylamide:BisAcrylamide)
Bromophenol Blue(nucleotides)
468
1012
9560453520
45024016012070
Xylene Cyanole(nucleotides)Gel %
Table 2.2.1a
1000-200070-45060-40050-30040-200
Size Range (bp)
Figure 2.2a Electrophoretic mobility versus log mw.
Gels are run in 1X buffer, at 5V/cm for 1-2 hours, until the Bromophenol Blue tracking dye has reached the end of the gel, or until it is known that the fragments of interest have migrated about 50% through the gel. Monitor upper and lower tank pH during the run if TAE is used and replenish buffer if pH begins to drift.
Formulas for Native DNA Polyacrylamide Casting Solutions using National Diagnostics’ AccuGel 29:1 (40%)
Gel % TBE Gels TAE Gels TTE Gels
AccuGel: 15ml10X TBE: 10ml di H2O: 75ml
AccuGel: 15ml50X TAE: 2ml di H2O: 83ml
AccuGel: 15ml20X TTE: 5ml di H2O: 80ml
AccuGel: 20ml10X TBE: 10ml di H2O: 70ml
AccuGel: 20ml50X TAE: 2ml di H2O: 78ml
AccuGel: 20ml20X TTE: 5ml di H2O: 75ml
AccuGel: 25ml10X TBE: 10ml di H2O: 65ml
AccuGel: 25ml50X TAE: 2ml di H2O: 73ml
AccuGel: 25ml20X TTE: 5ml di H2O: 70ml
AccuGel: 30ml10X TBE: 10ml di H2O: 60ml
AccuGel: 30ml50X TAE: 2ml di H2O: 68ml
AccuGel: 30ml20X TTE: 5ml di H2O: 65ml
6%
8%
10%
12%
Table 2.2.2a Add 0.8 ml of 10% APS and 0.1 ml of TEMED per 100 ml solution.

57USA: 1-800-526-3867EUROPE: 441 482 646022
Electrophoresis Applications - Gel Electrophoresis of DNA and RNAElectrophoresis
Applications
Applications of Native DNA PAGE2.2.3 PCR AnalysisThe polymerase chain reaction (PCR) is a powerful technique which uses repetitive cycles of primer annealing, primer extension, and product denaturing to produce an exponential increase in the copy number of the target DNA. Two primers are used, which flank the region of inter-est (Figure 2.2.3a). In the presence of a thermostable polymerase, the substrate DNA is denatured at 95°C, the primers are annealed at 50°C, and the polymerase generates new copies of the DNA at 72°C. In the next cycle, twice as many molecules are available for primers to anneal to; thus for n cycles, 2n products are produced. Typically 30 cycles are used, which generates 230 = 1 X 10⁹ copies from one original. For a 500 bp fragment, this corresponds to about 1 pg of DNA from each copy, or a microgram of DNA from each femtogram of starting material.
Nontarget bands are also produced from mis-priming. If the primers have sufficient homology to some nontarget DNA region, this region will be amplified. It is important to realize that mismatches between primer and target only impede the first round of amplification. Once the first product has been copied, a perfect match is generated for the next annealing (Figure 2.2.3b). Mis-priming is minimized by using the highest annealing temperature which gives product, and by optimizing the Mg+2 concentration in the reaction. It is also important to avoid over-amplification. Once a product has accumulated to >1µg/reaction, the probability of one of the primers finding an unintended priming site within the target sequence is greatly increased. This generates a truncated fragment which is more efficiently amplified than the longer target. Because this smaller fragment contains a portion of the target sequence, it can interfere with subsequent analysis of the reaction, such as sequencing or blot analysis.
Figure 2.2.3a One cycle of the polymerase chain reaction (PCR). The double stranded substrate is denatured at 95°C. Primers are annealed to the single strands at 50°C, and extended at 72°C to produce two copies of the original template.
Denaturation95oC
PrimerAnnealing
50oC
Extension72oC
An important aspect of PCR is its ability to amplify specific sequences from complex mixtures. Given primers of sufficient specificity, and with some effort at optimizing conditions, a single sequence can be isolated from total RNA or genomic DNA using this technique. This allows rapid cloning of target sequences without creating and screening a library. The flanking sequences needed to design the primers can often be derived from end sequencing of proteins, from knowledge of gene structure (i.e. using the poly A of RNA as a priming site) or from conserved regions in homologous sequences.
Ideally, a PCR reaction gives one product of a predicted size, which needs only to be separated from the unused primers and dNTPs. In practice, particularly in amplifications from complex mixtures, multi-ple products are often produce d. One of the most common artifacts is “primer-dimer”. This is produced when the primers used are able to hybridize to each other at their 3’ ends. These hybrids are extended efficiently into a 30-50 bp structure, which competes for amplification with the target DNA. The result is a low molecular weight band, which in the worst cases is over 90% of the reaction product.
AccuGel 29:1 (40%) EC-852 Stabilized, pre-filtered 40% acrylamide: bisacrylamide solution. Two year shelf life-at room temperature. (pg. 15)
TBE 10X EC-860 Formulated with 18 MegOhm water. 0.2 micron microfiltration. More economical than bench-top buffers. (pg. 20)
Ammonium Persulfate EC-504 Exceeds ACS Standards. Low absorbed water results in consistent initiating capabil-ities. (pg. 32)
Products for Native DNA PAGE
AccuGel 29:1 (30%) EC-851 Stabilized, pre-filtered 40% acrylamide: bisacrylamide solution. Two year shelf life-at room temperature. (pg. 15)
TAE 50X EC-872 Ultra-Pure preformulated buffer for electropho-resis. TAE optimizes sample recovery. (pg. 20)
TEMED EC-503 Fractionally distilled twice to remove absolutely all inhibitory and fluorescent contaminants. (pg. 33)
Annealing of the primer to a non-target site attaches non-target DNA (gold) to au-thentic primer sequence (blue)
Annealing of a second primer downstream of the first site initiates complementary strand synthesis.
Extension of the second primer produces a construct which contains non-target DNA be-tween two authentic primer sequences.
In all subsequent cycles, the new construct will amplify at least as efficiently as the target sequence.
Figure 2.2.3b Mis-priming can produce unintended prod-ucts. After a single round, any mismatches between the primer and the improper sequence will be eliminated, as the figure at left shows. The improper target will have no impedance to its amplification along with the target DNA.
Protocol 2.2.3a
PCR Amplification
Protocols and conditions for PCR depend strongly on the enzyme, primers and substrate used. General guidelines for use of Taq polymerase are given below:
Reaction mixture (25-100µl): 25-50µl of Taq Buffer 0.2 mM dNTP’s 0.5 µM each primer 2-3 units Taq Polymerase Target sequence
Taq buffer contains 67mM Tris-HCl, pH 8.8, 150mM (NH4)2SO4, 1-5mM MgCl2, and 10mM BME. The concentration of Mg++ will vary from 1-5mM, depending upon primers and substrate. The amount of substrate used depends upon the concentration of target sequence in the sample DNA. The target will be amplified by up to 106 fold in a successful reaction, but the amplification will usually plateau at 1-10µg. Thus, 1 pg of target sequence in the reaction is a good place to begin.
Prepare the reaction in an 0.5ml microcentrifuge tube, and overlay it with 50-100 µl (1-2 drops) of mineral oil to prevent evaporation. Place the tube(s) in a thermocycler and run 20-30 amplification cycles.
c o n t i n u e d

58 USA: 1-800-526-3867EUROPE: 441 482 646022
Electrophoresis Applications - Gel Electrophoresis of DNA and RNAEl
ectr
opho
resi
sA
pplic
atio
ns
Cycle Conditions:
Denature the reaction at 90-94°C for 0.5 - 1 minute. The time and tem-perature should both be the minimum compatible with product production. Taq polymerase has a half-life of 20 minutes at 94°C. Consequently, after 30 one minute cycles with denaturation at 94°C, more than half the enzyme activity will be lost.
After denaturing, anneal the primers at 45-60°C. This temperature is one of the most critical optimization parameters. Start at 5-10° below the lowest calculated melting temperature (Tm) of the primer pair, and increase for subsequent reactions until yield begins to decline. The annealing step requires 0.5 - 1 minute.
Finally, increase the temperature to 72°C, the optimal temperature for Taq polymerase. Allow the Taq to extend the annealed primers for 1.5 - 3 minutes. Many programs increase the extension time for each succes-sive cycle, to compensate for lost Taq activity and increased substrate concentrations.
Cycle summary: 1. 90 - 94°C 0.5 - 1 minute
2. 45 - 60°C 0.5 - 1 minute 3. 72°C 1.5 - 3 minute
4. Return to (1)
30 such cycles are usually sufficient to amplify 1-10 µg of product. 35-45 cycles may be used, but internal priming on the product and over am-plification of unwanted bands often result from over-cycling. Generally, it is better to focus on optimizing reaction conditions than to go beyond 35 cycles.
Figure 2.2.3c PCR amplification follows an exponential curve until a saturation point is reached, after which further amplification often serves only to degrade purity. Curve shape depends upon the amount of substrate present initially.
Gel Electrophoresis of PCR ProductsGel electrophoresis of PCR products is the standard method for analyz-ing reaction quality and yield. PCR products can range up to 10kb in length, but the majority of amplifications are at 1kb and below, where PAGE analysis is the most effective. In the size range from 400 to 1000 bases, the choice of native PAGE or agarose for the analysis of PCR products depends mainly upon whether the product will need to be further purified. Purification from agarose is generally more convenient. Electrophoresis reveals the size of the product band, which is compared with the predicted result. Electrophoresis also shows how much of this band was produced, and reveals the presence or absence of any unintended amplification products.
Section 2.4.1 discusses how to prepare an agarose electrophoresis gel and Section 2.4.3 discusses methods for purification from agarose.
PAGE gels for PCR products are poured and run as described in Section 2.2.2. The concentration of acrylamide and the amount of cross-linker are chosen to give pore sizes optimal for the size of DNA fragment desired. See Table 2.2.2a for suggested gel percentages for a variety of fragment sizes. Gels are most often stained in Ethidium Bromide, even though the fluorescence of this stain is quenched by polyacrylamide, which decreases sensitivity 2-5 fold. This decrease in sensitivity generally does not present a problem, because most PCR reactions yield product levels in the microgram range, and Ethidium will detect as little as 1/10 of this amount.
InterpretationIdeally, electrophoresis yields a single strong band of correct size, as determined by comparison with size markers run on the same gel. If possible, identity should be confirmed by digestion with a restriction enzyme with a known site in the target DNA, or by Southern analysis (Section 4.1.2). An unexpected band running below 100bp is usually primer-dimer. If this is the case, this band will also be found in the control reaction, run without substrate. Adjustment of Mg2+ concentra-tion may help to minimize primer-dimer, but primer redesign may be required to eliminate it completely.
Multiple bands from a PCR reaction are a bad sign. They indicate multiple priming sites for the primers within the target DNA, and call into question the reliability of the primer set. Often, multiple bands may be eliminated by raising the hybridization temperature. Some-times adjusting the Mg2+ concentration eliminates unwanted products. Reducing the primer concentration will also make the annealing more specific, eliminating incorrect amplifications. As a final resort, band(s) which appear to be correct molecular weight can be cut out and purified (Section 2.2.5 for PAGE, Section 2.4.3 for agarose).
Yield and KineticsPCR reactions produce product in a nonlinear pattern (Figure 2.2.3c). Amplification follows a typical exponential curve until some saturation point is reached. Generally products will not be further amplified once 1-5 µg has been generated. Saturation by one product of a reaction does not always prevent further amplification of other (generally unwanted) products. As noted above, this means that over-cycling may decrease the quality of an otherwise good reaction. When first optimizing a re-action, it is advisable to take samples every 5 or 10 cycles to determine the number of cycles actually needed.
AccuGel 29:1 EC-852 Stabilized, pre-filtered acrylamide: bisacryl-amide solution. Two year shelf life-at room temperature. (pg. 15)
TBE 10X EC-860 Formulated with 18 MegOhm water. 0.2 micron filtration. More economical than bench-top buffers. (pg. 20)
Ammonium Persulfate EC-504 Exceeds ACS Standards. Low absorbed water results in consistent initiating capabil-ities. (pg. 32)
AquaPor LE EC-202 AquaPor LE is a high quality, general purpose agarose ideal for most routine applications.(pg. 16)
Products for PCR Analysis
Nuclistain EC-730 For the UV free visualization of DNA on acryl-amide and agarose. Improves the recovery of PCR products. (pg. 29)
TAE 50X EC-872 Ultra-Pure preformulated buffer for electropho-resis. TAE optimizes sample recovery. (pg. 20)
TEMED EC-503 Fractionally distilled twice to remove absolutely all inhibitory and fluorescent contaminants. (pg. 33)
AquaPor LM EC-204 AquaPor LM has the highest gel strength avail-able for a low melt agarose.(pg. 16)

59USA: 1-800-526-3867EUROPE: 441 482 646022
Electrophoresis Applications - Gel Electrophoresis of DNA and RNAElectrophoresis
Applications
2.2.4 Mobility Shift AssayProtein bound to a small piece of DNA will alter the electrophoretic mobility of that DNA fragment. This allows the analysis of protein-DNA interactions, including the measurement of binding rates, affinity, and specificity. In addition, bound and unbound DNA may be isolated from the gel and used for further types of analysis such as methylation interference or uracil interference (Section 2.1.10).
In the mobility-shift (or gel-shift) assay, end labeled DNA is allowed to bind protein. The resulting DNA protein complexes are then run on a non-denaturing PAGE gel and the gel is dried and autoradiographed. The buffer composition of the PAGE gel is varied from the standard TBE gel, because lower ionic strength is needed to facilitate the DNA protein binding. It is interesting to note that binding interactions which can dissociate in free solution within 1 minute show altered mobility on gels which require more than an hour to run. It is theorized that the gel matrix forms a “cage” around the DNA-protein complex, which prevents the components from diffusing away from each other, thus promoting re-association and in effect stabilizing the complex. This would argue that the ratio of bound and unbound material seen on the gel is a direct measure of the fraction of bound material in the sample as it entered the gel. Thus, the conditions set in the binding reaction are of critical importance.
Protocol 2.2.4a
Mobility Shift Assay
Probe Preparation:
A probe of the proper size is cut from 10 µg of plasmid clone, using restriction enzymes which will yield probe of 50-150 bp, with one 5' overhanging end.
Label the probe with 32P dNTP and Klenow fragment, to fill in the overhang. To the restriction digest reaction, add 100µCi of 32P dNTP (chosen to be part of the filled in region) and 0.2 mM of the other necessary dNTP’s.
Add 3 units of Klenow fragment and incubate 30 minutes @ room tem-perature.
Add an additional aliquot of a mixture of all 4 dNTP’s to a final concen-tration of 0.2mM, and incubate another 10 minutes.
Add 0.1 volume 3M sodium acetate, 3 volumes ethanol, precipitate the DNA and wash once with 70% ethanol to remove the bulk of the unincorporated label.
Isolate the probe on an agarose gel by electrophoresis onto a DEAE membrane (Section 2.4.3)
Probe should be labeled to 107 - 108 cpm/µg.
Binding Reaction:
Mix: 104 cpm of DNA probe 2µg nonspecific DNA (calf thymus DNA, or synthetic
polymer) 20 µg sample protein 1 µl glycerol in a final volume of 15 µl
Incubate at 30°C for 15-30 minutes.
This gives a basic framework for a binding reaction. Components which may be needed to ensure binding include glycerol (10%), KCl (50mM) and DTT (1mM). Buffer conditions must be optimized for each protein/DNA combination studied.
Electrophoresis:
The mobility shift assay gel uses a low ionic strength buffer system, to avoid salt effects on binding constants. This necessitates buffer circulation between upper and lower chambers to prevent buffer exhaustion and pH shifts during the run.
10X Gel Buffer: 67mM Tris HCl pH 8.0 33mM sodium acetate 10mM EDTA
Mix components and adjust pH to 8.0 Use this buffer at 1X for upper and lower buffer chambers.
Gel Mix: 6.7ml 30% acrylamide (AcrylaGel) 1.25ml 2% methylene bis-acrylamide (Bis-AcrylaGel) 1.25ml glycerol 36ml H2O 5 ml 10X gel buffer
Just prior to pouring, add 125µl 10% APS and 45µl TEMED to initiate polymerization.
Gel assembly:
Cast the gel in a standard format (16cm plate) cassette, with 1.5mm spacers and wells at least 0.8cm wide. Pour using standard techniques, and allow to polymerize one hour.
Run Conditions:
Recirculate the buffer at least 10ml/min.
Pre-run gel for 1.5 hours at 6V/cm
Preload at least one well with 0.01% bromophenol blue in 10% glycerol, to provide a tracking dye. No dyes are included in the binding reactions.
Load binding reactions and run gel at approximately 12 V/cm for 1-2 hours. Adjust the run voltage so that plates do not become warm, be-cause increases in temperature will alter binding equilibria. A current of 25-30 mA is sufficient for a 16 cm gel. Gels may be run at higher voltage in a cold room.
Results:
Bound DNA will appear as a more slowly migrating band, which is not visible in the lanes without protein. The band will disappear on addition of unlabeled competitive DNA sequences.
c o n t i n u e d
AcrylaGel EC-810 Stabilized, pre-filtered 30% acrylamide solu-tion. Two year shelf life at room temperature. (pg. 15)
Ammonium Persulfate EC-504 Exceeds ACS Standards. Low absorbed water results in consistent initiating capabil-ities. (pg. 32)
Glycerol - ULTRA PURE EC-606 Ultra Pure for molecular biology applications. Specifications include >99.7% purity. (pg. 33)
EDTA - ULTRA PURE EC-610 Molecular biology grade EDTA. Specifications include low insolubles (<0.005%) and >99% purity. (pg. 32)
Products for Mobility Shift Assay
Bis-AcrylaGel EC-820 Stabilized, pre-filtered solution of 2% methylene bisacrylamide. Aldehyde and acrylic acid free. (pg. 15)
TEMED EC-503 Fractionally distilled twice to remove absolutely all inhibitory and fluorescent contaminants. (pg. 33)
Tris - ULTRA PURE EC-406Purified to remove ammonia and amine contaminants. Specifications include >99.9% purity. (pg. 33)

60 USA: 1-800-526-3867EUROPE: 441 482 646022
Electrophoresis Applications - Gel Electrophoresis of DNA and RNAEl
ectr
opho
resi
sA
pplic
atio
ns
c o n t i n u e d
Figure 2.3.1a Heteroduplex Analysis. Annealing of mutant DNA to wild type probe gives duplexes with one or more mismatched bases (heteroduplexes). Mismatching causes the double helix to take on a conformation which retards its mobility during electrophoresis.
Wild type
Mutant
Denaturation
Annealing
Heteroduplexes
Homoduplexes
Hetero-duplex Bands
Mut
ant
Wild
Typ
e
Dup
lexe
s
2.3 Conformational AnalysisNative DNA PAGE gels can be used to detect small mutational differ-ences between DNA molecules. In heteroduplex analysis, for double stranded DNA, the basis of separation is the conformational difference arising from the bending of the rodlike double helix caused by small mismatches between the strands. In SSCP analysis, single stranded DNA molecules are fractionated based on the compactness of their folded structure. In both cases, it is possible to separate strands of equal length which have different sequences, often differing by only 1 base. Given a control (unmutated) fragment to use as a gel standard, these techniques can be used to screen large numbers of samples for mutations.
2.3.1 Heteroduplex AnalysisDouble stranded DNA is not a completely straight rigid rod. Sequence variations can cause bends in the double helix, or even alter the basic structure of the helix. A bend or kink in the DNA restricts its mobility through a sieving matrix because the bent molecule presents a larger projected area to the gel pores. A mismatch between the two strands of DNA in a duplex can produce a more radical kink in the structure, producing a heteroduplex species which can easily be resolved from the homoduplex by electrophoresis.
In this system, control DNA is denatured and allowed to anneal with denatured sample DNA. The renatured products are analyzed on a gel optimized to resolve conformational differences, such as National Diag-nostics’ SequaGel MD. If the sample DNA is not identical to the control DNA, multiple bands are observed. The fastest migrating band is the homoduplex control and/or the homoduplex sample. Heteroduplexes with mismatches migrate more slowly.
Heteroduplex Analysis is easily applied to large numbers of samples, and is particularly suited to the analysis of PCR products, because both sample and control DNA must be of the same size. In PCR, this would correspond to using the same amplification primers.
Protocol 2.3.1a
Heteroduplex Analysis
GEL PREPARATION
1. Preparation of working solutions:
To cast a 0.8 to 1.0 mm thick gel (>40 cm vertical gel recommended) combine the following in an Erlenmeyer flask:
50 ml SequaGel MD 6 ml 10X TBE 15 g urea (optional)
Fill to 100 ml with deionized water and mix thoroughly. Urea may assist the formation of more distinct bands during electrophoresis and reduces the formation of doublets in homoduplex controls.
2. Casting the gel:
Treat one plate from the gel cassette with Glass Free to facilitate later disassembly of the cassette.
Add the following to the solution, and swirl gently: 40 µl TEMED 400µl freshly prepared 10% ammonium persulfate
Using standard acrylamide procedure (Section 2.1.2), pour the gel solution into the cassette, insert the comb, and allow to polymerize at room temperature for a minimum of 60 minutes. Attach the gel cassette to the electrophoresis apparatus, and fill the upper and lower chambers with 0.6X TBE.
SAMPLE PREPARATION
1. PCR amplification:
PCR conditions should be optimized for the desired PCR product before heteroduplex analysis. It is recommended that the minimum number of PCR cycles be used on a purified, salt free template, and that reagent and primer concentrations be optimized.
After PCR thermal cycling, add EDTA to a final concentration of 5 mM (1µl of 0.5 M EDTA per 100 µl reaction) to inactivate the Taq DNA polymerase.
2. Hybridization:
Mix equivalent quantities of wild type and sample PCR-amplified DNA. Heat at 95°C for 3 minutes. Then, over a 20-30 minute period, slowly cool the mixture to room temperature. The use of a thermocycler can facilitate this step.
ELECTROPHORESIS
1. Add 1 µl Triple Dye Loading Buffer (provided in kit) per 5 µl of sample and mix thoroughly.
2. Rinse the wells with running buffer and load the samples in the 1.0X SequaGel MD gel. One lane should consist of control homoduplex DNA, and one of the sample homoduplex DNA. This will allow the detection of non-heteroduplex artifacts on the gel. Another lane should consist of an appropriate DNA size marker.
3. Run the gel in 0.6X TBE, at a constant voltage of 20 V/cm, as determined by the length of the gel. For a 40 cm gel, set the power supply to 800 V. Approximate run times can be estimated from the chart below:
Fragment Size Run Time (800V) Volt X Hours
200 bp 14.0 hours 11,200 250 bp 14.5 hours 11,600 300 bp 16.5 hours 13,200 500 bp 20.0 hours 16,000 700 bp 25.0 hours 20,000 900 bp 30.0 hours 24,000
4. When the electrophoretic run is complete, remove the gel from the appa-ratus, and carefully remove one plate from the gel. Stain with ethidium bromide or silver stain.

61USA: 1-800-526-3867EUROPE: 441 482 646022
Electrophoresis Applications - Gel Electrophoresis of DNA and RNAElectrophoresis
Applications
STAINING
Stain using 0.6X TBE containing 1 µg /ml of ethidium bromide. Water should not be used in place of the TBE, because the gel will swell when placed in water. Stain for 15-30 minutes. For maximum sensitivity, destaining in 0.6X TBE for up to 30 minutes may be required.
To visualize ethidium bromide stained bands, cover the gel with plastic wrap and place the plate with the gel side down on a UV-transillumina-tor. It may assist in handling and visualization to cut out the gel region containing the bands of interest.
WARNING: ETHIDIUM BROMIDE HAS BEEN SHOWN TO BE A CAR-
CINOGEN AND SHOULD BE DISPOSED OF PROPERLY.
Silver staining (Section 4.1.1) may be used to increase band visibility.
2.3.2 SSCP Analysis Single stranded DNA can adopt multiple conformations under non-de-naturing conditions. In the absence of a complementary strand, DNA will anneal short internal complementary sequences, forming a complex “knot”. A DNA molecule follows a complex path of folding to reach its final form. This form is influenced by the solution environment and temperature. The path consists of a series of annealing steps, each sta-bilizing and, to some extent, directing the next step. Minor alterations in the sequence of the DNA will disrupt the annealing process and result in a different final shape. The compactness of these structures will determine how fast the single stranded DNA migrates through a non-denaturing gel. Such differences in electrophoretic mobility between nearly identical strands serve as the basis for the technique known as single strand conformation polymorphism (SSCP) analysis. Like het-eroduplex analysis, SSCP is a rapid method for mutational screening.
Samples are denatured with heat and then rapidly cooled. Rapid cooling favors self-annealing, because insufficient time is allowed for complementary strands to collide and orient for duplex formation. The renatured samples are analyzed on a gel opposite the control DNA. As with Heteroduplex Analysis, all fragments must be the same length. Mutant samples will show a mobility different from the control DNA. The gel matrix used must be optimized for the resolution of DNA conformers of the same length. Various combinations of Acrylamide/Bis-Acrylamide are mentioned in the literature, at ratios from 29 to 1 to 50 to 1, and at percentages from 4 to 8. National Diagnostics’ SequaGel MD (page 12) is optimized to provide superior results in both hetero-duplex and SSCP analysis.
Figure 2.3.2a SSCP Analysis (Single Strand Conformational Polymorphism). Single point mutations can cause major differences in the folded form of single stranded DNA. These differences can be detected as differences in electrophoretic mobility.
SequaGel MDMonomer Solution EC-845 For the detection of minor mutational differ-ences in SSCP Analysis and Heteroduplex Analysis. (pg. 14)
SequaGel MDHeteroduplex Kit EC-847 Contains SequaGel MD Monomer Solution (200ml) and Triple Dye Loading Buffer (1.2ml). (pg. 14)
Ammonium Persulfate EC-504 Exceeds ACS Standards. Low absorbed water results in consistent initiating capabil-ities. (pg. 32)
Products for Conformational Analysis
TBE 10X EC-860 Ultra-Pure, Convenient, and Economical. Formulated with 18 MegOhm water. 0.2 micron microfiltration. Costs less than bench-top buffers. (pg. 20)
SequaGel MDSSCP Kit EC-846 Contains SequaGel MD Monomer Solution (200ml) and SSCP Stop Solution (1.2ml). (pg. 14)
TEMED EC-503 Fractionally distilled twice to remove absolutely all inhibitory and fluorescent contaminants. (pg. 33)
Wild type
Mutant
Denaturation
Annealing
Mut
ant
Wild
Typ
e
Mut
ant +
Wild
Typ
e
Protocol 2.3.2a
SSCP Analysis
GEL PREPARATION
1. Preparation of working solutions:
To cast a 0.4 mm thick gel (>40 cm vertical gel recommended) combine the following in an Erlenmeyer flask:
25 ml SequaGel MD 6 ml 10X TBE Fill to 100 ml with deionized water and mix thoroughly.
Prepare 0.6 X running buffer by diluting 60 ml of 10X TBE stock to 1 L with deionized water.
2. Casting the gel:
Add the following to the gel solution, and swirl gently: 40 µl TEMED 400 µl freshly prepared 10% APS
Using standard acrylamide procedures, pour the gel solution into the cassette, insert the comb (inverted if using a sharkstooth comb), and allow polymerization at room temperature for a minimum of 60 minutes. Attach the gel cassette to the electrophoresis apparatus.
SAMPLE PREPARATION
1. PCR amplification:
PCR conditions should be optimized for desired PCR product before SSCP analysis is undertaken. It is recommended that the minimum number of PCR cycles be used on a purified, salt-free template, and that reagent and primer concentrations be optimized. If radiolabeling is going to be utilized instead of silver staining, end-labeled primers may be used, or an α-32P dNTP may be included in the PCR amplification.
2. After PCR thermal cycling, 1 µl of PCR product should be added per 10 µl of SCCP Stop Solution (provided with SequaGel MD kit). To denature the sample DNA, this solution should be heated to 94°C for 2 minutes. The vials should then be placed immediately into an ice slurry to rapidly cool the solution.
ELECTROPHORESIS
1. Rinse the gel wells with running buffer. The sharkstooth comb should be reinserted so that it just touches the surface of the gel, and 1 to 3 µl of the sample should be loaded.
2. Run the gel at a constant power of 6-8 watts for 14 hours.
3. If the DNA was radiolabeled, transfer the gel to Whatman 3MM filter paper, place on a flat surface, and cover with plastic wrap. Dry the gel and, using standard technique, expose to X-ray film. Silver staining may be used for detection. Ethidium bromide is not effective at detecting single stranded DNA.

62 USA: 1-800-526-3867EUROPE: 441 482 646022
Electrophoresis Applications - Gel Electrophoresis of DNA and RNAEl
ectr
opho
resi
sA
pplic
atio
ns
2.4 Agarose Gel Electrophoresis of DNA and RNADNA and RNA strands are extremely large macromolecules. A 1 ki-lobase piece of single stranded DNA or RNA has a molecular weight of 330,000 daltons, larger than the vast majority of proteins. Often in the lab, genomic DNA fragments as large as 1000 kilobases (1 megabase) must be separated by gel electrophoresis. The separation of such large molecules requires an extremely open matrix structure. Agarose, which forms gels of sufficient strength at percentages as low as 0.5%, is the matrix of choice for separation of DNA or RNA over 1000 bp.
Agarose is a natural polysaccharide, purified from seaweed (see Section 1.3.2 for a discussion of the agarose matrix). The crude precursor ma-terial (agar) has been used in some electrophoresis applications, but it contains a number of contaminants, which adversely affect the quality of the results. Sulfonated polysaccharides are the main problem, because they add strong negative charges to the gel matrix. As discussed in section 1.3.2, fixed charges on the matrix cause water to flow through the gel to balance the osmotic effects of the migration of their counter ions. This effect is known as electroendosmosis (EEO), which causes bands to smear or broaden. In addition, sulfonated polysaccharides can act as effective DNA mimics, profoundly inhibiting enzyme action in later processing steps, such as ligation or restriction analysis. To avoid these effects, agarose is purified to remove most of the endogenous contaminants found in agar. Gels prepared with agarose have low EEO, and thus excellent band resolution. Bands isolated from agarose gels can often be processed with enzymes without further purification, although this is not always the case.
The 3-dimensional structure of an agarose gel is held together by hy-drogen bonding. Because no covalent bonds link this network, the gel can be disrupted by heating. For this reason, agarose gels are easy to create and pour, one of the great advantages of this material. Agarose is simply melted into the proper volume of buffer, and the molten material is poured into a gel mold and allowed to cool. The buffer can be chosen to provide native or denaturing run conditions, so double stranded DNA, single stranded DNA and RNA can all be analyzed on agarose gels. Typically, agarose gels are run in a horizontal apparatus, with the gel lying under a thin layer of buffer (submarine gels). Agarose gels can also be run in a vertical format. This is generally done if discontinuous buffer systems or thin gels are required.
Agarose electrophoresis is used for a variety of purposes. Specialty grades of agarose have been developed to fulfill specific requirements. The most commonly used variant is low-melting agarose, which has been modified to lower its melting temperature from over 90°C to around 65°C. This variation allows bands to be excised from a gel and then melted at a mild temperature to release the DNA. Unfortunately, low melt agarose generally produces gels which are difficult to work with because of low mechanical strength. However, National Diagnostics’ AquaPor LM, has exceptionally high strength for a low melt agarose, and produces gels which can be handled easily without breaking.
Representing another popular form of agarose, National Diagnostics’ AquaPor ES has been modified for exceptional mechanical strength. This is particularly useful when extra large DNA fragments are run. The low percentage gels required to run megabase fragments of DNA are extremely flimsy. Extra strength agarose allows the use of very low percentage gels, permitting the analysis of even larger pieces of DNA.
Finally, agarose can be refined to give matrices with enhanced resolu-tion, such as National Diagnostics’ AquaPor HR. Standard agarose can achieve about 5% size resolution (resolved fragments must differ by at least 5%). High resolution agarose can resolve fragments differing by as little as 2%. This improvement allows the resolution of fragments below 500bp, and is ideal for analyzing PCR products. Another alternative for small fragments is National Diagnostics’ AquaPor 3:1, which is ideal for casting the high percentage gels necessary to sieve small DNA fragments.
2.4.1 Preparation of Agarose GelsTo determine the percentage gel to cast, consult the table above corre-sponding to the AquaPor agarose of choice.
Protocol 2.4.1a
Preparing an Agarose Gel
Comb Selection: Use a thin (< 1 mm) comb with wide teeth for the sharpest, best-resolved
bands.
Be certain the comb is cleaned scrupulously prior to use.
Buffer Selection:
Use 1X TBE for optimal resolution of DNA < 12 kb when the DNA will not be recovered.
Use 1X TAE for the best separation of DNA from 12 kb to 50 kb, or for DNA < 12 kb if the DNA will be recovered from the gel.
Use 1X Tris-Acetate (TAE without EDTA) if the DNA will be used for in-gel enzymatic processing.
Casting a gel:
Add buffer (at room temperature) to a flask that is 2.5 - 4 times the volume of gel solution. Add a teflon-coated stir bar.
Add AquaPor powder while stirring vigorously so the agarose is dispersed uniformly. Stir for 2 minutes to hydrate the agarose.
Tare the flask and solution.
Place in a microwave oven and heat at 100% power using 20-60 second intervals. Swirl gently between intervals to resuspend the agarose.
Continue the cycle of heating and swirling until the agarose is completely dissolved (no visible particles are present).
Add distilled water to return the solution to its initial weight and mix.
Cool the solution to 50-60°C before pouring the gel. Pour the solution into the mold so as to dispense the entire amount in 30-60 seconds, without generating bubbles. Insert comb.
After casting, chill the gel for 30 minutes prior to comb removal when using AquaPor LM, HR, and low (<1%) concentrations of AquaPor LE and ES. This will complete gelation, increase gel strength, and enhance DNA resolution.
AquaPor LEall around performance
Size Range(bp)
2.0
1.75
1.5
1.0
0.75
200 - 3,000
250 - 4,000
300 - 5,000
400 - 12,000
1,000 - 23,000
Gel %
AquaPor 3:1small fragments
Size Range(bp)
4
3
2
1
0.75
50 - 1000
100 - 1500
200 - 5000
400 - 10,000
1,000 - 20,000
Gel %
AquaPor LMlow melting point
Size Range(bp)
4
3
2
1
0.75
<500
200 - 800
300 - 3,000
500 - 20,000
600 - 25,000
Gel %
AquaPor HRhighest resolution
Size Range(bp)
4.5
4.0
3.0
2.5
2.0
50 - 200
75 - 300
100 - 700
125 - 800
150 - 1000
Gel %
AquaPor EShigh strength for PFGE
Size Range(bp)
1.5
1.0
0.75
0.5
0.3
300 - 5,000
400 - 12,000
800 - 15,000
1,000 - 25,000
5,000 - 50,000
Gel %
For a particular type of agarose, these tables indicate the percentage gel yielding the best sep-aration over a particular range of fragment sizes.

63USA: 1-800-526-3867EUROPE: 441 482 646022
Electrophoresis Applications - Gel Electrophoresis of DNA and RNAElectrophoresis
Applications
Preparation of Denaturing Agarose GelsSeveral denaturants can be used with agarose. Alkaline gels are most often employed with single stranded DNA, because pouring and han-dling such gels is nonhazardous and convenient. However, because strong alkali will hydrolyze RNA, formaldehyde is used with RNA.
Protocol 2.4.1b
Preparing Alkaline Agarose Gels
At high temperatures, alkaline conditions will hydrolyze the Agarose poly-saccharide chains. To prepare an alkaline gel, the agarose is first melted in water and cooled to near gelling temperature. Buffer concentrate is then added and the gel is poured.
Gel Preparation:
Dissolve 1.2g of Agarose in 98ml of deionized water. Stir agarose well into cold water, until all clumps are broken up. Heat the suspension in a microwave until it is a clear and homogeneous solution. Allow to cool to 15°C above gelling temperature.
Add 2ml of 50X Alkaline gel buffer.
50X Alkaline gel buffer: 1.5M NaOH 50 mM EDTA
Pour gel as described in Protocol 2.4.1a
Run gel in 1X Alkaline gel buffer. Sample Preparation:
MIx Samples with an equal volume of: 60mM NaOH 2mM EDTA 20% Ficoll 0.06% Bromocresol Green
(Stock solution is: 2g Ficoll, 0.4ml 50X Alkaline buffer, 6mg Bromocresol Green, bring to 10 ml with deionized water.)
Protocol 2.4.1c
Preparing Formaldehyde Agarose Gels (for RNA analysis)
Note: RNA is subject to rapid degradation by RNase present in the envi-ronment. For optimal results, use water treated with DEPC.
Gel Preparation:
Melt 1.2g agarose in 87ml of DEPC water, by dispersing the agarose uniformly and heating in a microwave until all particles are dissolved.
Bring the melted agarose to 60°C.
Add 10ml 10X MOPS Buffer and 3ml 37% formaldehyde. FORMAL-DEHYDE IS VOLATILE AND TOXIC. WORK IN A HOOD FROM THIS POINT FORWARD.
10X MOPS: 0.2M MOPS pH 7 with NaOH 50mM sodium acetate 10mM EDTA Use DEPC treated water and RNase free reagents
Pour gel as in Protocol 2.4.1a. USE A FUME HOOD!
Allow gel to set for 1 hour.
Run gel in 1X MOPS Buffer
Sample Preparation:
Sample Buffer: 65% formamide 22% formalin (37% formaldehyde) 13% 10X MOPS
Mix 40µl sample buffer with 10µl sample, heat to 55°C 15 minutes.
Add 10µl of: 50% glycerol, 1mM EDTA, 0.3% each bromophenol blue and xylene cyanol.
Applications of Agarose Gel Electrophoresis2.4.2 Restriction Digest MappingRestriction endonucleases are enzymes that cleave double stranded DNA at specific sites, generally 4, 6 or 8 base palindromic sequences. Because, in action, the enzymes are sequence specific, each piece of DNA has a recognizable pattern (or map) of restriction sites. This map serves as an easily identifiable “fingerprint” whereby the identity of a piece of DNA can be established without recourse to sequencing or blot hybridization. A map of restriction sites is also essential for planning subcloning ex-periments, in which a large piece of DNA is cut into smaller fragments for more convenient analysis.
To perform a restriction mapping experiment, 2-10µg of sample DNA is digested to completion in a set of separate reactions with 5-10 dif-ferent restriction enzymes. These reactions provide the primary map information, giving the distances between the restriction sites and the ends of the DNA molecule, or revealing the existence of multiple sites for one enzyme. This information is extracted by running the digestion reactions on an agarose gel vs standards of known size, to determine the size of each restriction fragment generated.
In the second stage of restriction mapping, the DNA is digested with pairs of enzymes (double digests) selected from the enzymes used in the single digests. The sizes of the fragments generated indicate the relative positions of the restriction sites for the two enzymes involved. Generally, a second round of double digests is then carried out to resolve remaining ambiguities in the map.
Figure 2.4.2a Restriction mapping involves treatment of a DNA fragment with restriction enzymes both singly and in combination. The electrophoresis of cleavage products yields a map of the DNA in terms of restriction sites.AquaPor LE EC-202 High quality, general purpose agarose ideal for most routine applications. Low EEO. DNase & RNase free. Unique low boil-over formulation. (pg. 16)
AquaPor LM EC-204 Low melting agarose. Certified for in-gel ligation and PCR. DNase & RNase free. Highest gel strength available in a low-melting agarose. (pg.16)
AquaPor ES EC-203 AquaPor ES is a premium, ultra high strength, ultra low EEO agarose. Ideal for Pulsed Field Gel Electrophoresis (PFGE). (pg. 17)
TAE 50X EC-872 Ultra-Pure preformulated buffer for electropho-resis. TAE optimizes sample recovery with low melt agarose. (pg. 20)
National Diagnostics AquaPor Agarose and Buffers
AquaPor 3:1 EC-206 Fine resolution of small DNA fragments. Yields strong gels with low UV background. Low viscosity makes pouring high% gels much easier. (pg. 17)
AquaPor HR EC-205 AquaPor HR combines high resolution with low melting. Resolves DNA down to 2% size difference (or 4 bp below 200 bp). DNase & RNase free. (pg. 17)
TBE 10X EC-860 Formulated with 18 MegOhm water. 0.2 micron filtration. More economical than bench-top buffers. (pg. 20)
Figure 2.4.2a Restriction mapping involves treatment of a DNA fragment with restriction enzymes both singly and in combination. The electrophoresis of cleavage products yields a map of the DNA in terms of restriction sites.

64 USA: 1-800-526-3867EUROPE: 441 482 646022
Electrophoresis Applications - Gel Electrophoresis of DNA and RNAEl
ectr
opho
resi
sA
pplic
atio
ns
Glass Powder ElutionDNA purified from low melt agarose is sufficiently clean for many pur-poses. When further purification proves necessary, glass powder elution is an effective method. In this technique, the DNA is bound to finely powdered glass or microscopic glass beads in a high salt suspension. Agarose and other contaminants do not bind to the glass and can be washed away. The DNA is then eluted in water or a low salt buffer. A selection of glass powder elution kits are commercially available. DNA may also be purified from standard agarose gels by this technique, using sodium iodide (NaI) to disrupt the gel matrix.
ElectroelutionThe most popular alternative to glass powder elution for the complete purification of DNA from agarose is electroelution. Because agarose gels are run in a horizontal apparatus, the gel can be manipulated during a pause in the run. This allows variations of electroelution to be performed that are not possible with vertical gels, which are encased in glass plates throughout the entire run.
In the most straightforward form of electroelution, the band is excised from the gel and placed in a bag of dialysis membrane. This bag is then filled with electrophoresis buffer and placed in an electric field. The DNA migrates out of the gel slice and into the buffer, but it is too large to migrate out of the bag. Recovery is then just a matter of collecting the buffer from the bag.
An alternative involves cutting a “trench” into the gel just ahead of the band of interest, and then continuing the electrophoresis until the band is eluted into the trench. Although such technique allows recovery of the band in a small volume of running buffer, it requires exact timing or running the gel on a UV transilluminator, to avoid running the band past the trench.
Alternatively, instead of a trench, a slit can be cut in the gel just ahead of the band, and a piece of DEAE ion exchange paper can be inserted into the gel, so that the band is run onto the paper. The DNA binds tightly to the paper, and there is no need for exact timing and absolutely continuous monitoring of the run. Once all of the band is bound to the paper, recovery is accomplished by washing the paper in a high salt buffer. With this protocol it is often necessary to ethanol precipitate the DNA to remove the elution buffer.
2.4.3 DNA/RNAPurification fromAgaroseGels
Low Melting AgaroseAs with PAGE electrophoresis, the DNA or RNA resolved on an agarose gel is of high sequence purity, and it is often advantageous to recover this material. As later steps in processing may be sensitive to agarose, its contaminants or the components of the running buffer, it may be necessary to separate the nucleic acid from the matrix material. A va-riety of techniques have been developed to carry out such separations. In cases where agarose and buffer components will not interfere, low melting agarose gels are used for the electrophoretic separation. The gel is stained and the band(s) of interest excised. The excised material can be melted at 60-65°C, well below the melting temperature of any DNA longer than 30 bases. Processing is then carried out in the melted gel. (Section 2.4.4 details in gel enzymatic reactions.) Use of low melting agarose also facilitates purification from the matrix. The challenge of recovering DNA from a matrix arises from the fact that the nucleic acid molecules are caged in a 3-dimensional network of ma-trix molecules. Removing the DNA from this cage requires forcing the DNA through the matrix pores. Use of low melting agarose circumvents this problem by disrupting the matrix to release the DNA, simplifying the physical separation of the two components.
Protocol 2.4.3a
Purification of DNA from Low Melt Agarose Gels
1. Cast and run a gel (protocol 2.4.1a), stain (protocol 4.1.1b) and excise band(s).
2. Add 3 volumes TE buffer to the gel slice (for gels over 2%, use 5 volumes TE).
3. Melt agarose at 65° for 15-30 minutes.
4. Add to the melted agarose solution an equal volume of phenol, buffered to pH 8.0 with 0.1M Tris HCl and mix by vortex or vigorous shaking for 10 minutes - the longer it is mixed, the cleaner the final product.
5. Centrifuge in a microcentrifuge for 15 minutes at 10,000 rpm.
6. Collect upper aqueous phase. Do not recover any of the white interface material. (More DNA can be recovered by re-extracting the phenol/interface with an equal volume of TE buffer, but this will also carry some agarose into the aqueous phase.)
7. Precipitate the aqueous fraction(s) with 0.1 volume of 3M sodium acetate and 3 volumes of cold ethanol.
8. Recover DNA by centrifugation, wash once with cold 70% ethanol and allow to air dry.
Figure 2.4.2a Restriction mapping involves treatment of a DNA fragment with restriction enzymes both singly and in combination. The electrophoresis of cleavage products yields a map of the DNA in terms of restriction sites.AquaPor LM EC-204 Low melting agarose. Certified for in-gel ligation and PCR. DNase & RNase free. Highest gel strength available in a low-melting agarose. (pg. 16)
TAE 50X EC-872 Ultra-Pure preformulated buffer for electropho-resis. TAE optimizes sample recovery with low melt agarose. (pg. 20)
TE Buffer (100X) EC-862 100X Concentrated solution of 1M Tris-HCl, pH 8, with 100mM EDTA. 0.2 micron filtration. (pg. 20)
Agarose and Related Products Useful in Purification
AquaPor LE EC-202 High quality, general purpose agarose ideal for most routine applications. Low EEO. DNase & RNase free. Unique low boil-over formulation. (pg. 16)
TBE 10X EC-860 Formulated with 18 MegOhm water. 0.2 micron filtration. More economical than bench-top buffers. (pg. 20)
AquaPor HR EC-205 AquaPor HR combines high resolution with low melting. Resolves DNA down to 2% size difference (or 4 bp below 200 bp). DNase & RNase free. (pg. 17)
Figure 2.4.3a DNA Purificationfrom agarose by electroelution

65USA: 1-800-526-3867EUROPE: 441 482 646022
Electrophoresis Applications - Gel Electrophoresis of DNA and RNAElectrophoresis
Applications
Figure 2.4.3a DNA Purificationfrom agarose by electroelution
Protocol 2.4.3c
Electroelution into a Dialysis Bag
1. Cut the band of interest out of the gel, and trim away excess agarose.
2. Tie two knots in the end of a 1cm diameter dialysis tube, 5cm long. Alternatively, the bag can be closed with a plastic clip.
3. Place the band in the dialysis tube, add 0.5-1ml of TAE buffer, and seal the bag with knots or a second clip.
4. Place the bag in a horizontal electrophoresis apparatus, and add 1X TAE until the bag is barely submerged.
5. Apply a voltage of 2-3 V per cm of distance between the electrodes.
6. Elute for 1 hr per kilobase of target length. For fragments over 5kb, elute overnight.
7. At the end of the run, reverse the polarity and run at 5V/cm for 1 minute to release any DNA adhered to the inside of the tubing.
8. Open the bag and recover the TAE. Rinse the bag with 0.5-1ml TAE and pool the TAE fractions.
9. Precipitate the DNA with 0.1 vol. 3M sodium Acetate and 3 vol. ethanol.
Protocol 2.4.3d
Electroelution into a Trough
1. Run the gel until the band of interest is adequately resolved. This is best done in an apparatus which can be mounted on a UV light box, running the gel in buffer containing Ethidium Bromide, and checking the band progress periodically. As an alternative, judge the run by the migration of the tracking dyes, staining the gel in Ethidium Bromide prior to elution to locate band of interest.
2. Cut a trough 2mm wide just ahead of the band, 2mm wider than the band. Return the gel to the apparatus, and add or remove buffer until the top surface of the gel is barely above the level of the buffer. Fill the trough with buffer and run the gel until the band has entered the trough. If continuous monitoring is not feasible, stop the gel periodically to remove the buffer and refill the trough.
An alternative, more reliable procedure is to cut a slit ahead of the band, and insert a piece of Whatman 3mm paper backed by a piece of dialysis membrane. Upon resumption of electrophoresis, the DNA is trapped against the dialysis membrane and can be easily recovered by eluting or centrifuging the buffer from the Whatman paper.
Protocol 2.4.3e
Electroelution onto DEAE Paper
Anion exchange paper will bind DNA tightly in the relatively low salt environ-ment of an electrophoresis buffer. A strip of DEAE paper, placed in front of a DNA band, will effectively trap all of the DNA in the band. The DNA can be eluted in high purity with high salt.
1. Run an agarose gel and stain with ethidium bromide.
2. Locate band and cut slits in the gel just before and just after the band.
3. Insert a piece of DEAE filter paper into each slit, and return the gel to the electrophoresis chamber.
4. Continue to run the gel for 10-20 minutes, until the entire band is bound to the paper. The paper inserted above the band prevents any contam-ination from larger DNA fragments.
5. Recover the paper, and rinse briefly in electrophoresis buffer. Elute the DNA by placing the paper into 500 µl of 1M NaCl, and heating to 65°C for 30 minutes per kilobase of DNA.
6. Ethanol precipitate with 1ml of EtOH and wash pellet twice with 70% EtOH.
2.4.4 In Gel Enzyme ReactionsIn many cases, the processing of DNA by enzymes is not impeded by agarose. Such reactions can be run directly in bands excised from low melting point agarose gels. The excised band is melted, mixed with the required buffer and enzyme, and then incubated at the optimal reac-tion temperature. The gel may solidify during the incubation without interfering with the reaction, and the agarose can then be remelted to recover the DNA.
NB: TAE, TBE and TTE, as well as most other common electrophoresis buffers, contain EDTA at 1-2mM. This level of EDTA is sufficient to inhibit most DNA modifying enzymes, by chelating the Mg2+ that these enzymes require. The effect of the EDTA can be avoided in two ways: more Mg2+ may be added to the reaction to saturate the EDTA, or less EDTA may be included in the electrophoresis buffer. Impure samples of DNA may be degraded by endogenous nucleases if the EDTA is decreased in the gel buffer, so if the purity of the sample is questionable, it is advisable to run the gel in the standard buffer and add supplementary Mg2+ to the subsequent reaction.
Protocol 2.4.4a
In Gel Restriction Digestion
This technique is used when one DNA species from a complex mixture is to be digested. Without pre-purification, digestion would result in a complex mass of unidentifiable bands.
1. Run the DNA sample on a low melting gel of the appropriate concentra-tion. Load sufficient DNA to provide 1-10µg of target material.
2. Stain the gel with ethidium bromide, and cut out the band(s) of interest. Do not expose the DNA to UV light for more than 1-2 minutes, or nicking and strand breaks may occur.
3. Weigh the gel slice, and determine the approximate volume by assuming 1mg = 1µl.
4. Heat the slice to 65°C in a sealed tube to prevent evaporation. Allow 5-10 minutes for the band to melt.
5. Equilibrate the melted band to 37°C, and add an equal volume of 2X enzyme buffer containing 5-10 units of enzyme per µg DNA in the slice.
6. Allow to digest for 1-2 hours at 37°C.
7. The digested DNA may be analyzed on a second gel, purified from the LM agarose solution (Section 2.4.3) or further processed as desired.
Protocol 2.4.4b
In Gel Ligation
In most cases, the creation of cloned constructs requires the ligation of at least one, and more often two, fragments isolated from agarose gels. Isolation of bands prior to ligation prevents the generation of spurious constructs, and lowers the background of undigested vector DNA in the experiment. It is most convenient to perform ligation reactions directly in melted bands isolated from Low Melt agarose gels.
1. Excise the bands to be ligated from a low melting agarose gel of the appropriate concentration. Limit the UV exposure of the DNA to under 1 minute.
2. Combine the bands in a pre-weighed tube. Weigh the tube to determine the volume of agarose (assume 1mg=1µl). Melt the agarose at 65°C for 5-10 minutes, and bring to 37°C.
If the optimal ratio of the two fragments is known (i.e. 3:1 insert:vector for subcloning), the excised bands should be melted separately, and appropriate volumes combined to give the desired ratio.
3. Add an equal volume of 2X T4 ligase buffer, containing 1-2 units of T4 ligase. Mix well and ligate at 15°C overnight, or room temperature for 3-4 hours.
Protocol 2.4.4c
In Gel PCR Amplification
Although the PCR reaction is highly selective for the target DNA (Section 2.2.3) it is often beneficial to purify the template prior to amplification. In particular, if an amplification yields multiple bands, analysis of the individual bands requires separation on agarose, which is generally followed by re-amplification to provide sufficient material for analysis.
1. Run template DNA on a low melting agarose or high resolving gel of appropriate concentration. Stain with Ethidium Bromide and cut out the band of interest. Limit the time of exposure of the DNA to UV light to under 1 minute.
NB: Due to the extreme sensitivity of PCR, band contamination from adjoining lanes is highly probable. Use alternating lanes to minimize this problem.
2. Melt the DNA band at 65°C for 5-10 minutes. Add 1ml Nuclease free water for every 1µg of template DNA. Mix well.
3. 1µl of the above mixture will provide 1ng of template, which is sufficient for most amplification protocols.

66 USA: 1-800-526-3867EUROPE: 441 482 646022
Electrophoresis Applications - Gel Electrophoresis of DNA and RNAEl
ectr
opho
resi
sA
pplic
atio
ns
2.4.5 Pulsed Field and Field Inversion Gel Electrophoresis (PFGE & FIGE)Standard agarose gels can resolve DNA fragments up to 75 kb, but analysis of genomic DNA often requires resolution of megabase (mb) fragments. Fragments greater in size than one megabase all run at the same rate on agarose gels (“limiting mobility”) and are not resolved from each other. This lack of resolution is because of the mechanism of sieving in agarose (or acrylamide) gels and the rodlike shape of double stranded DNA.
To migrate through a gel, DNA must pass through a large enough pore. The size of pore required depends on both the size of the DNA molecule, and its orientation relative to the pore. Molecules oriented perpendicular to their direction of migration present their full length to a gel pore, and thus require a very open gel structure to pass through. The longer a DNA molecule, the more angled it must be to pass through the pores of the gel. Limiting mobility is reached when a DNA molecule can only pass through the gel parallel to its direction of migration, presenting its end to each successive pore. This snakelike progression is called “reptation”, and requires that the DNA maintain itself in as straight a conformation as possible. This highly ordered state is thermodynamically unfavorable, and the DNA will “relax” into a less structured conformation rapidly when conditions permit. Once relaxed, a DNA molecule requires a finite time to reorient itself for further reptation. Longer DNA mole-cules require longer times to reorient. In PFGE & FIGE this difference in reorientation time serves as the basis of the electrophoretic separation of megabase sized DNA molecules.
PFGE gels are run in a constantly changing electric field. Originally, gels were subjected to alternating voltage fields oriented at 90° to each other. Current protocols generally employ fields at 120° angles, and more complex systems use 3 or more angled voltages. In all cases, the effect is to force the DNA to continuously re-configure itself to migrate in a new direction. Larger molecules take longer to reorient and therefore make less overall progress through the gel.
FIGE is a special case of PFGE, in which the fields are oriented at a 180° offset, directly opposing each other. In this case, the voltage pulses must be of different strength or duration, so that the DNA makes some net progress through the gel. In FIGE, the timing of the voltage pulses is critical, and must be matched to the reorientation times of the DNA of interest. If the reversing pulse is too short, larger DNA molecules will not reorient, while smaller molecules will reorient and begin to migrate backward. Upon resumption of the forward field, the larger DNA’s will be able to resume reptation, while the smaller pieces will rapidly reorient, but then have to make up the distance lost through reverse mobility. The result is that longer DNA’s will migrate faster than short pieces. Most often, a progressively longer series of pulses is used, to ensure good resolution over a wide range of sizes. FIGE is easier to use than PFGE, since it can be carried out in a standard horizontal gel apparatus. FIGE’s range of size resolution is more limited- up to 2mb versus 5mb for PFGE. A number of devices and systems for PFGE are commercially available. The gel running conditions must be optimized for the sample, gel apparatus and size range to be resolved. Parameters include overall pulse lengths, the ratio between forward and lateral pulse length, pulse voltages and the ramp rate between voltages. It is impractical to provide a general protocol which begins to address these variables. The user is referred to the instruction manuals provided with the PFGE units for suggested conditions for their own particular unit.
One of the main challenges in PFGE experiments is to isolate intact DNA in the megabase size range. DNA of this length is easily sheared by turbulence in the solution. Shearing cleaves the DNA at random points, making it impossible to generate discrete bands during restric-tion digestion. A procedure has been developed in which the cells are lysed and the DNA released within an agarose block, which effectively protects the DNA from shearing forces.
AquaPor ES EC-203 AquaPor ES is a premium, ultra high strength, ultra low EEO agarose. Ideal for Pulsed Field Gel Electrophoresis (PFGE). (pg. 17)
TE Buffer (100X) EC-862 100X Concentrated solution of 1M Tris-HCl, pH 8, with 100mM EDTA. 0.2 micron filtration. (pg. 20)
Products for PFGE and FIGE
TBE 10X EC-860 Formulated with 18 MegOhm water. 0.2 micron filtration. More economical than bench-top buffers. (pg. 20)
EDTA - ULTRA PURE EC-610 Molecular biology grade EDTA. Specifications include low insolubles (<0.005%) and >99% purity. (pg. 32)
Protocol 2.4.5a
Preparing High Molecular Weight DNA for PFGE & FIGE Electrophoresis
1. ENCASE THE CELLS IN AGAROSE BLOCKS
a. Prepare a mold to cast the blocks in:
Tape 1 end of a plexiglass mold, containing slots of the same size as the wells in the gel.
Alternatives: i. Cast samples as dots of agarose on a glass or plastic surface, and cut to size. ii. Prepare a length of 2mm internal diameter Tygon tubing (~2cm/sample)
b. Prepare a solution of 1% agarose in lysis buffer:
10mM Tris HCl pH 8 100mM EDTA 20mM NaCl
c. Heat to melt the agarose and cool to 50°C.
d. Suspend the cells to be lysed in Lysis buffer at 108 cells/ml, and warm to 50°C.
e. Mix an equal volume of agarose and cell suspension, and pipette into molds (or draw up into tubing). Allow to set at 4°C. f. Recover the set plugs into 50ml centrifuge tubes.
2. LYSE THE CELLS
a. Incubate the agarose blocks in 50 volumes of lysis buffer containing 1% Sarkosyl detergent and 0.01% proteinase K, 16-24 hours at 50°C. Remove the supernatant, replace with fresh buffer/Sarkosyl/proteinase K mixture. Incubate an additional 16-24 hours at 50°C.
b. Remove lysis buffer, and wash 3 times at 50°C in 50 volumes of TE + 40 µg/ml PMSF, 1 hour each. (phenylmethyl sulfonyl/ chloride, a potent proteinase inhibitor)
Note: PMSF IS VOLATILE AND TOXIC. USE ONLY IN A FUME HOOD WITH ADEQUATE PRECAUTIONS. PMSF is inactivated after incubation at pH 9 or above for 1 hour.
3. DIGEST THE DNA
a. Equilibrate the blocks in 10 volumes of 1X restriction buffer (optimal buffer for the desired enzyme).
b. Remove the buffer and replace with 3 volumes of 1X restriction buffer containing 50 units of the appropriate enzyme. Incubate 16 hours at the digestion temperature.
c. Wash blocks for 1 hour in 50 volumes of TE @ 4°C.
4. The blocks may now be loaded directly into the PFGE wells.

67USA: 1-800-526-3867EUROPE: 441 482 646022
Electrophoresis Applications - Gel Electrophoresis of DNA and RNAElectrophoresis
Applications
2.4.6 RNA ElectrophoresisElectrophoresis of RNA presents unique challenges. Though RNA is isolated in single stranded form without complementary sequences, it must be fully denatured in order to obtain fractionation based on size. RNA molecules form complex and often very stable secondary struc-tures, which are more difficult to denature than DNA. Additionally, RNA is extremely vulnerable to degradation by RNase enzymes found either in the sample or in the process environment. Effective procedures have been developed for the isolation of intact RNA and its analysis on denaturing agarose gels. Avoiding RNase contamination is critical to the prodcedure effectiveness.
RNases are small thermostable enzymes found throughout nature. In particular, RNases are found on the surface of human skin, where they are thought to play a role in defense against retroviruses. It is therefore of paramount importance to wear gloves throughout any RNA experiment, and that any glass or plasticware possibly touched with bare hands be treated prior to use. The use of certified RNase free glassware or disposable plasticware is recommended. RNases are extremely stable enzymes. Although denatured with boiling the enzymes renature upon cooling. Therefore, heating is not an effective method for eliminating RNase from solutions. Dry heating glassware is effective, and glassware may be rendered RNase free by heating to 250°C for 4 hours. Solutions which must be rendered RNase free may be treated in several ways. The most common approach is to use DEPC (Dieth-ylpyrocarbamate). DEPC irreversibly inhibits RNase, and may then be removed by autoclaving. (NOTE: DEPC IS HIGHLY TOXIC AND VOLATILE. IT MUST BE USED ONLY IN A FUME HOOD). The limitations of DEPC are that solutions must be heated to remove the DEPC, (which would otherwise covalently modify the RNA) and that DEPC reacts with amines. Thus, to decontaminate heat labile, RNA containing or Tris buffered solutions another method must be used. Samples containing RNA are often decontaminated during extraction by treating with Guanidinium salts. Small volumes of Tris buffers are protected by adding RNase inhibitors: RNasin, a 40 kb protein or Vanadyl Ribonucleosides, which are transition state analogs which bind to and inhibit RNase.
Preparation of RNA SamplesIsolation of intact RNA from cells depends upon the rapid inactivation of the endogenous RNase released when the cells are disrupted. The protocol below—based on the system of Chomczynski and Sacchi—uses the chaotropic agent Guanidinium Isothiocyanate (GTC) to disrupt the cells and dissolve cellular protein. RNase is inactive when dissolved in GTC in combination with reducing agents, so the disrupted cellular suspension preserves the RNA intact. The solution is then phenol extracted to remove the RNase. This extraction is carried out at a pH of 4.5, at which DNA partitions into the organic phase and is removed with the RNase and other proteins. Finally, the RNA is precipitated by ethanol and collected by centrifugation.
Protocol 2.4.6a
Guanidinium Isothiocyanate Isolation of RNA1. Dissolve tissue in 10 volumes extraction solution. Tissue may be powdered
under liquid N2 or homogenized into the buffer. Cells grown in a monolayer may be scraped into 1ml extraction solution/30cm2 growth area.
Extraction Solution: 4M guanidinium isothiocyanate 25mM sodium Citrate, pH 7.0 0.5% Sarkosyl detergent 100mM 2-mercaptoethanol (use DEPC water for all stock solutions)2. To 10ml of cells in extraction solution, add: 1ml 2M sodium acetate, pH 4.5 10ml buffer saturated phenol, pH 8 2ml chloroform: isoamyl alcohol, 24:1 Mix well between each addition by inverting tube several times. Mix
complete solution 1 minute.3. Chill solution to 4°C and centrifuge at 10,000g for 20 minutes at 4°C. 4. Recover aqueous (upper) phase and precipitate with 3 volumes of ice-
cold Ethanol. Allow solution to precipitate at -20°C for 2 hours.5. Collect RNA by centrifugation at 10,000g for 30 minutes at 4°C. Recover
pellet. DO NOT ALLOW PELLET TO DRY OR IT WILL NOT REDISSOLVE.6. If desired, redissolve pellet in 0.5ml of extraction solution and repeat steps
2-5. This gives a cleaner product but with some decrease in recovery.7. Wash pellet with cold 70% ethanol.8. Air dry pellet and redissolve in DEPC water.9. Check recovery and purity - measure A260 and A280. An A260 of 1 indicates
40µg RNA/ml in the cuvette. Pure RNA has an absorbance ratio of A260/A280 of 2.0. 1.8 or better is acceptable purity for Northern Analysis or cDNA Synthesis. A ratio below 1.8 indicates a need for further purification.
Gel Electrophoresis of RNAAgarose electrophoresis of RNA requires the inclusion of denaturing agents in the gel to disrupt secondary structures and ensure the re-lationship between molecular weight and mobility. Urea—used as a denaturant in polyacrylamide gels—disrupts the hydrogen bonds which hold the agarose gel together, and alkaline conditions—used in denaturing DNA electrophoresis in agarose—hydrolyze RNA. All denaturants which could be used for RNA analysis are toxic to some extent. Methylmercuric hydroxide (MMH) reacts reversibly with amino groups on RNA, and is an effective denaturant. However, its toxicity and high volatility make its use inconvenient and hazardous. Aldehydes also react with RNA to disrupt base pairing, and are somewhat safer than MMH. Protocols are given below for using formaldehyde or glyoxal.
Protocol 2.4.6b
Formaldehyde Denatured RNA Gels
1. Cast Gel: Dissolve 1g agarose in 100ml of DI water. Heat to completely dissolve
agarose crystals, and cool to 60°C.
Add 12 ml 10X MOPS, and 3.5 ml of 37% Formaldehyde.
10X MOPS: 0.2M MOPS acetate pH 7.0 0.05M sodium acetate 10mM EDTA Mix well and pour gel. Insert comb and allow to set for 30-60 minutes.
2. Sample Preparation: Mix: 4.5 µl of RNA (containing 10-20µg RNA) 2µl 10X MOPS 3.5µl 37% formaldehyde 10µl formamide Incubate at 55°C for 15 minutes.
Add 2µl Loading Buffer: 50% glycerol 1mM EDTA 0.25% each bromophenol blue and xylene cyanol
3. Running the Gel: Run in 1X MOPS buffer at 10-20 V/cm for 2-3 hours, until bromophenol
blue is 80-90% through the gel. Recirculate MOPS buffer to prevent pH drift. Use a peristaltic pump, or stop the run every 30 minutes and transfer buffer from cathode to anode and back.
Protocol 2.4.6c
Glyoxal Denatured RNA Gels
1. Cast Gel Dissolve 1.2g agarose in 100ml of 10mM sodium phosphate, pH 6.9.
Heat to completely dissolve agarose crystals, and cool to 60°C. Inhibit RNases by adding sodium iodoacetate to 10mM. Mix well and pour gel. Insert comb and allow to set for 30-60 minutes.
2. Sample Preparation: Dissolve 10µg of RNA in 5µl of DEPC treated water. Add 6µl 6M glyoxal,
15µl DMSO, and 3µl of 0.1M sodium phosphate, pH 6.9.
Note: Glyoxal must be deionized before use. After deionization, the pH of the solution should be >5.
Incubate at 50°C for 1 hour.
Add 5µl Loading Buffer: 50% glycerol 10mM sodium phosphate, pH6.9 1mM EDTA 0.25% each bromophenol blue & xylene
cyanol
3. Running the Gel: Run in 10mM sodium phosphate, pH 6.9 at 3-5 V/cm for 3-6 hours, until
bromophenol blue is 60-80% through the gel. Recirculate the buffer to prevent pH drift. Use a peristaltic pump, and magnetic stir bars in the buffer chambers. If recirculation is insufficient, the pH of the buffer will rise to the point that the glyoxal will dissociate from the RNA.

68 USA: 1-800-526-3867EUROPE: 441 482 646022
Electrophoresis Applications - Gel Electrophoresis of ProteinsEl
ectr
opho
resi
sA
pplic
atio
ns
3 Gel Electrophoresis of Proteins
3.1 DENATURING PROTEIN ELECTROPHORESIS - SDS PAGE
Overview / Sample Preparation / Gel Preparation / Molecular Weight Determination / Peptide Mapping/ProteinPurification/GenerationofAntibodies
3.2 NATIVE PROTEIN PAGE Overview / Sample Preparation / Gel Preparation /
Activity Stains / Immuno Electrophoresis
3.3 2-DIMENSIONAL PROTEIN ELECTROPHORESIS
Isoelectric focusing
Protein Electrophoresis...The Express Lane
Proteins, unlike nucleic acids, present the researcher with a variety of chemical characteristics. Proteins fold into complex secondary, tertiary & quaternary structures. Their surfaces may be hydrophobic (membrane proteins) or hydrophilic, with greater or lesser distributions of charge and reactive groups. Electrophoresis
techniques have been developed to take advantage of many of these characteristics, separating proteins on the basis of size, subunit composition, charge/mass ratio, isoelectric point, or combinations thereof. The vast majority of these techniques are carried out in polyacrylamide gels, which have pore sizes well matched to the usual range of protein molecular weights, generally from 5 - 150 kDa. Larger complexes are separated on high percentage (2-4%) agarose gels.
Separations are generally carried out in a vertical slab gel apparatus (see Section 1.5.2). This system allows the use of discontinuous buffers (which sharpen bands), more precise control of electrical parameters, and the exclusion of O2 from the polymerizing gel, which is required for polyacrylamide applications. Vertical gels are also thinner than horizontal gels of similar well capacity, which reduces staining times, often an issue in protein detection protocols. Vertical gels are poured between two glass plates, one of which is 1-2 cm shorter than the other. The plates are separated by spacers which determine gel thickness. A comb is inserted into the top of the gel mold after filling, to form sample wells. 0.75-2mm thick gels are generally selected for routine use. Thicker gels sacrifice resolution, as run anisotropies are exaggerated across thick gels. Thinner gels give excellent resolution, but their mechanical fragility is a nuisance. After casting, gels are clamped into an apparatus which places the top and bottom of the gel in contact with upper & lower buffer chambers. Samples are loaded (after comb removal) and voltage is applied. After the run, the apparatus is disassembled and the gel processed for detection of protein bands (see Section 4.2). Gels can be run in “full size” (16 x 30 cm or larger) or “mini” (8 x 10 cm) formats.
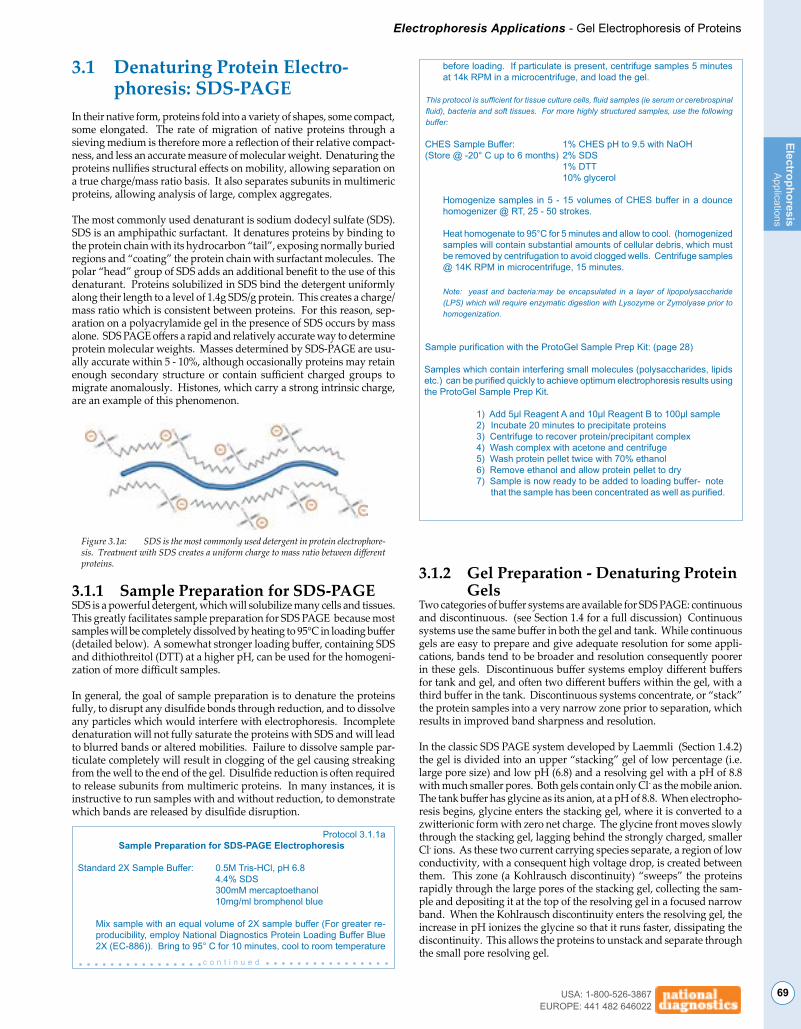
69USA: 1-800-526-3867EUROPE: 441 482 646022
Electrophoresis Applications - Gel Electrophoresis of ProteinsElectrophoresis
Applications
before loading. If particulate is present, centrifuge samples 5 minutes at 14k RPM in a microcentrifuge, and load the gel.
This protocol is sufficient for tissue culture cells, fluid samples (ie serum or cerebrospinal fluid), bacteria and soft tissues. For more highly structured samples, use the following buffer:
CHES Sample Buffer: 1% CHES pH to 9.5 with NaOH(Store @ -20° C up to 6 months) 2% SDS 1% DTT 10% glycerol Homogenize samples in 5 - 15 volumes of CHES buffer in a dounce
homogenizer @ RT, 25 - 50 strokes.
Heat homogenate to 95°C for 5 minutes and allow to cool. (homogenized samples will contain substantial amounts of cellular debris, which must be removed by centrifugation to avoid clogged wells. Centrifuge samples @ 14K RPM in microcentrifuge, 15 minutes.
Note: yeast and bacteria:may be encapsulated in a layer of lipopolysaccharide (LPS) which will require enzymatic digestion with Lysozyme or Zymolyase prior to homogenization.
Sample purification with the ProtoGel Sample Prep Kit: (page 28)
Samples which contain interfering small molecules (polysaccharides, lipids etc.) can be purified quickly to achieve optimum electrophoresis results using the ProtoGel Sample Prep Kit.
1) Add 5μl Reagent A and 10μl Reagent B to 100μl sample 2) Incubate 20 minutes to precipitate proteins 3) Centrifuge to recover protein/precipitant complex 4) Wash complex with acetone and centrifuge 5) Wash protein pellet twice with 70% ethanol 6) Remove ethanol and allow protein pellet to dry 7) Sample is now ready to be added to loading buffer- note
that the sample has been concentrated as well as purified.
3.1.2 Gel Preparation - Denaturing Protein GelsTwo categories of buffer systems are available for SDS PAGE: continuous and discontinuous. (see Section 1.4 for a full discussion) Continuous systems use the same buffer in both the gel and tank. While continuous gels are easy to prepare and give adequate resolution for some appli-cations, bands tend to be broader and resolution consequently poorer in these gels. Discontinuous buffer systems employ different buffers for tank and gel, and often two different buffers within the gel, with a third buffer in the tank. Discontinuous systems concentrate, or “stack” the protein samples into a very narrow zone prior to separation, which results in improved band sharpness and resolution.
In the classic SDS PAGE system developed by Laemmli (Section 1.4.2) the gel is divided into an upper “stacking” gel of low percentage (i.e. large pore size) and low pH (6.8) and a resolving gel with a pH of 8.8 with much smaller pores. Both gels contain only Cl- as the mobile anion. The tank buffer has glycine as its anion, at a pH of 8.8. When electropho-resis begins, glycine enters the stacking gel, where it is converted to a zwitterionic form with zero net charge. The glycine front moves slowly through the stacking gel, lagging behind the strongly charged, smaller Cl- ions. As these two current carrying species separate, a region of low conductivity, with a consequent high voltage drop, is created between them. This zone (a Kohlrausch discontinuity) “sweeps” the proteins rapidly through the large pores of the stacking gel, collecting the sam-ple and depositing it at the top of the resolving gel in a focused narrow band. When the Kohlrausch discontinuity enters the resolving gel, the increase in pH ionizes the glycine so that it runs faster, dissipating the discontinuity. This allows the proteins to unstack and separate through the small pore resolving gel.
3.1 Denaturing Protein Electro- phoresis: SDS-PAGEIn their native form, proteins fold into a variety of shapes, some compact, some elongated. The rate of migration of native proteins through a sieving medium is therefore more a reflection of their relative compact-ness, and less an accurate measure of molecular weight. Denaturing the proteins nullifies structural effects on mobility, allowing separation on a true charge/mass ratio basis. It also separates subunits in multimeric proteins, allowing analysis of large, complex aggregates.
The most commonly used denaturant is sodium dodecyl sulfate (SDS). SDS is an amphipathic surfactant. It denatures proteins by binding to the protein chain with its hydrocarbon “tail”, exposing normally buried regions and “coating” the protein chain with surfactant molecules. The polar “head” group of SDS adds an additional benefit to the use of this denaturant. Proteins solubilized in SDS bind the detergent uniformly along their length to a level of 1.4g SDS/g protein. This creates a charge/mass ratio which is consistent between proteins. For this reason, sep-aration on a polyacrylamide gel in the presence of SDS occurs by mass alone. SDS PAGE offers a rapid and relatively accurate way to determine protein molecular weights. Masses determined by SDS-PAGE are usu-ally accurate within 5 - 10%, although occasionally proteins may retain enough secondary structure or contain sufficient charged groups to migrate anomalously. Histones, which carry a strong intrinsic charge, are an example of this phenomenon.
Figure 3.1a: SDS is the most commonly used detergent in protein electrophore-sis. Treatment with SDS creates a uniform charge to mass ratio between different proteins.
3.1.1 Sample Preparation for SDS-PAGESDS is a powerful detergent, which will solubilize many cells and tissues. This greatly facilitates sample preparation for SDS PAGE because most samples will be completely dissolved by heating to 95°C in loading buffer (detailed below). A somewhat stronger loading buffer, containing SDS and dithiothreitol (DTT) at a higher pH, can be used for the homogeni-zation of more difficult samples.
In general, the goal of sample preparation is to denature the proteins fully, to disrupt any disulfide bonds through reduction, and to dissolve any particles which would interfere with electrophoresis. Incomplete denaturation will not fully saturate the proteins with SDS and will lead to blurred bands or altered mobilities. Failure to dissolve sample par-ticulate completely will result in clogging of the gel causing streaking from the well to the end of the gel. Disulfide reduction is often required to release subunits from multimeric proteins. In many instances, it is instructive to run samples with and without reduction, to demonstrate which bands are released by disulfide disruption.
Protocol 3.1.1aSample Preparation for SDS-PAGE Electrophoresis
Standard 2X Sample Buffer: 0.5M Tris-HCl, pH 6.8 4.4% SDS 300mM mercaptoethanol 10mg/ml bromphenol blue
Mix sample with an equal volume of 2X sample buffer (For greater re-producibility, employ National Diagnostics Protein Loading Buffer Blue 2X (EC-886)). Bring to 95° C for 10 minutes, cool to room temperature
c o n t i n u e d

70 USA: 1-800-526-3867EUROPE: 441 482 646022
Electrophoresis Applications - Gel Electrophoresis of ProteinsEl
ectr
opho
resi
sA
pplic
atio
ns
Protocol 3.1.2b
Casting Tris-Tricine Gels
Discontinuous SDS-PAGE employing Tris-Glycine as the tank buffer, the Laemmli system as described in Protocol 3.1.2a above, resolves proteins down to about 15 kd. However, below this size, the proteins do not “destack” from the SDS micelles running through the gel with the buffer front. In order to resolve proteins in this size range, the Tris-Tricine system of Schagger and von Jagow (1987) was developed.
An Alternative to the Schagger and von Jagow SystemRunning Tris-Tricine Gels using National Diagnostics
10X Tris-Tricine-SDS Buffer (EC-869)
With National Diagnostics Tris-Tricine-SDS, you can extend the range of SDS-PAGE to resolve smaller proteins with minimal alteration of protocol. To provide this level of convenience, National Diagnostics streamlined the original method of Shaggar and Von Jagow (Anal. Biochem 1987 166, 368-79) by developing Tris-Tricine-SDS cathode tank buffer to be compatible with the standard Laemmli gel/buffer system. This combination resolves proteins as small as 5kD. The researcher simply substitutes National Diagnostics Tris-Tricine-SDS in the upper (cathode) tank, with no other changes from protocol 3.1.2a, to extend the resolution of their gels.
The Original Schagger and von Jagow System
Tricine gels are poured in the same manner as Tris-Glycine gels (Protocol 3.1.2a), but the stacking and resolving gels are poured using the same buffer concentrate:
Buffer Concentrate: 3.0M Tris-HCl, pH8.5 0.3% SDS
Resolving gel: 17ml Buffer Concentrate 17ml ProtoGel 12ml H20 5ml Glycerol
Stacking gel: 3ml Buffer Concentrate 1.6ml ProtoGel 7.5ml H2O
Polymerize as described for discontinuous protein gels in Protocol 3.1.2a, and run with 0.2M Tris-HCl pH 8.9 in the lower chamber, and 0.1M Tris, 0.1M Tricine and 0.1% SDS in the upper chamber.
Table 3.1.2a
Resolving Gel Formulation
%gel
METHOD 1Volume of ProtoGel,
ProtoGel Buffer to use
METHOD 2Volume of ProtoGel,and reagents to use
ProtoGel: 20.0ml 1.5 M Tris-HCl (pH 8.8): 25.0ml 10% SDS: 1.0ml Deionized H2O: 52.9ml
ProtoGel: 20.0ml ProtoGel Buffer: 25.0ml Deionized H2O: 53.9ml
6%
OR
ProtoGel: 26.7ml 1.5 M Tris-HCl (pH 8.8): 25.0ml 10% SDS: 1.0ml Deionized H2O: 46.2ml
ProtoGel: 26.7ml ProtoGel Buffer: 25.0ml Deionized H2O: 47.2ml
8%
ProtoGel: 33.3ml 1.5 M Tris-HCl (pH 8.8): 25.0ml 10% SDS: 1.0ml Deionized H2O: 39.6ml
ProtoGel: 33.3ml ProtoGel Buffer: 25.0ml Deionized H2O: 40.6ml
10%
ProtoGel: 40.0ml 1.5 M Tris-HCl (pH 8.8): 25.0ml 10% SDS: 1.0ml Deionized H2O: 32.9ml
ProtoGel: 40.0ml ProtoGel Buffer: 25.0ml Deionized H2O: 33.9ml
12%
ProtoGel: 50.0ml 1.5 M Tris-HCl (pH 8.8): 25.0ml 10% SDS: 1.0ml Deionized H2O: 22.9ml
ProtoGel: 50.0ml ProtoGel Buffer: 25.0ml Deionized H2O: 23.9ml
15%
Size Range
(kd)
60-200
40-140
20-80
15-70
15-50
Stacking Gel Formulation
ProtoGel: 2.6ml 0.5 M Tris-HCl (pH 6.8): 5.0ml 10% SDS: 0.4ml Deionized H2O: 11.8ml
ProtoGel: 2.6ml ProtoGel Stacking Buffer: 5.0ml Deionized H2O: 12.2ml
ProtoGel EC-89030% solution of Acrylamide and BisAcrylamide, 37.5:1 ratio. Filtered, Deionized, and Stabilized. (pg. 8)
Tris-Glycine-SDS (10X) EC-870 ProtoGel Resolving Buffer (4X) EC-892ProtoGel Stacking Buffer (4X) EC-893Formulated with 18 MegOhm water. 0.2 micron filtration. Used in combination with ProtoGel to produce clear, reproducible, SDS-PAGE gels. (pg. 18)
Ammonium Persulfate EC-504 Exceeds ACS Standards. Low absorbed water results in consistent initiating capabil-ities. (pg. 32)
TEMED EC-503 Fractionally distilled twice to remove absolutely all inhibitory and fluorescent contaminants. (pg. 33)
Products for Denaturing Protein Electrophoresis
Insite Markers EC-897 Combined visible markers for run-time ori-entation and unstained protein standards for fluorescent detection. (pg. 27)
ProtoStain Blue EC-727Easy-to-Use colloidal Coomassie stain. Detects as little as 1ng of protein per band. (pg. 21)
Protein LoadingBuffer Blue 2X EC-886 Ready to use buffer solution for the preparation of samples for SDS-PAGE. (pg. 18)
Protocol 3.1.2a
Casting a Discontinuous SDS-PAGE Gel (The Laemmli System)
1. Prepare resolving gel and stacking gel casting solutions. Table 3.1.2a gives the formulations for SDS-PAGE resolving gels from 6 - 16% as well as the formulation for the stacking gel.
Formulate enough resolving gel solution to fill the cassette and formu-late 1/5 that amount of stacking gel solution. De-gas the solutions for optimum reproducibility. To de-gas, stir the solution under aspiration for 10 minutes at room temperature.
2. Pour the resolving gel:
Add 1.0ml of fresh 10% Ammonium Persulfate solution for every 100ml of casting solution. Swirl gently to mix. Add 0.1ml of TEMED for every 100ml of casting solution. Swirl gently to mix. Pour the solution into the gel cassette. Fill the cassette to a level which will allow the comb to be inserted with 5mm between the bottom of the wells and the top of the resolving gel. Overlay the gel with 1-2mm of water saturated n-butanol to exclude O2 and ensure a flat interface between the resolving and stacking gels. Allow the gel to polymerize for 30 minutes. A line will become visible at the top of the gel as it polymerizes.
3. Pour the stacking gel:
Rinse the butanol from the top of the gel with water, and drain the water by inverting the gel. Add 0.2 ml of 10% APS and 20 µl TEMED for every 20 ml of stacking gel solution and fill the top of the cassette with this mixture. Insert the comb until the teeth are 5mm from the resolving gel. The comb should rest so that the tops of the well dividers are level with the top of the short plate. This excludes oxygen while ensuring that the dividers will fully separate the wells. Allow the stacking gel to polymerize for 30-60 minutes. Run the gel in 1X Tris-Glycine SDS.

71USA: 1-800-526-3867EUROPE: 441 482 646022
Electrophoresis Applications - Gel Electrophoresis of ProteinsElectrophoresis
Applications
Gradient GelsGradient gels are cast with a higher concentration of acrylamide at the bottom than the top. The applications of gradient gels include the deter-mination of protein molecular weights and the separation of molecules which co-migrate on uniform gels. The use of these gels is described in Section 3.1.3. Casting of gradient gels requires a gradient forming apparatus, and is more labor intensive than casting uniform percentage gels. For these reasons, precast gradient gels have become very popular.
Multiple gel casting units are available, particularly for mini-gel systems. The solutions given below are sufficient for 1 gel, and can be scaled up as appropriate for multi-gel casters. Similarly, the protocol given is for casting one gradient gel. For multi-gel systems, follow the instructions provided with the unit.
2. PREPARE THE CASTING APPARATUS
a. Assemble the gel cassette. Seal the bottom per manufacturer’s instruc-tions, or use a molten solution of 1% agarose, allowing it to penetrate the bottom of the cassette by capillary action to a depth of 1 - 2 mm.
b. Place gradient maker on a stirring stand so that the bottom of the chambers are higher than the top of the gel cassette. Place a stir bar in each chamber. Attach a narrow bore tygon tube to the outflow. Attach a pipette tip to the other end of the tube, and clamp into position so that outflow is directed into the cassette from the top center. Angle cassette slightly to allow the solution to run down the tall plate.
c. Close the stopcock between the gradient maker chambers and the outlet from the gradient maker. Place the low % gel solution into the non-outlet (reservoir) side of the gradient maker. Open the stopcock between the two chambers and allow 0.1 - 0.3 ml of solution to flow through to clear any bubbles.
d. Place the high % gel solution into the outlet side (mixing chamber) of the gradient chamber. The next steps must be carried out rapidly, to avoid polymerization of the solutions before the gel is fully cast.
e. Start mixing in the gradient maker.
3. CAST THE GEL
a. Add the specified amounts of APS & TEMED to each chamber. (Per 100ml of casting solution, add 1.0 ml of 10% APS and 0.1 ml TEMED.)
b. Open the stopcock between chambers. Some backflow into the low % reservoir may occur, due to the density variation between the solu-tions. It will not substantially alter the final gradient. Open the outlet, at a flow rate to drain the solutions in 5 - 8 minutes. Faster flow will cause a turbulence in the gel which will disrupt the gradient. Slower flow rates allow polymerization to occur before pouring is complete.
c. When all of the solution is dispensed, remove the pipette tip from the top of the cassette. Overlay the gel with water saturated n-Butanol. Flush the gradient apparatus immediately with water to prevent polymerization within the system.
d. After 1 hour, cast a stacking gel as detailed in Protocol 3.1.2a.
Notes: A peristaltic pump may be used to regulate the flow from the gradient maker. Gradient gels without stacking gels may be stored up to 1 week. Mul-tiple gel casters are available from many manufacturers. Specific protocols optimal for each system are provided with the equipment.
Gradient Casting Apparatus The gradient is formed with a gradient-maker. The gradient maker must be positioned above the gel cassette to encourage flow due to gravity, or it can be emptied through a peristaltic pump. Gradient makers consist of 2 containers, joined by a narrow connector at their bases, with one container (A) having also an additional outlet in its base. As liquid is drained from (A), it is replaced from (B) due to the equilibration of hydrodynamic pressure which keeps the levels in (A) and (B) equal. (A) is constantly stirred, which causes the solution draining from (A) to be progressively diluted with (B) until, when the gradient maker is emptied, the outflowing material is essentially 100% B. Various shapes of gradients can be generated by varying the geometry of the system. In casting gradient gels, acrylamide monomer solutions are placed in the gradient maker, corresponding to the highest and lowest acrylamide percentages desired in the gel. Table 3.1.2b below gives suggested ranges of percentages for various protein size ranges. Table 3.1.2c gives for-mulations to produce the high and low percentage solutions needed to generate these gels. Sucrose is added to the high percentage gel solution to create a density gradient, which stabilizes the gel while it polymerizes, allowing more reproducible gradients between gels.
Protocol 3.1.2cPouring a Gradient Gel
Figure 3.1.2a A gradient maker. As the apparatus empties, the composition of the out-flowing solution becomes progressively closer to the contents of B.
Separation Ranges of Gradient Gels
Size Range(kDa)Gel %
20-200
10-200
10-100
8-150
6-150Table 3.1.2b
5-15
5-20
8-15
8-20
10-20
1. PREPARE THE HIGH AND LOW PER-CENTAGE GEL SOLUTIONS
Table 3.1.2b gives suggested gel compo-sitions for various ranges of protein size. Table 3.1.2c gives formulations for the high and low percentage solutions to make these gels. Each solution will account for 1/2 of the total gel volume. To prepare a gradient which fully covers the desired range, both solutions must be completely consumed. The high percentage solution is subject to polymerization after APS addition, even in the absence of TEMED. For this reason, do not add APS until ready to pour the gel. Do not de-gas the solu-tions (de-gassing removes polymerization inhibiting O2) and keep the solutions cold prior to APS addition.
Gel %
Gradient Gel Component Solutions
Monomer %Deionized
Water (ml)
Sucrose(g)
5
6
8
10
10
12
15
20
3.3
4.0
5.3
6.7
6.7
8
10
13.3
5
5
5
5
5
5
5
5
Upp
er S
olut
ions
Low
er S
olut
ions
-
-
-
-
3
3
3
3
11.6
11
9.7
8.3
6.7
5.3
3.3
0
Table 3.1.2c
ProtoGel(30% 37:1
Acrylamide:MBA)(ml)
ProtoGel Buffer(1.5M Tris-HCl, pH8.8,
0.4% SDS)(ml)

72 USA: 1-800-526-3867EUROPE: 441 482 646022
Electrophoresis Applications - Gel Electrophoresis of ProteinsEl
ectr
opho
resi
sA
pplic
atio
ns
Applications of Denaturing Protein Electrophoresis3.1.3 Measuring Molecular WeightThe mobility (Rf) of a molecule in gel electrophoresis is determined by its free solution mobility, Y0 (= mobility in a gel of zero %) and the sieving action of the gel matrix. In denaturing protein electrophoresis, the addition of SDS to the electrophoresis buffer uniformly coats the proteins with negative charges, equalizing the charge to mass ratio for all proteins, thus making Y0 the same for all species. In this case, relative mobilities are determined solely by the sieving action of the gel. This sieving action is proportional to the molecular weight (MW) of the particular protein. Theoretical treatments suggest that log(Rf) should vary with MW, but most users use an empirical plot of log(MW) vs Rf for several standards of known MW to determine the MWs of unknowns.
In practice the proportionality of log(MW) vs Rf holds true for most pro-teins, provided they are fully denatured, and provided the gel percentage has been chosen to match the molecular weight range of the sample. In fact, the actual plot of log(MW) vs Rf is sigmoidal (Figure 3.1.3a), because at high MW, the sieving affect of the matrix is so large that molecules are unable to penetrate the gel, while at low MW, the sieving effect is negligible, and proteins migrate almost at their free mobility, which in SDS is independent of MW. Given an appropriate selection of gel % (see Table 3.1.2a) and a protein which displays near-ideal behavior, molec-ular weights can be determined to within 5 - 10%. Molecular weights of non-ideal proteins can be determined by the use of Ferguson plots, discussed in Section 3.2.
3.1.4 Peptide MappingPeptide mapping involves controlled cleavage of a pure protein with small amounts of a pure protease to generate peptides of characteristic, reproducible sizes. These peptides can be separated on PAGE to produce a “fingerprint” characteristic of the protein. Peptide mapping can map cleavage sites in an unknown protein, or it can identify an unknown pro-tein based upon its fingerprint identity with a previously tested sample.
The polyacrylamide gel used can be either denaturing or non-denaturing, but SDS PAGE is most often used because it gives molecular weight information about the peptides produced. Small amounts of protease are used, so that minor variations in time and temperature of incubations will not overly perturb the results.
Proteins for peptide mapping can be taken from bands sliced out of elec-trophoresis gels, or purified by standard means. Protocols are provided for the mapping of a pure protein and a protein in an acrylamide gel.
Figure 3.1.3a Although the overall graph of logMW vs. Rf is sigmoidal, it is nearly linear for a range of molecular weights depending on the percentage monomer of the gel.
Figure 3.1.3b With gradient gels log MW and log Rf are directly proportion-al over a broad range of values.
Gradient SDS GelsIf a gradient of acrylamide concentration is introduced into SDS PAGE, larger ranges of proteins may be analyzed on the same gels, with great-er resolution. The complexity of the relationship between migration and molecular weight is dependant upon the shape of the gradient. The overall equation is of the form log(MW) α log(P), where P is the concentration of Acrylamide at the band position. A graph of log(MW) vs log(P) is linear, and allows the determination of MW’s from a set of standard protein positions. For linear gradient gels, the percentage of acrylamide is proportional to the position in the gel, so log(MW) will be proportional to log(band position). Therefore, a graph of log(MW) vs log(Rf) for a set of standards will be linear, and Rf values for unknowns can then be converted to MW values. On a 3 - 30% gradient gel, a range of proteins which differ in MW by up to 100 fold can be resolved and MWs determined. (Figure 3.1.3b).
Proteases for Use in Peptide Mapping
ProteaseFinal Conc.
(µg/ml)pH opti-
mum
Trypsin
Papain
Chymostrypsin
Elastase
Staph. Aureus ProteaseV8
Specificity
5-20
10-20
50-100
50-100
50-100
7-9
6-7
7-8
7-9
4-8
Arg, Lys
Arg,Lys,Gln,His,Gly,Tyr
Aromatic
Uncharged Aliphatic
Asp, Glu
Table 3.1.4a
Protocol 3.1.4a
Peptide Mapping - Purified Protein
1. Dissolve protein to 0.5mg/ml in digestion buffer; heat to 100°C for 2 min.
Digestion Buffer: 0.125M Tris HCl pH 6.8 0.5% SDS 10% glycerol 0.0001 % Bromphenol blue (BPB)
2. Cool to 37°C and digest with protease for 30 minutes (see Table 3.1.4a for enzymes and amounts).
3. Stop digestion by adding SDS to 2% (1/10 vol of 20% SDS) and 2-Mer-captoethanol to 10% and heating to 100°C for 2 minutes.
4. Load 10 - 15 - 20 µl (5 -10 µg) on a 10 - 15% SDS PAGE gel for analysis.
Protocol 3.1.4b
Peptide Mapping - Protein in a Gel Slice
1. Stain and destain as quickly as possible to avoid acid hydrolysis artifacts.
2. Cut out band of interest (containing 1-10µg of protein) and rinse slice in cold deionized water. Cut slice to the width of a well, because it will be loaded into the analytical gel.
3. Soak slice in 1X stacking gel buffer (see Protocol 3.1.2a) and 1 mM EDTA.
4. Place slice at the bottom of a well in the analytical gel (use a spatula or loading tip to place slice)
NB: The analytical gel for this protocol must have a stacking gel of at least 3 cm, to allow a space for digestion to occur.
5. Overlay slice with stacking gel buffer + 20% glycerol.
6. Overlay this with 10 µl of stacking buffer + 10% glycerol + protease + 0.01% bromophenol blue
7. Run samples into stacking gel. When the tracking dye reaches the bottom of the stacking gel, turn off voltage for 30 minutes to allow digestion to occur. Then continue run as usual.
Note that smaller amounts of radiolabeled protein can be analyzed by this method.

73USA: 1-800-526-3867EUROPE: 441 482 646022
Electrophoresis Applications - Gel Electrophoresis of ProteinsElectrophoresis
Applications
Protocol 3.1.5a
Crush and Soak Method for Recovering Proteins fromSDS-PAGE Gels
Note: Staining of proteins in SDS PAGE gels generally involves “fixing” the gel by denaturing the proteins with acid and/or organis solvents. This denaturation prevents recovery by the crush and soak method. To recover proteins from SDS-PAGE gels, use the guide strip technique (page 89), then use the protocol below on the excised, unstained gel fragment.
1. Macerate or cut gel slice into pieces less than 1mm in any dimension, in a microcentrifuge tube. The smaller the gel fragments, the faster
and more complete the elution will be.
2. Add 50 microliters of desired buffer to the tube. Adjust the volume of buffer as needed, so that the gel slice constitutes no more than 25% of the total volume in the tube. The protein will equilibrate between the gel slice and the buffer, so the percentage of total volume made up of added buffer is the maximum percentage recovery that may be expected.
3. Soak at 4oC. Recovery increases with soaking time: For 50% recovery, soak for 2-3 hours. For >80% recovery, soak 8 hours or overnight.
4. Gel fragments can be removed by filtration or centrifugation, or the supernatant can be pipeted off of the fragments.
Protocol 3.1.5b
MALDI-MS Analysis of Samples Recovered from SDS-PAGE Gels
1. If necessary, concentrate small amounts of eluted protein by ultrafiltration on a Millipore UltraFree microcentrifuge filter (or equivalent), until the protein concentration is at least 1-5 pmol/microliter.
2. For the most consistent results across the sample spot, use the “crushed crystal” technique of sample spotting:
a. Make up a matrix solution of 50% Acetonitrile, 0.1% TrifluoroAcetic acid, saturated with Sinnapinic Acid (~40 mg/ml)
b. Spot 1 microliter of this solution on the MALDI sample plate, and allow to dry. Crush the resulting crystals by covering them with a glass microscope slide, and applying gentle pressure with the eraser end of a pencil. Remove the slide and gently brush off any loose crystals with a kimwipe, or blow them off with a stream of dry compressed air.
c. Mix one part protein sample with 4 parts of the above matrix solution, and spot 1 microliter of this mixture onto the crushed crystals. Allow the sample to dry, and proceed with MALDI-MS analysis.
Protocol 3.1.5c
Purification of Proteins from Denaturing PAGE by Electroelution
Electroelution in small volumes of low levels (<20mg) of protein requires specialized equipment. For these applications, it is recommended that the protocols provided with the equipment be used.
Analytical gels for peptide mapping:The choice of gel system for the analysis of peptide mapping is dictated by the anticipated results. If a wide range of peptide sizes is anticipated, a gradient gel may be required. For peptides over 7 kDa, standard Tris Glycine SDS PAGE gels give superior results. Small peptides will require strongly denaturing fixatives to avoid loss of signal during staining (Section 4.2.1). For extremely small peptides, analysis on native PAGE gels (Section 3.2) may be superior. In native protein PAGE, separation is based partly on charge to mass ratio. This can enable the resolution of peptides that would run too close to the SDS/dye front in SDS PAGE.
3.1.5 ProteinPurificationusing Denaturing ElectrophoresisThe high resolution achievable with SDS PAGE means that the bands of protein visualized on the gel are (usually) extremely pure. Although the amount of protein which can be fractionated and recovered from a gel is relatively small (10 - 50 mg on large scale preparative gels, < 50µg on analytical or mini gels), enough can be recovered for a variety of purposes including amino acid analysis, antibody inductions , peptide mapping, microsequencing, and mass spectroscopy analysis.
The challenge in recovering proteins from gel excisions is to overcome one of the forces which allowed the proteins to be separated in the first place, the sieving nature of the gel matrix. Due to the close agreement between pore size and protein size, passive diffusion in and out of the gel is extremely slow. As a consequence, external force must be exerted on the protein molecules to cause them to migrate out of the matrix or the gel must be altered itself. In the most basic technique, simple elution or “crush and soak”, the gel is broken, cut, ground or otherwise reduced to pieces < 1mm3 in size. This multiplies the surface area of the gel while maintaining a constant volume. With a greatly increased surface area to volume ratio, the concentration gradient between protein in the gel and protein in the elution buffer is strong enough to produce a realistic effusion rate.
Though mechanically simple, the crush and soak technique has tradition-ally produced low yields (10 - 60%) requiring long incubations. Radical improvement with crush and soak can be obtained using the National Diagnostics Insite System for protein visualization (EC-759). The Insite System is an in-gel fluorescent stain for proteins, providing excellent sensitivity (10ng) more quickly than any other detection method. The Insite stain runs with the proteins during electrophoresis. No staining step is required after electrophoresis (only a short destain in water). Because no methanol or acetic acid is employed, the proteins are not fixed to the gel. Proteins visualized with Insite may be recovered by crush and soak at >80% yield after 8 hours soaking time.
Although more complex and requiring special equipment, electroelution is a rapid, efficient technique, which essentially electrophoreses the protein out of the gel slice into the surrounding buffer. Because proteins require little time to migrate the 1 - 2 mm width of a slice, electroelution is fast, and usually yields from 70 - 90% recovery.
For all techniques, processing of the gel prior to extraction can have a profound effect on sample recovery. Most staining techniques involve fixing, or denaturing of the protein bands (Section 4.2.1). Fixed proteins are insoluble precipitates, difficult if not impossible to recover. Fixation of the desired protein can be avoided by use of National Diagnostics’ Insite for detection or by use of the guide strip technique (Section 4.2.2), in which a duplicate lane is run and stained to provide a template for band excision from the unstained lane. If large amounts of protein are present, bands may be visualized without staining, using UV light at 302nm or by precipitating the protein-SDS complex with potassium or by chilling to 4OC. If fixing is unavoidable, recoveries can usually be enhanced by including SDS or Urea in the elution buffer, to redissolve the protein aggregates.

74 USA: 1-800-526-3867EUROPE: 441 482 646022
Electrophoresis Applications - Gel Electrophoresis of ProteinsEl
ectr
opho
resi
sA
pplic
atio
ns
Protein PrecipitationResearchers in proteomics often find themselves caught between two opposing forces. On the one hand, manipulation and detailed analysis of individual proteins requires fairly pure protein, concentrated in a small volume. On the other hand, most protein purification procedures involve dilution, sometimes by a factor of 1000 fold or more. In addition, many protein samples contain multiple protein species, and are very dilute to start with. Dilution not only makes analysis difficult, it also destabilizes many proteins, due to surface denaturation. Thus, one of the most commonly encountered challenges in the proteomics lab is the efficient concentration of a dilute protein solution. Concentration of protein samples is not only useful in and of itself- most concentration procedures also discriminate between proteins and small molecules such as buffers. Concentrating a protein sample thus also offers the opportunity to change the buffer composition. This becomes important for handling effluents from column purifications, in particular ion exchange columns. These columns are generally eluted with a salt gradient. This leaves the sample in a large volume of high salt buffer- concentration of the sample, if done properly, will leave the researcher with a small volume of highly concentrated protein in a buffer appropriate to further manipulations.
Concentration of proteins is generally accomplished by filtration, dial-ysis, or precipitation. Each of these techniques has its own advantages and drawbacks. Dialysis, for example, can be made to serve as a means of concentrating a protein sample, by dialyzing against a high molecular weight polymer which cannot penetrate the membrane. Water will diffuse out of the bag in an attempt to equalize the water activity on either side. While this can be effective, it is extremely slow, and leads to the loss of peptides smaller than the cutoff of the membrane (typically around 12,000 daltons). Also, the polymers used are often polydisperse, and smaller molecules can diffuse into the sample, posing a problem later in processing.
Ultrafiltration, accelerated by gas pressure or centrifugation, is a popular method for concentrating protein solutions. This technique uses membranes of defined pore size, allowing only molecules below a set size to penetrate. Membranes are available with cutoffs as low as 3000 Da, allowing the retention and concentration of even fairly small proteins. Ultrafiltration devices which fit into microcentrifuges make concentration by this method rapid and efficient. However, the cost of such devices, losses of protein bound to the membrane, and the loss of smaller peptides limit the application of this technique to a subset of the total possible samples.
Precipitation of proteins is a rapid, inexpensive and simple method of recovering proteins from dilute solutions. Proteins may be induced to aggregate into complexes of greater density than the surrounding solution by the addition of organic solvents, salts or other agents. The precipitating agent must be chosen with care to achieve the desired re-sult: some solvents, for example, will fail to precipitate smaller proteins, while trichloroacetic acid (TCA) is harshly denaturing, and unsuitable for applications requiring downstream activity or native structure retention. An ideal precipitating agent would be efficient, in that it would bring down even small amounts of protein from dilute solutions. It would be comprehensive, precipitating all proteins from a given mixture, pre-serving their relative proportions by having similar percent recoveries for all. And it would be non-destructive to the proteins, preserving as much structure as possible for downstream investigations. A table comparing the advantages and disadvantages of the more com-monly used protein precipitation methods is shown below.
Protein Precipitation Methods
Mode of Action
“Salting out”,entropichydrophobicinteractions
Acidicdenaturation
Solvents - van der Waals, electrostatic and dipole forces
Protein to ProteinVariabiliy
High: Each protein has its own optimum salt concentration
Minimal: Essentially universal
Moderate: Some hydrophobic proteins may be soluble
Speed
Slow: 1-2 hours for reproducible results
Rapid: Under 30 minutes
Rapid: Under 30 minutes
Table 1.1a
Recovery
Variable: 50-90% depend-ing on protein mixture and starting concentration
Very good: Often used for quantitative labeling studies
Variable: Some smaller proteins may be lost
Comments
Simple and non-hazard-ous, but requires strict control of all variables
Destructive to protein structure, very robust in terms of recovery and reproducibility
Easy and fairly gentle but with variable results for small proteins in particular
Effect on Proteins
Gentle: Stabilizes precipi-tated proteins
Harsh: Strong acid denaturation can modify structure or hydrolyze backbone
Moderate: May cause denaturation due to inversion of hydrophobic areas
Precipitant
AmmoniumSulfate
Co-precipitation Minimal: Essentially universal
Rapid: Under 30 minutes
Excellent: Greater than 90% in most cases
Universal, gentle method
Moderate: Immunospecificity preserved, although not en-zyme activity in many cases
NationalDiagnostics ND Protein Precip-itation Kit
Reduction in the activity of water
High: Varies strongly with the hydrophobicity of proteins
Slow: Requires 1-2 hours for full equilibrium
Variable Optimum con-ditions must be worked out for each experimen-tal system
Gentle: Does not denature most proteins
PolyethyleneGlycols/polymers
TCA (+/- Acetone, Deoxycholate or other denaturants)
Acetone/Ethanol

75USA: 1-800-526-3867EUROPE: 441 482 646022
Electrophoresis Applications - Gel Electrophoresis of ProteinsElectrophoresis
Applications
Protocol 3.1.5d
Protein Precipitation using the ND Protein Precipitation Kit
National Diagnostics Protein Precipitation Kit precipitates >99% of all proteins, even complex mixtures in dilute solution. Interfering salts and surfactants are left behind in the supernatant. The precipitants are removed with a rapid and gentle acetonitrile or acetone wash, allowing the concentrated proteins to be recovered in a small volume of whatever buffer is optimal for the next procedure.
1. Add 1/20 volume Reagent A to sample in a centrifuge tube and mix well.
2. Add 1/10 volume Reagent B to sample.
3. Allow to precipitate for 20 minutes at room temperature. Precipitate is comprised of Reagent A:B complex along with trapped protein molecules.
4. Collect precipitate by centrifugation and remove supernatant. The pellet will be large.
5. Completely disperse pellet in acetone to dissolve away precipitated A:B complex. The solution should appear clear to cloudy, depending on protein concentration, with no visible clumps. Undispersed clumps will trap impurities which will be carried over into the final isolate.
6. Collect proteins by centrifugation.
7. To remove salts and surfactants, wash pellet with acetone, acetonitrile or 70% ethanol. This step may be repeated if desired for heavily con-taminated samples, or for downstream applications requiring the highest purity proteins. Collect proteins by brief centrifugation if necessary.
8. Redissolve pellet in desired buffer.
Combined Reagent A and Reagent B form a coprecipitate with the protein.
After a simple wash, the small protein pellet is ready to be redissolved in de-sired buffer.
ND Protein Precipitation Kit FAQ
Is the kit selective for membrane proteins, cytosolic proteins etc?The kit is not selective for a particular class of protein. Reagent A binds non-spe-cifically to proteins and the ratio of recovered proteins should reflect the proportion in the original solution. It is possible that individual proteins precipitate with slightly different efficiencies but this has not been observed in testing.
What are the upper and lower concentration limits of protein that can be precipitated?The lower limit for reproducible recovery of BSA is 100ng at a concentration of 0.25 µg/ml. Recovering more than 50µg of protein in a single tube at 200 µg/ml may not be ideal because it becomes more difficult to redissolve the protein pellet at the end of the procedure. Above this concentration it may be helpful to divide the samples among several tubes or dilute the sample before precipitation. We are not aware of any commercially available kit which can recover below 2µg which matches the simplicity of the ND Protein Precipitation Kit, which does not involve centrifuge concentration.
What MW of proteins can be precipitated?Intact proteins in the range of 10kD -200kD have been precipitated successfully as analyzed on SDS-PAGE gels.
Are there special instructions for 2D electrophoresis and Mass Spectrometry?2D electrophoresis and mass spectrometry require the sample to be as con-taminant-free as possible. The wash step is very important in this regard as it removes traces of the precipitation reagents that were used. For 2D electropho-resis and mass spec several washes (at least 2) may be necessary to ensure no contaminants remain with the pellet. Centrifuge after each wash and be careful not to dislodge the pellet.
Does the concentration of salt in the sample have an effect on the results?Most salts at concentrations used in biological laboratories will not affect the pre-cipitation method. However, the surrounding solution can effect kit performance in a few instances. Very high salt concentrations e.g. a saturated solution of NaCl (5.5M) will make it difficult to collect the pellet formed by adding reagent A and B due to the high density of the solution. In this case it may be helpful to dilute the sample before starting the precipitation. Furthermore, salts with chaotropic anions (thiocyanate, iodide, perchlorate) will affect the performance of the kit. Solutions with these salts will cause a precipitate to form as soon as reagent A is added. Chaotropic cations (guanidine) do not have this effect. Guanidine thiocyanate will affect performance of the kit but guanidine HCl will not. Sodium iodide and sodium perchlorate will affect performance but sodium chloride will not.
Do nucleic acids co-precipitate with proteins?Yes nucleic acids do precipitate to some extent with this kit. The kit cannot be used as a way to purify proteins away from nucleic acids, as some nucleic acid will co-precipitate.
Does the pH of the starting solution affect precipitation?The kit has been tested on protein solutions between pH 6 and pH 8 and no difference was seen in the recovery.
The protocol gives a choice between acetone, acetonitrile and 70% ethanol for the wash steps. Which one is best?The choice of washing solution will depend on the application. An acetonitrile wash may help the recovery of low molecular weight proteins while 70% ethanol may be the best wash where salt removal is of utmost importance. Different washes can also be done sequentially. The best washing procedure for your application may have to be determined empirically.
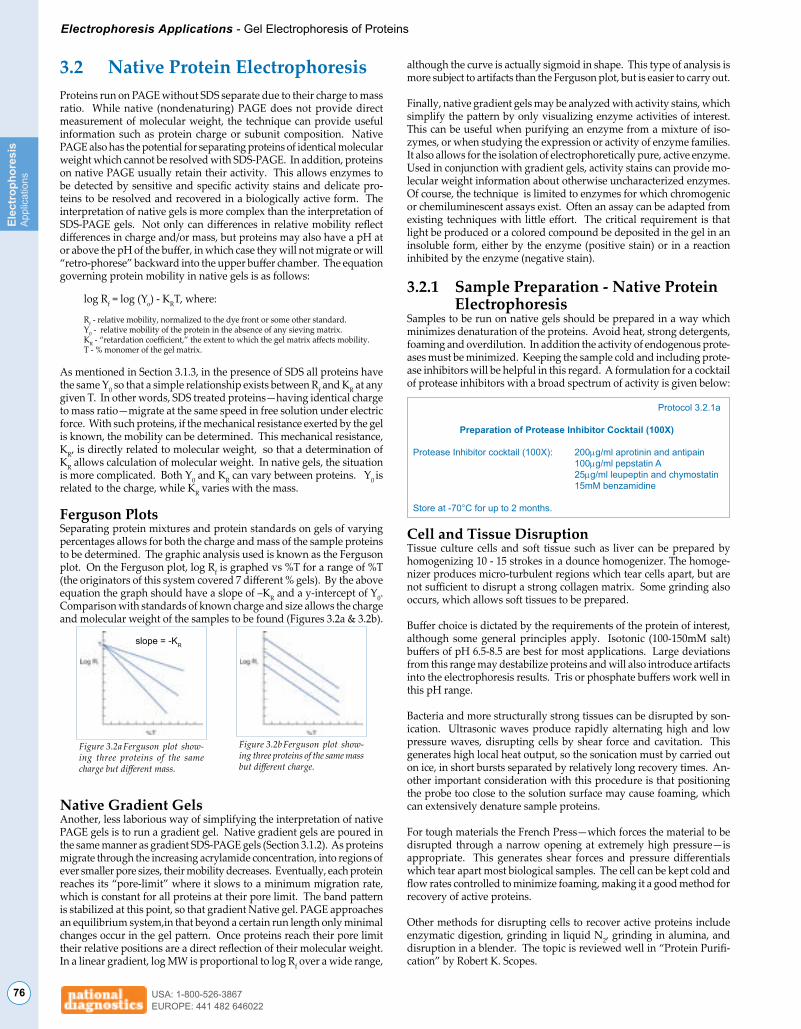
76 USA: 1-800-526-3867EUROPE: 441 482 646022
Electrophoresis Applications - Gel Electrophoresis of ProteinsEl
ectr
opho
resi
sA
pplic
atio
ns
3.2 Native Protein ElectrophoresisProteins run on PAGE without SDS separate due to their charge to mass ratio. While native (nondenaturing) PAGE does not provide direct measurement of molecular weight, the technique can provide useful information such as protein charge or subunit composition. Native PAGE also has the potential for separating proteins of identical molecular weight which cannot be resolved with SDS-PAGE. In addition, proteins on native PAGE usually retain their activity. This allows enzymes to be detected by sensitive and specific activity stains and delicate pro-teins to be resolved and recovered in a biologically active form. The interpretation of native gels is more complex than the interpretation of SDS-PAGE gels. Not only can differences in relative mobility reflect differences in charge and/or mass, but proteins may also have a pH at or above the pH of the buffer, in which case they will not migrate or will “retro-phorese” backward into the upper buffer chamber. The equation governing protein mobility in native gels is as follows:
log Rf = log (Yo) - KRT, where:
Rf - relative mobility, normalized to the dye front or some other standard. Y0 - relative mobility of the protein in the absence of any sieving matrix. KR - “retardation coefficient,” the extent to which the gel matrix affects mobility. T - % monomer of the gel matrix.
As mentioned in Section 3.1.3, in the presence of SDS all proteins have the same Y0 so that a simple relationship exists between Rf and KR at any given T. In other words, SDS treated proteins—having identical charge to mass ratio—migrate at the same speed in free solution under electric force. With such proteins, if the mechanical resistance exerted by the gel is known, the mobility can be determined. This mechanical resistance, KR, is directly related to molecular weight, so that a determination of KR allows calculation of molecular weight. In native gels, the situation is more complicated. Both Y0 and KR can vary between proteins. Y0 is related to the charge, while KR varies with the mass.
Ferguson PlotsSeparating protein mixtures and protein standards on gels of varying percentages allows for both the charge and mass of the sample proteins to be determined. The graphic analysis used is known as the Ferguson plot. On the Ferguson plot, log Rf is graphed vs %T for a range of %T (the originators of this system covered 7 different % gels). By the above equation the graph should have a slope of –KR and a y-intercept of Y0. Comparison with standards of known charge and size allows the charge and molecular weight of the samples to be found (Figures 3.2a & 3.2b).
although the curve is actually sigmoid in shape. This type of analysis is more subject to artifacts than the Ferguson plot, but is easier to carry out.
Finally, native gradient gels may be analyzed with activity stains, which simplify the pattern by only visualizing enzyme activities of interest. This can be useful when purifying an enzyme from a mixture of iso-zymes, or when studying the expression or activity of enzyme families. It also allows for the isolation of electrophoretically pure, active enzyme. Used in conjunction with gradient gels, activity stains can provide mo-lecular weight information about otherwise uncharacterized enzymes. Of course, the technique is limited to enzymes for which chromogenic or chemiluminescent assays exist. Often an assay can be adapted from existing techniques with little effort. The critical requirement is that light be produced or a colored compound be deposited in the gel in an insoluble form, either by the enzyme (positive stain) or in a reaction inhibited by the enzyme (negative stain).
3.2.1 Sample Preparation - Native Protein ElectrophoresisSamples to be run on native gels should be prepared in a way which minimizes denaturation of the proteins. Avoid heat, strong detergents, foaming and overdilution. In addition the activity of endogenous prote-ases must be minimized. Keeping the sample cold and including prote-ase inhibitors will be helpful in this regard. A formulation for a cocktail of protease inhibitors with a broad spectrum of activity is given below:
Protocol 3.2.1a
Preparation of Protease Inhibitor Cocktail (100X)
Protease Inhibitor cocktail (100X): 200µg/ml aprotinin and antipain 100µg/ml pepstatin A 25µg/ml leupeptin and chymostatin 15mM benzamidine
Store at -70°C for up to 2 months.
Cell and Tissue DisruptionTissue culture cells and soft tissue such as liver can be prepared by homogenizing 10 - 15 strokes in a dounce homogenizer. The homoge-nizer produces micro-turbulent regions which tear cells apart, but are not sufficient to disrupt a strong collagen matrix. Some grinding also occurs, which allows soft tissues to be prepared.
Buffer choice is dictated by the requirements of the protein of interest, although some general principles apply. Isotonic (100-150mM salt) buffers of pH 6.5-8.5 are best for most applications. Large deviations from this range may destabilize proteins and will also introduce artifacts into the electrophoresis results. Tris or phosphate buffers work well in this pH range.
Bacteria and more structurally strong tissues can be disrupted by son-ication. Ultrasonic waves produce rapidly alternating high and low pressure waves, disrupting cells by shear force and cavitation. This generates high local heat output, so the sonication must by carried out on ice, in short bursts separated by relatively long recovery times. An-other important consideration with this procedure is that positioning the probe too close to the solution surface may cause foaming, which can extensively denature sample proteins.
For tough materials the French Press—which forces the material to be disrupted through a narrow opening at extremely high pressure—is appropriate. This generates shear forces and pressure differentials which tear apart most biological samples. The cell can be kept cold and flow rates controlled to minimize foaming, making it a good method for recovery of active proteins.
Other methods for disrupting cells to recover active proteins include enzymatic digestion, grinding in liquid N2, grinding in alumina, and disruption in a blender. The topic is reviewed well in “Protein Purifi-cation” by Robert K. Scopes.
Figure 3.2a Ferguson plot show-ing three proteins of the same charge but different mass.
slope = -KR
Figure 3.2b Ferguson plot show-ing three proteins of the same mass but different charge.
Native Gradient GelsAnother, less laborious way of simplifying the interpretation of native PAGE gels is to run a gradient gel. Native gradient gels are poured in the same manner as gradient SDS-PAGE gels (Section 3.1.2). As proteins migrate through the increasing acrylamide concentration, into regions of ever smaller pore sizes, their mobility decreases. Eventually, each protein reaches its “pore-limit” where it slows to a minimum migration rate, which is constant for all proteins at their pore limit. The band pattern is stabilized at this point, so that gradient Native gel. PAGE approaches an equilibrium system,in that beyond a certain run length only minimal changes occur in the gel pattern. Once proteins reach their pore limit their relative positions are a direct reflection of their molecular weight. In a linear gradient, log MW is proportional to log Rf over a wide range,

77USA: 1-800-526-3867EUROPE: 441 482 646022
Electrophoresis Applications - Gel Electrophoresis of ProteinsElectrophoresis
Applications
3.2.2 Gel Preparation - Native Protein GelsThe basic protocols for preparing Native PAGE gels are the same as those given for discontinuous SDS PAGE gels (Section 3.1.2), substituting non-SDS buffers for those containing SDS.
Protocol 3.2.2a
Casting Native Protein Gels
1. Prepare resolving gel and stacking gel casting solutions. Table 3.2.2a gives the formulations for native resolving gels from 6 - 12% as well as the formulation for the stacking gel.
Resolving gel buffer (4x): 1.5M Tris-HCl, pH 8.8 Stacking gel buffer (4x): 0.6M Tris-HCl, pH 6.8 Running (tank) buffer (10X): 1.92M glycine, 0.25M Tris, pH 8.3
Gel %
Native Gradient Gel Component Solutions
Monomer %Deionized
Water (ml)
Sucrose(g)
4
6
8
10
10
12
15
20
2.6
4.0
5.3
6.7
6.7
8
10
13.3
5
5
5
5
5
5
5
5
Upp
er S
olut
ions
Low
er S
olut
ions
-
-
-
-
3
3
3
3
12.4
11
9.7
8.3
6.7
5.3
3.3
0
Table 3.2.2b
ProtoGel(30% 37:1
Acrylamide:MBA)(ml)
Buffer(1.5M Tris-HCl
pH8.8)(ml)
Applications of Native Protein Gels3.2.3 Activity StainsBecause activity stains are specific for a given enzyme or family of en-zymes, it is not possible to present general protocols. Examples of some well defined, commonly used activity stains are given below to indicate the general principles and uses of activity staining.
Horseradish PeroxidaseHorseradish Peroxidase catalyzes the oxidation of a wide range of sub-strates, transferring electrons from these substrates to H2O2 to produce water. Diaminobenzidine (DAB), when oxidized by HRP, produces an insoluble brown precipitate. Gels soaked in H2O2 + DAB will show brown bands over sites of peroxidase activity.
Protocol 3.2.3a
Activity Staining for Horseradish Peroxidase
After electrophoresis, soak gels in a solution containing:
5mM H2O2 0.5mg/ml DAB (diaminobenzidine) 50mM potassium phosphate pH 7
NB: DAB IS A SUSPECTED CARCINOGEN, DECONTAMINATE BEFORE DISPOSAL
Brown bands at peroxidase sites will begin to appear in 1 - 10 minutes, de-pending upon activity. Stop reaction by removing gel to potassium phosphate buffer without H2O2 and DAB.
This assay can be adapted to detect a number of other enzymes. If H2O2 is left out of the buffer, and peroxidase is added at 50 µg/ml, the system will detect H2O2. Inclusion of amino acids allows the detection of the H2O2 producing enzyme amino acid oxidase. Similarly, addition of an amine will permit detection of amine oxidase which also releases H2O2. Inclusion of both H2O2 and HRP in the assay mix will turn the entire gel brown, except where catalase is present. Catalase is detectable in such gels as an achromatic zone.
Nitro Blue TetrazoliumAnother versatile stain is built around the reduction of nitro blue tetra-zolium (NBT) to an insoluble blue formazan (Figure 3.2.3a). Diapho-rases which reduce NBT at the expense of NAD(P)H, can be detected by soaking gels in 50mM sodium phosphate, pH 7.8 + NBT + NAD(P)H. This reduction can also be accomplished by superoxide. O2
- pro-ducing enzymes can thus be detected, and superoxide dismutase (SOD), which removes superoxide, may be detected as an achromatic zone on uniformly stained NBT/ O2
- gels.
Other Enzymes and SubstratesChromogenic substrates also exist for β-galactosidase (x-gal), phospha-tase (BCIP) and proteases. Creative adaptation of these assays allows the detection of a wide range of enzymatic activities on native gels.
Figure 3.2.3a Nitro Blue Tetrazolium (NBT)
Formulate enough resolving gel solution to fill the cas-sette and formulate 1/5 that amount of stacking gel solu-tion. De-gas the solutions for optimum reproducibility. Stir the solution under aspi-ration for 10 minutes at room temperature.
2. Pour the resolving gel:
Add 0.1ml of fresh 10% ammonium persulfate (APS) solution for every 10ml of casting solution. Swirl gently to mix. Add 10µl of TEMED for every 10ml of casting solution. Swirl gently to mix. Pour the solution into the gel cassette. Fill the cassette to a level which will allow the comb to be inserted with 5mm between the bottom of the wells and the top of the resolving gel. Overlay the gel with 1-2mm of water saturated n-butanol to exclude O2 and ensure a flat interface between the resolving and stacking gels. Allow the gel to polymerize for 30 minutes. A line will become visible at the top of the gel as it polymerizes.
3. Pour the stacking gel:
Rinse the butanol from the top of the gel with water, and drain the water by inverting the gel. Add 0.1 ml of 10% APS and 10 µl TEMED for every 10 ml of stacking gel solution and fill the top of the cassette with this mixture. Insert the comb until the teeth are 5mm from the resolving gel. The comb should rest so that the tops of the well dividers are level with the top of the short plate. This excludes oxygen while ensuring that the dividers will fully separate the wells. Allow the stacking gel to polymerize for 30-60 minutes. Run the gel in 1X Tris-Glycine buffer (see above).
Native Gradient GelsNative gradient gels use the same pouring apparatus and techniques as SDS PAGE gradient gels. Table 3.2.2b gives the formulations for the high and low percentage solutions for Native PAGE gradient gels. See Section 3.1.2 for instructions and guidelines for pouring these gels.
Table 3.2.2a
Formulations for Native Protein Gels
Gel %Protogel
(ml)6%
Resolving Gel Buffer
(ml)
DIWater(ml)
8%
10%
12%
2 2.5 5.5
2.7 2.5 4.8
3.3 2.5 4.2
4 2.5 3.5
Stacking Gel
1.25 2.5 (Stacking Gel
buffer)
6.5

78 USA: 1-800-526-3867EUROPE: 441 482 646022
Electrophoresis Applications - Gel Electrophoresis of ProteinsEl
ectr
opho
resi
sA
pplic
atio
ns
3.2.4 Immuno-Electrophoresis / Immuno- DiffusionAntibodies are produced by the immune system in response to foreign macromolecules. Each antibody binds specifically to one feature (epi-tope) on one macromolecule (antigen). This allows the use of antibodies for the detection and quantitation of specific proteins in complex mix-tures. Antibodies are generally isolated from animal serum, unless they are produced from tissue culture as monoclonals. The serum must be titrated to determine antibody concentration and specificity. Concen-tration determinations are often needed for antigen mixtures as well. Immunodiffusion and immunoelectrophoresis are useful techniques for these purposes.
If antibody and antigen are present in solution at approximately equal concentrations, they form an aggregate, which precipitates. This pre-cipitate can be dissolved by the addition of an excess of antibody or of antigen (Figure 3.2.4a).
Figure 3.2.4a When present at approximately equal concentration, antigen and antibody will precipitate as an aggregate. The figure above illustrates a principle underlying the usefulness of immunodiffusion, that with shifts in antibody concentration, a corresponding shift in the region of precipitation will occur.
Protocol 3.2.4a
Radial Immuno-Diffusion
1. Melt 1g Agarose in 100ml PBS.
2. Spread 1ml of this solution on a glass plate or microscope slide. Allow to dry. This precoats the slide and allows the gel poured in the next step to adhere to the slide.
3. Pour enough of the agarose solution onto the precoated slide to cover it to a depth of 1 - 2 mm. Allow this to cool until gelled.
4. Punch wells in the gel with a 2 - 3 mm punch. The end of a 1ml glass pipette works well.
5. Place antigen and antibody solutions in adjacent wells and allow plate to diffuse 24 hours. It will be necessary to run multiple dilutions of sample and antibody to determine optimum concentrations of each.
Immuno-ElectrophoresisAgarose gels have a small number of fixed charges, which cause a phenomenon known as electroendosmosis (Section 1.3.2). EEO causes a slow net flow of water through the gel away from the positive elec-trode. At a pH of 8.5, antibodies are nearly uncharged, and their slow electrophoretic migration is nullified by the EEO flow through the agarose. Most other proteins are highly charged at pH 8.5, and will migrate through an agarose gel. If antiserum is included in the gel matrix, immuno precipitates will form, in a pattern dependent upon the antigen concentration. This technique, immuno-electrophoresis, is much faster than immuno-diffusion, and has been applied in a variety of geometries, to analyze simple or complex samples.
Protocol 3.2.4b
“Rocket” Immuno-Electrophoresis
“Rocket” Immuno-Electrophoresis is used as a rapid way to quantitate antigen in complex samples.
1. Cast a 1% agarose gel, in buffer at pH 8.6 containing typically 1% of the desired antiserum.
2. Into wells punched at one end, load antigen solutions. Run gel with wells closest to the negative electrode.
As the antigen proteins enter the gel, they form a concentration gradient, which at some point gives the proper concentration for precipitation with the antibody in the gel. The more concentrated the antigen, the further it must run to be diluted to precipitable levels. The result is that each sample gives a “rocket”, the length of which is proportional to the concentration of antigen in the sample.
3. Precipitates can be stained with Coomassie Blue R-250. Detection limits are usually sufficient to quantitate 0.1 - 0.2 g/ml of antigen.
Mixtures with multiple antigen species which cross react with the same antiserum may be analyzed by running them first on an analytical gel. Then cut a strip from that gel and lay it in a slit cut into the immuno-elec-trophoresis gel to form a large well. (Figure 3.2.4c). The resulting pattern shows the positions of strongly reacting antigen species.
Figure 3.2.4b Of the common patterns of wells contain-ing antibody antiserum (Ab) and antigen samples (Ag) used in immunodiffusion, the system of parallel slots (a) can demonstrate the presence of antigen and roughly estimate concentration; the three-well pattern (b) can demonstrate the immunological identity (or not) of two antigen samples; radial immunodiffusion (c) introduces the capacity for com-parative analysis unavailable with the three-well pattern.
Ag
Ag
Ag
Ab
Ab
Ab
a.
Ag Ag
Ab
b.
Ab
Ag Ag
Ag Ag
Ag Ag
c.
In a gel matrix, if a gradient is established in which antibody concentra-tion decreases linearly in a given direction, while antigen concentration increases in the same direction, a precipitate will form a band perpendic-ular to this direction, at the point of approximately equal concentration This is the basis of both immunodiffusion and immunoelectrophoresis. In both of these techniques, a gradient of antigen, or of antibody and antigen, establishes a line of precipitate in the gel. The position of the line is indicative of the concentration of antigen or antibody in the sample, and may be calibrated against standards. Figure 3.2.4b shows different variations of the immunodiffusion assay.
Figure 3.2.4c Crossed immunoelectrophoresis of antigens and antiserum. In the first dimension, proteins are separated by standard electrophoresis. The separated proteins are then run into the second dimension gel at an angle of 90° from the first dimension. The second dimension gel contains antiserum, generating an immunoprecipitate pattern.
First dimension Sec
ond
dim
ensi
on

79USA: 1-800-526-3867EUROPE: 441 482 646022
Electrophoresis Applications - Gel Electrophoresis of ProteinsElectrophoresis
Applications
3.3 Two Dimensional ElectrophoresisConventional electrophoresis techniques can separate up to 100 different proteins on one run. Typically, cell or tissue extracts contain thousands of proteins, most of which will not be resolved into single bands with separation based on any one parameter, such as size or net charge. For any one size range, there is a high probability of more than one protein falling into this range. Separation on the basis of two parameters, usually size and isoelectric point, lowers the probability that two proteins will overlap, and allows the resolution of thousands of protein species on one gel. Such two dimensional separations are carried out by running a one dimensional gel to separate by the first parameter, and then laying this gel or a lane cut from it, across the top of the second dimension gel, the first gel serving as the “sample” for the second. Typically, the second dimension gel is an SDS PAGE gel, because this gives a direct measurement of a protein’s size. The first dimension usually employs isoelectric focusing (IEP). IEP separates by the isoelectric point (pI) of the protein - the pH at which the protein sample will not migrate in an electric field, the protein’s net charge being zero. A two dimensional gel can give size and pI information on thousands of proteins in one run.
3.3.1 Isoelectric FocusingProteins carry charged groups on their surface (see Section 1.1.2 for a discussion of protein structure). Each of these functional groups has a pK, which corresponds to the pH at which half of the members of that group are protonated. Above the pK that group can be considered fully deprotonated, below the pK, fully protonated. Thus, as the pH changes, the net charge on a protein’s surface will change. At high pH, most proteins will have many deprotonated surface groups, and will carry a net negative charge. At low pH, with many protons added to the surface, most proteins have a net positive charge. At some intermediate pH, different for every protein, the net charge on the protein will be zero. It is important to remember that this is a net charge - the protein is not uncharged - it carries equal numbers of positive and negative charges. The pH at which a protein has a net charge of zero is designated its isoelectric point (pI).
Various mixtures of amphoteric substances have been used as ampholy-tes: amino acids, proteins, and poly acidic poly basic synthetic molecules. Natural amino acids have poor conductivity and poor buffering capacity in their zwitterionic state, making them poor candidates. Proteins can be good ampholytes, but they interfere with analysis of the sample, by introducing new proteins into the mixture. Polycarboxylic acid poly-amines are the most commonly used ampholytes. These molecules have excellent buffering capacity and conductivity across a broad pH range, and are usually provided in a molecular weight range of 300 - 500, which is small enough to avoid interference with most subsequent processing. Their sole disadvantage is that they may bind tightly to the proteins, due to ionic interactions, and can be very difficult to remove.
Protocol 3.3.1aIsoelectric Focusing
IEF is frequently the first step in 2-dimensional electrophoresis. The apparatus best suited for this purpose is a “tube gel” system. The gels are cast and run in glass tubes with an internal diameter matched to the thickness of the second dimension gel. 1.5mm gels are commonly used. After the run, the IEF gel is extruded from the tube and laid across the top of the second dimension gel. This system is assumed in the protocol below. IEF gels can also be run as slabs, which allows an increased sample throughput. Slab IEF gels can be cut into strips for loading onto second dimension gels.
1. PREPARE THE GELS
a. To formulate gel solution, dissolve 4g urea in 3 ml H2O + 1ml ProtoGel. Warm to 37°C if needed. De-gas for 10 minutes under aspiration.
b. Add 150µl NP-40 detergent and 0.4ml ampholytes, mix and filter through a 0.22µm filter.
c. Add 30µl of 10% APS, and 3µl of TEMED. Mix well and place solution in a 10ml syringe with a 22ga needle as long as the gel tubes.
d. Insert needle into gel tube until it reaches the bottom, and fill tube, withdrawing needle as the fluid level rises. Use the needle to dislodge any bubbles. Allow the gels to polymerize for at least 2 hours.
2. PREPARE THE SAMPLES
a. Add 15ml sample buffer/gram tissue: 9M Urea 4% NP-40 2% Ampholytes (pH 9-11) 2% Mercaptoethanol pH to >9 with NaOH.
b. Homogenize if necessary. Incubate at room temperature for 10 min., then centrifuge for 1 hr. at 100,000g. Remove supernatant without disturbing pellet, which contains materials likely to clog the IEF gel.
3. RUN CONDITIONS
a. Fill lower tank with 0.1% phosphoric acid. Place gels in the apparatus and fill the upper tank with 20mM NaOH. Use a syringe to dislodge any bubbles from inside gel tubes. Any bubbles in the tubes will distort the electric field and prevent gels from completely focusing during the run.
b. Samples prepared as above can be loaded by layering onto the tops of the gels. Run at 500-700V (depending upon the apparatus used) for 16-24 hours. At the end of the run, mark the top end of each gel with a small amount of bromphenol blue.
4. POST ELECTROPHORESIS
IEF gels may be coomassie stained (Section 4.2.2), but most often they are loaded onto SDS PAGE gels for second dimension analysis. Extrude the gels by applying pressure to one end of the tube with a pipette or syringe, while holding the other end over a vial or tray. Extruded gels may be frozen at -70°C for later analysis.
5. LOADING AN IEF GEL ONTO A SECOND DIMENSION SLAB
a. Place the IEF gel in a solution of 20% glycerol, 4% SDS, and 250mM Tris-HCl, pH 6.8, with 1% mercaptoethanol added just prior to use. Incubate the gel in this solution for 5-10 minutes.
b. Dissolve 0.1g agarose in 20ml of Tris-Glycine-SDS buffer. Heat until the agarose is melted.
c. Overlay the second dimension gel with 1-2 mm of agarose, place the first dimension gel over the agarose, being careful not to trap any air bubbles. Overlay the gel with another 1-2mm of agarose solution, and run the second dimension gel.
Figure 3.3.1a In isoelectric fo-cusing, a protein stops migrating when it enters the zone in which the surrounding pH equals its isoelectric point, pI.
In isoelectric focusing (IEF) a pH gradient is established along the length of the gel. Under the in-fluence of electric force, proteins migrate through this gradient until they reach the pH zone equal to their pI. The orientation of the voltage is chosen so that if a protein is in a region where the pH is above its pI it moves toward a lower pH zone. If the protein is in a pH below its pI, it has a positive charge and moves into higher pH regions. This gives rise to the “focusing” aspect of IEF, as proteins are continually swept back into tight bands centered on the appropriate pI (Figure 3.3.1a). IEF is thus an equilibrium electrophoresis system, run until protein movement ceases.
AmpholytesThe pH gradient in IEF gels is generated by the inclusion of a mixture of ampholytes of varying pI. Ampholytes are low molecular weight amphoteric molecules, which, like protein molecules, migrate through the gel until they reach a region where the pH equals their pI. Unlike the proteins, the ampholytes are present in high enough concentration to change their local pH. The gel is set up with a uniform mixture of ampholytes throughout, and its anodic and cathodic ends are immersed in dilute acid and base respectively. With the application of voltage, the ampholytes separate into zones of defined pH. If the ampholyte system is well designed, a smooth gradient of pH is created, with no abrupt charges, or “steps”. Commercial systems are available in broad range (2 - 12 pH) or narrow range (extending 2 pH units across the gel).

80 USA: 1-800-526-3867EUROPE: 441 482 646022
Electrophoresis Applications - Post Electrophoretic AnalysisEl
ectr
opho
resi
sA
pplic
atio
ns
4 Post Electrophoretic Analysis
4.1 DNA & RNA Detection Fixing and Staining / Autoradiography / Blotting
4.2 Protein Detection FixingandStaining/Blotting
Post Electrophoretic Analysis...To See or Not to See!
Electrophoresis accomplishes the separation of a transparent sample of macromolecules across a clear or semi-clear gel matrix. Once this separation is achieved, further steps are required to detect the sample molecules within the gel. As samples routinely contain more than 100 separable components, each band
may represent less than 1% of the total material loaded. The sensitivity of detection rapidly becomes a key issue. In addition, diffusion within the gel after the electric potential is removed causes band spreading, decreasing resolution over time. Speed and the ability to immobilize or “fix” bands are important parameters to be considered. Finally, it is often necessary to determine the relative amounts of material detected in several samples loaded on a gel. Thus a wide linear response is desirable.
Detection methods may be broadly divided into two types: staining, in which a small molecule is selectively bound to the sample components, causing bands to become visible and/or fluoresce; and blotting, in which bands are detected on the basis of their specific interactions with macromolecular probes. The use of macromolecules as probes for detection requires that the bands be transferred out of the gel onto a solid support, a process known as blotting, which has given its name to an entire class of processes.

81USA: 1-800-526-3867EUROPE: 441 482 646022
Electrophoresis Applications - Post Electrophoretic AnalysisElectrophoresis
Applications
4.1 DNA and RNA Detection4.1.1 Staining of Nucleic AcidsNucleic acids are usually loaded onto gels at levels below 10 µg. For a typical Southern Blot (Section 4.1.2) a single copy gene will be present at <1 in 106, or <10pg/band for every 10 µg loaded. Alternatively, a restriction digest of 1 µg of a 6 kilobase plasmid which cuts the DNA into 6 unique pieces, the smallest of which is 600 bp, will present bands larger than 100 ng. A wide array of staining and blotting techniques have been developed to cover this range of detection, offering low sensitivity, great speed and convenience at one end and extreme (but labor inten-sive) sensitivity at the other. Some of the most sensitive techniques are destructive, rendering the DNA inactive and not suitable for recovery. Most of the less sensitive techniques preserve the DNA structure intact, and are commonly used where DNA is to be purified from the gel for further processing. In general, staining techniques aim for sensitivity in the nanogram range and recovery of intact DNA.
Figure 4.1.1a When ultraviolet l ight strikes a DNA molecule, it may be absorbed, transmitted, or, if a fluorescent dye is present, re-emitted as visible light.
UV ShadowingDetection of DNA/RNA in solution is usually done by measuring its UV absorbance at 260 nm. This absorbance is due to the ring systems in the nitrogen bases, and can also be used for low sensitivity detection of DNA/RNA in gels. In a technique known as UV shadowing, the gel is placed on plastic wrap over a UV fluorescent TLC plate. The dye in the plate is excited by placing a near-UV source over the gel. Dark areas are observed where DNA in the gel absorbs the UV light. The sensitivity of this method is limited, on the order of 10-50 µg, and its use is limited to thin gels, which do not excessively attenuate the UV light.
NuclistainNational Diagnostics’ Nuclistain offers a significant increase in sensitiv-ity over UV shadowing along with the convenience of visual staining. With Nuclistain there is no need for UV light. Nuclistain is a blue dye which binds to DNA, revealing blue bands after destaining with water. Nuclistain detects DNA down to levels of 50ng. Nuclistain does not modify DNA in any way and is easily removed from DNA following band isolation.
Protocol 4.1.1a
Detecting Nucleic Acids with Nuclistain
1. Dilute Nuclistain stock 1:100 in distilled or deionized water. Prepare enough solution to completely submerge the gel.
2. Stain the gel with agitation for 20-30 minutes.
3. Destain in deionized water. Bands will begin to appear within 15 minutes. Complete destaining for maximum sensitivity requires 3-12 hours.
DNA, yielding low background and a detection limit of 1-5 ng/band. The major drawback is that it is a potent mutagen. Solutions must be handled with extreme caution and decontaminated prior to disposal. Nonetheless, the sensitivity, simplicity (the dye may be run in the gel with the DNA if desired, eliminating a separate staining/destaining process) and nondestructive nature of EtBr staining have made it the standard stain for double stranded DNA.
EtBr staining is strongly enhanced by the double stranded structure of native DNA. Staining of denatured, ssDNA or RNA is relatively insen-sitive, requiring some 10 fold more nucleic acid for equivalent detection. Another limitation is that the fluorescence of ethidium is quenched by polyacrylamide, reducing sensitivity by 10-20 fold in PAGE gels.
Protocol 4.1.1b
Detection of DNA/RNA using Ethidium Bromide
*CAUTION: ETHIDIUM BROMIDE IS A POTENT MUTAGEN. HANDLE ONLY WITH GLOVES AND PROPER PRECAUTIONS.
Method I - Including ethidium bromide in the gel and buffer
GEL PREPARATION
1. Dissolve agarose in buffer as described in Section 2.4.1.
2. Allow gel to cool to 60-70°C.
3. Add EtBr to 0.5 µg/ml final concentration. (Stocks are generally 10 mg/ml, and require 5µl stock/100ml gel).
4. Pour gel and allow to set as usual.
BUFFER PREPARATION
1. Prepare enough buffer to fill the apparatus.
2. Add 5µl/100ml EtBr stock.
RUN GEL
Upon completion of run, place gel in plastic wrap on a UV light box. Bands will appear bright orange on a faint orange background.
Notes:Gels and buffers must be decontaminated prior to disposal. See your local health and safety office for your institution’s preferred method.This method will detect ~ 5ng. of DNA. Destaining in water or 1 mM MgSO4 may be required to achieve full sensitivity.As an alternative, ethidium may be included in the gel, but not the buffer. Ethidium is positively charged, and will migrate in the opposite direction from the DNA. In general, sufficient ethidium will remain bound to the DNA even at the cathode end of the gel. Such gels will have an area of high background where the ethidium has not yet migrated out of the gel. They are however sufficient for many purposes, and do not generate as much ethidium waste (Your safety office will know what level of Ethidium causes a buffer to be declared a hazard).
Method II - Post Run Staining
1. Prepare enough 0.5mg/ml EtBr in water or buffer to completely submerge the gel. This solution is stable for 1-2 months at room temperature in the dark.
2. After the run submerge the gel in the staining solution for 15-30 minutes (depending upon gel thickness).
3. Place gel on plastic wrap on a UV light box and observe under 300nm illumination. Bands will appear bright orange on a pale orange back-ground.
Notes:This protocol minimizes the amount of EtBr waste created with each gel run.Sensitivity the same as Method I can be achieved but may require destaining in water or 1mM MgSO4 to achieve the best sensitivity.In this method, bands become visible from the top and bottom of the gel as the dye diffuses into the matrix. High contrast results can often be achieved without destaining by soaking the gel until the top and bottom of the bands appear, and then leaving the gel to stand out of the staining solution for 15-30 minutes. During this time the stain will continue to diffuse into the gel, binding to the DNA at the expense of free dye. The result is a lower background without destaining.
Always use plastic wrap under ethidium stained gels to avoid solarization damage to the surface of the transilluminator.
Figure 4.1.1b Bands in gels stained with Ethidium Bromide fluoresce under ultraviolet light.
Ethidium BromideThe most commonly used stain for de-tecting DNA/RNA, ethidium bromide (EtBr) is a DNA interchelator, inserting itself into the spaces between the base pairs of the double helix. EtBr possesses UV absorbance maxima at 300 and 360 nm. Additionally, it can absorb energy from nucleotides excited by absorbance of 260 nm radiation. Ethidium re-emits this energy as yellow/orange light centered at 590 nm. The fluorescence of EtBr in aqueous solution is significantly lower than that of the intercalated dye. Ethid-ium bromide is a sensitive, easy stain for

82 USA: 1-800-526-3867EUROPE: 441 482 646022
Electrophoresis Applications - Post Electrophoretic AnalysisEl
ectr
opho
resi
sA
pplic
atio
ns
Silver StainingSilver staining is more sensitive than ethidium bromide for double stranded DNA, and detects single stranded DNA or RNA with no loss in sensitivity. Silver staining relies on the reduction of silver cations to insoluble silver metal by nucleic acids. This chemical reaction is insensitive to the macrostructure of the DNA molecule. Reduced sil-ver grains deposit in the gel around the DNA bands, creating a “latent image.” The latent image is developed to visibility by soaking the gel in a solution of silver cations and a reducing agent. The silver granules in the latent image catalyze the further reduction and deposition of silver from the solution. Bands manifest as dark brown or black regions which appear before significant background develops. Development is stopped by altering the pH of the gel to a point where silver reduction is no longer favored.
The mechanism whereby nucleic acids reduce silver is not well defined. Staining is enhanced by treatment with oxidants, and it may be that such treatment oxidizes vicinal sugar diols to highly reductive aldehydes, which are known to reduce silver (e.g. Tollens test). However, if this were the primary mechanism, silver staining would be expected to destroy the DNA. Recent reports indicate that enough DNA survives silver staining to provide a template for PCR amplification. This may reflect either the nondestructive nature of silver staining or the extreme sensitivity and power of the PCR reaction.
Protocol 4.1.1c
Silver Staining with the Sterling Silver Kit
For mini-gels (10X7cm), use 100ml of each solution. For larger gels, in-crease STERLING volumes appropriately to immerse gel to depth of 1cm. Wash mini-gels in 200ml volumes of water, and agitate continuously during all steps. Glassware must be clean, and the water should be distilled or high-quality deionized.
FIX
1. Incubate the gel for 25 minutes in 100ml of the standard mixture of 5:5:1 methanol:water:acetic acid.
2. Decant fixative, then add reconstituted STERLING Fixative (45ml water, 50ml methanol, 5ml STERLING Fixative Concentrate) and fix for an additional 5 minutes.
WASH
1. Rinse the gel twice for 15 minutes in deionized water. The addition of 0.1% nonionic surfactant will aid in submerging the gel.
2. While the gel is washing, prepare Staining Solution (see below). Do not combine the two component solutions until just prior to use.
PREPARATION OF STAINING SOLUTION
1. Dilute 25ml Reagent A with 25ml of water.
2. Dissolve 2.8 grams of Reagent B in 50ml of water. STIR UNTIL COM-PLETELY DISSOLVED (approx. 5-10 minutes).
3. Immediately prior to use, pour (1) into (2) while stirring, and pour over gel. The combined solution has a useful life of 20-30 minutes.
STAIN
1. Decant wash solution and immerse gel in combined staining solution.
2. Bands will begin to appear in 5-10 minutes. When desired intensity is achieved, stop development by immersing the gel in a 5% acetic acid solution.
Note: A new level of sensitivity in DNA staining is claimed for a num-ber of fluorescent DNA and RNA dyes. These dyes are less mutagenic and more sensitive than EtBr, at times approaching or surpassing silver staining in sensitivity.
4.1.2 BlottingNucleicAcids- Northerns and SouthernsA DNA or RNA probe will selectively hybridize with nucleic acid molecules of complementary sequence in a sample. A labeled nucleic acid molecule of known sequence can facilitate detection of any com-plementary molecules in an unknown sample. This is the basis of the RNase protection assay (Section 2.1.8), and PCR amplification (Section 2.2.3), among other techniques. In theory, labeled nucleic acid mol-ecules could act as specific “stains” for DNA or RNA species in gels. Only complementary fragments would be “stained”. However, specific hybridization requires nucleic acid polymers of twenty-five or more bases, which are too large to diffuse rapidly into a gel.
In order to circumvent this problem, a method was devised to “print” an electrophoretic pattern onto a solid support, preserving the positional information from a gel, but removing the matrix. This process—blot-ting—was first publicized by Southern (1975). Southern demonstrated that DNA could be electrophoretically fractionated, transferred to nitro-cellulose, and then probed with radioactively labeled DNA sequences, which would hybridize to their cognates on the membrane.
The result, dubbed a “Southern Blot,” reveals a pattern of bands showing the size and relative amount of DNA containing the probe sequence. Soon thereafter RNA was blotted successfully (Northern blotting) and protein (Western blotting). The advantage gained by blotting was the immobilization of the electrophoretic pattern, rendering the molecules in that pattern accessible to macromolecular probes.
Transfer TechniquesBlots are created by laying a membrane over one face of the gel and then creating a flow which carries the molecules in the gel onto the mem-brane. The two most common methods used for Northern and Southern blotting are capillary flow and vacuum transfer. Electroblotting is also used occasionally, although it requires special care to prevent crushing or melting of the agarose gel.
Capillary flow transfers are carried out in a dish of buffer (Figure 4.1.2a). The gel is placed on a porous support (usually filter paper or a sponge) that holds the gel above the buffer while allowing buffer to flow up to the gel. The membrane is placed on top of the gel, and a stack of ab-sorbent paper is placed over the membrane. A weight is placed on top of the stack to ensure continued close contact of all components, and the entire assembly is left to stand for 12-16 hours. During this period, buffer is wicked out of the gel through the membrane and onto the dry filters above. As buffer flows into the gel from the tank below, the nucleic acids in the gel are carried upward to the membrane. Conditions are chosen to favor binding to the membrane, so molecules of nucleic acid are trapped there. Usually 80-90% of the molecules in the gel can be recovered on the membrane by this procedure.
Figure 4.1.2a Capillary blotting.
Stack oftowels
Membrane
Gel
Buffer
Support blockWick
Vacuum blotting also uses a flow of buffer to elute bands onto the mem-brane, but it uses a vacuum instead of capillary action to create the flow (Figure 4.1.2b). The membrane is placed on a porous support, the gel is placed over it, vacuum is applied and the buffer is added to submerge the gel. This type of blotting is quite fast (1-3 hrs.), and gives excellent recoveries. Its only drawback is the need for specialized apparatus.

83USA: 1-800-526-3867EUROPE: 441 482 646022
Electrophoresis Applications - Post Electrophoretic AnalysisElectrophoresis
Applications
Figure 4.1.2b Vacuum blotting.
MembraneGel
Buffer
Electroblotting of DNA or RNA from agarose gels is most often carried out in a “semi-dry” apparatus, between solid flat electrodes of metal or graphite. In this technique, potential is applied perpendicular to the gel, causing the nucleic acid fragments to eletroelute onto the membrane. With agarose, special care must be taken not to crush, distort or melt the gel during transfer. Electroblotting is far more popular for poly-acrylamide gels in which capillary or vacuum techniques fail due to the smaller pore size. (Section 4.2.2 Western blotting).
In the methods given for Northern and Southern blotting below, di-rections are given for setting up capillary blots. For instructions on vacuum or electro-blotting, see the protocols supplied by manufacturer’s of these devices.
MembranesThere are two popular membrane materials used in nucleic acid blotting. These materials are nitrocellulose (including supported nitrocellulose), and nylon (charged and uncharged). Nitrocellulose is the traditional support medium, and it is still employed by many researchers. In a high salt aqueous environment, nitrocellulose will bind to nucleic acids tightly but non-covalently. After transfer, nucleic acid binding is stabilized by baking the filter for 1 hour. The baked filter can be stripped and reprobed, but because the bound nucleic acid is not covalently linked to the membrane, significant signal loss can occur. A major drawback to nitrocellulose membranes is that they are quite fragile, requiring very careful handling to preserve the blot intact.
Nylon filters have gained great popularity since their introduction, their most obvious advantage over nitrocellulose being their durability. Nylon filters can be handled roughly with no physical damage. The material withstands prolonged exposure to alkali, which allows use of the convenient alkaline transfer technique (Protocol 4.1.2c). Nylon is blocked by SDS, which simplifies the pre-hybridization steps. Nucleic acids can be covalently linked to nylon membranes through controlled exposure to UV light. The resulting blot may be stripped and reprobed many times with minimal loss of signal. Nylon membranes are avail-able in uncharged form, or with immobilized positive charges on their surfaces. Positively charged nylon has a higher affinity for nucleic acids, which are anions, than does neutral nylon. Positively charged nylon will bind nucleic acid semi-permanently after alkaline blotting without UV cross-linking. However, in some cases, charged nylon may give higher backgrounds than uncharged membranes.
Protocol 4.1.2aNorthern Blotting
ELECTROPHORETIC SEPARATION (see Protocol 2.4.6b)RNA samples should be free of contaminating particles and DNA, with an A260/A280 ratio
of 1.9-2.0.
1. For highly expressed genes, load 10µg total of RNA. For trace expression detection, load 10µg of poly A+ RNA. Ethidium may be added to the gel (4 µl of 10 mg/ml per 100ml gel = 0.4µg/ml).
2. Visualize the gel on UV and photograph with a phosphorescent ruler.
TRANSFER1. To remove formaldehyde and EtBr which may hamper transfer and/or
recovery, soak the gel in 3 changes of DI water for 10 minutes each.2. Place a platform slightly larger than the gel in the center of a 9X13X2”
tray. Fill the tray with 10X SSC until the buffer is 0.5 cm below the surface of the platform (An inverted gel mold or a sponge make good platforms. Rinse commercial sponges before first use, to remove surfactants).
3. Cut a strip of Whatman 3MM paper to the width of the platform and length of the tray. Lay it over the platform so that the ends rest in the buffer. Roll a pipette over the filter to remove any bubbles beneath.
4. Flood the filter paper surface with 10X SSC and lay the gel on the filter paper. Roll the gel with a pipette if needed to remove air bubbles.
5. Place strips of plastic wrap on the platform around the gel to prevent buffer from bypassing the gel. Alternatively, lay a piece of plastic wrap over the gel and platform, and cut away the plastic over the gel with a razor blade, leaving a “mask” on the tray.
6. Flood gel surface with 10X SSC and carefully overlay membrane onto gel (Note: handle membrane with gloves or forceps and only at corners).
7. Cut 3 pieces of Whatman 3MM to the size of the gel. Wet one piece and lay it over the membrane. Roll the paper and membrane with a pipette to remove any bubbles.
8. Inspect carefully - gaps between gel and membrane block transfer and may create “hot spots” on the blot, making interpretation more difficult.
9. Wet each remaining cut piece of 3MM paper, lay over the stack, and roll to remove bubbles.
10. Lay a stack (3-4” high) of paper towels, cut to the size of the gel, over the top of the stack.
11. Place a glass plate and a 500g weight on top of the stack. Allow to transfer overnight.
POST TRANSFER PROCESSING
1. Disassemble capillary stack down to membrane, mark well positions with indelible pen or pencil before removing membrane from gel.
Note: Gel will be flattened to ~ 2mm thickness. The gel can be stained with EtBr and checked under UV to determine extent of transfer.
2. Rinse membrane in 5X SSC for 5 minutes at room temperature.3. Cross-link RNA to membrane: Nylon - expose to UV (~150 mj/cm2).
Nitrocellulose - Bake at 80°C for 120 minutes.4. (Nylon filter only) Wash filter in 1X SSC + 0.1% SDS @ 65° C for 1 hour.
This will substantially reduce the background.
HYBRIDIZATION1. Probe purification (Section 2.4.3)2. Prehybridize in hybridization solution (see below) for 1 hour @ 65°C,
then replace with fresh solution containing probe for hybridization.Many different protocols exist for hybridization reactions and each must be optimized for
any given probe. General guidelines are given below.
Hybridization solution: 5X Denhardt’s Solution 100µg/ml Salmon or Herring Sperm DNA 0.1% SDS 5X SSPE 50% formamide Filter sterilize and store at -20°C. Denhardt’s solution (50X): 1% BSA 1% Polyvinylpyrrolidone 1% Ficoll SSPE (20X): 3M NaCl 0.2M Sodium Phosphate, pH 7.4 25mM EDTA3. Select a hybridization temperature which will allow annealing of the
probe, but prevent non- specific binding to nontarget sequences. Note that high stringency washing later in the protocol may not be able to compensate for too low a hybridization temperature. The result will be a large number of false positive bands.
AquaPor LE EC-202 AquaPor LE is a high quality, general purpose agarose ideal for most routine applications. (pg. 16)
SDS Solution 20% EC-874 For the same cost, avoids the discomfort and inconvenience of working with powdered SDS. (pg. 33)
Denaturation Solution EC-875 Neutralization Solution EC-876Ready-to-use solutions for Southern blotting. (pg. 18)
Dextran Sulfate EC-877Ultra pure reagent used in hybridization reactions to promote annealing and reaction times. (pg. 32)
Products for Northern and Southern BlottingSSC Buffer (20X) EC-873 Formulated with 18 MegOhm water. 0.2 micron filtration. More reproducible than bench-top buffers. (pg. 18)
ProgoGlow ECL CL-300Highest sensitivity HRP chemiluminescent detection in Western and Southern blot tech-niques. (pg. 24)
Formamide EC-608 Ready-to-use DNA denaturing agent. Redis-tilled, deionized, and stored under nitrogen. (pg. 32)
c o n t i n u e d
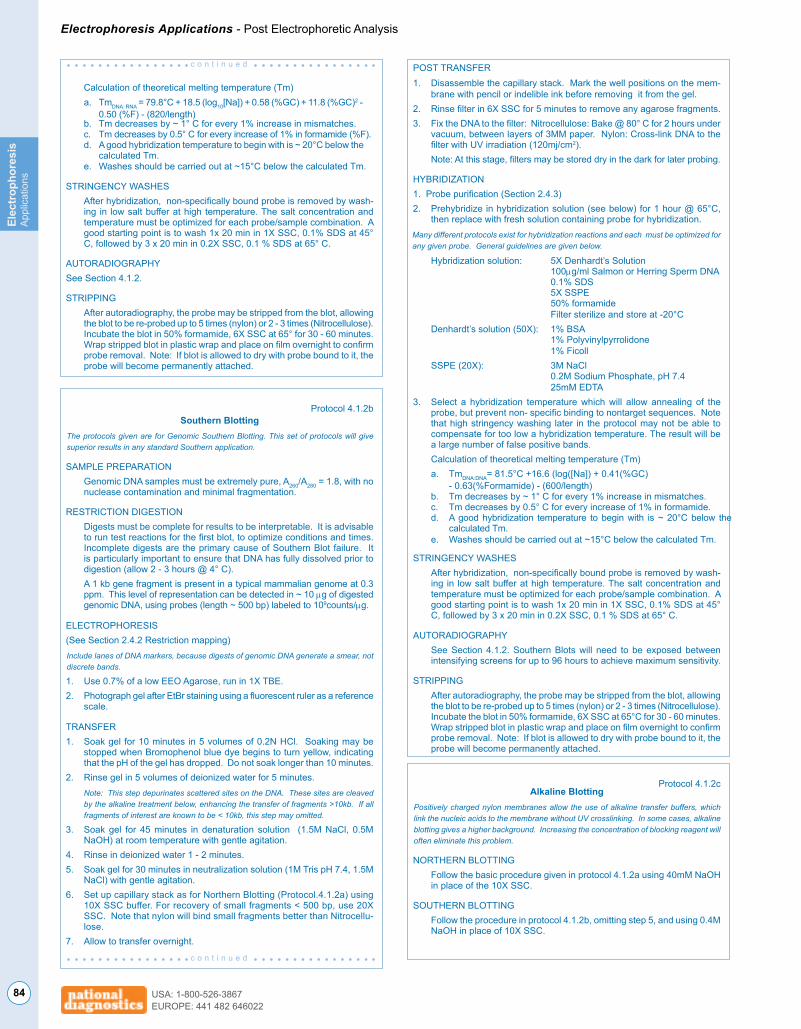
84 USA: 1-800-526-3867EUROPE: 441 482 646022
Electrophoresis Applications - Post Electrophoretic AnalysisEl
ectr
opho
resi
sA
pplic
atio
ns
POST TRANSFER1. Disassemble the capillary stack. Mark the well positions on the mem-
brane with pencil or indelible ink before removing it from the gel. 2. Rinse filter in 6X SSC for 5 minutes to remove any agarose fragments. 3. Fix the DNA to the filter: Nitrocellulose: Bake @ 80° C for 2 hours under
vacuum, between layers of 3MM paper. Nylon: Cross-link DNA to the filter with UV irradiation (120mj/cm2).
Note: At this stage, filters may be stored dry in the dark for later probing.
HYBRIDIZATION1. Probe purification (Section 2.4.3)2. Prehybridize in hybridization solution (see below) for 1 hour @ 65°C,
then replace with fresh solution containing probe for hybridization.Many different protocols exist for hybridization reactions and each must be optimized for any given probe. General guidelines are given below.
Hybridization solution: 5X Denhardt’s Solution 100µg/ml Salmon or Herring Sperm DNA 0.1% SDS 5X SSPE 50% formamide Filter sterilize and store at -20°C Denhardt’s solution (50X): 1% BSA 1% Polyvinylpyrrolidone 1% Ficoll SSPE (20X): 3M NaCl 0.2M Sodium Phosphate, pH 7.4 25mM EDTA3. Select a hybridization temperature which will allow annealing of the
probe, but prevent non- specific binding to nontarget sequences. Note that high stringency washing later in the protocol may not be able to compensate for too low a hybridization temperature. The result will be a large number of false positive bands.
Calculation of theoretical melting temperature (Tm) a. TmDNA:DNA= 81.5°C +16.6 (log([Na]) + 0.41(%GC) - 0.63(%Formamide) - (600/length) b. Tm decreases by ~ 1° C for every 1% increase in mismatches. c. Tm decreases by 0.5° C for every increase of 1% in formamide. d. A good hybridization temperature to begin with is ~ 20°C below the
calculated Tm. e. Washes should be carried out at ~15°C below the calculated Tm.
STRINGENCY WASHES After hybridization, non-specifically bound probe is removed by wash-
ing in low salt buffer at high temperature. The salt concentration and temperature must be optimized for each probe/sample combination. A good starting point is to wash 1x 20 min in 1X SSC, 0.1% SDS at 45° C, followed by 3 x 20 min in 0.2X SSC, 0.1 % SDS at 65° C.
AUTORADIOGRAPHY See Section 4.1.2. Southern Blots will need to be exposed between
intensifying screens for up to 96 hours to achieve maximum sensitivity.
STRIPPING After autoradiography, the probe may be stripped from the blot, allowing
the blot to be re-probed up to 5 times (nylon) or 2 - 3 times (Nitrocellulose). Incubate the blot in 50% formamide, 6X SSC at 65°C for 30 - 60 minutes. Wrap stripped blot in plastic wrap and place on film overnight to confirm probe removal. Note: If blot is allowed to dry with probe bound to it, the probe will become permanently attached.
Protocol 4.1.2cAlkaline Blotting
Positively charged nylon membranes allow the use of alkaline transfer buffers, which link the nucleic acids to the membrane without UV crosslinking. In some cases, alkaline blotting gives a higher background. Increasing the concentration of blocking reagent will often eliminate this problem.
NORTHERN BLOTTING Follow the basic procedure given in protocol 4.1.2a using 40mM NaOH
in place of the 10X SSC.
SOUTHERN BLOTTING Follow the procedure in protocol 4.1.2b, omitting step 5, and using 0.4M
NaOH in place of 10X SSC.
Calculation of theoretical melting temperature (Tm) a. TmDNA: RNA = 79.8°C + 18.5 (log10[Na]) + 0.58 (%GC) + 11.8 (%GC)2 -
0.50 (%F) - (820/length) b. Tm decreases by ~ 1° C for every 1% increase in mismatches. c. Tm decreases by 0.5° C for every increase of 1% in formamide (%F). d. A good hybridization temperature to begin with is ~ 20°C below the
calculated Tm. e. Washes should be carried out at ~15°C below the calculated Tm.
STRINGENCY WASHES After hybridization, non-specifically bound probe is removed by wash-
ing in low salt buffer at high temperature. The salt concentration and temperature must be optimized for each probe/sample combination. A good starting point is to wash 1x 20 min in 1X SSC, 0.1% SDS at 45° C, followed by 3 x 20 min in 0.2X SSC, 0.1 % SDS at 65° C.
AUTORADIOGRAPHY See Section 4.1.2.
STRIPPING After autoradiography, the probe may be stripped from the blot, allowing
the blot to be re-probed up to 5 times (nylon) or 2 - 3 times (Nitrocellulose). Incubate the blot in 50% formamide, 6X SSC at 65° for 30 - 60 minutes. Wrap stripped blot in plastic wrap and place on film overnight to confirm probe removal. Note: If blot is allowed to dry with probe bound to it, the probe will become permanently attached.
Protocol 4.1.2bSouthern Blotting
The protocols given are for Genomic Southern Blotting. This set of protocols will give superior results in any standard Southern application.
SAMPLE PREPARATION Genomic DNA samples must be extremely pure, A260/A280 = 1.8, with no
nuclease contamination and minimal fragmentation.
RESTRICTION DIGESTION Digests must be complete for results to be interpretable. It is advisable
to run test reactions for the first blot, to optimize conditions and times. Incomplete digests are the primary cause of Southern Blot failure. It is particularly important to ensure that DNA has fully dissolved prior to digestion (allow 2 - 3 hours @ 4° C).
A 1 kb gene fragment is present in a typical mammalian genome at 0.3 ppm. This level of representation can be detected in ~ 10 µg of digested genomic DNA, using probes (length ~ 500 bp) labeled to 109counts/µg.
ELECTROPHORESIS(See Section 2.4.2 Restriction mapping)Include lanes of DNA markers, because digests of genomic DNA generate a smear, not discrete bands.
1. Use 0.7% of a low EEO Agarose, run in 1X TBE.2. Photograph gel after EtBr staining using a fluorescent ruler as a reference
scale.
TRANSFER1. Soak gel for 10 minutes in 5 volumes of 0.2N HCl. Soaking may be
stopped when Bromophenol blue dye begins to turn yellow, indicating that the pH of the gel has dropped. Do not soak longer than 10 minutes.
2. Rinse gel in 5 volumes of deionized water for 5 minutes. Note: This step depurinates scattered sites on the DNA. These sites are cleaved
by the alkaline treatment below, enhancing the transfer of fragments >10kb. If all fragments of interest are known to be < 10kb, this step may omitted.
3. Soak gel for 45 minutes in denaturation solution (1.5M NaCl, 0.5M NaOH) at room temperature with gentle agitation.
4. Rinse in deionized water 1 - 2 minutes. 5. Soak gel for 30 minutes in neutralization solution (1M Tris pH 7.4, 1.5M
NaCl) with gentle agitation.6. Set up capillary stack as for Northern Blotting (Protocol.4.1.2a) using
10X SSC buffer. For recovery of small fragments < 500 bp, use 20X SSC. Note that nylon will bind small fragments better than Nitrocellu-lose.
7. Allow to transfer overnight.
c o n t i n u e d
c o n t i n u e d

85USA: 1-800-526-3867EUROPE: 441 482 646022
Electrophoresis Applications - Post Electrophoretic AnalysisElectrophoresis
Applications
4.1.3 AutoradiographyAutoradiography is the use of X-ray (or occasionally photographic) film to detect radioactive materials. It produces a permanent record of the positions and relative intensities of radiolabeled bands in a gel or blot. Typically, biomolecules are labeled with 32P or 35S and detected by overnight film exposure.
Radioactive Exposure of Filmβ-particles emitted by radionuclides penetrate film emulsions to a depth proportional to their energy. As these particles pass through the film, they activate the silver halide crystals in the emulsion. Activated crystals are detected by reduction to black silver grains in the development step. The activated silver halide crystals are not stable, although they can be stabilized by further exposure to β-particles, or to light. On average, a crystal will require 5 “hits” from either radioactive emissions or light to be stably activated, and thus detected. In order to compensate for this instability, autoradiography is often carried out at –70°C, which stabilizes the activated crystals, enhancing sensitivity. Additional sensitivity is gained by “preflashing” the film before use. The film is exposed to a microsecond burst of light which is calibrated to bring the crystals in the film to a partially stabilized, activated state. Preflashed film requires only one “hit” per grain deposited. This not only increases sensitivity but also ensures that the film signal will be linear with the amount of radioactivity, even at very low signal levels.
FluorographySensitivity of autoradiography can be greatly enhanced through the use of fluorography, which converts radioactive emissions into light. Light penetrates film more efficiently than β-particles and is therefore more readily detected. Various phosphor compounds are available which can be dried into a gel, and which absorb the energy from β-particles and re-emit it as light. For high energy β- particles, though, such as those from 32P, the problem is not insufficient penetration but over-penetration, in which the emitted particles pass entirely through the film without activating the emulsion. To recover the energy of these “lost” particles, phosphorescent intensifying screens are used, which emit light on irra-diation. Phosphorescent intensifying screens require low temperatures (-70°C) for optimum performance.
Protocol 4.1.3aAutoradiography
Because water quenches beta particle emissions, optimum sensitivity is obtained using dried blots and gels . However, because drying blots permanently fixes the probe onto the membrane, if blots are to be stripped and re-probed, DO NOT DRY. Wrap in plastic wrap to prevent water and radioactivity from contacting the film. Note that 35S and 14C emit β-particles at low energy, and the majority of such particles are unable to penetrate a layer of plastic wrap. For 35S or 14C detection place the dry gel or blot directly on the film or use fluorographic enhancement. Use high quality X-ray film: Kodak XAR or equivalent.
1. Prepare gel or blot.2. Wrap wet samples in plastic wrap.3. Tape the sample to the inside face of an X-ray cassette, with enhance-
ment screens for 32P if desired. It is essential to fasten the sample so it does not move, because it must later be aligned with the exposed film.
4. Fasten a phosphorescent ruler or other orientation aid (radioactive dots) along one side. If a marker other than a ruler is used, be sure to include enough marks to unambiguously align the developed film to the sample.
5. In the dark, or under safelight, place one piece of X-ray film over the sample. For 35S or 14C, room temperature exposure is sufficient. For 32P, intensifying screens require a temperature of -70° C for exposure.
6. Expose film. Use Tables 4.1.3a & b as a guide for length of exposure. A good rule of thumb is that bands must be detectable on a Geiger counter for overnight exposure to be sufficient.
7. To avoid condensation on the film allow the cassette to return to room temperature before opening. Develop the film according to manufac-turer’s instructions.
Autoradiographic Enhancement with AutofluorNational Diagnostics’ Autofluor is an extremely sensitive, water based fluorographic enhancer for autoradiography on gels, TLC plates or paper chromatograms.
GELS1. After staining, fix the gel with 5% glacial acetic acid, 5% isopropyl alcohol,
and 90% water. Fix for 15 to 20 minutes. Pour off fixing solution and discard according to radioactive disposal procedures.
2. Rinse the gel in a continuous flow of water for 15 minutes to ensure the complete removal of any acetic acid residue.To prevent crystal formation, it is important that the gel be thoroughly rinsed after fixing. Should the gel develop white crystals on contact with Autofluor, dissolve the precipitate by soaking the gel in a solution of 1g sodium carbonate/100ml water or in Tris Buffer. Soak the gel in Autofluor until the white precipitate is fully dissolved. Repeat from the beginning of step 2.
3. Cover gel with Autofluor until the depth of Autofluor is twice the thickness of the gel. Gently agitate in Autofluor for 30 min/mm of gel thickness. Pour off remaining Autofluor and retain for future use. Label reserved material as radioactive. Autofluor may be reused several times before a diminishing response is observed.
4. DO NOT WASH GEL. Place directly on filter paper and dry on gel dryer under heat (80oC) and vacuum.
5. The gel will have a white to light tan sparkling appearance similar to freshly fallen snow.
6. Place on film and expose at -70oC. Due to the higher light output of the Autofluor phosphor, less exposure time is needed for gels treated with Autofluor than for gels treated with PPO/DMSO. Sufficient exposure time for a 5000 dpm/band is 24 hours. Overexposure of the film will cause the bands to become fuzzy and resolution to be lost.
7. Develop film according to manufacturer’s instructions.
PAPER CHROMATOGRAPHY AND TLC PLATES1. Spray twice or dip plates in Autofluor and allow to dry.2. Place on film and expose at -70oC.
TO MAXIMIZE AUTOFLUOR EFFICIENCY• If gels crack or stick during drying, add 0.5% (5ml/liter) of glycerol directly
to the Autofluor before using.• Since Autofluor is inducted into the gel by crystallization in situ as op-
posed to precipitated, it is advantageous to form the smallest crystals possible. This is accomplished by drying as quickly as possible under the strongest vacuum possible. A vacuum pump with a good seal on the dryer is preferred over a “house vacuum.” After the gel appears dry, turn off heat and continue vacuum for another 1/2 hour.
X-ray filmGel or blot
Figure 4.1.3a Typical autoradiographic technique involves enclosing the gel or blot with X-ray film for at least 24 hours within an X-ray cassette. Development of the film reveals the gel or blot image. Note the use of radioactive or phosphores-cent dots to record the orientation of the film. Table 4.1.3a gives the amounts of commonly used isotopes which can be detected by overnight autoradiography.
Autoradiography Detection Limits
MinimumCPM for
Detection3H
14C35S32P125I
>107
2000
1000
100
100
0.0055
0.050
0.167
0.70
(gamma)
Energy perEmission
(MEV)
Isotope
Table 4.1.3a
Gel %
Fluorography Exposure Times
DPM/band
500
5000
300
1000
8.3
83
5
17
Beq./band
Exposure(hours)
48-72
24
24
8-12
3H3H
14C/35S14C/35S
Isotope
Table 4.1.3b
Autoradiography Enhancement
Autofluor LS-315National Diagnostics’ autoradiographic image intensifier, Autofluor, is a water based phosphor that yields superior results to PPO-DMSO. (pg. 30)
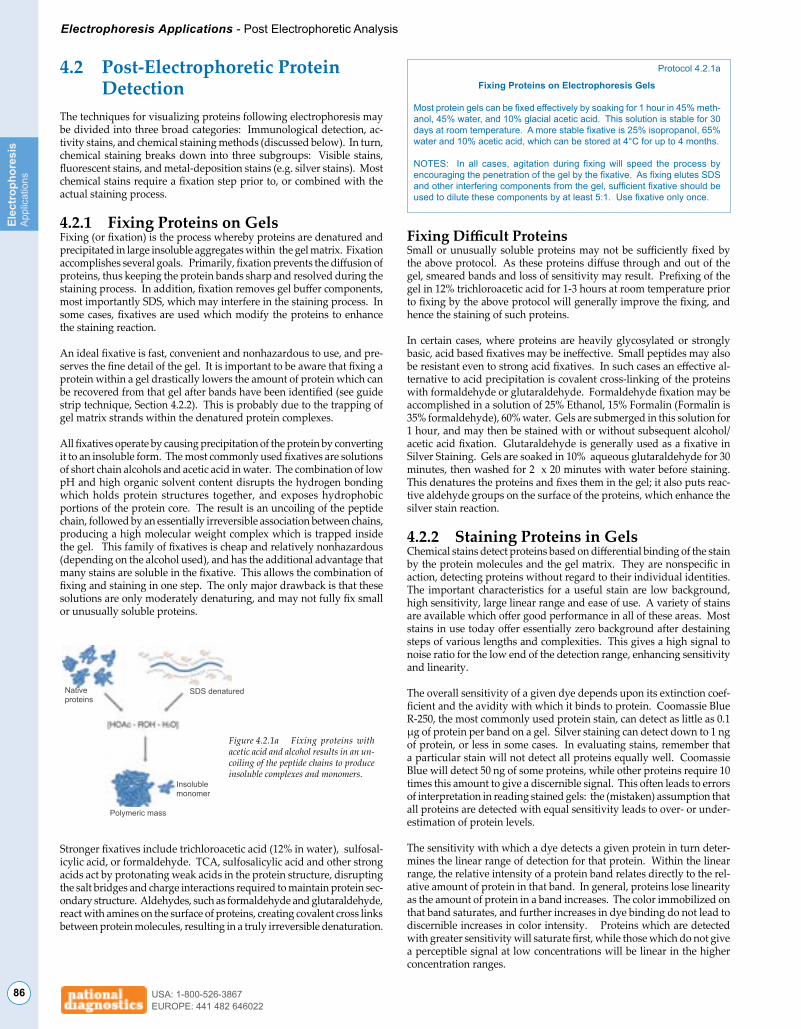
86 USA: 1-800-526-3867EUROPE: 441 482 646022
Electrophoresis Applications - Post Electrophoretic AnalysisEl
ectr
opho
resi
sA
pplic
atio
ns
SDS denaturedNative proteins
Polymeric mass
Insoluble monomer
4.2 Post-Electrophoretic Protein DetectionThe techniques for visualizing proteins following electrophoresis may be divided into three broad categories: Immunological detection, ac-tivity stains, and chemical staining methods (discussed below). In turn, chemical staining breaks down into three subgroups: Visible stains, fluorescent stains, and metal-deposition stains (e.g. silver stains). Most chemical stains require a fixation step prior to, or combined with the actual staining process.
4.2.1 Fixing Proteins on GelsFixing (or fixation) is the process whereby proteins are denatured and precipitated in large insoluble aggregates within the gel matrix. Fixation accomplishes several goals. Primarily, fixation prevents the diffusion of proteins, thus keeping the protein bands sharp and resolved during the staining process. In addition, fixation removes gel buffer components, most importantly SDS, which may interfere in the staining process. In some cases, fixatives are used which modify the proteins to enhance the staining reaction.
An ideal fixative is fast, convenient and nonhazardous to use, and pre-serves the fine detail of the gel. It is important to be aware that fixing a protein within a gel drastically lowers the amount of protein which can be recovered from that gel after bands have been identified (see guide strip technique, Section 4.2.2). This is probably due to the trapping of gel matrix strands within the denatured protein complexes.
All fixatives operate by causing precipitation of the protein by converting it to an insoluble form. The most commonly used fixatives are solutions of short chain alcohols and acetic acid in water. The combination of low pH and high organic solvent content disrupts the hydrogen bonding which holds protein structures together, and exposes hydrophobic portions of the protein core. The result is an uncoiling of the peptide chain, followed by an essentially irreversible association between chains, producing a high molecular weight complex which is trapped inside the gel. This family of fixatives is cheap and relatively nonhazardous (depending on the alcohol used), and has the additional advantage that many stains are soluble in the fixative. This allows the combination of fixing and staining in one step. The only major drawback is that these solutions are only moderately denaturing, and may not fully fix small or unusually soluble proteins.
Protocol 4.2.1a
Fixing Proteins on Electrophoresis Gels
Most protein gels can be fixed effectively by soaking for 1 hour in 45% meth-anol, 45% water, and 10% glacial acetic acid. This solution is stable for 30 days at room temperature. A more stable fixative is 25% isopropanol, 65% water and 10% acetic acid, which can be stored at 4°C for up to 4 months.
NOTES: In all cases, agitation during fixing will speed the process by encouraging the penetration of the gel by the fixative. As fixing elutes SDS and other interfering components from the gel, sufficient fixative should be used to dilute these components by at least 5:1. Use fixative only once.
FixingDifficultProteinsSmall or unusually soluble proteins may not be sufficiently fixed by the above protocol. As these proteins diffuse through and out of the gel, smeared bands and loss of sensitivity may result. Prefixing of the gel in 12% trichloroacetic acid for 1-3 hours at room temperature prior to fixing by the above protocol will generally improve the fixing, and hence the staining of such proteins.
In certain cases, where proteins are heavily glycosylated or strongly basic, acid based fixatives may be ineffective. Small peptides may also be resistant even to strong acid fixatives. In such cases an effective al-ternative to acid precipitation is covalent cross-linking of the proteins with formaldehyde or glutaraldehyde. Formaldehyde fixation may be accomplished in a solution of 25% Ethanol, 15% Formalin (Formalin is 35% formaldehyde), 60% water. Gels are submerged in this solution for 1 hour, and may then be stained with or without subsequent alcohol/acetic acid fixation. Glutaraldehyde is generally used as a fixative in Silver Staining. Gels are soaked in 10% aqueous glutaraldehyde for 30 minutes, then washed for 2 x 20 minutes with water before staining. This denatures the proteins and fixes them in the gel; it also puts reac-tive aldehyde groups on the surface of the proteins, which enhance the silver stain reaction.
4.2.2 Staining Proteins in GelsChemical stains detect proteins based on differential binding of the stain by the protein molecules and the gel matrix. They are nonspecific in action, detecting proteins without regard to their individual identities. The important characteristics for a useful stain are low background, high sensitivity, large linear range and ease of use. A variety of stains are available which offer good performance in all of these areas. Most stains in use today offer essentially zero background after destaining steps of various lengths and complexities. This gives a high signal to noise ratio for the low end of the detection range, enhancing sensitivity and linearity.
The overall sensitivity of a given dye depends upon its extinction coef-ficient and the avidity with which it binds to protein. Coomassie Blue R-250, the most commonly used protein stain, can detect as little as 0.1 µg of protein per band on a gel. Silver staining can detect down to 1 ng of protein, or less in some cases. In evaluating stains, remember that a particular stain will not detect all proteins equally well. Coomassie Blue will detect 50 ng of some proteins, while other proteins require 10 times this amount to give a discernible signal. This often leads to errors of interpretation in reading stained gels: the (mistaken) assumption that all proteins are detected with equal sensitivity leads to over- or under- estimation of protein levels.
The sensitivity with which a dye detects a given protein in turn deter-mines the linear range of detection for that protein. Within the linear range, the relative intensity of a protein band relates directly to the rel-ative amount of protein in that band. In general, proteins lose linearity as the amount of protein in a band increases. The color immobilized on that band saturates, and further increases in dye binding do not lead to discernible increases in color intensity. Proteins which are detected with greater sensitivity will saturate first, while those which do not give a perceptible signal at low concentrations will be linear in the higher concentration ranges.
Figure 4.2.1a Fixing proteins with acetic acid and alcohol results in an un-coiling of the peptide chains to produce insoluble complexes and monomers.
Stronger fixatives include trichloroacetic acid (12% in water), sulfosal-icylic acid, or formaldehyde. TCA, sulfosalicylic acid and other strong acids act by protonating weak acids in the protein structure, disrupting the salt bridges and charge interactions required to maintain protein sec-ondary structure. Aldehydes, such as formaldehyde and glutaraldehyde, react with amines on the surface of proteins, creating covalent cross links between protein molecules, resulting in a truly irreversible denaturation.

87USA: 1-800-526-3867EUROPE: 441 482 646022
Electrophoresis Applications - Post Electrophoretic AnalysisElectrophoresis
Applications
Ease of use varies considerably from one stain to another. Coomassie staining, for example, requires up to 16 hours to complete, but requires minimal “hands on” time. In contrast, silver staining can be completed in one hour, but requires intense worker involvement. There are varia-tions on most staining techniques which trade time or convenience for sensitivity, or sensitivity for time.
Xylene Cyanole(nucleotides)Gel %
Protein Staining Techniques
Time Required
Amido Black
Coomassie Blue R-250
Coomassie Blue G-250
Colloidal Coomassie
Immunological
Insite System
Silver
Zinc
12 hrs
16 hrs
1-2 hrs
1-8 hrs
4-6 hrs
30 min
2 hrs
10 min
500 ng
50 ng
200 ng
5 ng
<10 pg
10 ng
1 ng
10 ng
SensitivityStain
Table 4.2.2a
Mechanism of StainingWith the exception of silver staining, chemical stains operate by binding to proteins with a higher affinity than to the gel matrix. The result is a local increase in concentration of the dye in the protein bands. Chem-ical staining is usually a two step procedure. The gel is first saturated with the dye. Then, excess dye is washed out under conditions which favor dye binding to protein. The three most commonly used dyes for in-gel staining are Amido Black, Coomassie Blue G-250, and Coomassie Blue R-250.
Coomassie BlueThe Coomassie dyes (R-250 and G-250) bind to proteins through ionic interactions between dye sulfonic acid groups and positive protein amine groups as well as through Van der Waals attractions. Coomassie R-250, the more commonly used of the two, can detect as little as 50 ng of protein. Though less sensitive, Coomassie G-250 can be used in place of the R-250 form to create a rapid and convenient staining procedure. This capability of G-250 is due to its particular properties. Coomassie G-250 manifests a leuco form below pH 2. Solutions of the dye, dark blue black at pH 7, turn a clear tan upon acidification. The leuco form recovers its blue color upon binding to protein, apparently due to the more neutral pH of the environment around the protein molecule. Under proper conditions, a gel placed in an acidified solution of Coomassie G-250 will manifest blue protein bands on a light amber background. The bands develop rapidly and there is no need to destain, for the background color is so light as to be essentially clear. This stain is less sensitive than Coomassie Blue R-250 protocols, detecting 200 ng of most proteins. The loss in sensitivity is offset by the speed and convenience of the protocol, which saves up to 11 hours versus the most sensitive R-250 procedures.
Protocol 4.2.2a
Staining Gels with Coomassie Blue R-250 or Coomassie Blue G-250
STANDARD PROTOCOL - COOMASSIE BLUE R-250
1. Gel may be prefixed in 50% MeOH, 10% HOAc, 40% H2O for 30 minutes to overnight.
2. Stain gel in the above solution, with 0.25% Coomassie Blue R-250, for 2 - 4 hours, until the gel is a uniform blue color. Staining is complete when the gel is no longer visible in the dye solution. Prior to complete staining, the gel will appear as a lighter area against the dark staining solution.
3. Destain for 4 - 24 hours in 5% MeOH, 7.5% HOAc, 87.5% H2O. Bands will begin to appear in 1 - 2 hours. Destain until background is clear.
This method will detect as little as 50ng/band.
4. Store gels in 7% HOAc.
RAPID PROTOCOL - COOMASSIE BLUE R-250
1. Fix gel in 25% IPA, 10% HOAc in water, 30 - 60 minutes.
2. Stain gel in 10% Acetic Acid in water, containing 60 mg/L of Coomassie Blue R-250. Bands will appear in 30 minutes. Allow staining to proceed until desired band intensity is reached. In this protocol, background staining is low due to the very low dye concentration used.
3. Destain gel in 10% Acetic Acid for 2 hours or more. Store gels in 7% HOAC.
RAPID PROTOCOL - COOMASSIE BLUE G-250
1. To make the Coomassie Blue G-250 staining reagent, dissolve 0.2g dye in 100 ml H2O (this will require warming to ~ 50°C). Cool and add 100 ml 2N H2S04. Incubate at room temperature 3 hours to overnight, then filter. To filtered solution, CAREFULLY add 22.2 ml 10N KOH, then add 28.7g TCA. Allow to stand > 3 hours, then filter again if necessary to obtain an amber-brown solution without blue precipitate.
2. To stain, immerse gel in above solution. Bands will begin to appear within 15 minutes. Intensity and sensitivity will continue to improve for several hours.
3. Staining solution is stable for 2 - 3 weeks @ 25°C.
Colloidal CoomassieThe capacity of Coomassie Blue G-250 to form metastable colloidal suspensions has been exploited to create a stain which is substantially more sensitive than the standard Coomassie R-250 protocol. In high salt, acidic solutions, the G-250 dye disperses to form a uniform col-loid. The particles of this colloid have two useful properties. First, they are too large to enter into most gel pores, so submerging a gel in the dye suspension does not create a high background color. Second, the particles break down upon contact with proteins, releasing soluble dye. When a gel is submerged in a colloidal suspension of Coomassie Blue G-250, particles of dye essentially dissolve into the protein bands, resulting in an accumulation of color only where protein bands are present. Destaining is not required.
Colloidal Coomassie stains are capable of detecting as little as 5ng of protein per band. Although the development of bands below 20 ng may take up to 8 hours, the “hands on” time of this type of stain is gener-ally less than 10 minutes. Because of its ease and sensitivity, colloidal Coomassie staining has gained a great deal of popularity.
Figure 4.2.2b The two Coomassie Blue dyes, R-250 and G-250, differ by two methyl groups.
Coomassie Blue R-250 Coomassie Blue G-250
ProtoStain Blue EC-727Easy-to-Use, Eco-Safe Colloidal Coomassie Stain. Detects as little as 1ng of protein per band. (pg. 21)
Coomassie Blue G-250 HS-605Converted to a leuco form at low pH, used in colloidal staining techniques. (pg. 23)
Products for Staining Proteins in GelsSTERLING Rapid Silver Stain EC-720 The fastest and most sensitive silver stain to date, producing superb results in one hour. (pg. 22)
Coomassie Blue R-250 HS-604Coomassie Blue R-250 is the time-tested standard for protein visualization. (pg. 23)

88 USA: 1-800-526-3867EUROPE: 441 482 646022
Electrophoresis Applications - Post Electrophoretic AnalysisEl
ectr
opho
resi
sA
pplic
atio
ns
Protocol 4.2.2b
Procedures for Using ProtoStain Blue
ProtoStain Blue stain formulation is compatible with all polyacrylamide gel types, and produces lower background staining than competing stains without requiring extensive water destaining to produce a crystal-clear background.
ProtoStain Blue is ready to use- no measuring or mixing required.
STANDARD PROTOCOLAs llittle as 1ng of denatured BSA can be detected by this protocol.
1. Wash the gel 3 times for 10 minutes each with deionized water on an orbital shaker. Decant wash solution.
2. After the last wash, add enough ProtoStain Blue solution to completely cover the gel.
3. Bands containing more than 1µg of protein will be detected within 15 minutes. For full sensitivity incubate the gel in the stain for at least 4-5 hours. Longer incubations in the stain will not adversely affect the gel or the staining sensitivity.
4. Remove the stain and wash the gel in deionized water. Incubating the gel in water increases the sensitivity of detection by reducing the background to crystal clear. The gel is stable in water for up to a week without loss of sensitivity. There is no need to store the gel in a salt solution.
RAPID PROTOCOL (60 minutes)For fast staining - complete in 60 minutes. 20ng of denatured BSA can be detected after 10 minutes destaining in water. Less than 5ng can be detected after overnight incubation in water, due to a combination of bands binding residual dye and the production of a crystal clear background.
All steps are performed in a loosely covered plastic container. This protocol is optimized for 0.75mm thick laemmli formulation mini gels.
1. Wash the gel by heating to 95°C in deionized water for 45 seconds to one minute. Incubate for an additional minute on an orbital shaker.
2. Repeat the above step two more times. After the last wash rinse the gel in cold deionized water. Decant rinse water.
3. Warm enough ProtoStain Blue solution to 65°C to completely cover the gel. Add warmed stain to the gel.
4. Shake the gel in the stain on an orbital shaker for 10-50 minutes. Gels thicker than 0.75mm may require longer incubations. Remove the stain and rinse the gel several times. Incubate the gel in water on an orbital shaker until the required contrast/sensitivity is achieved.
PREPARING SAMPLES FOR MASS SPECTROSCOPYGels stained with ProtoStain Blue can be destained for in-gel tryptic digests with 25-100mM ammonium bicarbonate/50% acetonitrile.
Procedure:1. Cut out gel band or spot. Cut band into 1mm x 1mm pieces if necessary.
Place in an eppendorf tube.
2. Add 200μl destaining solution to gel pieces.
3. Incubate at room temperature or 37°C for 30-45 minutes.
4. Remove destaining solution.
5. Repeat steps 2-3. Gel pieces should now be transparent.
Fluorescent StainsVarious stains have been developed over the past decade which offer fluorescent detection of proteins in gels. These compounds show an increase in fluorescence upon protein binding. The sensitivity of these stains varies from the range of standard Coomassie staining to better than Silver staining. The protocols for fluorescent stainng are generally rapid and straightforward, but acceptance of these stains has been limited by the need for a UV light box and photographic system, and the lack of permanent staining on the gel.
Zinc StainsProteins contain many chemical groups which can bind metal ions. A number of stains have been developed which take advantage of this capacity. Zinc staining is the most sensitive and convenient represen-tative of this group of detection systems. In zinc staining, the gel is first impregnated with imidazole, and then placed in a solution of a zinc salt. The bivalent zinc forms an insoluble complex with the bidentate imidazole. Precipitation of this complex turns the gel an opaque white. Protein bands sequester the zinc in their vicinity, preventing formation of the precipitate. The result is clear bands on an opaque white gel, with sensitivities down to nanogram levels. One significant advantage of this technique is that it is non-denaturing and completely reversible. It is thus ideal for applications where recovery of intact, unaltered protein is desired.

89USA: 1-800-526-3867EUROPE: 441 482 646022
Electrophoresis Applications - Post Electrophoretic AnalysisElectrophoresis
Applications
Silver StainsUtilizing the same chemistry as black and white photography, silver staining is another highly sensitive method for the visualization of pro-tein bands on electrophoresis gels. Silver ions are reduced to insoluble silver metal granules in the vicinity of the protein molecules. Sufficient silver deposition is visible as a dark brown or black band on the gel.
The exact mechanism of silver staining is subject to debate, but certain key points are generally acknowledged. Staining appears to be depen-dent upon the initial reduction and resulting immobilization of a small number of silver ions by the proteins in the gel. This reduction may be caused by aldehydes created during fixing with glutaraldehyde or with oxidizing agents (e.g. chromic acid). Reduction of silver may also be enhanced by sequestration of the silver cations by carboxylic acid side chains, or by amino side chains, creating an amine-silver complex.
The initial deposition of silver is referred to as a latent image. This “image” is not visible, as the number and size of the silver granules de-posited at this stage are minute. In the next stage a moderate reducing environment is created in the gel, in which all of the silver ions begin to “plate out” slowly. The silver granules which make up the latent image act to catalyze this process, resulting in more rapid deposition of silver at the sites of the protein bands. Silver staining is thus a kinetic process: development must be monitored and stopped at the point where the highest contrast between band and background is achieved.
Protocol 4.2.2e
Silver Staining with the Sterling Silver Kit
For mini-gels (10x7cm), use 100ml of each solution. For larger gels, increase STERLING volumes appropriately to immerse gel to depth of 1cm. Wash mini-gels in 200ml volumes of water, and agitate continuously during all steps. Glassware must be clean, and the water should be distilled or high-quality deionized.
FIX
1. Incubate the gel for 25 minutes in 100ml of the standard mixture of 5:5:1 Methanol:Water:Acetic Acid.
2. Decant fixative, then add reconstituted STERLING Fixative (45ml water, 50ml methanol, 5ml STERLING Fixative Concentrate) and fix for an additional 5 minutes.
WASH
1. Rinse the gel twice for 15 minutes in deionized water. The addition of 0.1% nonionic surfactant will aid in submerging the gel.
2. While the gel is washing, prepare Staining Solution (see below). Do not combine the two component solutions until just prior to use.
PREPARATION OF STAINING SOLUTION
1. Dilute 25ml Reagent A with 25ml of water.
2. Dissolve 2.8 grams of Reagent B in 50ml of water. STIR UNTIL COM-PLETELY DISSOLVED (approx. 5-10 minutes).
3. Immediately prior to use, quickly pour (1) into (2) while stirring, and pour over gel. The combined solution has a useful life of 20 minutes.
STAIN
1. Decant wash solution and immerse gel in combined staining solution.
2. Bands will begin to appear in 5-10 minutes. When desired intensity is achieved, stop development by immersing the gel in a 5% acetic acid solution.
Guide Strip TechniqueIn certain instances, the effects of staining a protein may interfere with subsequent analysis. Examples are Coomassie staining when enzymatic activity is required, or silver staining prior to amino acid analysis, when covalent modification of the amino acids will give spurious results. In these cases, it is common to use a “guide strip”. A guide strip is a lane which is run parallel to the lane to be analyzed, and containing either size markers or a duplicate sample. After the gel is run, the guide strip is cut off and stained, and then realigned with the gel and used as a template to guide band excision. The technique is straightforward. The only common error is to fail to re-equilibrate the gel with running buffer after staining. As many stains cause shrinkage or swelling of the gel, re-equilibration is necessary for accurate and consistent realignment.
Figure 4.2.2b In the Guide Strip Technique, a parallel lane is excised and stained to guide band excision.
Staining of Proteins Immobilized on MembranesImmunological detection of proteins requires that proteins be trans-ferred and immobilized onto a membrane support after electrophoresis (Section 4.2.3 Western Blotting). Staining of the immobilized proteins establishes transfer efficiency, and allows the operator to mark the membrane with the locations of lanes and size markers, facilitating later analysis. The mechanism of staining is the same as for in-gel staining. Conditions must be established under which the dye binds more avidly to the protein than to the support, resulting in dark, high contrast zones corresponding to the presence of protein. However, the requirements for the staining are different. Sensitivity is less of an issue, as markers are generally loaded in high concentration, and lanes of sample will show up even when individual bands in the lanes may be faint. Speed and protein recovery (not stripping the protein from the membrane) are more important in this case.
Protocol 4.2.2f
Staining of Proteins Immobilized on Membranes
PONCEAU S
1. To make a stock solution of Ponceau S, dissolve 0.5g Ponceau S in 100 ml of 1% Aqueous Acetic Acid.
2. Immerse blot in Ponceau S stock solution for 5 minutes.
3. Transfer blot to deionized H2O, and agitate until bands appear (1-5 minutes).
4. Mark bands with indelible ink (note: bands will fade in 15 minutes).
INDIA INK
1. Wash blot in 0.3% Tween 20 in Phosphate Buffered Saline (PBS), 5 x 30 minutes @ 37°C.
2. Transfer blot to India Ink solution (0.1% Pelikan 17 Black or equivalent in 0.3% Tween 20 PBS)
3. Rinse membrane 2 times in Tween solution. Destain in Tween 20 solution until desired contrast is achieved.
This protocol will detect as little as 50 µg per band.

90 USA: 1-800-526-3867EUROPE: 441 482 646022
Electrophoresis Applications - Post Electrophoretic AnalysisEl
ectr
opho
resi
sA
pplic
atio
ns
Figure 4.2.3a The basic method of immunostaining is to probe with an antibody which is bound to a detect-able molecule such as an enzyme or a fluorescent dye.
4.2.3 Immunological Detection of ProteinsThe highly specific binding interaction between antibodies and their unique antigens has been exploited to create sensitive and specific de-tection systems for proteins. An antibody can be raised and/or purified against a single epitope on an antigen. When antibody and antigen are mixed, the antibody will bind tightly to the epitope it recognizes. This identifies the antigen as bearing the epitope in question. Thus, immu-nological detection answers questions about the structure and identity of a protein which cannot be addressed through conventional chemical stains. In addition, immunological detection can be as much as 100 fold more sensitive than chemical stains.
Mechanism of ImmunostainingAntibodies, or immunoglobulins, are produced by the body in response to invasion by foreign proteins. The function of an antibody is to bind to a specific site (epitope) on the invader, thus tagging it for destruc-tion by other agents of the immune system. The salient characteristics of antibody binding are binding strength and selectivity. In assay terminology, antibodies are said to be accurate (low false negatives) and specific (low false positives). In the body, the mere presence of a bound antibody on the surface of an antigen is sufficient signal for the immune system to “detect” that molecule. In an in-vitro assay, addi-tional aids are required. These aids take the form of easily detectable molecules, which are bound to the antibody. Examples are enzymes, such as horseradish peroxidase (HRP) or fluorescent dyes. Enzymes are particularly suited to this role, because they are proteins, and thus stable wherever antibodies are stable. The catalytic cycling of enzymes greatly multiplies the sensitivity of the assay. The two enzymes most commonly used for labeling antibodies are horseradish peroxidase and alkaline phosphatase (AP). Chromogenic and luminogenic substrates are available for both of these enzymes.
Alkaline phosphataseAlkaline phosphatase catalyzes the removal of a phosphate group from its substrate. A variety of synthetic substrates have been constructed which, on phosphate hydro-lysis, liberate chromogens or luminescent compounds. A commonly used chromo-genic substrate is bromochloroindoyl phos-phate (BCIP) in conjunction with nitro blue tetrazolium (NBT). Dephosphorylation of BCIP generates one half of an indigo dye molecule. Dimerization generates the indi-go dye, and liberates two reducing equiv-alents which can reduce NBT to the blue insoluble formazan. This system generates a deep blue insoluble dye, which is ideally suited for blotting procedures. Alternative-ly, PNPP (para nitrophenyl phosphate) is hydrolyzed to liberate a soluble yellow dye, useful for ELISA reactions.
Luminometric substrates for alkaline phosphatase are exemplified by CSPD (chloro-phospho-phenyl dioxetane). Upon dephosphorylation, this material yields a metastable charged dioxetane which then cleaves, releasing a highly energetic chlo-rophenylate. This molecule decays within 1 minute to a ground state, releasing light of wavelength 466 nm.
Horseradish PeroxidaseChromogenic and luminometric substances are also available for HRP. The “classic” chromogen used with HRP is diaminobenzidine (DAB). In the presence of H2O2, HRP will oxidize DAB, creating a water insoluble brown precipitate. DAB has two primary disadvantages, it is relatively insensitive and it is a potential carcinogen which must be decontami-nated before disposal.
The sensitivity and convenience of HRP based detection has been greatly enhanced by the use of luminol as a chemiluminescent substrate. HRP catalyzes the reduction of H2O2 to H2O, and then recovers the electrons used for this reduction from luminol, generating an oxidized luminol radical. The luminol radical reacts with O2 to create O2
–. The superoxide anion then reacts with a second luminol radical to produce a luminol endoperoxide, which subsequently decays with emission of light.
The chemiluminescent reaction of HRP with luminol can be enhanced up to 104 fold by the inclusion of a variety of compounds, including substituted phenols, amines and napthalene derivatives. The mechanism of enhancement is still unclear, but it is theorized that the enhancers act as “electron conduits,” channeling electrons more rapidly along the series of reactions from HRP + luminol to light emission.
Figure 4.2.3b Mechanism of light emission by CSPD, a luminescent substrate for use with alkaline phosphatase.
Dephosphorylation
Cleavage
LightEmission
Figure 4.2.3c Mechanism of light emission by luminol, a luminescent substrate for use with alkaline phosphatase.
ProtoGlow ECL CL-300Chemiluminescent system enhances horserad-ish peroxide visualization. Ideal for Western blotting. (pg. 24)
Tris-Glycine Electroblotting Buffer EC-880Stable, economical, ultra-pure. Absolutely reproducible performance. (pg. 19)
ProtoGel EC-89030% solution of Acrylamide and BisAcrylamide, 37.5:1 ratio. Filtered, Deionized, and Stabilized. (pg. 8)
Products for Western Blotting
ProtoBlock System CL-252To enhance signal to noise ratio during che-miluminescent membrane bound visualization techniques. (pg. 26)
Buffers:Formulated with 18 MegOhm water. 0.2 micron filtration. (pg. 19)
Tris-Glycine-SDS (10X) EC-870 ProtoGel Resolving Buffer (4X) EC-892ProtoGel Stacking Buffer (4X) EC-893TBS (10X) EC-881TBST (10X) EC-882PBS (10X) CL-253

91USA: 1-800-526-3867EUROPE: 441 482 646022
Electrophoresis Applications - Post Electrophoretic AnalysisElectrophoresis
Applications
Enzyme Linked Immunosorbent Assay (ELISA)One of the most straightforward applications of immunological detection is the ELISA, or enzyme linked immunosorbent assay (Figure 4.2.3d). In the simplest system, bound antigen is probed with antibodies which carry covalently attached enzyme molecules. Antibody binding immo-bilizes enzyme in the vicinity of the bound antigen, allowing detection of the antigen. Variations include a competition ELISA in which sample antigen is used to titrate the antibody from bound antigen. In this system, comparison of signal with signals from known antigen standards allows very accurate quantitation. In sandwich (capture) ELISAs, antibody is bound to a surface, and used to capture the antigen for detection by a second antibody. Sandwich ELISAs are extremely specific, because the antigen must react with 2 antibodies to be detected. ELISA signals may be chromogenic and interpreted by eye or spectrophotometer, or luminogenic and detected by a luminometer. Typically, ELISA’s are run in 96 well plates which are scanned (and sometimes processed) by automated devices.
Figure 4.2.3d The variations of ELISA (Enzyme Linked Immunosorbent Assay). Top: Basic ELISA, in which antigen is bound to a surface and probed with enzyme linked antibody, providing semi-quantitative information. Middle: Competitive ELISA. Purified antigen is bound to the surface. Probing is carried out in the presence of samples or dilutions of free antigen (standards). The free antigen competes with the bound antigen, reducing the amount of antibody bound. Com-parison between samples and standards yields quantitative information. Bottom: Sandwich ELISA, using one antibody to capture the antigen and another to detect it, resulting in increased specificity.
WesternBlottingProteins can also be detected immu-nologically following electrophoresis, a technique known as Western Blot-ting. This method relies on the fact that most epitopes (sites recognized by antibodies, generally comprising several amino acids) are still recog-nizable following denaturing of the protein with SDS and binding to the surface of a membrane. The two pri-mary advantages of Western Blotting are sensitivity and specificity. Silver staining may detect 10ng of protein, and it will detect all proteins in a given sample. Western blotting can detect as little as 0.1ng of protein, and it will selectively detect only the protein of interest. Thus a complex mixture containing only traces of the desired protein may be analyzed accurately with this technique.
Antibodies are large molecules and penetrate gels slowly. In order to efficiently use immunological staining for post-electrophoretic detection, the proteins in the gel must be immobilized on an exposed surface, a process called “blotting.” Electroblotting is commonly used in the West-ern system. Following the run, the gel is sandwiched with a membrane and a voltage is applied perpendicular to the plane of the gel, such that proteins are electrophoresed out of the gel and onto the membrane.
Various membranes are employed in Western blotting, but the two pre-dominant types are nitrocellulose and PVDF (polyvinylidine difluoride). Nitrocellulose was the first support used for Western blotting, and is still widely used. It probably binds proteins through hydrophobic interac-tions; the binding is blocked by oils. Nitrocellulose has a relatively high capacity for protein ( 50-100 µg/cm2 ), but it is also brittle and difficult to work with. In addition, the binding of proteins to the membrane has proven reversible under some circumstances, leading to sample loss and poorer detection limits.
PVDF is mechanically stronger than nitrocellulose. It binds proteins more tightly and has up to two fold higher capacity. Proteins immo-bilized on PVDF can be analyzed by microsequencing or amino acid analysis in addition to Western blotting. The PVC-like nature of this material gives it a resistance to mechanical and chemical stresses, and provides hydrophobic ”pockets” for denatured protein binding. For these reasons, PVDF has gained considerable popularity for Western blotting use.
Once the protein has been transferred to the membrane, the membrane (or blot) is blocked to prevent unoccupied protein binding sites from nonspecifically immobilizing antibodies in the following steps. Blocking generally is carried out by incubating the blot in skim milk, BSA or some other complex mixture of proteins and surfactants such as National Diagnostics’ ProtoBlock (CL-252). The blocked blot is then ready for antibody probing.
In order to achieve maximum sensitivity most Western blots are probed in two steps, using a “primary” and “secondary” antibody (Figure 4.2.3f). The primary antibody detects the protein of interest. If this antibody is “polyclonal” (that is, derived from an immunized animal, and therefore containing antibodies to multiple epitopes on the same protein) many antibodies will bind to each protein molecule. The secondary antibody is directed against the primary antibody, and is generally polyclonal, so several 2° antibodies will bind each 1° antibody. The result is an amplification, in which many 2° antibodies are bound to the site of each protein. The 2° antibody carries the enzyme label. Following binding and washing, detection reagents are applied to the gel to visualize the band(s) detected. Chromogenic substrates cause colored bands to appear on the white blot. If luminescent systems are used, the blot is placed against a piece of X-ray film and exposed, typically for 1 - 10 minutes.
Figure 4.2.3e The Western Blotting apparatus. Proteins are electrophoresed from the gel to the membrane.
MembraneGel
Filter paper
Foam pads
RubberbandsPositiveplate
Negative plate
Buffer
chamberFigure 4.2.3f In western blot-ting, use of polyclonal primary and secondary antibodies results in amplification of the signal.

92 USA: 1-800-526-3867EUROPE: 441 482 646022
Electrophoresis Applications - Post Electrophoretic AnalysisEl
ectr
opho
resi
sA
pplic
atio
ns
Protocol 4.2.3a
Western Blotting
ELECTROPHORESIS
Prepare and run an SDS PAGE gel as described in Protocol 3.1.2a. Select a gel percent which will give the best resolution for the size of antigen being analyzed (if known). If the size is not known, a 12% gel is a good starting point. Load enough protein to provide 0.1-1ng of antigen per well. It is generally advantageous to load serial dilutions of sample, so as to ensure that one lane at least will fall in the optimal range for detection. If desired, use prestained markers, such as National Diagnostics’ ProtoMarkers, to monitor transfer efficiency.
TRANSFER
Upon completion of the run, the gel must be transferred onto a blotting membrane. This can be accomplished by semi-dry transfer or wet transfer. Both are electrophoretic transfers, and require equipment designed for that purpose. The procedures outlined below are intended as general outlines. For best results and to ensure safety, follow the equipment manufacturer’s instructions for this phase.
SEMI-DRY BLOTTING
1. Rinse electrode plates with deionized H2O.
2. Cut 6 sheets of Whatman 3MM paper and 1 sheet of blotting membrane to the size of the gel, or slightly smaller.
3. Wet the membrane. Soak nitrocellulose in deionized H2O for 3 minutes. Soak PVDF in methanol for 1 minute. Transfer membrane to transfer buffer and soak for 3 minutes.
Transfer buffer: 0.025M Tris base 0.192M Glycine 20% MeOH
ASSEMBLE THE TRANSFER STACK
1. On the lower plate (positive, red lead), place in order:
3 sheets of 3MM (precut and wetted with transfer buffer) Transfer membrane Gel 3 sheets 3MM (precut and wetted with transfer buffer)
Remove any air bubbles by rolling over each layer as placed with a 10ml pipette. Be careful not to disturb the stack, or to let the gel stick to the pipette. Roll gel after placing first upper layer of paper, if desired. Note that bubbles trapped in the stack will distort current flow, leading to lateral band displacements and failure of bands to transfer.
2. Check to be sure that no portion of the upper paper stack contacts the
paper or the electrode underneath the gel. Contacts between upper and lower stacks will short circuit the current, distorting the transfer. In some systems, parafilm or plastic wrap may be arranged around the gel to prevent this short circuiting from occurring. Check the instructions.
3. Place the upper (negative, black lead) electrode plate on top of the stack, and apply current. Consult apparatus instructions; typical conditions are 1 hour @ 0.8 mA/cm2. Over-transfer may dry the gel and drive proteins through a Nitrocellulose membrane.
WET TRANSFER
1. Cut 2 sheets of Whatman 3MM paper and 1 sheet of transfer membrane to the size of the gel.
2. Wet the membrane: Soak Nitrocellulose in water for 2 minutes. Soak
PVDF in methanol for 2 minutes.
3. Place membrane in transfer buffer (see “Semi-Dry Blotting” above)
4. Assemble transfer “sandwich” in order:
Filter paper sheet Gel Membrane Filter paper sheet
5. Assemble sandwich clamps and support pads as per equipment man-ufacturer’s instructions.
6. Place sandwich in transfer tank with membrane side closest to the positive electrode (Red lead).
7. Add cold transfer buffer, and initiate cooling procedure.
8. Apply voltage: This parameter is entirely dependent upon the apparatus used. Large format gels may require 50 - 75V, 5 - 15 hours. Minigels can be blotted in 1 hour @ 50 - 100V in some systems.
POST TRANSFER
It is prudent to mark the blot in a permanent way for orientation, by notching or clipping a corner. If prestained markers were used, their positions should be marked in pencil or an alcohol indelible ink. Often well positions can be distinguished and marked immediately after transfer.
Notes: Nitrocellulose membranes may be air dried prior to further processing. It has been reported that this improves protein retention on the blot. After transfer, Coomassie staining of the gel (Protocol 4.2.2c) can give information about the efficiency of transfer.
1. Stain the blot as described in Protocol 4.2.2g, and mark the positions of well and markers. If prestained markers were used, this step may be skipped.
2. At this point it is very helpful to spot diluted primary and secondary antibody on an unused area on the blot. This can be invaluable for trou-bleshooting. If a blot fails (no bands are detected) the antibody spots can be interpreted as follows:
Visible: 1° & 2°- 2° antibody functioning well - label okay, 1° antibody may have failed.2° only- 2° antibody failed to bind 1° no spots- Label enzyme denatured - remake 2° antibody dilution.
BLOCKING
A variety of blocking reagents are available. It is worthwhile to optimize blocking procedures, as this step determines the background level of the blot, and hence the detection limit. The most universal blocking agents contain mixtures of proteins and surfactants. This combination provides good to excellent blocking on most membranes.
1. Blocking Solutions
a. ProtoBlock: Dissolve 10g of Reagent B in 170 ml di water. Add 20 ml of Reagent A.
b. Tween/milk: Dissolve 50g nonfat dry milk and 2 g Tween 20 in 1L
PBS. If product is to be stored for > 1 day, add 0.2 g NaN3 (CAU- TION - TOXIC!)
2. Blocking Procedure:
a. Immerse blot in blocking agent with agitation (i.e. a shaking or rock ing table) for 1 - 2 hours at room temperature.
b. Rinse blot in PBS + 0.2% Tween 20 twice for 5 minutes each.
Blot is now ready for antibody hybridization
ANTIBODY PROBING
1. Dilute 1° and 2° antibodies into PBS + 0.2% Tween (PBST).
c o n t i n u e d c o n t i n u e d
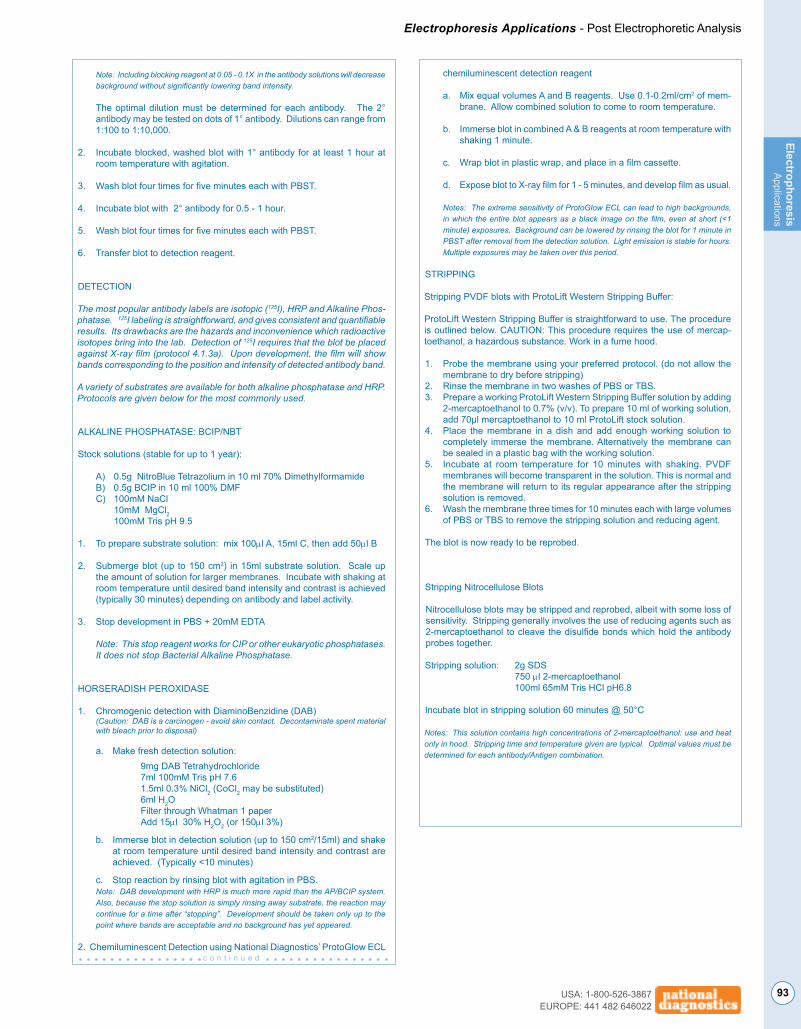
93USA: 1-800-526-3867EUROPE: 441 482 646022
Electrophoresis Applications - Post Electrophoretic AnalysisElectrophoresis
Applications
chemiluminescent detection reagent
a. Mix equal volumes A and B reagents. Use 0.1-0.2ml/cm2 of mem-brane. Allow combined solution to come to room temperature.
b. Immerse blot in combined A & B reagents at room temperature with shaking 1 minute.
c. Wrap blot in plastic wrap, and place in a film cassette.
d. Expose blot to X-ray film for 1 - 5 minutes, and develop film as usual.
Notes: The extreme sensitivity of ProtoGlow ECL can lead to high backgrounds, in which the entire blot appears as a black image on the film, even at short (<1 minute) exposures. Background can be lowered by rinsing the blot for 1 minute in PBST after removal from the detection solution. Light emission is stable for hours. Multiple exposures may be taken over this period.
STRIPPING
Stripping PVDF blots with ProtoLift Western Stripping Buffer:
ProtoLift Western Stripping Buffer is straightforward to use. The procedure is outlined below. CAUTION: This procedure requires the use of mercap-toethanol, a hazardous substance. Work in a fume hood.
1. Probe the membrane using your preferred protocol. (do not allow the membrane to dry before stripping)
2. Rinse the membrane in two washes of PBS or TBS.3. Prepare a working ProtoLift Western Stripping Buffer solution by adding
2-mercaptoethanol to 0.7% (v/v). To prepare 10 ml of working solution, add 70μl mercaptoethanol to 10 ml ProtoLift stock solution.
4. Place the membrane in a dish and add enough working solution to completely immerse the membrane. Alternatively the membrane can be sealed in a plastic bag with the working solution.
5. Incubate at room temperature for 10 minutes with shaking. PVDF membranes will become transparent in the solution. This is normal and the membrane will return to its regular appearance after the stripping solution is removed.
6. Wash the membrane three times for 10 minutes each with large volumes of PBS or TBS to remove the stripping solution and reducing agent.
The blot is now ready to be reprobed.
Stripping Nitrocellulose Blots
Nitrocellulose blots may be stripped and reprobed, albeit with some loss of sensitivity. Stripping generally involves the use of reducing agents such as 2-mercaptoethanol to cleave the disulfide bonds which hold the antibody probes together.
Stripping solution: 2g SDS 750 µl 2-mercaptoethanol 100ml 65mM Tris HCl pH6.8
Incubate blot in stripping solution 60 minutes @ 50°C
Notes: This solution contains high concentrations of 2-mercaptoethanol: use and heat only in hood. Stripping time and temperature given are typical. Optimal values must be determined for each antibody/Antigen combination.
Note: Including blocking reagent at 0.05 - 0.1X in the antibody solutions will decrease background without significantly lowering band intensity.
The optimal dilution must be determined for each antibody. The 2°
antibody may be tested on dots of 1° antibody. Dilutions can range from 1:100 to 1:10,000.
2. Incubate blocked, washed blot with 1° antibody for at least 1 hour at room temperature with agitation.
3. Wash blot four times for five minutes each with PBST.
4. Incubate blot with 2° antibody for 0.5 - 1 hour.
5. Wash blot four times for five minutes each with PBST.
6. Transfer blot to detection reagent.
DETECTION
The most popular antibody labels are isotopic (125I), HRP and Alkaline Phos-phatase. 125I labeling is straightforward, and gives consistent and quantifiable results. Its drawbacks are the hazards and inconvenience which radioactive isotopes bring into the lab. Detection of 125I requires that the blot be placed against X-ray film (protocol 4.1.3a). Upon development, the film will show bands corresponding to the position and intensity of detected antibody band.
A variety of substrates are available for both alkaline phosphatase and HRP. Protocols are given below for the most commonly used.
ALKALINE PHOSPHATASE: BCIP/NBT
Stock solutions (stable for up to 1 year):
A) 0.5g NitroBlue Tetrazolium in 10 ml 70% Dimethylformamide B) 0.5g BCIP in 10 ml 100% DMF C) 100mM NaCl 10mM MgCl2 100mM Tris pH 9.5
1. To prepare substrate solution: mix 100µl A, 15ml C, then add 50µl B
2. Submerge blot (up to 150 cm2) in 15ml substrate solution. Scale up the amount of solution for larger membranes. Incubate with shaking at room temperature until desired band intensity and contrast is achieved (typically 30 minutes) depending on antibody and label activity.
3. Stop development in PBS + 20mM EDTA
Note: This stop reagent works for CIP or other eukaryotic phosphatases. It does not stop Bacterial Alkaline Phosphatase.
HORSERADISH PEROXIDASE
1. Chromogenic detection with DiaminoBenzidine (DAB) (Caution: DAB is a carcinogen - avoid skin contact. Decontaminate spent material
with bleach prior to disposal)
a. Make fresh detection solution: 9mg DAB Tetrahydrochloride 7ml 100mM Tris pH 7.6 1.5ml 0.3% NiCl2 (CoCl2 may be substituted) 6ml H2O Filter through Whatman 1 paper Add 15µl 30% H2O2 (or 150µl 3%)
b. Immerse blot in detection solution (up to 150 cm2/15ml) and shake at room temperature until desired band intensity and contrast are achieved. (Typically <10 minutes)
c. Stop reaction by rinsing blot with agitation in PBS. Note: DAB development with HRP is much more rapid than the AP/BCIP system.
Also, because the stop solution is simply rinsing away substrate, the reaction may continue for a time after “stopping”. Development should be taken only up to the point where bands are acceptable and no background has yet appeared.
2. Chemiluminescent Detection using National Diagnostics’ ProtoGlow ECL c o n t i n u e d

Electrophoresis - Troubleshooting
94 USA: 1-800-526-3867EUROPE: 441 482 646022
Elec
trop
hore
sis
Trou
bles
hoot
ing
Matrix Related ProblemsProblems with the matrix will manifest as smeared bands and/or loss of resolution. Note that most “total failures” of electrophoresis are not matrix related (see “D”- Buffer related problems)
1) Pore size: This is determined by the amount of matrix and cross-linker used; suggested ranges are given on page 95. Using the wrong formulation will result in the region of interest running off of the gel, or failing to enter the gel sufficiently to resolve. Larger pore sizes also allow more diffusion, resulting in broader bands.
2) Polymerization: Gels which take longer than usual to polymerize will generally give broad and distorted bands due to local variations in gel quality. Polymerization of the gel is a chain reaction, initiated by ammonium persulfate (APS) and TEMED. The extension of initiated chains is inhibited by oxygen. APS and TEMED must be fresh for consistent results. APS should “crackle” when dissolving. TEMED should be clear, with no yellow color. Use of old reagents will lead to incomplete polymerization, which is further inhibited by low levels of dissolved oxygen. Degassing will remove O2, giving better polymerization, but it is not a substitute for fresh reagents. Cold temperatures will also slow polymerization- cast gels at room temperature.
3) Well Formation (sharks-tooth comb): The bottom of the well must be smooth and flat. Remove the comb after casting slowly, under buffer. Reinsert the comb carefully, so as not to over-penetrate the gel surface. Do not withdraw the comb once inserted- well distortions and leakage will result.
4) Immobilized charges: Acrylamide is subject to oxidation, producing acrylic acid. The immobilization of acrylic acid in the matrix generates a reverse flow of water (electroendosmosis), and allows DNA to interact with the matrix which leads to band broadening. Use only fresh acrylamide solutions within their shelf life which have been properly stored.
Symptom Diagnosis
Run ConditionsThe voltage and temperature maintained during the run can have marked effects on the results.
1) Electrical parameters: run gels at constant wattage (45-55 watts), to maintain the temperature above 50°C, which keeps the sample denatured. Too low a wattage allows the gel to cool to the point that the samples will begin to renature. Running at too high a voltage causes smearing and/or “smiling”.
2) Pre-Run: Gels must be pre-run for 30 min. to warm the gel to operating temperature. Failure to pre-run gives doublet bands.
3) Heat exchange: Heat must be conducted away from the gel to avoid thermal gradients in the gel, which cause “smiling” or other pattern distortions.
A B
C D
Smeared bands or distorted band pattern- dyes run normally (gel difficult to load)
Smeared bands or distorted band pattern- dye run speed altered or dyes smeared
“Smiling”- middle lanes run faster than outer lanes
Double bands
Dye runs slowly, as a sharp band at the top of the gel
Wavy bands
Expected bands not seen
Gel fails to polymerize
Troubleshoot ing Denatur ing DNA-PAGE Gels
Gel poorly polymerized (A-2), gel overloaded (B-3), nuclease in samples (B-1), salt in samples (D-1), or wells not flushed (B-4).
Gel heating during run- check run parameters (C-1), buffer (D-3,4) and heat exchange system on gel apparatus (C-3).
Poor gel polymerization (A-2) or upper edge of gel distorted (A-3).
Ammonium Persulfate or TEMED too old (A-2), or too much oxygen in the gel solution (A-2).
Nuclease digestion of samples (B-1) or wrong pore size used (A-1).
Buffer mismatch (D-1,3,4), glycerol in samples (D-5), run parameters not optimal (C-1), or fixed charges on gel (A-4).
Samples not fully denatured (B-2), nuclease degradation (B-1), or insuf-ficient pre-run (C-2).
No buffer in gel (D-2).
BufferRelatedProblemsBuffer problems are by far the most common cause of “total failure” of gels. A buffer imbalance will lead to changes in the voltage, current or wattage of the run.
1) Sample contains too much salt: Salt ions in the sample will migrate as a zone of high conductivity, low resistance and low voltage. The initial migration of the sample bands will be altered, resulting in skewed or broad bands, or aberrant band positions. High salt samples should be dialyzed or otherwise desalted before loading.
2) No buffer in gel: This creates a high resistance across the gel. With no ions to carry the current, the tracking dye “stacks” in the zone behind the slow moving buffer front.
3) Tank buffer incorrect: Tank buffer that is too concentrated or too dilute will lead to a salt discontinuity which migrates through the gel, distorting the band pattern with a “wave” effect.
4) Gel buffer incorrect: The gel provides most of the resistance to current flow- changes in the gel buffer will alter the electrical parameters of the run. Too concentrated a gel buffer will allow more current to flow, leading to more heat generation, with distortions such as smiling. Too dilute a gel buffer will increase resistance to current flow, which may actually sharpen the bands but generally slows the run and reduces resolution.
5) Glycerol containing samples: Glycerol forms complexes with the borate in TBE buffer, creating a zone of low conductivity which migrates slowly through the gel, creating a “wave” pattern. Use a non-glycerol loading buffer, or run gels in a borate free buffer such as TTE.
Sample PreparationDegradation of samples leads to smeared or doubled bands. Overloading will cause bands to smear and will alter band positions.
1) Nuclease degradation: Exonucleases will cause bands to smear down, endonucleases will generate new bands. Keep samples cold, include EDTA where practical.
2) Denaturation: Insufficient heating may allow reten-tion of residual secondary structure which causes bands to migrate at spurious molecular weights and may cause doublets.
3) Overloading: Loading of more than 10 micrograms per lane of DNA will cause an upward smearing of the bands.
4) Urea in wells: The urea in the gel will diffuse into the wells and disrupt sample loading. Flush wells with running buffer just prior to loading.

Electrophoresis - Troubleshooting
95USA: 1-800-526-3867EUROPE: 441 482 646022
ElectrophoresisTroubleshooting
Matrix Related ProblemsProblems with the matrix will manifest as smeared bands and/or loss of resolution. Note that most “total failures” of electrophoresis are not matrix related (see “D”- Buffer related problems)
1) Pore size: This is determined by the concentration and type of agarose used. Suggested ranges are given on page 95. Low concentration gels should be run in the cold room, they are fragile, and allow more sample diffusion. High concentration gels are friable (crumble easily), and will not allow large DNA molecules to enter the gel.
2) Gel preparation: Agarose should be boiled only long enough to dissolve all crystals. Overboiling will weaken the matrix. Cool to 60°C before pouring to avoid damage to the gel mold. Allow the gel to cool gradually after pouring- rapid cooling will “trap” swirling and convection currents in the set gel, which can distort bands which pass through them. NOTE ON ALKALINE GELS: alkaline gel buffers will hydrolyze hot agarose solutions. Boil agarose for alkaline gels in water, cool, and then add alkaline buffer concentrate just before pouring the gel.
3) Wells: Use care in removing the comb after casting; check to be sure that the gel is completely cooled. Twisting of the comb on removal will tear the walls of the well, allowing sample to seep into the tear, and generating distorted band shapes. Rapid removal of the comb will create a vacuum which will tear out the bottom of the wells, allowing sample to seep out before it can enter the gel.
4) Immobilized charges: Poor grades of agarose can carry sulfate groups which, under electrophoresis, will generate a reverse flow of water (electroendosmosis), and which will also interact with the sample. Both effects lead to band broadening. Use only fresh, high quality Agarose, with an EEO specification of <0.15.
BufferRelatedProblemsBuffer problems are by far the most common cause of “total failure” of gels. A buffer imbalance will lead to changes in the voltage, current or wattage of the run.
1) Sample contains too much salt: Salt ions in the sample will migrate as a zone of high conductivity, low resistance and low voltage. The initial migration of the bands will be altered, resulting in skewed or broad bands, or aberrant band positions. High salt samples should be dialyzed or otherwise desalted before loading.
2) No buffer in gel: Failure to add buffer to the gel creates a high resistance across the gel, with no ions to carry the current. The tracking dye “stacks” in the zone just behind the buffer front, and migrates slowly into the gel.
3) Gel or tank buffer incorrect: A mismatch between gel and tank buffers will lead to a salt discontinuity which migrates through the gel, distorting the band pattern with a “wave” effect. This can also cause bands to migrate at an angle to the vertical, causing the bands to look broad when viewed from directly above. In some cases, such bands will appear to be doublets.
Sample PreparationDegradation of samples leads to smeared or doubled bands. Overloading will cause bands to smear and will alter band positions.
1) Nuclease degradation: Exonucleases will cause bands to smear down, endonucleases will generate new bands. Keep samples cold, include EDTA where practical.
2) Overloading: Loading of more than 10 micrograms per lane of DNA will cause an upward smearing of the bands.
3) Dye overload: In some cases, bands will comigrate with the tracking dye. The dye will absorb the ethid-ium fluorescence during staining, obscuring the band. Soaking the gel in water or buffer for 1 hour will allow the dye to diffuse enough to see the bands.
Symptom Diagnosis
Run ConditionsThe voltage and temperature maintained during the run can have marked effects on the results.
1) Electrical parameters: Most gels are meant to be run at 5-15V/cm. Running at too low a voltage (too slow) allows the bands to diffuse too much before the run is finished. Too high a voltage causes heating which can melt the gel. Increasing the voltage also selectively increases the mobility of larger DNA molecules, com-pressing the band pattern.
2) Temperature: In general, gels should be run as cold as is convenient. This is particularly true for low-melting or low percentage gels, which are fragile at room temperature.
A B
C D
Smeared bands- dyes run normally
Smeared bands- dye run speed altered or dyes smeared
“Smiling”- middle lanes run faster than outer lanes
Double bands
Dye runs slowly, as a sharp band at the top of the gel
Wavy bands
Expected bands not seen
Gel fails to set up
Troubleshoot ing Agarose DNA Gels
Gel overloaded (B-2), nuclease in samples (B-1), or excessive salt in samples (D-1).
Gel heating during run-check run parameters (C-1,2) and buffer (D-3).
Gel cooled too quickly after pouring (A-2) or wells damaged (A-3).
Alkaline buffer hydrolyzed matrix (A-2). Agarose concentration too low (A-1).
Nuclease digestion of samples (B-1), wrong percentage gel used (A-1), voltage too high (C-1), or dye overload (B-3).
Run parameters not optimal (C-1,2), buffer mismatch (D-1,3), or fixed charges on gel (A-4).
Nuclease degradation (B-1), gel run too fast (C-1), or buffer mismatch (D-3).
No buffer in gel (D-2).

Electrophoresis - Troubleshooting
96 USA: 1-800-526-3867EUROPE: 441 482 646022
Elec
trop
hore
sis
Trou
bles
hoot
ing
Matrix Related ProblemsProblems with the matrix will manifest as smeared bands and/or loss of resolution. Note that most “total failures” of electrophoresis are not matrix related (see “D”- Buffer related problems)
1) Pore size: This is determined by the amount of matrix and cross-linker used; suggested ranges are given on page 95. Too small of a pore size will prevent proteins of interest from moving far enough into the resolving gel to be resolved. Too large of a pore size will allow smaller proteins to run with the SDS front, creating a large, intense protein band containing many unresolved proteins, running just behind or with the tracking dye.
2) Polymerization: Polymerization of the gel is a chain reaction, initiated by ammonium persulfate(APS) and TEMED. The extension of initiated chains is inhibited by oxygen. APS and TEMED must be fresh for consistent results. APS should “crackle” when dissolving. TEMED should be clear, with no yellow color. Use of old reagents will lead to incomplete polymerization, which is easily inhibited by low levels of dissolved oxygen. Such gels will take longer than usual to polymerize, and will give broad and distorted bands due to local variations in gel quality. Degassing will remove O2, giving better polymerization, but it is not a substitute for fresh reagents.
3) Stacking gel: This gel sharpens the protein zone before it enters the resolving gel. A straight sharp interface is critical to good resolution- overlay the resolving gel with water saturated n-butanol for best results.
4) Immobilized charges: Acrylamide is subject to oxidation, producing acrylic acid. The immobilization of acrylic acid in the matrix generates a flow of water (electroendosmosis), and allows the proteins to interact with the matrix, which leads to band broadening. Use only fresh acrylamide solutions, within their shelf life, which have been properly stored.
BufferRelatedProblemsBuffer problems are by far the most common cause of “total failure” of gels. A buffer imbalance will lead to changes in the voltage, current or wattage of the run.
1) Sample contains too much salt: Salt ions in the sample will migrate as a zone of high conductivity, low resistance and low voltage. Until this zone migrates away from the sample, the migration of the protein bands will be altered, resulting in skewed or broad bands, or aberrant band positions. High salt samples should be dialyzed or otherwise desalted before loading.
2) No buffer in gel: Failure to add buffer to the gel creates a high resistance across the gel, with no ions to carry the current. The tracking dye “stacks” in the zone just behind the buffer front, and migrates slowly into the gel.
3) Tank buffer incorrect: The Laemmli buffer system uses a buffer discontinuity to “stack” the samples prior to separation; as a result it is more tolerant of minor buffer changes than a continuous system. Use of too concentrated or too dilute tank buffer will lead to a salt discontinuity which migrates through the gel, distorting the band pattern with a “wave” effect.
4) Gel buffer incorrect: The gel provides most of the resistance to current flow- changes in the gel buffer will alter the electrical parameters of the run. Too concentrated a gel buffer will allow more current to flow, leading to more heat generation, with distortions such as smiling. Too dilute a gel buffer will increase resistance to current flow, which may actually sharpen the bands but generally slows the run and reduces resolution.
Sample PreparationDegradation of samples leads to smeared or doubled bands. Overloading will cause bands to smear and will alter band positions.
1) Proteolysis/Oxidation: Proteases are active in the sample buffer- keep the samples cold prior to denaturing and loading. Add mercaptoethanol or DTT to the sample buffer if oxidation is suspected. Proteolysis can cause spurious bands or a downward smearing.
2) Denaturation: Insufficient heating may allow reten-tion of residual secondary structure which will cause bands to migrate at spurious molecular weights, and may cause doublets.
3) Overloading: Loading of more than 40 micrograms per lane of protein will cause an upward smearing of the bands.
Symptom Diagnosis
Run ConditionsThe voltage and temperature maintained during the run can have marked effects on the results.
1) Electrical parameters: Most gels are meant to be run at 5-20V/cm. Running at too low a voltage (too slow) allows the bands to diffuse too much before the run is finished. Running at too high a voltage causes the bands to smear, and will lead to overheating, which causes “smiling”.
2) Temperature: In general, gels should be run as cold as is convenient. If high voltages are used, a heat exchange system should be used. Overheating of the gel causes changes in the conductivity of the buffer, which leads to unpredictable results, often distortions of the band pattern, or band broadening.
A B
C D
Smeared bands- dyes run normally
Smeared bands- dye run speed altered or dyes smeared
“Smiling”- middle lanes run faster than outer lanes
Double bands
Dye runs slowly, as a sharp band at the top of the gel
Wavy bands
Expected bands not seen
Gel fails to polymerize
Troubleshoot ing Denatur ing Pro te in Gels
Gel poorly polymerized (A-2), gel overloaded (B-3), protease in samples (B-1), or excessive salt in samples (D-1).
Gel heating during run - Check run parameters (C-1), buffer (D-3,4) and heat exchange system on gel apparatus (C-2).
Poor interface between stacking and resolving gels (A-3). Poor gel po-lymerization (A-2).
Ammonium Persulfate or TEMED too old (A-2). Too much oxygen in the gel solution (A-2).
Protease digestion of samples (B-1) or wrong pore size used (A-1).
Run parameters not optimal (C-1), buffer mismatch (D-1,3,4), or fixed charges on gel (A-4).
Protease degradation or sample oxidation (B-1), or samples not fully denatured (B-2).
No buffer in gel (D-2).

Electrophoresis - Useful Information
97USA: 1-800-526-3867EUROPE: 441 482 646022
ElectrophoresisU
seful Information
Useful Information for Electrophoresis
Xylene Cyanole(nucleotides)
Effective Range of Separation of DNAs andDye Co-Migration in Native Polyacrylamide Gels
29:1 Acrylamide/Bis-Acrylamide
Bromophenol Blue(nucleotides)
4
6
8
10
12
95
60
45
35
20
450
240
160
120
70
Xylene Cyanole(nucleotides)Gel %
SizeRange (bp)
1000-2000
70-450
60-400
50-300
40-200
Xylene Cyanol(nucleotides)
Effective Range of Separation of DNAs andDye Co-Migration in Denaturing Polyacrylamide Gels
19:1 Acrylamide/Bis-Acrylamide
Bromophenol Blue(nucleotides)
4
6
8
10
12
30
25
20
10
8
155
110
75
55
45
Xylene Cyanol(nucleotides)Gel %
SizeRange (bp)
>250
60-250
40-120
20-60
10-50
Range of Separation inAgarose Gels
0.3
0.6
0.7
0.9
1.2
1.5
2.0
Gel %Size
Range (bp)
5000-60,000
1000-20,000
800-10,000
500-7000
400-6000
200-3000
100-2000
Range of Separation ofProteins in SDS-PAGE
6
8
10
12
15
Gel %Size
Range (kd)
60-200
40-140
20-80
15-70
10-50
Melting Point Calculations:TmDNA:RNA = 79.8° C + 18.5 (log10[Na]) + 0.58 (%GC)+ 11.8 (%GC)2 + 0.50 (% Formamide) + (820/length)
TmDNA:DNA = 81.5°C - 16.6(log10([Na])+0.41(%GC)- 0.63(%Formamide) - (600/length)
Tm decreases by ~ 1° C for every 1% increase in mismatches.Tm decreases by ~ 0.5° C for every increase of 1% in formamide.
DNA DataBase pairs per turn (B form): 10
1 microgram of 1000bp DNA=1.51pmoles
avg MW of a base pair=650
UV Absorbance ofDNA and RNA
Nucleic Acid
µg/ml to give an A260=1.0
A260/A280 of pure material
ds DNAss DNA
RNA
503740
1.81.8-1.9
2.0
Protein DataAverage MW of an amino acid:110 daltonsgrams SDS bound per gram of protein: 1.2 (average)A280 1mg/ml solution: 0.4-1.5 (range can be as much as 0.0-2.65)
The Genet ic Code
AA G T C
A G T C
A G T C
A G T C
G
T
C
Lys Lys Asn Asn Arg Arg Ser Ser Ile Met Ile Ile Thr Thr Thr Thr
A G T C A G T C A G T C A G T C
Glu Glu Asp Asp Gly Gly Gly Gly Val Val Val Val Ala Ala Ala Ala
A G T C A G T C A G T C A G T C
Stop Stop Tyr Tyr Stop Trp Cys Cys Leu Leu Phe Phe Ser Ser Ser Ser
A G T C A G T C A G T C A G T C
Gln Gln His His Arg Arg Arg Arg Leu Leu Leu Leu Pro Pro Pro Pro
A G T C A G T C A G T C A G T C
The sieving characteristics of different types of agarose vary considerably. A more complete discussion can be found in Section 2.4.1 (page 87).
Range of separation tables adapted from Sambrook, J., Fritsch., and Maniatis, T. (1989) Molecular Cloning: A Laboratory Manual. Cold Spring Harbor: Cold Spring Harbor Laboratory.

Electrophoresis - Suggested Reading
98 USA: 1-800-526-3867EUROPE: 441 482 646022
Elec
trop
hore
sis
Sug
gest
ed R
eadi
ng
General Resources Sambrook, J., Fritsch, E.F., and Maniatis, T. (1989) Molecular Cloning, a Laboratory Manual , Cold Spring Harbor Laboratory Press, Cold Spring Harbor, NY.Ausubel, F.M. (1995) Current Protocols in Molecular Biology, (K. Janssen, Ed.) John Wiley and Sons, Inc, New York, NY.Westermeier, Reiner (1997) Electrophoresis in Practice - A Guide to Methods and Applications of DNA and Protein Separations, 2nd edition. Wiley-VCH.
Gel Preparation Isfort, R. and Ihle, J. (1988) The 4-6-8 method of sequence analysis. Biotechniques 6 138-141.
Denaturants U.S. Biochemical (1990) Formamide gels (40%) for sequencing DNA. Comments 17(1) 31
BufferGradientsSheen, J.Y. and Seed, B. (1988) Electrolyte gradient gels for DNA se-quencing. Biotechniques 6 942-944.
Maxam & Gilbert Sequencing Maxam, A.M. and Gilbert, W. (1977) A new method for sequencing DNA. PNAS(USA) 74 560.
Sequencing - Sanger Method Sanger, F. Nicklen, S. and Coulson, A.R. (1977) DNA sequencing with chain termination inhibitors. PNAS(USA) 74 5463-5467.Sanger, F., Coulson, A.R., Barrell, B.G., Smith, A.J.M., and Roe, B.A. (1980) Cloning in single-stranded bacteriophage as an aid to rapid DNA sequencing. J. Mol. Biol. 143 161-178.Tabor, S. and Richardson, C.C. (1990) DNA sequence analysis with a modified bacteriophage T7 DNA polymerase: effects of pyrophorolysis and metal ions. J. Biol. Chem. 265 8322-8328.
Gel Electrophoresis for DNA Sequencing Sanger, F., Coulson, A.R. (1978) The use of thin acrylamide gels for DNA sequencing. FEBS lett. 87 107-110.
DifferentialDisplayLiang, P. and Pardee, A.B. (1992) Differential display of eukaryotic messenger RNA by means of the polymerase chain reaction.Liang, P., Avergoikh, L., and Pardee, A.B. (1993) Distribution and cloning of eukaryotic mRNAs by means of differential display: Refinements and optimization. Nucl. Acids. Res. 21 3269-3275.de Vries, C.J.M., van Achterberg, T.A.E., Horrevoets, A.J.G., ten Cate, J.W., and Pannekoek, H. (2000) Differential display identification of 40 genes with altered expression in activated human smooth muscle cells. J. Biol. Chem. 275 (31) 23939-23947.
S1 Mapping Berk, A.J. and Sharp, P.A. (1977) Sizing and mapping of early adenovirus mRNAs by gel electrophoresis of S1 endonuclease-digested hybrids. Cell 12 721-732.Sharp, P.A., Berk, A.J., and Berget, S.M. (1980) Transcriptional maps of adenovirus. Meth. Enz. 65 570-768.
Ribonuclease Protection Zinn, K., DiMaio, D., and Maniatis, T. (1983) Identification of two distinct regulatory regions adjacent to the human b-interferon gene. Cell 34 865-879.Melton, D.A., Krieg, P.A., Rebagliati, M.R., Maniatis, T., Zinn, K., and Green, M.R. (1984) Efficient in vitro synthesis of biologically active RNA and RNA hybridization probes from plasmids containing a bacterio-phage SP6 promoter. Nucl. Acids Res. 12 7035-7056.
Primer Extension Jones, K.A., Yamamoto, K.R., and Tjian, R. (1985) Two distinct tran-scription factors bind to the HSV thymidine kinase promoter in vitro. Cell 42 559-572.
DNase I footprinting Galas, D, and Schmitz, A. (1978) DNase footprinting: A simple method for the detection of protein-DNA binding specificity. Nucl. Acids Res. 5 3157-3170.Tullius, T.D., Dombroski, B.A., Churchill, M.E.A., and Kam, L. (1987) Hydrox-yl radical footprinting: A high resolution method for mapping protein-DNA contacts. Meth.Enz. 155 537-558.
Uracil Interference Assay Goeddel , D.V., Yansura, D.G. and Caruthers, M.H. (1978) How lac repressor recognizes lac operator. PNAS(USA) 75 3579-3582.Pu, W.T. and Struhl, K. (1992) Uracil interference, a rapid and general method for defining protein-DNA interactions involving the 5-methyl group of thy-mines: Ghe GCN4-DNA complex. Nucl. Acids Res. 20 771-775.
Methylation Interference Assay Siebenlist, U. and Gilbert, W. (1980) Contacts between E. coli RNA polymerase and an early promoter of phage T7. PNAS(USA) 77 122-126.
Nondenaturing PAGE of DNA PCR Analysis
Saiki, R.K., Scharf, S., Faloona, F., Mullis, K.,Horn, G., Erlich, H.A., and Arnheim, N. (1985) Enzymatic amplification of B globin genomic sequences and restriction site analysis for diagnosis of sickle cell anemia. Science 230 1350-1354.Saiki, R.K., Bugawan, T.L., Horn, G.T., Mullis, K.B., Erlich, H.A. (1986) Analysis of enzymatically amplified B-globin and HLA-DQa DNA with allele-specific oligonucleotide probes. Nature 324 163-166. Mullis, K.B., Faloona, F., Scharf, S.J., Saiki, R.K., Horn, G.T. and Erlich, H.A. (1986) Specific enzymatic amplification of DNA in vitro: The polymerase chain reaction. Cold Spring Harbor Symp. Quant. Biol. 51 263-273.White, Bruce A. (ed) (1993) PCR Protocols. Humana Press.PCR Technology: Principles and Applications for DNA amplification. (H.A. Erlich, Ed.) Stockton Press, NY.
Mobility Shift Assay Fried, M. and Crothers, D.M. (1981) Equilibria and kinetics of lac repres-sor-operator interactions by polyacrylamide gel electrophoresis. Nucl. Acids Res. 9 6505-6525.Garner, M.M. and Revzin, A. (1981) A gel electrophoresis method for quan-tifying the binding of proteins to specific DNA regions: Application to components of the Escherichia coli lactose operon regulatory system. Nucl. Acids Res. 9 3047-3060,
Heteroduplex AnalysisNagamine, C.M., Chan, K. and Lau, Y.F.C. (1989) A PCR artifact: generation of heteroduplexes. Am. J. Hum. Genet. 45 337-339.
SSCP Analysis Sheffield, V.C., Beck, J.S., Kwitek, A.E., Sandstrom, D.W. and Stone, E.M. (1993) The sensitivity of single-strand conformation polymorphism analysis for the detection of single base substitutions. Genomics 16 325-332.Orita, M., Iwahana, H., Kanazawa, H., Hayashi, K. and Sekiya, T. (1988) Detec-tion of polymorphisms of human DNA by gel electrophoresis as single-strand conformation polymorphisms. PNAS(USA) 86 2766-2770
Agarose Gel Electrophoresis of DNA and RNASharp, P.A., Sugden, B., and Sambrook, J. (1973) Detection of two restriction endonuclease activities in Haemophilus parainfluenzae using analytical agarose-ethidium bromide electrophoresis. Biochemistry 12 3055.
Alkaline Agarose Gels: McDonell, M.W., Simon, M.N. and Studier, F.W. (1977) Analysis of restriction fragments of T7 DNA and determination of molecular weights by electropho-resis in neutral and alkaline gels. J. Mol. Biol. 110 119.
Formaldehyde Gels Lehrach, H.a, Diamond,D., Wozney,J.M., and Boedtker, H. RNA molecular weight determinations by gel electrophoresis under denaturing conditions, a critical reexamination. Biochemistry 16 4743.
Suggested Reading in Electrophoresis

Electrophoresis - Suggested Reading
99USA: 1-800-526-3867EUROPE: 441 482 646022
ElectrophoresisS
uggested Reading
PurificationofDNAfromLowMeltAgaroseGelsWieslander L. (1979) A simple method to recover intact high molecular weight RNA and DNA after electrophoretic separation in low gelling temperature agarose gels. Anal. Biochem. 98 305.
Glass Powder Elution Vogelstein, B. and Gillespie, D. (1979) Preparative and analytical purification of DNA from agarose. PNAS(USA) 76 615-619
Electroelution Wienand, U., Schwarz, Z., and Felix, G. (1978) Electrophoretic elution of nucleic acids from gels adapted for subsequent biological tests: application for analysis of mRNAs from maize endosperm. FEBS Lett. 98 319-323.
Electroelution onto DEAE Paper: Girvitz, S.C., Bachetti, S., Rainbow, A.., and Graham, F.L. (1980) A rapid and efficient procedure for the purification of DNA from agarose gels. Anal. Biochem. 106 492.
Pulsed Field & Field Inversion Gel Electrophoresis (PFGE & FIGE) Burmeister, Margit and Ulanovsky, Levy (eds) (1992) Pulsed-field Gel Elec-trophoresis: Protocols, Methods, and Theories. Humana Press.Schwartz, D.C. and Cantor, C.R. (1984) Separation of yeast chromosome-sized DNAs by pulsed field gradient gel electrophoresis. Cell 37 67. Carle, G.F., Frank, M., and Olson, M.V. (1986) Electrophoretic separations of large DNA molecules by periodic inversion of the electric field. Science 232 65-68
RNA ElectrophoresisGuanidinium Isothiocyanate Isolation of RNA
Chomczynski, P. and Sacchi, N. (1987) Single-step method of RNA isolation by acid guanidinium thiocyanate-phenol-chloroform extraction. Anal. Biochem. 162 156-159.Puissant, C., and Houdebine, L.M. (1990) An improvement of the single-step method of RNA isolation by acid guanidinium thiocyanate-phenol-chloro-form extraction. Biotechniques 8 148-149.
Formaldehyde Denatured RNA Gels Seed, B. (1982) Attachment of nucleic acids to nitrocellulose supports. In Genetic engineering: principles and methods. (J.L Setlow and A. Hollaender, eds). Volume 4, p91. Plenum Publishing, NY.
Glyoxal Denatured RNA GelsMcMaster, G.K. and Carmichael, G.G. (1977) Analysis of single- and dou-ble-stranded nucleic acids on polyacrylamide and agarose gels by using glyoxal and acridine orange. PNAS(USA) 74 4835.
Gel Electrophoresis of ProteinsGeneral Resources
Franks, Felix (ed) (1993) Protein Biotechnology: Isolation, Characterization, and Stabilization. Humana Press.Walker, John M (ed) (1994) Basic Protein and Peptide Protocols. Humana Press.Rickwood, D. and Hames, B.D. (eds) (1990) Gel Electrophoresis of Proteins: A Practical Approach. Oxford University Press.Dunn, Michael J. (ed) (1999) From Genome to Proteome - Advances in the Practice and Application of Proteomics. Wiley-VCH.Kellner, Roland, Lottspeich, Friedrich, Meyer, Helmut (1999) Microcharac-terization of Proteins, 2nd edition. Wiley-VCH.
Denaturing Protein Electrophoresis: SDS-PAGE Laemmli, U.K. (1970) Cleavage of structural proteins during the assembly of the head of bacteriophage T4. Nature 227, 680-685.
Tricine Gels Schagger, H. and von Jagow, G. (1987) Tricine-sodium dodecyl sulfate-poly-acrylamide gel electrophoresis for the separation of proteins in the range from 1 to 100 kDa. Anal. Biochem. 166 368-379.
Peptide Mapping Cleveland, D.W., Fischer, S.G., Kirschner, M.W., and Laemmli, U.K. (1977) J. Biol. Chem. 252 1102.
Native Protein Electrophoresis Davis, B.J. (1964) Disc electrophoresis II- method and application to human serum proteins. Ann. NY Acad. Sci. 121, 404-427.
Activity StainsMisra, H.P. and Fridovish, I. (1977) Arch. Biochem. Biophys. 183 511-515. Gregory, E.M. and Fridovich, I. (1974) Anal. Biochem. 58 57-62.
Two Dimensional ElectrophoresisO’Farrell, P.H. (1975) High-resolution two-dimensional electrophoresis of proteins. J. Biol. Chem. 250 4007-4021.
Celis, J.E. and Bravo, R. (eds) (1984) Two dimensional gel electrophoresis of proteins. Academic press, Orlando, FL.
PurificationofProteinsfromPAGEGelsbyElectroelutionHunkapiller, M.W., and Lujan, E. (1986) Purification of microgram quantities of proteins by polyacrylamide gel electrophoresis. In Methods of Protein Microcharacterization (Shively, J., ed.) 89-101. Humana Press, Clifton, NJ.
DNA and RNA Detection Ethidium Bromide
Sharp, P.A., Sugden, B., and Sambrook, J. (1973) Detection of two restriction endonuclease activities in Haemophilus parainfluenzae using analytical agarose-ethidium bromide electrophoresis. Biochemistry 12 3055.
Silver Staining DNA & RNABloom, H., Beier, H, and Gross, H.S. (1987) Improved silver staining of plant proteins, RNA and DNA in polyacrylamide gels. Electrophoresis 8 93-99.
BlottingNucleicAcids-NorthernsandSouthernsThomas, P.S. (1980) Hybridization of denatured RNA and small DNA frag-ments transferred to nitrocellulose. PNAS(USA) 77 5201.Reed, K.C. and Mann D.C. (1985) Rapid transfer of DNA from agarose gels to nylon membranes. Nucleic Acids Res. 13 7207.Casey, J. and Davidson, N. (1977) Rates of formation and thermal stabilities of RNA:DNA and DNA:DNA duplexes at high concentrations of formamide. Nucleic Acids Res. 4 1539-1552Southern, E.M. (1975) Detection of Specific sequences among DNA fragments separated by gel electrophoresis. J. Mol. Biol. 98 503-517.Meinkoth, J. and Wahl, G. (1984) Hybridization of nucleic acids immobilized on solid supports. Anal. Biochem. 138 267-284,
Post-Electrophoretic Protein Detection Machenko, Gennady (ed) (1994) Detection of Enzymes on Electrophoretic Gels: A Handbook. CRC Press.
Staining Proteins in Gels Wilson, C.M. (1979) Studies and critique of amido black 10B, coomassie blue R, and fast green FCF as stains for proteins after polyacrylamide gel electrophoresis. Anal. Biochem. 96 263-278.Blakesly, R.W. and Boezi, J.A. (1977) A new staining technique for proteins in polyacrylamide gels using coomassie brilliant blue G250. Anal. Biochem. 82 580-582.
Silver Staining ProteinsBloom, H., Beier, H, and Gross, H.S. (1987) Improved silver staining of plant proteins, RNA and DNA in polyacrylamide gels. Electrophoresis 8 93-99.Merril, C.R., Goldman, D. and Van Keuren, M.L. (1984) Gel protein stains: silver stain. Meth. Enz. 104 441-447.
ImmunologicalDetectionofProteins(WesternBlotting)Burnette, W.H. (1981) Western blotting: electrophoretic transfer of proteins from SDS-polyacrylamide gels to unmodified nitrocellulose and radiographic detection with antibody and radioiodinated protein A. Anal. Biochem. 112 195-203.Bers, G. and Garfin, D. (1985) Protein and nucleic acid blotting and immu-nobiochemical detection . Biotechniques 3 276-288.Ramlau, J. (1987) Use of secondary antibodies for visualization of bound primary reagents in blotting procedures. Electrophoresis 8 398-402.Towbin, H. Staehelin, T., and Gordon, J. (1979) Electrophoretic transfer of proteins from polyacrylamide gels to nitrocellulose sheets: Procedure and some applications. PNAS(USA) 76 4350-4354.
Alkaline Phosphatase Moe, D. and Kirkeby, S. (1982) Evaluation of the indoxyl-tetrazolium method for measurement of alkaline phosphatase activity. Cell. and Mol. Biol. 28 555-558.
Horseradish PeroxidaseGraham, R.C. and Karnovsky, M.J. (1966) The early stages of absorption of injected horseradish peroxidase in the proximal tubules of mouse kidney: ultrastructural cytochemistry by a new technique. J. Histochem. Cytochem. 14 291-302.
Enzyme Linked Immunosorbent Assay (ELISA)Engvall, E., and Perlman, P. (1971) Enzyme linked immunosorbent assay (ELI-SA): quantitative assay of immunoglobulin G. Immunochemistry 8 871-879.

Histology Products - Clearing Agents
100 USA: 1-800-526-3867EUROPE: 441 482 646022
His
tolo
gyC
lear
ing
Age
nts
National Diagnostics has a history of innovation in providing alternatives to the use of hazardous chemicals in the laboratory. Because xylene is a serious health risk for technicians working in histology, cytology, anat-omy and pathology laboratories, National Diagnostics offers a range of solvent substitutes that eliminate the hazards associated with xylene without compromising performance. Our clearing agents ensure both good results and safe practice.
HistologicalClearing Agents
The use of Histo-Clear in the laboratory means no longer having to breathe xylene when preparing histological sections. Distilled from oranges, care-fully purified, and stabilized, Histo-Clear is one of the safest clearing agents available.
Histo-Clear not only improves safety but also results. Histo-Clear leaves tissue less hard and brittle than xylene, facilitating the cutting of thin sections and prolonging microtome blade life. Nuclear morphology is rendered in fine detail. Histo-Clear enhances the clarity and vibrance of acidophilic stains and improves staining of Harris’ Hematoxylin with a brighter Eosin background. Histo-Clear can directly substitute for xylene and yields excellent results in automated tissue processing.
Histo-Clear
Processing Fixed Tissue - Clearing ............................................. 111
APPL ICATION
Rapid Clearing without the Toxic Hazards of XyleneBiodegradableGreatly Reduces Disposal CostsSuperior Results with Lower Citrus OdorNatural Product with Food Grade Rating World-Wide
l
l
l
l
l
Exposure to xylene may cause systemic toxicity including adverse effects to the kidney, liver, brain, blood, spleen, fetus and central nervous system. Repeated and prolonged occupational exposure has been associated with permanent brain and nervous system damage (sometimes referred to as sol-vent or painter’s syndrome). Xylene may cause adverse reproductive and/or developmental effects. Pregnant women may be at an increased risk from exposure. Preexisting medical conditions which may be aggravated by expo-sure include disorders of the skin, eye, heart, kidney, liver, blood, respiratory system, neurological and hemopoietic organs.
The Safety of Histo-Clear
The Hazards of Xylene
Histo-Clear makes histology safer and improves results.
Histo-Clear HS-200 1 L 1 gal (1-3)
1 gal (4+) 5 gal 55 gal
Product Name Cat. No. Size
Histomount [pg 107] HS-103 100 ml (1-3) 100 ml (4+) 450 ml (1-3) 450 ml (4+) Hydromount [pg 107] HS-106 100 ml (1-3) 100 ml (4+) Omnimount HS-110 100 ml (1-3) 100 ml (4+)
Mounting Media
®

Histology Products - Clearing Agents
101USA: 1-800-526-3867EUROPE: 441 482 646022
Histology
Clearing A
gents
Histo-Clear II, like its predecessor Histo-Clear, is a safer histological clearing agent that leads to the production of high-quality tissue slides. Histo-Clear II is nontoxic and completely biodegradable, thus reducing disposal costs. His-to-Clear II has a greatly reduced citrus odor compared to other citrus-based histological clearing agents. Histo-Clear II may be substituted for toluene and xylene with minimal change in protocol.
His to-Clear II
Processing Fixed Tissue - Clearing ..............................................111
APPL ICATION
Low HazardBiodegradableReduced Citrus Odor
l
l
l
Histo-Clear II HS-202 1 gal (1-3) 1 gal (4+) 5 gal 55 gal
Product Name Cat. No. Size
Histosol is the original high flash point (114˚F TCC) histological clearing agent. It is intended to be used as a replacement for xylene where the hazards asso-ciated with aromatic hydrocarbon vapors are to be reduced. Museum-quality tissue slides can be prepared with Histosol without change in protocol or proce-dure. Histosol is manufactured from petrochemical products and is miscible in all proportions with ethanol, isopropanol, and t-butanol. It is also miscible with all paraffin-based tissue embedding media and all permanent mounting media.
His tosol
Processing Fixed Tissue - Clearing ............................................. 111
APPL ICATION
Histosol HS-100 1 gal 5 gal
Product Name Cat. No. Size
®
TM
Histological GradeReagent Ethanol
Stringently Controlled Quality and Batch ConsistencyNo Harmful KetonesVirtually No Residual Water95% Ethanol / 5% Methanol
l
l
l
l
High quality ethanol is essential for excellent results in paraffin embedding technique and related methods. National Diagnostics Reagent Ethanol matches the demands of currrent histology and cytology practice. Stringently controlled specifications and intensive quality testing ensure that no residual water or chemical impurities are present to interfere with deparaffinizing, staining or mounting.
The use of National Diagnostics’ Histological Grade Ethanol in tandem with National Diagnostics Histo-Clear—our low toxicity clearing agent—ensures excellent tissue processing results.
Reagent Ethanol (denatured) HS-300 1 L 4 L 20 L
Product Name Cat. No. Size
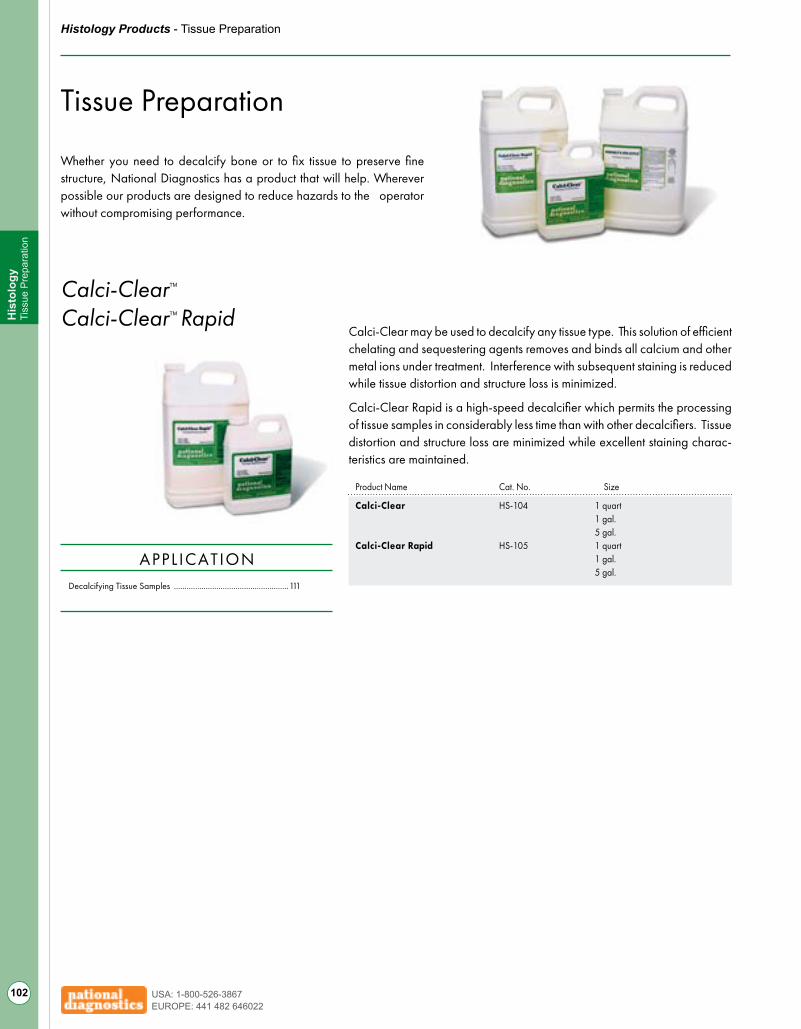
Histology Products - Tissue Preparation
102 USA: 1-800-526-3867EUROPE: 441 482 646022
His
tolo
gyTi
ssue
Pre
para
tion
Whether you need to decalcify bone or to fix tissue to preserve fine structure, National Diagnostics has a product that will help. Wherever possible our products are designed to reduce hazards to the operator without compromising performance.
Tissue Preparation
Calci-Clear may be used to decalcify any tissue type. This solution of efficient chelating and sequestering agents removes and binds all calcium and other metal ions under treatment. Interference with subsequent staining is reduced while tissue distortion and structure loss is minimized.
Calci-Clear Rapid is a high-speed decalcifier which permits the processing of tissue samples in considerably less time than with other decalcifiers. Tissue distortion and structure loss are minimized while excellent staining charac-teristics are maintained.
Calci-ClearCalci-Clear Rapid
®
Decalcifying Tissue Samples ......................................................111
APPL ICATION
Calci-Clear HS-104 1 quart 1 gal. 5 gal. Calci-Clear Rapid HS-105 1 quart 1 gal. 5 gal.
Product Name Cat. No. Size
TM
TM

Histology Products - Tissue Preparation
103USA: 1-800-526-3867EUROPE: 441 482 646022
Histology
Tissue Preparation
Mirsky’s Fixative is a superior fixing agent for use in immunohistological and immunocytological staining protocols. Mirsky’s Fixative does not contain formaldehyde or glutaraldehyde. Therefore, it has considerably reduced toxicity and virtually no odor. Mirsky’s Fixative is neutral, buffered, and isotonic (308 milliosmol). Additionally, Mirsky’s Fixative does not contain toxic or hazardous buffers such as cacodylate or barbital, and can be safely used for a wide variety of tissue samples. With Mirsky’s Fixative, hardening or shrinkage of tissue is considerably reduced.
Double reactive sites afford excellent crosslinking properties while maintaining sample enzyme activity. Therefore, samples processed in Mirsky’s Fixative for light microscopy can subsequently be used in electron microscopy pro-cedures. Special buffer systems may be used in place of the buffer provided.
Method: Use as a replacement for formalin and/or glutaraldehyde fixatives in immunohistological and immunocytological staining protocols. Tissue size is unlimited as long as the sample is no thicker than 0.5 cm in at least one plane to assure uniformity of tissue penetration. Mirsky’s Fixative is crosslinking and will therefore retain cellular morphology better than non-crosslinking fixatives such as formaldehyde. It is expected that the gross visual appearance will be different than in formaldehyde and tissue may seem “raw.” This is due to double site binding of the fixative with a resultant reduction in tissue brit-tleness and shrinkage. Microscopic examination of tissue morphology will be noticeably improved. This material is intended to maintain enzyme and antibody activity. For best results, tissue sections of high digestive enzyme content should be thoroughly rinsed in saline solution before fixation (e.g. trypsin in intestinal samples). Once fixed, tissue may be retained in Mirsky’s Fixative and ethanol and is stable indefinitely.
Mirsky’s Fixative is normally distributed as a concentrated two bottle sys-tem, although high throughput laboratories may be interested in the single bottle ready-to-use format. The two bottle system is comprised of Mirsky’s Fixative 10X Concentrate and Mirsky’s Fixative 10X Buffer. To reconstitute to working strength, add 1 part Mirsky’s Fixative 10X Buffer to 8 parts distilled or deionized water, mix thoroughly, then add 1 part Mirsky’s Fixative 10X Concentrate and mix again. The material is now ready for use.
The two bottle system has a shelf life of 12 months while the ready-to-use format has a shelf life of 30 days.
Mirsky’s Fixative Saponin/Glyoxylate FixativePreserves Immunohistological ActivityContains No FormaldehydeFast-ActingNo Toxic Buffers
l
l
l
l
l
Mirsky’s Fixative HS-102 200 ml system 2 liter system Mirsky’s Fixative (ready-to-use) HS-101 1 gal 5 gal
Product Name Cat. No. Size
Fixing Tissue Samples ................................................................ 109
APPL ICATION
TM

Histology Products - Aldehyde Disposal
104 USA: 1-800-526-3867EUROPE: 441 482 646022
His
tolo
gyA
ldeh
yde
Dis
posa
l Neutralin is a convenient, cost-effective method for the disposal of hazardous formaldehyde, glutaraldehyde, and other aldehyde solutions. Neutralin converts hazardous aldehydes into a nonhazardous, noncorrosive, non-toxic polymer and water. The polymer produced is not a hazardous waste (as defined by United States Title 40 Code of Federal Regulations (40 CFR 261.24(a)). Neutralin reduces disposal costs and contributes to a safer work environment.
Simply pour used aldehyde solutions into the five gallon pail containing Neutralin and agitate. Neutralization occurs overnight without additional steps or decants. Neutralin is supplied with a Trace Aldehyde Detection Kit, which enables testing of the waste solutions to ensure the absence of residual aldehydes. Neutralin is prepacked and ready to receive five gallons of 4% formaldehyde (10% formalin) solutions.
Neutralin ®
Safer Disposal of Aldehyde Waste .......................................... 106
APPL ICATION
Neutralin HS-108 1 system
Product Name Cat. No. Size
Neutralizes Formaldehyde, Glutaraldehyde and other Aldehyde SolutionsConvenient, Safer Disposal
l
l
Safer Aldehyde DisposalTM

Histology Products - Mounting Media
105USA: 1-800-526-3867EUROPE: 441 482 646022
Histology
Mounting M
edia
National Diagnostics mounting media have been laboratory standards for over twenty five years. They enable the researcher to produce museum quality slide preparations with crystal clear visibility.
Histomount is the classic choice in synthetic mounting media. Histomount provides a permanent seal to store or ship slides with confidence.
Histomount is a pH neutral, UV stabilized preparation which retains its clarity and brilliance for years. Refractive index is matched to glass cover slips and slides, reducing chromatic aberration with any light source.
Histomount is effective with most clearing agents when used as a liquid cover slip or as a permanent mounting medium for traditional glass cover slipping. A dip stick providing an optimal amount of Histomount is provided with each 100 ml bottle.
Histomount
®
Mounting Tissue Sections ............................................................ 115
APPL ICATION
Mounting Media
Hydromount is the traditional choice whenever a nonfluorescing aqueous medium is needed. Hydromount is water-based and is suitable for mounting specimens that have been processed in water. Hydromount is effective for frozen sections, amyloid, and immunofluorescent staining procedures. Should it become necessary, Hydromount may be removed by soaking the slides in warm saline.
Hydromount
Product Name Cat. No. Size
TM
TM
Specifically developed to provide compatibility with National Diagnostics clearing agent, Histo-Clear II, Omnimount combines outstanding optical characteristics with low fluorescence and exceptional durability. In addition to being the ideal partner for Histo-Clear II, Omnimount is a truly universal mounting medium, compatible with all common clearing agents: xylene, toluene, limonene, and petroleum derived products.
The Omnimount solvent has a higher flash point and a lower toxicity than xy-lene based mountants, so Omnimount provides both a safer work environment and reduces shipping costs.
Omnimount TM
Histomount HS-103 100 ml (1-3) 100 ml (4+) 450 ml (1-3) 450 ml (4+) Hydromount HS-106 100 ml (1-3) 100 ml (4+) Omnimount HS-110 100 ml (1-3) 100 ml (4+)

Histology Products - Histological Stains
106 USA: 1-800-526-3867EUROPE: 441 482 646022
His
tolo
gyS
tain
s
Uniform and reliable, National Diagnostics’ stains are the highest possible quality. Their preparation entails special purification and conformity to high standards of performance.
Histological Stains
Harris’ Hematoxylin
Harris’ Hematoxylin HS-400 l liter
Product Name Cat. No. Size
Finest Control of the Ripening ProcessLongest Shelf LifeFewest ArtifactsReproducible Vibrant Staining
l
l
l
l
Eosin Solution 1% Stock SolutionReady for Use in your Preferred Protocol
l
l
Eosin Solution HS-402 100 ml
Product Name Cat. No. Size
For Reliable Bluing of Hematoxylin StainsUltra-Pure Reagents0.1 Micron Filtration18 megOhm Water
l
l
l
l
Scott’s Tapwater HS-404 1 liter
Product Name Cat. No. Size
Scott’s Tapwater
H & E Staining Supplies
The most commonly used histological stain, hematoxylin is a natural compound extracted from a species of tree found in Mexico and the West Indies. The extracted compound is oxidized to produce hematein, the active staining component of the hematoxylin stain. The production of histological staining solutions is an art. Only a few laboratories are ca-pable of developing a stain of reliable vibrance. At National Diagnostics we have gone one step further. Our proprietary methods achieve the finest control of the ripening process, resulting in the only commercially available Harris’ Hematoxylin with a full one year shelf-life.

Histology Products - Histological Stains
107USA: 1-800-526-3867EUROPE: 441 482 646022
Histology
Stains
Dye for histones in alkaline & neutral buffer systems. Commonly used tracking dye in DNA, RNA and protein electrophoresis.
Bromophenol Blue
Alcian Blue in conjunction with PAS (Mowry, 1956) is commonly used to differentiate acid and neutral mucopolysaccharides. It is also used with safranine for mast cell differentiation (Csaba, 1969.)
Alcian Blue
Alcian Blue HS-504 25 g
Bromophenol Blue HS-603 10 g
Amido Black is a useful forensic stain typically used for enhancing latent prints contaminated with blood. Amido Black is very sen-sitive to the proteins found in blood. It leaves a black/blue stain and is usable on both porous and nonporous surfaces.
Amido Black
Amido Black 10B HS-601 25 g
Basic Fuchsin is the main ingredient of Schiff’s reagent, a pH indicator, and can be used as stain for glycoproteins and muco-polysaccharide proteins in acidic pH systems. Usually used with Naphthol Blue Black as a post-stain color enhancer.
Basic Fuchsin
Basic Fuchsin HS-518 25 g
Biebrich Scarlet can be used as a plasma stain instead of Acid Fuchsin in Masson’s trichrome.
Biebrich Scarlet
Biebrich Scarlet HS-506 25 g
Recommended as a substitute for Light Green SF Yellowish in Masson’s trichrome as it is less likely to fade. It may be substituted for Light Green in many other procedures as well.
Fast Green FCF
Fast Green FCF HS-516 25 g
Methyl Green in conjunction with Pyronin Y will differentiate RNA & DNA.
Methyl Green
Methyl Green HS-606 10 g
Sensitive stain specific for DNA and RNA.
Methylene Blue
Methylene Blue HS-525 25 g
Pyronin Y in conjunction with Methyl Green will differentiate RNA & DNA.
Pyronin Y
Pyronin Y HS-607 5 g

Histology Applications - Fundamental Histological Technique
108 USA: 1-800-526-3867EUROPE: 441 482 646022
His
tolo
gyFu
ndam
enta
ls
Histology...Through the Looking Glass
Histology is concerned with the relationships between life processes and the microscopic characteristics of tissues. In practice, histology involves the collection of tissues from the body and their examination under a microscope. The purpose of histological procedures is often to assist in the diagnosis of disease.
Prior to microscopic examination, it is usually necessary to subject a tissue specimen to a series of processes in order to preserve the tissue and to highlight specific morphological characteristics. Although in practice there are many variations of histological technique, the most common means to prepare a slide for light microscopy is referred to as the paraffin technique. The paraffin technique consists of the steps of fixation, dehydration, clearing, embedding in paraffin, sectioning, rehydration, staining, and mounting.
Thanks to the University of Bristol Department of Pathology and Microbiology.
1 Histology Fundamentals
1.1 FIXATION Aldehyde Based Fixatives / Other Fixatives / Factors
AffectingFixation/WorkingSafelywithFixatives
1.2 DECALCIFICATION
1.3 PROCESSING OF FIXED TISSUE Dehydration / Clearing / Embedding
1.4 SECTIONING
1.5 ARTIFACTS IN HISTOLOGIC SECTIONS
1.6 STAINING Introduction / The Chemistry of Dyes / The
Chemistry of Staining / Staining Procedures
1.7 MOUNTING

Histology Applications - Fundamental Histological Technique
109USA: 1-800-526-3867EUROPE: 441 482 646022
Histology
Fundamentals
1.1 FixationTo maintain the tissue in as lifelike a state as possible, tissue for analysis is usually placed directly into a fixative solution upon removal from the body. Fixation is normally carried out as soon as possible to prevent autolysis and to reduce possible infectivity. Several factors determine the choice of fixative for a given application. If morphological changes are known to take place rapidly after tissue collection, as with neural tissue, the speed of fixing action is extremely important. For large tissue samples, the rate of penetration of the fixative into the sample must also be considered. If immunological detection methods are to be used, a fixative which preserves protein structure is required. For Electron Microscopy, fixatives which do not precipitate proteins avoid artifacts invisible to light microscopy. The price of a fixative may also be a factor. The low cost of formaldehyde fixatives is one reason for their popularity. A partial list of fixatives, grouped by chemical type, would include:
Aldehydes Mercurials Formaldehyde B-5 Glutaraldehyde Zenker’s Mirsky’s Fixative Alcohols Picrates Methanol Bouin’s solution Ethanol Oxidizing agents Osmium tetroxide Permanganate fixatives (potassium permanganate) Dichromate fixatives (potassium dichromate)
Protocol 1.1.1a
Microwave Fixation with Mirsky’s Fixative
1. Fix tissue blocks (<3mm on a side) in Mirsky’s fixative for 30 minutes at room temperature.
2. Microwave vials in a microwave processor.
1-3mm thick blocks: 15 minutes at 55°C < 1mm thick blocks: 4 minutes at 55°C
3. Transfer the block to 100% ethanol, and microwave for 4-8 minutes (increase time for thicker sections) at 67°C.
4. Repeat ethanol/microwave treatment with fresh ethanol 2 times.
5. Microwave in preheated-paraffin for 7 minutes at 84°C
1.1.1 Aldehyde FixativesFormaldehyde and glutaraldehyde are the most commonly used aldehyde fixatives. They work by forming cross-links both within and between proteins, particularly between lysine residues. Damage to the tertiary structure of the proteins occurs on a limited basis. Formalin (37% aqueous formaldehyde) is normally diluted 10 fold and neutrally buffered to make a working fixative solution consisting of 4% form-aldehyde. The buffer prevents autolysis that occurs under acid conditions and also prevents the development of coloration of the tissue caused by “formalin pigment”.
Glutaraldehyde (normally used as a 2% buffered solution) causes defor-mation of alpha-helix structures in proteins, which limits its usefulness as a fixative for immunological stains. Glutaraldehyde is nonetheless a rapid fixative. As a result, it has become the standard for electron mi-croscopy (Section 2.2). Recently glutaraldehyde has become identified as a powerful allergen. A maximum exposure limit of 0.05mg/m3 has been imposed on laboratories in the United Kingdom, sharply limiting the use of this fixative in that country.
National Diagnostics’ Mirsky’s Fixative is an aldehyde based formula which is exceptionally good at preserving fine tissue structure and protein conformations. This fixative is an excellent replacement for Glutaraldehyde in EM applications. For light microscopy, Mirsky’s Fixative is especially recommended for immunoperoxidase techniques where formaldehyde can lead to the loss of epitopes. The use of micro-wave enhancement can speed the action of Mirsky’s Fixative greatly, allowing tissues to be embedded within a few hours.
Formaldehyde Glutaraldehyde
Common Fixatives
Fixative Typical Applications Disadvantages
Buffered Formaldehyde
General use. The most widely used fixative.
Toxic. Discolors tissues, may cause “formalin pigment” formation.
Advantages
Works well in a wide range of applications. Easily identifiable odor.
Bouin’s Solution
Testis, GI tract, endocrine tissue.
Slow. Colors tissue yellow. May cause tissue shrinkage.
Does not require removal of mercury deposits before staining.
Picric Acid Fixes histones and basic pro-teins.
Explosive when dry. Shrinks tissue.
Good glycogen preservation.
95% Ethanol SmearsCauses dena-turation and brittleness.
Rapid. Easy. Low toxicity.
Glutaraldehyde Electron Microscopy
Toxin, allergen, solution must be cold, and tissue should be <1mm thick.
Good preservation of fine structure. Cross linking fixative.
Zenker’s Fixative
Reticuloendothe-lial tissues: lymph nodes, spleen, thymus, bone marrow.
Mercury deposits must be removed before staining.
Excellent nuclear fixative. Enhances some stains.
Mirsky’s Fixative
General use.Electron microscopy. Glutaraldehyde replacement.
Tissues must be sectioned to <3mm thickness.
Excellent preserva-tion of fine structure. Cross linking fixative. Antimicrobial.
Table 1.1a
Figure 1.1.1a Aldehyde fixatives form crosslinks between proteins.
Aldehydefixative
Mirsky’s Fixative HS-102(Concentrate and Buffer)Excellent for immunohistochemistry with en-hanced enzyme and antibody activity. (pg.103)
Neutralin HS-108Improves safety by converting hazardous aldehyde waste into a nonhazardous polymer and water. (pg.104)
Products for Fixation
Mirsky’s Fixative HS-101(Ready-to-Use)Convenient, no-mixing formula. 30 day shelf-life. (pg.103)

Histology Applications - Fundamental Histological Technique
110 USA: 1-800-526-3867EUROPE: 441 482 646022
His
tolo
gyFu
ndam
enta
ls
1.1.3 FactorsAffectingFixationFixation protocols are usually straightforward. The tissue is cut to dimensions suited to the rate of penetration of the particular fixative and placed in the fixative solution. The number of factors affecting the fixation process includes buffering, penetration, volume, temperature and concentration.
In fixation pH is critical. This is especially the case with formaldehyde, where acidity favors the formation of formalin-heme pigment deposits in tissue and may lead to protein denaturation and structural deformations. Sources of acidity include hypoxia of tissues and oxidation of formalde-hyde stocks to formic acid. To prevent extremes of acidity or basicity, fixatives are generally buffered to a pH between 6-8. Common buffers include phosphate, bicarbonate, cacodylate, and veronal. Commercial formaldehyde fixatives are often buffered with phosphate at a pH of 7.The diffusibility of each fixative will determine its rate of penetration
Methanol
Ethanol
Mercuric chloride
HgCl2
1.1.2 Other Fixatives
Mercury Based FixativesMercurials contain mercuric chloride. Their method of tissue fixation is poorly understood. While not penetrating tissue well and causing some tissue hardness, mercurials are fast and provide excellent nuclear detail. They are commonly used to fix hematopoietic and reticuloen-dothelial tissues.
Alcohol FixativesAlcohols, including methyl alcohol (methanol) and ethyl alcohol (etha-nol), are sometimes used as fixatives. They tend not to be used routinely as they cause brittleness in tissue due to their dehydrating effect. How-ever, they are very good for cytological smears because they act quickly and give good nuclear detail.
Oxidizing FixativesOxidizing agents such as potassium permanganate, potassium dichro-mate, and osmium tetroxide are powerful denaturants and are therefore of limited use. Osmium tetroxide is used most commonly in electron microscopy.
Potassiumpermanganate Potassium
dichromateOsmiumtetroxide
Picric Acid FixativesForemost among the picrate based fixatives is Bouin’s solution. Its mechanism of action is unknown. Like the mercurials, they give good nuclear detail but with less brittle-ness of tissue.
Picric acid
through tissue. Formalin and alcohol penetrate the fastest, glutaralde-hyde the slowest, with mercurials and Mirsky’s Fixative falling between these extremes. Normally, slow rates of penetration are only a problem when dealing with whole organ perfusion, because thin tissue sections are easily permeated and not affected by this variable. Speed of fixation can be dramatically improved by the use of microwave protocols.
The standard ratio of fixative to tissue volume is 10:1. Lower volumes can be used if frequent changes of the fixative are carried out to prevent exhaustion. Agitation will enhance the process by ensuring that fresh fixative solution is constantly washing over the surface of the tissue.
Increasing the temperature will increase the speed of fixation, and hot formaldehyde is often used in automated tissue processors. The tem-perature used must be selected carefully, as thermal denaturation of tissue proteins will begin to occur at extreme temperatures. Generally 60°C is used with formaldehyde fixatives.
The concentration of the fixative can affect the rate of fixation and the total penetration of fixative into the sample. Too high a concentration will lead to hardening of the tissue and the formation of excessive artifacts. Too low a concentration will allow exhaustion of the fixative before the process is complete.
1.1.4 Working Safely with FixativesFixatives are among the most hazardous substances used in life science research. Work with these substances under the hood wearing gloves, lab coat and safety goggles.
Formaldehyde is a suspect cancer hazard and a strong sensitizer. It is harmful if inhaled or absorbed through the skin. High exposures may be fatal. Formaldehyde can cause blindness if swallowed.
Glutaraldehyde is corrosive, causing severe eye burns as well as severe irritation to the skin and respiratory tract. Additionally, glutaraldehyde can cause an allergic reaction.
Potassium permanganate, potassium dichromate and osmium tetroxide are strong oxidizers and can cause severe burns to any area of contact, possibly fatal if swallowed or inhaled. Furthermore, potassium dichro-mate is a known carcinogen.
Mercuric chloride may be fatal if swallowed. It is a birth defect haz-ard. Mercuric chloride is harmful if inhaled or absorbed through the skin. Mercuric chloride causes severe irritation to the eyes, skin, and respiratory tract.
Safe Disposal of Aldehyde Waste
National Diagnostics’ Neutralin converts aldehyde waste into a noncorrosive, nontoxic polymer and water (nonhazardous waste as defined in Title 40 Code of Federal Regulations (United States)) 40 CFR 261.24(a). Neutralin reduces disposal costs and contributes to a safer work environment.

Histology Applications - Fundamental Histological Technique
111USA: 1-800-526-3867EUROPE: 441 482 646022
Histology
Fundamentals
1.2 DecalcificationThe removal of calcium deposits is essential for good embedding pro-cedure. Decalcification is usually carried out between the fixation and processing steps (Section 1.3). Bone must obviously be processed in this way, but other tissues may also contain calcified areas. A variety of agents or techniques have been developed to decalcify tissues, each with advantages and disadvantages. Immersion in solutions containing mineral acids, organic acids, or EDTA are the predominant methods used. Electrolysis has also been tried.
Strong mineral acids such as nitric and hydrochloric acids are used with dense cortical bone because they will remove large quantities of calcium at a rapid rate. As might be expected, these strong acids also damage cellular morphology. Mineral acid decalcifiers are not recommended for delicate tissues such as bone marrow. Because they are not as ag-gressive, organic acids such as acetic and formic acid are better suited to bone marrow and other soft tissues. Organic acids act more slowly than mineral acids, and will require extended treatments to decalcify cortical bone. Formic acid in a 10% concentration is the best all-around decalcifier. Some commercial solutions combine formic acid with for-malin to fix and decalcify tissues at the same time.
EDTA can remove calcium and is not as harsh as mineral or organic acids. The use of EDTA is limited by the fact that it penetrates tissue poorly and works slowly. It is also expensive in large amounts. Elec-trolysis has been tried in experimental situations where calcium had to be removed with the least tissue damage. Electrolysis is slow and not suited for routine daily use.
1.3.1 DehydrationDehydration is usually carried out by transferring the tissue through solutions of increasing alcohol concentration, until 100% alcohol is reached. Sometimes the first step is a mixture of Formalin and alcohol. Other dehydrants can be used, but have major disadvantages. Acetone, though fast, is a fire hazard, so it is safe only for small, hand-processed sets of tissues. Dioxane can be used without clearing, but has toxic fumes.
1.3.2 Clearing
The step following dehydration is called “clearing” and consists of replacing the dehydrant with a substance that will be miscible with the embedding medium (paraffin). The term “clearing” comes from the fact that the clearing agents often have the same refractive index as proteins. As a result, when the tissue is completely infiltrated with the clearing agent, it becomes translucent. This change in appearance is often used as an indication of the effectiveness or completeness of the clearing process.
The most common clearing agent is xylene. Xylene is reasonably cost effective and works well for short-term clearing of small tissue blocks. Long-term immersion of tissue in xylene results in tissue distortions. Toluene is better at preserving tissue structure and is more tolerant of small amounts of water left behind in the tissues than xylene. However, toluene is more expensive than xylene and more toxic, so toluene is less commonly used. Chloroform has been used in some applications, but it is a severe health hazard, acts slowly and may lead to sectioning dif-
Calci-Clear HS-104Decalcification utilizing chelating and sequestering agents to effi-ciently remove solubilized calcium. (pg. 98)
Products for Decalcification
Calci-Clear Rapid HS-105Very rapid, high quality bone and tissue decalcification. Tissue dis-tortion and structure loss mini-mized. (pg. 98)
1.3 Processing Fixed TissueOnce fixed, the tissue must be treated to allow the cutting of the thin sections required for viewing under the microscope. The procedures designed to prepare the tissue for sectioning are collectively known as Tissue Processing. First, the sample is dehydrated by immersion in a series of aqueous alcohol solutions gradually moving to pure alcohol. The tissue is then soaked in an appropriate solvent to remove the alcohol. Finally the tissue is embedded in paraffin wax, which enables the cut-ting of sections of between 3 and 10 microns thickness. The movement through the series of baths in Tissue Processing occurs either by hand or by means of an automated processor. Table 1.3a gives a typical tissue schedule for an automated processor. The optimum protocol for any particular sample and apparatus may vary.
Automated Tissue Processing Schedule
Process Bath18 hour cycleTime (hours)
24 hour cycleTime (hours)
70% Ethanol80% Ethanol95% EthanolAbsolute AlcoholAbsolute AlcoholAlcohol/Histo-Clear (v/v)Histo-ClearHisto-ClearHisto-ClearParaffinParaffinParaffin
1.51.51.51.51.51.51.51.51.51.51.51.5
222222222222
Table 1.3a
Figure 1.3a An overview of the complete process of tissue preparation for viewing by light microscopy, from fixation to mounting.
Histo-Clear HS-200Recognized as the best orange oil clearing agent available. Outperforms xylene while increasing safety. (pg. 100)
Histosol HS-100High flash point solvent replacement for xylene. (pg101)
National Diagnostics Clearing Agents
Histo-Clear II HS-202Histo-Clear II substitutes for xylene especially well in dry mounting applications. Low citrus odor. (pg. 101)
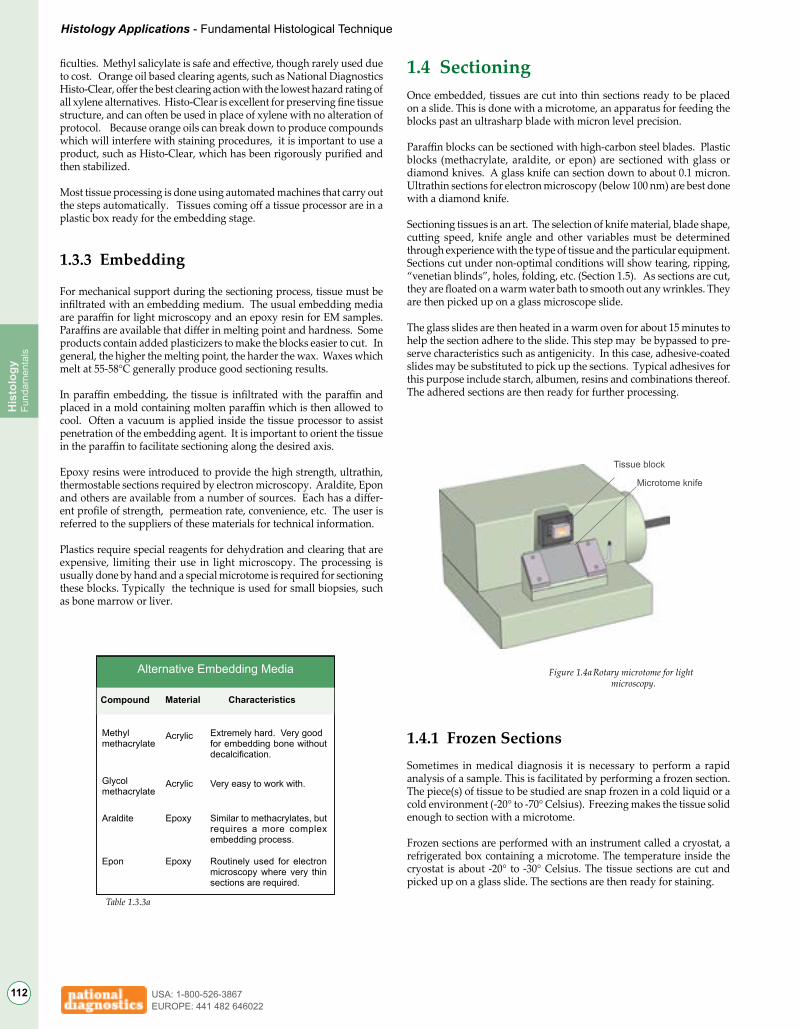
Histology Applications - Fundamental Histological Technique
112 USA: 1-800-526-3867EUROPE: 441 482 646022
His
tolo
gyFu
ndam
enta
ls
ficulties. Methyl salicylate is safe and effective, though rarely used due to cost. Orange oil based clearing agents, such as National Diagnostics Histo-Clear, offer the best clearing action with the lowest hazard rating of all xylene alternatives. Histo-Clear is excellent for preserving fine tissue structure, and can often be used in place of xylene with no alteration of protocol. Because orange oils can break down to produce compounds which will interfere with staining procedures, it is important to use a product, such as Histo-Clear, which has been rigorously purified and then stabilized.
Most tissue processing is done using automated machines that carry out the steps automatically. Tissues coming off a tissue processor are in a plastic box ready for the embedding stage.
1.3.3 Embedding
For mechanical support during the sectioning process, tissue must be infiltrated with an embedding medium. The usual embedding media are paraffin for light microscopy and an epoxy resin for EM samples. Paraffins are available that differ in melting point and hardness. Some products contain added plasticizers to make the blocks easier to cut. In general, the higher the melting point, the harder the wax. Waxes which melt at 55-58°C generally produce good sectioning results.
In paraffin embedding, the tissue is infiltrated with the paraffin and placed in a mold containing molten paraffin which is then allowed to cool. Often a vacuum is applied inside the tissue processor to assist penetration of the embedding agent. It is important to orient the tissue in the paraffin to facilitate sectioning along the desired axis.
Epoxy resins were introduced to provide the high strength, ultrathin, thermostable sections required by electron microscopy. Araldite, Epon and others are available from a number of sources. Each has a differ-ent profile of strength, permeation rate, convenience, etc. The user is referred to the suppliers of these materials for technical information. Plastics require special reagents for dehydration and clearing that are expensive, limiting their use in light microscopy. The processing is usually done by hand and a special microtome is required for sectioning these blocks. Typically the technique is used for small biopsies, such as bone marrow or liver.
Alternative Embedding Media
Compound Material Characteristics
Methylmethacrylate
Acrylic
Glycolmethacrylate
Acrylic
Araldite Epoxy
Epon Epoxy
Extremely hard. Very good for embedding bone without decalcification.
Very easy to work with.
Similar to methacrylates, but requires a more complex embedding process.
Routinely used for electron microscopy where very thin sections are required.
Table 1.3.3a
1.4 Sectioning Once embedded, tissues are cut into thin sections ready to be placed on a slide. This is done with a microtome, an apparatus for feeding the blocks past an ultrasharp blade with micron level precision.
Paraffin blocks can be sectioned with high-carbon steel blades. Plastic blocks (methacrylate, araldite, or epon) are sectioned with glass or diamond knives. A glass knife can section down to about 0.1 micron. Ultrathin sections for electron microscopy (below 100 nm) are best done with a diamond knife.
Sectioning tissues is an art. The selection of knife material, blade shape, cutting speed, knife angle and other variables must be determined through experience with the type of tissue and the particular equipment. Sections cut under non-optimal conditions will show tearing, ripping, “venetian blinds”, holes, folding, etc. (Section 1.5). As sections are cut, they are floated on a warm water bath to smooth out any wrinkles. They are then picked up on a glass microscope slide.
The glass slides are then heated in a warm oven for about 15 minutes to help the section adhere to the slide. This step may be bypassed to pre-serve characteristics such as antigenicity. In this case, adhesive-coated slides may be substituted to pick up the sections. Typical adhesives for this purpose include starch, albumen, resins and combinations thereof. The adhered sections are then ready for further processing.
1.4.1 Frozen SectionsSometimes in medical diagnosis it is necessary to perform a rapid analysis of a sample. This is facilitated by performing a frozen section. The piece(s) of tissue to be studied are snap frozen in a cold liquid or a cold environment (-20° to -70° Celsius). Freezing makes the tissue solid enough to section with a microtome.
Frozen sections are performed with an instrument called a cryostat, a refrigerated box containing a microtome. The temperature inside the cryostat is about -20° to -30° Celsius. The tissue sections are cut and picked up on a glass slide. The sections are then ready for staining.
Figure 1.4a Rotary microtome for light microscopy.
Tissue block
Microtome knife

Histology Applications - Fundamental Histological Technique
113USA: 1-800-526-3867EUROPE: 441 482 646022
Histology
Fundamentals
Tissue block
Microtome knife
1.5 Artifacts in Histologic SectionsArtifacts that appear in stained slides may result from a number of caus-es including improper fixation, the type of fixative, poor dehydration, improper reagents, or poor microtome sectioning.
The presence of a fine black precipitate on the slides, often with no rela-tionship to the tissue (i.e., the precipitate appears adjacent to tissues or within interstices or vessels) suggests the formation of formalin-heme pigment. The identification of this problem can be confirmed by polar-ized light microscopy. The pigment is birefringent in polarized light and will appear as numerous bright white motes on the slide. It forms when the formalin buffer is exhausted and the tissue becomes acidic, which promotes the formation of a complex of heme and formalin. Formalin-heme pigment is most often seen in tissues containing large amounts of blood or heme proteins, or in autopsy tissues. Tissues such as spleen and lymph node are particularly prone to this artifact. Making thin sections and using enough neutral-buffered formalin (10 to 1 ratio of fixative to tissue) will help. If the fixative solution in which the tissues are sitting is extremely murky brown to red, place the tissues in new fixative.
The presence of large irregular clumps of black precipitate on slides of tissues fixed in a mercurial fixative such as B-5 suggests that the tissues were not “dezenkerized” prior to staining. These black precipitates will also appear white with polarized light microscopy.
Tissues that are insufficiently dehydrated prior to clearing and infiltra-tion with paraffin wax will be hard to section on the microtome, leading to tearing and holes in the sections. Tissue processor cycles should allow sufficient time for dehydration, and the final ethanol dehydrant solution should be at 100% concentration, which can be difficult to achieve in humid climates. Covering or sealing the solutions from ambient air will help. Air conditioning (with refrigerants, not with evaporative coolers) will also reduce humidity in the laboratory. As a clearing agent, toluene is more forgiving of poorly dehydrated tissues, but it is more expensive and presents more of a health hazard than most other clearing agents.
Though alcohols such as ethanol make excellent fixatives for cytologic smears, they tend to make tissue sections brittle, resulting in microtome sectioning artifacts with chattering and a “venetian blind” appearance.
Bubbles under the coverslip may form when the mounting medium is too thin, and, as it dries, air is pulled in under the coverslip. Contam-ination of clearing agents or coverslipping media may also produce a bubbled appearance under the microscope. It is important to confirm that a clearing agent is compatible with the mounting medium to be used because some solvent may be carried over to the mounting stage.
Formalin-heme pigment Fold
Nick in cuttingedge
Figure 1.5a Artifacts often found in histological sections. A) Formalin-heme pigment B) Fold which occurred during attachment to slide C) Line across section produced by a nick in the cutting edge of the microtome knife.
A B C
Eosin B Eosin B (excited)
1.6 StainingHistological staining involves the use of dyes to highlight specific intra- or extracellular elements within tissue. A vast array of dyes and associated staining protocols exist in use. Each dye is targeted toward different cellular structures. The response to a given protocol can vary among samples. Many protocols are up to 100 years old, and were devel-oped using partially characterized textile dyes. As a result, the detailed mechanism underlying many popular staining techniques is unclear.
1.6.1 The Chemistry of Dyes
The human eye responds to wavelengths of light between 400 and 700 nanometers (the visible spectrum). The presence of all wavelengths in this spectrum is perceived as white light. The presence of one wavelength alone is seen as a color: Blue for 450 nm light, Red for 600 nm light, etc. Furthermore, if one color (wavelength) is removed from the full visible spectrum, the light is perceived as having the “complementary color”. For example, materials which absorb at 450 nm (blue light) will appear carmine. In general, dyes appear colored because they absorb a particular wavelength in the visible region. The eye senses the reflected light as the complementary color.
Figure 1.6.1a The colors of the visible spectrum are represented above as three complementary pairs. The absorption of yellow light by the dye eosin produces a complementary purple color.
Harris’ Hematoxylin HS-400 For vibrant, reproducible H&E staining. Longest shelf-life of any Harris’ Hematoxylin on the market. (pg. 106)
Alcian Blue HS-504 Histological stain used to differentiate acid and neutral mucopolysaccharides and as a differential stain for amyloid tissue. (pg. 107)
Amido Black 10B HS-601 Very sensitive stain for proteins found in blood. (pg.107)
Basic Fuchsin HS-518 Used with periodic acid in the PAS stain for carbohydrates. (pg.107)
Biebrich Scarlet HS-506 Can be used as a plasma stain in Masson’s Trichrome. (pg.107)
Bromophenol Blue HS-603 Dye for histones in alkaline and neutral buffer systems. (pg. 107)
Histological Stains from National Diagnostics
Eosin Solution HS-402 1% stock solution. Ready for use in the protocol of your choice. (pg.106)
Fast Green FCF HS-516 Can be used as a protein stain, or as a substi-tute for Light Green SF yellowish in Masson’s Trichrome. (pg.107)
Methylene Blue HS-525 Sensitive stain specific for RNA and DNA. (pg.107)
Methyl Green HS-606 Metachromatic amyloid staining, used in conjunction with Pyronin to differentiate RNA and DNA. (pg.107)
Pyronin Y HS-607 Used in conjunction with Methyl Green to differentiate RNA and DNA. Alternative marker dye for RNA electrophoresis. (pg.107)

Histology Applications - Fundamental Histological Technique
114 USA: 1-800-526-3867EUROPE: 441 482 646022
His
tolo
gyFu
ndam
enta
ls
1.6.3 The Chemistry of Staining
Staining procedures provide conditions which promote the binding of a given dye to specific cellular organelles or extracellular features. The utility of a staining procedure lies in its ability to bind dye only to selected structures, highlighting these structures in contrast with the rest of the section. To accomplish this, each procedure makes use of a subset of possible interactions between the dye and the cellular components. The major classes of interaction (bonds) are ionic, covalent, and hydrophobic. Ionic bonding results from the attraction between positive and negative charges. In solution, acidic groups (carboxylic or sulfonic acids, etc.) will lose a proton and become negatively charged (anionic). Basic groups (generally amines) will accept a proton to become positively charged cations. The pH of the solution determines the extent to which any chemical group is protonated or deprotonated, and a dye or biological molecule may have many such groups on its surface. Thus, altering the pH of a staining solution will alter the charges on the dye and the tissue molecules, and therefore alter the staining pattern. Ionic bonds are the predominant mode of interaction between tissues and dyes.
Covalent bonding occurs between uncharged atoms that require the gain or loss of electrons to reach a stable configuration. In the usual scenario, the atoms involved donate electrons to a shared orbital. The atoms then share the electrons involved, and are bonded by the resulting orbital. Coordinate bonds are a subclass of covalent bonds in which one of the atoms donates all the electrons (two of them) which are then shared by both of the atoms participating in the bond. Except with mordants, covalent bonds are of little importance in staining.
The presence of nonpolar molecules in an aqueous environment forces water molecules to assume a highly ordered arrangement, which is entropically disfavored. A large sphere of nonpolar molecules pres-ents less surface area to the water than many dispersed molecules, so nonpolar materials tend to aggregate into their own phase. This sort of behavior, where molecules partition out of an aqueous solution, is called hydrophobicity, and the tendency of hydrophobic molecules to self associate is called the hydrophobic interaction. This phenomenon is utilized in staining lipids, which are hydrophobic. Hydrophobic stains will tend to dissolve into lipid rich regions of the section, highlighting them for analysis.
Many dyes have a poor affinity for tissue when used alone. Various compounds, most often metal salts, have been found to enhance the staining of these dyes. These enhancing compounds are called mordants. The mechanism of action of the mordants is not clear, but it presumably involves coordination bonding between the metal and the dye, and then further coordination between this complex and the tissue.
1.6.4 Staining Procedures
Most dyes used to visualize the membranes and organelles of the cell are water soluble. The embedded wax must therefore be removed prior to staining. This is done by effectively reversing the tissue processing schedule (Figure 1.3a).
There are literally thousands of staining protocols and procedures in use. As an example, one of the most common stains, the Hematoxylin-Eosin stain, is presented below. For a detailed list of stain procedures we rec-ommend that you visit the University of Bristol web site: www.bristol.ac.uk/vetscience/services/pathology/
Hematoxylin and Eosin Stain:Hematoxylin is a natural compound extracted from a species of tree found in Mexico and the West Indies. The extracted compound is then oxidized to produce hematein, which is the active staining component of the hematoxylin stain. Hematoxylin stains must therefore be “ripened” by oxidation before they can be used. Hematoxylin staining requires the use of a mordant (most commonly aluminum salts) and stains the nuclear components of cells a dark blue. Hematoxylin is used in combination with eosin because eosin stains the cytoplasmic organelles varying shades of pink, red or orange. The combination of the two stains provides a broad range of morphological information about the section.
Hematoxylin
Hematein
Eosin Y
Figure 1.6.4a The H & E (Hematoxylin and Eosin) stained section above shows dark blue, hematoxylin stained nuclei against pink, eosin stained cytoplasm.
Thanks to the University of Bristol Department of Pathology and Mi-crobiology.
1.6.2 Why dyes produce colorAbsorption of light energy occurs when a compound has an electron which can be promoted by a “quantum permitted” mechanism to a higher energy level. The energy difference between the ground state and the excited state determines the wavelength of light absorbed. The energy absorbed can be re-emitted at a longer wavelength (fluorescence), or dissipat-ed as heat (simple absorbance) (Figure 1.6.2b). All dyes possess a chromophore, an aryl ring system with one or more de-localized electrons. (Figure 1.6.2a). These electrons can be promoted to excited states by visible light. The absorption wavelength of a given ring system can be modified by the addition of non-aryl sub-stituents (color modifiers). For example, the successive addition of methyl groups to the red dye Pararosaniline produces a series of dyes with progressively longer absorbance wavelengths: Methyl violet (4 methyl groups), Crystal Violet (6 methyl groups), and Methyl Green (7 methyl groups).
Basic Fuchsin
Figure 1.6.2a The molecular structures of dyes contain con-jugated aromatic rings.
Methylene Blue
Red Color Produced by Absorption
Red Color Produced by Fluorescence
Figure 1.6.2b Simple absorption vs. fluorescence.
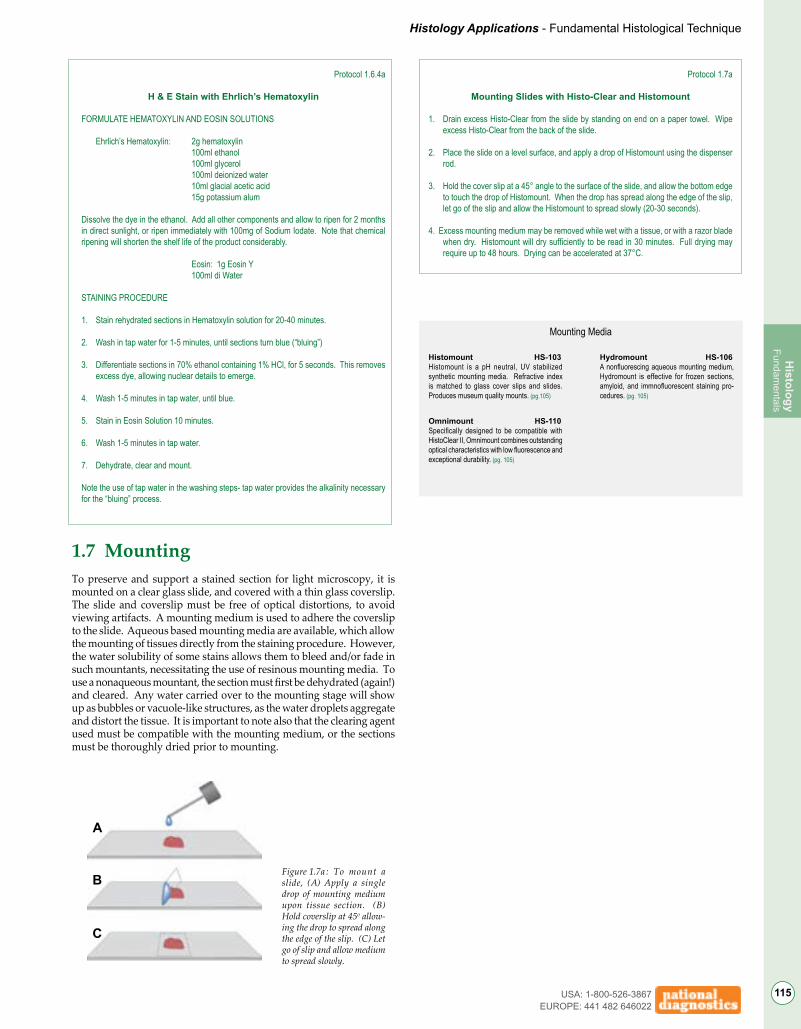
Histology Applications - Fundamental Histological Technique
115USA: 1-800-526-3867EUROPE: 441 482 646022
Histology
Fundamentals
Protocol 1.6.4a
H & E Stain with Ehrlich’s Hematoxylin
FORMULATE HEMATOXYLIN AND EOSIN SOLUTIONS
Ehrlich’s Hematoxylin: 2g hematoxylin 100ml ethanol 100ml glycerol 100ml deionized water 10ml glacial acetic acid 15g potassium alum
Dissolve the dye in the ethanol. Add all other components and allow to ripen for 2 months in direct sunlight, or ripen immediately with 100mg of Sodium Iodate. Note that chemical ripening will shorten the shelf life of the product considerably.
Eosin: 1g Eosin Y 100ml di Water
STAINING PROCEDURE
1. Stain rehydrated sections in Hematoxylin solution for 20-40 minutes.
2. Wash in tap water for 1-5 minutes, until sections turn blue (“bluing”)
3. Differentiate sections in 70% ethanol containing 1% HCl, for 5 seconds. This removes excess dye, allowing nuclear details to emerge.
4. Wash 1-5 minutes in tap water, until blue.
5. Stain in Eosin Solution 10 minutes.
6. Wash 1-5 minutes in tap water.
7. Dehydrate, clear and mount.
Note the use of tap water in the washing steps- tap water provides the alkalinity necessary for the “bluing” process.
1.7 MountingTo preserve and support a stained section for light microscopy, it is mounted on a clear glass slide, and covered with a thin glass coverslip. The slide and coverslip must be free of optical distortions, to avoid viewing artifacts. A mounting medium is used to adhere the coverslip to the slide. Aqueous based mounting media are available, which allow the mounting of tissues directly from the staining procedure. However, the water solubility of some stains allows them to bleed and/or fade in such mountants, necessitating the use of resinous mounting media. To use a nonaqueous mountant, the section must first be dehydrated (again!) and cleared. Any water carried over to the mounting stage will show up as bubbles or vacuole-like structures, as the water droplets aggregate and distort the tissue. It is important to note also that the clearing agent used must be compatible with the mounting medium, or the sections must be thoroughly dried prior to mounting.
Protocol 1.7a
Mounting Slides with Histo-Clear and Histomount
1. Drain excess Histo-Clear from the slide by standing on end on a paper towel. Wipe excess Histo-Clear from the back of the slide.
2. Place the slide on a level surface, and apply a drop of Histomount using the dispenser rod.
3. Hold the cover slip at a 45° angle to the surface of the slide, and allow the bottom edge to touch the drop of Histomount. When the drop has spread along the edge of the slip, let go of the slip and allow the Histomount to spread slowly (20-30 seconds).
4. Excess mounting medium may be removed while wet with a tissue, or with a razor blade when dry. Histomount will dry sufficiently to be read in 30 minutes. Full drying may require up to 48 hours. Drying can be accelerated at 37°C.
A
B
C
Figure 1.7a : To mount a slide, (A) Apply a single drop of mounting medium upon tissue section. (B) Hold coverslip at 45o allow-ing the drop to spread along the edge of the slip. (C) Let go of slip and allow medium to spread slowly.
Histomount HS-103 Histomount is a pH neutral, UV stabilized synthetic mounting media. Refractive index is matched to glass cover slips and slides. Produces museum quality mounts. (pg.105)
Omnimount HS-110Specifically designed to be compatible with HistoClear II, Omnimount combines outstanding optical characteristics with low fluorescence and exceptional durability. (pg. 105)
Mounting Media
Hydromount HS-106 A nonfluorescing aqueous mounting medium, Hydromount is effective for frozen sections, amyloid, and immnofluorescent staining pro-cedures. (pg. 105)
Histology Applications - Advanced Histological Technique
116 USA: 1-800-526-3867EUROPE: 441 482 646022
His
tolo
gyS
peci
al T
echn
ique
s
2 Advanced Histological Techniques
2.1 IMMUNOHISTOCHEMISTRY Antibody Binding / Detection Systems
2.2 ELECTRON MICROSCOPY Fixation / Processing / Sectioning / Staining
ImmunohistochemistryandElectronMicroscopy...GettingDowntoDetails
Twentieth century advances in science significantly increased the repertoire of the histologist. The develop ment of the understanding of the processes of the immune system led to the practice of labeling specific cellular constituents (antigens) by means of antigen-antibody interactions. The resulting field of Immunohis-
tochemistry enables the identification of specific substances that cannot be characterized by conventional staining.Electron microscopy is another example of how advances in pure science have led to improvements in histological
technique. Modern physics gave us an understanding of the particle-wave duality of electrons. This understanding along with the ability to focus electron beams with magnetic lenses led to the development of electron microscopy, which represented a thousand fold improvement over the resolution achievable with conventional optics.

Histology Applications - Advanced Histological Technique
117USA: 1-800-526-3867EUROPE: 441 482 646022
Histology
Special Techniques
2.1 ImmunohistochemistryImmunohistochemistry is the application of Antibody/Antigen inter-actions to provide information about biological systems. The body’s response to the introduction of a foreign agent, known as the immune response, results in the production of antibodies which bind the offend-ing material. Antibodies bind tightly and specifically to an “epitope” (one specific structure) on an “antigen” (foreign molecule or structure). The definition of an antigen is “anything that can be bound by an antibody”. This can be an enormous range of substances from simple chemicals, sugars, and small peptides to complex protein complexes such as a virus capsid. Not all antigens directly elicit an antibody response. Some require a carrier to be effective. These generally smaller antigens are called haptens. The structure of an antibody resembles a ‘Y’. The stem of the ‘Y’ is the “constant region”, which defines the animal and class of the antibody. Antibody classes are designated by a letter, and prefixed with Ig (for immunoglobulin), thus IgG, IgM and IgE are all classes of antibodies, and all human IgG molecules have the same constant region. The arms of the ‘Y’ contain the variable regions of the antibody, where the antigen binding sites are located. Each arm has a binding site, so each antibody can bind two antigens.
Figure 2.1a Antibody structure.
Heavy chains
Light chains
Antigen binding sites
Variable region Varia
ble re
gion
Antibodies can be generated by injecting animals with antigens, and then collecting serum after the immune response has taken place. If the antibodies are labeled with an easily detectable molecule (a fluorescent dye, an enzyme, etc.), they become powerful detection reagents for the antigen. This system has been exploited to generate exceptionally specific and sensitive “stains” which are used in histology, as well as other disciplines.
Immunohistochemistry/cytology is the use of antibodies in light micros-copy and EM. The basic process depends upon selecting an antibody sufficiently specific to bind an antigen in situ. The antibody / antigen conjugate is then identified using a variety of signal generating molecules triggered either by the antibody/antigen interaction or by secondary processes. The signal generators can be precipitating dyes, fluorescent molecules or electron dense (ultrastructural tag) materials for electron microscopy (EM).
The first report of an immunohistochemistry technique was made in 1942 when Coons et al detected pneumococcal antigen using a fluorescently tagged antibody. The immunohistochemical techniques for EM were developed by Singer using ferritin (1959). This was quickly followed by the first use of an enzyme, horseradish peroxidase (still widely used) in 1966 by Graham et al. Since then, a variety of enzyme and heavy metal techniques have been developed, the most important of which are Colloidal Gold for EM (Faulk 1971), Immunoperoxidase assay (Nakane, 1966), peroxidase/anti-peroxidase PAP technique (Sternberger 1970) and the Avidin-Biotin Complex (ABC) technique (Hsu, 1981).
Immunohistochemistry is generally carried out in sectioned tissue, which allows the antibodies free access to the interior of the cells. Immuno-histochemistry can also be carried out on cells either in free solution or bound to membranes, or on monolayers of cultured cells. Intracellular Immunohistochemistry requires that the antibody to the target antigen be able to penetrate the cell membrane and whatever cell wall may be present before it can attach to the antigen. This requires a number of steps not required for sectioned tissue. Primarily the cell membrane must be made permeable to the antibody, though at the same time the integrity of the cell contents and structures must be maintained. This is normally achieved through the use of a specialized buffer containing a detergent. Saponin is frequently used for this purpose.
2.1.1 Antibody BindingThe antibody systems used in Immuno-histochemistry can be broadly divided into two types, direct and indirect. With the direct method the visualizing agent is attached directly to the antibody that will bind with the antigen. The direct method is technically and theoretically straight-forward, and yields results sufficient for many studies. Its sensitivity is limited by the fact that only one antibody, and therefore one visualization agent, is bound to each antigen.
Figure 2.1.1a With direct immunohistochemistry, the labeled antibody directly binds to the antigen.
Indirect immunohistochemistry utilizes a second antibody specific to the first (primary) antibody. This secondary antibody has the visualizing agent attached. This allows for signal amplification. Primary antibodies directly label the antigen. The secondary antibody binds to the constant region of each primary antibody, with many secondary antibodies bind-ing to each primary. This creates a cascade effect, amplifying the signal.
2.1.2 Detection systemsLight microscopy makes use of primarily two detection systems for im-munohistochemistry - fluorescence and enzyme labeling, while electron microscopy relies on the deposition of electron dense materials at the site of antibody binding. Techniques for light microscopy are discussed below. EM is covered briefly in the next section.
ImmunofluorescenceThe conjugation of a fluorescent dye to the primary or secondary antibody allows its detection under ultraviolet light. Microscopes are available which allow a slide to be UV illuminated, producing brightly emitting areas where the antibody has bound. Typically, Texas Red, Rhodamine, Fluorescine, or Phycoerythrin are conjugated to the anti-body. Texas Red and Rhodamine fluoresce in the red range, Fluorescine in the green and Phycoerythrin in the blue. This allows multiple label experiments, in which different antigens show up as different colors. While extremely sensitive, this technique suffers from the fact that the dyes fade with time. Long term storage of slides is seldom practical, as loss of signal destroys their utility.
Figure 2.1.1b The signal can be greatly amplified with indirect immunohistochemistry, in which the visualizing agent (horseradish peroxidase) is attached to polyclonal secondary antibodies with polyclonal primary antibodies binding antigen.
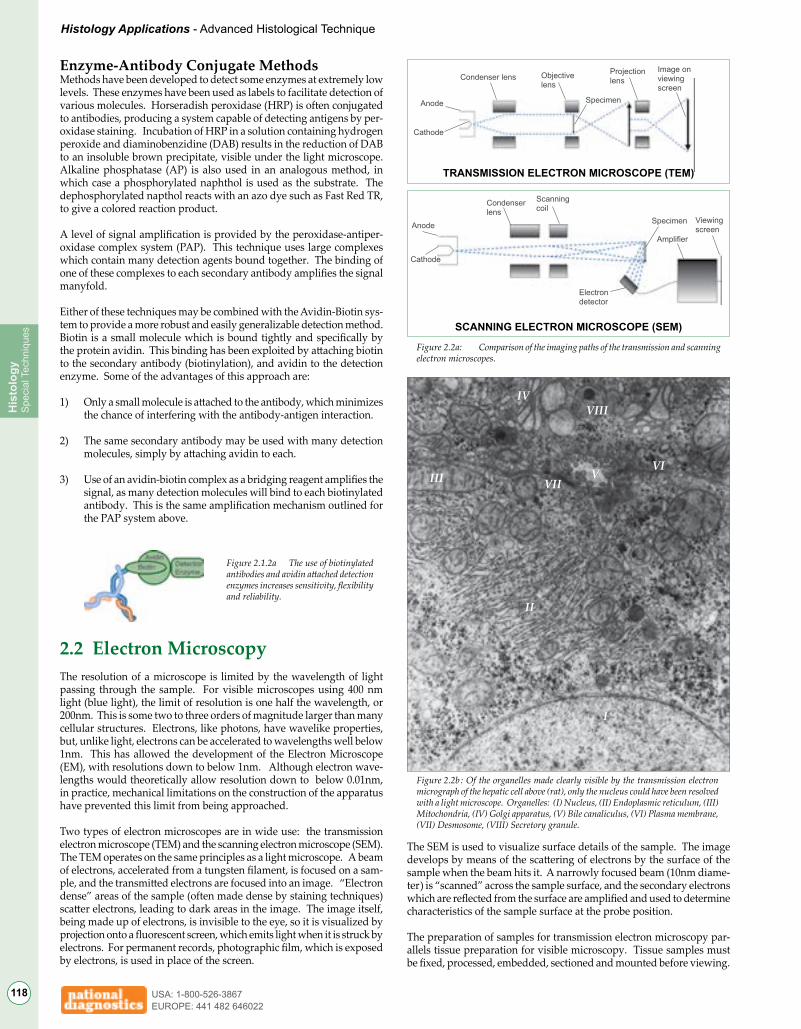
Histology Applications - Advanced Histological Technique
118 USA: 1-800-526-3867EUROPE: 441 482 646022
His
tolo
gyS
peci
al T
echn
ique
s
Enzyme-Antibody Conjugate MethodsMethods have been developed to detect some enzymes at extremely low levels. These enzymes have been used as labels to facilitate detection of various molecules. Horseradish peroxidase (HRP) is often conjugated to antibodies, producing a system capable of detecting antigens by per-oxidase staining. Incubation of HRP in a solution containing hydrogen peroxide and diaminobenzidine (DAB) results in the reduction of DAB to an insoluble brown precipitate, visible under the light microscope. Alkaline phosphatase (AP) is also used in an analogous method, in which case a phosphorylated naphthol is used as the substrate. The dephosphorylated napthol reacts with an azo dye such as Fast Red TR, to give a colored reaction product.
A level of signal amplification is provided by the peroxidase-antiper-oxidase complex system (PAP). This technique uses large complexes which contain many detection agents bound together. The binding of one of these complexes to each secondary antibody amplifies the signal manyfold.
Either of these techniques may be combined with the Avidin-Biotin sys-tem to provide a more robust and easily generalizable detection method. Biotin is a small molecule which is bound tightly and specifically by the protein avidin. This binding has been exploited by attaching biotin to the secondary antibody (biotinylation), and avidin to the detection enzyme. Some of the advantages of this approach are:
1) Only a small molecule is attached to the antibody, which minimizes the chance of interfering with the antibody-antigen interaction.
2) The same secondary antibody may be used with many detection molecules, simply by attaching avidin to each.
3) Use of an avidin-biotin complex as a bridging reagent amplifies the signal, as many detection molecules will bind to each biotinylated antibody. This is the same amplification mechanism outlined for the PAP system above.
Figure 2.1.2a The use of biotinylated antibodies and avidin attached detection enzymes increases sensitivity, flexibility and reliability.
2.2 Electron MicroscopyThe resolution of a microscope is limited by the wavelength of light passing through the sample. For visible microscopes using 400 nm light (blue light), the limit of resolution is one half the wavelength, or 200nm. This is some two to three orders of magnitude larger than many cellular structures. Electrons, like photons, have wavelike properties, but, unlike light, electrons can be accelerated to wavelengths well below 1nm. This has allowed the development of the Electron Microscope (EM), with resolutions down to below 1nm. Although electron wave-lengths would theoretically allow resolution down to below 0.01nm, in practice, mechanical limitations on the construction of the apparatus have prevented this limit from being approached.
Two types of electron microscopes are in wide use: the transmission electron microscope (TEM) and the scanning electron microscope (SEM). The TEM operates on the same principles as a light microscope. A beam of electrons, accelerated from a tungsten filament, is focused on a sam-ple, and the transmitted electrons are focused into an image. “Electron dense” areas of the sample (often made dense by staining techniques) scatter electrons, leading to dark areas in the image. The image itself, being made up of electrons, is invisible to the eye, so it is visualized by projection onto a fluorescent screen, which emits light when it is struck by electrons. For permanent records, photographic film, which is exposed by electrons, is used in place of the screen.
The SEM is used to visualize surface details of the sample. The image develops by means of the scattering of electrons by the surface of the sample when the beam hits it. A narrowly focused beam (10nm diame-ter) is “scanned” across the sample surface, and the secondary electrons which are reflected from the surface are amplified and used to determine characteristics of the sample surface at the probe position.
The preparation of samples for transmission electron microscopy par-allels tissue preparation for visible microscopy. Tissue samples must be fixed, processed, embedded, sectioned and mounted before viewing.
Anode
Cathode
Condenser lens
Scanning coil
Electrondetector
Amplifier
Viewing screen
Specimen
Specimen
Objective lens
Condenser lensProjection lens
Image on viewing screen
Anode
Cathode
TRANSMISSION ELECTRON MICROSCOPE (TEM)
SCANNING ELECTRON MICROSCOPE (SEM)
Figure 2.2a: Comparison of the imaging paths of the transmission and scanning electron microscopes.
I
II
III
IV
VVI
VII
VIII
Figure 2.2b : Of the organelles made clearly visible by the transmission electron micrograph of the hepatic cell above (rat), only the nucleus could have been resolved with a light microscope. Organelles: (I) Nucleus, (II) Endoplasmic reticulum, (III) Mitochondria, (IV) Golgi apparatus, (V) Bile canaliculus, (VI) Plasma membrane, (VII) Desmosome, (VIII) Secretory granule.

Histology Applications - Advanced Histological Technique
119USA: 1-800-526-3867EUROPE: 441 482 646022
Histology
Special Techniques
The sections produced must be thinner and stronger than those for light microscopy, and the level of detail observable mandates that the tissue structure be exceptionally well preserved. Specialized fixing and processing techniques have been refined to meet these requirements. Furthermore, staining techniques have been developed to produce electron dense zones instead of colored or fluorescent areas. (Tech-niques of sample preparation for scanning electron microscopy are not covered here. For a good overview of the process, the reader is referred to: Robinson, G & Gray T. (1990) Electron Microscopy 3: Specialized Techniques, in Bancroft, J. & Stevens A. (ed.) Theory and Practice of Histological Techniques, 3rd edn. London. Churchill.)
2.2.1 FixationThe most popular fixatives for TEM work are the aldehydes and osmi-um tetroxide. Aldehyde based fixatives react with amines and other nucleophiles in the tissue, most notably lysine and arginine, generating cross-linked proteins. The cross linking action of these fixatives stabilizes the cytosol, preserving cellular structures. Aldehydes do not react with most lipids, so membrane components may be leached during fixing and processing. Glutaraldehyde has been used extensively. It is a protein cross linker, penetrates small tissue blocks acceptably (2-3mm penetra-tion in 10 hours), and gives excellent fine structure preservation. Its main drawback is that it is a potent allergen, hazardous at levels above 0.05mg/m3 (this is a mandated limit in some EU countries). Formaldehyde has been used for some purposes, but preservation of fine structure is not as good. One major benefit of formaldehyde fixatives is that formaldehyde is not as strongly denaturing to proteins as glutaraldehyde. Formalde-hyde is therefore popular in immunohistochemistry. Mirsky’s Fixative from National Diagnostics is similar in action to glutaraldehyde, but Mirsky’s Fixative is not allergenic and poses a reduced health hazard. Mirsky’s Fixative is a good cross-linker and gives excellent fine-structure preservation. Its speed of action can be greatly increased by the use of microwave enhancement (Protocol 1.1.1a).
Osmium tetroxide fixes tissue by cross linking lipids. It reacts with unsat-urated lipids and possibly with some proteins. Most proteins, however, are not well fixed by Osmium, and will leach out of the sample during processing. Osmium tetroxide may be used as a post- or secondary- fix-ative, after an aldehyde is used. This will stabilize membrane structures and also adds electron dense material to the section, enhancing contrast.
2.2.3 Sectioning The ultrathin sections required in TEM are cut with knives of glass, diamond or sapphire. These materials produce extremely hard, ul-trasharp edges, but they are brittle and subject to damage. Glass knives are produced as needed by fracturing. Sapphire knives and diamond knives may be purchased. The high cost of diamond knives makes resharpening economically feasible. Sections are cut into a trough mounted on the back of the blade, which is filled with water or 10-20% ethanol to “float out” the sections as they are cut. The refractive index of the sections will depend on their thickness, and this gives rise to apparent colors which can be used as a guide as to which sections are of usable thickness. Gold, silver and grey sections (ca 110, 75 and <60 nm respectively) are all usable for most purposes. Ultramicrotomy is challenging, and usually must be learned from an expert.
2.2.4 StainingAlthough secondary fixation in Osmium Tetroxide provides some areas of electron density, this is usually not sufficient to provide high contrast, high definition images. A number of staining techniques are available to enhance the contrast of areas of interest. These fall into two major categories. Positive stains deposit electron dense material on the area of interest, so that it stands out as a dark area on a light background. Negative stains penetrate and darken the interstices between areas of interest, which then appear light on a dark background.
Positive StainsUranyl acetate is used as a positive stain for EM. Uranyl ions react strongly with phosphate and amino groups, staining DNA and some proteins. Organelles composed of membranes are not stained well. Note that the starting material is radioactive. Lead citrate may also be employed as a positive stain. Reynolds lead citrate stain binds lead ions to negative ions, producing a general increase in contrast. Lead is a cumulative toxin, so skin contact must be avoided.
Negative StainsNegative staining is most often used to highlight surface features on individual particles, such as virions, bacteria, or cell fragments. Table 2.2.4a lists a number of compounds used as negative stains.
Mirsky’s Fixative HS-102(Concentrate and Buffer)Excellent for immunohistochemistry with enhanced enzyme and antibody activity. (pg. 103)
Neutralin HS-108Improves safety by converting hazardous aldehyde waste into a nonhazardous polymer and water. (pg.104)
Products for Fixation for TEM
Mirsky’s Fixative HS-101(Ready-to-Use)Convenient, no-mixing formula. 30 day shelf-life. (pg. 103)
Negative Staining Agents for EM
Stain Formula Solubility(g/100ml H2O)
Ammonium Molybdate
Sodium Phosphotungstate
Sodium Tungstate
(NH4)6Mo7O24•4H2O
Na3PO4•12WO3
Na2WO4
44
90
Density(g/cc)
Silver Nitrate
Cadmium Iodide
Uranium Nitrate
Uranyl Acetate
Uranyl Formate
AgNO3
CdI2
UO2(NO3)2•H2O
UO2(C2H3O2)2•2H2O
UO2(CHO2)2•H2O
220
85
150
8
7
Anionic Stains
Cationic Stains
2.5
3.8
4.2
4.4
5.73
3.7
2.9
3.7
Table 2.2.4a
2.2.2 Processing Sections for TEM must be less than 80 nm thick in order to allow at least 50% of the electron beam to penetrate the sample. This can only be ac-complished by using resins for embedding (epoxy, acrylic or polyester) which requires a modification of the processing protocol. Graded alcohol baths (typically 20, 40, 70, 90 and 100%) are used for the dehydration, but in place of the clearing agents used in light microscopy, a “transi-tional fluid” is used. This fluid is miscible with both ethanol and the embedding resin, and is almost universally 1,2 epoxypropane (propylene oxide). If water soluble embedding resins are used, the sample may be dehydrated in graded baths of the embedding resin instead of alcohol, and a transitional fluid is not needed.
ImmunostainingAntibodies bound to colloidal gold particles are visible under the EM as dark spots. The gold particles can range from 1 to 20 nm, although 5-10 nm seems to be an optimum range. Embedded or frozen sections can be probed in this way.

Histology Applications - Useful Information
120 USA: 1-800-526-3867EUROPE: 441 482 646022
His
tolo
gyU
sefu
l Inf
orm
atio
n
Useful Information for the Histology Laboratory
Xylene Cyanole(nucleotides)
0.2M Acetate Buffer Compositions
Solution A(ml)
3.8
4.0
4.2
4.4
4.6
4.8
5.0
5.2
5.4
44.0
41.0
36.8
30.5
25.5
20.0
14.8
10.5
8.8
6.0
9.0
13.2
19.5
24.5
30.0
35.2
39.5
41.2
Solution B(ml)pH
Acetate buffer compositions: Solution A is 0.2M acetic acid (Dilute 1.2ml glacial acetic acid to 100ml with water). Solution B is 0.2M sodium acetate (dissolve 1.64g anhydrous sodium acetate in 100ml of water).
Xylene Cyanole(nucleotides)
0.2M Phosphate Buffer Compositions
Solution A(ml)
6.0
6.2
6.4
6.6
6.8
7.0
7.2
7.4
7.6
7.8
43.8
40.7
36.7
31.2
25.5
19.5
14.0
9.5
6.5
4.2
6.2
9.3
13.3
18.8
24.5
30.5
36.0
40.5
43.5
45.8
Solution B(ml)pH
Phosphate buffer compositions: Solution A is 0.2M monobasic sodium phosphate (Dissolve 3.12g NaH2PO4•2H2O in 100ml of water). Solution B is 0.2M dibasic sodium phosphate (dissolve 2.83g Na2HPO4 in 100ml of water).
Scott’sTapwaterUse when available tap water is too acidic for bluing of He-matoxylin-Eosin stainsPotassium bicarbonate 2gMagnesium sulfate 20gDissolve in 1 liter of distilled water.
NeutralbufferedformaldehydeGeneral purpose fixative. Buffering minimizes formalin pigment formation.Formalin 100mlDistilled water 900mlMonobasic sodium phosphate 4gDibasic sodium phosphate 6.5g
Formal CalciumPreserves lipids better than standard formalin fixatives.Formalin 100mlDistilled water 900ml10% aqueous calcium chloride 100ml
Xylene Cyanole(nucleotides)
0.1M Citrate Buffer Compositions
Solution A(ml)
3.8
4.0
4.2
4.4
4.6
4.8
5.0
5.2
5.4
5.6
15.0
17.0
18.5
22.0
24.5
27.0
29.5
32.0
34.0
36.3
35.0
33.0
31.5
28.0
25.5
23.0
20.5
18.0
16.0
13.7
Solution B(ml)pH
Citrate buffer compositions: Solution A is 0.1M sodium citrate (Dissolve 2.94g of sodium citrate dihydrate (mw294), in 100ml of water). Solution B is 0.1M citric acid (dissolve 2.1g citric acid•H2O in 100ml of water).
Adapted from Bancroft, J.D. and Stevens, A. (eds) (1990)Theory and Practice of Histological Techniques. Churchill Livingstone, Edinburgh.

Histology Applications - Suggested Reading
121USA: 1-800-526-3867EUROPE: 441 482 646022
Histology
Suggested Reading
Suggested Reading in Histology
General ResourcesBancroft, J.D. and Stevens, A. (eds) (1990) Theory and Practice of Histological Techniques . Churchill Livingstone, Edinburgh.Bancroft, J.D., Cook, H.C., and Turner, D.R. (eds) (1993) Manual of Histo-logical Techniques and Their Diagnostic Application. Churchill Livingstone, Edinburgh.Kok, L.P. and Boon, Mathilde E (1992) Microwave Cookbook for Microsco-pists. Coulomb Press Leyden.Prophet, E. (ed) (1992) Armed Forces Institute of Pathology: Laboratory Methods in Histotechnology. American Registry of Pathology.Mikel, Urika V. (ed) (1994) Armed Forces Institute of Pathology: Advanced Laboratory Methods in Histology and Pathology. American Registry of Pathology.Cormack, D.H. (1993) Essential Histology J. B. Lippincott, Philadelphia, PA.
Fixation Aldehyde Based Fixatives
Walker, J.F. (1964) Formaldehyde 3rd edition; Chapman-Hall .London.King, J.C., Lechan, R.M., Kugel, G. and Anthony, E.L.P. (1983) Acrolein: a fixative for immunocytochemical localization of peptides in the central nervous system. J. Histochem. Cytochem. 31 62-68.
Mercury Based FixativesLillie, R.D. and Fulmer, H.M. (1976) Histopathological technique and practical histochemistry. 4th edition. McGraw-Hill, NY.
Alcohol Fixatives Pearse, A.G.E. (1980) Histochemistry theoretical and applied. 4th edition. Churchill-Livingstone, Edinburgh.
Oxidizing Fixatives Glauert A.M. (1965) Section staining, cytology, autoradiography and immu-nochemistry of biological specimens. In Techniques for electron microscopy (Kay, D. ed.) Blackwell Scientific Publications. Oxford, McLean, I.W., and Nakane, P.K. (1974) Periodate-lysine-paraformaldehyde fixative. A new fixative for immuno-electron microscopy. J. Histochem. Cytochem. 22 1077-1083.
Picric Acid Fixatives Manns, E. (1958) The preservation and demonstration of glycogen in tissue sections. Journal of Medical Laboratory Technology 15 1-12.Murgatroyd L.B. (1969) Studies on the histochemical demonstration of glycogen. Thesis: Institute of Medical Laboratory Technology.Somogyi, P. and Takagi, H. (1982) A note on the use of picric acid-paraformal-dehyde-glutaraldehyde fixative for correlated light and electron microscopic immunocytochemistry. Neuroscience, 7 1779-1783.
DecalcificationGray, P. (1954) The microtomists formulary and guide p256-260. Constable, London, UK.Brain, E.B. (1966) The preparation of decalcified sections. p69-135. Charles C. Thomas, Springfield, Il.Wallington (1979) Artefacts in tissue sections. Medical Laboratory Sciences 36 3.
Processing of Fixed Tissue Gordon, K.C. (1990) Tissue processing, in Theory and Practice of Histological Techniques 3rd edition (Bancroft and Stevens, eds) Churchill-Livingstone, Edinburgh, UK.
Embedding and SectioningChurukian, Charles J. (ed) (1993) Manual of the Special Stains Laboratory. University of Rochester.Tyrer, N.M., (1999) Celloidin-wax sandwich microtomy: a novel and rapid method for producing serial semithin sections. J. Microscopy 196 273-278.Causton, B. (1981) Resins: toxicity, hazards and safe handling. Proc. R. Microsc. Soc. 16 265-271.Tokuyasu, K.T. (1986) Application of cryoultramicrotomy to immunocyto-chemistry. J. Microscopy 143 139-149.
Artifacts in Histologic Sections Wallington (1979) Artefacts in tissue sections. Medical Laboratory Sciences 36 3.Herschberber, L.R. and Lillie, R.D. (1947) Physical properties of acid formalin hematin, or formalin pigment. Journal of Technical Methods and Bulletins of the International Association of Medical Museums. 27 162.
StainingLillie, R.D. (1977) Conn’s Biological stains 9th edition. Williams and Wilkins, BaltimoreHorobin, R.W. (1988) Understanding histochemistry: selection, evaluation and design of biological stains. Horwood, Chichester.
Hematoxylin and Eosin Stain: Ehrlich, P. (1886) Fragekasten, Zeitschrift fur wissenschaftliche mikroskopie und fur mikroskopische technik. 3 150.Harris, H.F. (1900) On the rapid conversion of haematoxylin into hae-matin in staining reactions. Journal of Applied Microscopic Laboratory Methods 3 777.
Immunohistochemistry Cuello, A.C. (ed) (1993) Immunohistochemistry II. J. Wiley & Sons.Beesley, J. (ed) (1993) Immunocytochemistry: A Practical Approach. Oxford University press.Skepper, J.N. (2000) Immunocytochemical strategies for electron micros-copy: choice or compromise. J. Microscopy 199 1-36.Gatter, K.C., Falini, B. and Mason, D.Y. (1984) The use of monoclonal antibodies in histopathological diagnosis. In Recent Advances in Histopa-thology Antony, P.P and MacSween, R.N.M. eds, Churchill-Livingstone, Edinburgh, UK.Warnke, R.A., Gattes, K.C. and Mason, D.Y. (1983) Monoclonal antibodies as diagnostic reagents. Recent advances in clinical immunology 3 163.Sternberger, L.A. (1979) Immunocytochemistry 2nd edition, Wiley, NY.Singer, S.J. (1959) Preparation of an electron dense antibody conjugate. Nature London 183 1523.
Enzyme-Antibody Conjugate Methods Graham, R.C. and Karnovsky, M.J. (1966) The early stages of absorption of injected horseradish peroxidase in the proximal tubules of mouse kidney. Ultrastructural cytochemistry by a new technique. Journal of Histochemistry 14 291.Sternberger, L.A., Hardy, P.H. Jr, Culculis, J.J. and Meyer, H.G. (1970) The unlabeled enzyme method of immunohistochemistry preparation of antigen-antibody complex (peroxidase-anti-peroxidase) in identification of spirochaetes. Journal of Histochemistry and Cytochemistry 18 315.Nakane, P.K. and Pierce, G.B., (1966) Enzyme labeled antibodies: preparation and application for the localization of antigens. Journal of Histochemistry and Cytochemistry 14 929.Faulk, W.P. and Taylor, G.M. (1971) Immunocytochemistry 8 1081.Coons, A.H. et al (1942) The demonstration of pneumococcal antigen in tissues by the use of fluorescent antibody. J. Immunol. 45 159.Hsu, S.M., Raine, L. and Fanger, H. (1981) Use of avidin-biotin-peroxidase complex (ABC) in immunoperoxidase techniques: a comparison between ABC and unlabeled antibody (PAP) procedures. Journal of Histochemistry and Cytochemistry 29 577-580.
Electron Microscopy Meek, G.A. (1970) Practical Electron Microscopy for Biologists Wiley-In-terscience, NY.Weaklye, B.S. (1974) A Beginners Handbook in Biological Electron Micros-copy Churchill-Livingstone, Edinburgh, UK.Bullock, G.R. (1983) The current status of fixation for electron microscopy: a review. Journal of Microscopy, 133 1-15.Hayat, M.A. (1970) Principles and Techniques of Electron Microscopy: Biological Applications. 1 Van Nostrand-Reinhold, NY.Immunostaining Singer, S.J. (1959) Preparation of an electron dense antibody conjugate. Nature London 183 1523.

Reactive Oxygen - Oxygen Radical Assays
122 USA: 1-800-526-3867EUROPE: 441 482 646022
Oxy
gen
Ass
ayS
uper
oxid
e
Oxygen Radical Chemical Assays
National Diagnostics’ Diogenes Cellular Luminescence Enhancement System is a superoxide chemiluminescent enhancer that is non-denaturing to living cells. Superoxide radical (O2¯) is produced intracellularly as a consequence of aerobic metabolism and extracellularly by leukocytes in response to infection. The extent of “oxidative burst” produced by white blood cells (WBCs) when stimulated by f-met-leu-phe, phorbol esters, anti-Fc receptor antibodies or LPS is a partial indicator of the immunocompetence of the cells tested. Currently, the production of O2¯ by leukocytes is monitored by such cumbersome and indirect methods as measuring oxygen uptake in a Clark electrode (both in the presence and absence of cyanide) or measuring spectral changes caused by the reduction of cytochrome c. As a non-cytotoxic intermediate in the mechanism of photon production, Diogenes is ideally suited to the detection of cell-me-diated superoxide production. The intensity of light produced by Diogenes in the presence of superoxide is directly proportional to the O2¯ concentration, but is much higher than that achieved by using luminol. Therefore, Diogenes is ideal for monitoring cellular immunocompetence, utilizing a luminometer to quantify the light output. Any stimulant that activates an oxidase to produce extracellular superoxide is usable with Diogenes. Such means can be physi-ological or mimetic of the physiologic pathway.
Storage: The prepared Diogenes Complete Enhancer Solution can be stored at 4-8OC for up to 30 days. The shelf-life of the non-reconstituted reagents in the original packaging is one (1) year.
Cellular Luminescence Enhancement System for Superoxide DetectionEasy to Use - Specific for SuperoxideFrom 100-Fold to 600-Fold EnhancementRequires Fewer Cells - Non Cytotoxic
Diogenes
APPLICATIONExcellent for:Luminometric detection of superoxide. Superoxide dismutase assay using an intrinsic superoxide generator. NADPH oxidase assays. Neutrophil activation assays.
Diogenes Kit CL-202 1 Kit
Product Name Cat. No. Size
l
l
l
l
TM

Reactive Oxygen - Oxygen Radical Assays
123USA: 1-800-526-3867EUROPE: 441 482 646022
Oxygen A
ssayH
ydrogen Peroxide
Hydrogen peroxide is a part of the oxygen reduction pathway, produced by the two-electron reduction of molecular oxygen, or by the one electron reduction of superoxide anion radical. Hydrogen peroxide is a potent oxidant, and the levels of hydrogen peroxide must be accurately determined in order to fully characterize the oxidative state of the system under study.
National Diagnostics Hydrogen Peroxide Assay Kit is a rapid, sensitive and quantitative method for the determination of hydrogen peroxide in chemical or biological systems. The assay is based upon formation of a complex between Xylenol Orange and ferric iron, which is produced by the peroxide dependent oxidation of ferrous iron. This reaction is quantified colorimetrically, detecting as little as 15ng/ml of peroxide.
National Diagnostics Hydrogen Peroxide Assay is the ideal complement to our well established Diogenes Superoxide detection system. Using these kits in tandem, researchers can now quantitatively determine the first two steps in the oxygen reduction pathway.
Hydrogen Peroxide Assay Kit CL-204 1 Kit - 100 Assays
Product Name Cat. No. Size
Protocol:
1. Reagent Preparation:
Prepare 1.8 ml of reagent per sample to run tests in duplicate.
To prepare 20ml: Combine 19.8ml of Component A with 0.2ml Component B.
The mixture is stable at room temperature for one day.
2. Assay procedure:
Mix 0.9 ml of Assay Reagent with up to 0.1 ml of sample.
Incubate at room temperature for at least 30 minutes to allow for complete color development.
Read absorbance at 560nm.
Sensitive, Quantitative Assay for Hydrogen PeroxideDetects as Little as 15ng/mlEasy-to-use Colorimetric System
Hydrogen Peroxide Assay Kit
l
l
l
APPLICATIONExcellent for:Sensitive, quantitative detection of hydrogen peroxide.

Reactive Oxygen Assays - Reactive Oxygen Assays
124 USA: 1-800-526-3867EUROPE: 441 482 646022
Oxy
gen
Ass
ayFu
ndam
enta
ls
O2 e_
e_
O2_
+
e_
+2 H2O2
O2_ 2 H
+
H2O2+
.
.
OH_
OH.
+
Superoxide
HydrogenPeroxide
H2O2
O2_
Fe III+ O2 Fe II+
+ OH_
+ OH.
+Fe II2)
1)
Fe II
OH.
+X H2O+X.
Reactive Oxygen SpeciesOxygen is used by a great variety of organisms as a means for producing energy. The redox potential of the oxygen: water couple is 1.229 Volts, meaning that a relatively large amount of energy is released during the 4 electron reduction which converts O2 to H2O. The incorporation of this reaction into cellular metabolism was an enabling step on the evolutionary path to higher organisms. However, harnessing this new resource came at a cost: the intermediates produced during the reduction of molecular oxygen are all highly reactive, and pose risks to the cells that use this pathway. The intermediates of oxygen reduction are shown below:
The first reduction product of oxygen is the superoxide radical ( O2- ).
Carrying an unpaired electron, superoxide is a potent oxidizing agent. It has been found to react with numerous cellular structures, such as iron-sulfur clusters, unsaturated lipids, and nucleic acids. Superoxide can also cause biological damage by acting as a reductant, as in the Fenton reaction described below.
Reduction of superoxide yields hydrogen peroxide, H2O2 . Hydrogen peroxide is also a powerful oxidant, and is commonly used in first aid as a biocide to cleanse wounds, or in high concentrations as a bleaching agent. While superoxide carries a charge, and is thus unable to freely cross biological membranes, H2O2 is uncharged, and can diffuse across membranes as easily as water. Hydrogen peroxide is also more stable than superoxide, and can diffuse through a cell or tissue, causing damage at a distance from its point of origin.
In the presence of catalytic amounts of iron, superoxide and hydrogen peroxide can react to produce hydroxyl radical (OH. ).
Hydroxyl radical is one of the most potent oxidizing agents known. It is too reactive to diffuse far in a cellular environment rich in targets for oxidation. It is thought to cause damage in the vicinity of iron centers or other sites containing bound iron. Oxidation by hydroxyl radical results in the concommitant reduction of the radical to water:
Where X is the molecule oxidized by hydroxyl radical.
Superoxide
Superoxide has been implicated in diseases ranging from alzheimers to diabetes. The wide range of pathologies associated with superoxide is the result of its ability to react with a variety of cellular targets, including enzyme active sites, nucleic acids and lipids. Cells protect themselves against superoxide damage by producing superoxide dismutase en-zymes (SODs). These enzymes accept an electron from a superoxide molecule, reducing the active metal (copper/Zinc, iron or manganese) at the core of the enzyme, and releasing oxygen. The reduced enzyme then reacts with a second superoxide, reducing it to produce hydrogen peroxide, and regenerating the enzyme. The high reactivity of superox-ide in aqueous solutions almost precludes its being added to a biological test system in a controlled manner. As a result, much of what is known of the involvement of superoxide in disease states comes from studies in which SOD has been inactivated, leaving the cells vulnerable to endogenous superoxide damage.
Detection of Superoxide A number of methods have been developed to detect superoxide. They all employ what has been termed an “indicating scavenger;” that is, a molecule which reacts with superoxide, producing a detectable prod-uct. The most commonly used indicating scavengers are cytochrome c, lucigenin and luminol, each of which has its own advantages and pitfalls. Cytochrome c is reduced by reaction with superoxide, pro-ducing ferrocytochrome c, which has a detectable absorbance at 550 nm. This assay is relatively insensitive, and is subject to a number of interferences from other chemicals and from enzymes which reduce the cytochrome directly.
Lucigenin is a di-acridinium compound, which emits light on reaction with superoxide. The reaction involves an initial reduction of the lucigenin to a radical. The lucigenin radical can then react with either oxygen—producing superoxide—or with superoxide in an addition reac-tion—leading to the decomposition of the lucigenin into two acridones, one of which is in an excited state, and decays to produce light. As with most chemiluminescent reactions, lucigenin is more sensitive than colo-rimetric methods such as cytochrome c reduction. The lucigenin assay has been criticized as a measure of superoxide because lucigenin itself can react to produce superoxide, and because in some cases lucigenin has been observed to stimulate superoxide production by intact cells.
Luminol—unlike cytochrome c and lucigenin—is oxidized by super-oxide. This leads into a complex series of reactions between luminol, luminol radicals, oxygen and superoxide, ultimately producing a luminol endoperoxide, which decomposes with the release of a photon. Again, because superoxide is involved as both initiator and intermediate in the reaction, objections have been raised to the use of luminol as a quantitative measure of superoxide production.
No matter which assay is used it is important to include the proper controls in the experimental design in order to be certain that any signal detected is due to superoxide. The primary control experiment is to run the reaction in the presence of superoxide dismutase (SOD). If the signal is not abolished by SOD, it does not represent superoxide production. However, the converse is not always true: a signal which is quenched by SOD does not absolutely indicate that superoxide is being produced by the test system. Both luminol and lucigenin can generate superoxide as they react to produce light, and both chemicals can undergo a redox cycle, induced by cellular agents, which produce light by way of a su-peroxide intermediate. Thus, in special cases, SOD will inhibit a signal which did not originate with a superoxide molecule, and results must be interpreted with caution.

Reactive Oxygen Assays - Reactive Oxygen Assays
125USA: 1-800-526-3867EUROPE: 441 482 646022
Oxygen A
ssayFundam
entals
Hydrogen Peroxide
Hydrogen peroxide—like superoxide—can react with a variety of targets in the cell, and has been associated with a number of diseases. Aerobic organisms express catalase and peroxidase enzymes to pre-vent damage by H2O2. Peroxidases—most of which contain a heme at their active site—undergo an enzymatic cycle in which a molecule of peroxide oxidizes the enzyme, releasing one of the peroxide oxygen atoms as water, and leaving the other complexed to the enzyme-bound iron. This configuration is known as Compound I. The second part of the cycle involves a transfer of electrons from a reducing substrate to the enzyme, releasing the bound oxygen as water, and regenerating the starting configuration of the active site. The net reaction is:
where AH is the reducing substrate. Catalase is a specific sub-form of peroxidase, in which the reducing substrate is a second molecule of hydrogen peroxide. In this case the reaction is:
Perhaps the prototypical example of a peroxidase is horseradish perox-idase (HRP), which is frequently used as a label in immunochemistry. Coupled to an antibody, HRP can be sensitively detected by its catalytic oxidation of luminol in the presence of hydrogen peroxide. The oxidized luminol is metastable, rearranging to give off a photon of light. Detection of Hydrogen Peroxide In at least one important way, measuring hydrogen peroxide is sub-stantially easier than measuring superoxide. Superoxide is unstable in aqueous solution- its steady state concentration cannot be measured directly. As a result, superoxide “levels” must be determined indirectly, by measuring rates of production and removal, and then correlating the two, or by measuring damage to a superoxide target. Hydrogen peroxide, in contrast, is relatively stable, allowing direct measurement of it’s concentration in many cases. The classical methods for measuring hydrogen peroxide concentrations are through direct measurement of the absorbance at 330nm of the H2O2 molecule, or through reaction of the peroxide with ferrous iron, monitored via a subsequent reaction with the dye xylenol orange. A variety of other methods are also available.
While H2O2 does not have an absorbance peak at 330nm, the absorbance at this wavelength correlates well enough with the concentration of H2O2 to allow its use as a quantitative assay, using an extinction coefficient of 43.6/Mcm (JBC 245 (9) (1970) pp2409-13). Of course, given the low extinction coefficient, this is not a very sensitive assay. In addition, while 330nm is a long enough wavelength to minimize interferences from DNA and aromatic amino acid residues, many cellular components will show a significant absorbance at this wavelength. However, for measuring high concentrations of H2O2 , and for calibrating standard solutions, this measurement can be very useful. A higher sensitivity, more selective assay is mediated by the oxidation of ferric iron to its ferrous state. The ferrous iron so produced will form a complex with the dye xylenol orange, resulting in a net increase in absorbance of the solution at 560nm. This assay is much more sensitive, being capable of detecting as little as 15ng H2O2 per ml. It is, however, subject to interferences from compounds which can oxidize ferric iron, and so requires the use of the appropriate controls as described below.
A number of other assays have been developed to measure hydrogen peroxide levels. Many of these are based on the horseradish peroxidase mediated reaction between H2O2 and some indicating reactant. For ex-ample, in the presence of H2O2 , HRP will oxidize luminol, producing light. Under the proper conditions, the light output of this system can be made to be proportional to the concentration of peroxide present. This assay can be extremely sensitive, but it is also subject to many interfer-ences, as HRP can react with a variety of different cellular substrates. Regardless of the assay used, two possible sources of error must be controlled for. The first is interference from compounds other than H2O2 which are redox active and can create a signal within the assay. such interferences can be detected by running the assay after treating the sample with catalase, which will specifically remove the H2O2 . Any signal which is lost to such treatment can be confidently assigned to H2O2 . The second source of error often encountered is the scavenging of per-oxide by components of the sample either before or during the assay. Cells contain elaborate defenses against peroxide damage, and such systems often continue to work during sample preparation procedures. It is therefore important to prepare samples under conditions which minimize peroxide degradation, ie short post preparation storage time, prep and storage at or below 4OC. It is also possible to “spike” a sample with a known amount of peroxide during work-up. Comparing the amount of peroxide detected in spiked vs. unspiked samples will give an indication of the extent of peroxide degradation between sampling and assay.
2 A+
2 H2OH2O2 +2 AH+
O22 H2O2 H2O2 +
Diogenes CL-202Cellular luminescence enhancement system for superoxide detection. Easy to use. Specific for superoxide. (pg.122)
Products for Assay of Reactive Oxygen
Hydrogen Peroxide Assay Kit CL-204Sensitive, quantitative assay for hydrogen peroxide. Easy-to-use, colorimetric system. (pg.123)
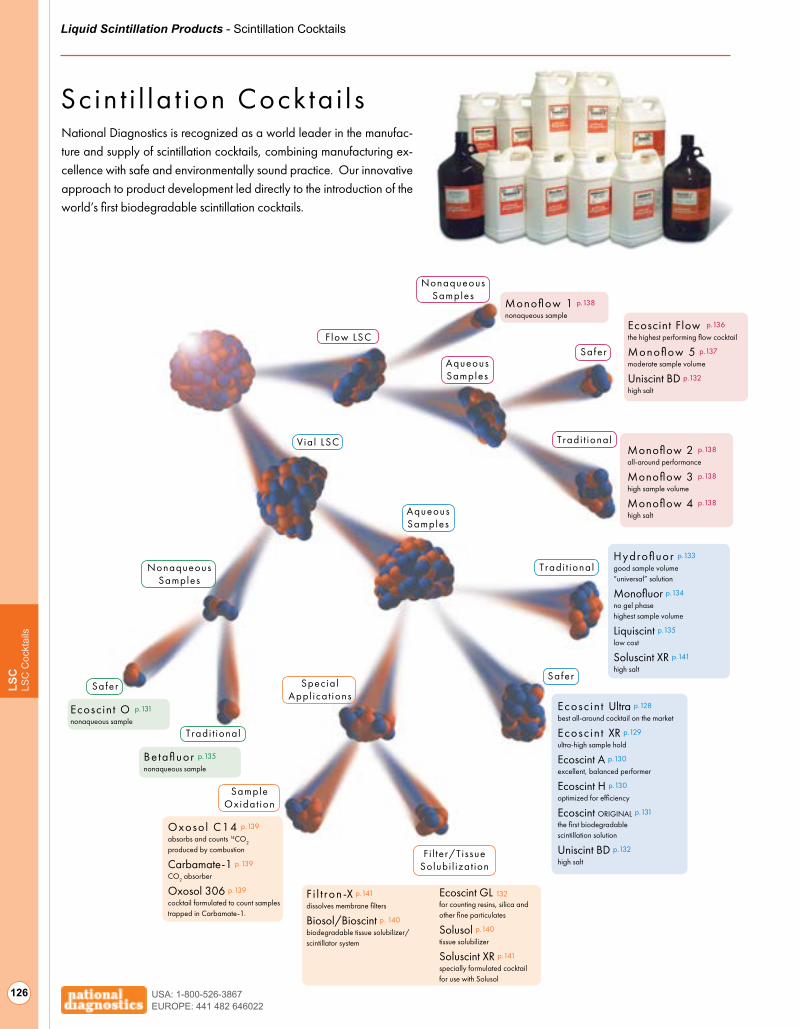
Liquid Scintillation Products - Scintillation Cocktails
USA: 1-800-526-3867EUROPE: 441 482 646022
126
LSC
LSC
Coc
ktai
ls
National Diagnostics is recognized as a world leader in the manufac-ture and supply of scintillation cocktails, combining manufacturing ex-cellence with safe and environmentally sound practice. Our innovative approach to product development led directly to the introduction of the world’s first biodegradable scintillation cocktails.
Sc in t i l la t ion Cock ta i l s
Vial LSC
Safer
NonaqueousSamples
AqueousSamples
Tradi t ional
NonaqueousSamples
Tradi t ional
AqueousSamples
Tradi t ional
SaferSpecia l
Appl ica t ions
SampleOxidat ion
Fi l ter/TissueSolubi l izat ion
Monoflow 1 p.138
nonaqueous sample
Monoflow 2 p.138
all-around performance
Monoflow 3 p.138
high sample volume
Monoflow 4 p.138
high salt
Ecoscint Flow p.136
the highest performing flow cocktail
Monoflow 5 p.137
moderate sample volume
Uniscint BD p.132
high salt
Hydrofluor p.133
good sample volume“universal” solution
Monofluor p.134
no gel phasehighest sample volume
Liquiscint p.135
low cost
Soluscint XR p.141
high salt
Ecosc in t Ultra p.128
best all-around cocktail on the market
Ecosc in t XR p.129
ultra-high sample hold
Ecoscint A p.130
excellent, balanced performer
Ecoscint H p.130
optimized for efficiency
Ecoscint ORIGINAL p.131
the first biodegradablescintillation solution
Uniscint BD p.132
high salt
F i l t ron-X p.141
dissolves membrane filters
Biosol/Bioscint p. 140
biodegradable tissue solubilizer/scintillator system
Oxosol C14 p.139
absorbs and counts 14CO2 produced by combustion
Carbamate-1 p.139
CO2 absorber
Oxosol 306 p.139
cocktail formulated to count samples trapped in Carbamate-1.
Be tafluor p.135
nonaqueous sample
Ecoscint O p.131
nonaqueous sample
Safer
Ecoscint GL 132for counting resins, silica and other fine particulates
Solusol p.140
tissue solubilizer
Soluscint XR p.141
specially formulated cocktailfor use with Solusol
F low LSC
Acidic samplesAgarose gels
Alkaline samplesAlpha counting
Alpha/beta discriminationAmmonium formate
Ammonium phosphateAqueous samples - high vol.
Aqueous samples - low/med. vol.Biological samples
BloodBrain
Carbon dioxideCatecholamine assays
Cellulose acetate membranesCellulose nitrate membranes
Cesium chloride gradientsDensity gradients
Environmental samplesFilter paper
Flow counting - high efficiencyFlow counting - high salt
Flow counting - high sample holdGaseous samples
Gelling scintillation countingGlass fiber filters
High sensitivity countingHPLC gradients
Inositol phosphatesMilk
Organic samples - hydrophobicOxidation counting
PlasmaPolar (hydrophilic) solvents
Polyacrylamide gels Powders - suspended
Radon RIA - supernatants
Salt solutions - highSalt solutions - medium, low
SerumSodium hydroxide gradients
Solids Solubilization
SucroseTissue homogenatesTissue solubilization
UrineWater

Liquid Scintillation Products - Scintillation Cocktails
USA: 1-800-526-3867EUROPE: 441 482 646022
127
LSCLS
C C
ocktails
Samples and Applications
Choos ing a Sc in t i l la t ion F lu id for Your Sample or Appl ica t ion
Monofluor (
pg.134)
L iqu isc
int (p
g.135)
Monoflow 1
(pg.13
8)
Monoflow 2
(pg.13
8)
Monoflow 3
(pg.13
8)
Monoflow 4
(pg.13
8)
Monoflow 5
(pg.13
7)
F i l tro
n-X (pg.14
1)
B ioso
l/Bio
scin
t (pg.14
0)
Soluso
l (pg.14
0)
Solusc
int X
R (pg.14
1)
Oxoso
l C14 (p
g.139)
Carbamate
(pg.13
9)
Betafluor (
pg.135)
Ecoscin
t A (p
g.130)
Ecoscin
t H (p
g.130)
Ecoscin
t O (p
g.131)
Ecoscin
t ORIG
INAL (
pg.131)
Uniscin
t BD (p
g.132)
Hydrofluor (
pg.133)
Ecoscin
t XR (p
g.129)
Ecoscin
t Flo
w (pg.13
6)
Sc in t i l la t ion F lu ids(green = biodegradable)
Ecoscin
t Ultra
(pg.12
8)
Ecosci
nt GL (
pg.132)
Acidic samplesAgarose gels
Alkaline samplesAlpha counting
Alpha/beta discriminationAmmonium formate
Ammonium phosphateAqueous samples - high vol.
Aqueous samples - low/med. vol.Biological samples
BloodBrain
Carbon dioxideCatecholamine assays
Cellulose acetate membranesCellulose nitrate membranes
Cesium chloride gradientsDensity gradients
Environmental samplesFilter paper
Flow counting - high efficiencyFlow counting - high salt
Flow counting - high sample holdGaseous samples
Gelling scintillation countingGlass fiber filters
High sensitivity countingHPLC gradients
Inositol phosphatesMilk
Organic samples - hydrophobicOxidation counting
PlasmaPolar (hydrophilic) solvents
Polyacrylamide gels Powders - suspended
Radon RIA - supernatants
Salt solutions - highSalt solutions - medium, low
SerumSodium hydroxide gradients
Solids Solubilization
SucroseTissue homogenatesTissue solubilization
UrineWater
best performance good performance

Liquid Scintillation Products - Biodegradable Scintillation Cocktails for Vial Counting
USA: 1-800-526-3867EUROPE: 441 482 646022
128
LSC
Saf
er C
ockt
ails
Recognizing the need for enhanced safety and environmental friend-liness in the laboratory, National Diagnostics was the first company to introduce biodegradable solvents for scintillation counting. The products in this section are formulated with low toxicity, nonflammable solvents. National Diagnostics biodegradable scintillation cocktails are optimized for the highest possible quality and performance while minimizing risk to the operator and the environment.
Biodegradable ScintillationCocktails
When National Diagnostics laboratories set out to create Ecoscint Ultra, our aim was to create the best cocktail available for environmental sample counting and urine bioassay. We are proud to announce that not only have we succeeded in this goal, but we have surpassed it, creating the best all-around performing cocktail on the market for both large and small aqueous samples.
Ecoscint Ultra enables ultra-low level counts to be discriminated from back-ground not only for large but also for small samples. With large samples, Ecoscint Ultra delivers up to 30% 3H counting efficiency at maximum sample hold with very low background levels. With small samples, Ecoscint Ultra yields 3H efficiency greater than 60%.
Ten millilters of Ecoscint Ultra holds 12ml H2O in a clear emulsion at 18oC, while 10ml of Ecoscint Ultra holds 10ml 0.5M NaCl at that temperature.
Ecoscint Ultra
Excellent for:High or low volume aqueous samples, environmental samples, biological samples, acidic samples, alkaline samples, polar solvents, medium/low salt solutions, urine.
Counting discrete samples ...................................................... p.156
A P P L I C A T I O N S
For Environmental Sample CountingUltra-High Water Capacity (1:1.2 Cocktail to Sample) Ultra-Low Background Unsurpassed Counting EfficiencyIdeal for Low Temperature Environmental Counting
l
l
l
l
l
Ecoscint Ultra LS-270 4 liter (1-3) 4 liter (4 +)
Product Name Cat. No. Size
TM
Distilled Water
0.5M NaCl
0.1M NaCl
0.1M NaH2PO4
0.1M Tris
1X PBS
0 2.0 4.0 6.0 8.0 10
Sample Hold Capacity (ml) in 10ml Ecoscint Ultra*
* Ecoscint Ultra was designed both for low temperature (15OC), ultra-low background counting and room temperature counting. The data above reflects the intermediate temperature of 20OC. For salt or buffer solutions at 25OC, we recommend verifying emulsion clarity before exceeding 6ml sample in 10ml cocktail.
12 mL8 mL 10 mL 10 mL 10 mL 10 mL
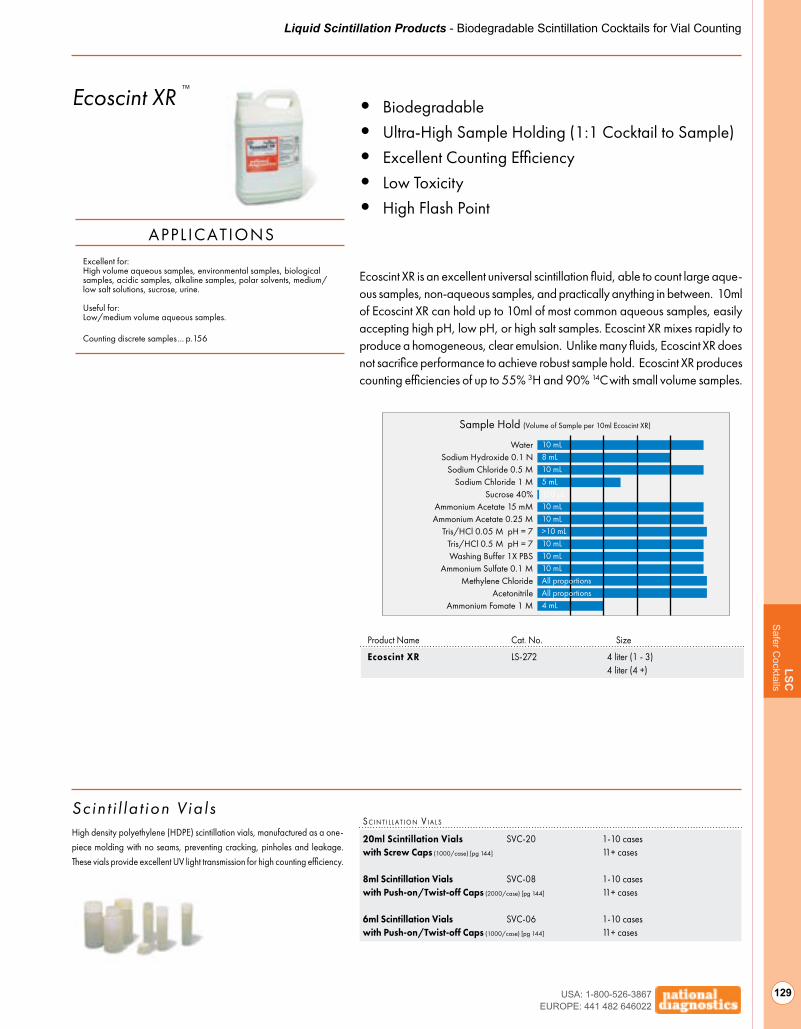
Liquid Scintillation Products - Biodegradable Scintillation Cocktails for Vial Counting
USA: 1-800-526-3867EUROPE: 441 482 646022
129
LSCS
afer Cocktails
20ml Scintillation Vials SVC-20 1-10 cases with Screw Caps (1000/case) [pg 144] 11+ cases
8ml Scintillation Vials SVC-08 1-10 cases with Push-on/Twist-off Caps (2000/case) [pg 144] 11+ cases
6ml Scintillation Vials SVC-06 1-10 cases with Push-on/Twist-off Caps (1000/case) [pg 144] 11+ cases
s c I n T I l l a T I o n V I a l s
High density polyethylene (HDPE) scintillation vials, manufactured as a one-piece molding with no seams, preventing cracking, pinholes and leakage. These vials provide excellent UV light transmission for high counting efficiency.
Scin t i l la t ion V ia ls
Ecoscint XR is an excellent universal scintillation fluid, able to count large aque-ous samples, non-aqueous samples, and practically anything in between. 10ml of Ecoscint XR can hold up to 10ml of most common aqueous samples, easily accepting high pH, low pH, or high salt samples. Ecoscint XR mixes rapidly to produce a homogeneous, clear emulsion. Unlike many fluids, Ecoscint XR does not sacrifice performance to achieve robust sample hold. Ecoscint XR produces counting efficiencies of up to 55% 3H and 90% 14C with small volume samples.
Ecoscint XR
Excellent for:High volume aqueous samples, environmental samples, biological samples, acidic samples, alkaline samples, polar solvents, medium/low salt solutions, sucrose, urine.
Useful for:Low/medium volume aqueous samples.
Counting discrete samples ... p.156
APPL ICATIONS
Biodegradable Ultra-High Sample Holding (1:1 Cocktail to Sample) Excellent Counting Efficiency Low Toxicity High Flash Point
l
l
l
l
l
Ecoscint XR LS-272 4 liter (1 - 3) 4 liter (4 +)
Product Name Cat. No. Size
TM
WaterSodium Hydroxide 0.1 N
Sodium Chloride 0.5 MSodium Chloride 1 M
Sucrose 40%Ammonium Acetate 15 mMAmmonium Acetate 0.25 M
Tris/HCl 0.05 M pH = 7Tris/HCl 0.5 M pH = 7Washing Buffer 1X PBS
Ammonium Sulfate 0.1 MMethylene Chloride
Acetonitrile Ammonium Fomate 1 M
10 mL8 mL 10 mL5 mL 150 µL 10 mL10 mL >10 mL10 mL10 mL 10 mLAll proportionsAll proportions4 mL
Sample Hold (Volume of Sample per 10ml Ecoscint XR)

Liquid Scintillation Products - Biodegradable Scintillation Cocktails for Vial Counting
USA: 1-800-526-3867EUROPE: 441 482 646022
130
LSC
Saf
er C
ockt
ails
Ecoscint H is specifically designed to provide the maximum counting efficiency for aqueous sample volumes under 10% of the total liquid scintillation volume. Furthermore, Ecoscint H has exceptional resistance to photoluminescence and chemiluminescence, which is especially important when counting biological samples or acrylamide gel slices.
Ecoscint H
Excellent for:High sensitivity counting, low volume aqueous samples, filter paper, glass fiber filters.
Useful for:Acidic samples, biological samples, environmental samples, inositol phosphates, plasma, polyacrylamide gels, salt solutions, serum, sucrose, urine, RIA supernatants.
Counting discrete samples ...................................................... p.156
APPL ICATIONS
Ultra High Efficiency Biodegradable Scintillation Fluidl
Distilled Water
0.15M NaCl
0.01M PBS
0.05M Tris-HCl
0.01N NaOH
10% Sucrose
BSA (1mg/ml)
0.1M HCl
Sample Volume (ml)
% Counting Efficiency (3H) of Typical Samplesat Various Volumes (in 10ml Ecoscint H)
Figure 1 - Sample Holding Capacities of Ecoscint A (10ml)
Distilled Water
0.15M NaCl
0.01M PBS
0.05M Tris-HCl
0.01N NaOH
10% Sucrose
BSA (1mg/ml)
Urine
8M Urea
0.1M HCl
0 1.0 2.0 3.0 4.0 4.5Sample Volume (ml)
0 1.0 2.0 3.0 4.0 4.5
Ecoscint A displays exceptional sample holding capability while still delivering high efficiency. Ecoscint A will easily accommodate up to 40% sample while maintaining a single liquid phase. Furthermore, Ecoscint A has exceptional resistance to photoluminescence and chemiluminescence. Ecoscint A is read-ily biodegradable, with a mean DOC elimination of >70% at 10 days. The low odor and low toxicity of Ecoscint A make it perfect for bench-top work. It is not necessary to use or store Ecoscint A under a fume hood.
Ecoscint A
Excellent for:Agarose gels, aqueous samples, biological samples, environmental samples, glass fiber or paper filters, plasma, polyacrylamide gels, salt solutions, sucrose, solublized tissues.
Useful for:Acidic samples, alkaline samples, catecholamine assays, high salt solutions, tissue homogenates.
Counting discrete samples ...................................................... p.156
APPL ICATIONS
High Efficiency with High Sample HoldingBiodegradable, Reduced Toxicity Solvent
l
l
SampleDistilled Water0.15M NaCl0.01M PBS0.05M Tris-HCl0.01N NaOH10% SucroseBSA (1mg/ml)Urine8M Urea0.1M HCl
0
56.2
56.2
56.2
56.2
56.2
56.2
56.2
56.2
56.2
56.2
0.5
51.8
51.4
51.6
52.0
53.0
53.6
51.5
50.9
51.8
50.2
% Counting Efficiency (3H) of Typical Samplesat Various Volumes (in 10ml Ecoscint A)
1.5
47.6
47.7
47.7
48.6
49.3
45.7
46.7
39.7
45.2
2.0
45.8
46.8
45.0
45.1
47.3
43.2
45.1
37.1
44.2
2.5
42.8
42.5
43.6
43.4
46.3
42.1
44.4
43.3
3.0
42.5
42.1
42.0
42.7
41.8
40.7
42.6
39.0
3.5
39.5
40.3
40.5
40.8
40.6
40.7
38.7
4.0
37.8
39.5
38.1
39.8
39.2
39.5
36.7
4.5
35.6
37.7
34.9
36.9
35.3
Sample Volume1.0
50.4
49.9
49.6
50.3
52.6
50.3
48.9
43.6
48.5
47.6
Ecoscint A LS-273 4 liter (1-3) 4 liter (4+) 20 Liter
Product Name Cat. No. Size
Ecoscint H LS-275 4 liter (1-3) 4 liter (4+) 20 Liter
Product Name Cat. No. Size
TM
TM
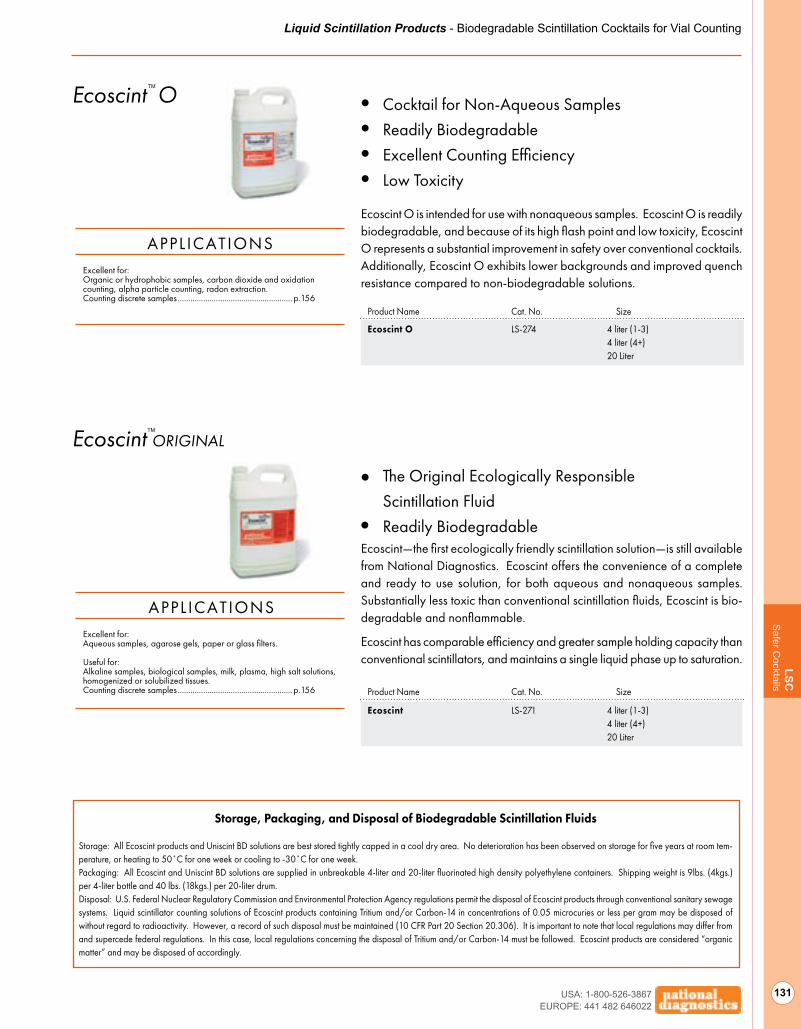
Liquid Scintillation Products - Biodegradable Scintillation Cocktails for Vial Counting
USA: 1-800-526-3867EUROPE: 441 482 646022
131
LSCS
afer Cocktails
Ecoscint—the first ecologically friendly scintillation solution—is still available from National Diagnostics. Ecoscint offers the convenience of a complete and ready to use solution, for both aqueous and nonaqueous samples. Substantially less toxic than conventional scintillation fluids, Ecoscint is bio-degradable and nonflammable.
Ecoscint has comparable efficiency and greater sample holding capacity than conventional scintillators, and maintains a single liquid phase up to saturation.
Ecoscint original
Excellent for:Aqueous samples, agarose gels, paper or glass filters.
Useful for:Alkaline samples, biological samples, milk, plasma, high salt solutions, homogenized or solubilized tissues.Counting discrete samples ...................................................... p.156
APPL ICATIONS
The Original Ecologically Responsible Scintillation FluidReadily Biodegradablel
Ecoscint LS-271 4 liter (1-3) 4 liter (4+) 20 Liter
Product Name Cat. No. Size
l
Storage, Packaging, and Disposal of Biodegradable Scintillation Fluids
Storage: All Ecoscint products and Uniscint BD solutions are best stored tightly capped in a cool dry area. No deterioration has been observed on storage for five years at room tem-perature, or heating to 50˚C for one week or cooling to -30˚C for one week.Packaging: All Ecoscint and Uniscint BD solutions are supplied in unbreakable 4-liter and 20-liter fluorinated high density polyethylene containers. Shipping weight is 9lbs. (4kgs.) per 4-liter bottle and 40 lbs. (18kgs.) per 20-liter drum.Disposal: U.S. Federal Nuclear Regulatory Commission and Environmental Protection Agency regulations permit the disposal of Ecoscint products through conventional sanitary sewage systems. Liquid scintillator counting solutions of Ecoscint products containing Tritium and/or Carbon-14 in concentrations of 0.05 microcuries or less per gram may be disposed of without regard to radioactivity. However, a record of such disposal must be maintained (10 CFR Part 20 Section 20.306). It is important to note that local regulations may differ from and supercede federal regulations. In this case, local regulations concerning the disposal of Tritium and/or Carbon-14 must be followed. Ecoscint products are considered “organic matter” and may be disposed of accordingly.
Ecoscint O is intended for use with nonaqueous samples. Ecoscint O is readily biodegradable, and because of its high flash point and low toxicity, Ecoscint O represents a substantial improvement in safety over conventional cocktails. Additionally, Ecoscint O exhibits lower backgrounds and improved quench resistance compared to non-biodegradable solutions.
Ecoscint O
Excellent for:Organic or hydrophobic samples, carbon dioxide and oxidation counting, alpha particle counting, radon extraction.Counting discrete samples ...................................................... p.156
APPL ICATIONS
Cocktail for Non-Aqueous SamplesReadily Biodegradable Excellent Counting EfficiencyLow Toxicity
l
l
l
l
Ecoscint O LS-274 4 liter (1-3) 4 liter (4+) 20 Liter
Product Name Cat. No. Size
TM
TM

Liquid Scintillation Products - Biodegradable Scintillation Cocktails for Vial Counting
USA: 1-800-526-3867EUROPE: 441 482 646022
132
LSC
Saf
er C
ockt
ails
Uniscint BD is a biodegradable scintillation solution especially formulated to accommodate high salt and buffer samples while still delivering efficiency. Uniscint BD has a low viscosity and is non-gelling. It is suited for use in on-line HPLC flow detectors as well as in traditional vial counting.
Uniscint BD accommodates all concentrations of ammonium phosphate up to 2M, at a ratio or 3:1 scintillator to sample, making it the ideal choice for counting ammonium phosphate gradients from 0-2M. Other samples, such as 2M ammonium formate and water are also accommodated at a 3:1 ratio.
Uniscint BD
Excellent for:High salt solutions, urine, ammonium phosphate or CsCl2 gradients, acidic samples, flow counting.
Useful for:High volume aqueous samples, biological samples, plasma, RIA supernatants, glass fiber filters, sucrose gradients.
Counting discrete samples ...................................................... p.156Flow scintillation counting ....................................................... p.158
APPL ICATIONS
Biodegradable Cocktail for High Salt SamplesLow Toxicity
l
l
Uniscint BD LS-276 4 liter (1-3) 4 liter (4+) 20 Liter
Product Name Cat. No. Size
2M Ammonium Phosphate
2M Ammonium Formate
Water
32
33
35
% Count ing E ffic iency
% Counting Efficiency (3H) of Typical Samplesat 3:1 Uniscint BD to Sample Ratio
Sample
TM
Ecoscint GL
For counting isotopes bound to silica or resinsForms stable gel phase with water or moderate saltReliable counting without settling of particulates
l
l
l
Ecoscint GL is the liquid scintillation cocktail to use for counting resins, silica and other particulate samples, as it alleviates the worry of solid materials drifting to the bottom of the vial.
Ecoscint GL forms a semisolid gel phase, which allows for sample material to be suspended for counting. Ecoscint GL will hold up to 2 ml of sample per 10 ml of cocktail in a liquid emulsion, and will form a gel at 2.5-3.5 ml of sample with water or moderate salt.
Ecoscint GL LS-262 4 liter (1-3)
Product Name Cat. No. Size
TM

Liquid Scintillation Products - Traditional Scintillation Cocktails for Vial Counting
USA: 1-800-526-3867EUROPE: 441 482 646022
133
LSCTraditional C
ocktails
As one of the first companies to manufacture scintillation cocktails com-mercially, National Diagnostics has a long history of providing quality cocktails for high efficiency counting of all samples. The following pages contain scintillation fluids for all applications which are formulated using a nonbiodegradable solvent.
Traditional ScintillationCocktails
Hydrofluor is a high efficiency, ready-to-use liquid scintillation solution de-signed to count large volumes of aqueous radioactive samples. Hydrofluor contains LSC grade fluors and solvents for one-step sample preparation. Up to 5 ml of aqueous solutions (acids, bases or biological fluids) can be incorporated in 10 ml of Hydrofluor and counted with high efficiency. Ad-ditionally, Hydrofluor has been specially designed to offer extremely low backgrounds and minimize chemiluminescence.
Hydrofluor may be used to prepare samples in either liquid or gel form. Sample volumes up to 15% Hydrofluor volume form clear mobile solutions. Sample volumes from 25-50% Hydrofluor volume form stable countable gels which may be used to suspend solids such as TLC plate scrapings. Sample volumes between 15-25% Hydrofluor volume form a two-phase system which is not recommended for counting. Increasing the sample or scintillator con-tent of these systems shifts them into the countable phase range (see graph).
Storage: Hydrofluor is best stored tightly capped in a cool dry area.
Hydrofluor
Excellent for:High volume aqueous samples, gel phase counting of suspended solids, biological samples, filter papers, salt solutions, tissue homoge-nates, density gradients with sucrose or CsCl2.
Useful for:Acidic samples, alkaline samples, catecholamine assays, glass fiber filters, environmental samples, milk.
Counting discrete samples ...................................................... p.156
APPL ICATIONS
For Large Volume Aqueous SamplesHigh Counting EfficiencyReady-To-Use for All Sample Types
l
l
l
Hydrofluor LS-111 4 liter (1-3) 4 liter (4 +)
Product Name Cat. No. Size
% Water in Hydrofluor
Clear MobileLiquid Two
PhaseSystem Gel
0 10 20 30 40 50
10
20
30
40
50
% Tr
itium
Cou
ntin
g Ef
ficie
ncy
Hydrofluor Efficiency (Tritium) atVarious Sample Volumes of Distilled Water
TM

Liquid Scintillation Products - Traditional Scintillation Cocktails for Vial Counting
USA: 1-800-526-3867EUROPE: 441 482 646022
134
LSC
Trad
itiona
l Coc
ktai
ls
Monofluor is a complete liquid scintillation solution designed to count ex-tremely large sample volumes. A 5.0ml aqueous sample can be counted as a crystal clear mobile liquid in 10ml Monofluor. With Monofluor, the suspension remains homogeneous with increasing sample volumes. There are no two-phase regions or non-homogeneous gel suspensions. The efficiency of Monofluor is nearly linear throughout its counting range without the drop-off encountered in gel phase counting.
Monofluor
Excellent for:Agarose gels, aqueous samples, biological samples, environmental samples, carbon dioxide, glass fiber or paper filters, low salt solutions, urine, sucrose gradients, tissue homogenates.
Useful for:Alkaline samples, polyacrylamide gels.
Counting discrete samples ...................................................... p.156
APPL ICATIONS
Extremely High Sample Holding CapacityClear Continuous Liquid Phase to 50% SampleNo Gel PhaseHigh Efficiency
l
l
l
l
Monofluor LS-191 4 liter (1-3) 4 liter (4+)
Product Name Cat. No. Size
Typical Efficiencies for 10ml Monofluor
Sample Volume (ml)
% Tritium
0 1 2 3 4 5
35
40
45
50
Nuclean and Nuc-Wipes can help you maintain the safety of your working environment. Nuclean is National Diagnostics’ concentrated, effective, and economical solution for removing radioac-tivity from laboratory glassware, equipment and surfaces. Nuc-Wipes are unique pads for environ-mental wipe tests. Unlike filter paper, Nuc-Wipes dissolve in scintillation fluid, ensuring accurate, reproducible results. See pages 142-143 for more information.
Nuclean and Nuc-Wipes
Improve Radia t ion Safe ty
TM
Nuclean [pg142] NC-200 1 quart 1 gallon (1-3) 1 gallon (4+)
Nuc-Wipes [pg143] NW-300 1 box of 100 (1-3) 1 box of 100 (4+)
Product Name Cat. No. Size

Liquid Scintillation Products - Traditional Scintillation Cocktails for Vial Counting
USA: 1-800-526-3867EUROPE: 441 482 646022
135
LSCTraditional C
ocktails
Betafluor is a pre-mixed scintillation solution designed to count virtually all nonaqueous and organic samples with greatly improved efficiencies. Beta-fluor contains all necessary primary and secondary fluors and solvents. It is precisely quality controlled to assure lot-to-lot consistency and reproducibility of results. Simply combine the nonaqueous sample with 10-15 ml Betafluor, shake well and count.
Betafluor has lower backgrounds and improved quench resistance over toluene-based scintillators, and tritium efficiencies over 55% are obtainable. Betafluor is formulated with our exclusive high flash point, low evaporation rate LSC solvent which offers higher counting efficiencies as well as reduced fire hazard and exposure to aromatic solvents.
Storage: Betafluor is best stored tightly capped in a cool dry area.
Betafluor
Excellent for:Organic solvents, oxidation counting, carbon dioxide, radon.
Counting discrete samples ...................................................... p.156
APPL ICATIONS
Betafluor LS-151 4 liter (1-3) 4 liter (4 +)
Product Name Cat. No. Size
Liquiscint is an economical, ready-to-use liquid scintillation solution designed for aqueous and organic samples. Liquiscint is intended as a general replace-ment for “homemade” toluene-Triton X-100 LSC solutions.
For no more than it would cost to prepare your own solutions, Liquiscint offers the advantages of convenience and safety, as well as stringent quality control testing to ensure consistency from batch to batch.
Storage: Liquiscint is best stored tightly capped in a cool dry area. It is stable for five years under normal conditions.
Liquiscint
Excellent for:Low volume aqueous samples.
Useful for:Samples on filter paper, polar solvents, low salt solutions, sucrose gradients, urine screening.
Counting discrete samples ...................................................... p.156
APPL ICATIONS
Liquiscint LS-121 4 liter (1-3) 4 liter (4 +) 20 liter drum
Product Name Cat. No. Size
For Non-Aqueous SamplesHigh Counting EfficiencyReady-To-UseEconomical
l
l
l
l
Typical Efficiencies for 10ml Betafluor and10 ml Conventional Toluene-Based Scintillator
External Standard Ratio
% E
ffici
ency
0
20
40
0.25 0.50 0.75 1.0
60
Betafluor
TolueneScintillator
TM
TM
EconomicalReliable
l
l

Liquid Scintillation Products - Biodegradable Scintillation Cocktails for Flow Counting
USA: 1-800-526-3867EUROPE: 441 482 646022
136
LSC
LSC
Coc
ktai
lsLS
CFl
ow C
ockt
ails
National Diagnostics produces a complete line of ready-to-use solutions specifically designed for on-line use in HPLC flow detectors. These solu-tions can also be used for discrete counting of individual samples in liquid scintillation vials. All National Diagnostics HPLC scintillation cocktails are low viscosity, monophasic and non-gelling, thus guaranteeing pumpable, homogeneous samples.
B iodegradable Cock ta i l sfor HPLC F low Detec t ion
Formulated for multipurpose flow applications, Ecoscint Flow represents the utilization of National Diagnostics’ new advances in scintillation fluid chemistry to create a low viscosity cocktail. Ecoscint Flow accepts a wide range of HPLC gradients at a 1:1 ratio, providing high counting efficiency (25% 3H efficiency at 1:1 cocktail/sample). Even difficult samples such as 0.1N NaOH mix rapidly to yield a clear, nonviscous emulsion.
Ecoscint Flow
Excellent for:High sample capacity, high efficiency flow counting with minimal waste generation.
Flow liquid scintillation ............................................................ p.158
APPL ICATIONS
Nonhazardous and BiodegradableLow ViscosityNon-GellingUltra-High Sample Hold (1:1 Cocktail to Sample)Low Toxicity High Counting Efficiency
l
l
l
l
l
l
Ecoscint Flow LS-288 4 liter (1-3) 4 liter (4+)
20 liter
Product Name Cat. No. Size
TM
Hydrochloric Acid 0.1 NSodium Hydroxide 0.1 N
Sodium Chloride 0.5 MSodium Chloride 1 M
Sucrose 40%Ammonium Acetate 15 mMAmmonium Acetate 0.25 M
Tris/HCl 0.05 M pH = 7Tris/HCl 0.5 M pH = 7Washing Buffer 1X PBS
Ammonium Sulfate 0.1 MAcetonitrile: 1% HOAc 75:25%Acetonitrile: 1% HOAc 50:50%Acetonitrile: 1% HOAc 25:75%Acetonitrile: 1% HOAc 0:100%Acetonitrile: 0.1% TFA 75:25%Acetonitrile: 0.1% TFA 50:50%Acetonitrile: 0.1% TFA 25:75%Acetonitrile: 0.1% TFA 0:100%
Acetonitrile: 1X PBS 75:25%Acetonitrile: 1X PBS 50:50%Acetonitrile: 1X PBS 25:75%Acetonitrile: 1X PBS 0:100%
Methylene ChlorideAcetonitrile
Ammonium Formate 1 M
6 mL8 mL 10 mL5 mL 150 µL 10 mL10 mL >10 mL10 mL10 mL 10 mL7 mL 5 mL 5 mL 10 mL 7.5 mL 5.5 mL 5.5 mL > 10 mL2.5 - 3 mL 2.5 - 3 mL 3.5 mL8 mL All proportionsAll proportions4 mL
Sample Hold (Volume of Sample per 10ml Ecoscint Flow)
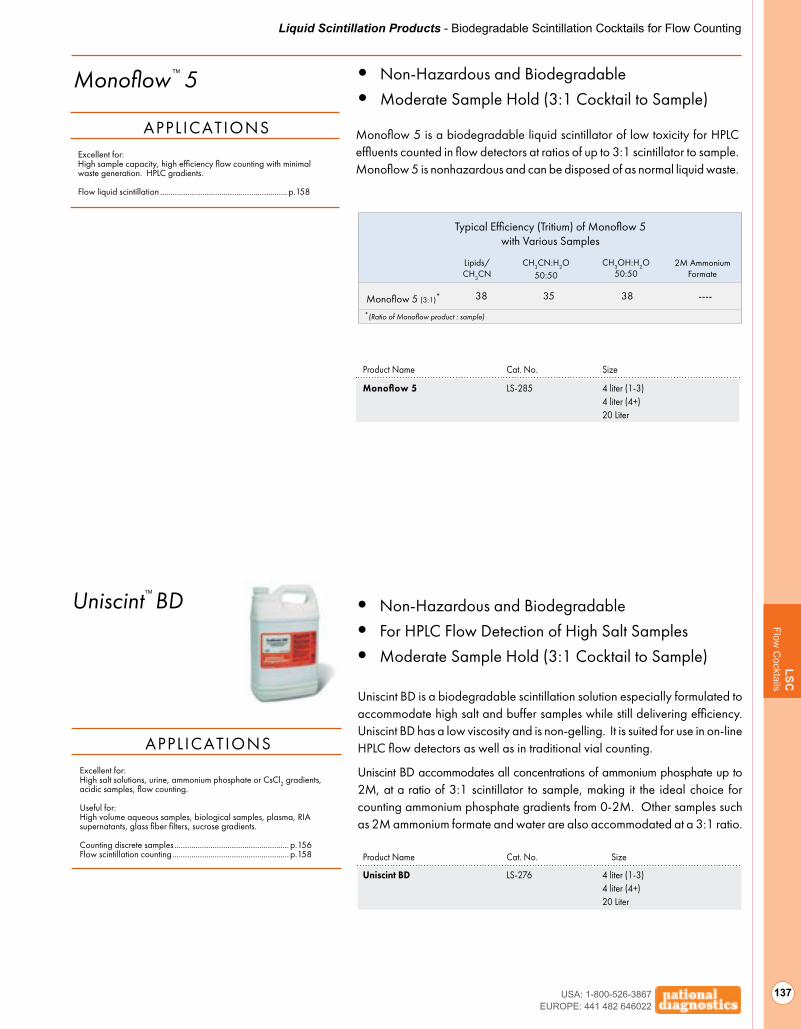
Liquid Scintillation Products - Biodegradable Scintillation Cocktails for Flow Counting
USA: 1-800-526-3867EUROPE: 441 482 646022
137
LSCLS
C C
ocktailsLSC
Flow C
ocktails
Monoflow 5 is a biodegradable liquid scintillator of low toxicity for HPLC effluents counted in flow detectors at ratios of up to 3:1 scintillator to sample. Monoflow 5 is nonhazardous and can be disposed of as normal liquid waste.
Monoflow 5
Excellent for:High sample capacity, high efficiency flow counting with minimal waste generation. HPLC gradients.
Flow liquid scintillation ............................................................ p.158
APPL ICATIONS
Non-Hazardous and BiodegradableModerate Sample Hold (3:1 Cocktail to Sample)
l
l
Monoflow 5 LS-285 4 liter (1-3) 4 liter (4+) 20 Liter
Product Name Cat. No. Size
Typical Efficiency (Tritium) of Monoflow 5 with Various Samples
Monoflow 5 (3:1)*
Lipids/CH3CN
2M AmmoniumFormate
CH3OH:H2O50:50
CH3CN:H2O50:50
38 35 38 ----
*(Ratio of Monoflow product : sample)
Uniscint BD is a biodegradable scintillation solution especially formulated to accommodate high salt and buffer samples while still delivering efficiency. Uniscint BD has a low viscosity and is non-gelling. It is suited for use in on-line HPLC flow detectors as well as in traditional vial counting.
Uniscint BD accommodates all concentrations of ammonium phosphate up to 2M, at a ratio of 3:1 scintillator to sample, making it the ideal choice for counting ammonium phosphate gradients from 0-2M. Other samples such as 2M ammonium formate and water are also accommodated at a 3:1 ratio.
Uniscint BD
Excellent for:High salt solutions, urine, ammonium phosphate or CsCl2 gradients, acidic samples, flow counting.
Useful for:High volume aqueous samples, biological samples, plasma, RIA supernatants, glass fiber filters, sucrose gradients.
Counting discrete samples ...................................................... p.156Flow scintillation counting ....................................................... p.158
APPL ICATIONS
Uniscint BD LS-276 4 liter (1-3) 4 liter (4+) 20 Liter
Product Name Cat. No. Size
Non-Hazardous and BiodegradableFor HPLC Flow Detection of High Salt SamplesModerate Sample Hold (3:1 Cocktail to Sample)
l
l
l
TM
TM
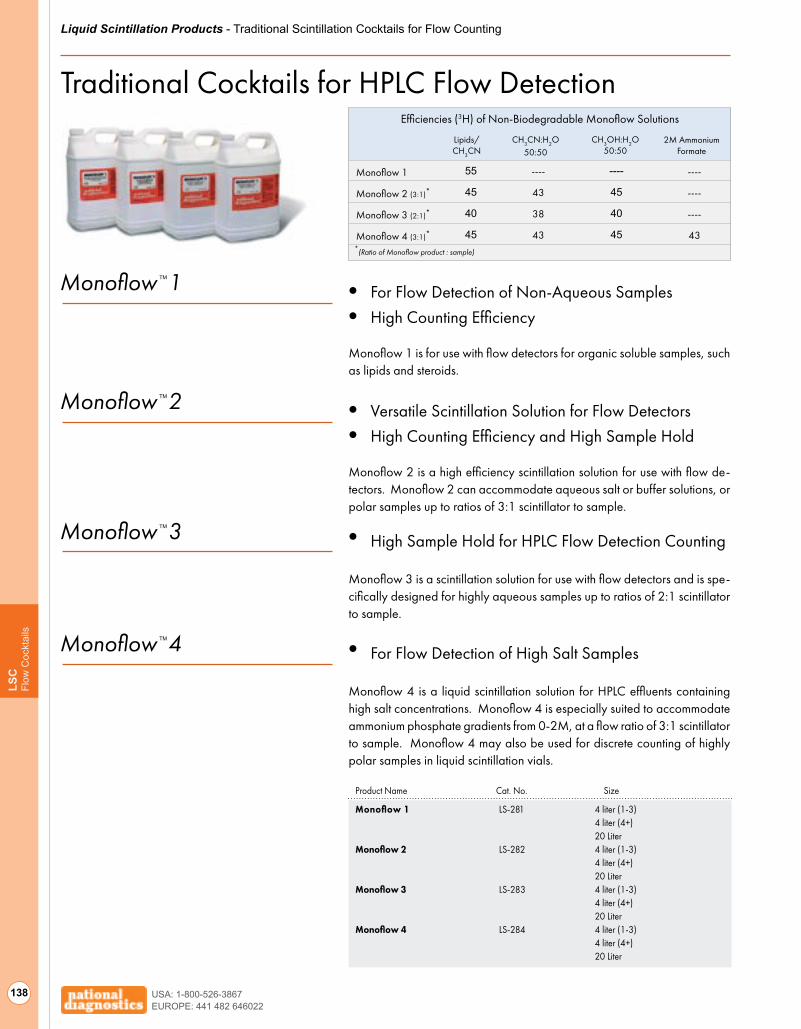
Liquid Scintillation Products - Traditional Scintillation Cocktails for Flow Counting
USA: 1-800-526-3867EUROPE: 441 482 646022
138
LSC
Flow
Coc
ktai
ls
Monoflow 1 is for use with flow detectors for organic soluble samples, such as lipids and steroids.
Monoflow 1 For Flow Detection of Non-Aqueous SamplesHigh Counting Efficiency
l
l
Monoflow 2 is a high efficiency scintillation solution for use with flow de-tectors. Monoflow 2 can accommodate aqueous salt or buffer solutions, or polar samples up to ratios of 3:1 scintillator to sample.
Monoflow 2 Versatile Scintillation Solution for Flow DetectorsHigh Counting Efficiency and High Sample Hold
l
l
Monoflow 3 is a scintillation solution for use with flow detectors and is spe-cifically designed for highly aqueous samples up to ratios of 2:1 scintillator to sample.
Monoflow 3 High Sample Hold for HPLC Flow Detection Countingl
Monoflow 4 is a liquid scintillation solution for HPLC effluents containing high salt concentrations. Monoflow 4 is especially suited to accommodate ammonium phosphate gradients from 0-2M, at a flow ratio of 3:1 scintillator to sample. Monoflow 4 may also be used for discrete counting of highly polar samples in liquid scintillation vials.
Monoflow 4 For Flow Detection of High Salt Samplesl
Monoflow 1 LS-281 4 liter (1-3) 4 liter (4+) 20 Liter Monoflow 2 LS-282 4 liter (1-3) 4 liter (4+) 20 Liter Monoflow 3 LS-283 4 liter (1-3) 4 liter (4+) 20 Liter Monoflow 4 LS-284 4 liter (1-3) 4 liter (4+) 20 Liter
Product Name Cat. No. Size
Traditional Cocktails for HPLC Flow DetectionEfficiencies (3H) of Non-Biodegradable Monoflow Solutions
Monoflow 1
Monoflow 2 (3:1)*
Monoflow 3 (2:1)*
Monoflow 4 (3:1)*
Lipids/CH3CN
2M AmmoniumFormate
CH3OH:H2O50:50
CH3CN:H2O50:50
55
45
40
45
----
43
38
43
----
45
40
45
----
----
----
43*(Ratio of Monoflow product : sample)
TM
TM
TM
TM

Liquid Scintillation Products - Sample Oxidation
USA: 1-800-526-3867EUROPE: 441 482 646022
139
LSC S
ample O
xidation
Oxosol C14 is a complete scintillator designed to absorb and count 14CO2 produced by sample combustion.
Oxosol C14
Excellent for:Carbon dioxide capture and counting. Gaseous samples.
Counting 14CO2 ....................................................................... p.158
APPL ICATION
Oxosol C14 LS-211 1 gallon (1-3) 1 gallon (4 +)
Product Name Cat. No. Size
Complete Oxidizer Solutionl
Accurate quantitation of 14CO2 released by respiration or sample combustion depends upon the efficiency of capture and scintillation. National Diagnostics supplies Carbamate and cocktail combinations suitable for all such applications. National Diagnostics’ reagents ensure compati-bility between Carbamate and cocktail, which is critical to obtaining accurate and reproducible results.
Sample Oxidation Solutions
Carbamate-1 is a high-capacity CO2 absorber intended to be used in con-junction with Oxosol 306. One (1) ml absorbs 5.8 mMoles CO2 at saturation.
Carbamate-1
Carbamate-1 LS-241 450 ml (1-3) 450 ml (4+)
Product Name Cat. No. Size
CO2 Absorberl
Oxosol 306 is a complete scintillation counting solution specifically formu-lated to count CO2 samples trapped in Carbamate.
Oxosol 306
Oxosol 306 LS-231 1 Liter 4 Liter
Product Name Cat. No. Size
Oxidizer Solutionl
TM
TM

Liquid Scintillation Products - Tissue/Gel/Filter Solubilization
USA: 1-800-526-3867EUROPE: 441 482 646022
140
LSC
Sol
ubili
zatio
n
National Diagnostics has extensive experience assisting researchers in the solubilization of tissues, gels, and filters in the preparation of samples for scintillation counting. National Diagnostics is the only company offering a biodegradable solubilizer/cocktail combination.
T i s sue/Gel/Fi l te rSolubilization
When used together, Biosol and Bioscint form a nonhazardous, biodegrad-able tissue solubilizer and scintillation solution. The solubilizer, Biosol, is designed to be used with a variety of samples, including tissue, filters and polyacrylamide gels. Bioscint is our neutralizing scintillation solution. Used in combination with Biosol, Bioscint eliminates chemiluminescence and renders the solubilizer nonhazardous.
One (1) part Biosol must be mixed with ten (10) parts Bioscint to be disposed of as nonhazardous waste under EPA 40 CFR Subpart C. Neither Biosol nor Bioscint can be disposed of separately as nonhazardous waste. Biosol is compatible with all aqueous scintillation solutions. However, only Bioscint will render the solution nonhazardous for disposal.
Storage: Biosol is corrosive, and is best stored tightly capped in a cool dry area.
BiosolBioscint
Excellent for:Tissue solubilization, tissue homogenates, biological samples, blood, brain, polyacrylamide gels.
Counting Tissue Samples ........................................................ p.157Samples in Polyacrylamide Gels ........................................... p.158
APPL ICATIONS
Biodegradable Tissue Solubilizer/Scintillator Combination
l
Biosol LS-310 400 ml
Bioscint LS-309 4 liter (1-3) 4 liter (4+)
Product Name Cat. No. Size
Solusol is a superior solubilizing agent which may be used with a wide variety of samples. Solusol accepts large aqueous samples and accommodates most animal and plant tissues and tissue homogenates with minimal quench-ing and high efficiency. Solusol has also been efficiently used to recover labeled samples from polyacrylamide gels.
Simply add sample to a glass scintillation vial with a nonmetallic cap (pre-wet sample if tissue is dehydrated). Add Solusol to sample vial, allow to digest and then count. An aromatic-based scintillation solution is recommended for counting. National Diagnostics’ Soluscint XR (Order No. LS-314) is ideally suited for this purpose.
Storage: Solusol is best stored in the freezer, tightly capped under nitrogen.
Solusol
Excellent for:Tissue solubilization, tissue homogenates, blood, brain, polyacryl-amide gels, biological samples.
Counting Tissue Samples ........................................................ p.157Samples in Polyacrylamide Gels ........................................... p.158
APPL ICATIONS
Tissue and Gel Solubilizerl
Solusol LS-311 450 ml (1-3) 450 ml (4 +)
Product Name Cat. No. Size
TM
TM
TM

Liquid Scintillation Products - Tissue/Gel/Filter Solubilization
USA: 1-800-526-3867EUROPE: 441 482 646022
141
LSCS
olubilization
Filtron-X is a ready-to-use liquid scintillation solution which completely dis-solves Millipore -type filters (cellulose acetate, cellulose nitrate and mixed ester), solubilizing a wide variety of samples contained on the filter. Filtron-X contains all the necessary phosphors and solvents to yield counting efficien-cies unattainable by any other means. The use of Filtron-X assures full 4 pi geometry counting of samples. Improvement in counting efficiency is most notable when tritium is used as the label since absorption of the emitted beta ray by the filter is completely avoided. Filtron-X will solubilize the sample assuring homogeneous counting. For a completely dry filter it may be nec-essary to moisten the filter with one or two drops of distilled water before placing in Filtron-X. Simply add filter to 10ml of Filtron-X, allow to stand at room temperature for 15 minutes. Shake well to assure complete dissolution of filter and sample and then count.
F i l t ron-X
Excellent for:Samples on cellulose ester (cellulose acetate or cellulose nitrate) membranes.
Samples on Cellulose-Ester Filters ......................................... p.157
APPL ICATIONS
Filtron-X LS-201 4 liter (1-3) 4 liter (4 +)
Product Name Cat. No. Size
Dissolves Membrane Filtersl
Path of Emitted Beta Rays
Emissions from LabeledCompound on Intact Filter
Emissions from LabeledCompound with Filter Dissolved
Note attenuation
of beta raysby filter
TM
Soluscint XR is National Diagnostics’ complete ready-to-use scintillation cocktail specifically designed to count tissue homogenized by National Diagnostics’ Solusol. Additionally, Soluscint XR is also ideal as a general purpose cocktail for counting high salt and highly alkaline aqueous samples. Chemiluminescence is reduced, and counting efficiency of highly quenched samples is considerably improved. Soluscint XR is capable of incorporating an aqueous sample at 25% sample hold.
Soluscint-XR
Excellent for:Tissue solubilization, tissue homogenates, biological samples, blood, brain, polyacrylamide gels.
Counting Tissue Samples ........................................................ p.157Samples in Polyacrylamide Gels ........................................... p.158
APPL ICATIONS
Soluscint-XR LS-314 4 liter (1-3) 4 liter (4 +)
Product Name Cat. No. Size
Companion Cocktail for SolusollTM
Ideal for High Salt and Alkaline Samplesl
1M Tris/HCl
1M NaCl
1M Ammonium Acetate
2M Ammonium Acetate
1M NaOH
Hold Max/10ml
1.6ml
1.5ml
4ml*
8ml
3ml*
Soluscint XR Sample Holdswith High Salt Samples
*In these cases the final emulsion forms a clear gel which is perfectly acceptable for counting.
TM

Liquid Scintillation Products - Radiation Safety
USA: 1-800-526-3867EUROPE: 441 482 646022
142
LSC
Rad
iatio
n S
afet
y
When working with radioactivity, nothing is more important than safety. Local, national and international regulations all require that where radioactivity is being handled, surfaces must be monitored on a frequent and regular basis. National Diagnostics has introduced a range of products to help researchers with safety protocols including a convenient and cost effective wipe test kit.
Radia t ion Safe ty
Nuclean is a concentrated, economical and highly efficient solution for safe and fast removal of radioactivity from laboratory glassware, equipment and laboratory surfaces. It is also a superior general laboratory cleaner and degreaser.
In normal use, Nuclean is diluted 1:50 with water, and the glassware allowed to soak overnight and rinsed clean with distilled water. Faster decontamination is effected by increasing the concentration to 1:20 and elevating the temperature. Agitation will greatly accelerate the process. For surface decontamination, such as lab benches and tops, Nuclean should be used undiluted.
Nuclean is biodegradable and mild to the skin when diluted 1:50. Nuclean is not only more effective than chromic acid but is safer to use as well. Quart containers are supplied with a spray-head.
Nuclean
Excellent for:Removing contamination from surfaces after positive wipe tests. Gen-eral laboratory cleaning.
Radiation safety ....................................................................... p.159
APPL ICATIONS
Nuclean NC-200 1 quart 1 gallon (1-3) 1 gallon (4+)
Product Name Cat. No. Size
Safe and Effective Radioactive DecontaminationSuperior CleanerBiodegradablepH NeutralWill Not Damage Metal Instruments
l
l
l
l
l
TM

Liquid Scintillation Products - Radiation Safety
USA: 1-800-526-3867EUROPE: 441 482 646022
143
LSCR
adiation Safety
Nuc-Wipes are dissolvable pads which assure superior environmental wipe tests. Nuc-Wipes are completely soluble in any scintillation solution, and because Nuc-Wipes dissolve completely, no emitted beta ray can be hindered or absorbed by an undissolved portion of the wipe. Nuc-Wipes allow full 4 pi counting efficiencies, thereby eliminating the possibility of lost counts due to absorption of beta rays by the filter itself.
Nuc-Wipes
Excellent for:Routine wipe testing.
Radiation safety ....................................................................... p.159
APPL ICATIONS
Completely Dissolving Wipes for Environmental TestsGreater Counting EfficiencyIncreased ReliabilitySafe and Easy to Use
l
l
l
l
Nucwipes [box of 100 wipes] NW-300 1 box of 100 (1-3) 1 box of 100 (4 +)
Product Name Cat. No. Size
Conventional Wipes
Nuc-Wipes
Using intact filters for environmental wipe tests can give inaccurate, erratic results. Beta rays originating from particles on intact filters are attenuated and absorbed by the filter. Furthermore, depending on the relative af-finity of the material for the solution, as material leaves the filter for the solution, counts change over time.
Nuc-Wipes eliminate the dependence of results on the direction of the filter paper and time. Because Nuc-Wipes dissolve in scintillation fluid, there is no intact filter to absorb or attenuate beta emissions. 4 pi count-ing efficiency is achieved, giving reproducible results.
TM

Liquid Scintillation Products - Scintillation Vials
USA: 1-800-526-3867EUROPE: 441 482 646022
144
LSC
Sci
ntill
atio
n Vi
als
Accessor ies for Sc in t i l la t ion Count ing
National Diagnostics’ scintillation vials are made of high density polyethylene (HDPE), providing low permeability to the organic solvents typically used in liquid scintillation counting. These scintillation vials are manufactured as a one-piece molding with no seams, thus eliminating cracked vials, pinholes and leakage. National Diagnostics’ vials also provide excellent UV light transmission for higher efficiency.
A tough, resilient sealing ring is precision-molded into the cap. This offers a secure seal and prevents leakage in general applications. National Di-agnostics’ scintillation vials are designed to accommodate all conventional scintillation solutions. Additionally, using National Diagnostics’ EcoscintTM family of biodegradable, low-toxicity, nonhazardous liquid scintillation solutions improves the safety of liquid scintillation procedures.
National Diagnostics offers three types of scintillation vials: 20ml standard vials with screw caps and 6ml or 8ml minivials with push-on/twist-off caps. The minivials with push-on / twist-off caps offer a novel closure system. The push-on/twist-off cap is a safer, more time-efficient alternative to the normal screw-on or plug cap. The push-on/twist-off cap pushes on for fast closure. This is especially helpful when processing many vials at one time. The cap then twists off as a normal screw cap for safer reopening. This eliminates the splashing caused by the removal of plug caps and avoids loss of radioactivity and/or personal contamination. The push-on/twist-off cap also eliminates the possibility of the cap popping off due to pressure buildup in the vial. The vial can be opened and closed many times both safely and easily.
Scin t i l la t ion V ia ls
Counting discrete samples ..................................................... p. 156
APPL ICATIONS
20ml Scintillation Vials SVC-20 1-10 cases with Screw Caps (1000/case) 11+ cases
8ml Scintillation Vials SVC-08 1-10 cases with Push-on/Twist-off Caps (2000/case) 11+ cases
6ml Scintillation Vials SVC-06 1-10 cases with Push-on/Twist-off Caps (1000/case) 11+ cases
Product Name Cat. No. Size
Precision MoldedHighest Quality HDPELeak-Tight SealEconomical
l
l
l
l

Liquid Scintillation Products - Liquid Handling
USA: 1-800-526-3867EUROPE: 441 482 646022
145
LSCLiquid H
andling
Compatible with all National Diagnostics’ scintillation cocktails, the National Diagnostics Bottle-Top Dispenser has an accuracy of delivery with 0.3% on maximum delivery and a precision better than 0.1% CV.
The National Diagnotics Bottle-Top Dispenser is fitted with an anti-drip safety valve, a feature which guards against drips when the Bottle-Top Dispenser is not in use. A fine adjustment mechanism allows for even greater repro-ducibility for repeat dispensing. The right-angled delivery spout ensures accurate dispensing into narrow scintillation vials.
Unlike other bottle-top dispensers, the National Diagnostics Bottle-Top Dispenser can be disassembled from the pedestal for thorough cleaning.
National DiagnosticsBottle-Top Dispenser
Bottle-Top Dispenser LS-900 1 Unit
Product Name Cat. No. Size
• Spring-lock cursor design ensures fine adjustment for exact and reproducible dispensing
• Easily removable PTFE piston for cleaning and smooth action
• Borosilicate glass barrel protected with a transparent polypropylene sleeve
• Easy to adjust calibration mechanism• Anti-drip tap
Extendable Delivery Jet The National Diagnostics Extendable Delivery Jet gives versatility to your dispensing, facilitating high-throughput scintillation counting. The delivery jet stylus slots into the right-angled spout of the Bottle-top Dispenser for “hands-off” use when desired.
Extendable Delivery Jet LS-904 1 Unit
Product Name Cat. No. Size

Liquid Scintillation Products - Autoradiographic Enhancement
USA: 1-800-526-3867EUROPE: 441 482 646022
146
LSC
Aut
orad
iogr
aphy
Autofluor
Excellent for:Fluorographic detection of radiolabeled samples on polyacrylamide gels or TLC plates.
Counting Samples on TLC Plates ........................................... p. 157Samples of Polyacrylamide Gels .......................................... p. 158Autoradiography ..................................................................... p. 83
APPL ICATION
Detection of low levels of radioactivity on TLC plates, polyacrylamide gels and histological slices can all be enhanced or accelerated by the use of Na-tional Diagnostics’ Autofluor. Autofluor is the first water soluble fluorographic enhancing reagent, providing the best efficiency of detection available, in a safer and easier to use solution.
Autoradiography Image Enhancement
TM
Autofluor represents the first water soluble scintillation phosphor to be devel-oped and applied directly for use as an autoradiographic image intensifier. Autofluor rapidly penetrates acrylamide gel systems and maximizes energy transfer from labeled compound to phosphor. Autofluor contains no dimeth-ylsulfoxide or acidic aromatic solvents. Therefore, the hazards of use related to these materials are eliminated. The band distortion that is associated with using nonaqueous enhancers is also eliminated.
The Autofluor procedure is the shortest and easiest procedure yet developed for enhancement and visualization of beta-emitters. In an independent test1 comparing eight different fluorographic methods for the detection of 35S-labeled proteins in polyacrylamide gels, Autofluor was the most effective. With Autofluor, the dpm/mm2 required to half-saturate the x-ray film was 1/8 that required by autoradiography alone.
Storage: Autofluor has a shelf life of at least one year stored at room temperature, out of direct sunlight. Keep from freezing. At temperatures less than 20OC precipitation of water soluble phosphors may occur. Warming to approximately 30OC will redissolve the phosphors.
The left gel (7%, 1mm) in the illustration was dehydrated in DMSO (di-methylsulfoxide) for one hour, then impregnated in PPO-DMSO for one hour, precipitated and dried. The right gel was impregnated with Autofluor for one hour and dried. Both gels were exposed for 24 hours at -76°C on Kodak XR-5 X-OMat film. The single tritiated band contains 5000 dpm. Note the higher degree of resolution and band discrimination with Autofluor vs PPO-DMSO.
l High Resolution Autoradiographic Image Intensifierl Rapid Enhancement of Low Energy Beta-Emitters Such as 3H, 14C, and 35Sl For Polyacrylamide Gels, Paper Chromatography, and TLC Platesl Water-Based, Odorless, Contains No DMSO
1Perng (1988), Analytical Biochemistry, 173, 387-392
Autofluor LS-315 1 Liter (1-3) 1 Liter (4 +)
Product Name Cat. No. Size
3H 14C
AutofluorPPO-DMSO
3H 14C

Liquid Scintillation Products - Scintillator Reagents
USA: 1-800-526-3867EUROPE: 441 482 646022
147
LSC Pow
der Scintillators
Primary Scintillators
Absolute fluorescence emission in cyclohexane (max): 410nm
POPOP SFC-60 25 g 100 g
Spectroanalysis assay ...........................99%Purity by TLC .................................. One Spot
Melting Point ..............................244-246oCAbsolute Absorption ......................... 358nm
BBQ SFC-13 1 g 5 g
Absolute fluorescence emission in cyclohexane (max): 477nmSpectroanalysis assay .……………………99%Purity by TLC .................................. One Spot
Melting Point ..............................202-204oCAbsolute Absorption ......................... 382nm
Naphthalene - ULTRA PURE
Absolute fluorescence emission in cyclohexane (max): 322nm
Naphthalene (scInTIllaTIon grade) SFC-40 100 g 1 kg
Assay by GLC ........................................99%Purity by TLC .................................. One Spot
p-Terphenyl ULTRA PURE
p-Terphenyl SFC-50 25 g 100 g
Absolute fluorescence emission in cyclohexane (max): 340nm
Assay by GLC ........................................99%Purity by TLC .................................. One Spot
Melting Point ................................212-213oCAbsolute Absorption ..........................276nm
Secondary Scintillators
Absolute fluorescence emission in cyclohexane (max): 420nm
Bis-MSB SFC-90 25 g 100 g
Spectroanalysis assay ...........................99%Purity by TLC .................................. One Spot
Melting Point ............................... 179-181oCAbsolute Absorption ..........................346nm
TPB SFC-15 5 g
Absolute fluorescence emission in cyclohexane (max): 455nm
Spectroanalysis assay ...........................99%Purity by TLC .................................. One Spot
Melting Point ..............................207-209oCAbsolute Absorption ..........................346nm
POPOP ULTRA PURE(1,4-bis[5-phenyloxazol-2-yl]benzene)
Bis-MSBULTRA PURE(1,4-bis[2-methylstyryl]benzene)
BBQ ULTRA PURE(7H-benzimidazo[2,1-a]benz[de]isoquinoline-7-one)
TPBULTRA PURE(1,1,4,4-tetraphenyl-1,3-butadiene)
Melting Point .................................. 80-81°CAbsolute Absorption ..........................276nm
Butyl PBDULTRA PURE(2,[4-biphenylyl]-5-[4-tert-butylphenyl]-1,3,4-oxadiazole)
Absolute fluorescence emission in cyclohexane (max): 363nmAssay by GLC .......................................99%Purity by TLC ................................... One spot
Melting Point ...............................137-139oCAbsolute Absorption ......................... 304nm
Butyl PBD SFC-20 25 g 100 g 500 g
Absolute fluorescence emission in cyclohexane (max): 357nm
Assay by GLC ........................................99%
Purity by TLC ................................... One spot
Melting Point ................................... 71-73oC
Absolute Absorption ..........................327nm
PPO - ULTRA PURE(2,5-diphenyloxazole)
PPO SFC-10 25 g 100 g 500 g

148
LSC Concepts - Fundamentals of Liquid Scintillation Counting
USA: 1-800-526-3867EUROPE: 441 482 646022
LSC
LSC
Fun
dam
enta
ls
Liquid Scintillation Counting...Making Light of the Situation
The chemical nature of an element is determined by its atomic number, not atomic mass. Changing the number of uncharged neutrons within the nucleus does not change the chemical behavior of most elements in any significant way. This makes possible the existence of isotopes, which are atoms of the same element with different atomic weight. Most isotopes are stable, and do not undergo any spontaneous nuclear changes. A subset of isotopes pos-sess too few or too many neutrons to be stable. These are radioactive. Radioactive atoms spontaneously rearrange their nuclei, emitting energy or particles in the process.
Radioactive isotopes of common elements are extremely useful in life science disciplines, among others, because radioactive atoms can be substituted for their nonradioactive counterparts in chemical formulations. The resulting radioactive compound is easily detectable but still chemically identical to the original material. Two detection meth-ods predominate for assaying such incorporated radioactivity. In autoradiography, labeled material is allowed to expose a photographic emulsion. Development of the emulsion reveals the distribution of labeled material. In the second detection method, the amount of radioactivity in labeled samples is directly measured, either by a Geiger counter or by a scintillation counter. In scintillation counting, the sample is mixed with a material that will fluoresce upon interaction with a particle emitted by radioactive decay. The scintillation counter quantifies the resulting flashes of light.
1 Fundamentals of Liquid Scintillation Counting
1.1 RADIOACTIVE EMISSIONS Types of Radioactive Emission / Characteristics of
Useful Isotopes / Use of Isotopes in Research
1.2 MEASUREMENT OF RADIATION AND ISOTOPE QUANTITATION
Ionization Detection / Scintillation Detection
1.3 MECHANISM OF LIQUID SCINTILLATION COUNTING
The Role of the Solvent / The Role of Phosphors (Scintillators)
1.4 LIQUID SCINTILLATION SIGNAL INTERPRETATION
PatternsofLightEmission/PulseAnalysis/CountingEfficiency/Quenching
1.5 THE COMPLETE SCINTILLATION COCKTAIL
1.6 CHEMILUMINESCENCE AND STATIC ELECTRICITY
1.7 WASTE DISPOSAL ISSUES

149149
LSC Concepts - Fundamentals of Liquid Scintillation Counting
USA: 1-800-526-3867EUROPE: 441 482 646022
LSCLS
C Fundam
entals
1.1 Radioactive Emissions1.1.1 Types of Radioactive Emission
Radioactive decay occurs with the emission of particles or electromag-netic radiation from an atom due to a change within its nucleus. Forms of radioactive emission include alpha particles (α), beta particles (β), and gamma rays (γ). α particles are the least energetic, most massive of these decay products. An α particle contains two protons and two neutrons, and thus comprises a stable helium nucleus. α particles only weakly penetrate whatever matter they encounter. They are unable to penetrate even 10 cm of air.
β particles are high energy electrons. These are produced during the conversion of a neutron to a proton in the nucleus. β particles are emitted in concert with a neutrino (Neutrinos are almost impossible to detect). The sum of the energies of the neutrino and β particle is a constant for a given isotope, and defines the maximum energy (Emax) which can be observed for any particle emitted from that isotope. Emax is approached only for particles emitted with a low energy neutrino. In practice a distribution of energies is observed, which is characteristic for the emitting isotope.
γ -rays differ from α and β emissions in that γ-rays are electromagnetic radiation, not particles. γ -rays are quite penetrating, in many cases passing through up to 5 cm of lead. Additionally, γ -rays are capable of generating secondary β emission from material they pass through. An electron in the material may absorb the energy of the γ-ray, and be promoted to an excited state which is no longer bound to its nucleus. Such an electron escapes from the atom as a free β-particle.
1.1.2 Characteristics of Useful Isotopes
The list of known radioisotopes is extensive, but the number of isotopes used in research is fairly small. To be useful as a label in research, an isotope must meet a restrictive set of qualifications. First of all, it must be an element that is already a part of the experimental system. For biological research, for example, isotopes of carbon, hydrogen, oxygen, and phosphorus are widely used. Alternatively, an element which can be substituted for another in the system may be used: sulfur isotopes can be used in place of oxygen, for example.
Useful isotopes must also have a reasonable half-life. The half-life of an isotope is a measure of the rate at which it decays to a nonradioactive state. As each nucleus emits its radiation, it eventually reaches a stable configuration which will not emit again. Thus a given quantity of isotope will eventually yield a finite total amount of radiation. Each nucleus de-cays independently, so the probability of a decay event occurring at any time is equal to the probability of any one nucleus decaying multiplied by the total number of radioactive nuclei present. This number changes as decay progresses, always proportional to the number of radioactive nuclei remaining. To express a rate of radioactive decay which is inde-pendent of the amount of material involved, the time required for the decay of 50% of the starting material, the half-life, is a useful quantity. Half-lives may range from milliseconds to thousands of years, a value characteristic of the particular isotope. Assuming that a 24 hour period is required for an experiment, an isotope with a half life (t1/2) of 6 hours would undergo 24 fold reduction in emissions, or a loss of 94%. Most experimentally used isotopes have t1/2 values of 10 days or more.
To determine the number of radioactive atoms present within a sample at a given time, use the equations above.
λ = decay constant t1/2 = half-life N = number of radioac-
tive atomsN0 = initial number t = elapsed time
Radioisotopes: Decay Products and Energies
Isotope Emission Energy(MeV)
Tritium (3H)
Carbon (14C)
Sulfur (35S)
Phosphorus (32P)
Phosphorus (33P)
Iodine (125I)
β
β
β
β
β
γ
Half Life (t1/2)
0.019
0.156
0.167
1.710
0.249
0.178
12.3 yrs
5730 yrs
87.2 days
14.3 days
25.3 days
59.9 days
Table 1.1.2a
1.1.3 The Use of Isotopes in Research
For many kinds of research, the utility of radioisotopes stems from their chemical identity with their nonradioactive counterparts. This allows their incorporation into “tracers”, radiolabeled components which can be followed and detected through a series of reaction steps. Tracers are invaluable in metabolic studies, where they allow the determination of the catabolic and/or anabolic fates of nutrient compounds. Animals are fed diets containing labeled molecules, such as sugars or amino acids, and the radioactivity is followed through the system until excretion or incorporation. Another use for isotopes has been protein and DNA analysis studies, where probes which bind to specific macromolecules can be radiolabeled without interfering with their activity.
Figure 1.1.3a Examples of radiolabeled biological molecules including tritiated glycine and ATP labeled with either 35S or 32P.
ATP [α-35S] ATP [α-32P]
1.2 Measurement of Radiation and Isotope QuantitationMost research applications of radioisotopes, at some stage, require quantitation of the isotope, which is done by measuring the intensity of radiation emitted. Common nomenclature expresses this intensity as disintegrations per minute (DPM). The SI unit for radiation, the Becquerel (Bq), corresponds to 60 DPM (one disintegration per second). The curie, an earlier and still prevalent measure, is equal to 3.7 x 10¹⁰ Bq. Truly accurate measurement of DPM would require that every emission event be detected and counted, which is not possible in most situations. Additionally, naturally occurring isotopes and cosmic radiation contrib-ute significant “background” radiation. Corrections for efficiency and background are needed to convert CPM, the counts per minute mea-sured, into DPM, the number of decay events which actually occurred. Techniques have been developed for applying these corrections, and a great deal of research has been carried out to improve the efficiency of counting, using various detection systems.
Glycine [2 - 3H]

150
LSC Concepts - Fundamentals of Liquid Scintillation Counting
USA: 1-800-526-3867EUROPE: 441 482 646022
LSC
LSC
Fun
dam
enta
ls
provide a usable method for counting organic isotopic compounds. These materials are most often water soluble β-emitters. LSC addresses the need for convenience, reproducibility, and high sensitivity in these assays. It also offers solutions to the problem of counting aqueous (i.e. biological) samples in a nonaqueous environment.
1.3 Mechanism of Liquid Scintillation CountingBy eliminating the combustion steps needed for gas phase analysis, the introduction of liquid scintillation counting (LSC) reduced the time required to analyze radioactive samples from hours to minutes. For low energy (“soft”) β emitters, LSC offers unmatched convenience and sensitivity. LSC detects radioactivity via the same type of light emission events which are used in solid scintillation. The key difference is that in LSC the scintillation takes place in a solution of scintillator, rather than in a solid crystal. This allows close contact between the isotope atoms and the scintillator, which is not possible with solid scintillation. With LSC the short path length of soft β emissions is not an obstacle to detection.
Liquid scintillation cocktails absorb the energy emitted by radioisotopes and re-emit it as flashes of light. To accomplish these two actions, absorption and re-emission, cocktails contain two basic components, the solvent and the phosphor(s). The solvent carries out the bulk of the energy absorption. Dissolved in the solvent, molecules of phosphor convert the absorbed energy into light. Many cocktails contain additional materials to extend their range of use to different sample compositions, but the solvent and the phosphor provide the scintillation of the mixture.
1.3.1 The Role of the Solvent
The solvent portion of an LSC cocktail comprises from 60 - 99% of the total solution. When a radioisotope dissolved in the cocktail undergoes an emission event, it is highly probable that the particle or ray will encounter only solvent molecules before its energy is spent. For this reason, the solvent must act as an efficient collector of energy, and it must conduct that energy to the phosphor molecules instead of dissipating the energy by some other mechanism. The solvent must not quench the scintillation of the phosphor, and, finally, the solvent must dissolve the phosphor to produce a stable, countable solution.
Aromatic organics have proven to be the best solvents for LSC. The prototypical LSC solvent is toluene (The solvents used in National Di-agnostics scintillation fluids are safer and less toxic than toluene). The π cloud of the toluene ring (or any aromatic ring) provides a target for β-interaction, which captures the energy of the incident particle. This captured energy is generally lost through transfer to another solvent molecule, as toluene has little tendency to emit light or undergo other alternate decay modes. Thus, a β-particle passing through a toluene solution leaves in its wake a number of energized toluene molecules. The energy from these molecules passes back and forth among the solvent ring systems, allowing efficient capture by dissolved phosphors.
Figure 1.2.2a In a solid scintillator, beta and alpha particles cannot penetrate the barrier between the sample well and the NaI crystal, but gamma rays pass through easily.
1.2.1 Ionization Detection
Alpha, beta & gamma radiation all fall into the category of ionizing radiation. Alpha & beta particles directly ionize the atoms with which they interact, adding or removing electrons. Gamma-rays cause secondary electron emissions, which then ionize other atoms. The ionized particles left in the wake of a ray or particle can be detected as increasing conductivity in an otherwise insulating gas, which is done in electroscopes, ionization chambers or proportional counting chambers. These devices measure the pulse of conductivity between two electrodes when a particle or ray ionizes the gas between them. If a sufficiently high voltage is applied between the electrodes, an amplification of the signal can be obtained, and such counters can be quite sensitive. Their utility is severely limited by the fact that for most research applications only gas phase isotopes can be detected. This greatly complicates sample preparation (requiring the combustion of 14C to 14CO2, for example) and may preclude the analysis of some compounds entirely.
Figure 1.2.1a The stylized representation of an ionization chamber above shows a beta particle colliding and ionizing a neutral particle.
Figure 1.3.1a Solvents employed in liquid scintilla-tion cocktails, such as toluene, pseudocumene, or PXE, possess aromatic rings to absorb the energy of incident radiation.
1.2.2 Scintillation Detection
Some irradiated atoms are not fully ionized by collision with emitted particles, but instead have electrons promoted to an excited state. (A sub population of ionized atoms can recombine with an ion of opposite sign and also produce an excited state.) Excited atoms can return to ground state by releasing energy, in some cases as a photon of light. Such scintillation phenomena form the basis of a set of very sensitive radiation detection systems. In solid scintillation systems, a crystal of inorganic or organic material, the scintillator, is irradiated by the sample. The light emitted in response to this irradiation is taken as a measure of the amount of radioactivity in the sample. Solid scintillation is excellent for γ radiation which is highly penetrating and can cause scintillation throughout a large crystal. An advantage of these techniques is that the same crystal is used for each sample, which enhances reproducibility. Unlike ionization counting, a gas phase sample is not required. For α or β counting, however, solid scintillation has severe limitations. The crystal must be protected from contamination by the sample, which means that the α & β particles must traverse a barrier prior to reaching the scintillator. α particles in particular are severely attenuated by even 0.05mm of aluminum or copper, and so cannot be expected to reach a scintillator crystal through even the thinnest shielding.Liquid scintillation (LSC), detailed in the next section, was evolved to
PXE (phenyl xylylethane)Toluene
Pseudocumene
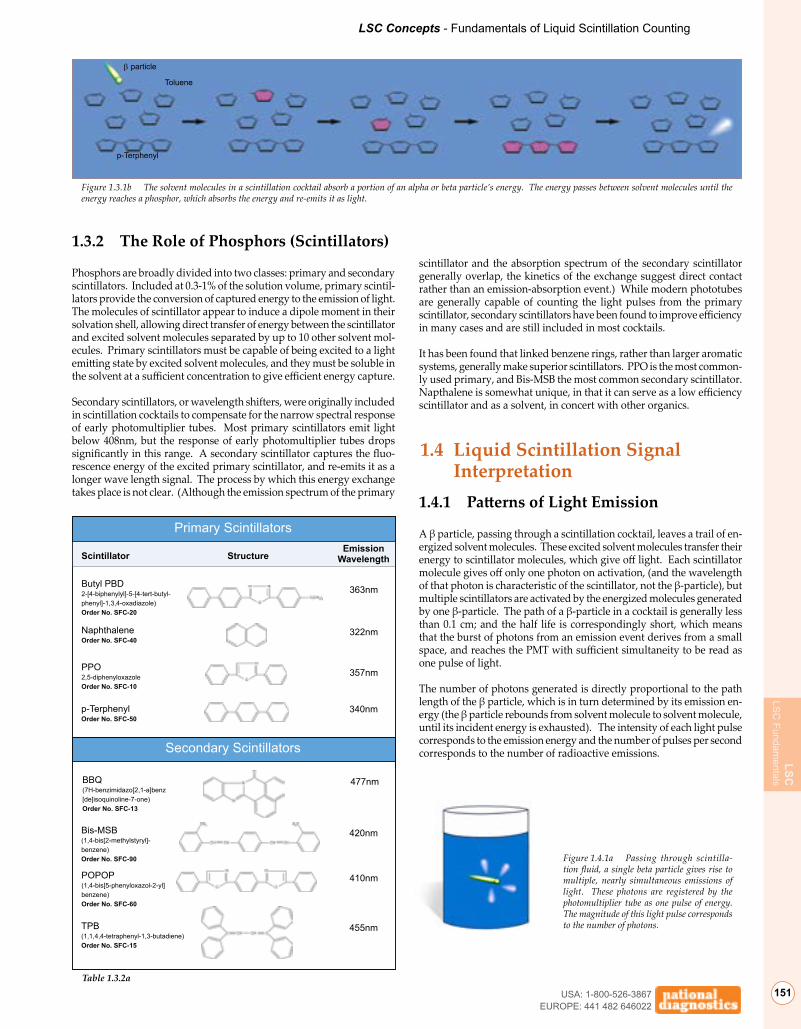
151151
LSC Concepts - Fundamentals of Liquid Scintillation Counting
USA: 1-800-526-3867EUROPE: 441 482 646022
LSCLS
C Fundam
entals
1.3.2 The Role of Phosphors (Scintillators)
Phosphors are broadly divided into two classes: primary and secondary scintillators. Included at 0.3-1% of the solution volume, primary scintil-lators provide the conversion of captured energy to the emission of light. The molecules of scintillator appear to induce a dipole moment in their solvation shell, allowing direct transfer of energy between the scintillator and excited solvent molecules separated by up to 10 other solvent mol-ecules. Primary scintillators must be capable of being excited to a light emitting state by excited solvent molecules, and they must be soluble in the solvent at a sufficient concentration to give efficient energy capture.
Secondary scintillators, or wavelength shifters, were originally included in scintillation cocktails to compensate for the narrow spectral response of early photomultiplier tubes. Most primary scintillators emit light below 408nm, but the response of early photomultiplier tubes drops significantly in this range. A secondary scintillator captures the fluo-rescence energy of the excited primary scintillator, and re-emits it as a longer wave length signal. The process by which this energy exchange takes place is not clear. (Although the emission spectrum of the primary
Figure 1.3.1b The solvent molecules in a scintillation cocktail absorb a portion of an alpha or beta particle’s energy. The energy passes between solvent molecules until the energy reaches a phosphor, which absorbs the energy and re-emits it as light.
Toluene
p-Terphenyl
β particle
scintillator and the absorption spectrum of the secondary scintillator generally overlap, the kinetics of the exchange suggest direct contact rather than an emission-absorption event.) While modern phototubes are generally capable of counting the light pulses from the primary scintillator, secondary scintillators have been found to improve efficiency in many cases and are still included in most cocktails.
It has been found that linked benzene rings, rather than larger aromatic systems, generally make superior scintillators. PPO is the most common-ly used primary, and Bis-MSB the most common secondary scintillator. Napthalene is somewhat unique, in that it can serve as a low efficiency scintillator and as a solvent, in concert with other organics.
1.4 Liquid Scintillation Signal Interpretation
1.4.1 PatternsofLightEmission
A β particle, passing through a scintillation cocktail, leaves a trail of en-ergized solvent molecules. These excited solvent molecules transfer their energy to scintillator molecules, which give off light. Each scintillator molecule gives off only one photon on activation, (and the wavelength of that photon is characteristic of the scintillator, not the β-particle), but multiple scintillators are activated by the energized molecules generated by one β-particle. The path of a β-particle in a cocktail is generally less than 0.1 cm; and the half life is correspondingly short, which means that the burst of photons from an emission event derives from a small space, and reaches the PMT with sufficient simultaneity to be read as one pulse of light.
The number of photons generated is directly proportional to the path length of the β particle, which is in turn determined by its emission en-ergy (the β particle rebounds from solvent molecule to solvent molecule, until its incident energy is exhausted). The intensity of each light pulse corresponds to the emission energy and the number of pulses per second corresponds to the number of radioactive emissions.
Scintillator StructureEmission
Wavelength
Butyl PBD2-[4-biphenylyl]-5-[4-tert-butyl-phenyl]-1,3,4-oxadiazole)Order No. SFC-20
NaphthaleneOrder No. SFC-40
p-TerphenylOrder No. SFC-50
363nm
322nm
340nm
Primary Scintillators
Secondary Scintillators
TPB(1,1,4,4-tetraphenyl-1,3-butadiene)Order No. SFC-15
455nm
Table 1.3.2a
PPO2,5-diphenyloxazoleOrder No. SFC-10
357nm
BBQ(7H-benzimidazo[2,1-a]benz[de]isoquinoline-7-one)Order No. SFC-13
477nm
POPOP(1,4-bis[5-phenyloxazol-2-yl]benzene)Order No. SFC-60
410nm
Bis-MSB(1,4-bis[2-methylstyryl]-benzene)Order No. SFC-90
420nm
Figure 1.4.1a Passing through scintilla-tion fluid, a single beta particle gives rise to multiple, nearly simultaneous emissions of light. These photons are registered by the photomultiplier tube as one pulse of energy. The magnitude of this light pulse corresponds to the number of photons.

152
LSC Concepts - Fundamentals of Liquid Scintillation Counting
USA: 1-800-526-3867EUROPE: 441 482 646022
LSC
LSC
Fun
dam
enta
ls
1.4.2 Pulse AnalysisThe scintillation counter classifies each pulse of photons according to the number of photons in the pulse, which corresponds to the energy of the individual β emission event. Pulses are collated into channels, and the counts per minute (CPM) in each channel is recorded. Each channel corresponds to a specific range of β energies (channels are also known as counting windows), and counts with energies above or below set limits are excluded from a particular channel. The usual practice is for three channels to be selected, which divide the energy spectrum of emissions into low, medium and high energy. The lowest channel corresponds to the energy of 3H emissions, the highest to 32P. When the counts have all been collated, the researcher knows the intensity of radiation, expressed as CPM, and its energy distribution, or spectrum. CPM is proportional to the amount of isotope in the sample, and the spectrum indicates the identity of the isotope.
Within a theoretically ideal cocktail, all of the energy from each β particle would be collected and converted into light. The spectrum of emitted β energy and the DPM values could then be taken directly from the data. The highest energy emissions would be compared with the Emax (maximum emission energies) for known radioisotopes to confirm the isotope identity. Real cocktails, however, are less than 100% efficient in energy collection and conversion, especially with lower energy β emissions. This makes data interpretation somewhat more complex.
Figure 1.4.2a A scintillation counter collating the energy spectrum of β emissions into three channels would read the majority of 3H emissions in the low energy channel, 14C in the intermediate channel, and 32P in the high energy channel.
1.4.3 CountingEfficiency
While the effectiveness of a scintillation cocktail may be expressed a number of ways, it is most often given as the percentage of emission events that produce a detectable pulse of photons, referred to as the counting efficiency. In other words, counting efficiency is equal to CPM/DPM—the ratio of counts per minute (CPM) to disintegrations per minute (DPM) expressed as a percentage. Counting efficiency varies for different isotopes, sample compositions and scintillation counters. Poor counting efficiency can be caused by an extremely low energy to light conversion rate, (scintillation efficiency) which, even optimally, will be a small value. It has been calculated that only some 4% of the energy from a β emission event is converted to light by even the most efficient scintillation cocktails. Fortunately, this number does not vary greatly across a wide range of β-energies, which avoids an additional level of complexity in signal interpretation. However, the low efficiency in en-ergy conversion means that low energy β particles will only generate a few photons. 3H, for example, has a maximum β energy of 0.019 MeV, which at 4% scintillation efficiency will generate about 240 photons. The average emission energy is generally 30-40% of Emax, which would give 70-100 photons in this case. Most phototubes used in scintillation detection only detect 1 in 4 photons, so the average 3H β-emission event will produce only a 20-25 photon pulse in the counter. Clearly many emissions of below average energy, or emissions which lose photons due to sample characteristics, will fall below the level of a 1 photon event and will not register as a count on the instrument. The loss of CPM due to absorption of β-energy or photons by sample components is known as quenching. Quenching can easily reduce pulses below the detection limit of the counter, thus reducing the overall counting efficiency.
1.4.3 QuenchingQuenching is the loss of counts due to sample or cocktail characteristics and may result from a variety of components in a sample. Quenchers are customarily divided into the categories of chemical quenchers or color quenchers. Chemical quenchers absorb radioactive energy before it is converted to light. Therefore, chemical quenchers reduce the number of photons generated by each β-particle. Color quenchers absorb light in the range of the wavelength emitted by the scintillator. In this case the number of photons emitted is not changed, but the number reaching the photomultiplier tube is reduced.
Figure 1.4.3a Strong quenching can shift the majority of pulses below the threshold of detection (marked by the dashed red line).
Below this energy, β-particles do not generate enough photons to be detected
In both types of quenching, the energy of all light pulses is reduced, and the total CPM is reduced by the number of pulses quenched to below detectable levels. This leads to an underestimate of the total counts, and thus of the isotope present. It also leads to an apparent shift in the energy spectrum of the sample.
Figure 1.4.3b Chemical quenching and color quenching can keep energy from a radioactive event from making its way through the scintillation mechanism to the photomultiplier tube. The stylized diagram above presents chemical quenching by water and color quenching by an organic nitrate as two possible obstacles to efficient counting.
Chemical quenchingby water
Color quenchingby organic nitrate
Detection

153153
LSC Concepts - Fundamentals of Liquid Scintillation Counting
USA: 1-800-526-3867EUROPE: 441 482 646022
LSCLS
C Fundam
entals
Quench CorrectionVarious methods are available for quench correction. The most straight-forward, but most laborious, is the use of an internal standard. A known amount of radioactivity, added to an unknown sample, will increase the DPM by a predictable amount. The difference between the increase in DPM observed and that expected is due to quenching, and allows the determination of counting efficiency for that sample. The drawback to the use of internal standards is that each sample must be counted twice. It is also inconvenient to add an internal standard to many vials.
Many scintillation counters offer the use of an external standard to cor-rect for quenching. After initial counting, a strong γ emission source is placed next to the vial and the sample is counted again. The γ rays cause secondary emission of Compton electrons, which scintillate in the cocktail like β particles. The counts due to sample radioactivity are subtracted, leaving only the Compton electron counts. The theoretical energy distribution of the Compton electrons is compared with the measured energy spectrum to determine the extent of quenching. The samples must still be counted twice, but nothing need be added to the vials, and the process may be carried out automatically by the counter.
The analysis of the energy spectrum is commonly done by computing a “channels ratio.” The detected counts are divided into channels based on their relative energies, and the number of high energy counts (with two channels, the “B” channel) is compared to the number of low energy counts (channel “A”). The ratio, calculated as B/A or B/B+A, will change if the sample is quenched. Quenching reduces the intensity of each light pulse, so counts will appear to be of lower energy. This will shift counts from high to low energy channels, and decrease the channels ratio. In practice, a set of quenched standards is created by adding a quenching agent to reduce the CPM of an internal standard. The channels ratio of the external standard is then determined, and a correlation is established between quench and channels ratio. The channels ratio analysis may also be applied to the sample itself to determine quenching. Again, a set of quenched standards is assembled, and a known amount of radioactivity is added to each. A curve is constructed, relating CPM/DPM to B/B+A. Once this curve has been generated, the quench of any subsequent sam-ple can be determined from its channels ratio. This quenching factor is then used to correct CPM to DPM.
1.5 The Complete Scintillation CocktailLiving creatures contain both hydrophobic and hydrophilic compounds, any of which may be labeled during the course of a radioactive exper-iment. As discussed in earlier sections, the best solvents for scintilla-tion counting are the aromatic organics, such as toluene and xylene. Hydrophobic compounds can be counted directly in such solvents, but hydrophilic materials, which include many biological samples, are completely insoluble in simple cocktails. This requires the engineering of complex cocktails, capable of bringing hydrophilic sample molecules into close proximity to organic solvents and the dissolved scintillators.
Most scintillation cocktails designed for aqueous samples contain sur-factants, which emulsify the sample into the organic solvent. Toluene containing the detergent Triton-X100 is a prototypical example of an emulsion cocktail (Figure 1.5a). When water is added to a solution of Triton-X100 in toluene, the detergent molecules orient to form micelles with their hydrophobic alkane chains facing out into the solvent, and their hydrophilic polyethylene glycol chains facing in, “dissolved” in a small amount of trapped water. Various other components are added to the cocktail in small amounts, which regulate the size of the micelles to maintain overall solution clarity.
Since the surfactants and other additives are generally less effective at energy capture than the solvent, emulsion cocktails are less efficient than pure solvent cocktails. In addition, the partitioning of the aqueous samples into micelles means that the radioactive emissions must escape from the micelle before beginning the scintillation process. Energy is
lost while the emitted particle traverses the micelle, resulting in fewer photons per particle reaching the counter. The result is an effective quench, which can be corrected by the means given in the previous sec-tion. This quenching is dependent upon the size of the micelles, which in turn depends upon the ratio of sample to cocktail. It is important to use a correction curve which accounts for this volume dependence.
Figure 1.5a: Micellar structure in a scintillation cocktail. Hydrophilic proteins (green) and water (blue) are emulsified by Triton X-100 (black). Radioactive emissions from the labeled protein must pass through the micelle to encounter the toluene solvent (brown) before energy can be passed to the primary and secondary phosphors (red) and be re-emitted as light.
Ecoscint Ultra LS-270Ecoscint Ultra is the best scintillation cocktail on the market with both ultra-high sample hold and ultra-high efficiency. (pg. 128)
Ecoscint XR LS-272Ecoscint XR achieves ultra-high sample hold without sacrificing efficiency. 10ml of Ecoscint XR can hold up to 10ml of most common aqueous samples. (pg.129)
Ecoscint A LS-273An excellent all around scintillation fluid, Ecoscint A is readily biodegradable with low odor and low toxicity. It has exceptional sample holding capability (40% water) and high efficiency. (pg.130)
Ecoscint H LS-275Ecoscint H is National Diagnostics’ highest efficiency scintillation fluid for aqueous samples. Ecoscint H delivers up to 62% 3H counting efficiency. (pg.130)
Ecoscint O LS-274 Ecoscint O is a biodegradable scintillation fluid designed to count non-aqueous (organic soluble) samples. (pg.131)
Biodegradable Scintillation Fluids
Ecoscint Flow LS-288 Ecoscint Flow accepts a wide range of HPLC gradients at a 1:1 ratio, providing high counting efficiency. Even difficult samples such as 0.1N NaOH mix rapidly to yield a clear, nonviscous emulsion. (pg.136)
Ecoscint LS-271The first biodegradable scintillation fluid in-troduced, the original Ecoscint is an excellent all around performer at an affordable price. Provides good counting efficiency and sample hold. (pg.131)
Monoflow 5 LS-285Economical, biodegradable flow scintillator for HPLC effluents counted in flow detectors at ra-tios of up to 3:1 scintillator to sample. Monoflow 5 is nonhazardous and can be disposed of as normal liquid waste. (pg. 137)
Uniscint BD LS-276Specially formulated to accommodate high salt and buffer samples while still delivering efficiency. Accepts NH4-HPO3 gradients up to 2M in concentration. Suitable for both flow or vial counting. (pg. 132)

154
LSC Concepts - Fundamentals of Liquid Scintillation Counting
USA: 1-800-526-3867EUROPE: 441 482 646022
LSC
LSC
Fun
dam
enta
ls
Sample Holding Capacities of National Diagnostics Ecoscint A
SampleCapacity
(ml sample /10ml cocktail)
Water (20°C)
Water (25°C)
Water (15°C)
0.05M Tris-HCl
0.15M NaCl
10% Sucrose
8M Urea
4.5
4.0
5.0
4.5
4.0
3.0
1.0
Table 1.5a
Figure 1.6a Spurious counts due to chemiluminescence (green) dissipate over the course of hours, while the true count stays nearly constant. With the common isotopes used in life sciences research, the rate of radioactive decay is much slower than the decay of chemiluminescent reactions.
Scintillationcounts
Chemiluminescencecounts
Sample CapacityIncreasing the amount of water dispersed in an emulsion cocktail will increase micellar size, decreasing the energy in any given β particle when it finally escapes the micelle and begins to generate light. At some point, the amount of water added causes a micellar inversion, in which the organic solvent is surrounded by the surfactant, while the water makes up the bulk solution. Efficiency will decrease drastically at this point. The inversion process generally does not yield a clear solution. Above the cocktail sample holding capacity, the mixture is cloudy or opaque, and photons emitted within such a solution are lost to internal reflectance. Sample holding capacity is dependant upon sample composition and upon temperature. In planning scintillation counting experiments, it is crucial to ensure that the sample volume not be too close to the capacity of the cocktail. Such samples may turn opaque with a 1-2° change in temperature, and give falsely low readings. With the use of translucent plastic scintillation vials this type of artifact can be very difficult to detect.
1.6 Chemiluminescence and Static ElectricityAnother commonly encountered artifact is chemiluminescence. This is caused by any chemical reaction which generates an excited product molecule, which decays to emit light. These reactions generate only a single photon, which may be quenched, or may reach the counter to register as a low energy emission event.
Such reactions can generate 105-106 cpm, skewing both total cpm data and counts ratio information. Chemiluminescence is generally diagnosed by counting the samples twice with a period of about an hour between counts. As the chemiluminescent reaction consumes its substrate, the rate of photon production decreases noticeably over an hour, and will usually decrease to zero over the course of 2-24 hours. By contrast, even a short-lived isotope like 32P will decrease its emissions by only 5% over 24 hours.
Many scintillation counters use coincidence counting to eliminate counts due to chemiluminescence. This system uses two photomultiplier tubes, generally mounted opposite each other. Because chemiluminescence only generates one photon at a time, only one photomultiplier tube will be activated. In contrast, the burst of photons from a genuine decay event will activate both photomultiplier tubes. Coincidence counting eliminates those emission events which do not appear at both photo-multiplier tubes, thus eliminating chemiluminescence counts. However, coincidence counting will also cause some low energy emission events to be missed.
A further source of spurious counts is static electricity. The energy from a static electric buildup can be released as a burst of light from the cocktail. In dry environments, with plastic vials and latex gloves, high levels of static can build up, sufficient to give 104 cpm or higher from an affected sample. Static is the likely cause if counts from an individual sample vary unpredictably from one measurement to the next. Static can be minimized by wiping the vials with a wet paper towel (water dissipates the static) or by wiping with an antistatic laundry dryer sheet.
1.7 Waste Disposal IssuesAn aspect of LSC which must be considered in experimental design, is waste disposal. Unlike solid scintillation, LSC adds components to the sample increasing the volume of radioactive material by up to 1000 fold. The components of the LSC cocktail may represent a hazard or a disposal problem in addition to the radioactivity. For many experiments, only a small percentage of the samples counted will have significant radioac-tivity, so disposal of the LSC is the predominating issue. Fortunately, biodegradable LSC cocktails have been developed, such as National Diagnostics’ Ecoscint fluids and Uniscint BD, which substantially reduce the difficulty of disposing of LSC waste.
Nuclean NC-200 Nuclean is a concentrated, economical and highly efficient solution for safe and fast removal of radioactivity from laboratory glassware, equipment and laboratory surfaces. It is also a superior general laboratory cleaner and degreaser. (pg.142)
Nuc-Wipes NW-300 Nuc-Wipes are dissolvable wipe test pads, soluble in any scintillation solution. Because Nuc-Wipes dissolve completely, full 4π count-ing occurs, eliminating the lost counts due to absorption by the filter, enhancing counting efficiency and reproducibility. (pg.143)
Accessories for Scintillation Counting
Scintillation Vials 6 ml SVC-06 6 ml volume, high density polyethylene (HDPE) scintillation vials are manufactured as a one-piece molding with no seams, which prevents cracking, pinholes and leakage. These vials provide excellent UV light transmission for high counting efficiency. (pg.144)
Scintillation Vials 8 ml SVC-08 8 ml volume, high density polyethylene (HDPE) scintillation vials are manufactured as a one-piece molding with no seams, which prevents cracking, pinholes and leakage. These vials provide excellent UV light transmission for high counting efficiency. (pg. 144)
Scintillation Vials 20 ml SVC-20 20ml volume, high density polyethylene (HDPE) scintillation vials are manufactured as a one-piece molding with no seams, which prevents cracking, pinholes and leakage. These vials provide excellent UV light transmission for high counting efficiency. (pg.144)
155155
LSC Concepts - Applications of Liquid Scintillation Counting
USA: 1-800-526-3867EUROPE: 441 482 646022
LSCLS
C A
pplications
2 Applications of Liquid Scintillation Counting
2.1 COUNTING DISCRETE SAMPLES Sample Neutralization (Elimination of
Chemiluminescence) / Decolorizing
2.2 SPECIAL SAMPLE PREPARATION PROTOCOLS
TLC Plates / Counting Samples on Cellulose-ester Filters (MilliporeTM filters)/CountingTissue Samples / Counting 14CO2 / Samples in Polyacrylamide Gels
2.3 FLOW LIQUID SCINTILLATION
2.4 LIQUID SCINTILLATION AND RADIATION SAFETY
LSC Applications...Make the Prize Light! - William Shakespeare, The Tempest
L ike solid scintillation, liquid scintillation counting was originally applied only to discrete samples, either aqueous or nonaqueous, and protocols were developed for each type. The introduction of flow counting apparatus made it possible to use LSC to monitor the effluent from a chromatography column for radioactive
peaks. Again, the samples in flow LSC experiments are divided between aqueous and nonaqueous compositions.
Cocktails have been developed for discrete samples and for flow applications, answering the specific needs of each type of experiment. In addition, cocktails are available for a variety of specific applications for the counting of dis-crete samples with unique characteristics. Most of these cocktails are designed to simplify sample preparation in such applications as counting samples in electrophoresis gels, samples on filters, whole tissue samples or combusted materials.

156
LSC Concepts - Applications of Liquid Scintillation Counting
USA: 1-800-526-3867EUROPE: 441 482 646022
LSC
LSC
App
licat
ions
2.1 Counting Discrete SamplesLiquid scintillation counting of discrete samples is conceptually straight-forward. A sample is mixed with an appropriate volume of scintillation cocktail, and the mixture is placed in an LSC vial and counted. For some samples, no additional steps are required, but in many situations, samples must be processed to avoid artifacts. The most common causes of artifacts are static electricity counts, chemiluminescent counts and color quenching. Protocols for sample preparation to maximize the efficiency of counting and minimize background are given below. These protocols can be readily adapted to a variety of samples. Following this section, the preparation and counting of several unique sample types are presented, as “special applications.”
The best counting efficiencies are achieved when samples uniformly disperse into the cocktail to produce a clear, colorless, pH neutral emulsion. Uniform dispersion of the sample is achieved by selecting the appropriate cocktail formulation. Organic samples present no problem. With organic samples, the highest efficiency can be achieved in cocktails which contain no emulsifiers and which are only suitable for organics. Organic samples, however, can be successfully counted in emulsifying cocktails, and often the convenience of using one cocktail for all applications outweighs any loss in efficiency. Aqueous samples present more of a challenge. The choice of cocktail will depend upon the balancing of sample holding and efficiency. It is a good idea to choose a cocktail which can hold at least 10% more sample than you intend to add, as sample capacity may be strongly affected by temperature or sample components.
neutralization is not practical, samples may be left to stand 1-3 hours, or in some cases, overnight, before counting. This allows time for the chemiluminescent reaction to run its course and die out. If chemilumi-nescence is suspected, samples should be counted repeatedly at intervals of greater than 1 hour until a stable reading is obtained.
2.1.2 Decolorizing Achieving a colorless solution of sample in cocktail is generally not problematic. Many samples are colorless, or contain so little color that dilution into the scintillation cocktail gives an essentially colorless solu-tion. In those cases where samples are deeply colored, particularly when the sample absorbs in the region of 300-400 nm, where scintillation phos-phors emit, several decolorizing protocols are available. As visible color often depends upon long conjugated polyene systems, strong oxidants are used to “bleach” the samples. Samples can be treated quite harshly prior to counting, because chemical changes to the labeled compounds will not alter the number of DPM emitted.
Protocol 2.1.2a
Decolorizing LSC Samples with Ultraviolet Light
Ultraviolet irradiation is often effective in bleaching visibly colored samples. The optimal wavelength, intensity and time must of course be determined for each sample. In many cases, exposing samples to sunlight for 1-2 hours is sufficient. Bleaching by UV has a great advantage over other methods - nothing is added to the sample, avoiding the potential quenching or chemiluminescent effects of other bleaching agents.
Protocol 2.1.2b
Decolorizing LSC Samples with Hydrogen Peroxide
H2O2 is a strong oxidant and a very effective bleaching agent. It is inexpensive, easy to work with, and miscible with aqueous samples. The only disadvantage to using H2O2 is that it decomposes to produce molecular oxygen, which is an effective quenching agent. Samples must be heated to drive off the O2 following H2O2 bleaching, to ensure reproducible results.
1. Mix: 0.1 - 0.3 ml of 30% H2O2 with 1ml sample
2. Incubate 1 hour at 50°C, shake occasionally.
3. Cool to room temperature, add scintillation cocktail and count.
Protocol 2.1.2c
Decolorizing LSC Samples with Benzoyl Peroxide
Samples which are not soluble in water or tissues which have been dissolved in organic solubilizers, can be bleached with Benzoyl Peroxide.
1. Dissolve 1g Benzoyl Peroxide in 5 ml Toluene - heating to 60°C may be required. Filter solution if cloudy. (Caution: Toluene has a flash point of 7°C. Heating must be carried out in a spark-free fume hood to avoid an explosion hazard.)
2. Add 2 ml Benzoyl Peroxide/Toluene solution to 1 ml sample.
3. Incubate for 30 minutes at 50°C.
4. Cool to room temperature, add scintillation cocktail and count.
2.2 Special Sample Preparation The preceding sections have outlined LSC procedures for samples which require only minimal preparation prior to counting. Often it is necessary to count materials which are not well suited to LSC. The problem is usually one of counting geometry, which is related to sample disper-sion. Figure 2.2a (pg. 157) shows the difference between the counting geometry of a well-dispersed sample vs. one adhering to filter paper. Counts are lost to absorption because they are emitted in a direction which does not take them into the cocktail. Additionally, in a sample which rests on the bottom of the tube fully 50% of the counts may be
Ecoscint Ultra LS-270Ecoscint Ultra is the best scintillation cocktail on the market. 10ml of Ecoscint XR can hold up to 12ml of water. With extremely low background, Ecoscint Ultra delivers unparalleled counting efficiency of both small and large aqueous samples. (pg.128)
Ecoscint XR LS-272Ecoscint XR achieves ultra-high sample hold without sacrificing efficiency. 10ml of Ecoscint XR can hold up to 10ml of most common aque-ous samples, easily accepting high pH, low pH, or high salt samples. (pg.129)
Ecoscint A LS-273An excellent all around scintillation fluid, Ecoscint A is readily biodegradable with high flash point, low odor and low toxicity. It has exceptional sample holding capability (40% water) and high efficiency. (pg.130)
Ecoscint H LS-275Ecoscint H is National Diagnostics’ highest efficiency scintillation fluid for aqueous samples. Ecoscint H delivers up to 62% 3H counting effi-ciency. It can hold up to 10% of its own volume of aqueous sample. (pg.130)
Biodegradable Scintillation Fluids
Ecoscint LS-271The first biodegradable scintillation fluid in-troduced, the original Ecoscint is an excellent all around performer at an affordable price. Provides good counting efficiency and sample hold. (pg.131)
Ecoscint O LS-274 Ecoscint O is a biodegradable scintillation fluid designed to count non-aqueous (organic solu-ble) samples. Ecoscint O delivers ultra-high ef-ficiency and extremely low background. (pg.131)
Uniscint BD LS-276Specially formulated to accommodate high salt and buffer samples while still delivering efficiency. Accepts NH4-HPO3 gradients up to 2M in concentration. Suitable for both flow or vial counting. (pg.132)
2.1.1 Sample Neutralization (Elimination of Chemiluminescence)
The neutralization of strongly alkaline samples is necessary to avoid chemiluminescence (Section 1.6). Neutralization can be accomplished by the addition of acetic acid. If the sample contains a high concentration of alkali, the addition of acetic acid may increase the overall salt content beyond the capacity of the scintillation cocktail. In such situations, the sample will need to be diluted prior to the addition of cocktail. If

157157
LSC Concepts - Applications of Liquid Scintillation Counting
USA: 1-800-526-3867EUROPE: 441 482 646022
LSCLS
C A
pplications
lost, as any downward emissions will either fail to scintillate or will gen-erate photons with no available path to the PMT. Examples of samples which present dispersion problems are silica particles from TLC plates, precipitates collected on filters, tissue samples, and polyacrylamide gels. Protocols are provided here for these samples.
2.2.1 TLC Plates
In a typical TLC experiment, the radioactivity is detected at two points: after TLC it is analyzed by autoradiography (Electrophoresis Theory, Section 4.1.3), to locate radioactive spots. These spots are then scraped off of the plate and counted to provide quantitative information. Each of these steps can be enhanced using the following protocols.
Protocol 2.2.1a
Autoradiography and LSC with TLC Plates
A. Autoradiography (Fluorography)
After the plate has been developed, spray twice with National Diagnostics’ Autofluor and allow the plate to dry. This impregnates the plate with phosphors, which will convert the β emissions to more readily detectable photons. Autofluor enhances the speed and sensitivity of detection when the plate is placed on film. For details on autoradiography procedures, see Electrophoresis Theory, Section 4.1.3.
B. Liquid scintillation counting of scraped TLC silica
Option 1: Suspend the silica powder in 10ml of a cocktail which has a gel phase with water such as National Diagnostics’ Hydrofluor. Shake well, and add 3ml H2O. Shake until gel forms, and count.
Option 2: Suspend the silica in 10ml of an organic based (non-emulsion) cocktail such as National Diagnostics’ Ecoscint O. Add 0.5-1g finely divided silica thixotrophic agent to form a clear gel in the solution, keeping the TLC particles suspended. Count as usual.
Protocol 2.2.2a
Counting Samples on Cellulose-Ester Filters
Do not dry the filters, because this will slow the dispersion process. If a filter has dried, dampen it with 1-2 drops of distilled water.
1. Place damp filter with sample into 10ml of National Diagnostics’ Filtron X.
2. Allow to stand at room temperature for 15 minutes. Shake well and count.
2.2.2 Counting Samples on Cellulose-Ester FiltersA common radiotracer technique is to precipitate macromolecules (protein & DNA) with TCA or some other strong denaturant, collect the precipitate on a filter and count it. Often such procedures give variable results, depending upon the degree to which the sample disperses from the filter into the cocktail. A typical artifact is counts which rise over time as more material dissolves off of the filter. It is possible to avoid these artifacts by using a cocktail which dissolves the filter, reproducibly releasing all of the sample for counting.
Figure 2.2a : The well-dispersed sam-ple on the right achieves 4π counting geometry, while half of the counts with the sample on the right are lost due to absorption and attenuation of emissions by the filter paper.
Autofluor LS-315National Diagnostics’ autoradiographic image intensifier, Autofluor, is a water based phos-phor yielding superior results to PPO-DMSO. (pg. 146)
Ecoscint O LS-274 Ecoscint O is a biodegradable scintillation fluid designed to count non-aqueous (organic soluble) samples. (pg. 131)
Autoradiography and Scintillation Counting with TLC Plates
Hydrofluor LS-111 High performance scintillation fluid with a tradi-tional solvent base, Hydrofluor offers a gel phase option for counting particulate samples. (pg. 133)
Filtron-X LS-201 A complete scintillation fluid Filtron-X solubilizes cellulose acetate, cellulose nitrate and mixed ester filter disks assuring homogeneous count-ing. (pg.141)
Counting Samples onCellulose Ester Filters
2.2.3 Counting Tissue SamplesSamples of animal or plant tissue are rarely thin or small enough to allow for full counting efficiency. Homogenization of such samples will allow them to be dispersed into a cocktail, but processing large numbers of radioactive samples by homogenization is not practical. To allow for ef-ficient and consistent counting of tissue samples, tissue solubilizers have been developed. These products contain strong denaturants and other agents, which can dissolve tissues at moderately elevated temperatures.
Protocol 2.2.3a
Counting Tissue Samples
BIOSOL/BIOSCINT
1. Place up to 200 mg of tissue, or 1 ml of blood, in a glass scintillation vial. Ground or minced tissue will dissolve more rapidly. Avoid adhesion of the sample to the bottom of the vial, as this will extend the digestion time.
2. Add 1 ml of Biosol. Agitate gently (do not vortex).
3. Incubate in shaking water bath at 50°C for 1-4 hours, until clear.
4. If necessary (for blood or other pigmented samples) decolorize with 0.2 ml of 30% H2O2. Cap loosely and incubate at 50°C 1 hour.
5. Cool to room temperature, add 10 ml of Bioscint and count.
SOLUSOL
The measurement quantities below are scaled for counting in 20ml scintillation vials. They may be scaled down for smaller vials.
1. Place up to 200mg of tissue, or 1 ml of blood, in a glass scintillation vial. Ground or minced tissue will dissolve more rapidly. Avoid adhesion of the sample to the bottom of the vial, as this will extend the digestion time.
2. Add 1ml of Solusol. Agitate gently (do not vortex).
3. Incubate at 50oC for 1-2 hours, or at room temperature for 3-5 hours, until clear.
4. Add 1ml of methanol to make the bubbles disappear.
5. If necessary (for blood or other pigmented samples) decolorize by adding 3 drops of H2O2 and leave samples at room temperature for one hour.
6. Add 15ml of Soluscint XR and leave overnight before counting.
Biosol LS-310Bioscint LS-309Together, Biosol and Bioscint form a non-hazardous, biodegradable tissue solubilizer and scintillation system. The combination eliminates chemiluminescence and renders the mixture nonhazardous. (pg.140)
Products for Counting Tissue Samples
Solusol LS-311Soluscint XR LS-314Solusol is National Diagnostics’ traditionally formulated solubilizer. Soluscint XR is the scin-tillant designed for use with samples solubilized by Solusol. (pp. 140-141)

158
LSC Concepts - Applications of Liquid Scintillation Counting
USA: 1-800-526-3867EUROPE: 441 482 646022
LSC
LSC
App
licat
ions
4. Place gel directly onto filter paper and dry under heat (80°C) and vacuum.
5. Expose at -80°C. 24 hours is generally sufficient for 14C or 3H samples, although up to 72 hours may be required for maximum detection of 3H.
DISSOLUTION AND COUNTING OF GEL SLICES
1. Using the autoradiography film as a template, cut out the band(s) of interest.
2. To every 100mg of gel, add 0.5ml 30% H2O2.
3. Incubate in a LSC vial at 50°C until digested (1-4 hours).
4. Heat at 37°C for one additional hour to drive off residual O2.
5. Cool, add 10ml of a scintillation cocktail capable of holding 0.6ml of aqueous material (such as Ecoscint H) and count.
2.3 Flow Liquid ScintillationRadiolabeled materials are often analyzed by chromatography. The original application of liquid scintillation counting to chromatographic techniques was to collect and count discrete fractions. This manner of counting is extremely laborious, and resolution is limited by the size of the fractions collected. Flow detectors were introduced to allow con-tinuous LSC monitoring of column effluents. This gives extremely high resolution results that are simultaneous with the separation. Modern flow detectors also have a switchable outflow, allowing radioactive peaks in the chromatogram to be collected for further analysis, or simply to sequester radioactive from nonradioactive waste.
2.2.4 Counting 14CO2
Prior to the introduction of liquid scintillation counting, a primary route of radiotracer analysis was to combust the organic material and detect the 14CO2 so generated in a gas phase proportional count-er. Many protocols still call for combustion and 14CO2 counting, and many metabolic studies require quantitation of 14CO2 exhaled by tracer-fed animals. 14CO2 is assayed by trapping it in a liquid phase as a complex with a strong base (carbamate) and then counting the liquid phase.
Protocol 2.2.4a
Counting 14CO2
OXOSOL C14
This is a single solution containing both carbamate and scintillators. Gas containing 14CO2 is shaken with the cocktail or bubbled through with a sparger. It is advisable to extract the gas with a second volume of solution to ensure capture of >90% of the 14CO2 . Cap the vials and count.
CARBAMATE-1 + OXOSOL 306
In this system, the carbamate is provided as a separate solution, which may enhance capture efficiencies. Shake or bubble the gas with 1ml of carbamate. Add 10ml of Oxosol 306 and count.
Figure 2.2.4a: Bubbling 14CO2 through carbamate traps the gas in the liquid phase, yielding a suitable sample for liquid scin-tillation counting.
Oxosol C14 LS-211Oxosol C 14 is a complete scintillator designed to absorb and count 14CO2 produced by sample combustion. (pg.139)
Oxosol 306 LS-231 Complete scintillation counting solution specifically formulated to count 14CO2 samples trapped in Carbamate. (pg.139)
Products for Counting 14CO2
Carbamate-1 LS-241 Carbamate-1 is a high-capacity CO2 absorber intended to be used in conjunction with Oxosol 306. One (1) ml absorbs 5.8mM CO2 at satu-ration. (pg.139)
2.2.5 Samples in Polyacrylamide GelsComplex radioactive samples are often fractionated on polyacrylamide gels. Analysis of radiolabeled samples in electrophoretic gels follow the same pattern as that on TLC plates. The gel is analyzed as a whole for radioactive bands, which are then excised and counted to obtain quanti-tative results. Autofluor, described in Section 2.2.1 for TLC plates, is also excellent for enhancing autoradiography of PAGE Gels (Electrophoresis Theory, Section 4.1.3). Once bands are located and excised, they can be dissolved using hydrogen peroxide and then counted efficiently.
Protocol 2.2.5a
Counting Samples in Polyacrylamide Gels
AUTOFLUOR FLUOROGRAPHY OF ELECTROPHORESIS GELS
1. Stain and fix gel as usual.
2. Rinse gel for 15 minutes in deionized water to remove fixative.
3. Immerse the gel in Autofluor. Agitate gently for 30 minutes per mm of gel thickness. Pour off the Autofluor and retain for future use. LABEL AS RADIOACTIVE MATERIAL!
c o n t i n u e d
Scintillationfluid from HPLC
Pump
Mixing chamber
Flow cell
Waste
PMT 1PMT 2
Coincidence filterRatemeter circuitData SystemChart Recorder
Figure 2.3a HPLC Flow Detector
Flow detectors operate by passing a mixture of column effluent and scintillation cocktail through a transparent or translucent channel, which is monitored by a photomultiplier tube. The flow rates of effluent and cocktail are metered to provide a constant ratio, and the channel (gener-ally a plastic tube) is coiled to cover the entire window area of the PMT, (see figure 2.3a). Cocktails for flow LSC must provide for high efficiency, high sample capacity, and low viscosity. High efficiency allows for more sensitive detection, and minimizes any decrease in signal due to sample composition or detector geometry. The sample capacity is important because flow LSC tends to generate surprising amounts of waste materials. A typical HPLC flow rate is 1ml/min. Over an 8 hour day, continuous use of such a system will generate 1 X 60 X 8=480ml of spent solvent. If a low capacity cocktail is used (one which requires 10 volumes of cocktail per volume of sample), up to 5 liters of waste will be produced. Use of a high capacity cocktail (3:1 or 2:1) will reduce this amount by up to 70% and keep disposal costs under control. Because of the large amounts of cocktail used, switching of labeled peaks to a separate waste collection and using a biodegradable cocktail are recommended.

159159
LSC Concepts - Applications of Liquid Scintillation Counting
USA: 1-800-526-3867EUROPE: 441 482 646022
LSCLS
C A
pplications
2.4 Liquid Scintillation and Radiation Safety
Working with radioactive isotopes requires diligent attention to safety measures, in order to avoid hazardous exposure(s). Because radioac-tivity cannot be detected without instrumentation, spills can easily be spread through and even out of the lab before they are noticed. Safety in radioisotope work requires sufficient attention to both containment and surveillance. Containment measures are designed to prevent the release of isotopes in unprotected areas. Surveillance aims to detect such accidental releases as rapidly as possible to prevent the spread of contamination.
Containment and MonitoringContainment measures are taught in radiation safety courses. A brief summary is presented here, which is not intended as a substitute for such a course. The primary safeguard against radioactive spills is com-mon sense. Radioactivity should be handled only in designated areas, which should be covered with disposable absorbent pads. Droplets of radioactive solutions will be absorbed and trapped by the pads, which are then disposed of as solid radioactive waste. Users of radioactivity must wear lab coats, gloves and eye protection. Gloves should be mon-itored with a Geiger counter if the isotope emissions are detectable by this means. In any case, frequent changing of gloves if contamination is detected or suspected will keep exposure to a minimum. Shielding should be used for 125I and 32P work, or for any isotope whose emissions can penetrate skin, but it is important to keep in mind that the primary long term danger from radioactive components is through ingestion or skin absorption. Eating or drinking or even chewing gum must be excluded from radioactive use areas.
Surveillance begins with personal dosimeters and Geiger counters. Dosimeters are most often film badges and film rings. These are worn during radioactive experiments, and the film contained within them is
Table 2.3a
Applications of National DiagnosticsFlow Scintillation Cocktails
CocktailSample Capacity
(ml /10ml cocktail) Applications
Monoflow 1Order # LS-281
Monoflow 2Order # LS-282
Monoflow 3Order # LS-283
Monoflow 4Order # LS-284
Biode-gradable
Monoflow 5Order # LS-285
Uniscint BDOrder # LS-276
N/A
3
5
3
3
3
Organic effluents. Lipid and steroid separations.
Routine low salt aqueous efflu-ents (<200mM salt)
Routine low salt aqueous effluents. Higher sample holding capacity than Monoflow 2
High salt aqueous samples. Can accommodate 2M salt gradients.
Biodegradable cocktail for rou-tine low salt aqueous samples (<200mM salt)
Biodegradable cocktail for high salt aqueous samples. Can accommodate up to 2M salt gradients.
Ecoscint FlowOrder # LS-288
10 All purpose scintillation fluid for a wide range of sample types. Ultra-high sample hold.
exposed by the emissions which affect the worker. A correlation between film exposure and worker exposure allows the detection of dangerous levels of radiation in the lab. Radiation safety departments also use film badges to ensure that no user exceeds their long term exposure limits in a given year. Short term monitoring of exposure to high-energy emissions can be done with a Geiger counter, which detects the ionization of a gas in a sealed tube. Only those emissions which are energetic enough to penetrate the tube can be detected: 32P and the highest energy emissions from 35S. Geiger counters can be invaluable for checking gloves for contamination during the course of an experiment.
Wipe TestingOnce an experiment is finished, a comprehensive and sensitive check of all work areas is required. This is accomplished by use of “wipe tests.” A 4 cm2 piece of paper or other absorbent material is rubbed vigorously over the work area, placed in scintillation cocktail and counted. If counts above background are detected, the contaminated area is subdivided and the divisions wipe tested. Contaminated areas are cleaned and retested until no contamination can be detected.
The type of filter used in wipe testing has a marked effect on the reliabil-ity of the results obtained. Often standard filter paper discs are used. Such discs generally adhere to the side or the bottom of the scintillation vial. If the vial is placed in the counter such that the filter is on the side facing the photomultiplier tube, much of the light emitted by the cocktail will be absorbed by the filter. This will give artificially low numbers of counts, measuring contaminated areas as clean. This hazard is avoided by the use of a wipe which dissolves in the scintillation cocktail such as National Diagnostics’ Nuc-Wipes.
Efficient and effective cleaning of spills requires some knowledge of the chemical nature of the labeled compound. Water soluble materials will come off of nonabsorbent surfaces with detergent solutions. Hydro-phobic compounds require the use of higher detergent concentrations. Extremely hydrophobic compounds or absorbent surfaces may require the use of organic solvents. If an unknown sample is spilled (spent culture medium, cellular extracts, etc.), a general purpose radioactive decontamination agent should be tried, such as National Diagnostics’ Nuclean, followed by solvents if necessary.
Figure 2.4b Nuc-Wipes eliminate the dependence of results on the direction of the filter paper and time. Because Nuc-Wipes dissolve in scintillation fluid, there is no intact filter to ab-sorb or attenuate beta emissions. 4π counting efficiency is achieved, giving reproducible results.
Figure 2.4a Using intact filters for environmental wipe tests can give inaccurate, erratic results. β particles originating from particles on intact filters are attenuated and absorbed by the filter. Furthermore, depending on the relative affinity of the material for the solution, as material leaves the filter for the solution, counts change over time.
Nuc-Wipes NW-300 Nuc-Wipes are dissolvable wipe test pads, soluble in any scintillation solution. Because Nuc-Wipes dissolve completely, full 4π count-ing occurs, eliminating the lost counts due to absorption by the filter, enhancing counting efficiency and reproducibility. (pg.143)
Products for Radiation Safety
Nuclean NC-200 Nuclean is a concentrated, economical and highly efficient solution for safe and fast removal of radioactivity from laboratory glassware, equipment and laboratory surfaces. It is also a superior general laboratory cleaner and degreaser. (pg.142)

160
LSC Concepts - Troubleshooting
USA: 1-800-526-3867EUROPE: 441 482 646022
LSC
Trou
bles
hoot
ing
Sample OverloadExceeding the sample holding capacity of a scintillation cocktail will yield unpredictable results. The mixture will become opaque, with most photons being lost to internal reflectance. Phase sep-aration may occur, which can increase or decrease counts depending on how the sample partitions.1) Sample composition: The salt content, pH, protein content, etc., of a sample will determine the amount of cocktail needed to provide a clear, countable emulsion. Samples above 0.5M salt, or with pH < 4 or pH > 10 will generally require more cocktail.2) Temperature: Sample/cocktail emulsions have a range of temperature in which they remain clear and countable. This range narrows as the sample volume approaches the cocktail holding capacity. The heat of mixing associated with adding sample to the cocktail can cause sample/cocktail mixtures which are initially clear to cloud on standing, leading to a drop in counting efficiency. Addition of more cocktail will restore a clear solution.3) Phase separation: The opaque solution generated by sample overload may separate into two phases on standing. If the sample molecules partition into the organic phase, this can increase efficiency. However, because this is a slow process, the effect is unpredictable, and manifests as erratic counting from sample to sample.4) Standard curves: It is important to plan standard curves so that the sample capacity is not approached, to ensure that the efficiency is the same for all points.
QuenchingScintillator light emissions can be absorbed by colored sample components (color quenching). In addition, the energy from radioactive emissions can be trapped by sample components before it reaches the cocktail phosphors (chemical quenching). In both cases, total counts are reduced, and the ratio of high to low energy counts is decreased.1) Color quenching: Samples which absorb light at 350-450nm will attenuate the light emitted from the phosphors. In general, samples which appear yellow or brown will be quenched to some extent. Quenching shifts counts from high to low energy- a shift in the ratio of high and low channels is diagnostic. Samples can be bleached with hydrogen peroxide, taking care to remove the residual oxygen, which is a chemical quencher (see (2), below).2) Chemical Quenching: Many chemicals are able to intercept the energy from a radioactive emission event before it can be converted to light. The effect is the same as color quenching: lower counts, and proportionally more low energy counts. Water can be a chemical quencher. To ensure consistent efficiency, all samples should have the same amount of water added. Molecular Oxygen is another quenching agent, it can be removed by warming the sample to degas it. Organic compounds containing oxygen (i.e. aldehydes and alcohols), or halogens (e.g. chloroform) are generally strong chemical quenchers. Such samples should be counted in as dilute a solution as possible, to minimize the quenching effect.
Counting GeometryParticulate samples, or samples bound to a solid support, will have some emission events which are absorbed by the solid be-fore reaching the cocktail. This can reduce efficiency by as much as 50%.1) Particulate samples: Insoluble powders must be suspended in a cocktail which forms a gel, to avoid changes in counts as the particles settle.2) Samples on solid support: For TLC plate scrapings, see (A) particulate samples, above. Samples bound onto modified cellulose filters, use Filtron-X to dissolve the filter. For glass fiber filters, use a cocktail which will dissolve the sample components, and allow sufficient time and mixing for complete elution. Be sure filter is not in the path of the PMT.
Symptom Diagnosis
Chemiluminescenceand Static ElectricityLight emission from cocktails can be stimulated by static electricity or chemically excited mole-cules. Such emissions are relatively short lived.1) Chemiluminescence: Caused by reactions which generate chemically excited products, its lifetime is limited by the amount of substrate in the sample. Samples should be recounted repeatedly until a stable result is obtained. Alkaline samples are particularly susceptible; neutralization can minimize the problem.2) Static electricity: Static buildup, particularly on plastic vials, can cause bursts of light emission, giving wildly erratic counts. Run water over the vial, or wipe with an antistatic dryer sheet.
A B
C D
Counts increase with time
Counts decrease with time
Erratic counting- recounting gives inconsistent results
Low efficiency- solid samples
Standard curve not linear
Low efficiency- liquid samples
Low efficiency- sample on filter
Troubleshoot ing L iqu id Sc in t i l la t ion Exper iments
Sample not fully separated from solid support (B-2) or solid sample not fully dispersed/dissolved in cocktail (B-1).
Static electricity (C-2), sample overload (A-2,3), or solid sample settling out of cocktail (B-1).
Color Quenching (D-1), chemical quenching (D-2), or sample overload (A-1).
Sample not eluted from filter (B-2), filter blocking PMT window (B-2), or quenching (D-1,2).
Chemiluminescence (C-1) or sample overload (A-2,3).
Sample not fully dispersed or dissolved (B-1).
Sample overload (A-4).

161
LSC Concepts - Troubleshooting
USA: 1-800-526-3867EUROPE: 441 482 646022
LSCU
seful Information
Useful Information for Liquid Scintillation Counting
Radioisotopes: Decay Products and Energies
Isotope EmissionEnergy(MeV)
Tritium (3H)
Carbon (14C)
Sulfur (35S)
Phosphorus (32P)
Phosphorus (33P)
Iodine (125I)
β
β
β
β
β
γ
half life (t1/2)
0.019
0.156
0.167
1.710
0.249
0.178
12.3 yrs
5730 yrs
87.2 days
14.3 days
25.3 days
59.9 days
Radioisotopes: Range of Emissions
Isotope Air Water
Tritium (3H)
Carbon (14C)
Sulfur (35S)
Phosphorus (32P)
Phosphorus (33P)
0.6
24
26
800
50
Plexiglass
-
0.28
0.3
1
0.6
-
0.23
0.25
0.8
0.5
Maximum Range in material (cm)
Units of Radioactivity
1 Becquerel(Bq) = 1 disintegration per second (dps) = 60 disintegrations per minute (dpm)
1 Curie(Ci) = 3.7 X 10¹⁰ disintegrations per second = 2.2 X 10¹² disintegrations per minute
Half-life (t1/2) Calculations
t1/2(half life) = the time required for 1/2 of the atoms present to undergo decay.
λ (decay constant) = 0.693/t1/2
N = N0e-λt
where: N= number of atoms remaining at time t N0=number of atoms at start (t=0)
Suggested Reading in Liquid Scintillation Counting
General ResourcesSchimel, David S. (1993) Theory and Application of Tracers. Academic Press.Knoche, H.W. (1991) Radioisotopic Methods for Biological and Medical Research Oxford University Press, NY. Slater, R.J. (ed) (1990) Radioisotopes in Biology - A Practical Approach. Oxford University Press.Coleman, David C and Fry, Brian, (eds) (1991) Carbon Isotope Techniques. Academic Press.Ehmann, Wm. D. and Vance, Diane E. (1991) Radiochemistry and Nuclear Methods of Analysis. J. Wiley & Sons.
Types of Radioactive EmissionBrowne, E. and Firestone, R.B. (1986) Table of Radioactive Isotopes. V.S. Shirley, ed. Wiley, NY.Weast, R.C. (1988) Handbook of Chemistry and Physics 69th edition. CRC Press, Boca Raton.
Slack, L. and Way, K. (1959) Radiations from Radioactive Atoms in Frequent Use. U.S. Atomic Energy Commission Report.
Ionization DetectionWilkinson, D.H., (1950) Ionization Chambers and Counters. Cambridge University Press, Cambridge, UK.
Liquid Scintillation CountingHorrocks, D.L. (1974) Applications of Liquid Scintillation Counting. North Holland, AmsterdamBirks, J.B. (1964) The Theory and Practice of Scintillation Counting. Per-gammon Press, Oxford, UK.
Liquid Scintillation Signal InterpretationVerrezen, V. and Hurtgen, C., (2000) A multiple window deconvolution technique for measuring low-energy beta activity in samples contaminated with high-energy beta impurities using liquid scintillation spectrometry. Appl. Rad. and Isotopes 53 (2000) 289-296.

Electro-Optical Grade Solvents
162 USA: 1-800-526-3867EUROPE: 441 482 646022
Elec
tro-
Opt
ical
Solv
ents
To reduce the environmental impact and occupational health and safety haz-ards associated with toxic organic clearants in the laboratory and in industry, National Diagnostics developed its original, award-winning OptiClearTM cleaning solvent. As a result of ever growing demand for safe products for cleaning optical and electronic components, National Diagnostics expanded the OptiClear product line to include an array of lower hazard solvents.
Electro-Optical Grade Solvents
O p t i C l e a r Sample Kits
Flash Point 120oF 142oF 45oF 147oF 177oF 199oF
Non-Toxic
Biodegradable
Food Grade
Evaporation Rate 0.4 2.0 1.6 0.04 0.0 0.06
No Residue
Water Miscible
Low Odor citrus
Non-Conductive < 5µS/cm < 5µS/cm < 5µS/cm < 5µS/cm < 5µS/cm < 5µS/cm
pH (aqueous extraction) Neutral Neutral Neutral Neutral Neutral Neutral
Water Content (ppm) < 50 N.A. < 100 < 100 < 100 < 500
Kauri-Butanol 62.7 0 29 27 27 > 200
Color APHA < 50 < 50 < 50 < 50 < 50 < 50
Boiling Point 350oF 180oF 244-284oF 376-401oF 424-484oF 396oF
Refractive Index 1.47 1.34 1.4041 1.4276 1.4372 1.469
Vapor Pressure (mm Hg) 6 @ 77oF 58 @ 100oF 36 @ 68oF 1.0 @ 68oF 0.1 @ 68oF 0.5 @ 77oF
Specific Gravity 0.84 @ 25oC 0.94 @ 25oC 0.72 @ 16oC 0.77 @ 16oC 0.79 @ 16oC 1.026 @ 25oC
Viscosity (cps) 6 @ 25oC 0.5 @ 25oC 6 @ 25oC 2.0 @ 25oC 3.4 @ 25oC 1.5 @ 25oC
Solids > 0.2µm Nil Nil Nil Nil Nil Nil
Abrasives None None None None None None
Wax, Pitch, Flux Some Inorganic Pitch, Flux, Pitch, Flux Pitch, Flux, Flux, OilDissolves Grease, Tar, Salts, Oil Oil, Grease Oil, Grease Oil, Grease Grease Polystyrene Grease
OptiClear OptiClear OptiClear OptiClear OptiClear OptiClear R E S S2 W OE-101 OE-102 OE-104 OE-105 OE-107 OE-106
(N-Butyl Acetate = 1)
T h e O p t i C l e a r S o l v e n t s
Sample Kit II OE-109
1 Liter of Each of OE-101, OE-102, OE-104, OE-105, & OE-106
Sample Kit I OE-108
1 Liter of Each of OE-101, OE-102, OE-105, & OE-106
TM
TM

163
Electro-Optical Grade Solvents
USA: 1-800-526-3867EUROPE: 441 482 646022
163
Electro-Optical
Solvents
OptiClear is National Diagnostics’ original, award winning, nontoxic, non-flammable, biodegradable solvent. OptiClear is intended for the removal of wax, pitch, flux, grease, resin and solvent soluble resists from optical and electronic components of glass, ceramic, or metal.
OptiClear may be substituted directly for toluene, xylene or chlorinated hydrocarbons, such as trichloroethylene (TCE), in batch-type or ultrasonic cleaners with no alteration in protocol. OptiClear removes wax adhered to lenses, optical components, polished wafers or printed circuit boards.
OptiClear has high solvency power, yet it will not affect metal or metal alloy. OptiClear also has a neutral pH, so it will not stain glass. OptiClear’s water content is less than 50 ppm. It is miscible in all proportions with acetone, ethanol, and isopropanol, any of which may be used as a post wash.
Since OptiClear is 100% natural, food grade material, it is biodegradable and not categorized as a hazardous waste.
Non-ToxicElectro-Optical GradeBiodegradableNon-Ozone Depleting
Dissolves Wax, pitch, grease, tar and polystyrene.
Will not affectMetal and metal alloy; glass and ceramic; inorganic crystal; phenolics, epoxy, melamine, alkydes, and fiberglass.
Will moderately affectPolyethylene (swells on long exposure but will not dissolve).
METHOD1. Use undiluted.2. Set up an OptiClear bath at room temperature. Soak components for 15 minutes to 1 hour. For lighter
cleaning applications, OptiClear can be used as a spray.3. Remove components from bath and allow OptiClear to evaporate.4. If excessive residue remains, rinse in OptiClear R (OE-102)
OptiClear
APPLICATIONS
l
l
l
l
Opticlear OE-101 16 oz. spray bottle 1 gallon(1-3) 1 gallon(4+) 5 gallon drum 55 gallon drum
Product Name Cat. No. Size
Safety InformationWith a flash point in excess of 141oF (TCC), OptiClear R, OptiClear S, and OptiClear W all exceed the requirements for classification as a nonflammable solvent by the U.S. Department of Transportation, the U.S. Environmental Protection Agency, and the National Fire Protection Association.
Note that the “nonflammable” designation of OptiClear products does not mean that the material cannot be made to burn. It means only that OptiClear products will not ignite as readily, or burn with the intensity or violence of flammable liquids such as xylene.
OptiClear products are intended to dissolve paraffins and fats. Therefore, to prevent drying of the skin, avoid direct contact with the skin. Avoid contact with eyes as well as unnecessary inhalation of vapors. In case of contact with eyes, wash with large quantities of water.
The information contained herein is based on the data available to us and is believed to be correct. However, National Diagnostics makes no warranty expressed or implied regarding the accuracy of this data or the results to be obtained from the use thereof. Na-tional Diagnostics assumes no responsibilities for injury from the use of the products described herein.
TM

Electro-Optical Grade Solvents
164 USA: 1-800-526-3867EUROPE: 441 482 646022
Elec
tro-
Opt
ical
Solv
ents
OptiClear R is nonflammable, biodegradable, water-based solvent intended as an acetone replacement for cleaning optical and electronic components. OptiClear R is nonconductive, and can be used to rinse away oily film and light grease from glass, ceramic or metal without leaving any residue. OptiClear R is non-aggressive and does not attack metal, glass or plastic.
OptiClear E is an odorless cleaning solvent for optical and electronic com-ponents. OptiClear E is our fastest evaporating OptiClear formulation, and it leaves no residue. This eliminates the need for a post wash. OptiClear E is also nonconductive. OptiClear E can be used to remove wax and pitch; however, the necessary soaking time is longer than that required for the original OptiClear.
Dissolves Pitch, flux, oil and grease.
Will not affectMetal and metal alloy; glass and ceramic; phenolics, epoxy, melamine, alkydes, and fiberglass.
METHOD1. Use undiluted.2. Set up an OptiClear E bath at room temperature and soak components for 15 minutes to 1 hour. Heating
is not recommended. For lighter cleaning applications, OptiClear E can be used as a spray.3. Remove components from bath and allow OptiClear E to evaporate.4. OptiClear E does not leave a residue, so a post-rinse is not necessary.
OptiClear S is a nonflammable, odorless degreaser that removes light oil from optics and electronics components. OptiClear S is nonconductive and leaves no residue. OptiClear S can also be used to remove wax and pitch; although the necessary soaking time is longer than that required for the original OptiClear. OptiClear S has a higher flash point and evaporates more slowly than OptiClear E.
Dissolves Pitch, flux, oil, and grease.
Will not affectMetal and metal alloy; glass and ceramic; phenolics, epoxy, melamine, alkydes, and fiberglass.
METHOD1. Use undiluted.2. Set up an OptiClear S bath and warm to 100OF. Keep product away from sparks
and flame. Soak components for 15 minutes to 1 hour. For lighter cleaning applications, OptiClear S can be used as a spray.
3. Remove components from bath and allow OptiClear S to evaporate.4. OptiClear S does not leave a residue, so a post-rinse is not necessary.
OptiClear SSAFE
OptiClear E EVAPORATES FAST
OptiClear RRINSE
APPLICATIONS
APPLICATIONS
OptiClear R OE-102 16 oz. spray bottle 1 gallon bottle (1-3) 1 gallon bottle (4+) 5 gallon drum
Product Name Cat. No. Size
OptiClear E OE-104 16 oz. spray bottle 1 gallon bottle(1-3) 1 gallon bottle(4+) 5 gallon drum
Product Name Cat. No. Size
OptiClear S OE-105 16 oz. spray bottle 1 gallon bottle (1-3) 1 gallon bottle (4+) 5 gallon drum 55 gallon drum
Product Name Cat. No. Size
TM
TM
TM

165
Electro-Optical Grade Solvents
USA: 1-800-526-3867EUROPE: 441 482 646022
165
Electro-Optical
Solvents
OptiClear S2 is a nonflammable, odorless degreaser that removes light oil from optics and electronics components. OptiClear S2 is nonconductive and leaves no residue. OptiClear S2 can also be used to remove wax and pitch; however, the necessary soaking time is longer than that required for OptiClear Original. OptiClear S2 has a higher flash point than OptiClear S but evaporates more slowly than OptiClear S.
METHOD1. Use undiluted.2. Set up an OptiClear S2 bath and warm to 130OF. Keep product away from sparks and flame. Soak
components for 15 minutes to one hour. For lighter cleaning applications, OptiClear S2 can be used as a spray.
3. Remove components from bath and allow OptiClear S2 to evaporate.4. OptiClear S2 does not leave a residue, so a post-rinse is not necessary.
OptiClear W is a nonflammable, biodegradable solvent intended to remove grease and oil from optical and electronic components. OptiClear W is miscible in all proportions with water. This eliminates the need for a solvent dip, since water can be used as a post wash.
Dissolves Flux, oil, and grease.
Will not affectMetal and metal alloy; glass and ceramic; phenolics, epoxy, melamine, alkydes, and fiberglass.
METHOD1. Use undiluted.2. Set up an OptiClear W bath at room temperature and soak components for 15 minutes to one hour.
OptiClear W can also be warmed to 140OF. For lighter cleaning applications, OptiClear W can be used as a spray. Keep product away from sparks and flame.
3. Remove components from bath and allow OptiClear W to evaporate.4. If excessive residue remains, rinse with water.
Dissolves Pitch, flux, oil, and grease.
Will not affectMetal and metal alloy; glass and ceramic; phenolics, epoxy, melamine, alkydes, and fiberglass.
OptiClear S2HIGH FLASH POINT
OptiClear WWATER
APPLICATIONS
APPLICATIONS
Opticlear W OE-106 16 oz. spray bottle 1 gallon (1-3) 1 gallon (4+) 5 gallon drum
Product Name Cat. No. Size
Opticlear S2 OE-107 16 oz. spray bottle 1 gallon bottle (1-3) 1 gallon bottle (4+) 5 gallon drum
Product Name Cat. No. Size
TM
TM

Inde
x of
Prod
ucts
166 USA: 1-800-526-3867EUROPE: 441 482 646022
Product Name Cat. No. Pack Size Page
How to Order - USAToll - Free Phone: 800-526-3867Telephone: 404-699-2121 Order by Fax: 404-699-2077Order on the Web: www.nationaldiagnostics.comE-mail: [email protected]
Alphabetical Product Index
Product Name Cat. No. Pack Size Page
AccuGel 19:1 (30%) EC-849 450 ml 13AccuGel 19:1 (40%) EC-850 1 1iter (1-3) 6AccuGel 19:1 (40%) EC-850 1 liter (4 +) 6AccuGel 19:1 (40%) EC-850 450 ml 13AccuGel 19:1 (40%) EC-850 1 1iter (1-3) 6AccuGel 19:1 (40%) EC-850 1 liter (4 +) 6AccuGel 29:1 (30%) EC-851 450 ml 8, 13AccuGel 19:1 (40%) EC-850 1 liter (1-3) 6AccuGel 19:1 (40%) EC-850 1 liter (4 +) 6AccuGel 29:1 (40%) EC-852 450 ml 8, 13AccuGel 29:1 (40%) EC-852 1 liter (1-3) 6AccuGel 29:1 (40%) EC-852 1 liter (4 +) 6
AcrylaGel EC-810 450 ml 9, 13AcrylaGel EC-810 1 liter (1-3) 7AcrylaGel EC-810 1 liter (4 +) 7
Acrylamide EC-201 100 gram 30Acrylamide EC-201 500 gram 30Acrylamide EC-201 1 kilogram 30
Alcian Blue HS-504 25 gram 105
Amido Black 10B HS-601 25 gram 21,105
Ammonium Persulfate EC-504 25 gram 30Ammonium Persulfate EC-504 100 gram 30
AquaPor 3:1 EC-206 25 gram 15AquaPor ES EC-203 100 gram (1-3) 9AquaPor ES EC-203 100 gram (4 +) 9
AquaPor ES EC-203 25 gram 15AquaPor ES EC-203 100 gram (1-3) 9AquaPor ES EC-203 100 gram (4 +) 9
AquaPor HR EC-205 25 gram 15AquaPor HR EC-205 100 gram (1-3) 9AquaPor HR EC-205 100 gram (4 +) 9
AquaPor LE EC-202 25 gram 14AquaPor LE EC-202 100 gram (1-3) 8AquaPor LE EC-202 100 gram (4 +) 8AquaPor LE EC-202 500 gram 8
AquaPor LM EC-204 25 gram 14AquaPor LM EC-204 100 gram (1-3) 8AquaPor LM EC-204 100 gram (4 +) 8
Autofluor LS-315 1 liter (1-3) 28, 144Autofluor LS-315 1 liter (4 +) 12
Basic Fuchsin HS-518 25 gram 105
BBQ SFC-13 1 gram 145BBQ SFC-13 5 gram 201
Betafluor LS-151 4 liter (1-3) 133Betafluor LS-151 4 liter (4 +) 191
Biebrich Scarlet HS-506 25 gram 105
Bioscint LS-309 4 liter (1-3) 138Bioscint LS-309 4 liter (4+) 194
Biosol LS-310 400 ml 138
Bis (Methylene Bis-Acrylamide) EC-301 25 gram 30
Bis-AcrylaGel EC-820 450 ml 9, 13Bis-AcrylaGel EC-820 1 liter (1-3) 7Bis-AcrylaGel EC-820 1 liter (4 +) 7
Bis-MSB SFC-90 25 gram 145Bis-MSB SFC-90 100 gram 201
Boric Acid EC-609 500 gram 30
Bottle-top Dispenser LS-900 1 unit 143
Bromocresol Green HS-602 5 gram 28
Bromophenol Blue HS-603 10 gram 21,28,105
Butyl PBD SFC-20 25 gram 145Butyl PBD SFC-20 100 gram 200Butyl PBD SFC-20 500 gram 200
Calci-Clear HS-104 1 quart 100Calci-Clear HS-104 1 gallon 150Calci-Clear HS-104 5 gallon 150
Calci-Clear Rapid HS-105 1 quart 100Calci-Clear Rapid HS-105 1 gallon 150Calci-Clear Rapid HS-105 5 gallon 150
Carbamate-1 CO2 Absorber LS-241 450 ml (1-3) 137Carbamate-1 CO2 Absorber LS-241 450 ml (4 +) 196
Coomassie Blue G-250 HS-605 10 gram 22
Coomassie Blue R-250 HS-604 10 gram 22
DATD EC-303 25 gram 30
Denaturation Solution EC-875 1 liter (1-3) 19Denaturation Solution EC-875 1 liter (4 +) 18
Denhardt’s Solution (50X) EC-915 50 ml 18
Dextran Sulfate EC-877 50 gram 30Dextran Sulfate EC-877 250 gram 31
Diogenes CL-202 1 kit 120
Dithiothreitol (DTT) EC-601 1 gram 30Dithiothreitol (DTT) EC-601 5 gram 31
Ecoscint LS-271 4 liter (1-3) 129Ecoscint LS-271 4 liter (4+) 184Ecoscint LS-271 20 liter drum 184
Ecoscint A LS-273 4 liter (1-3) 128Ecoscint A LS-273 4 liter (4+) 182Ecoscint A LS-273 20 liter drum
Ecoscint Flow LS-288 4 liter (1-3) 134Ecoscint A LS-273 4 liter (4+)
20 liter drum 182
Ecoscint GL LS-262 4 liter 130
Ecoscint H LS-275 4 liter (1-3) 128Ecoscint H LS-275 4 liter (4+) 183Ecoscint H LS-275 20 liter drum
Ecoscint O LS-274 4 liter (1-3) 129Ecoscint O LS-274 4 liter (4+) 184Ecoscint O LS-274 20 liter drum 184
Ecoscint Ultra LS-270 4 liter (1-3) 126Ecoscint O LS-274 4 liter (4+) 184
Ecoscint XR LS-272 4 liter (1-3) 127Ecoscint A LS-273 4 liter (4+) 182
EDTA EC-610 100 gram 30Filtron-X LS-201 500 gram 195
EDTA, 0.5M Solution EC-900 1 liter 17
Eosin, 1% Solution HS-402 100 ml 104
Ethanol, Reagent (Denatured) HS-300 1 liter 30, 99Ecoscin, REA LS-273 4 liter Ecoscint A LS-273 20 liter
Extendable Delivery Jet LS-904 1 unit 143
Fast Green FCF HS-516 25 gram 105
Filtron-X LS-201 4 liter (1-3) 139Filtron-X LS-201 4 liter (4 +) 195
Formamide EC-608 200 ml 30Filtron-X LS-201 450 ml 195
GelDry Film 11 X 12 cm EC-612 50 sheets 29
GelDry Film 22.5 X 22.5 cm EC-622 50 sheets 29
Glass Bond EC-620 25 ml 29
Glass Free EC-621 450 ml 29
Glycerol EC-606 450 ml 31
Glycine EC-405 250 gram 31Glycine EC-405 1 kilogram 32
Hematoxylin, Harris’ HS-400 1 liter 104
Histo-Clear HS-200 1liter 98 1 gallon (1-3) 1 gallon (4+) Histo-Clear HS-200 5 gallon 148Histo-Clear HS-200 55 gallon 148
Histo-Clear II HS-202 1 gallon (1-3) 99 1 gallon (4+) Histo-Clear II HS-202 5 gallon 149Histo-Clear II HS-202 55 gallon 149
Histomount HS-103 100 ml (1-3) 103Histomount HS-103 100 ml (4+) 153Histomount HS-103 450 ml(1-3) 153Histomount HS-103 450 ml (4+) 153
Histosol HS-100 1 gallon 99Histosol HS-100 5 gallon 149153Hydrofluor LS-111 4 liter (1-3) 131Hydrofluor LS-111 4 liter (4 +) 186
Hydrogen Peroxide Assay Kit CL-204 100 Assay Kit 121
Hydromount HS-106 100 ml (1-3) 103Hydromount HS-106 100 ml (4+) 153
Insite Markers EC-897 1 Tube 25
Ion Exchange Resin EC-408 100 gram 29
Liquiscint LS-121 4 liter (1-3) 133Liquiscint LS-121 4 liter (4 +) 190Liquiscint LS-121 20 liter drum 190
Mercaptoethanol EC-603 50 ml 31
MESA Buffer (10X) EC-911 1 liter 18
MES-SDS Running Buffer (20X) EC-868 450 ml 16Urea EC-605 1 liter 33
Methyl Green HS-606 10 gram 105
Methylene Blue HS-525 25 gram 105
Mirsky’s Fixative HS-102 200 ml system 101Mirsky’s Fixative HS-102 2 liter system 151
Mirsky’s Fixative (ready-to-use) HS-101 1 gallon 101Mirsky’s Fixative (ready-to-use) HS-101 5 gallon 151
Monoflow 1 LS-281 4 liter (1-3) 138Monoflow 1 LS-281 4 liter (4+) 192Monoflow 1 LS-281 20 liter drum 192
Monoflow 2 LS-282 4 liter (1-3) 136Monoflow 2 LS-282 4 liter (4+) 192Monoflow 2 LS-282 20 liter drum 192
Monoflow 3 LS-283 4 liter (1-3) 136Monoflow 3 LS-283 4 liter (4+) 192Monoflow 3 LS-283 20 liter drum 192
Monoflow 4 LS-284 4 liter (1-3) 136Monoflow 4 LS-284 4 liter (4+) 193Monoflow 4 LS-284 20 liter drum 193
Monoflow 5 LS-285 4 liter (1-3) 135Monoflow 5 LS-285 4 liter (4+) 193Monoflow 5 LS-285 20 liter drum 193
Monofluor LS-191 4 liter (1-3) 132Monofluor LS-191 4 liter (4 +) 189,197
MOPS-SDS Running Buffer (20X) EC-867 450 ml 16Urea EC-605 1 liter 33
Naphthalene — Scintillation Grade SFC-40 100 gram 145Naphthalene — Scintillation Grade SFC-40 1 kilogram 200
ND Protein Precipitation Kit EC-888 1 kit 26
Neutralin HS-108 5 gallon pail 102
Neutralization Solution EC-876 1 liter (1-3) 18Neutralization Solution EC-876 1 liter (4 +) 18
Nuc-Wipes NW-300 1 box (1-9) (100/box) 141Nuc-Wipes NW-300 1 box (10+) (100/box) 202,230

Index ofProducts
167167USA: 1-800-526-3867EUROPE: 441 482 646022
Product Name Cat. No. Pack Size PageProduct Name Cat. No. Pack Size Page
How to Order - EUROPE
Phone: 44 (0) 1482 646020 or 44 (0) 1482 646022Fax: 44 (0) 1482 646013E-mail: [email protected]
Nuclean NC-200 1 quart 14003, 230Nuclean NC-200 1 gallon (1-3) 203, 230Nuclean NC-200 1 gallon (4+) 203, 230
Nuclistain EC-730 25 ml (1-3) 27Nuclistain EC-730 25 ml (4 +) 186
Omnimount HS-110 100 ml (1-3) 103Hydromount HS-106 100 ml (4+) 25
OptiClear OE-101 16 oz. spray bottle 161OptiClear OE-101 1 gallon (1-3) 227OptiClear OE-101 1 gallon (4+) 227OptiClear OE-101 5 gallon 227OptiClear OE-101 55 gallon drum 227
OptiClear E OE-104 16 oz. spray bottle 162OptiClear E OE-104 1 gallon (1-3) 228OptiClear E OE-104 1 gallon (4+) 228OptiClear E OE-104 5 gallon 228
OptiClear R OE-102 16 oz. spray bottle 162OptiClear R OE-102 1 gallon (1-3) 228OptiClear R OE-102 1 gallon (4+) 228OptiClear R OE-102 5 gallon 228
OptiClear S OE-105 16 oz. spray bottle 162OptiClear S OE-105 1 gallon (1-3) 228OptiClear S OE-105 1 gallon (4+) 228OptiClear S OE-105 5 gallon 228OptiClear S OE-105 55 gallon drum 228
OptiClear S2 OE-107 16 oz. spray bottle (1-3) 163Opticlear S2 OE-107 1 gallon (1-3) 229Opticlear S2 OE-107 1 gallon (4 +) 229Opticlear S2 OE-107 5 gallon 229
OptiClear Sample Kit I OE-108 1 liter of each 160
OptiClear Sample Kit II OE-109 1 liter of each 160
OptiClear W OE-106 16 oz. spray bottle 163OptiClear W OE-106 1 gallon (1-3) 229OptiClear W OE-106 1 gallon (4 +) 229OptiClear W OE-106 5 gallon 229
Oxosol 306 LS-231 1 liter 137Oxosol 306 LS-231 4 liter
Oxosol C14 Oxidizer LS-211 4 liter (1-3) 137Oxosol C14 Oxidizer LS-211 4 liter (4 +) 200
PBS 10X CL-253 450 ml 17,24PBS 10X CL-253 1 liter 18PBS 10X CL-253 4 liter 18
POPOP SFC-60 25 gram 145POPOP SFC-60 100 gram 201
Potassium Acetate, 1M EC-908 200 ml 17
Potassium Acetate, 5M EC-909 200 ml 17
Potassium Chloride, 1M EC-903 1 liter 17
PPO SFC-10 25 gram 145PPO SFC-10 100 gram 200PPO SFC-10 500 gram 200
Protein Loading Buffer Blue 2X EC-886 10x1 ml 16,26
Protein Loading Buffer, 5X EC-887 10x1 ml 16
ProtoBlock System CL-252 1 system 24
ProtoBlot Transfer Buffer (10X) EC-878 1 liter 23
ProtoBlue Safe EC-722 1 liter 20ProtoGel EC-890 4 liter 20
ProtoGel (30%) EC-890 450 ml 6ProtoGel EC-890 1 liter (1-3) 12ProtoGel EC-890 1 liter (4 +) 20
ProtoGel (40%) EC-891 450 ml 6ProtoGel EC-890 1 liter (1-3) 12ProtoGel EC-890 1 liter (4 +) 12
ProtoGel Buffer EC-892 450 ml 16,6ProtoGel Buffer EC-892 1 liter (1-3) 12ProtoGel Buffer EC-892 1 liter (4 +) 12
ProtoGel Quick-Cast 12% EC-895 100 ml 7POPOP SFC-60 450 ml
ProtoGel Quick-Cast Loading Buffer EC-896 5 x 2 ml 7,16
ProtoGel Sample Prep Kit EC-884 1 Kit 26
ProtoGel Stacking Buffer EC-893 200 ml 16,6
ProtoGlow ECL CL-300 200 ml kit 22POPOP SFC-60 500 ml kit
ProtoLift Western Stripping Buffer EC-889 100 ml 23
ProtoMarkers EC-898 0.5 ml 25
ProtoMetrics EC-899 1 Tube 25
ProtoStain Blue EC-727 1 liter 19
Pyronin Y HS-607 5 gram 105
Riboflavin EC-501 25 gram 31
Scintillation Vials 6 mL SVC-06 1 case (1-10) 142Scintillation Vials 6 mL SVC-06 1 case (11+) 203
Scintillation Vials 8 mL SVC-08 1 case (1-10) 142Scintillation Vials 6 mL SVC-06 1 case (11+) 203
Scintillation Vials 20 mL SVC-20 1 case (1-10) 142Scintillation Vials 20 mL SVC-20 1 case (11+)
Scott’s Tapwater HS-404 1 liter 104
SDS EC-604 100 gram 31SDS EC-604 1 kilogram 33
SDS Solution 20% EC-874 100 ml 31SDS Solution 20% EC-874 450 ml 19
SequaGel MD Heteroduplex Kit EC-847 1 kit 12
SequaGel MD Monomer Solution EC-845 200 ml (1-3) 12SequaGel MD Monomer Solution EC-845 200 ml (4 +) 16
SequaGel MD SSCP Kit EC-846 1 kit 12
SequaGel MD SSCP Stop Solution EC-848 1.2 ml 12
SequaGel XR EC-842 450 ml 12SequaGel XR EC-842 1 liter (1-3) 17SequaGel XR EC-842 1 liter (4 +) 17
SequaGel XR Concentrate EC-843 100 ml 12SequaGel XR Concentrate EC-843 450 ml (1-3) 17SequaGel XR Concentrate EC-843 450 ml (4+) 17
Sodium Acetate 3M pH 4.5 EC-905 200 ml 17
Sodium Acetate 3M pH 5.2 EC-906 200 ml 17
Sodium Acetate 3M pH 7.0 EC-907 200 ml 17
Sodium Chloride 1M EC-901 1 liter 17
Sodium Chloride 0.9% EC-902 1 liter 17
Soluscint XR LS-314 4 liter (1-3) 139Soluscint A LS-313 4 liter (4+) 195
Solusol LS-311 450 ml (1-3) 138Solusol LS-311 450 ml (4+) 194
SSC Buffer 20X EC-873 1 liter 18SSC Buffer 20X EC-873 4 liters 19
SSPE Buffer 20X EC-910 1 liter 18
STERLING Rapid Silver Stain EC-720 1 kit (1-3) 20STERLING Rapid Silver Stain EC-720 1 kit (4+) 27
TAE Buffer 50X EC-872 1 liter (1-3) 18TAE Buffer 50X EC-872 1 liter (4+) 20
TBE 5X EC-861 1 liter 18TBE 5X EC-861 4 liters (1-3) 20TBE 5X EC-861 4 liters (4+) 20
TBE 10X EC-860 1 liter 18TBE 10X EC-860 4 liters (1-3) 20TBE 10X EC-860 4 liters (4+) 20
TBS (10X) EC-881 1 liter 17,24
TBST (10X) EC-882 1 liter 17,24
TE BUFFER 100X EC-862 25 ml 18
TEMED EC-503 25 ml 31
p-Terphenyl SFC-50 25 gram 145p-Terphenyl SFC-50 100 gram
TPB SFC-15 5 gram 145
Tricine EC-407 100 gram 31
Triple Dye Loading Buffer (6X) EC-855 1.2 ml 18
Tris EC-406 250 gram 31Tris EC-406 1 kilogram 33
Tris-Glycine Electroblotting Buffer 10X EC-880 1 liter 17,24Tris-Glycine Electroblotting Buffer 10X EC-880 4 liter (1-3) 21Tris-Glycine Electroblotting Buffer 10X EC-880 4 liter (4 +) 21
Tris-Glycine-SDS PAGE Buffer (10X) EC-870 1 liter 16Tris-Glycine-SDS PAGE Buffer (10X) EC-870 4 liter (1-3) 21Tris-Glycine-SDS PAGE Buffer (10X) EC-870 4 liter (4 +) 21
Tris-HCl, pH 7.2 EC-922 1 liter 17
Tris-HCl, pH 7.4 EC-923 1 liter 17
Tris-HCl, pH 7.6 EC-925 1 liter 17
Tris-Tricine-SDS PAGE Buffer (10X) EC-869 1 liter 16
TTE Glycerol Tolerant Buffer 20X EC-871 1 liter (1-3) 18TTE Glycerol Tolerant Buffer 20X EC-871 1 liter (4 +) 21
Tween 20 EC-607 200 ml 31Tween 20 EC-607 1 liter 188
Uniscint BD LS-276 4 liter (1-3) 130, 135Uniscint BD LS-276 4 liter (4+) 185,193Uniscint BD LS-276 20 liter drum 185,193
Urea EC-605 250 gram 31Urea EC-605 1 kilogram 33
UreaGel 29:1 Concentrate EC-828 450 ml 10UreaGel Concentrate EC-830 1 liter (1-3) 15UreaGel Concentrate EC-830 1 liter (4 +) 15UreaGel 29:1 System EC-829 1 liter kit 10SequaGel Sequencing System EC-833 2.2 liter kit (1-3) 15SequaGel Sequencing System EC-833 2.2 liter kit (4 +)
UreaGel-6 EC-836 450 ml 10UreaGel-6 EC-836 1 liter (1-3) 14UreaGel-6 EC-836 1 liter (4 +) 14
UreaGel-8 EC-838 450 ml 10UreaGel-8 EC-838 1 liter (1-3) 14UreaGel-8 EC-838 1 liter (4 +) 14
UreaGel Buffer EC-835 100 ml 11UreaGel Buffer EC-835 200 ml (1-3) 15UreaGel Buffer EC-835 200 ml (4 +) 15
UreaGel Complete Buffer EC-841 90 ml 10UreaGel Complete Buffer EC-841 200 ml 14
UreaGel Concentrate EC-830 450 ml 11UreaGel Concentrate EC-830 1 liter (1-3) 15UreaGel Concentrate EC-830 1 liter (4 +) 15
UreaGel Diluent EC-840 450 ml 11UreaGel Diluent EC-840 1 liter (1-3) 15SequaGel Diluent EC-840 1 liter (4 +) 15
UreaGel Loading Buffer EC-857 10 x 1ml 18
UreaGel Sequencing System EC-833 1 liter kit 11SequaGel Sequencing System EC-833 2.2 liter kit (1-3) 15SequaGel Sequencing System EC-833 2.2 liter kit (4 +)
Water, DEPC treated, sterile EC-625 1 liter 31
Xylene Cyanole FF HS-608 25 grams 28
See page170for the Index of Subjects
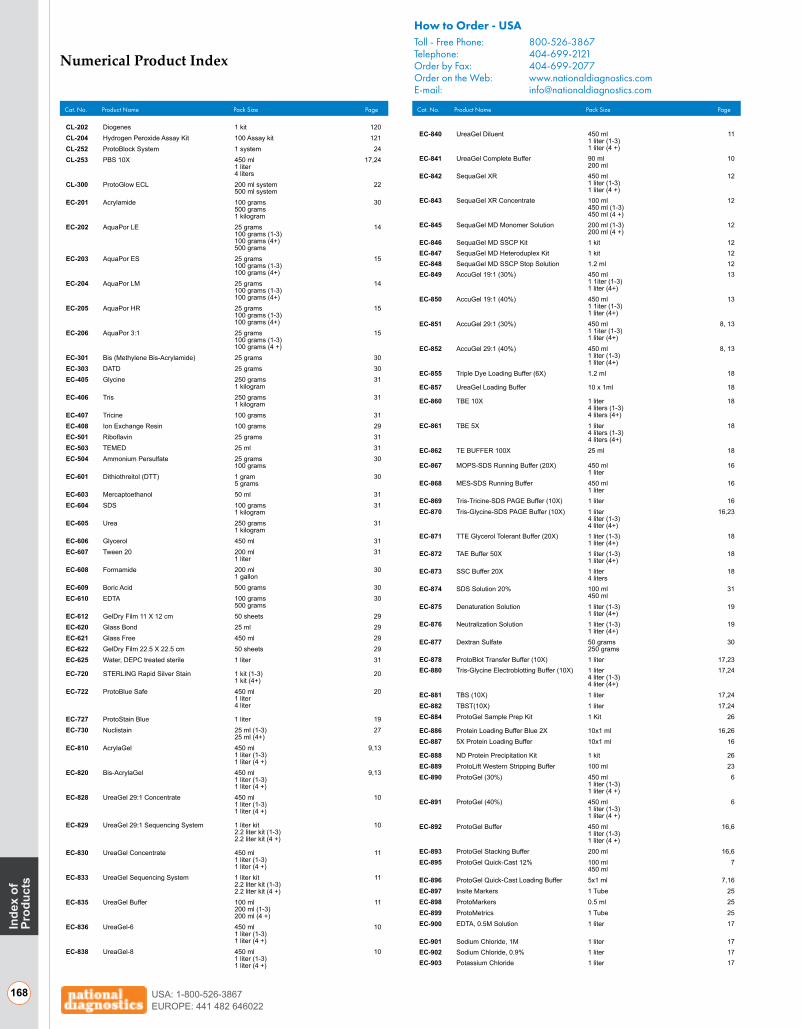
Inde
x of
Prod
ucts
168 USA: 1-800-526-3867EUROPE: 441 482 646022
CL-202 Diogenes 1 kit 120CL-204 Hydrogen Peroxide Assay Kit 100 Assay kit 121CL-252 ProtoBlock System 1 system 24CL-253 PBS 10X 450 ml 17,24PBS 10X CL-253 1 liter 18PBS 10X CL-253 4 liters 18CL-300 ProtoGlow ECL 200 ml system 22Dithiothreitol (DTT) EC-601 500 ml system 31EC-201 Acrylamide 100 grams 30Acrylamide EC-201 500 grams 30Acrylamide EC-201 1 kilogram 30EC-202 AquaPor LE 25 grams 14AquaPor LE EC-202 100 grams (1-3) 8AquaPor LE EC-202 100 grams (4+) 8AquaPor LE EC-202 500 grams 8EC-203 AquaPor ES 25 grams 15AquaPor ES EC-203 100 grams (1-3) 9AquaPor ES EC-203 100 grams (4+) 9EC-204 AquaPor LM 25 grams 14AquaPor LM EC-204 100 grams (1-3) 8AquaPor LM EC-204 100 grams (4+) 8EC-205 AquaPor HR 25 grams 15AquaPor HR EC-205 100 grams (1-3) 9AquaPor HR EC-205 100 grams (4+) 9EC-206 AquaPor 3:1 25 grams 15AquaPor ES EC-203 100 grams (1-3) 9AquaPor ES EC-203 100 grams (4 +) 9EC-301 Bis (Methylene Bis-Acrylamide) 25 grams 30EC-303 DATD 25 grams 30EC-405 Glycine 250 grams 31Glycine EC-405 1 kilogram 32EC-406 Tris 250 grams 31Tris EC-406 1 kilogram 33EC-407 Tricine 100 grams 31EC-408 Ion Exchange Resin 100 grams 29EC-501 Riboflavin 25 grams 31EC-503 TEMED 25 ml 31EC-504 Ammonium Persulfate 25 grams 30Ammonium Persulfate EC-504 100 grams 30EC-601 Dithiothreitol (DTT) 1 gram 30Dithiothreitol (DTT) EC-601 5 grams 31EC-603 Mercaptoethanol 50 ml 31EC-604 SDS 100 grams 31SDS EC-604 1 kilogram 33EC-605 Urea 250 grams 31Urea EC-605 1 kilogram 33EC-606 Glycerol 450 ml 31EC-607 Tween 20 200 ml 31Tween 20 EC-607 1 liter 33EC-608 Formamide 200 ml 30 1 gallon EC-609 Boric Acid 500 grams 30EC-610 EDTA 100 grams 30EDTA EC-610 500 grams 31EC-612 GelDry Film 11 X 12 cm 50 sheets 29EC-620 Glass Bond 25 ml 29EC-621 Glass Free 450 ml 29EC-622 GelDry Film 22.5 X 22.5 cm 50 sheets 29EC-625 Water, DEPC treated sterile 1 liter 31
EC-720 STERLING Rapid Silver Stain 1 kit (1-3) 20STERLING Rapid Silver Stain EC-720 1 kit (4+) 27EC-722 ProtoBlue Safe 450 ml 20 1 liter STERLING Rapid Silver Stain EC-720 4 liter 27
EC-727 ProtoStain Blue 1 liter 19EC-730 Nuclistain 25 ml (1-3) 27Nuclistain EC-730 25 ml (4+) 25EC-810 AcrylaGel 450 ml 9,13AcrylaGel EC-810 1 liter (1-3) 7AcrylaGel EC-810 1 liter (4 +) 7EC-820 Bis-AcrylaGel 450 ml 9,13Bis-AcrylaGel EC-820 1 liter (1-3) 7Bis-AcrylaGel EC-820 1 liter (4 +) 7EC-828 UreaGel 29:1 Concentrate 450 ml 10UreaGel Concentrate EC-830 1 liter (1-3) 15UreaGel Concentrate EC-830 1 liter (4 +)
EC-829 UreaGel 29:1 Sequencing System 1 liter kit 10UreaGel Sequencing System EC-833 2.2 liter kit (1-3) 15UreaGel Sequencing System EC-833 2.2 liter kit (4 +) 15
EC-830 UreaGel Concentrate 450 ml 11UreaGel Concentrate EC-830 1 liter (1-3) 15UreaGel Concentrate EC-830 1 liter (4 +) 15EC-833 UreaGel Sequencing System 1 liter kit 11UreaGel Sequencing System EC-833 2.2 liter kit (1-3) 15UreaGel Sequencing System EC-833 2.2 liter kit (4 +) 15EC-835 UreaGel Buffer 100 ml 11UreaGel Buffer EC-835 200 ml (1-3) 15UreaGel Buffer EC-835 200 ml (4 +) 15EC-836 UreaGel-6 450 ml 10UreaGel-6 EC-836 1 liter (1-3) 14UreaGel-6 EC-836 1 liter (4 +) 14EC-838 UreaGel-8 450 ml 10UreaGel-8 EC-838 1 liter (1-3) 14UreaGel-8 EC-838 1 liter (4 +)
Cat. No. Product Name Pack Size Page
Numerical Product Index
Cat. No. Product Name Pack Size Page
EC-840 UreaGel Diluent 450 ml 11UreaGel Diluent EC-840 1 liter (1-3) 15UreaGel Diluent EC-840 1 liter (4 +) 15EC-841 UreaGel Complete Buffer 90 ml 10SequaGel Complete Buffer EC-841 200 ml 14EC-842 SequaGel XR 450 ml 12SequaGel XR EC-842 1 liter (1-3) 17SequaGel XR EC-842 1 liter (4 +) 17EC-843 SequaGel XR Concentrate 100 ml 12SequaGel XR Concentrate EC-843 450 ml (1-3) 17SequaGel XR Concentrate EC-843 450 ml (4 +) 17EC-845 SequaGel MD Monomer Solution 200 ml (1-3) 12SequaGel MD Monomer Solution EC-845 200 ml (4 +) 16EC-846 SequaGel MD SSCP Kit 1 kit 12EC-847 SequaGel MD Heteroduplex Kit 1 kit 12EC-848 SequaGel MD SSCP Stop Solution 1.2 ml 12EC-849 AccuGel 19:1 (30%) 450 ml 13AccuGel 19:1 (40%) EC-850 1 1iter (1-3) 6AccuGel 19:1 (40%) EC-850 1 liter (4+) 6EC-850 AccuGel 19:1 (40%) 450 ml 13AccuGel 19:1 (40%) EC-850 1 1iter (1-3) 6AccuGel 19:1 (40%) EC-850 1 liter (4+) 6EC-851 AccuGel 29:1 (30%) 450 ml 8, 13AccuGel 19:1 (40%) EC-850 1 1iter (1-3) 6AccuGel 19:1 (40%) EC-850 1 liter (4+) 6EC-852 AccuGel 29:1 (40%) 450 ml 8, 13AccuGel 29:1 (40%) EC-852 1 liter (1-3) 6AccuGel 29:1 (40%) EC-852 1 liter (4+) 6EC-855 Triple Dye Loading Buffer (6X) 1.2 ml 18
EC-857 UreaGel Loading Buffer 10 x 1ml 18
EC-860 TBE 10X 1 liter 18TBE 10X EC-860 4 liters (1-3) 20TBE 10X EC-860 4 liters (4+) 20EC-861 TBE 5X 1 liter 18TBE 5X EC-861 4 liters (1-3) 20TBE 5X EC-861 4 liters (4+) 20EC-862 TE BUFFER 100X 25 ml 18
EC-867 MOPS-SDS Running Buffer (20X) 450 ml 16Dextran Sulfate EC-877 1 liter 31EC-868 MES-SDS Running Buffer 450 ml 16Dextran Sulfate EC-877 1 liter 31EC-869 Tris-Tricine-SDS PAGE Buffer (10X) 1 liter 16EC-870 Tris-Glycine-SDS PAGE Buffer (10X) 1 liter 16,23Tris-Glycine-SDS PAGE Buffer (10X) EC-870 4 liter (1-3) 21Tris-Glycine-SDS PAGE Buffer (10X) EC-870 4 liter (4+) 21EC-871 TTE Glycerol Tolerant Buffer (20X) 1 liter (1-3) 18TTE Glycerol Tolerant Buffer 20X EC-871 1 liter (4+) 21EC-872 TAE Buffer 50X 1 liter (1-3) 18TAE Buffer 50X EC-872 1 liter (4+) 20EC-873 SSC Buffer 20X 1 liter 18SSC Buffer 20X EC-873 4 liters 19EC-874 SDS Solution 20% 100 ml 31SDS Solution 20% EC-874 450 ml 19EC-875 Denaturation Solution 1 liter (1-3) 19Denaturation Solution EC-875 1 liter (4+) 18EC-876 Neutralization Solution 1 liter (1-3) 19Neutralization Solution EC-876 1 liter (4+) 18EC-877 Dextran Sulfate 50 grams 30Dextran Sulfate EC-877 250 grams 31EC-878 ProtoBlot Transfer Buffer (10X) 1 liter 17,23EC-880 Tris-Glycine Electroblotting Buffer (10X) 1 liter 17,24Tris-Glycine Electroblotting Buffer 10X EC-880 4 liter (1-3) 21Tris-Glycine Electroblotting Buffer 10X EC-880 4 liter (4+) 21EC-881 TBS (10X) 1 liter 17,24EC-882 TBST(10X) 1 liter 17,24EC-884 ProtoGel Sample Prep Kit 1 Kit 26
EC-886 Protein Loading Buffer Blue 2X 10x1 ml 16,26EC-887 5X Protein Loading Buffer 10x1 ml 16
EC-888 ND Protein Precipitation Kit 1 kit 26EC-889 ProtoLift Western Stripping Buffer 100 ml 23EC-890 ProtoGel (30%) 450 ml 6ProtoGel EC-890 1 liter (1-3) 12ProtoGel EC-890 1 liter (4 +) 12EC-891 ProtoGel (40%) 450 ml 6ProtoGel EC-890 1 liter (1-3) 12ProtoGel EC-890 1 liter (4 +) 12EC-892 ProtoGel Buffer 450 ml 16,6ProtoGel Buffer EC-892 1 liter (1-3) 12ProtoGel Buffer EC-892 1 liter (4 +) 12EC-893 ProtoGel Stacking Buffer 200 ml 16,6EC-895 ProtoGel Quick-Cast 12% 100 ml 7ProtoGel Buffer EC-892 450 ml 12EC-896 ProtoGel Quick-Cast Loading Buffer 5x1 ml 7,16EC-897 Insite Markers 1 Tube 25EC-898 ProtoMarkers 0.5 ml 25EC-899 ProtoMetrics 1 Tube 25EC-900 EDTA, 0.5M Solution 1 liter 17
EC-901 Sodium Chloride, 1M 1 liter 17EC-902 Sodium Chloride, 0.9% 1 liter 17EC-903 Potassium Chloride 1 liter 17
How to Order - USAToll - Free Phone: 800-526-3867Telephone: 404-699-2121 Order by Fax: 404-699-2077Order on the Web: www.nationaldiagnostics.comE-mail: [email protected]

Index ofProducts
169169USA: 1-800-526-3867EUROPE: 441 482 646022
Cat. No. Product Name Pack Size PageCat. No. Product Name Pack Size Page
How to Order - EUROPE
Phone: 44 (0) 1482 646020 or 44 (0) 1482 646022Fax: 44 (0) 1482 646013E-mail: [email protected]
EC-905 Sodium Acetate, pH 4.5 1 liter 17EC-906 Sodium Acetate, pH 5.2 1 liter 17EC-907 Sodium Acetate, pH 7.0 1 liter 17EC-908 Potassium Acetate, 1M 1 liter 17EC-909 Potassium Acetate, 5M 1 liter 17EC-910 SSPE (20X) 1 liter 18EC-911 MESA RNA Electrophoresis Buffer (10X) 1 liter 18EC-915 Denhardt’s Solution 50 ml 18EC-922 Tris-HCl, pH 7.2 1 liter 17EC-923 Tris-HCl, pH 7.4 1 liter 17EC-925 Tris-HCl, pH 7.6 1 liter 17
HS-100 Histosol 1 gallon 99Histosol H -100 5 gallon 149HS-101 Mirsky’s Fixative (ready-to-use) 1 gallon 101Mirsky’s Fixative (ready-to-use) HS-101 5 gallon 151HS-102 Mirsky’s Fixative 200 ml system 101Mirsky’s Fixative HS-102 2 liter system 151HS-103 Histomount 100 ml (1-3) 103Histomount HS-103 100 ml (4+) 153Histomount HS-103 450 ml (1-3) 153Histomount HS-103 450 ml (4+) 153HS-104 Calci-Clear 1 quart 100Calci-Clear HS-104 1 gallon 150Calci-Clear HS-104 5 gallons 150HS-105 Calci-Clear Rapid 1 quart 100Calci-Clear Rapid HS-105 1 gallon 150Calci-Clear Rapid HS-105 5 gallons 150HS-106 Hydromount 100 ml (1-3) 103Hydromount HS-106 100 ml (4+) 153HS-108 Neutralin 5 gallon pail 102HS-110 Omnimount 100 ml (1-3) 103Hydromount HS-106 100 ml (4+) 153
HS-200 Histo-Clear 1 liter 98 1 gallon (1-3) 1 gallon (4+) Histo-Clear HS-200 5 gallon 148Histo-Clear HS-200 55 gallon 148HS-202 Histo-Clear II 1 gallon (1-3) 99 1 gallon (4+) Histo-Clear II HS-202 5 gallon 149Histo-Clear II HS-202 55 gallon 149HS-300 Reagent Ethanol - Denatured 1 liter 30,99Liquiscint LS-121 4 liter 190Liquiscint LS-121 20 liter drum 188HS-400 Harris’ Hematoxylin 1 liter 104
HS-402 Eosin, 1% Solution 100ml 104
HS-404 Scott’s Tapwater 1 liter 104
HS-504 Alcian Blue 25 grams 105HS-506 Biebrich Scarlet 25 grams 105HS-516 Fast Green FCF 25 grams 105HS-518 Basic Fuchsin 25 grams 105HS-525 Methylene Blue 25 grams 105HS-601 Amido Black 10B 25 grams 21,105HS-602 Bromocresol Green 5 grams 28HS-603 Bromophenol Blue 10 grams 21,28,105HS-604 Coomassie Blue R-250 10 grams 22HS-605 Coomassie Blue G-250 10 grams 22HS-606 Methyl Green 10 grams 105HS-607 Pyronin Y 5 grams 105HS-608 Xylene Cyanole FF 25 grams 28LS-111 Hydrofluor 4 liter (1-3) 131Hydrofluor LS-111 4 liter (4 +) 186LS-121 Liquiscint 4 liter (1-3) 133Liquiscint LS-121 4 liter (4 +) 190Liquiscint LS-121 20 liter drum 188LS-151 Betafluor 4 liter (1-3) 133Betafluor LS-151 4 liter (4 +) 191LS-191 Monofluor 4 liter (1-3) 132Monofluor LS-191 4 liter (4 +) 189,197LS-201 Filtron-X 4 liter (1-3) 139Filtron-X LS-201 4 liter (4 +) 195LS-211 Oxosol C14 Oxidizer 4 liter (1-3) 137Oxosol C14 Oxidizer211 4 liter (4 +) 200LS-231 Oxosol 306 1 liter 137Oxosol 306 LS-231 1 gallonLS-241 Carbamate-1 CO2 Absorber 450 ml (1-3) 137Carbamate-1 CO2 Absorber 450 ml (4 +) 196LS-262 Ecoscint GL 4 liter 130LS-270 Ecoscint Ultra 4 liter (1-3) 126Ecoscint LS-271 4 liter (4+) 184LS-271 Ecoscint 4 liter (1-3) 129Ecoscint LS-271 4 liter (4+) 184Ecoscint LS-271 20 liter drum 184LS-272 Ecoscint XR 4 liter (1-3) 127Ecoscint A LS-273 4 liter (4+) 182LS-273 Ecoscint A 4 liter (1-3) 128Ecoscint A LS-273 4 liter (4+) 182Ecoscint A LS-273 20 liter drum
LS-274 Ecoscint O 4 liter (1-3) 129Ecoscint O LS-274 4 liter (4+) 184Ecoscint O LS-274 20 liter drum 184LS-275 Ecoscint H 4 liter (1-3) 128Ecoscint H LS-275 4 liter (4+) 183Ecoscint H LS-275 20 liter drum LS-276 Uniscint BD 4 liter (1-3) 130,135Uniscint BDLS-276 4 liter (4+) 185,193Uniscint BDLS-276 20 liter drum 185,193LS-281 Monoflow 1 4 liter (1-3) 136Monoflow 1 LS-281 4 liter (4+) 192Monoflow 1 LS-281 20 liter drum 192LS-282 Monoflow 2 4 liter (1-3) 136Monoflow 2 LS-282 4 liter (4+) 192Monoflow 2 LS-282 20 liter drum 192LS-283 Monoflow 3 1x4 liter bottle 136Monoflow 3 LS-283 4x4 liter case 192Monoflow 3 LS-283 20 liter drum 192LS-284 Monoflow 4 4 liter (1-3) 136Monoflow 4 LS-284 4 liter (4+) 193Monoflow 4 LS-284 20 liter drum 193LS-285 Monoflow 5 4 liter (1-3) 135Monoflow 5 LS-285 4 liter (4+) 193Monoflow 5 LS-285 20 liter drum 193LS-288 Ecoscint Flow 4 liter (1-3) 134Ecoscint A LS-273 4 liter (4+) Ecoscint A LS-273 4 liter (4+) 182LS-309 Bioscint 4 liter (1-3) 138Bioscint LS-309 4 liter (4+) 194LS-310 Biosol 400 ml 138LS-311 Solusol 450 ml (1-3) 138Solusol LS-311 450 ml (4+) 194LS-314 Soluscint XR 1 gallon (1-3) 139Soluscint O LS-312 1 gallon (4+) 195LS-315 Autofluor 1 liter (1-3) 28,144Autofluor LS-315 1 liter (4+) 153LS-900 Bottle-top Dispenser 1 unit 143LS-904 Extendable Delivery Jet 1 unit 143NC-200 Nuclean 1 quart 140Nuclean NC-200 1 gallon (1-3) 203, 230Nuclean NC-200 1 gallon (4+) 203, 230NW-300 Nuc-Wipes 1 box (1-9) (100/box) 141Nuc-Wipes NW-300 1 box (10+) (100/box) 202,230OE-101 OptiClear 16 oz. spray bottle 161OptiClear OE-101 1 gallon (1-3) 227OptiClear OE-101 1 gallon (4+) 227OptiClear OE-101 5 gallon 227OptiClear OE-101 55 gallon drum 227OE-102 OptiClear R 16 oz. spray bottle 162OptiClear R OE-102 1 gallon (1-3) 228OptiClear R OE-102 1 gallon (4+) 228OptiClear R OE-102 5 gallon drum 228OE-104 OptiClear E 16 oz. spray bottle 162OptiClear E OE-104 1 gallon (1-3) 228OptiClear E OE-104 1 gallon (4+) 228OptiClear E OE-104 5 gallon drum 228OE-105 OptiClear S 16 oz. spray bottle 162OptiClear S OE-105 1 gallon (1-3) 228OptiClear S OE-105 1 gallon (4+) 228OptiClear S OE-105 5 gallon drum 228OptiClear S OE-105 55 gallon drum 228OE-106 OptiClear W 16 oz. spray bottle 163OptiClear W OE-106 1 gallon (1-3) 229OptiClear W OE-106 1 gallon (4+) 229OptiClear W OE-106 5 gallon drum 229OE-107 OptiClear S2 16 oz. spray bottle 163Opticlear S2 OE-107 1 gallon (1-3) 229Opticlear S2 OE-107 1 gallon (4+) 229Opticlear S2 OE-107 5 gallon drum 229OE-108 OptiClear Sample Kit I 1 liter of each 160OE-109 OptiClear Sample Kit II 1 liter of each 160SFC-10 PPO 25 grams 145PPO SFC-10 100 grams 200PPO SFC-10 500 grams 200SFC-13 BBQ 1 gram 145BBQ SFC-13 5 grams 201SFC-15 TPB 5 grams 145SFC-20 Butyl PBD 25 grams 145Butyl PBD SFC-20 100 grams 200Butyl PBD SFC-20 500 grams 200SFC-40 Naphthalene — Scintillation Grade 100 grams 145Naphthalene — Scintillation Grade SFC-40 1 kilogram 200SFC-50 p-Terphenyl 25 g 145p-Terphenyl SFC-50 100 g SFC-60 POPOP 25 grams 145POPOP SFC-60 100 grams 201SFC-90 Bis-MSB 25 grams 145Bis-MSB SFC-90 100 grams 201SVC-06 Scintillation Vials 6 mL 1 case (1-10) 142Scintillation Vials 20 mL SVC-20 1 case (11 +) 203SVC-08 Scintillation Vials 8 mL 1 case (1-10) 142Scintillation Vials 6 mL SVC-06 1 case (11 +) 203SVC-20 Scintillation Vials 20 mL 1 case (1-10) 142Scintillation Vials 6 mL SVC-06 1 case (11 +)
See page 170for the Index of Subjects

Inde
x of
Subj
ects
170 USA: 1-800-526-3867EUROPE: 441 482 646022
A B
C
Subject Index
A260 of DNA samples.......................................................... 43AccuGel 19:1 ..........................................................................13AccuGel 29:1 ..................................................................... 8,13AcrylaGel ............................................................................ 9,13Acrylamide ....................................................................... 30,36Agarose ....................................................................... 14,36,37
extra strength ..................................................................................60AquaPor ES ................................................................................. 15
low melting point ............................................................................60AquaPor LM ................................................................................ 14
Alcohol Fixatives ............................................................108,111Aldehyde fixatives ............................................................... 107
disposal with Neutralin ....................................................... 102,108formaldehyde ........................................................................ 107,111formalin-heme pigment .........................................................108,111gluteraldehyde ..............................................................................117Mirsky’s fixative .....................................................................107,117
Alkaline blotting ......................................................................81Alkaline phosphatase ..................................................... 88,116Alpha particles ..................................................................... 147
ionization detection ......................................................................148penetration ....................................................................................147solid scintillation............................................................................148
Amido Black ............................................................................21Amino acid oxidase ................................................................75Ammonium persulfate ............................................................ 36Ammonium Persulfate ............................................................ 30Ampflified Fragment Length Polymorphism (AFLP*) ........... 48Ampholytes ............................................................................. 77Antibodies ........................................................................76,115
detection systemsdirect ...........................................................................................115indirect ........................................................................................115
production ......................................................................................115Antigen .................................................................................. 115AquaPor GTAC Agarose ........................................................14
AquaPor 3:1 ................................................................................... 15AquaPor ES ..................................................................................... 15AquaPor HR .................................................................................... 15AquaPor LE ..................................................................................... 14AquaPor LM .................................................................................... 14
Artifacts in histologic sections ...............................................111Autofluor ................................................................................. 28
protocol ...........................................................................................83AutoFluor .............................................................................. 144Automated Sequencing ......................................................... 47
electrophoresis ................................................................................47reactions ..........................................................................................47SequaGel XR .................................................................................. 12
Autoradiography ........................................................... 83,155Autofluor .........................................................................................28
protocol ........................................................................................83detection limits ................................................................................83
Avidin-Biotin system .............................................................. 116
Base pairs ............................................................................... 33Becquerel.............................................................................. 147Betafluor ................................................................................133Beta particles........................................................................ 147
ionization detection ......................................................................148liquid scintillation detection .................................................148,149
efficiency ....................................................................................150neutrino emission ..........................................................................147path length ....................................................................................149secondary emissions ....................................................................147solid scintillation............................................................................148
Biosol and Bioscint ............................................................... 138Biotin ................................................................................... 116Bis-AcrylaGel ...................................................................... 9,13Blotting membranes ................................................................81
nitrocellulose ................................................................................... 81nylon ............................................................................................... 81PVDF ...............................................................................................89
Boric Acid ............................................................................... 30BromoChloroIndoyl Phosphate (BCIP) ................................. 88Bromocresol Green ................................................................ 28Bromophenol Blue ............................................................ 21,28Buffer additives ...................................................................... 40Buffer gradient gels .......................................................... 44,46
protocol ...........................................................................................47Buffers .............................................................................. 38,44
discontinuous ..................................................................................39homogeneous .................................................................................39pre-mixed electrophoresis buffers .................................................16selection parameters ......................................................................38
Calci-Clear ...........................................................................100Calci-Clear Rapid ................................................................100Calcium deposits ..................................................................109Capillary blotting ................................................................... 80Carbamate-1 ........................................................................137Carbon Dioxide counting .................................................... 156Catalase ..................................................................................75Cellulose-Ester Filters ........................................................... 155Channels ratio .......................................................................151Charge to mass ratio ............................................ 33,39,54,67Chemiluminescence ............................................................. 152Chromophore ........................................................................ 112Clearing ................................................................................109
safer clearing agentsHisto-Clear ..................................................................................98Histo-Clear II ...............................................................................99Histosol ........................................................................................99
Coincidence counting.......................................................... 152Color perception ....................................................................111Conformational analysis ....................................................... 58
heteroduplex analysis ....................................................................58protocol ........................................................................................58
single strand conformational polymorphism (SSCP) a ................59

Index ofSubjects
171171USA: 1-800-526-3867EUROPE: 441 482 646022
D
E
C conTInued D conTInued
protocol ........................................................................................59Coomassie Blue G-250 .........................................................21Coomassie Blue R-250 ..........................................................21Coomassie staining ................................................................ 85
powdered stains ............................................................................. 21Counting efficiency .............................................................. 150Counting Efficiency .............................................................. 150Counting windows ............................................................... 150Counts per minute .........................................................147,150Curie 147
DATD 30Decalcification .....................................................................109
Calci-Clear and CalciClear Rapid ............................................ 100Decolorizing LSC samples .................................................. 154Decolorizing LSC Samples with Ultraviolet Light
protocols .......................................................................................154Dehydration ....................................................................109,111
dioxane ........................................................................................ 109Denaturing agents ........................................................... 43,44DEPC (Diethylpyrocarbamate) ............................................. 65Dextran Sulfate....................................................................... 30Diaminobenzidine......................................................75,88,116Differential display ................................................................. 48Diogenes .............................................................................. 120Dioxane ................................................................................109Discontinuous buffer systems............................................39,67Disintegrations per minute ................................................... 150Disintegrations per minute (DPM) ....................................... 147Dithiothreitol ..................................................................... 40,67Dithiothreitol (DTT) ................................................................. 30DNA and RNA Detection ...................................................... 27
autoradiography ............................................................................28ethidium bromide ............................................................................79
protocol ........................................................................................79nuclistain..........................................................................................27
protocol ........................................................................................79silver staining
protocol ........................................................................................80Southern blotting ............................................................................80
protocol ........................................................................................82DNA and RNA Electrophoresis ............................................ 42
agarose gel electrophoresis ..........................................................60AquaPor GTAC agarose ............................................................ 14gel preparation ...........................................................................60gel preparation - alkaline gels ................................................... 61gel preparation - formaldehyde gels ........................................ 61troubleshooting ............................................................................93
denaturing electrophoresis of DNA & RNA .....................33,40,43gel preparation ...........................................................................43manual sequencing .....................................................................44molecular weight determination ................................................44run conditions ..............................................................................44troubleshooting ............................................................................92
gels for DNA and RNA analysis ...................................................10native DNA electrophoresis ...........................................................54
gel formulations ...........................................................................54sample preparation .....................................................................54
pre-mixed electrophoresis buffers ................................................. 18DNA and RNA Purification
electroelution ............................................................................62,63using agarose .................................................................................62using low melt agarose ..................................................................62
DNA footprint analysis ...........................................................51DNA/Protein interactions ......................................................51DNase I footprinting ...............................................................51
standard protocol ........................................................................... 51DNA sequencing
electrophoresis ................................................................................46G-C compressions ......................................................................47glycerol ........................................................................................47gradient gels ................................................................................47TTE buffer .....................................................................................47
Maxam and Gilbert .......................................................................45Sanger dideoxy terminators ..........................................................45
Dyes ....................................................................................111Chromophores ...............................................................................112
Ecoscint ..................................................................................129Ecoscint A ..............................................................................128Ecoscint Flow .........................................................................134Ecoscint H ..............................................................................128Ecoscint O .............................................................................129Ecoscint XR ............................................................................127EDTA .................................................................................... 30Ehrlich’s Hematoxylin ........................................................... 113Electroendosmosis ............................................................37,60Electron microscopy .............................................................. 116
fixation ............................................................................................117immunostaining ..............................................................................117resolution ........................................................................................116scanning electron microscope ......................................................116sectioning .......................................................................................117staining ...........................................................................................117
negative stains ............................................................................117positive stains..............................................................................117
tissue processing ............................................................................117transmission electron microscope .................................................116
Electro-optical solvents ........................................................ 160Electrophoresis reagents ........................................................ 30Embedding ............................................................................110
electron microscopy ......................................................................117Epoxy resins .................................................................................. 110media............................................................................................. 110Paraffin wax .................................................................................. 110
Enzyme linked immunosorbent assay .................................. 89Epitope ................................................................................... 115Epoxy resins ..........................................................................110Ethidium bromide ..............................................................43,79
Ferguson plots .........................................................................74Field inversion gel electrophoresis (FIGE) ............................ 64Filtron X ................................................................................. 139Fixation (histology) ...................................................... 107,108
alcohols ........................................................................................ 108aldehydes ..............................................................................107,117
Mirsky’s Fixative ........................................................................101
F

Inde
x of
Subj
ects
172 USA: 1-800-526-3867EUROPE: 441 482 646022
Alphabetical Index
K
F conTInued G conTInued
G
H
I
L
Aldehydes .....................................................................................107electron microscopy ......................................................................116
glutaraldehyde ...........................................................................117Mirsky’s fixative ..................................................................101,117osmium tetroxide ........................................................................117
mercurials .......................................................................107,108,111oxidizing agents .................................................................. 107,108pH ............................................................................................ 108picric acid .................................................................................... 108safety ............................................................................................ 108table of fixatives ...........................................................................107temperature .................................................................................. 108
Fixation of protein gels .......................................................... 84protocol ...........................................................................................84
Flow counting ....................................................................... 156applications table .........................................................................156biodegradable cocktails for flow detection ...............................134detectors ........................................................................................156traditional cocktails for flow detection ........................................136
Flow detectors ...................................................................... 156Fluorography .................................................................. 83,155
detection limits ................................................................................83protocol ...........................................................................................83TLC plates
protocol ......................................................................................155Formaldehyde ................................................................107,111Formaldehyde gels ................................................................ 65Formalin-heme pigment .................................................108,111Formamide ...................................................................30,43,44Frozen sections ......................................................................110
Gamma rays ......................................................................... 147ionization detection ......................................................................148
Gamma raysSecondary b emissions ...............................................................147
G-C compressions ................................................................. 47GelDry Film ............................................................................ 29Gel preparation
agarose gels ...................................................................................60denaturing DNA gels .....................................................................43denaturing protein gels ..................................................................68
gradient gels ................................................................................69native DNA gels .............................................................................54native protein gels ..........................................................................75
Gels for electrophoresisgels for DNA/RNA analysis .........................................................10
AccuGel 19:1 .............................................................................. 13AcrylaGel and Bis-AcrylaGel ................................................... 13SequaGel 4, 4.25, 4.75, 6, and 8 ..........................................10SequaGel MD ............................................................................. 12SequaGel XR ............................................................................... 12
gels for protein analysis ................................................................... 6AccuGel 19:1 .............................................................................. 13AccuGel 29:1 ............................................................................... 8AcrylaGel and BisAcrylaGel ....................................................... 9ProtoGel ......................................................................................6,7
Genomic Analysis .................................................................. 48Ampflified Fragment Length Polymorphism (AFLP*) ....................48Random Amplification of Polymorphic DNA (RAPD) ..................48
Glass Bond ............................................................................. 29
Glass Free ............................................................................... 29Gluteraldehyde ..................................................................... 117Glycerol .............................................................................31,44Glycine ....................................................................................31Glyoxal gels for RNA ............................................................ 65Gradient gels.....................................................................69,70Guanidinium isothiocyanate ................................................. 65Guide strip Technique ............................................................ 87
Hematoxylin and Eosin stain ................................................ 113Henderson-Hasselbalch equation ........................................ 38H & E Stain ............................................................................ 113Heteroduplex analysis ........................................................... 58
SequaGel MD ................................................................................ 12Histo-Clear ............................................................................. 98Histo-Clear II .......................................................................... 99Histological artifacts ..............................................................111Histological Stains ............................................................... 104Histomount ............................................................................103Histosol ................................................................................... 99Homogeneous buffer systems ............................................... 39Horizontal gels ........................................................................41Horseradish peroxidase ..................................... 75,88,115,116Human eye .............................................................................111Hydrofluor .............................................................................131Hydrogen bonding agents .................................................... 40Hydromount .........................................................................103
Immuno-diffusion ....................................................................76protocol ...........................................................................................76
Immuno-electrophoresis .........................................................76protocol ...........................................................................................76
Immunohistochemistry .......................................................... 115Avidin-biotin system.......................................................................116detection systems ...........................................................................115Enzyme-antibody conjugates .......................................................116immunofluorescence .....................................................................115peroxidase-antiperoxidase ..........................................................116
Immunological detection (electrophoresis) .....................87,88In - gel reactions
ligation ............................................................................................63restriction digestion .........................................................................63
Insite Markers ......................................................................... 25Ionization detection ............................................................. 148Isoelectric focusing ...........................................................34,77
protocol ...........................................................................................77Isoelectric point .................................................................34,77Isotachophoresis .................................................................... 40Isotopes ................................................................................ 147
decay products (table) .................................................................147detection and quantitation ...........................................................147energy spectrum ................................................................... 150,151half life ...........................................................................................147
Kohlrausch discontinuity ...................................................39,67
Laemmli gel system ....................................................6,7,39,67

Index ofSubjects
173173USA: 1-800-526-3867EUROPE: 441 482 646022
M conTInued
N
O
Leading ions ........................................................................... 39Ligation, in - gel ..................................................................... 63Limiting mobility ..................................................................... 64Liquid scintillation ................................................................. 148Liquid scintillation cocktails ..................................................124
biodegradable scintillation cocktails ..........................................126choosing a scintillation fluid.........................................................125cocktails for flow detection ..........................................................134sample oxidation solutions ..........................................................137tissue/gel/filter solubilization .....................................................138traditional scintillation cocktails ................................................... 131
Liquid scintillation countingalkaline samples ...........................................................................154beta particles ................................................................................148Carbon dioxide ....................................................................155,156
protocol ......................................................................................156sample oxidation solutions .......................................................137
Cellulose-Ester Filters ...................................................................155chemiluminescence .............................................................. 152,154cocktails......................................................................................... 151
biodegradable .................................................................. 126,152sample capacity ........................................................................152
coincidence counting ...................................................................152Counting efficiency.......................................................................150Counting windows ........................................................................150Decolorizing .................................................................................154HPLC flow counting ......................................................................156mechanism ....................................................................................148phosphors ..............................................................................145,149Polyacrylamide gels
protocol ......................................................................................156quenching .....................................................................................150Radiation safety
wipe testing ................................................................................157signal interpretation ......................................................................149
light emission patterns ...............................................................149pulse analysis ............................................................................150
solvents ..........................................................................................148static electricity .............................................................................152Tissue samples ..............................................................................155
protocol ......................................................................................155troubleshooting .............................................................................158waste disposal ..............................................................................152
Liquid scintillation countingsamplesdiscrete samples ...........................................................................154
Liquiscint ................................................................................133Low melting point agarose .................................................... 60
DNA purification ............................................................................62in gel ligation ..................................................................................63in gel restriction digestion ..............................................................63
Luminol .................................................................................... 88
MALDI MS Analysis from Insite stained gels ........................71Mass spectroscopy
sample preparation using the Insite System ................................. 71Maxam & Gilbert Sequencing ............................................. 45
electrophoresis ................................................................................46protocol ...........................................................................................45
2-Mercaptoethanol ................................................................31Mercaptoethanol ................................................................... 40
Mercurial fixatives .........................................................108,111Methylation interference ..................................................51,53Methylenebisacrylamide ...................................................... 36Methylene Bisacrylamide ..................................................... 30Microtomy ............................................................................. 117Microwave fixation- Mirsky’s fixative ................................ 107
protocol .........................................................................................107Mini-gels ..................................................................................41Mirsky’s fixative............................................................. 107,117
microwave enhancement .............................................................107Mirsky’s Fixative ................................................................... 101Mobility shift assay ................................................................ 57
protocol ...........................................................................................57Monoflow 1 - 4 ................................................................... 136Monoflow 5 ......................................................................... 135Monofluor .............................................................................132Mounting of tissues .........................................................111,113
mounting media ........................................................................... 103Histomount ................................................................................ 103Hydromount .............................................................................. 103
protocol ..........................................................................................113
Napthalene .......................................................................... 149Neutralin .......................................................................102,108Neutralization Solution...........................................................18Neutrino................................................................................ 147Nitro Blue Tetrazolium ......................................................75,88Nitrocellulose ......................................................................... 89Northern blotting ................................................................... 80
protocol ........................................................................................... 81Nuclean ................................................................................ 140Nucleic Acids ......................................................................... 33Nucleotide .............................................................................. 33Nuclistain ...........................................................................27,79Nuc-Wipes ............................................................................141
Ohm’s law .............................................................................. 35OptiClear ..............................................................................161OptiClear solvents ............................................................... 160Osmium tetroxide .................................................................. 117Oxidizing fixatives ...............................................................108
osmium tetroxide............................................................................117Oxosol 306...........................................................................137Oxosol C14 ...........................................................................137
Paraffin wax ....................................................................110,111PBS (10X) Phosphate Buffered Saline ...................................17PCR Analysis........................................................................... 55Peptide mapping .................................................................... 70
protocol ...........................................................................................70Peroxidase ...............................................................................75Peroxidase-antiperoxidase complex (PAP) ........................ 116Phosphors ............................................................................. 149
secondary .....................................................................................149structures and emission wavelengths (table) ..............................149
Picric Acid Fixatives .............................................................108pKa .................................................................................... 38
L conTInued
M
P

Inde
x of
Subj
ects
174 USA: 1-800-526-3867EUROPE: 441 482 646022
P conTInued
R
S
Alphabetical Index
Polyacrylamide ...................................................................... 36Polyacrylamide gels
counting samples in ......................................................................156Polymerase chain reaction .................................................... 55
gel electrophoresis of products .....................................................56in - gel .............................................................................................63primer dimer ..............................................................................55,56protocol ...........................................................................................55
Polyvinylidine difluoride (PVDF) ........................................... 89Pore size ................................................................................. 36
agarose .....................................................................................36,37polyacrylamide ..............................................................................36
Power (wattage) ...............................................................35,44Primer extension ..................................................................... 50
protocol ...........................................................................................50Protein detection ...............................................................19,84
staining ...................................................................................... 19,84coomassie blue protocols ...........................................................85Insite System ................................................................................85membrane blot staining ..............................................................87powdered stains .......................................................................... 21products for post-electrophoretic visualization ......................... 19silver stain ....................................................................................20silver stain protocol .....................................................................87Sterling Rapid Silver Stain ..........................................................20
Western blotting .......................................................................87,89Protein electrophoresis
buffers for protein electrophoresis ................................................... 6denaturing protein electrophoresis: SDS-PAGE ...........................67
gel formulations ...........................................................................68gel preparation ...........................................................................68gradient gels ................................................................................70gradient gels - protocol ..............................................................69sample preparation .....................................................................67tris-tricine gels ..............................................................................68troubleshooting ............................................................................94
gels for protein analysis ................................................................... 6native protein electrophoresis ........................................................ 74
Ferguson plots ............................................................................. 74gel preparation ...........................................................................75gradient gels ................................................................................ 74sample preparation ..................................................................... 74
pre-mixed buffers ...........................................................................16Protein Loading Buffer Blue (2X) ............................................16Protein purification ..................................................................71
crush and soak ................................................................................ 71electroelution .................................................................................. 71using the Insite System .................................................................... 71
Proteins ................................................................................... 34Protein Standards ................................................................... 25ProtoBlock System .................................................................. 24ProtoGel ................................................................................ 6,7ProtoGel Buffers .................................................................. 6,16ProtoMarkers .......................................................................... 25ProtoMetrics ........................................................................... 25Pulsed field gel electrophoresis (PFGE) ................................ 64
AquaPor ES ..................................................................................... 15
Quenching ..................................................................... 150,151channels ratio ............................................................................... 151
chemical ........................................................................................150color .....................................................................................150,154correction ...................................................................................... 151external standard ......................................................................... 151
Radiation safety ............................................................140,157wipe testing ........................................................................... 141,157
Radioactive decay ............................................................... 147detection and quantitation ...........................................................147
Becquerel ...................................................................................147counts per minute ......................................................................147Curie...........................................................................................147
types of emissions .........................................................................147alpha particles ..........................................................................147beta particles .............................................................................147gamma rays ...............................................................................147
Radioactive emissionsGamma rays
Secondary ẞ emissions ............................................................147Random Amplification of Polymorphic DNA (RAPD) ......... 48Reducing agents .................................................................... 40Reptation ................................................................................. 64Resolution
polyacrylamide ..............................................................................37Restriction mapping ................................................................61
in - gel digestion .............................................................................63Riboflavin .................................................................................31Ribonuclease protection ........................................................ 50
protocol ...........................................................................................50Ribonucleosides ..................................................................... 65RNA electrophoresis .............................................................. 65
gel preparationformaldehyde gels ......................................................................65glyoxal gels .................................................................................65
sample preparation ........................................................................65RNA mapping ........................................................................ 49
S-1 mapping .......................................................................... 49protocol ...........................................................................................49
Salt wave ................................................................................ 39Sample preparation
denaturing protein gelsprotocol ........................................................................................67
native DNA gels .............................................................................54native protein gels .......................................................................... 74RNA ...............................................................................................65
Sanger dideoxy sequencing ................................................. 46electrophoresis ................................................................................46protocol ...........................................................................................46substrate preparation .....................................................................46
Saponin ................................................................................. 115Scintillation detection ........................................................... 148Scintillation Vials .................................................................. 142Scintillators ........................................................................... 145SDS ..............................................................31,34,39,40,67SDS-PAGE ......................................................................... 39,74
buffers for SDS-PAGE ....................................................................16gel matrices for SDS-PAGE ..........................................................6,7
Secondary ẞ emissions ....................................................... 147
Q conTInued
Q

Index ofSubjects
175175USA: 1-800-526-3867EUROPE: 441 482 646022
S conTInued T conTInued
T
U
V
W
X
Sectioning ..............................................................................110electron microscopy .............................................................. 110,117
positive staining ..........................................................................117frozen sections .............................................................................. 110paraffin blocks .............................................................................. 110
SequaGel MD .........................................................................12SequaGel XR ...........................................................................12Silver staining
protein protocol ..............................................................................87Sterling Rapid Silver Stain .............................................................20
Solid scintillation .................................................................. 148Solusol .................................................................................. 138Solvents for liquid scintillation counting ............................. 148Southern blotting .................................................................... 80
protocol ...........................................................................................82SSCP analysis ......................................................................... 59
SequaGel MD ................................................................................ 12Stacking gel .......................................................................39,67Staining (histology) ................................................................111
electron microscopy ......................................................................117Hematoxylin and Eosin stain ........................................................113
histological stains ..................................................................... 104protocol .......................................................................................113
Static electricity in LSC ........................................................ 152Sterling Rapid Silver Stain ..................................................... 20Submarine gels ...................................................................... 60Superoxide detection .......................................................... 120
Diogenes .......................................................................................120Superoxide dismutase ............................................................75Surfactants .......................................................................40,151
TBE bufferglycerol artifacts .............................................................................54
TBE Buffer (10X or 5X) ...........................................................18TEMED ...............................................................................31,36Tissue processing
clearing ........................................................................................ 109Histo-Clear ................................................................................ 110xylene........................................................................................ 109
dehydration .................................................................................. 109electron microscopy ......................................................................117schedule ....................................................................................... 109
Tissue samples (LSC) ........................................................... 155TLC plates ............................................................................. 155
counting scraped samples ...........................................................155fluorography .................................................................................155
Toluene.....................................................................111,148,151Tracers .................................................................................. 147Tracking dyes ......................................................................... 54Trailing ions............................................................................. 39Transmission electron microscopy ........................................ 116Tricine .....................................................................................31Triple Dye Loading Buffer (6X) ..............................................18Tris ............................................................................................31Tris-Glycine Electroblotting Buffer (10X) ...............................17Tris-Glycine-SDS PAGE Buffer (10X) ....................................16Tris-Tricine-SDS PAGE Buffer (10X) .......................................16Triton-X100 ............................................................................151
Troubleshootingelectrophoresis
agarose gels ................................................................................93denaturing DNA-PAGE gels ......................................................92denaturing protein gels ...............................................................94
liquid scintillation counting...........................................................158TTE buffer ................................................................................ 47TTE Glyerol Tolerant Buffer (20X) ..........................................18Tube gels ..................................................................................41Tween-20 ................................................................................31Two dimensional electrophoresis .......................................... 77
Uniscint BD ....................................................................130,135Uracil interference assay ..................................................51,53
protocol ...........................................................................................53Uranyl acetate ....................................................................... 117Urea ................................................................... 31,40,43,44UreaGel 6 and 8 ................................................................... 10
Vacuum blotting ..................................................................... 80Vertical gels .............................................................................41
Waste issues ......................................................................... 156Wedge gel ............................................................................. 46Western blotting ................................................................22,89
blocking ...........................................................................................89pre-mixed buffers ..................................................................... 16,24products ...........................................................................................22protocol ...........................................................................................90
Wipe testing ......................................................................... 157Nuc-Wipes ................................................................................... 141
Xylene ...........................................................................109,151Xylene Cyanole FF ................................................................. 28

ORDERING INFORMATION
Contact Us Ordering Shipping and Pricing
UNITED STATES
Orders may be placed by mail, fax, telephone, Email or via the internet.Customer service representatives are available to receive your order Monday through Friday 8:30AM - 5:00PM (Eastern time).
Call toll free: (800) 526-3867In Georgia: (404) 699-2121
A written confirmation is required for telephone orders.
During non-office hours, orders may be received by:
Fax: (404) 699-2077
Email:[email protected]
Web:www.nationaldiagnostics.com
Standard mail:
National Diagnostics, Inc.305 Patton Drive Atlanta, Georgia 30336
UNITED KINGDOM
Standard Mail:
Unit 4, Fleet Business ParkItlings LaneHessle, Hull HU139LXEngland
Phone: (0482) 646022Fax: (0482) 646013
Email:[email protected]
PURCHASINGPROCEDURES
Please be prepared to supply the following information for fastest processing of your order:
1) Purchase order number. 2) Complete billing address. 3) Shipping address (if different from billing address). 4) Name of end user. 5) Name of Primary Investigator. 6) Product name and order number. 7) Quantity ordered. 8) Any special instructions (express shipping, etc.).
CONDIT IONS OF SALE
All orders are shipped F.O.B. shipping point.
Payment terms are net 30 days from date of shipment.
National Diagnostics products are sold for research laboratory use only. See Health and Safety Suggestions (facing page) for safe handling procedures.
DEL IVERYINFORMATION
Orders are usually processed and shipped within 24 hours. Delivery may vary with the carrier. Air delivery is available upon request. Research scientists with unique delivery requirements may arrange for special or expedited handling. Some items may incur a handling fee. Due to shipping regulations for hazardous chemicals, some products may incur additional hazardous materials shipping charges.
DAMAGED SHIPMENTS
Claims for damage must be filed with the carrier. Visible damage must be noted on the carrier’s delivery receipt. Concealed damage must be reported to the carrier within 15 days.
PR ICING
Prices listed are for the most commonly ordered quantities. Quotations are available upon request. If your purchasing department is not familiar with this procedure, they may contact us for further information.
National Diagnostics strives to maintain constant list pricing throughout the duration specified on its catalog. However, raw material costs can be extremely volatile, and we reserve the right to change pricing. Actual list prices may differ from the printed prices within this catalog.


NONTOXIC/FLAMMABLE DESIGNATIONS
Please note that a “nontoxic” or “nonflammable” designation does not indicate that the material is hazard free. In many cases, the designation refers to a product with significantly reduced hazards, which can be shipped and stored as a nonhazardous material.
Ingestion of a “nontoxic” compound in significant amounts may entail serious health risks; similarly, “nonflammable” solvents can be made to burn if they are heated sufficiently. Prudent safety precautions must be observed.
WARRANTY
The health and safety information herein is offered in good faith as accurate, but without guarantee. Conditions of use and product suitability for a particular use are beyond our control. All risks of use of our products are therefore assumed by the user. Appropriate warnings, safe handling procedures and safety data sheets should be provided to users. Nothing herein is to be construed as recommending the violation of any patent, law or regulation.
GENERAL GUIDELINES
Many laboratory chemicals are hazardous to the eyes, or can damage or be absorbed through the skin. Good laboratory practice excludes eating and drinking from areas where hazardous chemicals are in use. Minimize exposure to chemicals by avoiding mouth pipetting, working in a fume hood, planning experiments so that actual manipulation of toxic compounds is kept to a minimum, and always clean up any spill immediately.
PROTECTIVE CLOTHING
Even the best technique cannot completely eliminate the possibility of a spill or splash with concomitant skin or eye contact. It is imperative that protective gloves, eyewear, faceshields and lab coats be worn when appropriate.
V E N T I L A T I O N A N D F U M E HOODS
Safe handling of organic solvents, or volatile solids such as acrylamide, requires adequate ventilation and/or the use of a fume hood to prevent the accumulation of harmful levels of vapor. The product MSDS will provide guidelines for exposure limits- use a fume hood with adequate face velocity if required.
SAFETY DATA SHEETS
Safety data sheets are available for all National Diagnostics products. The SDS should be consulted before any use of the product. The SDS provides important information about routes of exposure, toxicity levels, health effects and emergency procedures. It also gives guidelines for the safe use and handling of the product.
ACRYLAMIDE
Acrylamide is a neurotoxin which is easily absorbed through the skin, or by inhalation or ingestion. Symptoms of acrylamide toxicity include tingling, fatigue and slurred speech.
Solid acrylamide is particularly hazardous, as it sublimates, generating hazardous levels of acrylamide vapor. In addition, the powder is easily spilled. Solid acrylamide should be handled in a fume hood, and any powder spills must be cleaned up immediately.
Solutions of acrylamide significantly reduce handling hazards. The sublimation rate and risk of spillage are both reduced. Spills are more easily contained and cleaned. The chief hazard from solutions of acrylamide is direct contact with skin or eyes. Gloves and eye protection must be worn when handling these materials. Because the vapor hazard is not completely eliminated, solutions of acrylamide should be used only in a well ventilated area.
ORGANIC SOLVENTS
National Diagnostics endeavors to supply safer solvent substitutes for toxic material such as toluene and xylene. These solvents, while less hazardous than the materials they replace, are irritants, skin defatting agents, and present toxicity and aspiration hazards if ingested. Eye protection, gloves and adequate ventilation are required.
HEALTH AND SAFETY
Handling Chemicals Items in this Catalog Specific Hazards

Austria
Biozym Biotech Trading GmbHWehlistr 27bA-1200 WienTel: +43 1 334 0156 0Email: [email protected]: www.biozym.com
Belgium
VWR International BVBA Researchpark Haasrode 2020Leuven, BelgiumB3001Tel: 016 385 011Email: [email protected]: www.be.vwr.com
Belgium & LuxembourgGentuar BvhaAvenue de l’Armée 68/B41040 Brussels BelgiumTel: +32 2 732 5628Fax: +32 2 732 4414 Email: [email protected]: www.gentaur.com
Canada
Diamed Lab Supplies Inc.3069 Universal DriveMississauga, OntarioCanada L4X 2E2Tel: (800) 434-2633 (905) 625-6021 Fax: (905) 625-6280Email: [email protected]: www.diamed.ca
Chile Fermelo S.A.Terranova 150, Piso 1; ProvidenciaSantiago, Chile Tel: 562 2247 2976 Fax: 562 2247 2977Email: [email protected]: www.fermelo.cl
China
Sanger Biotechnology CO., Ltd.630 Chifeng RoadShanghai, China 200083Tel: 400-920-8916Fax: 86-21-35120405Email: [email protected]: www.sangerbio.com
Croatia Gorea Plus d.o.oSvetonedjeljska costa 9710431 Sveta Nedelja, CroatiaTel: +385 1 33 69 610Email: [email protected]: www.gorea-plus.hr
Denmark
BN Instruments A/SBalskildevej 218355 Solbjerg, DenmarkTel: 45 44 53 78 88Fax: 45 44 53 79 88Email: [email protected]
Finland
Teknocalor OYSinikellonkuja 401300 VANTAA, FinlandTel: +358 (0) 10 820 1100Email: [email protected]: www.labtronic.fi
France
VWR International SAS201 rue Carnot F-94126 Fontenay-sous-bois CEDEXTel: 33145148550Fax: 33145148542Email: [email protected]
Germany
Biozym Scientific GmbHSteinbrinksweg 27 OldendorfGermany 31840Tel: +49 5152 9020Fax: +49 5152 2070Email: [email protected]: www.biozym.com
Greece
Biodynamics S.A. 54A Katehaki Str115 25 AthensTel: +30 210 6449421 Fax: +30 2101 6442266 Email: [email protected]: www.biodynamics.gr
Ireland
Bio-Sciences Ltd.3 Charlemont TerraceCrofton Rd Dun Laoghaire Co Dublin IrelandTel: 353 12845122 Fax: 353 12845135 Email: [email protected]
Israel
Gadot Chemical Terminals Ltd.Hamelacha Street 5Poleg Industrial AreaNetanya 4250540Tel: +972-9-8929645Fax: +972-9-8858616Email: [email protected]: www.gadot.com
Italy
Polymed S.R.L. 50028 Sambuca Val de Pesa (FI)Via L. da Vinci, 55Firenze, Italy 50028Tel: +39 055 8071285 Fax: +39 055 8071703Email: [email protected]: www.polymed.it
Histology Products OnlyCELLTECH S.r.l.Via Chambery 93/107 U10142 Torino, Italy Tel: +39 011 4115123 +39 011 4111169Fax: +39 011 5702104 Email: [email protected]: www.cell-tech.it
Japan
LSC Products OnlySowa Trading Co., Inc.Mr. Susuma KuwashimaSegi Building1-7-1 Iwamoto-choChiyoda-Ku, Tokyo 101-0032Tokyo, Japan Tel: +81-3-3862-2700 Fax: +81-3-3862-6300Email: [email protected]: www.sowa-trading.co.jp
Cosmo Bio Co., Ltd.Toyo-Ekimae Building2-2-20 Toyo Koto-KuTokyo, Japan 135-0016Tel: +81-3-5632-9610 Fax: +81-3-5632-9620Email: [email protected]: www.cosmobio.co.jp
Techno Science LtdIkefuji Building4-5-8, Shiba, Minato-KuTokyo, Japan 108-0014Tel: 81-3-5232-6961 Fax: 81-3-5232-6964
Korea
Fine Life Science Co., Ltd.Rm 907 Woolim Lion’s Valley Bldg. A371-28 Gosan-DongGeumcheon-guSeoul, Korea 153-803Tel: 82-2-2026-5350Fax: 82-2-2026-5369Email: [email protected]: www.finels.com
Chayon, Inc.22 Yeoksam-ro 7-gilGangnam-gu, Seoul 135-936KoreaTel: +82-2-3471-4100 Fax: +82-2-3471-0040 Email: [email protected]: www.chayon.co.kr
The Netherlands
BiozymTC B.V.Rötscherweg 616374 XW LandgraafThe NetherlandsTel: +31 (0)45 5338777Fax: +31 (0)45 5338799 Email: [email protected]: www.biozymtc.com
Norway
Nerliens Meszansky ASØkerveien 121 0579 OsloTel: +47 22 66 65 00Fax: +47 22 66 65 01 Email: [email protected]: www.nmas.no
Poland
GENTAUR Poland Sp. z o.o. ul. Grunwaldzka 88/A m.281-771 Sopot, PolandTel: 058 710 33 44 Fax: 058 710 33 48 Email: [email protected]: www.gentaur.com
Portugal
Frilabo LdaRua Poça das Rãs109 MilheirósMaia, Portugal 4475-265Tel: (+351) 225 188 912Fax: (+351) 214 603 144E-mail: [email protected]
Serbia and Montenegro Gorea Plus d.o.o za trgovinuSvetonedeljska Cesta 9797 Kerestinec10431 SvetaCroatiaTel: 01/336901Fax: 01/336911Email: [email protected]: www.gorea-plus.hr
Singapore
Innovative Biotech Pte. Ltd. 67 Ayer Rajah Crescent #07-10 Ayer Rajah Industrial EstateSingapore 139950Tel: 65 (6) 779 1919 Fax: 65 (6) 779 1112Email: [email protected]: www.innobiotech.com.sg
Spain
Laboratorios Conda, S.A.La Forja, 9Torrejon De Ardoz, MAD, Spain 28850 Tel: +34917610200Fax: ++49 641/39221Email: [email protected]: www.condalab.com
Histology Products OnlyCasa Alvarez Mayor, 70 Bajo Derecho28013 Madrid, SpainTel: 91-548-10-16Fax: 91-548-05-27Email: [email protected] Web: www.casaalvarez.com
Itisa Biomedicina. S.A.(portal 1, Piso 2, Oficina 1)Crta Fuencarral-AlcobendasMadrid 28108, SpainKM 15,700Tel: 3416572393~94 Fax: 3416621769 Email: [email protected]
Sweden
BioNordika Sweden ABBox 21160Stockholm, 10031 SwedenTel: +46(0)8-306010Fax: +46(0)8-306015Email: [email protected]: www.invitro.se
Switzerland
Chemie Brunschwig AGAuf dem Wolf 10CH-4052 Basel, SwitzerlandTel: +41 61 3089111Fax: +41 61 3089119Email: [email protected]: www.brunschwig-ch.com
Taiwan
Rainbow Biotehcnology Co, Ltd.2F, No. 253, Sec. 4Chung King N. Rd.Taipei 111, Taiwan, R.O.C.Tel: +886-2-28118200Fax: +886-2-28118628Email: [email protected]: www.rainbowbiotech.com.tw
Thailand
Pacific Science Co., Ltd.62, 64 Soi Charansanitwong 49/1Charansanitwon Rd. BangbumruBangplad Bangkok 10700ThailandTel: 66-2-4330068-9Fax: 66-2-8819371email: [email protected]
United Kingdom
AGTC Bioproductst/a National Diagnostics UKUnit 4 Fleet Business ParkItlings Lane, HessleEast Riding of YorkshireHU139LXTel: 01482646020 01482646022Fax: 01482646013Email: [email protected]: www.agtcbioproducts.com
Geneflow Ltd.Paul Fisher House1 The Sycamore TreeElmhurst Business ParkElmhurst, LichfieldStaffordshire WS138EXTel: +44 (0) 1543 414704Fax: +44 (0) 1543 255666Email: [email protected]: www.geneflow.co.uk
Fisher Scientific LtdBiship Meadow RdLoughborough, Leicestershire LE11 5RGTel: 01509555500Fax: 01509231893Email: [email protected]: www.fisher.co.uk
United States
Southeast
Bartlett-Williams Scientific Resources239 Flemington RdChapel Hill, NC 27517Tel: (919) 967-8111Fax: (919) 967-2227Email: [email protected]
IMGEN TechnologiesAlexandria, VA 22314Tel: (703) 549-2866Fax: (703) 997-1290Email: [email protected]: www.imgen.com
BioMedical Solutions Inc.3727 Greenbriar, Ste. 304Stafford, TX 77477Tel: (281) 240-5893Fax: (281) 242-6294Email: [email protected]
NortheastDavid CelanderTel: (781) 258-1786Email [email protected]
Laboratory Products Sales1665 Buffalo RoadRochester, NY 14624Tel: (800) 388-0166 toll free (585) 247-4720Fax: (585) 247-6686Email: [email protected]: www.lpsinc.com
MidwestJohn GarrettTel: (614) 284-5514Email: [email protected]
Bio-Resources Inc.1423 South Rock Hill Rd.St. Louis, MOTel: (314) 968-2326Fax: (314) 968-2280Email [email protected]
DAI Scientific EquipmentKathie MannieArea Representative for MN, ND and SDLake Elmo, MN 55042Tel: (651) 351-2011Cell: (612) 812-2860Email: [email protected]
WestLife Science Products5989 Iris ParkwayPO Box 1150Frederick, CO 80530Tel: (800) 245-LSPI (5774)Fax: (303) 452-7689Email: [email protected]: www.e-lspi.com
Lynn Haar - Life Science ProductsTel: (708) 361-3224Email: [email protected]
Protolum TechnologiesRocky ChoiWalnut Creek, CA 94596Tel: (925) 808-1064Fax: (925) 954-6503Email: [email protected]: www.protolum.com
NATIONAL DIAGNOSTICS Around the World
Direct Sales Office U.S.A.
National Diagnostics U.S.A.305 Patton DriveAtlanta, Georgia 30336
Toll Free: 800-526-3867Phone: 404-699-2121Fax: 404-699-2077Email: [email protected]: www.nationaldiagnostics.com
Direct Sales Office U.K.
National Diagnostics (UK) Ltd / AGTC BioproductsUnit 4 Fleet Business ParkItlings Lane, HessleEast Riding of Yorkshire HU139LXEngland
Phone: 44 (0) 1482 646020 44 (0) 1482 646022Fax: 44 (0) 1482 646013Email: [email protected]: www.agtcbioproducts.com
In ternat ional Representa t ion