Catalan Government Budget 2011
53
1
-
Upload
miqui-mel -
Category
News & Politics
-
view
396 -
download
0
Transcript of Catalan Government Budget 2011

1

2
Budget 2011Austerity, social welfare, credibility, joint responsibility
3
Contents:Budget FeaturesThe Generalitat’s budgetPublic sector budgetMacroeconomic framework

4
Budget Features
Budget Features

5
Budget 2011 guidelines
Austerity: guaranteeing the Generalitat’s public finances sustainability
Social welfare as a priority: maintaining the welfare state main services
Credibility: setting a severe, but attainable spending reduction goal
Joint responsibility: the final deficit will depend on the CentralGovernment’s cooperation and overall institutional loyalty
Budget Features

6
Starting point
Revenues: The Generalitat’s non-financial revenues fell by €3.4bn between 2009and 2010, bringing them down to 2006 levels.
Expenditures: Non-financial expenditures rose by 60% between 2004 and 2010.
Deficit increase: The Generalitat’s budget deficit started increasing in 2007,surpassing €5bn in 2008. In 2010, the deficit reached €7.6bn, or 3.86% ofCatalunya’s Gross Domestic Product.
Unsustainable increase of debt: Total debt reached 16.2% of GDP at the end of2010, more than twice the 7.5% reached in 2007.
Budget Features

7
Government deficit and total debt (As % of GDP in ESA terms)
Source: Bank of Spain, Government of Spain –department of State Administration- and Generalitat de Catalunya –Department for the Economy and Knowledge.
-0.73 -0.39 -0.45 -0.22 -0.62
-2.60 -2.41.-3,86
7.4 7.8 8.1 7.6 7.5
9.3
11.9
16.2
0,0
2,0
4,0
6,0
8,0
10,0
12,0
14,0
16,0
18,0
-6,00
-4,00
-2,00
0,00
2,00
4,00
6,00
8,00
10,00
12,00
2003 2004 2005 2006 2007 2008 2009 2010 (liq.prov.)
% debt / GDP% deficit / GDP
Dèficit DeuteBudget deficit Debt
Budget Features

8
Austerity
Strong commitment to achieve the European Union’s Stability and Growth Pact goals
Keeping the 2010 debt increase rate is unsustainable
The welfare state can only be guaranteed by healthy government finances
The Generalitat’s financial health assures and reinforces self-government
Budget Features

9
Amount
Actual 2010 expenditures (general fund non-financial expenditures) 26,792.5
Commitment to reduce 10% of 2010 actual expenditures -2,680.0.
General fund non-financial expenditures ceiling (in ESA terms) for 2011 24,112.5
Commitment to cut general fund non-financial expenditures (in ESA terms)1
M€
1Non-financial expenditures in ESA terms (European System of National and Regional Accounts ESA95) includes the Generalitat’s expenditure chapters 1 to 7 and capital contributions (chapter 8), to finance the entities’ deficits and ESA entities deficit not financed by capital contributions. General fund expenditures do not include expenditures financed by earmarked revenues.
Budget Features
10
Budget 2010 Budget 2011 2011 / 2010
amount amount M€ % change
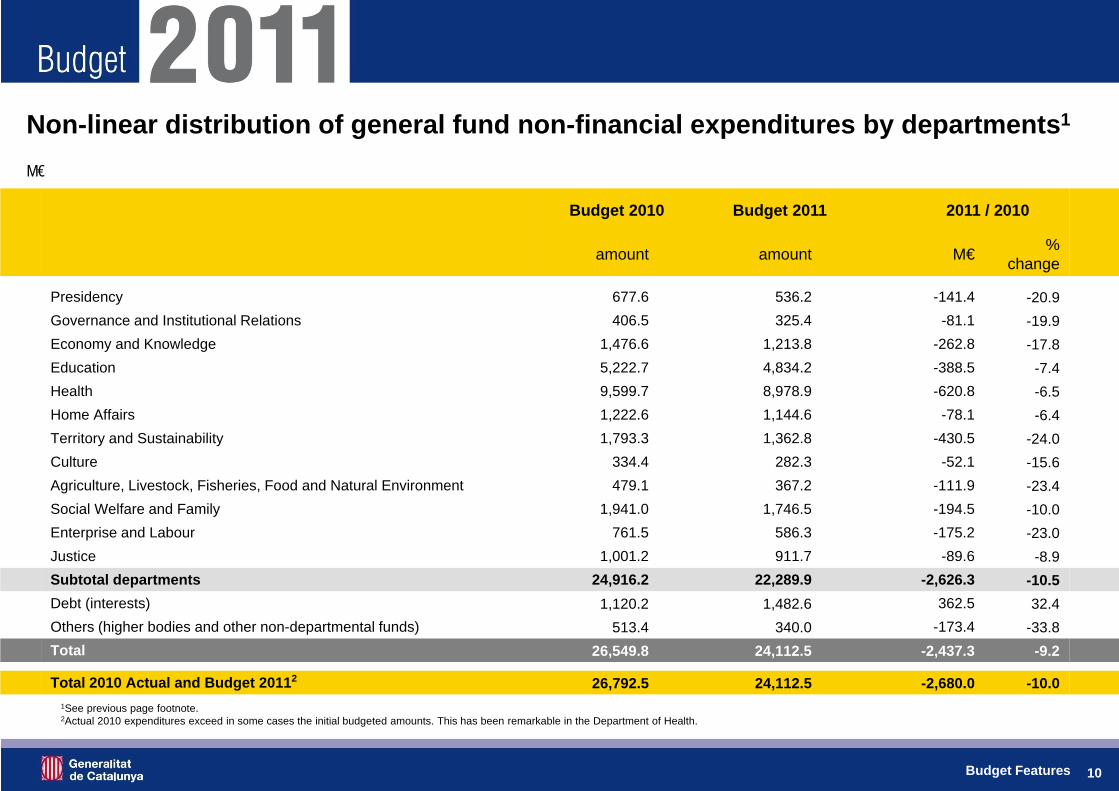
Presidency 677.6 536.2 -141.4 -20.9Governance and Institutional Relations 406.5 325.4 -81.1 -19.9Economy and Knowledge 1,476.6 1,213.8 -262.8 -17.8Education 5,222.7 4,834.2 -388.5 -7.4Health 9,599.7 8,978.9 -620.8 -6.5Home Affairs 1,222.6 1,144.6 -78.1 -6.4Territory and Sustainability 1,793.3 1,362.8 -430.5 -24.0Culture 334.4 282.3 -52.1 -15.6Agriculture, Livestock, Fisheries, Food and Natural Environment 479.1 367.2 -111.9 -23.4Social Welfare and Family 1,941.0 1,746.5 -194.5 -10.0Enterprise and Labour 761.5 586.3 -175.2 -23.0Justice 1,001.2 911.7 -89.6 -8.9Subtotal departments 24,916.2 22,289.9 -2,626.3 -10.5Debt (interests) 1,120.2 1,482.6 362.5 32.4Others (higher bodies and other non-departmental funds) 513.4 340.0 -173.4 -33.8Total 26,549.8 24,112.5 -2,437.3 -9.2
Total 2010 Actual and Budget 20112 26,792.5 24,112.5 -2,680.0 -10.0
M€
Non-linear distribution of general fund non-financial expenditures by departments1
1See previous page footnote.2Actual 2010 expenditures exceed in some cases the initial budgeted amounts. This has been remarkable in the Department of Health.
Budget Features

11
Evolution of budgeted and actual interest expenditures1
M€
Source: Generalitat de Catalunya Budget.
Debt interests growth in 2011 (Generalitat): Over 2010 budget Over 2010 actual359.2 558.7
1Generalitat administration. The overall budgeted public sector interest expenditures for 2011 are 1,869.6M€
Budget Features
440.7491.2
561.1
678.7
808.5
1,118.7
1,477.9
480.4 504.7570.3
696.9796.6
919.2
0
200
400
600
800
1.000
1.200
1.400
1.600
2005 2006 2007 2008 2009 2010 2011
Budget Actual
12
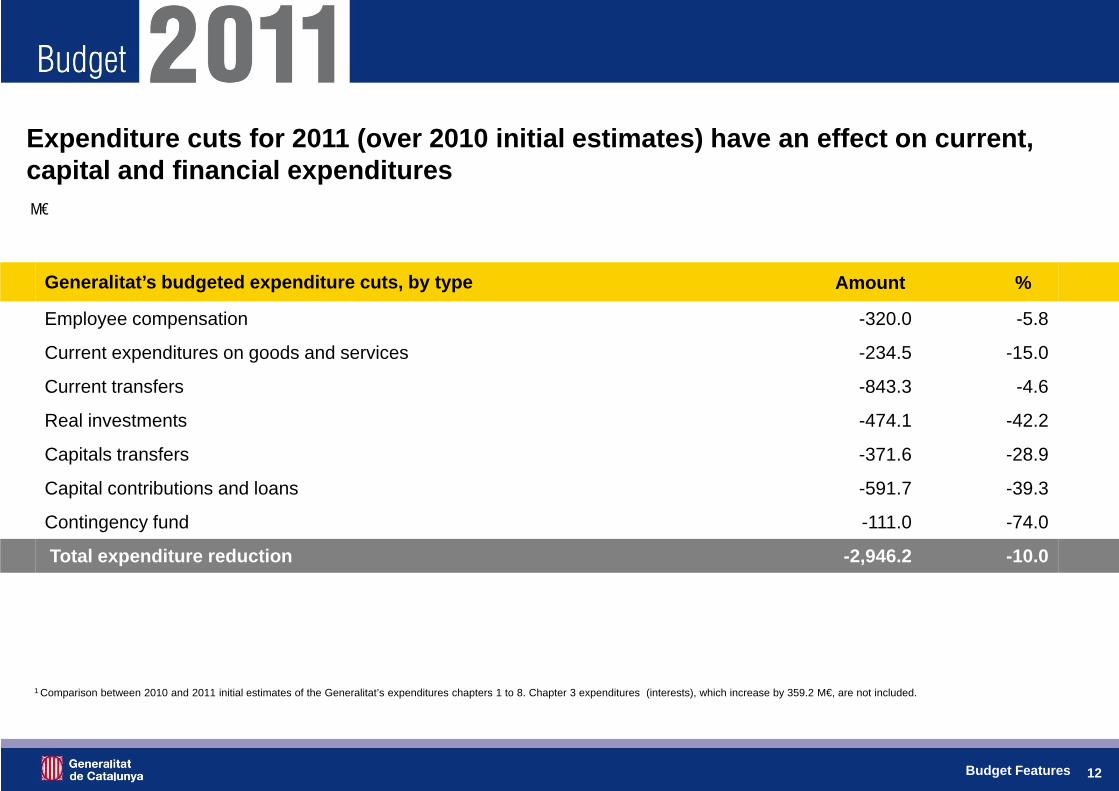
Generalitat’s budgeted expenditure cuts, by type Amount %
Employee compensation -320.0 -5.8
Current expenditures on goods and services -234.5 -15.0
Current transfers -843.3 -4.6
Real investments -474.1 -42.2
Capitals transfers -371.6 -28.9
Capital contributions and loans -591.7 -39.3
Contingency fund -111.0 -74.0
Total expenditure reduction -2,946.2 -10.0
M€
Expenditure cuts for 2011 (over 2010 initial estimates) have an effect on current, capital and financial expenditures
1 Comparison between 2010 and 2011 initial estimates of the Generalitat’s expenditures chapters 1 to 8. Chapter 3 expenditures (interests), which increase by 359.2 M€, are not included.
Budget Features

13
DepartmentsBudget 2010 Budget 2011
Amount Amount
Healthcare 9,599.7 8,978.9
Education 5,222.7 4,834.2
Social welfare and family 1,941.0 1,746.5
Total welfare departments 16,763.4 15,559.6
Total departments 24,916.2 22,289.9
% welfare expenditures to total departments general fund non-financial expenditures in ESA terms 67% 70%
Social welfare as a priority (general fund non-financial expenditures in ESA terms)
Figures in M€
Budget Features
14
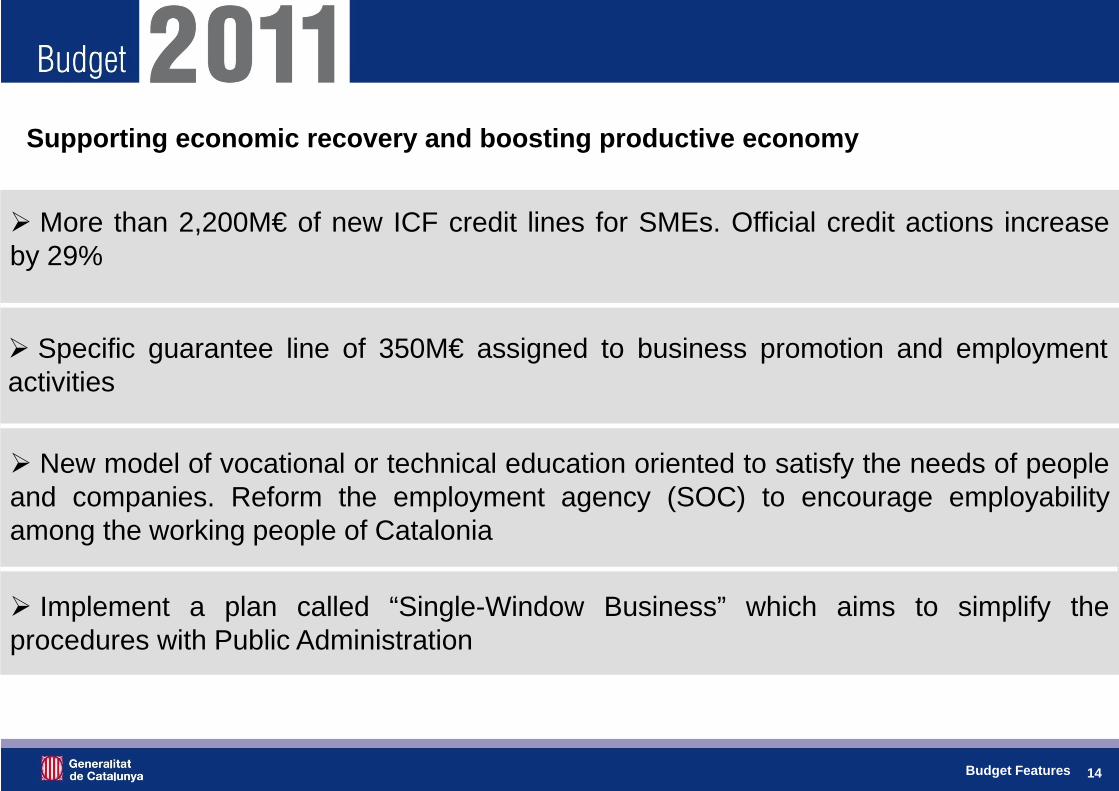
Supporting economic recovery and boosting productive economy
Budget Features
More than 2,200M€ of new ICF credit lines for SMEs. Official credit actions increaseby 29%
Specific guarantee line of 350M€ assigned to business promotion and employmentactivities
New model of vocational or technical education oriented to satisfy the needs of peopleand companies. Reform the employment agency (SOC) to encourage employabilityamong the working people of Catalonia
Implement a plan called “Single-Window Business” which aims to simplify theprocedures with Public Administration

15
CredibilityGovernment’s strong commitment to address the Generalitat’s finances
The deficit reduction goal is tough, but attainable
Deficit reduction rigor slows down previous rates of debt increase
Responsibility and achieving commitments enhances credibility and confidence from
international markets and institutions
Prudence in revenue forecasting in order to avoid deviations
Fiscal year 2012 will deepen expenditure rationalisation and saving
Budget Features
16
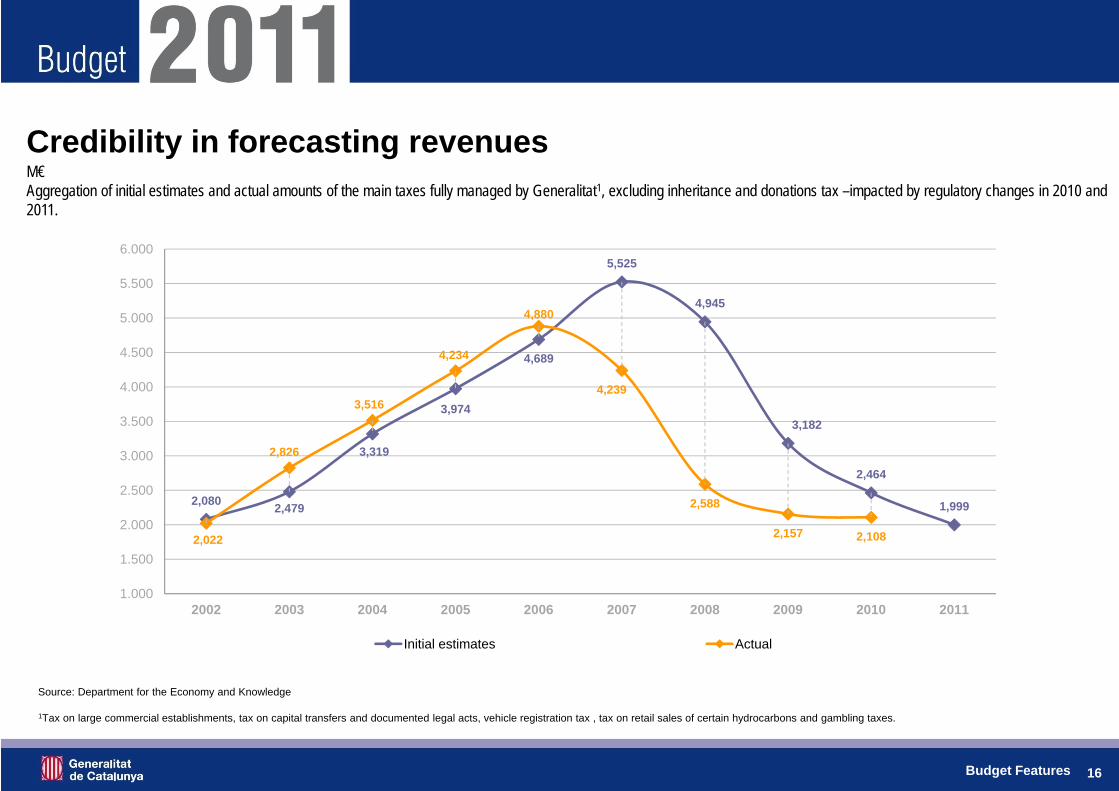
Credibility in forecasting revenues
Source: Department for the Economy and Knowledge
M€Aggregation of initial estimates and actual amounts of the main taxes fully managed by Generalitat1, excluding inheritance and donations tax –impacted by regulatory changes in 2010 and 2011.
1Tax on large commercial establishments, tax on capital transfers and documented legal acts, vehicle registration tax , tax on retail sales of certain hydrocarbons and gambling taxes.
2,080 2,479
3,319
3,974
4,689
5,525
4,945
3,182
2,464
1,999
2,022
2,826
3,516
4,234
4,880
4,239
2,588
2,157 2,108
1.000
1.500
2.000
2.500
3.000
3.500
4.000
4.500
5.000
5.500
6.000
2002 2003 2004 2005 2006 2007 2008 2009 2010 2011
Initial estimates Actual
Budget Features
17
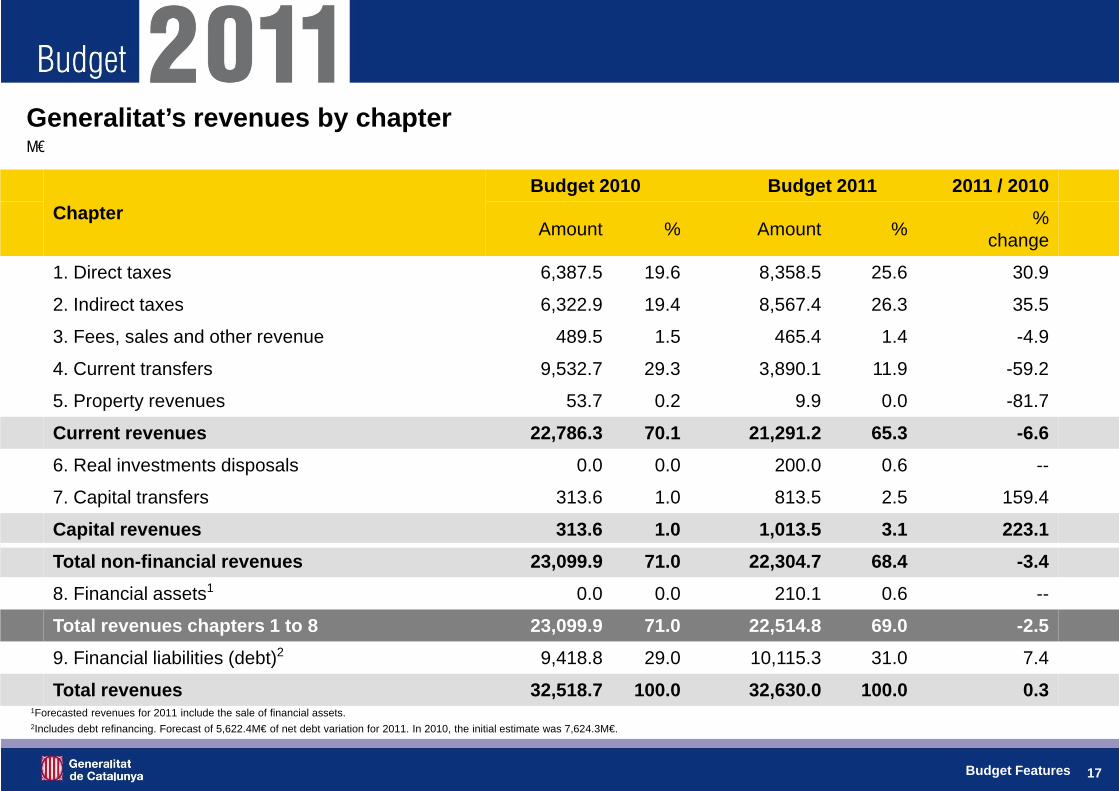
Generalitat’s revenues by chapterM€
ChapterBudget 2010 Budget 2011 2011 / 2010
Amount % Amount % % change
1. Direct taxes 6,387.5 19.6 8,358.5 25.6 30.9
2. Indirect taxes 6,322.9 19.4 8,567.4 26.3 35.5
3. Fees, sales and other revenue 489.5 1.5 465.4 1.4 -4.9
4. Current transfers 9,532.7 29.3 3,890.1 11.9 -59.2
5. Property revenues 53.7 0.2 9.9 0.0 -81.7
Current revenues 22,786.3 70.1 21,291.2 65.3 -6.66. Real investments disposals 0.0 0.0 200.0 0.6 --
7. Capital transfers 313.6 1.0 813.5 2.5 159.4
Capital revenues 313.6 1.0 1,013.5 3.1 223.1Total non-financial revenues 23,099.9 71.0 22,304.7 68.4 -3.48. Financial assets1 0.0 0.0 210.1 0.6 --
Total revenues chapters 1 to 8 23,099.9 71.0 22,514.8 69.0 -2.59. Financial liabilities (debt)2 9,418.8 29.0 10,115.3 31.0 7.4
Total revenues 32,518.7 100.0 32,630.0 100.0 0.31Forecasted revenues for 2011 include the sale of financial assets.2Includes debt refinancing. Forecast of 5,622.4M€ of net debt variation for 2011. In 2010, the initial estimate was 7,624.3M€.
Budget Features
18
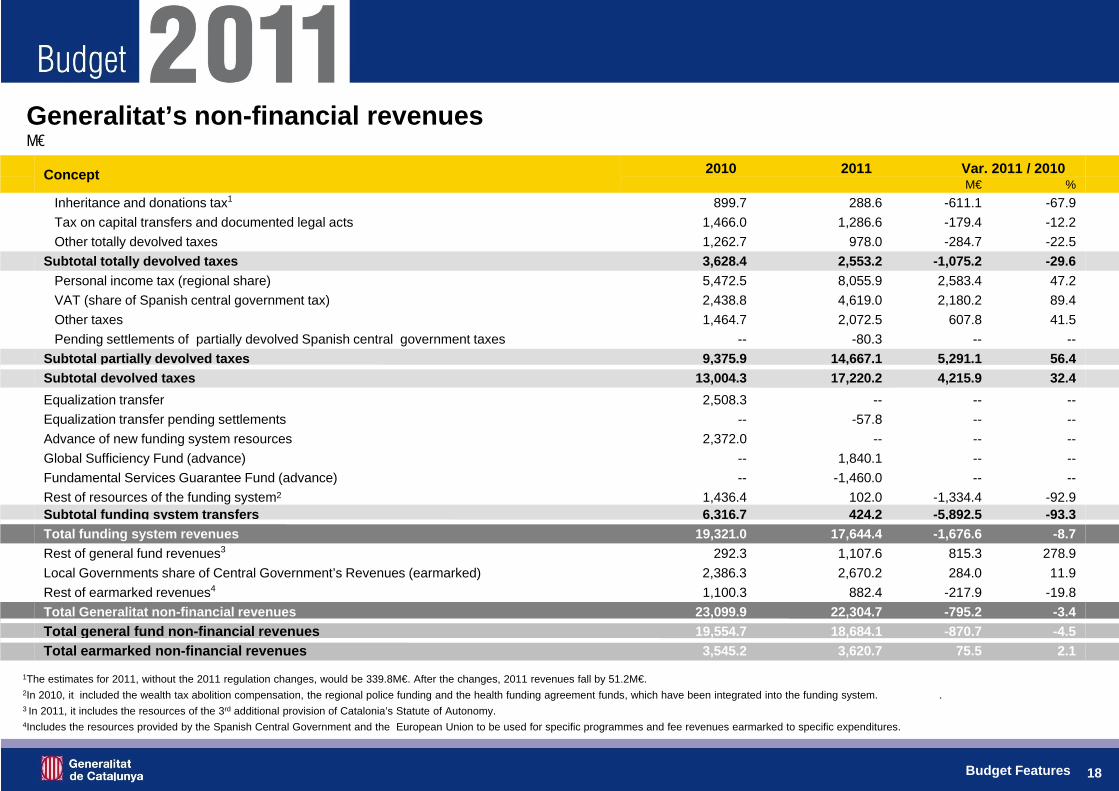
Concept 2010 2011 Var. 2011 / 2010M€ %
Inheritance and donations tax1 899.7 288.6 -611.1 -67.9Tax on capital transfers and documented legal acts 1,466.0 1,286.6 -179.4 -12.2Other totally devolved taxes 1,262.7 978.0 -284.7 -22.5
Subtotal totally devolved taxes 3,628.4 2,553.2 -1,075.2 -29.6Personal income tax (regional share) 5,472.5 8,055.9 2,583.4 47.2VAT (share of Spanish central government tax) 2,438.8 4,619.0 2,180.2 89.4Other taxes 1,464.7 2,072.5 607.8 41.5Pending settlements of partially devolved Spanish central government taxes -- -80.3 -- --
Subtotal partially devolved taxes 9,375.9 14,667.1 5,291.1 56.4Subtotal devolved taxes 13,004.3 17,220.2 4,215.9 32.4Equalization transfer 2,508.3 -- -- --Equalization transfer pending settlements -- -57.8 -- --Advance of new funding system resources 2,372.0 -- -- --Global Sufficiency Fund (advance) -- 1,840.1 -- --Fundamental Services Guarantee Fund (advance) -- -1,460.0 -- --Rest of resources of the funding system2 1,436.4 102.0 -1,334.4 -92.9Subtotal funding system transfers 6,316.7 424.2 -5,892.5 -93.3Total funding system revenues 19,321.0 17,644.4 -1,676.6 -8.7Rest of general fund revenues3 292.3 1,107.6 815.3 278.9Local Governments share of Central Government’s Revenues (earmarked) 2,386.3 2,670.2 284.0 11.9Rest of earmarked revenues4 1,100.3 882.4 -217.9 -19.8Total Generalitat non-financial revenues 23,099.9 22,304.7 -795.2 -3.4Total general fund non-financial revenues 19,554.7 18,684.1 -870.7 -4.5Total earmarked non-financial revenues 3,545.2 3,620.7 75.5 2.1
M€Generalitat’s non-financial revenues
1The estimates for 2011, without the 2011 regulation changes, would be 339.8M€. After the changes, 2011 revenues fall by 51.2M€.2In 2010, it included the wealth tax abolition compensation, the regional police funding and the health funding agreement funds, which have been integrated into the funding system. .3 In 2011, it includes the resources of the 3rd additional provision of Catalonia’s Statute of Autonomy.4Includes the resources provided by the Spanish Central Government and the European Union to be used for specific programmes and fee revenues earmarked to specific expenditures.
Budget Features
19
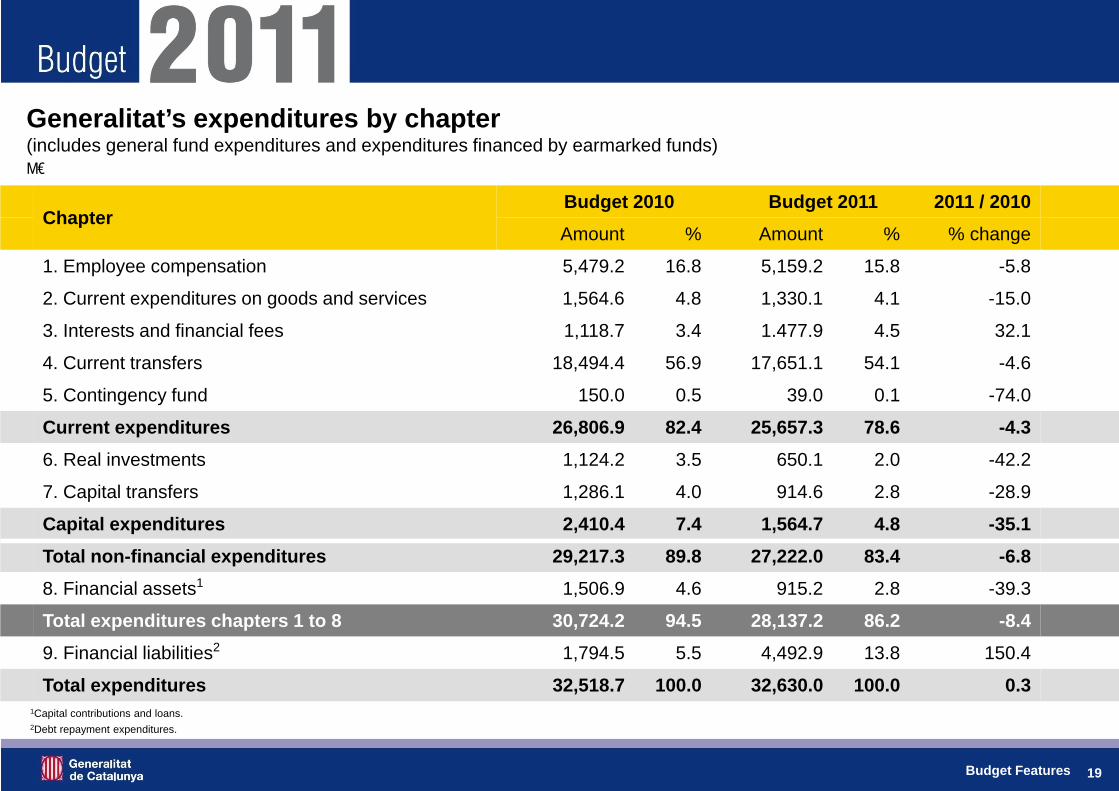
Generalitat’s expenditures by chapter (includes general fund expenditures and expenditures financed by earmarked funds)M€
ChapterBudget 2010 Budget 2011 2011 / 2010Amount % Amount % % change
1. Employee compensation 5,479.2 16.8 5,159.2 15.8 -5.8
2. Current expenditures on goods and services 1,564.6 4.8 1,330.1 4.1 -15.0
3. Interests and financial fees 1,118.7 3.4 1.477.9 4.5 32.1
4. Current transfers 18,494.4 56.9 17,651.1 54.1 -4.6
5. Contingency fund 150.0 0.5 39.0 0.1 -74.0
Current expenditures 26,806.9 82.4 25,657.3 78.6 -4.36. Real investments 1,124.2 3.5 650.1 2.0 -42.2
7. Capital transfers 1,286.1 4.0 914.6 2.8 -28.9
Capital expenditures 2,410.4 7.4 1,564.7 4.8 -35.1Total non-financial expenditures 29,217.3 89.8 27,222.0 83.4 -6.88. Financial assets1 1,506.9 4.6 915.2 2.8 -39.3
Total expenditures chapters 1 to 8 30,724.2 94.5 28,137.2 86.2 -8.49. Financial liabilities2 1,794.5 5.5 4,492.9 13.8 150.4
Total expenditures 32,518.7 100.0 32,630.0 100.0 0.31Capital contributions and loans.2Debt repayment expenditures.
Budget Features

20
Main changes in the Generalitat de Catalunya’s budgetFigures in M€
Budget2010
Budget 2011 Change 2011 / 2010
M€ %
Total budget 32,518.7 32,630.0 111.3 0.3%
Expenditures related to:
Debt amortisation(*) 1,794.5 4,492.9 2,698.3 150.4%
Debt interest expenditures(**) 1,118.7 1,477.9 359.2 32.1%
Other expenditures 29,605.5 26,659.3 -2,946.2 -10.0%
Budget Features
(*) Expenditures are linked to the debt redemption calendar.(**) Figures computed on a budget to budget comparison . However, when comparing 2011’s budget figures to the final data available for 2010, debt interest expenditures have risen by 558.7M€, or 60.8%, from 2010.
21
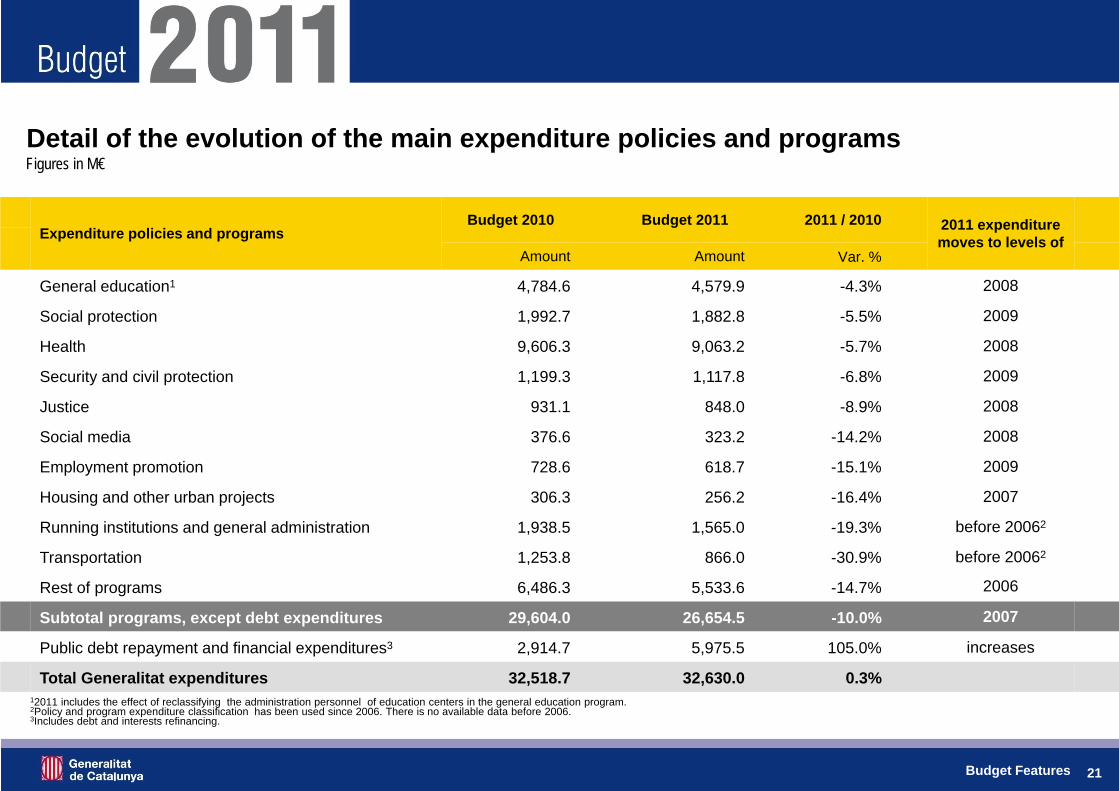
Detail of the evolution of the main expenditure policies and programs
Expenditure policies and programs Budget 2010 Budget 2011 2011 / 2010 2011 expenditure
moves to levels ofAmount Amount Var. %
General education1 4,784.6 4,579.9 -4.3% 2008
Social protection 1,992.7 1,882.8 -5.5% 2009
Health 9,606.3 9,063.2 -5.7% 2008
Security and civil protection 1,199.3 1,117.8 -6.8% 2009
Justice 931.1 848.0 -8.9% 2008
Social media 376.6 323.2 -14.2% 2008
Employment promotion 728.6 618.7 -15.1% 2009
Housing and other urban projects 306.3 256.2 -16.4% 2007
Running institutions and general administration 1,938.5 1,565.0 -19.3% before 20062
Transportation 1,253.8 866.0 -30.9% before 20062
Rest of programs 6,486.3 5,533.6 -14.7% 2006
Subtotal programs, except debt expenditures 29,604.0 26,654.5 -10.0% 2007
Public debt repayment and financial expenditures3 2,914.7 5,975.5 105.0% increases
Total Generalitat expenditures 32,518.7 32,630.0 0.3%12011 includes the effect of reclassifying the administration personnel of education centers in the general education program. 2Policy and program expenditure classification has been used since 2006. There is no available data before 2006.3Includes debt and interests refinancing.
Budget Features
Figures in M€

22
Generalitat’s non-financial revenues and expenditures since 2004Figures in M€
Source: Department for the Economy and Knowledge .
Budget features
10.000
15.000
20.000
25.000
30.000
35.000
2004 2005 2006 2007 2008 2009 2010 2011
Ingressos no financers Despeses no financeresNon-financial revenues Non-financial expenditures
23
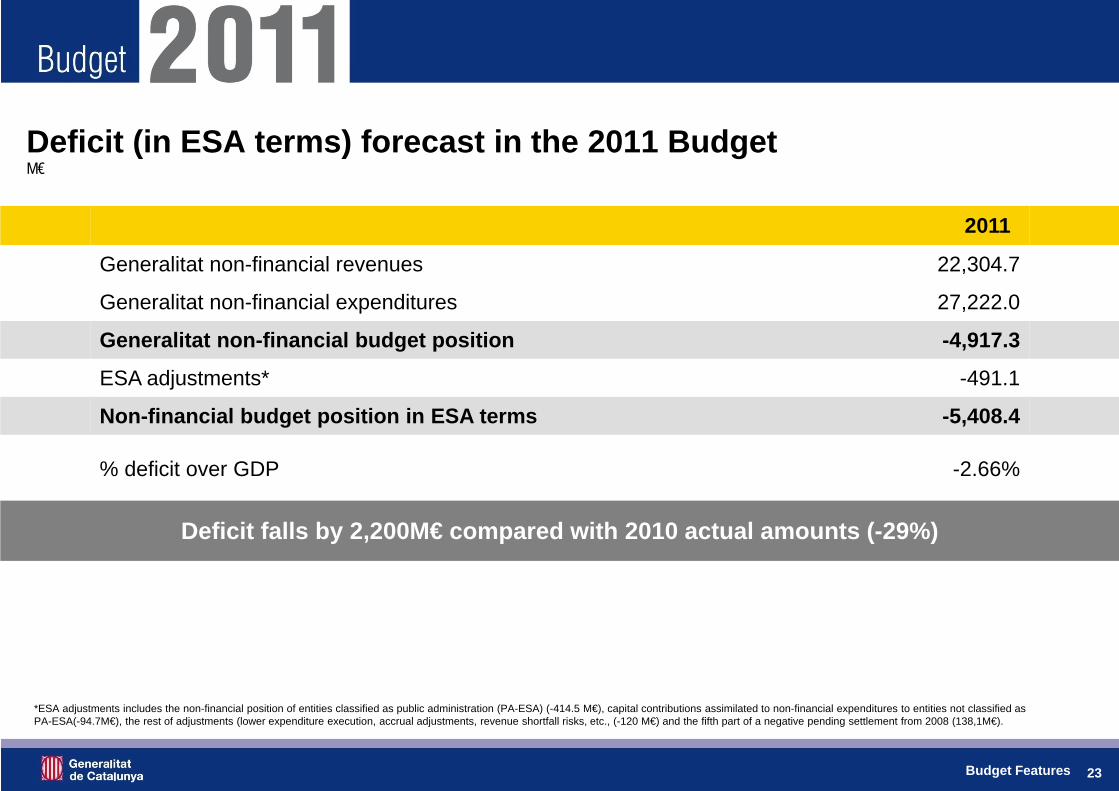
2011
Generalitat non-financial revenues 22,304.7
Generalitat non-financial expenditures 27,222.0
Generalitat non-financial budget position -4,917.3
ESA adjustments* -491.1
Non-financial budget position in ESA terms -5,408.4
% deficit over GDP -2.66%
Deficit falls by 2,200M€ compared with 2010 actual amounts (-29%)
Deficit (in ESA terms) forecast in the 2011 Budget
*ESA adjustments includes the non-financial position of entities classified as public administration (PA-ESA) (-414.5 M€), capital contributions assimilated to non-financial expenditures to entities not classified as PA-ESA(-94.7M€), the rest of adjustments (lower expenditure execution, accrual adjustments, revenue shortfall risks, etc., (-120 M€) and the fifth part of a negative pending settlement from 2008 (138,1M€).
M€
Budget Features
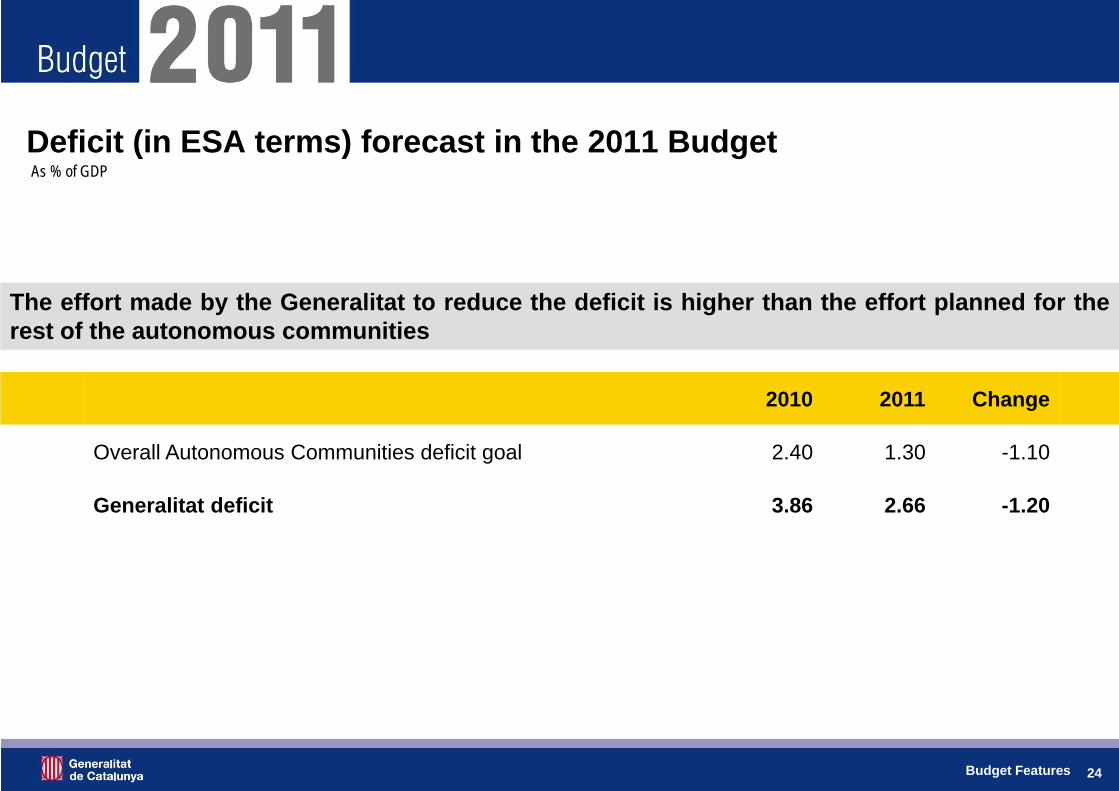
24
Deficit (in ESA terms) forecast in the 2011 Budget
The effort made by the Generalitat to reduce the deficit is higher than the effort planned for therest of the autonomous communities
2010 2011 Change
Overall Autonomous Communities deficit goal 2.40 1.30 -1.10
Generalitat deficit 3.86 2.66 -1.20
As % of GDP
Budget Features

25
Generalitat de Catalunya’s fiscal program
Source: Department for the Economy and Knowledge and INE.
Deficit (in ESA terms) over GDP
1Fiscal and Financial Policy Board
-0.22
-0,62
-2.60-2.41
-3.86
-2.66
-1.30-1.10 -1.00
-4,50
-4,00
-3,50
-3,00
-2,50
-2,00
-1,50
-1,00
-0,50
0,00
2006Actual
2007Actual
2008Actual
2009Actual
2010Actual (prov.)
2011 Budget
2012 2013 2014
CPFF1 2012-2014 goals
Budget Features
26
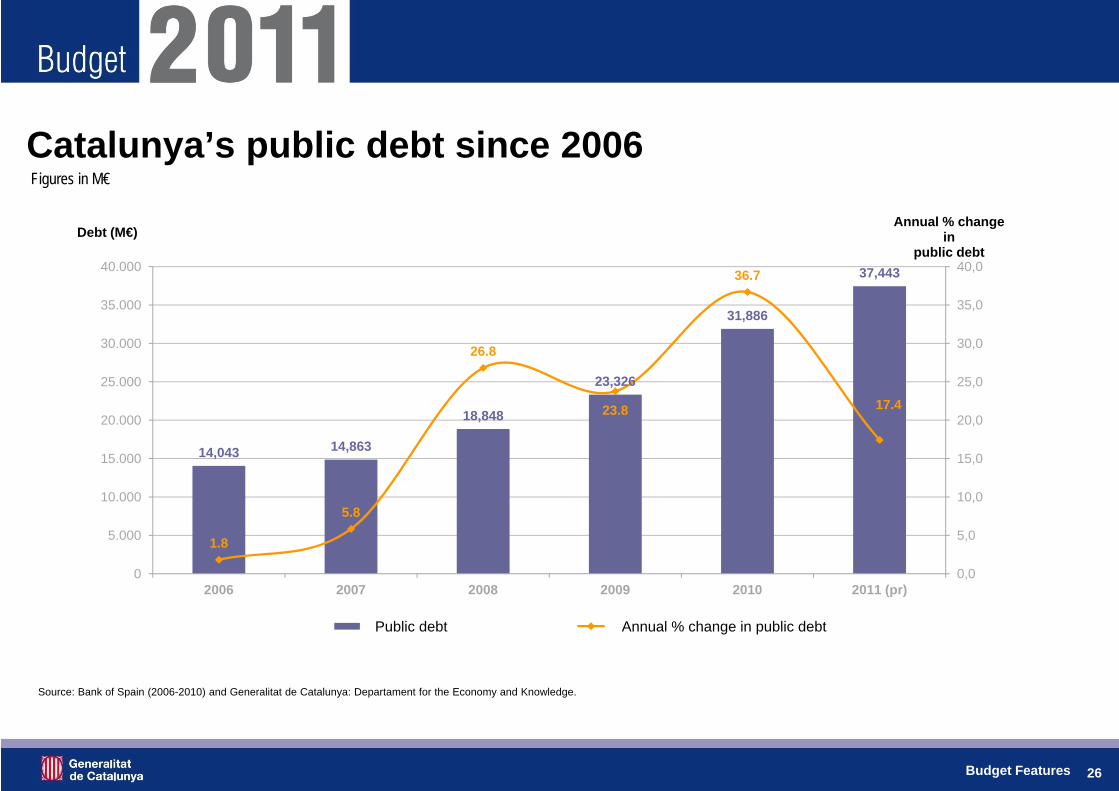
Catalunya’s public debt since 2006
Budget Features
Source: Bank of Spain (2006-2010) and Generalitat de Catalunya: Departament for the Economy and Knowledge.
Figures in M€
14,043 14,863
18,848
23,326
31,886
37,443
1.8
5.8
26.8
23.8
36.7
17.4
0,0
5,0
10,0
15,0
20,0
25,0
30,0
35,0
40,0
0
5.000
10.000
15.000
20.000
25.000
30.000
35.000
40.000
2006 2007 2008 2009 2010 2011 (pr)
Annual % changein
public debtDebt (M€)
Deute % variació anual del deutePublic debt Annual % change in public debt
27
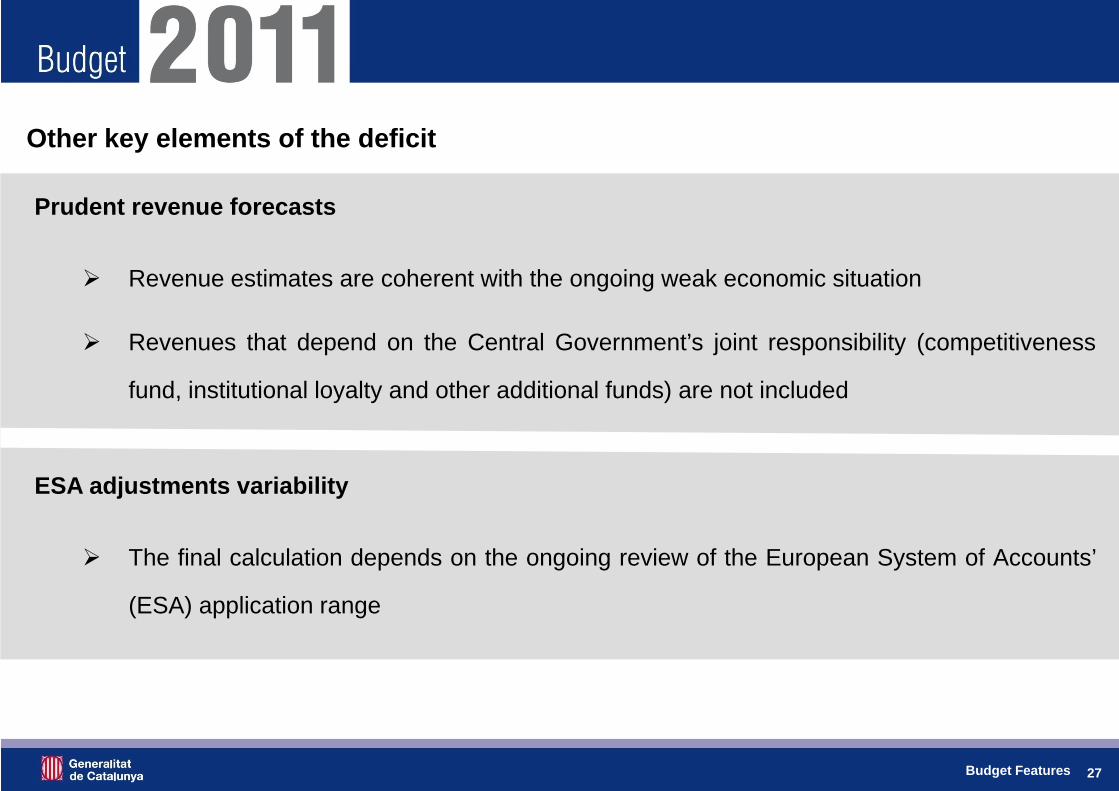
Other key elements of the deficit
Prudent revenue forecasts
Revenue estimates are coherent with the ongoing weak economic situation
Revenues that depend on the Central Government’s joint responsibility (competitiveness
fund, institutional loyalty and other additional funds) are not included
ESA adjustments variability
The final calculation depends on the ongoing review of the European System of Accounts’
(ESA) application range
Budget Features
28
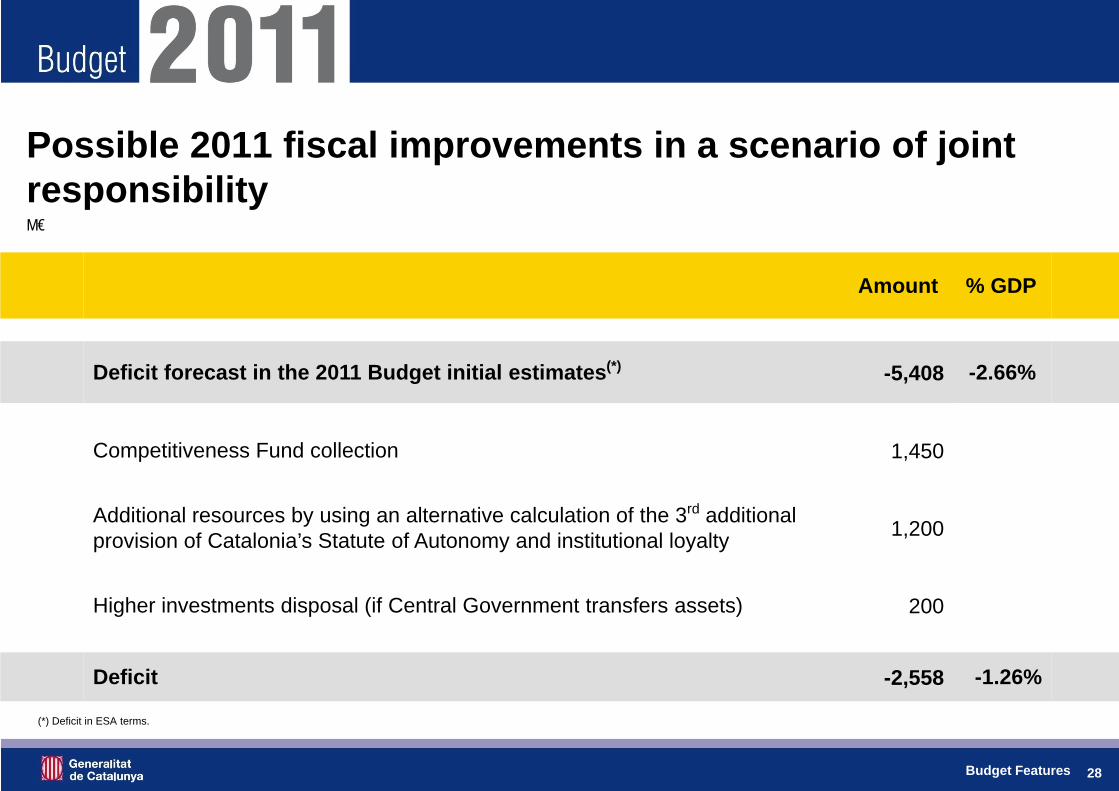
Possible 2011 fiscal improvements in a scenario of joint responsibility
Amount % GDP
Deficit forecast in the 2011 Budget initial estimates(*) -5,408 -2.66%
Competitiveness Fund collection 1,450
Additional resources by using an alternative calculation of the 3rd additional provision of Catalonia’s Statute of Autonomy and institutional loyalty 1,200
Higher investments disposal (if Central Government transfers assets) 200
Deficit -2,558 -1.26%
M€
(*) Deficit in ESA terms.
Budget Features

29
Generalitat de Catalunya’s fiscal programme in a scenario of joint responsibility with the Central Government
Source: IGAE and Department for the Economy and Knowledge.
-0.22
-0.62
-2.60-2.41
-3.86
-1.26 -1.30-1.10 -1.00
-4,50
-4,00
-3,50
-3,00
-2,50
-2,00
-1,50
-1,00
-0,50
0,00
2006Actual
2007Actual
2008Actual
2009Actual
2010Actual (prov.)
2011 Budget
2012 2013 2014
CPFF 2012-2014 goals
Deficit (in ESA terms) over GDP
Budget Features

30
Some specific issues about the Generalitat’s public sector consolidated budget
Budget Features
31
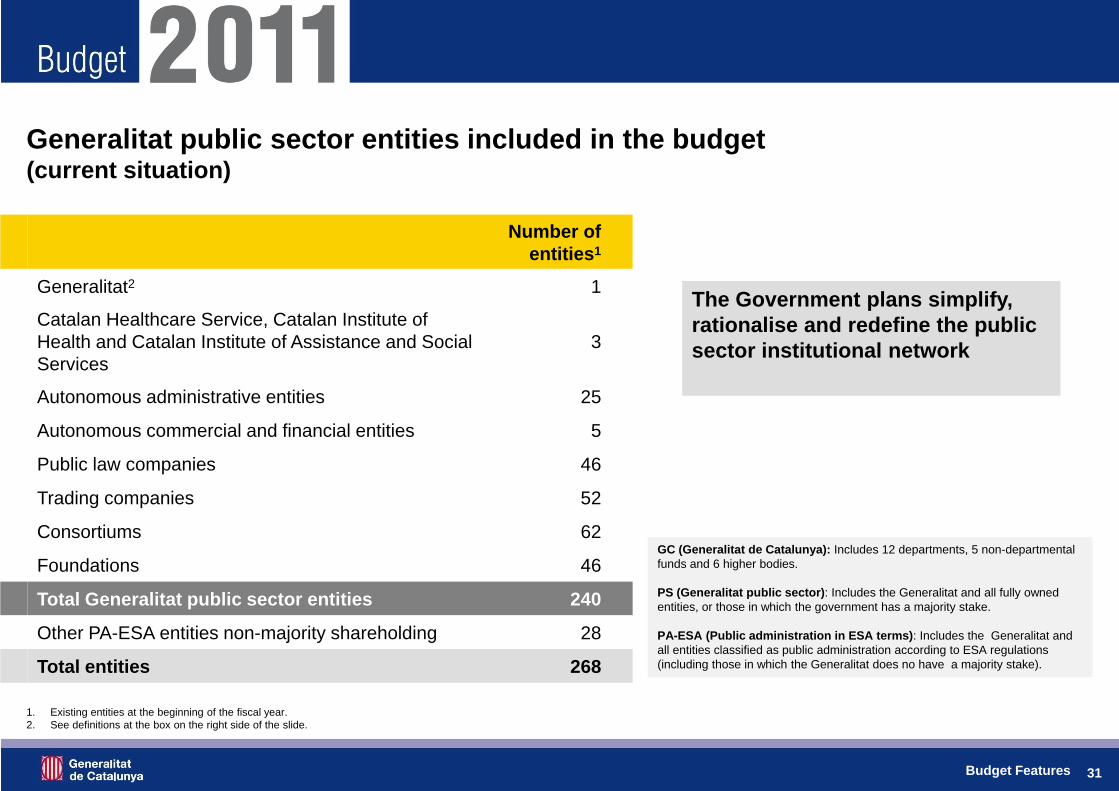
Generalitat public sector entities included in the budget(current situation)
Number of entities1
Generalitat2 1
Catalan Healthcare Service, Catalan Institute of Health and Catalan Institute of Assistance and Social Services
3
Autonomous administrative entities 25
Autonomous commercial and financial entities 5
Public law companies 46
Trading companies 52
Consortiums 62
Foundations 46
Total Generalitat public sector entities 240
Other PA-ESA entities non-majority shareholding 28
Total entities 268
GC (Generalitat de Catalunya): Includes 12 departments, 5 non-departmental funds and 6 higher bodies.
PS (Generalitat public sector): Includes the Generalitat and all fully owned entities, or those in which the government has a majority stake.
PA-ESA (Public administration in ESA terms): Includes the Generalitat and all entities classified as public administration according to ESA regulations (including those in which the Generalitat does no have a majority stake).
1. Existing entities at the beginning of the fiscal year.2. See definitions at the box on the right side of the slide.
The Government plans simplify, rationalise and redefine the public sector institutional network
Budget Features

32
Generalitat public sector budgets1
M€
1Includes financial operations.2 Total consolidated amounts in the 2010 and 2011 Budgets are not fully comparable because of a change in the number of entities,.
Budget 2010 Budget 2011 2011 / 2010
Amount % Amount % % change
Generalitat 32,518.7 53.2 32,630.0 55.3 0.3
Catalan Healthcare Service, Catalan Institute of Health and Catalan Institute of Assistance and Social Services 14,087.8 23.1 13,436.7 22.8 -4.6
Autonomous administrative entities 926.0 1.5 785.3 1.3 -15.2
Autonomous commercial and financial entities 137.9 0.2 131.2 0.2 -4.8
Public law companies 6,667.2 10.9 5,466.8 9.3 -18.0
Trading companies 3,025.8 5.0 2,345.0 4.0 -22.5
Consortiums 3,098.8 5.1 3,506.6 5.9 13.2
Foundations 648.1 1.1 705.3 1.2 8.8
Total 61,110.3 100.0 59,007.0 100.0 -3.4
Internal transfers -21,411.0 -19,653.0 -8.2
Total consolidated2 39,699.3 39,354.0 -0.9
Budget Features

33
Total investment: budgeted estimates and amounts financed using deferred payment methods
Budget Features
1,297.8 1,367.61,567.4
1,795.62,222.4
2,450.4
3,138.2
5,284.65,778.3
5,099.7
5,906.5
6,581.26,177.1
3,901.6
0
1.000
2.000
3.000
4.000
5.000
6.000
7.000
8.000
1998 1999 2000 2001 2002 2003 2004 2005 2006 2007 2008 2009 2010 2011
M€

34
2011 2012 2013 2014
Financing of road works 109.9 306.7 111.6 58.9
Financing of transport and mobility 211.2 366.8 278.1 91.9
Financing of irrigation systems 4.6 35.9 50.8 14.7
Underground Line 9 278.3 472.4 509.6 536.1
Other infrastructure and equipment concessions 133.5 180.1 213.5 251.1
Land rights related to equipment 79.6 93.5 115.3 131.9
Other projects 28.6 26.0 26.0 7.0
Total 845.5 1,481.5 1,305.0 1,091.6
Future payments linked to investments made using deferred payment methodsFigures in M€
Budget Features
35
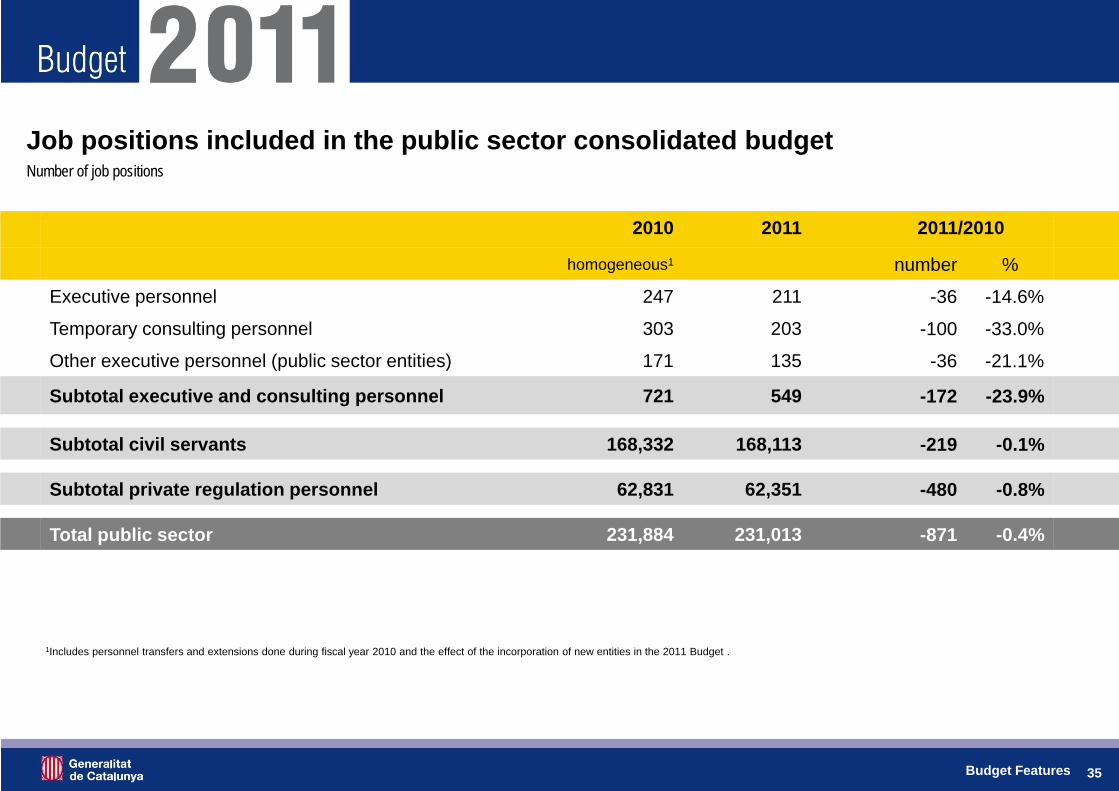
Job positions included in the public sector consolidated budget
2010 2011 2011/2010
homogeneous1 number %
Executive personnel 247 211 -36 -14.6%
Temporary consulting personnel 303 203 -100 -33.0%
Other executive personnel (public sector entities) 171 135 -36 -21.1%
Subtotal executive and consulting personnel 721 549 -172 -23.9%
Subtotal civil servants 168,332 168,113 -219 -0.1%
Subtotal private regulation personnel 62,831 62,351 -480 -0.8%
Total public sector 231,884 231,013 -871 -0.4%
Number of job positions
1Includes personnel transfers and extensions done during fiscal year 2010 and the effect of the incorporation of new entities in the 2011 Budget .
Budget Features

36
Budget of the Generalitat de Catalunya
Budget of the Generalitat de Catalunya

37
Generalitat’s revenues by chapterM€
ChapterBudget 2010 Budget 2011 2011 / 2010
Amount % Amount % % change
1. Direct taxes 6,387.5 19.6 8,358.5 25.6 30.9
2. Indirect taxes 6,322.9 19.4 8,567.4 26.3 35.5
3. Fees, sales and other revenue 489.5 1.5 465.4 1.4 -4.9
4. Current transfers 9,532.7 29.3 3,890.1 11.9 -59.2
5. Property revenues 53.7 0.2 9.9 0.0 -81.7
Current revenues 22,786.3 70.1 21,291.2 65.3 -6.66. Real investments disposals 0.0 0.0 200.0 0.6 --
7. Capital transfers 313.6 1.0 813.5 2.5 159.4
Capital revenues 313.6 1.0 1,013.5 3.1 223.1Total non-financial revenues 23,099.9 71.0 22,304.7 68.4 -3.48. Financial assets1 0.0 0.0 210.1 0.6 --
Total revenues chapters 1 to 8 23,099.9 71.0 22,514.8 69.0 -2.59. Financial liabilities (debt)2 9,418.8 29.0 10,115.3 31.0 7.4
Total revenues 32,518.7 100.0 32,630.0 100.0 0.31Forecasted revenues for 2011 include the sale of financial assets.2Includes debt refinancing. Forecast of 5,622.4M€ of net debt variation for 2011. In 2010, the initial estimate was 7,624.3M€.
Budget of the Generalitat de Catalunya

38
Generalitat funding system revenues
Concept 2010Budget
2010Actual
2011Budget
2011 / 2010 Budget
% var.Inheritance and donations tax(*) 899.7 658.8 288.6 -67.9Wealth tax 0.0 13.1 0.0 --Tax on transfers and documented legal acts 1,466.0 1,398.2 1,286.6 -12.2Gambling taxes 309.2 285.9 308.3 -0.3Energy tax 280.1 280.1 279.3 -0.3Vehicle registration tax 321.5 137.0 110.0 -65.8Tax on retail sales of certain hydrocarbons 351.9 272.9 280.4 -20.3Totally devolved taxes 3,628.4 3,046.1 2,553.2 -29.6Personal income tax (regional share) 5,472.5 5,472.5 8,055.9 47.2VAT (share of Spanish central government tax) 2,438.8 2,438.8 4,619.0 89.4Tax on tobacco products (share of Spanish central government tax) 680.1 680.1 953.7 40.2Tax on alcoholic drinks (share of Spanish central government tax) 81.1 81.1 122.3 50.7Hydrocarbon tax (share of Spanish central government tax) 703.5 703.5 996.6 41.7Pending settlements of partially devolved taxes (**) 0.0 0.0 -80.3 --Partially devolved taxes 9,375.9 9,375.9 14,667.1 56.4Total devolved tax revenues 13,004.3 12,422.0 17,220.2 32.4Equalisation transfer 2,508.3 2,495.6 -- --Healthcare specific funds(***) 103.5 84.4 102.0 -1.4Health financing transfers 103.1 103.1 -- --Pending settlements of equalisation transfer 0.0 0.0 -57.8 --Advance of new funding system resources(****) 3,601.8 3,515.7 -- --Global Sufficiency Fund (advance) -- -- 1,840.1 --Fundamental Services Guarantee Fund (advance) -- -- -1,460.0 --Total transfer revenues 6,316.7 6,198.8 424.2 -93.3Total funding system revenues 19,321.0 18,620.8 17,644.4 -8.7
(*) The estimates for 2011, without the 2011 regulation changes, would be 339.8M.€ After the changes, 2011 revenues fall by 51.2M€.(**) Pending settlements of specific consumption taxes, Personal income tax and VAT.(***) Health cohesion fund, temporary incapacity control and accidents and foreign invoicing. (****) Includes Wealth tax elimination compensation and regional police financing.
El pressupost de la Generalitat de Catalunya
M€
39
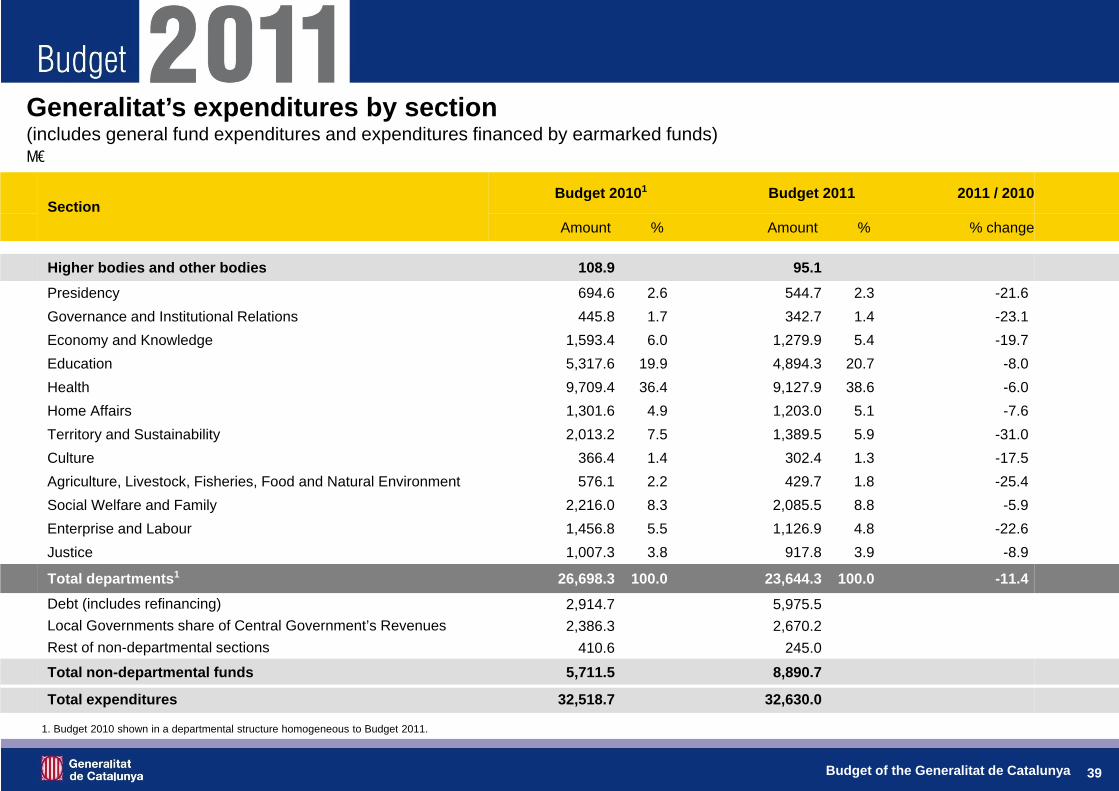
Generalitat’s expenditures by section(includes general fund expenditures and expenditures financed by earmarked funds)M€
SectionBudget 20101 Budget 2011 2011 / 2010
Amount % Amount % % change
Higher bodies and other bodies 108.9 95.1Presidency 694.6 2.6 544.7 2.3 -21.6Governance and Institutional Relations 445.8 1.7 342.7 1.4 -23.1Economy and Knowledge 1,593.4 6.0 1,279.9 5.4 -19.7Education 5,317.6 19.9 4,894.3 20.7 -8.0Health 9,709.4 36.4 9,127.9 38.6 -6.0Home Affairs 1,301.6 4.9 1,203.0 5.1 -7.6Territory and Sustainability 2,013.2 7.5 1,389.5 5.9 -31.0Culture 366.4 1.4 302.4 1.3 -17.5Agriculture, Livestock, Fisheries, Food and Natural Environment 576.1 2.2 429.7 1.8 -25.4Social Welfare and Family 2,216.0 8.3 2,085.5 8.8 -5.9Enterprise and Labour 1,456.8 5.5 1,126.9 4.8 -22.6Justice 1,007.3 3.8 917.8 3.9 -8.9
Total departments1 26,698.3 100.0 23,644.3 100.0 -11.4Debt (includes refinancing) 2,914.7 5,975.5Local Governments share of Central Government’s Revenues 2,386.3 2,670.2Rest of non-departmental sections 410.6 245.0
Total non-departmental funds 5,711.5 8,890.7
Total expenditures 32,518.7 32,630.0
1. Budget 2010 shown in a departmental structure homogeneous to Budget 2011.
Budget of the Generalitat de Catalunya
40
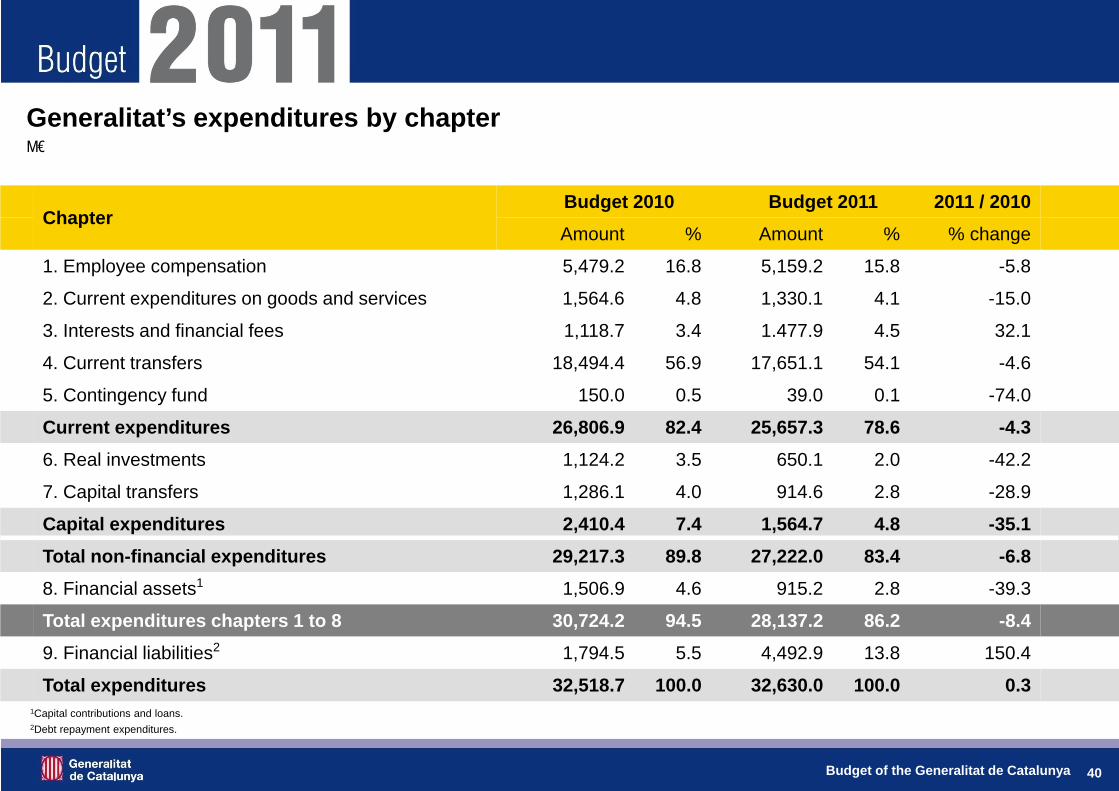
Generalitat’s expenditures by chapterM€
Budget of the Generalitat de Catalunya
ChapterBudget 2010 Budget 2011 2011 / 2010Amount % Amount % % change
1. Employee compensation 5,479.2 16.8 5,159.2 15.8 -5.8
2. Current expenditures on goods and services 1,564.6 4.8 1,330.1 4.1 -15.0
3. Interests and financial fees 1,118.7 3.4 1.477.9 4.5 32.1
4. Current transfers 18,494.4 56.9 17,651.1 54.1 -4.6
5. Contingency fund 150.0 0.5 39.0 0.1 -74.0
Current expenditures 26,806.9 82.4 25,657.3 78.6 -4.36. Real investments 1,124.2 3.5 650.1 2.0 -42.2
7. Capital transfers 1,286.1 4.0 914.6 2.8 -28.9
Capital expenditures 2,410.4 7.4 1,564.7 4.8 -35.1Total non-financial expenditures 29,217.3 89.8 27,222.0 83.4 -6.88. Financial assets1 1,506.9 4.6 915.2 2.8 -39.3
Total expenditures chapters 1 to 8 30,724.2 94.5 28,137.2 86.2 -8.49. Financial liabilities2 1,794.5 5.5 4,492.9 13.8 150.4
Total expenditures 32,518.7 100.0 32,630.0 100.0 0.31Capital contributions and loans.2Debt repayment expenditures.

41
Public sector consolidated budget
Public sector consolidated budget

42
Generalitat public sector budgets1
M€
1Includes financial operations.2 Total consolidated amounts in the 2010 and 2011 Budgets are not fully comparable because of a change in the number of entities,.
Budget 2010 Budget 2011 2011 / 2010
Amount % Amount % % change
Generalitat 32,518.7 53.2 32,630,0 55.3 0.3
Catalan Healthcare Service, Catalan Institute of Health and Catalan Institute of Assistance and Social Services 14,087.8 23.1 13,436,7 22.8 -4.6
Autonomous administrative entities 926.0 1.5 785,3 1.3 -15.2
Autonomous commercial and financial entities 137.9 0.2 131,2 0.2 -4.8
Public law companies 6,667.2 10.9 5,466,8 9.3 -18.0
Trading companies 3,025.8 5.0 2,345,0 4.0 -22.5
Consortiums 3,098.8 5.1 3,506,6 5.9 13.2
Foundations 648.1 1.1 705,3 1.2 8.8
Total 61,110.3 100.0 59,007,0 100.0 -3.4
Internal transfers -21,411.0 -19,653,0 -8.2
Total consolidated2 39,699.3 39,354,0 -0.9
Public sector consolidated budget

43
Generalitat’s public sector revenues by chapterM€
ChapterBudget 2010 Budget 2011 2011 / 2010
Amount % Amount % % change
1. Direct taxes 6,387.5 16.1 8,358.5 21.2 30.9
2. Indirect taxes 6,322.9 15.9 8,567.4 21.8 35.5
3. Fees, sales and other revenue 2,941.3 7.4 3,099.0 7.9 5.4
4. Current transfers 10,049.3 25.3 4,431.6 11.3 -55.9
5. Property revenues 211.1 0.5 301.6 0.8 42.9
Current revenues 25,912.1 65.3 24,758.1 62.9 -4.56. Real investments disposal 694.6 1.7 436.5 1.1 -37.2
7. Capital transfers 1,155.8 2.9 988.5 2.5 -14.5
Capital revenues 1,850.4 4.7 1,425.0 3.6 -23.0Total non-financial revenues 27,762.5 69.9 26,183.1 66.5 -5.78. Financial assets1 504.6 1.3 1.019.3 2.6 102.0
Total revenues chapters 1 to 8 28,267.1 71.2 27,202.4 69.1 -3.89. Financial liabilities (debt)2 11,432.1 28.8 12,151.6 30.9 6.3
Total revenues 39,699.3 100.0 39,354.0 100.0 -0.91Forecasted revenues for 2011 include the sale of financial assets.2Includes debt refinancing.
Public sector consolidated budget
44
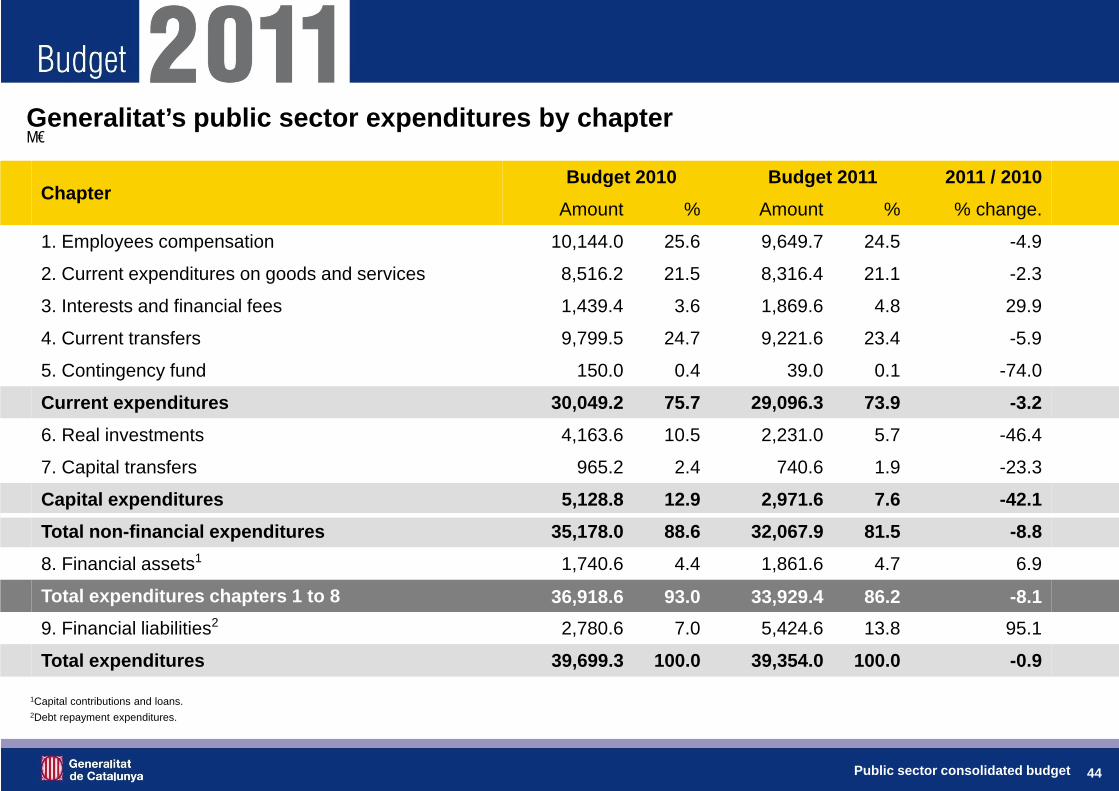
Generalitat’s public sector expenditures by chapterM€
ChapterBudget 2010 Budget 2011 2011 / 2010
Amount % Amount % % change.
1. Employees compensation 10,144.0 25.6 9,649.7 24.5 -4.9
2. Current expenditures on goods and services 8,516.2 21.5 8,316.4 21.1 -2.3
3. Interests and financial fees 1,439.4 3.6 1,869.6 4.8 29.9
4. Current transfers 9,799.5 24.7 9,221.6 23.4 -5.9
5. Contingency fund 150.0 0.4 39.0 0.1 -74.0
Current expenditures 30,049.2 75.7 29,096.3 73.9 -3.26. Real investments 4,163.6 10.5 2,231.0 5.7 -46.4
7. Capital transfers 965.2 2.4 740.6 1.9 -23.3
Capital expenditures 5,128.8 12.9 2,971.6 7.6 -42.1Total non-financial expenditures 35,178.0 88.6 32,067.9 81.5 -8.88. Financial assets1 1,740.6 4.4 1,861.6 4.7 6.9
Total expenditures chapters 1 to 8 36,918.6 93.0 33,929.4 86.2 -8.19. Financial liabilities2 2,780.6 7.0 5,424.6 13.8 95.1
Total expenditures 39,699.3 100.0 39,354.0 100.0 -0.9
1Capital contributions and loans.2Debt repayment expenditures.
Public sector consolidated budget
45
Macroeconomic framework
Macroeconomic framework

46
2009 2010 2011
GDP market prices (% real change) -4,2 0,1 0.9
GDP (M€) 207,237 209,727 214,131GDP (% nominal change) -3.7 1.2 2.1
Internal demand1 -5.2 -0.3 0.0Household consumption -4.2 1.7 1.1Public sector consumption2 6.1 0.2 -1.3Investment3 -14.6 -5.6 -2.0
Capital goods and others -17.9 -1.5 2.1Construction -11.7 -10.7 -6.1
Foreign trade balance1 1.0 0.3 0.9
Foreign trade balance3 2.2 1.0 0.7Exports of goods and services -12.3 12.6 6.2Imports of goods and services -17.0 8.4 3.7
Balance with the rest of Spain3 -1.2 -0.7 0.2
Prices
GDP Deflator 0.6 1.1 1.2Labour marketJobs created (thousands)4 -259.3 -57.6 -6.3Jobs created (% change)4 -7.5% -1.8% -0.2%Estimated unemployment rate (EPA) (% unemployed/active population) 16.2% 17.8% 18.0%
Macroeconomic forecast- Catalonia% annual change –unless otherwise indicated
Source: Idescat and Department for the Economy and Knowledge.
.
1. Contribution to growth.2. Includes non-profit household consumption.3. Includes stock variation4. Full-time jobs .
Macroeconomic framework
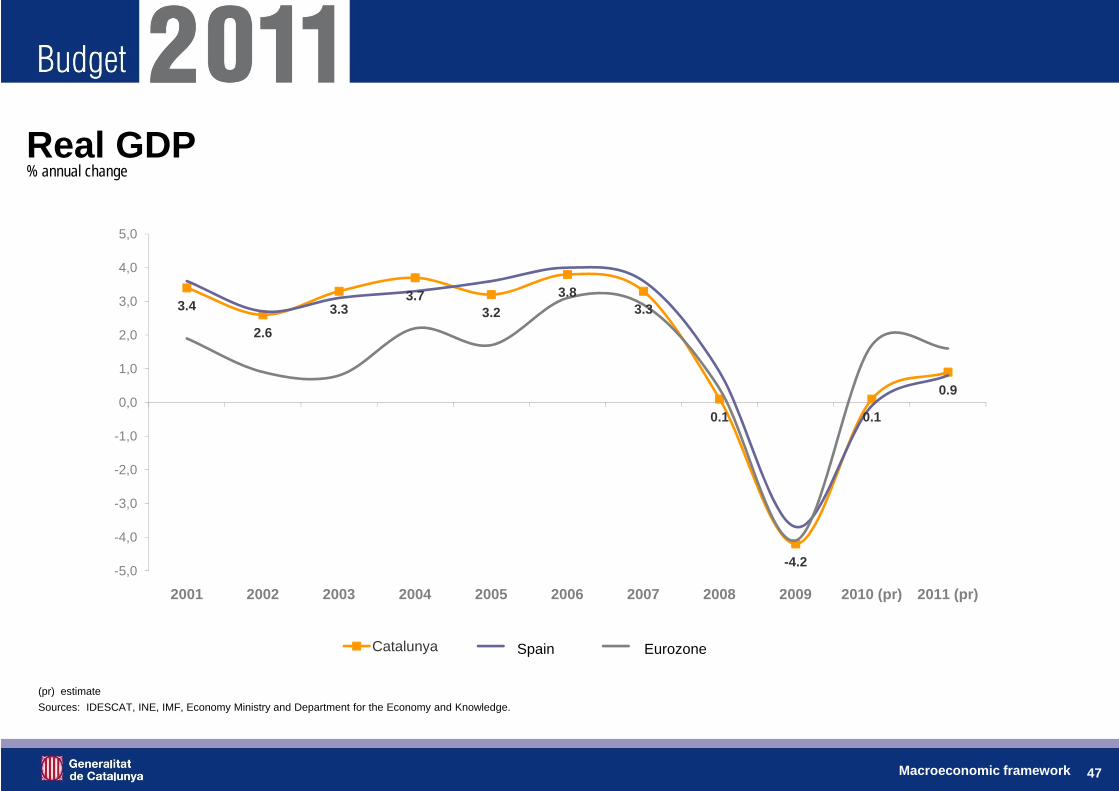
47
Real GDP% annual change
(pr) estimateSources: IDESCAT, INE, IMF, Economy Ministry and Department for the Economy and Knowledge.
3.4
2.6
3.33.7
3.23.8
3.3
0.1
-4.2
0.1
0.9
-5,0
-4,0
-3,0
-2,0
-1,0
0,0
1,0
2,0
3,0
4,0
5,0
2001 2002 2003 2004 2005 2006 2007 2008 2009 2010 (pr) 2011 (pr)
Catalunya Espanya Zona euroSpain Eurozone
Macroeconomic framework

48
Internal and external demand% contribution to growth
(pr) estimateSource: Idescat.
Macroeconomic framework
3.53.1
3.7
4.7 4.3
5.44.4
-1.0
-5.2
-0.3
0.0
-0.1 -0.5 -0.3-1.0 -1.1
-1.5 -1.2
1.1 1.00.3
0.9
-6,0
-4,0
-2,0
0,0
2,0
4,0
6,0
2001 2002 2003 2004 2005 2006 2007 2008 2009 2010 2011 (pr)
Demanda interna Demanda externa PIB realInternal demand External demand Real GDP

49
Housing % interannual change, 12-month average
-80
-60
-40
-20
0
20
40
Iniciats AcabatsStarted Completed
Source: Ministry of Development
Macroeconomic framework

50
Imports and exports% interannual change, 12-month average
-25,0
-20,0
-15,0
-10,0
-5,0
0,0
5,0
10,0
15,0
20,0
25,0
Exportacions Importacionsexports imports
Source: Idescat , based on Spanish Tax Administration Agency data.
Macroeconomic framework

51
Prices in Catalunya, Spain and the Eurozone% interannual change
Source: INE and Eurostat.
-1,5
-1,0
-0,5
0,0
0,5
1,0
1,5
2,0
2,5
3,0
3,5
4,0
4,5
5,0
5,5
6,0
Catalunya Espanya Zona euro (IPCH)Spain Eurozone
Macroeconomic framework

52
Unemployment rate (EPA)% active population
(pr) estimateSource: Idescat, INE, Eurostat, Department for the Economy and Knowledge, IMF, Economy Ministry
18.8
17.1
14.4
10.7
8.9 8.6 10.1 10.1 9.7
7.0 6.6 6.5
9.0
16.2
17.8 18.0
5,0
7,5
10,0
12,5
15,0
17,5
20,0
22,5
25,0
1996 1997 1998 1999 2000 2001 2002 2003 2004 2005 2006 2007 2008 2009 2010 2011 (pr)
Catalunya Espanya Zona euroSpain Eurozone
Macroeconomic framework
53
www.gencat.cat/economia/pressupostos