Casualty Actuaries of New England Avoiding Knee Jerk Reactions to Short Term Natural Catastrophes...
26
Casualty Actuaries of New England Avoiding Knee Jerk Reactions to Short Term Natural Catastrophes Scott Jean Vice President and Chief Actuary EMC Insurance Companies
-
Upload
joanna-tucker -
Category
Documents
-
view
215 -
download
0
Transcript of Casualty Actuaries of New England Avoiding Knee Jerk Reactions to Short Term Natural Catastrophes...

Casualty Actuaries of New EnglandAvoiding Knee Jerk Reactions to Short Term Natural Catastrophes
Scott Jean
Vice President and Chief Actuary
EMC Insurance Companies

Antitrust Notice
• The Casualty Actuarial Society is committed to adhering strictly to the letter and spirit of the antitrust laws. Seminars conducted under the auspices of the CAS are designed solely to provide a forum for the expression of various points of view on topics described in the programs or agendas for such meetings.
• Under no circumstances shall CAS seminars be used as a means for competing companies or firms to reach any understanding –expressed or implied – that restricts competition or in any way impairs the ability of members to exercise independent business judgment regarding matters affecting competition.
• It is the responsibility of all seminar participants to be aware of antitrust regulations, to prevent any written or verbal discussions that appear to violate these laws, and to adhere in every respect to the CAS antitrust compliance policy.

Session Objectives
• Objectively review weather data for insurance relevancy
• Evaluate limitations in using short term data to achieve long term predictions
• Consider alternative data sources to assist in interpreting relevant insurance experience
Significant Tornadoes by Year
1 2 3 4 5 6 7 8 9 10 11 12 13 14 15 16 17 18 19 20 21 22 23 24 250
20
40
60
80
100
120
140
160
Number of TornadoesLinear (Number of Tornadoes)5 Year Moving Average
Source: NOAA Storm Prediction Center, F3-F5 or EF3-EF5

Industry Combined Ratios
1996 1997 1998 1999 2000 2001 2002 2003 2004 2005 2006 2007 2008 2009 2010 2011 2012 201380.0%
85.0%
90.0%
95.0%
100.0%
105.0%
110.0%
115.0%
120.0%
125.0%Homeowners All Excluding
Source: SNL Financial
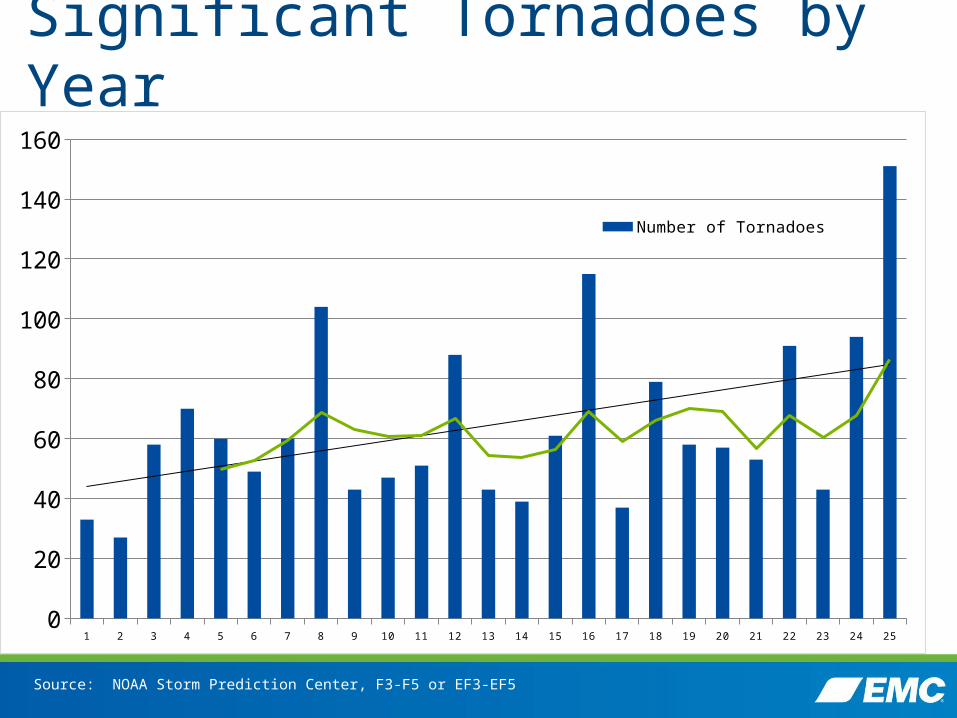
Industry Homeowners Differentials
1996 1997 1998 1999 2000 2001 2002 2003 2004 2005 2006 2007 2008 2009 2010 2011 2012 2013-1.5%
-1.0%
-0.5%
0.0%
0.5%
1.0%
1.5%
2.0%
2.5%
3.0%
Source: SNL Financial

Convective StormsTornadoes

Number of Tornadoes Reported
Source: NOAA Storm Prediction Center: http://www.spc.noaa.gov/wcm/adj.html

Adjusted Tornadoes Reported
Source: NOAA Storm Prediction Center: http://www.spc.noaa.gov/wcm/adj.html

Significant Tornadoes by Year
19501952
19541956
19581960
19621964
19661968
19701972
19741976
19781980
19821984
19861988
19901992
19941996
19982000
20022004
20062008
20102012
0
20
40
60
80
100
120
140
160
Number of Tornadoes
5 Year Moving Average
Source: NOAA Storm Prediction Center, F3-F5 or EF3-EF5

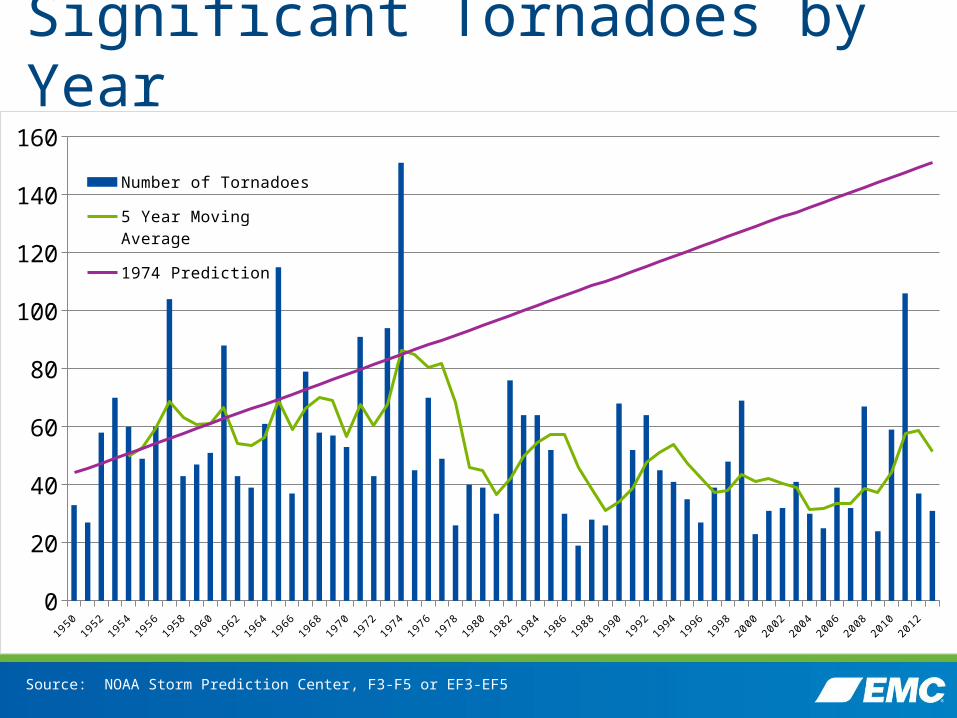
Significant Tornadoes by Year
19501952
19541956
19581960
19621964
19661968
19701972
19741976
19781980
19821984
19861988
19901992
19941996
19982000
20022004
20062008
20102012
0
20
40
60
80
100
120
140
160
Number of Tornadoes
5 Year Moving Average
1974 Prediction
Source: NOAA Storm Prediction Center, F3-F5 or EF3-EF5

EF5 or F5 Tornadoes Reported by Year
19501952
19541956
19581960
19621964
19661968
19701972
19741976
19781980
19821984
19861988
19901992
19941996
19982000
20022004
20062008
20102012
0
1
2
3
4
5
6
7
Number of EF-5 or F-5 Tornadoes5 Year Moving Average
Source: NOAA Storm Prediction Center

EF5 or F5 Tornadoes since 195059 May 20, 2013 Moore OK 58 May 24, 2011 El Reno/Piedmont OK 57 May 22, 2011 Joplin MO 56 April 27, 2011 Rainsville/Sylvania AL 55 April 27, 2011 Preston MS 54 April 27, 2011 Hackleburg/Phil Campbell AL 53 April 27, 2011 Smithville MS 52 May 25, 2008 Parkersburg IA 51 May 4, 2007 Greensburg KS 50 May 3, 1999 Bridge Creek/Moore OK 49 April 16, 1998 Waynesboro TN 48 April 8, 1998 Pleasant Grove AL 47 May 27, 1997 Jarrell TX 46 July 18, 1996 Oakfield WI 45 June 16, 1992 Chandler MN 44 April 26, 1991 Andover KS 43 August 28, 1990 Plainfield IL 42 March 13, 1990 Goessel KS 41 March 13, 1990 Hesston KS 40 May 31, 1985 Niles OH 39 June 7, 1984 Barneveld WI 38 April 2, 1982 Broken Bow OK 37 April 4, 1977 Birmingham AL 36 June 13, 1976 Jordan IA 35 April 19, 1976 Brownwood TX 34 March 26, 1976 Spiro OK 33 April 3, 1974 Guin AL 32 April 3, 1974 Tanner AL 31 April 3, 1974 Mt. Hope AL 30 April 3, 1974 Sayler Park OH 29 April 3, 1974 Brandenburg KY 28 April 3, 1974 Xenia OH 27 April 3, 1974 Daisy Hill IN 26 May 6, 1973 Valley Mills TX 25 February 21, 1971 Delhi LA 24 May 11, 1970 Lubbock TX 23 June 13, 1968 Tracy MN 22 May 15, 1968 Maynard IA 21 May 15, 1968 Charles City IA 20 April 23, 1968 Gallipolis OH 19 October 14, 1966 Belmond IA 18 June 8, 1966 Topeka KS 17 March 3, 1966 Jackson MS 16 May 8, 1965 Gregory SD 15 May 5, 1964 Bradshaw NE 14 April 3, 1964 Wichita Falls TX 13 May 5, 1960 Prague OK 12 June 4, 1958 Menomonie WI 11 December 18, 1957 Murphysboro IL 10 June 20, 1957 Fargo ND 9 May 20, 1957 Ruskin Heights MO 8 April 3, 1956 Grand Rapids MI 7 May 25, 1955 Udall KS 6 May 25, 1955 Blackwell OK 5 December 5, 1953 Vicksburg MS 4 June 27, 1953 Adair IA 3 June 8, 1953 Flint MI 2 May 29, 1953 Ft. Rice ND 1 May 11, 1953 Waco TX
Source: NOAA Storm Prediction Center
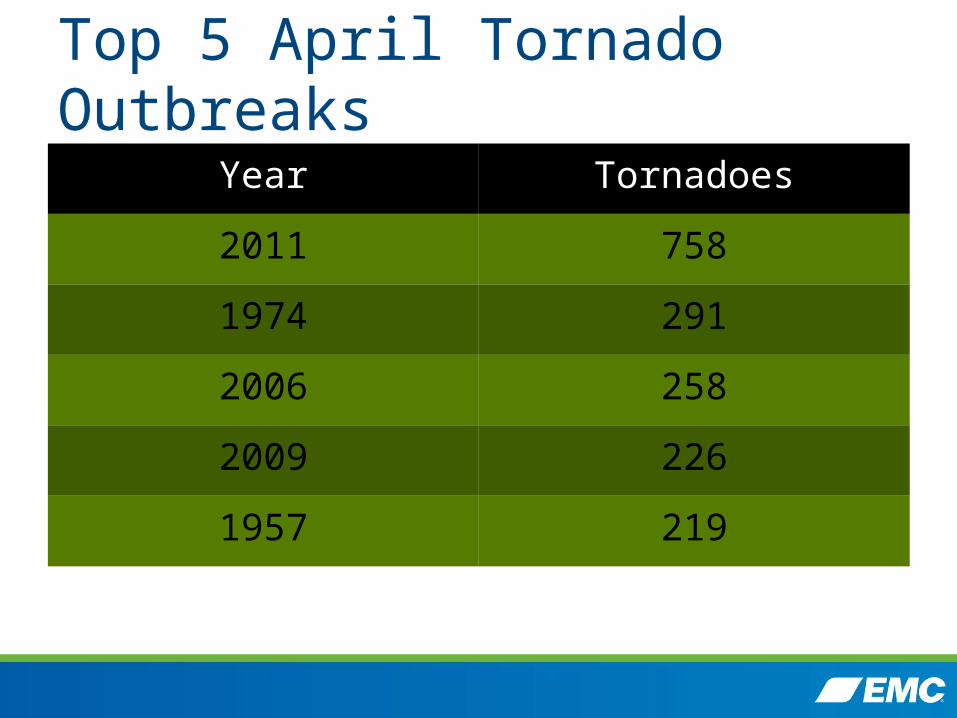
Top 5 April Tornado OutbreaksYear Tornadoes
2011 758
1974 291
2006 258
2009 226
1957 219
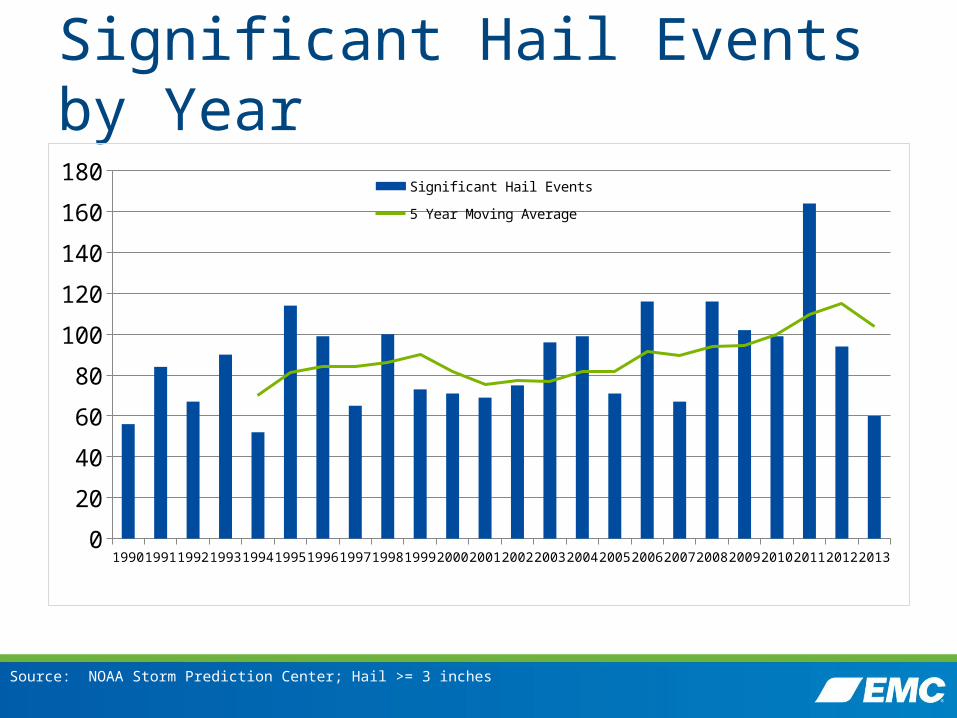
Significant Hail Events by Year
1990 1991 1992 1993 1994 1995 1996 1997 1998 1999 2000 2001 2002 2003 2004 2005 2006 2007 2008 2009 2010 2011 2012 20130
20
40
60
80
100
120
140
160
180Significant Hail Events 5 Year Moving Average
Source: NOAA Storm Prediction Center; Hail >= 3 inches
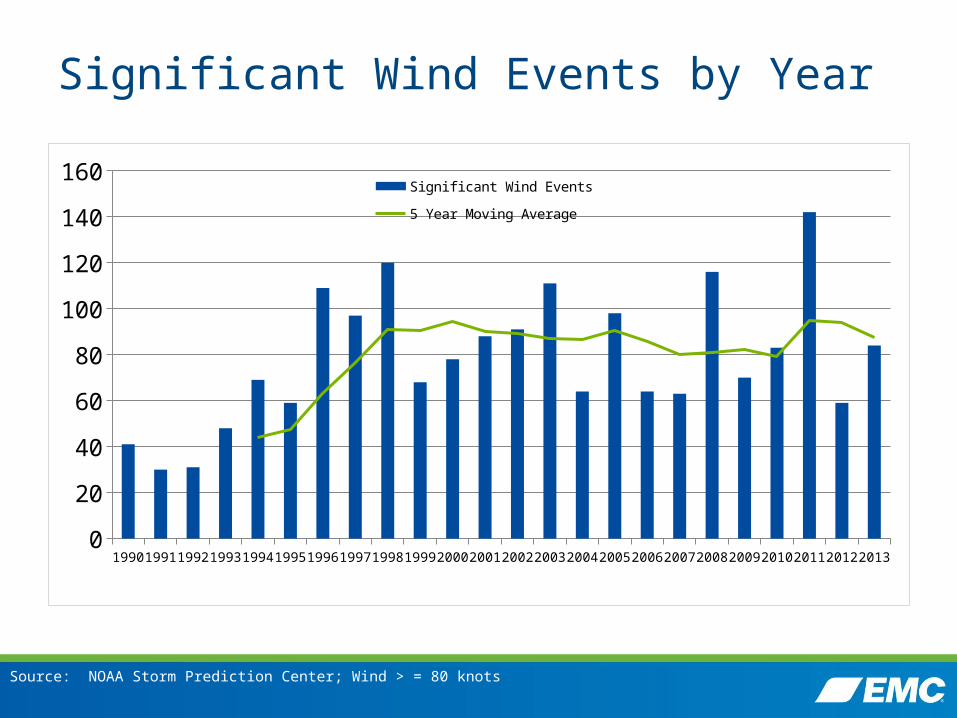
Significant Wind Events by Year
1990 1991 1992 1993 1994 1995 1996 1997 1998 1999 2000 2001 2002 2003 2004 2005 2006 2007 2008 2009 2010 2011 2012 20130
20
40
60
80
100
120
140
160Significant Wind Events 5 Year Moving Average
Source: NOAA Storm Prediction Center; Wind > = 80 knots

Source: NOAA Storm Prediction Center
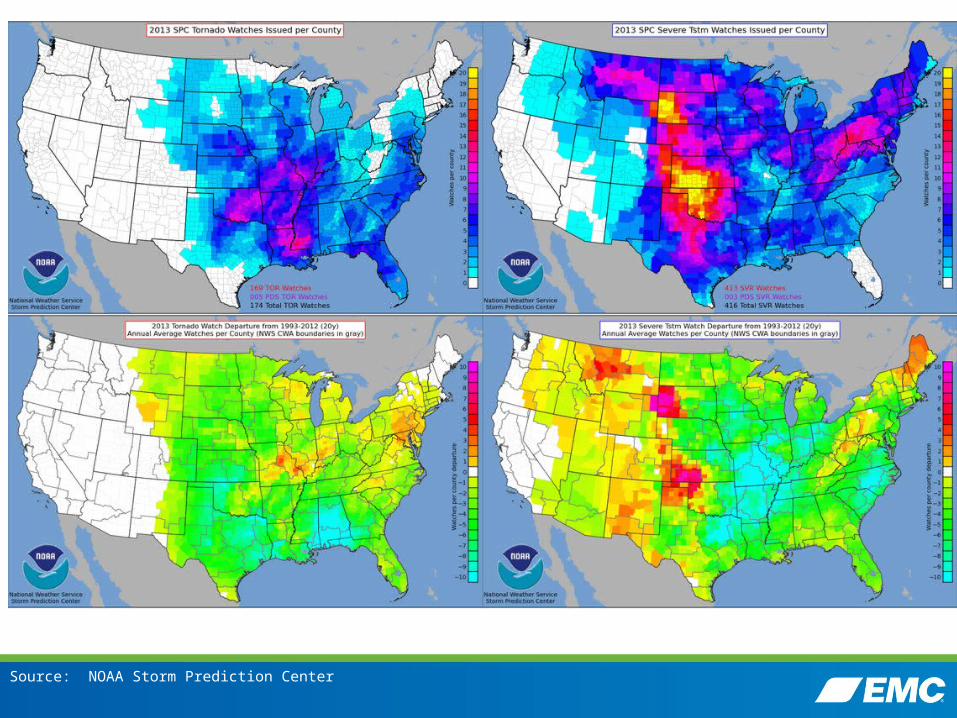
Source: NOAA Storm Prediction Center

Hurricanes

Historical Named Storms
1851 1858 1865 1872 1879 1886 1893 1900 1907 1914 1921 1928 1935 1942 1949 1956 1963 1970 1977 1984 1991 1998 2005 20120
5
10
15
20
25
30
Named Storms Moving Avg
Source: Weather Underground
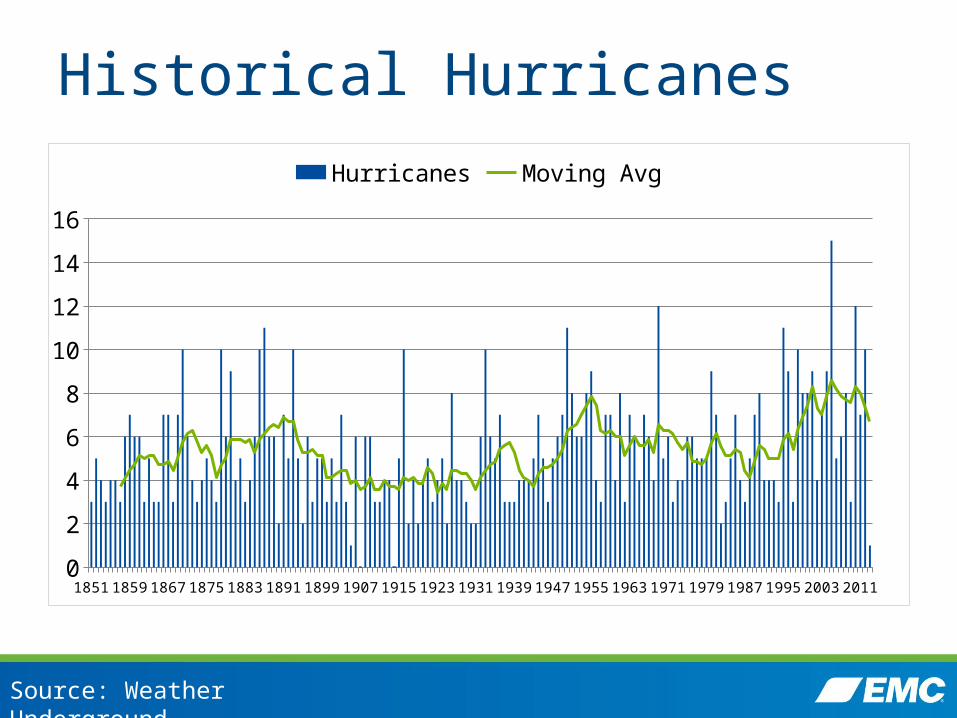
Historical Hurricanes
1851 1858 1865 1872 1879 1886 1893 1900 1907 1914 1921 1928 1935 1942 1949 1956 1963 1970 1977 1984 1991 1998 2005 20120
2
4
6
8
10
12
14
16
Hurricanes Moving Avg
Source: Weather Underground

7 Year Moving Averages
1857 1864 1871 1878 1885 1892 1899 1906 1913 1920 1927 1934 1941 1948 1955 1962 1969 1976 1983 1990 1997 2004 20110
2
4
6
8
10
12
14
16
18
20
Hurricanes Named Storms Linear (Named Storms)
Source: Weather Underground
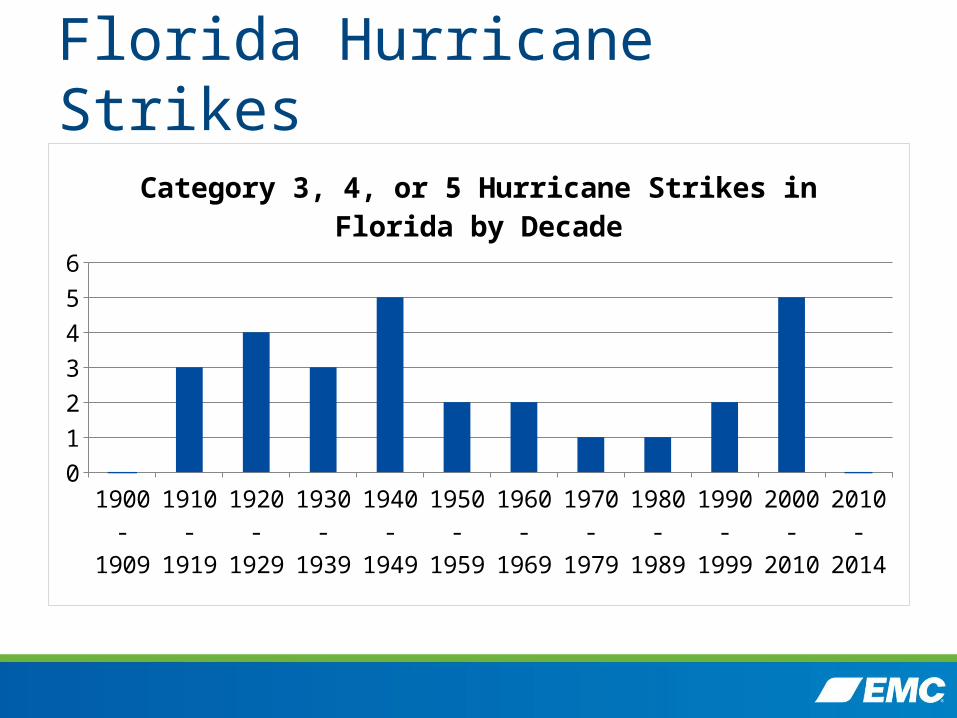
Florida Hurricane Strikes
1900-1909
1910-1919
1920-1929
1930-1939
1940-1949
1950-1959
1960-1969
1970-1979
1980-1989
1990-1999
2000-2010
2010-2014
0
1
2
3
4
5
6
Category 3, 4, or 5 Hurricane Strikes in Florida by Decade

Major Atlantic Hurricanes
19441947
19501953
19561959
19621965
19681971
19741977
19801983
19861989
19921995
19982001
20042007
20102013
0
1
2
3
4
5
6
7
8
9Major Hurricanes 5 Year Moving Average
Source: Chris Landsea NOAA @ Aon Benfield Conference and Wikipedia

Why Increases in Insured Losses?
• Recent active weather period• Population changes• Economy • Stormchasers• The new norm?
Significant Tornadoes by Year
19501952
19541956
19581960
19621964
19661968
19701972
19741976
19781980
19821984
19861988
19901992
19941996
19982000
20022004
20062008
20102012
0
20
40
60
80
100
120
140
160
Number of Tornadoes
5 Year Moving Average
1974 Prediction
Source: NOAA Storm Prediction Center, F3-F5 or EF3-EF5