
CASS/UCSD AOGS 2011 3D Analysis of the Heliosphere B.V. Jackson Center for Astrophysics and Space...
48
CASS/UCSD AOGS 2011 3D Analysis of the Heliosphere B.V. Jackson Center for Astrophysics and Space Sciences, University of California at San Diego, La Jolla, CA, USA Masayoshi http://smei.ucsd.edu/ http://ips.ucsd.edu/ The 3D Analysis of the Heliosphere Using Interplanetary Scintillation and Thomson- Scattering Observations With inputs from: Andrew Buffington, P. Paul Hick, John Clover, Mario Bisi, Tamsen Dunn Masayoshi Kojima, Munetoshi Tokumaru, Ken’ichi Fujiki, Maria Hirota Masumi Shimojo, Nobuharu Sako, Sako Tsuneta, Kazunari Shibata Katsuhide Marubashi, Kevin Schenk, Joe Gurman, P.K. Manoharan Igor Chasey, Americo Gonzalez, Julio Mejia Craig DeForest, Tim Howard Nikolai Pogorelov, Gary Zank Chris Eyles, Dave Webb
-
Upload
samantha-patterson -
Category
Documents
-
view
212 -
download
0
Transcript of CASS/UCSD AOGS 2011 3D Analysis of the Heliosphere B.V. Jackson Center for Astrophysics and Space...

CASS/UCSD AOGS 2011
3D Analysis of the Heliosphere
B.V. JacksonCenter for Astrophysics and Space Sciences, University of California at San Diego, La Jolla, CA, USA
Masayoshihttp://smei.ucsd.edu/ http://ips.ucsd.edu/
The 3D Analysis of the Heliosphere Using Interplanetary Scintillation and Thomson-Scattering Observations
With inputs from:
Andrew Buffington, P. Paul Hick, John Clover, Mario Bisi, Tamsen DunnMasayoshi Kojima, Munetoshi Tokumaru, Ken’ichi Fujiki, Maria HirotaMasumi Shimojo, Nobuharu Sako, Sako Tsuneta, Kazunari Shibata Katsuhide Marubashi, Kevin Schenk, Joe Gurman, P.K. Manoharan Igor Chasey, Americo Gonzalez, Julio Mejia Craig DeForest, Tim HowardNikolai Pogorelov, Gary ZankChris Eyles, Dave Webb

CASS/UCSD AOGS 2011
3D Analysis of the Heliosphere
The Big Question: How does the Sun do it?
Motivation:To figure it out.
The Data:Spacecraft, ground-based input – Hinode, SDO,
SOHO LASCO, STEREO, SMEI, IBEX, Ground-based magnetograms, Ground-based IPS
The Analysis:To make 2D images into 3D measurements over time.
Conclusions:Are we there yet?
Introduction:

CASS/UCSD AOGS 2011
3D Analysis of the Heliosphere
Hinode XRT observations
Shimojo and Tsuneta, ApJ, 706, L145, 2009Munro and Jackson, ApJ, 213, 877, 1977
What energizes the solar wind to expel it? Do coronal jets somehow play a major role?

CASS/UCSD AOGS 2011
3D Analysis of the Heliosphere
NASA spacecraft
imagers
STEREO-A COR2 STEREO-B COR2
SDO AIA
7 June 2011
CMEs
LASCO C3

CASS/UCSD AOGS 2011
3D Analysis of the Heliosphere
NASA spacecraft
imagers
STEREO-A COR2 STEREO-B COR2
SDO AIA
7 June 2011
CMEs
LASCO C3
What powers CMEs?

CASS/UCSD AOGS 2011
3D Analysis of the Heliosphere
NASA spacecraft imagers
Integrated video from STEREO-A imagers(Courtesy of Craig DeForest, Tim Howard, SWRI, Boulder, CO)
HI-2 HI-1 COR2
Howard & DeForest, ApJ, 2011 (submitted)

CASS/UCSD AOGS 2011
3D Analysis of the Heliosphere
SMEI (The Solar Mass Ejection Imager)
SMEI_2003
(A precision photometer that can view the whole sky from Earth)
Jackson, B.V., et al., 2004, Solar Phys., 225, 177

CASS/UCSD AOGS 2011
3D Analysis of the Heliosphere
SMEI (The Solar Mass Ejection Imager)
SMEI_2003
(A precision photometer that can view the whole sky from Earth)
CME on 31 May 2003

CASS/UCSD AOGS 2011
3D Analysis of the Heliosphere
World-Wide IPS observation network
JapanMexico
India
RussiaUK/EISCAT
US-Australia
Ooty 327MHz 、 16,000㎡
Pushchino103MHz20,000 ㎡
MEXART140MHz 、 10,000㎡
MWA80-300MHz
STEL Multi-Station 327MHz2000 ㎡ ×3, 3500 ㎡
IPS

CASS/UCSD AOGS 2011
3D Analysis of the Heliosphere
Let’s start with what we observe in IPS
STELab IPS array near Mt. Fuji
DATA
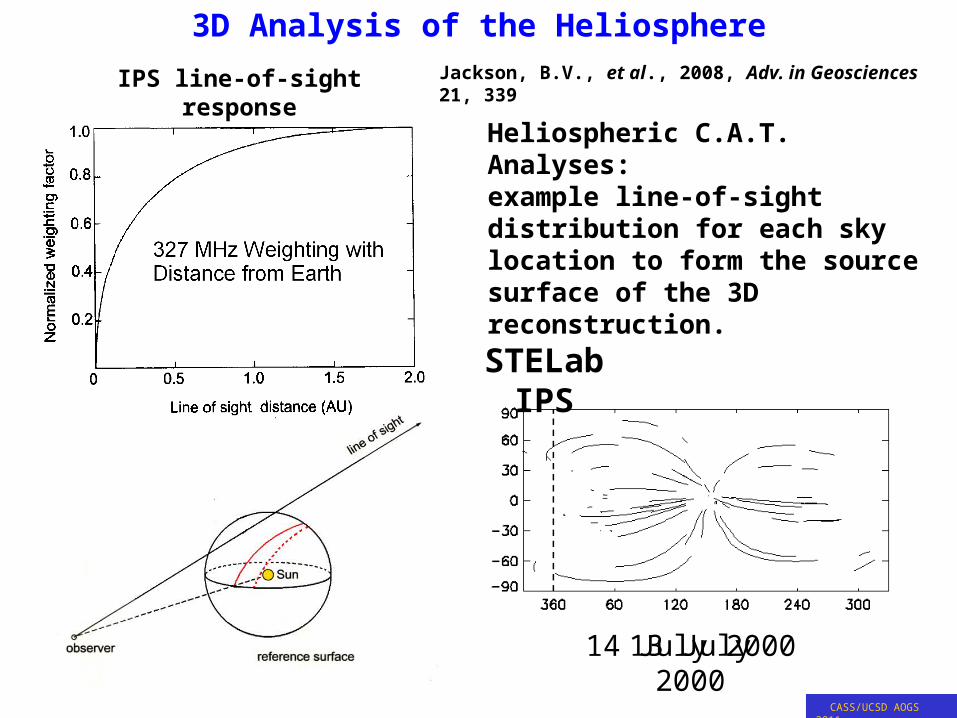
STELab IPS array systemsIPS line-of-sight response
How do we obtain a 3D depiction from these data?

CASS/UCSD AOGS 2011
3D Analysis of the Heliosphere
Heliospheric C.A.T. analyses: example line-of-sight distribution for each sky location to form the source surface of the 3D reconstruction.
STELab IPS
IPS line-of-sight response Jackson, B.V., et al., 2008, Adv. in Geosciences 21, 339
CASS/UCSD AOGS 2011
3D Analysis of the Heliosphere
13 July 200014 July 2000
Heliospheric C.A.T. Analyses: example line-of-sight distribution for each sky location to form the source surface of the 3D reconstruction.
STELab IPS
IPS line-of-sight response Jackson, B.V., et al., 2008, Adv. in Geosciences 21, 339

CASS/UCSD AOGS 2011
3D Analysis of the Heliosphere
All-Sky g-maps 2008/11/04
Toyokawa Kiso

CASS/UCSD AOGS 2011
3D Analysis of the Heliosphere
IPS C.A.T. analysis“Bastille Day” event
14 July 2000
Jackson, B.V., et al., 2002, Solar Wind 10, 31 Jackson, B.V., et al., 2008, Adv. in Geosciences 21, 339

CASS/UCSD AOGS 2011
3D Analysis of the Heliosphere
Heliospheric C.A.T. Analyses: example line-of-sight distribution for each sky location to form the source surface of the 3D reconstruction.
Thomson scattering
IPS line-of-sight response Jackson, B.V., et al., 2008, Adv. in Geosciences 21, 339
LOS Weighting
30º
60º
90º

CASS/UCSD AOGS 2011
3D Analysis of the Heliosphere
Brightness fall-off with distanceJackson, B.V., et al., 2004, Solar Phys., 225, 177

CASS/UCSD AOGS 2011
3D Analysis of the Heliosphere
B. V. Jackson, A. Buffington, P. P. Hick Center for Astrophysics and Space Sciences, University of California at San Diego, LaJolla, CA.
R.C. Altrock, S. Figueroa, P.E. Holladay, J.C. Johnston, S.W. Kahler, J.B. Mozer, S. Price, R.R. Radick, R. Sagalyn, D. Sinclair Air Force Research Laboratory/Space Vehicles Directorate (AFRL/VS), Hanscom AFB, MA
G.M. Simnett, C.J. Eyles, M.P. Cooke, S.J. TappinSchool of Physics and Space Research, University of Birmingham, UK
T. Kuchar, D. Mizuno, D.F.WebbISR, Boston College, Newton Center, MA
P.A. AndersonBoston University, Boston, MA
S.L. KeilNational Solar Observatory, Sunspot, NM
R.E. GoldJohns Hopkins University/Applied Physics Laboratory, Laurel, MD
N.R. WalthamSpace Science Dept., Rutherford-Appleton Laboratory, Chilton, UK
The Solar Mass Ejection Imager (SMEI) Mission -- Journal Article
The Coriolis spacecraft at Vandenberg prior to flight. The SMEI baffles are circled. The large NRL radiometer Windsat is on the top of the spacecraft.
Jackson, B.V., et al., 2004, Solar Phys., 225, 177

CASS/UCSD AOGS 2011
3D Analysis of the Heliosphere
Simultaneous images from the three SMEI cameras.
The Solar Mass Ejection Imager
(SMEI)C1
C2
C3
Sun
Sun
Jackson, B.V., et al., 2004, Solar Phys., 225, 177
Launch 6 January 2003
1 gigabyte/day; now ~4 terabytes
A joint US Air Force - NASA Project

CASS/UCSD AOGS 2011
3D Analysis of the Heliosphere
Frame composite for Aitoff mapBlue = Cam3; Green = Cam2; Red = Cam1
D290; 17 October 2003
Jackson, B.V., et al., 2008, J. Geophys Res., 113, A00A15, doi:10.1029/2008JA013224

CASS/UCSD AOGS 2011
3D Analysis of the Heliosphere
Heliospheric direct images (differenced)
SMEI difference images
Jackson, B.V., et al., 2008, J. Geophys Res., 113, A00A15, doi:10.1029/2008JA013224

CASS/UCSD AOGS 2011
3D Analysis of the Heliosphere
0 50 100 150 200 250 3000
50
100
150
- 5
- 4 . 5
- 4
- 3 . 5
- 3
- 2 . 5
- 2
- 1 . 5
- 1
- 0 . 5
0
0 . 5
1
1 . 5
2
2 . 5
3
3 . 5
4
4 . 5
5
Aurora removal
UCSD editing sequences
Aurora recognition and removal.
How to know where the aurora is.
How to remove it.
Aurora removed by recognition of their signal on an orbit – temporal sequence map.
0 50 100 150 200 250 3000
50
100
150
- 5
- 4 . 5
- 4
- 3 . 5
- 3
- 2 . 5
- 2
- 1 . 5
- 1
- 0 . 5
0
0 . 5
1
1 . 5
2
2 . 5
3
3 . 5
4
4 . 5
5
Jackson, B.V., et al., 2008, J. Geophys Res., 113, A00A15, doi:10.1029/2008JA013224

CASS/UCSD AOGS 2011
3D Analysis of the Heliosphere
SMEI brightness with a long-term (~30 day) base removed.
(1 S10 = 0.46 ± 0.02 ADU)
27-28 May 2003 CME events brightness time seriesfor select sky sidereal locations
SMEI data
Jackson, B.V., et al., 2008, J. Geophys Res., 113, A00A15, doi:10.1029/2008JA013224

CASS/UCSD AOGS 2011
3D Analysis of the Heliosphere
Heliospheric
3D reconstruction
Line of sight “crossed” components on a reference surface. Projections on the reference surface are shown. These weighted components are inverted to provide the time-dependent tomographic reconstruction.
Jackson, B.V., et al., 2008, Adv. in Geosciences 21, 339
>10,000 lines of sight /orbit >5,000,000 /month!

CASS/UCSD AOGS 2011
3D Analysis of the Heliosphere
SMEI density (remote observer view) of the 27-28 May 2003 halo CMEs
2003 May 27-28 CME eventsJackson, B.V., et al., 2008, J. Geophys Res., 113, A00A15, doi:10.1029/2008JA013224
SMEI density 3D reconstruction of the 27-28 May 2003 halo CMEs as viewed from 30º above the ecliptic plane about 30º west of the Sun-Earth line.
LASCO C3
Do CMEs move outward from the Sun to 1 AU?

CASS/UCSD AOGS 2011
3D Analysis of the Heliosphere
SMEI proton density reconstruction for the 27-28 May 2003 halo CME sequence. Reconstructed and Wind in-situ densities are compared over one Carrington rotation.
27-28 May 2003 CME event period
Jackson, B.V., et al., 2008, J. Geophys Res., 113, A00A15, doi:10.1029/2008JA013224
12-hour cadence, 7º x 7º lat, long
If so, what is their mass and interplanetary consequences?

CASS/UCSD AOGS 2011
3D Analysis of the Heliosphere
SMEI proton density reconstruction for the 27-28 May 2003 halo CME sequence. Reconstructed and Wind in-situ densities are compared over one Carrington rotation.
27-28 May 2003 CME event period
Jackson, B.V., et al., 2008, J. Geophys Res., 113, A00A15, doi:10.1029/2008JA013224
12-hour cadence, 7º x 7º lat, long
Associated IPS 3D velocity

CASS/UCSD AOGS 2011
3D Analysis of the Heliosphere
SMEI proton density reconstruction for the 27-28 May 2003 halo CME sequence. Reconstructed and ACE L2 in-situ densities are compared over one Carrington rotation.
27-28 May 2003 CME event period
Jackson, B.V., et al., 2008, J. Geophys Res., 113, A00A15, doi:10.1029/2008JA013224
Full SMEI data set, 6-hour cadence, 3º x 3º lat, long

CASS/UCSD AOGS 2011
3D Analysis of the Heliosphere
2003 May 27-28 CME events
CME mass
Jackson, B.V., et al., 2008, J. Geophys Res., 113, A00A15, doi:10.1029/2008JA013224

CASS/UCSD AOGS 2011
3D Analysis of the Heliosphere
Often ICMEs contain magnetic flux ropes near
their onset in the IM
2010 January 14 ICME flux rope (STEREO-B)
What is the mechanism that powers CMEs?
Marubashi flux rope cylinder fitMarubashi flux rope toroidal fit

CASS/UCSD AOGS 2011
3D Analysis of the Heliosphere
2010 January CME events
SMEI analysis
Brightness difference Density ecliptic cut12-hour cadence, 7º x 7º lat, long

CASS/UCSD AOGS 2011
3D Analysis of the Heliosphere
2010 January CME events
SMEI analysis
Brightness difference Density ecliptic cut12-hour cadence, 7º x 7º lat, long

CASS/UCSD AOGS 2011
3D Analysis of the Heliosphere
2010 January CME events
SMEI, STEREO-B in-situ analysis
12-hour cadence, 7º x 7º lat, long

CASS/UCSD AOGS 2011
3D Analysis of the Heliosphere
2010 January CME events
SMEI LASCO C3 coronagraph simulation
Late 14 January CME 17 January CME12-hour cadence, 7º x 7º lat, long
Fall 2011 AGU special session: “How do heliospheric remote-sensing observations limit magnetic flux rope models?”

CASS/UCSD AOGS 2011
3D Analysis of the Heliosphere
SPD Meeting, 16 June 2011 5
Ooty IPS 3D reconstruction (10 September 2005)
Is there other 3D evidence of loop-like heliospheric structure?
Manoharan, P.K., 2010, Solar Phys., 265, 137

CASS/UCSD AOGS 2011
3D Analysis of the Heliosphere
SPD Meeting, 16 June 2011 5
Ooty IPS 3D reconstruction (10 September 2005) Manoharan, P.K., 2010, Solar Phys., 265, 137
AOGS special special session ST14 Thursday 4:00-6:00 pm
(Be sure to come!)

CASS/UCSD AOGS 2011
3D Analysis of the HeliosphereSkymap view
Web analysis runs automatically using Linux on a P.C.
http://ips.ucsd.edu/
UCSD IPS forecast
So, you think we’re good at research?How about trying to forecast heliospheric structure
arrival at Earth?

CASS/UCSD AOGS 2011
3D Analysis of the HeliosphereRemote observer viewhttp://ips.ucsd.edu/
UCSD IPS forecast
Web analysis runs automatically using Linux on a P.C. CASS/UCSD AOGS 2011

CASS/UCSD AOGS 2011
3D Analysis of the HeliosphereVelocity and density
Web analysis runs automatically using Linux on a P.C.
http://ips.ucsd.edu/
UCSD IPS forecast
Typhoon!Lightening!

CASS/UCSD AOGS 2011
3D Analysis of the Heliosphere
Jets in Hinode XRT observations
3D IPS reconstruction program at the CCMC LASCO C2 observations
But what about the jets?We haven’t answered their role.

CASS/UCSD AOGS 2011
3D Analysis of the HeliosphereSMEI pseudo coronagraph
observations in 3D
07:14:48 07:18:48 07:22:48 07:26:48
Hinode jet (2007-SEP-14)
One jet of hundreds!
jet
jet(Sako, M., et al., 2010, 38th COSPAR Scientific Assembly, E21-0018-10)

CASS/UCSD AOGS 2011
3D Analysis of the HeliosphereSMEI pseudo coronagraph
observations in 3D
07:14:48 07:18:48 07:22:48 07:26:48
Hinode jet (2007-SEP-14)
jet
jet
Jet energy analysisportion of 2007-SEP-14
jet(Sako, M., et al., 2010, 38th COSPAR Scientific Assembly, E21-0018-10)
jet(Sako, M., et al., 2010, 38th COSPAR Scientific Assembly, E21-0018-10)
jet

CASS/UCSD AOGS 2011
3D Analysis of the Heliosphere
07:14:48 07:18:48 07:22:48 07:26:48
Hinode jet (2007-SEP-14)
jet
jet
Jet energy analysisportion of 2007-SEP-14
SMEI pseudo coronagraph observations in 3D
(Sako, M., et al., 2010, 38th COSPAR Scientific Assembly, E21-0018-10)
jet

CASS/UCSD AOGS 2011
3D Analysis of the Heliosphere
Jets (polar plumes) can be observed moving outward in the solar polar regions often at speeds >3 times ambient
LASCO C2 north polar hole example (left, north) shows outward motion of plume onset >2.0 Rs in 37 min. This implies an outward plane-of-the-sky speed of ~600 km s-1.

CASS/UCSD AOGS 2011
3D Analysis of the Heliosphere
Jets (polar plumes) can be observed moving outward in the solar polar regions often at speeds >3 times ambient
LASCO C2 north polar hole example (left) shows outward motion of plume onset >2.0 Rs in 37 min. This implies an outward plane-of-the-sky speed of ~600 km s-1.
Why doesn’t Ulysses see them?

CASS/UCSD AOGS 2011
3D Analysis of the Heliosphere
Hinode Observing Proposal (HOP 187)
17 June 2011 00:00 - 06:00 UT07 August 2011 00:00 - 08:00 UT (canceled)Rerun (TBD)
(Hinode XRT, EIS, SDO, LASCO C2, STEREO, IPS, SMEI)
“Jets from the solar surface to interplanetary space”
Current participants: B.V. Jackson, M. Shimojo, N. Sako, D. Brooks, A. Sterling, M.Tokumaru, P.K. Manoharan, K. Schenk, R. Howard, J. Gurman, P. Liewer, K. Shibata, W. Pesnell, Nikolai Pogorelov

CASS/UCSD AOGS 2011
3D Analysis of the Heliosphere
46
The heliopause colored by the total pressure, ISMF lines draping the HP, and the surface B·R=0 in the MHD-kinetic simulation from Pogorelov et al. (2009). The ISMF is from λ ≈ 236º and b ≈ 30º. The direction =224 and b=41 fits the IBEX observations better. In both cases, the BV-plane is parallel to the HDP.
Heliopause simulation (Pogorelov, N, et al., 2009, Adv. in Space Res., 44, 1337)

CASS/UCSD AOGS 2011
3D Analysis of the Heliosphere
IBEX ENA Flux
The ribbon is highly sensitive to variations in the ISMF direction!
47
Simulation (4.5 kev) ENA Image
Heliopause simulation (Pogorelov, N, et al., 2009, Adv. in Space Res., 44, 1337)

CASS/UCSD AOGS 2011
3D Analysis of the Heliosphere
The 3D heliosphere:We can reconstruct it globally in fundamental parameters,
velocity and density. CMEs, co-rotating structures, shock sheaths, the largest jets? We can forecast its arrival at Earth.
We’ve learned many things: The extent, shape, 3D mass of CMEs.
The relationship of density and velocity to the in-situ manifestation of these structures.
We are getting better!
Are we there yet? (Have we answered the most fundamental questions?)
Summary:


