
Cassandra Day Atlanta 2015: Diagnosing Problems in Production
39
©2013 DataStax Confidential. Do not distribute without consent. Jon Haddad, Technical Evangelist @rustyrazorblade Diagnosing Problems in Production 1
-
Upload
planet-cassandra -
Category
Technology
-
view
274 -
download
2
Transcript of Cassandra Day Atlanta 2015: Diagnosing Problems in Production
©2013 DataStax Confidential. Do not distribute without consent.
Jon Haddad, Technical Evangelist @rustyrazorblade
Diagnosing Problems in Production
1
First Step: Preparation
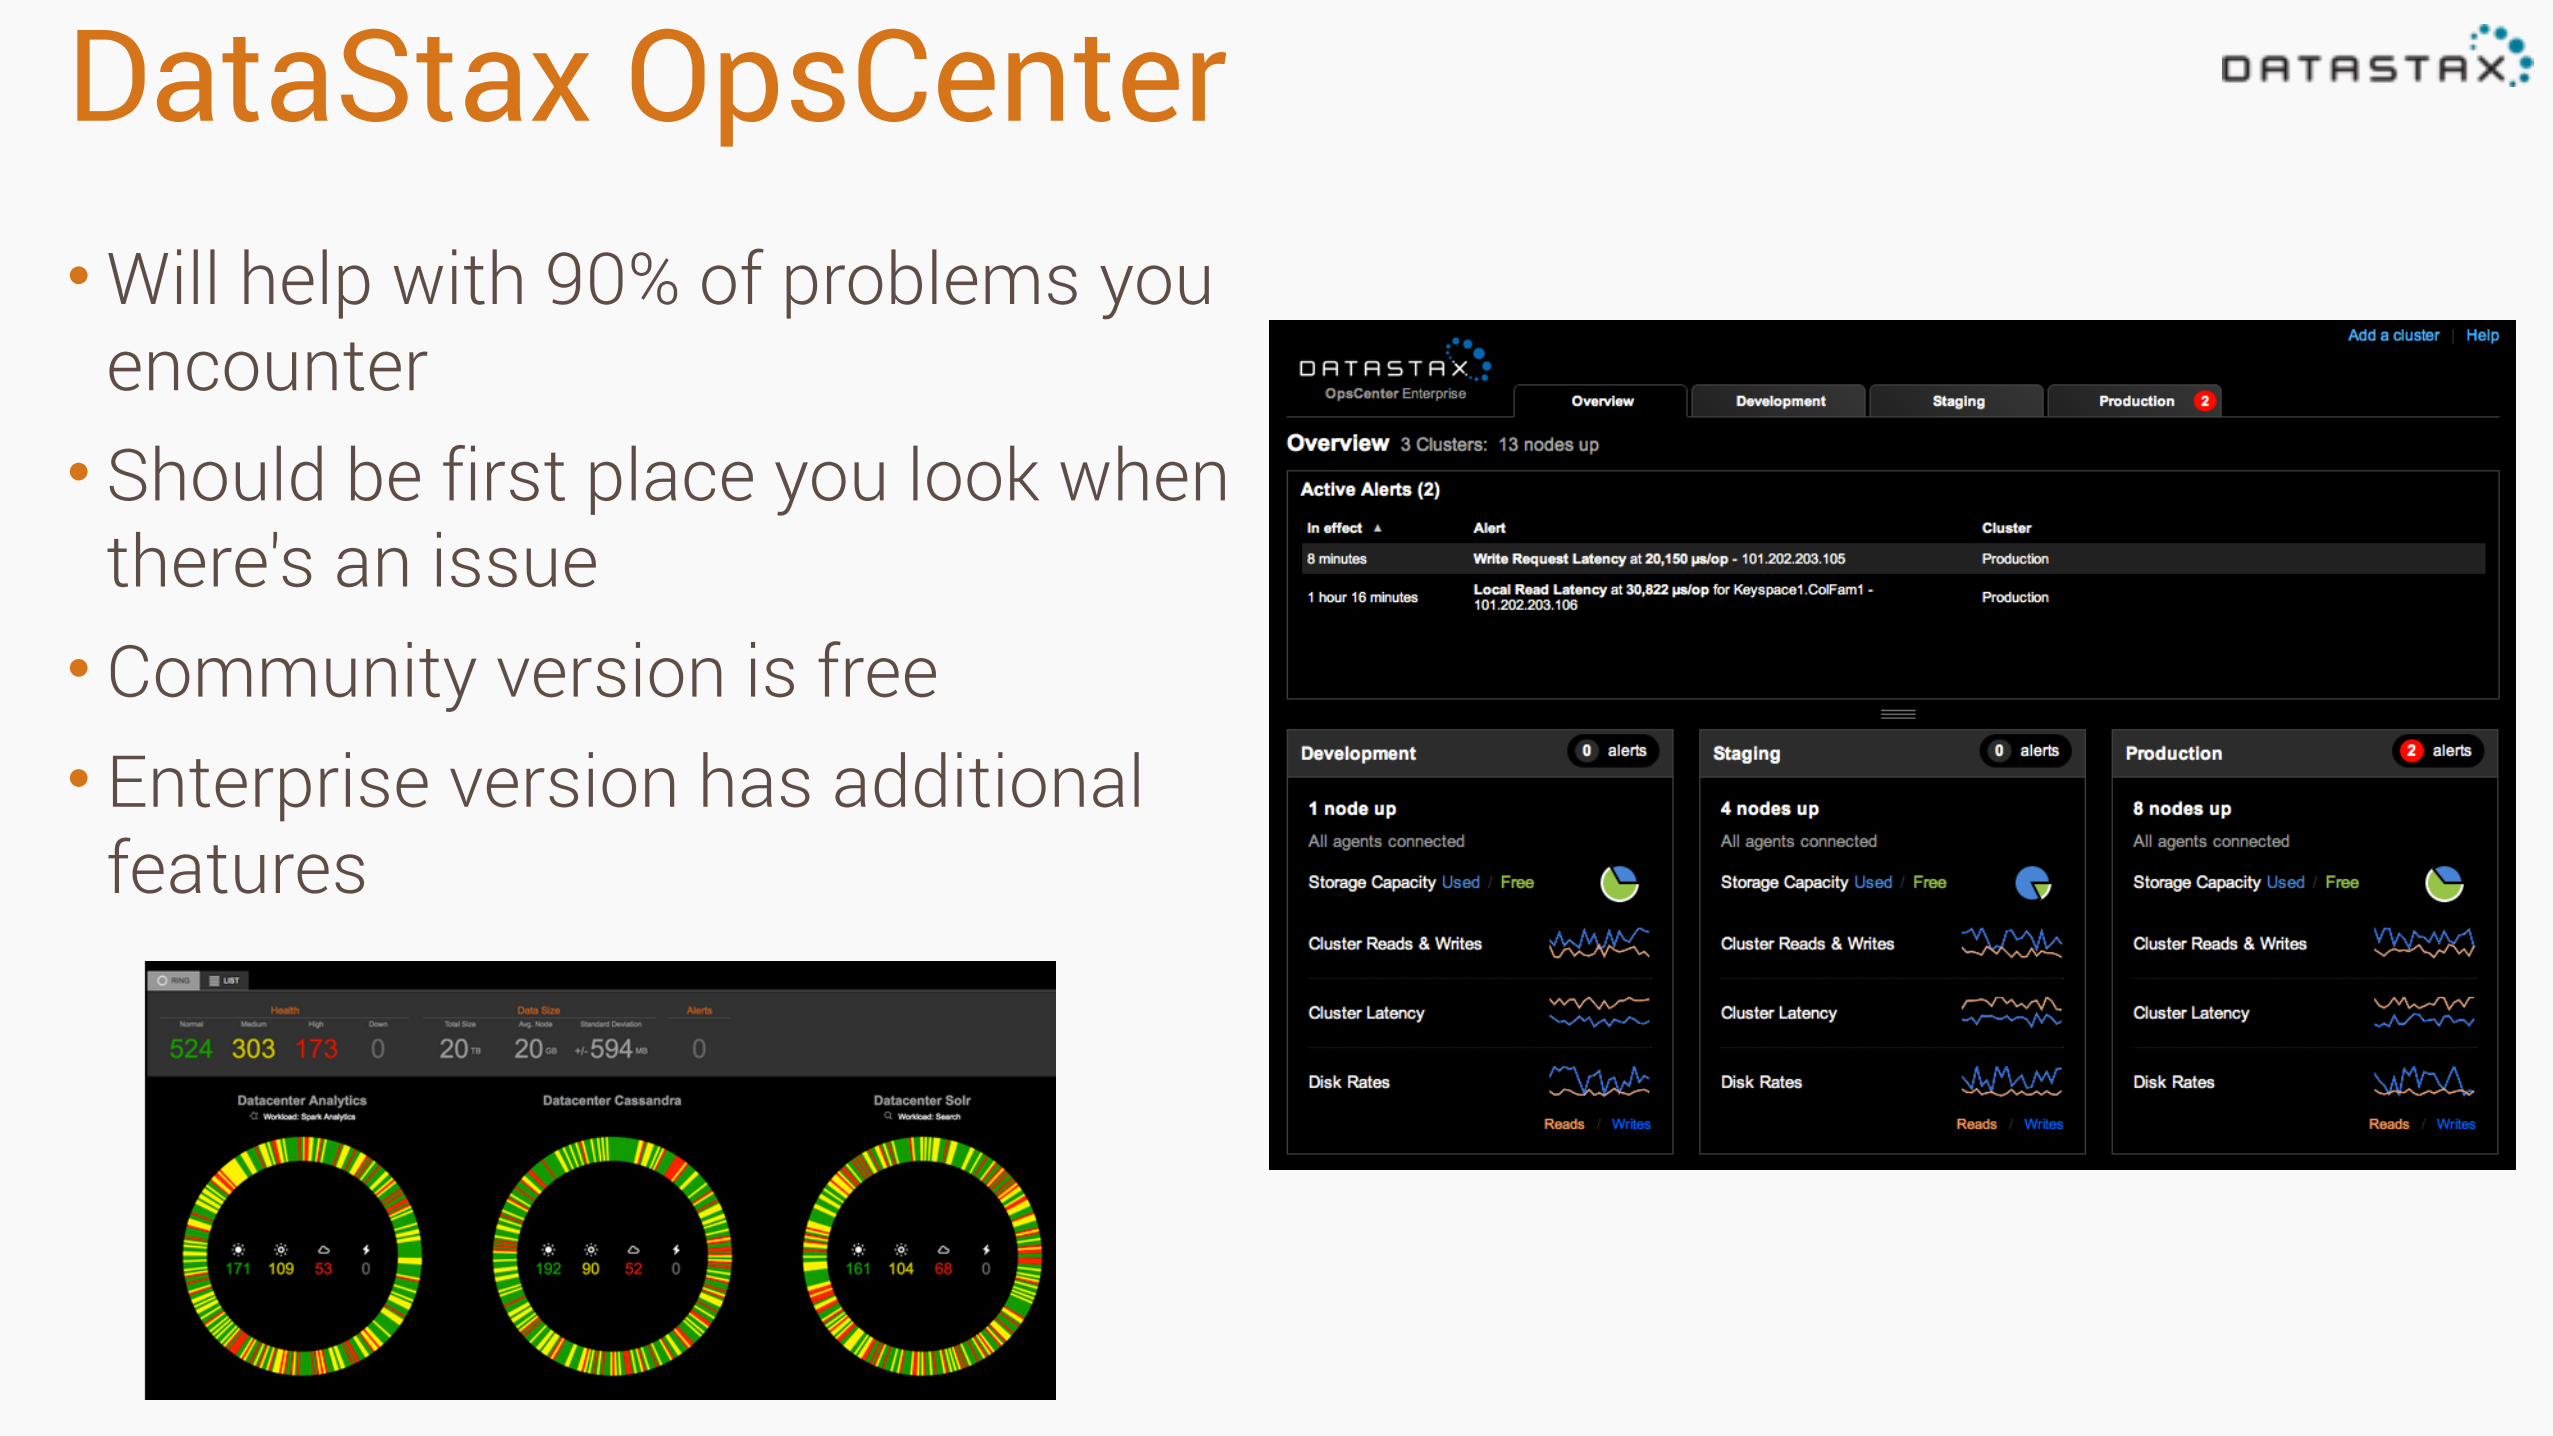
DataStax OpsCenter•Will help with 90% of problems you
encounter • Should be first place you look when
there's an issue • Community version is free • Enterprise version has additional
features
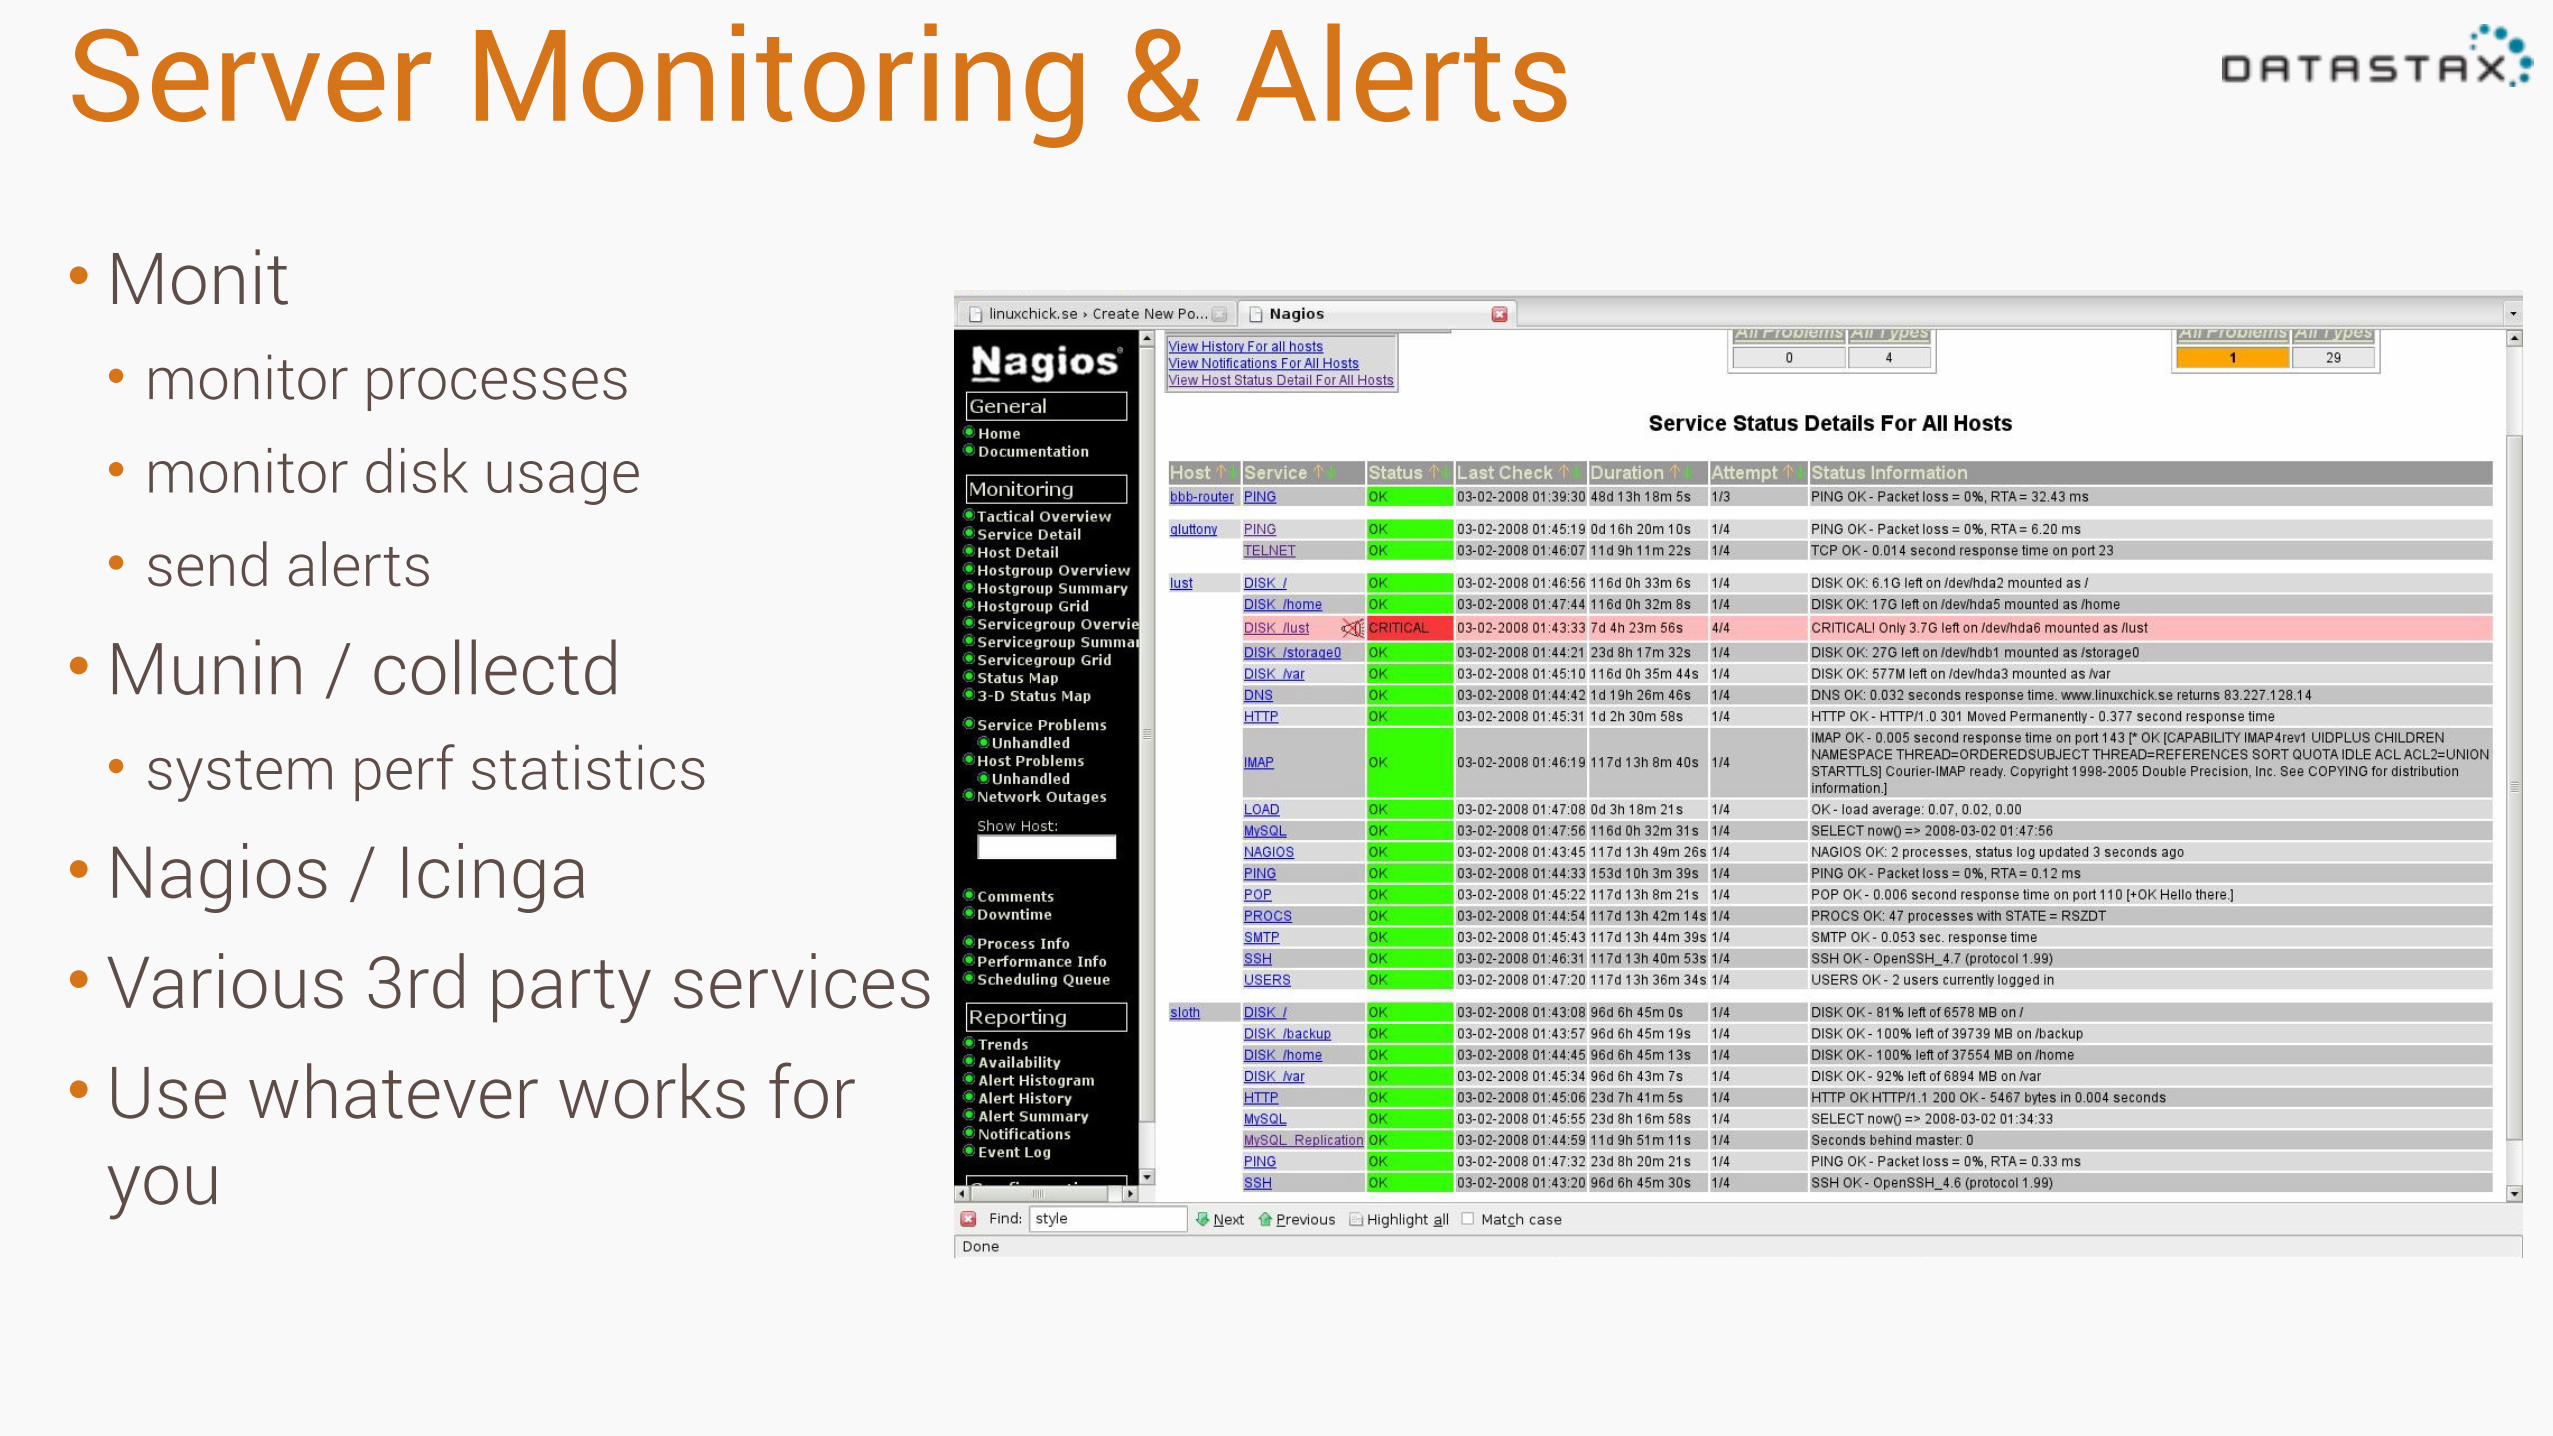
Server Monitoring & Alerts•Monit • monitor processes • monitor disk usage • send alerts
•Munin / collectd • system perf statistics
•Nagios / Icinga • Various 3rd party services • Use whatever works for
you
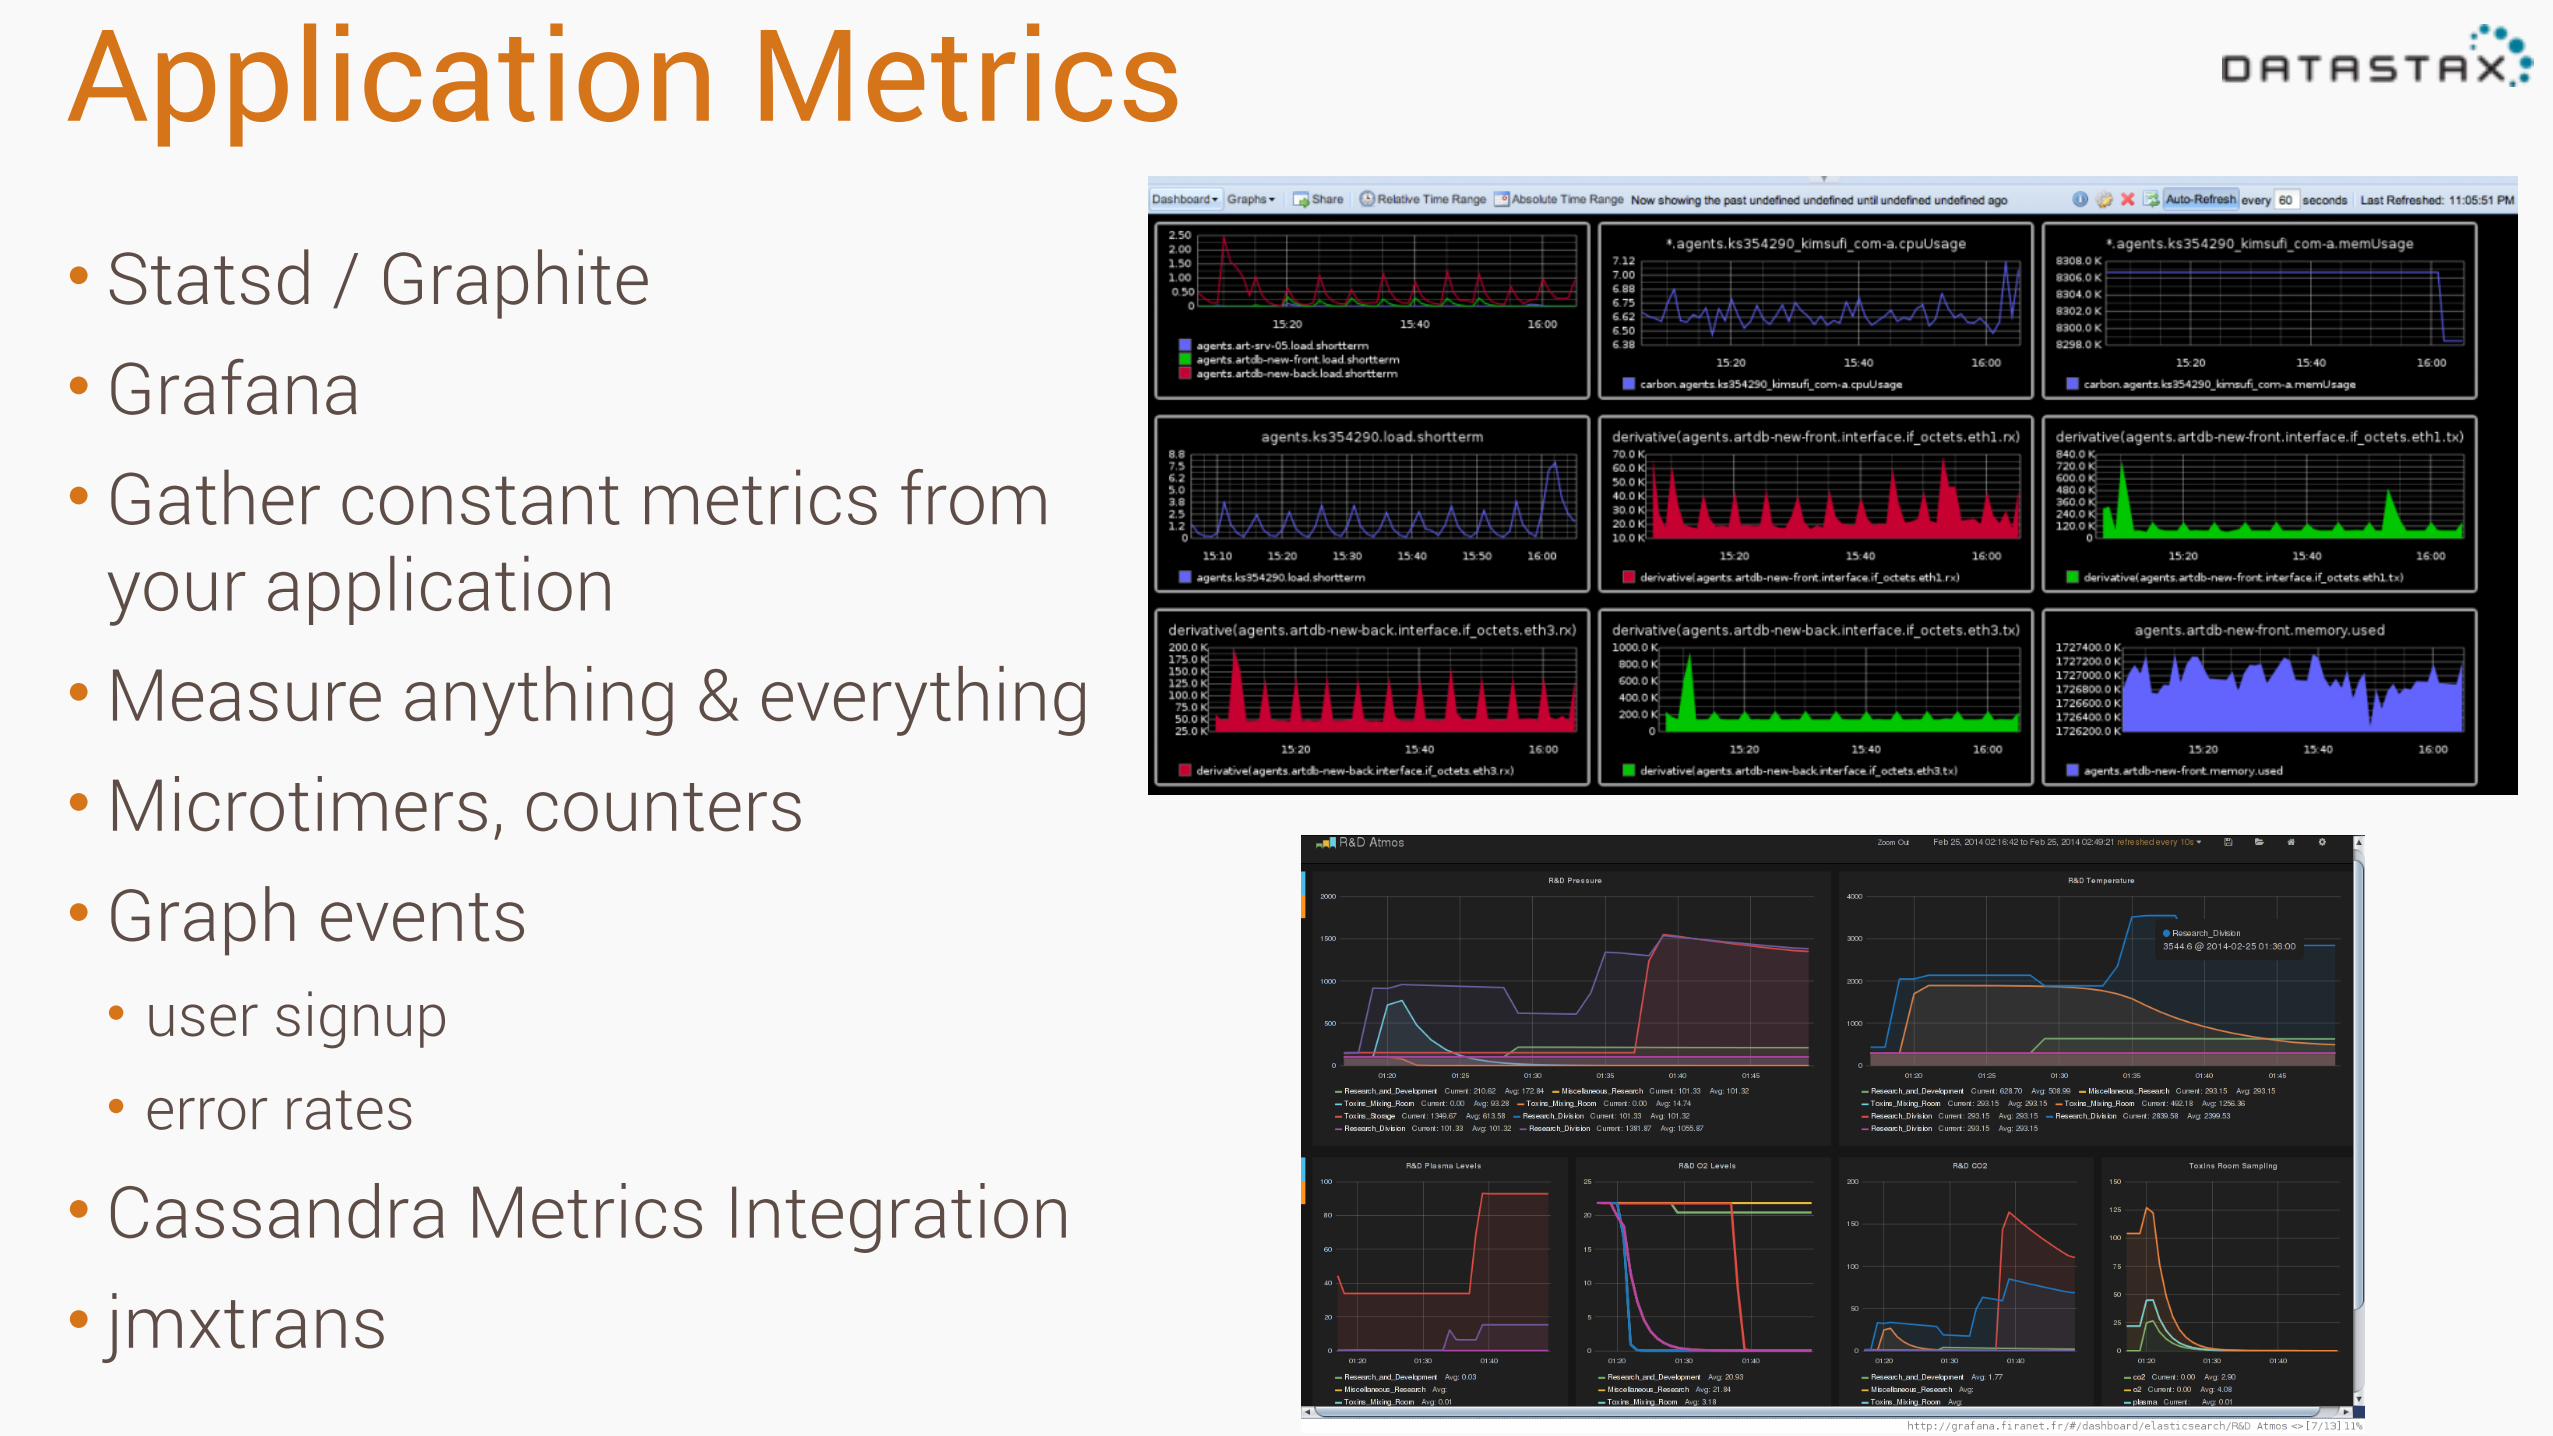
Application Metrics• Statsd / Graphite • Grafana • Gather constant metrics from
your application •Measure anything & everything •Microtimers, counters • Graph events • user signup • error rates
• Cassandra Metrics Integration • jmxtrans
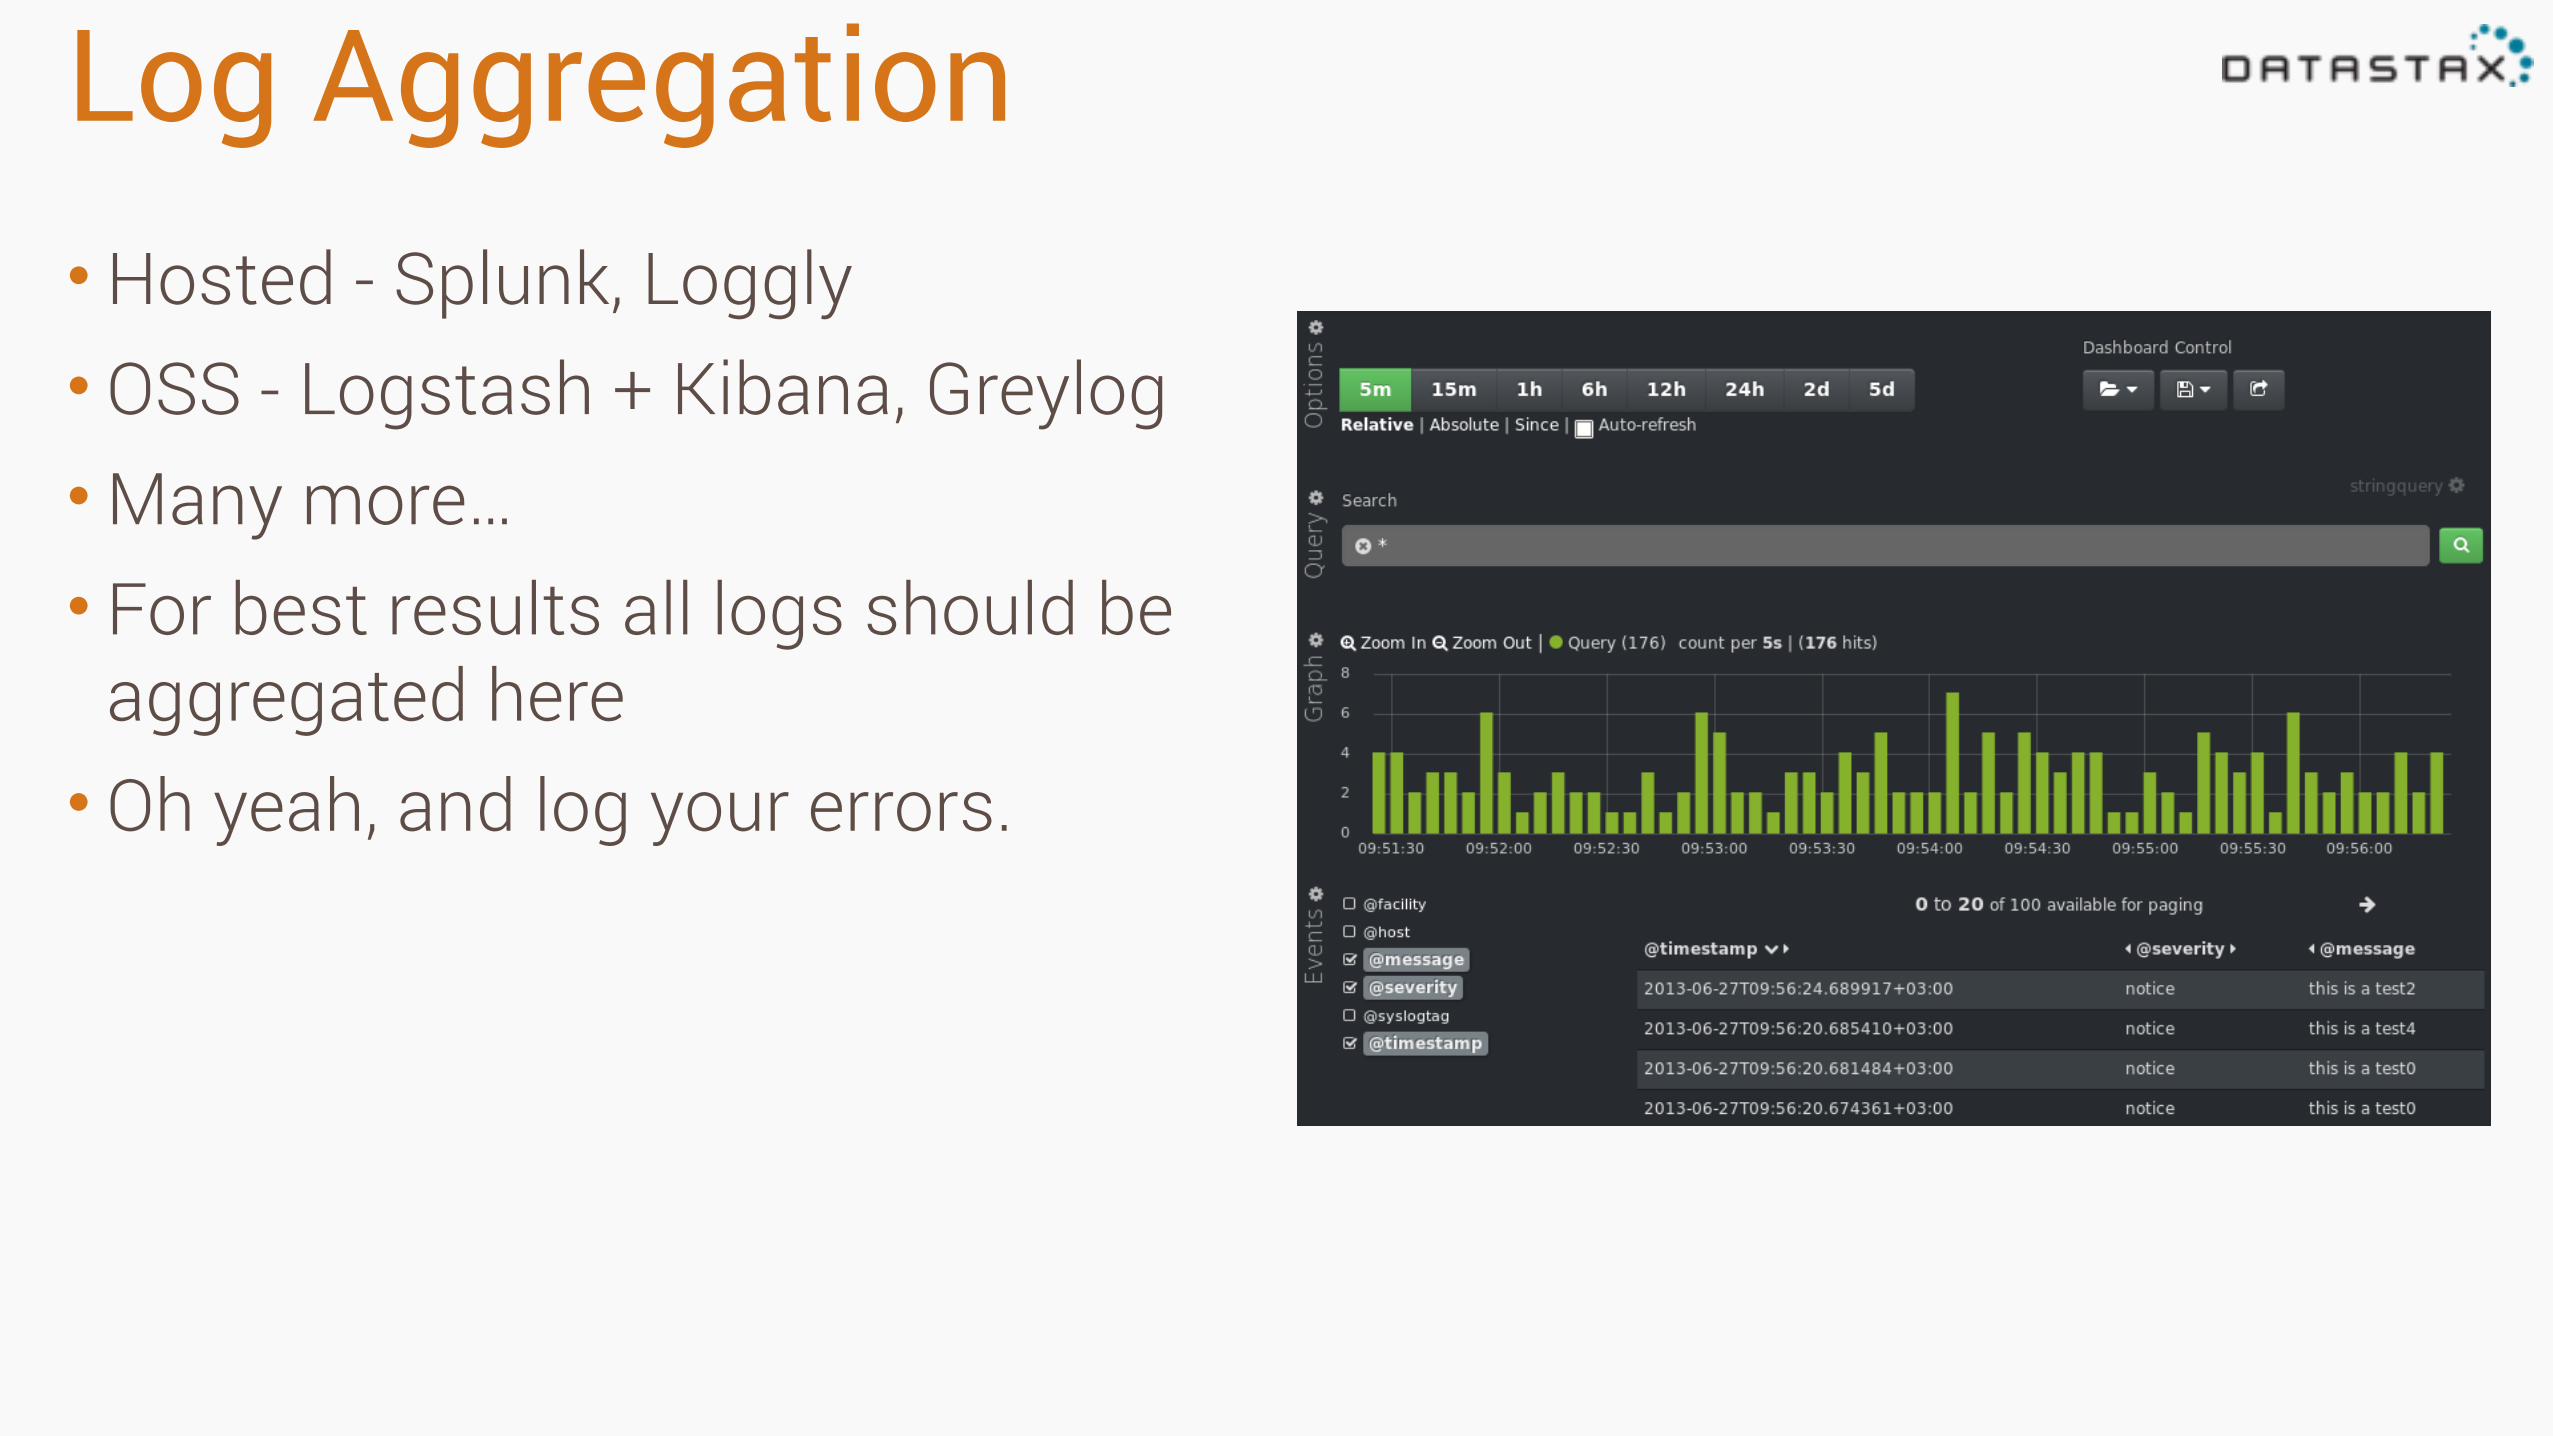
Log Aggregation•Hosted - Splunk, Loggly • OSS - Logstash + Kibana, Greylog •Many more… • For best results all logs should be
aggregated here • Oh yeah, and log your errors.

Gotchas
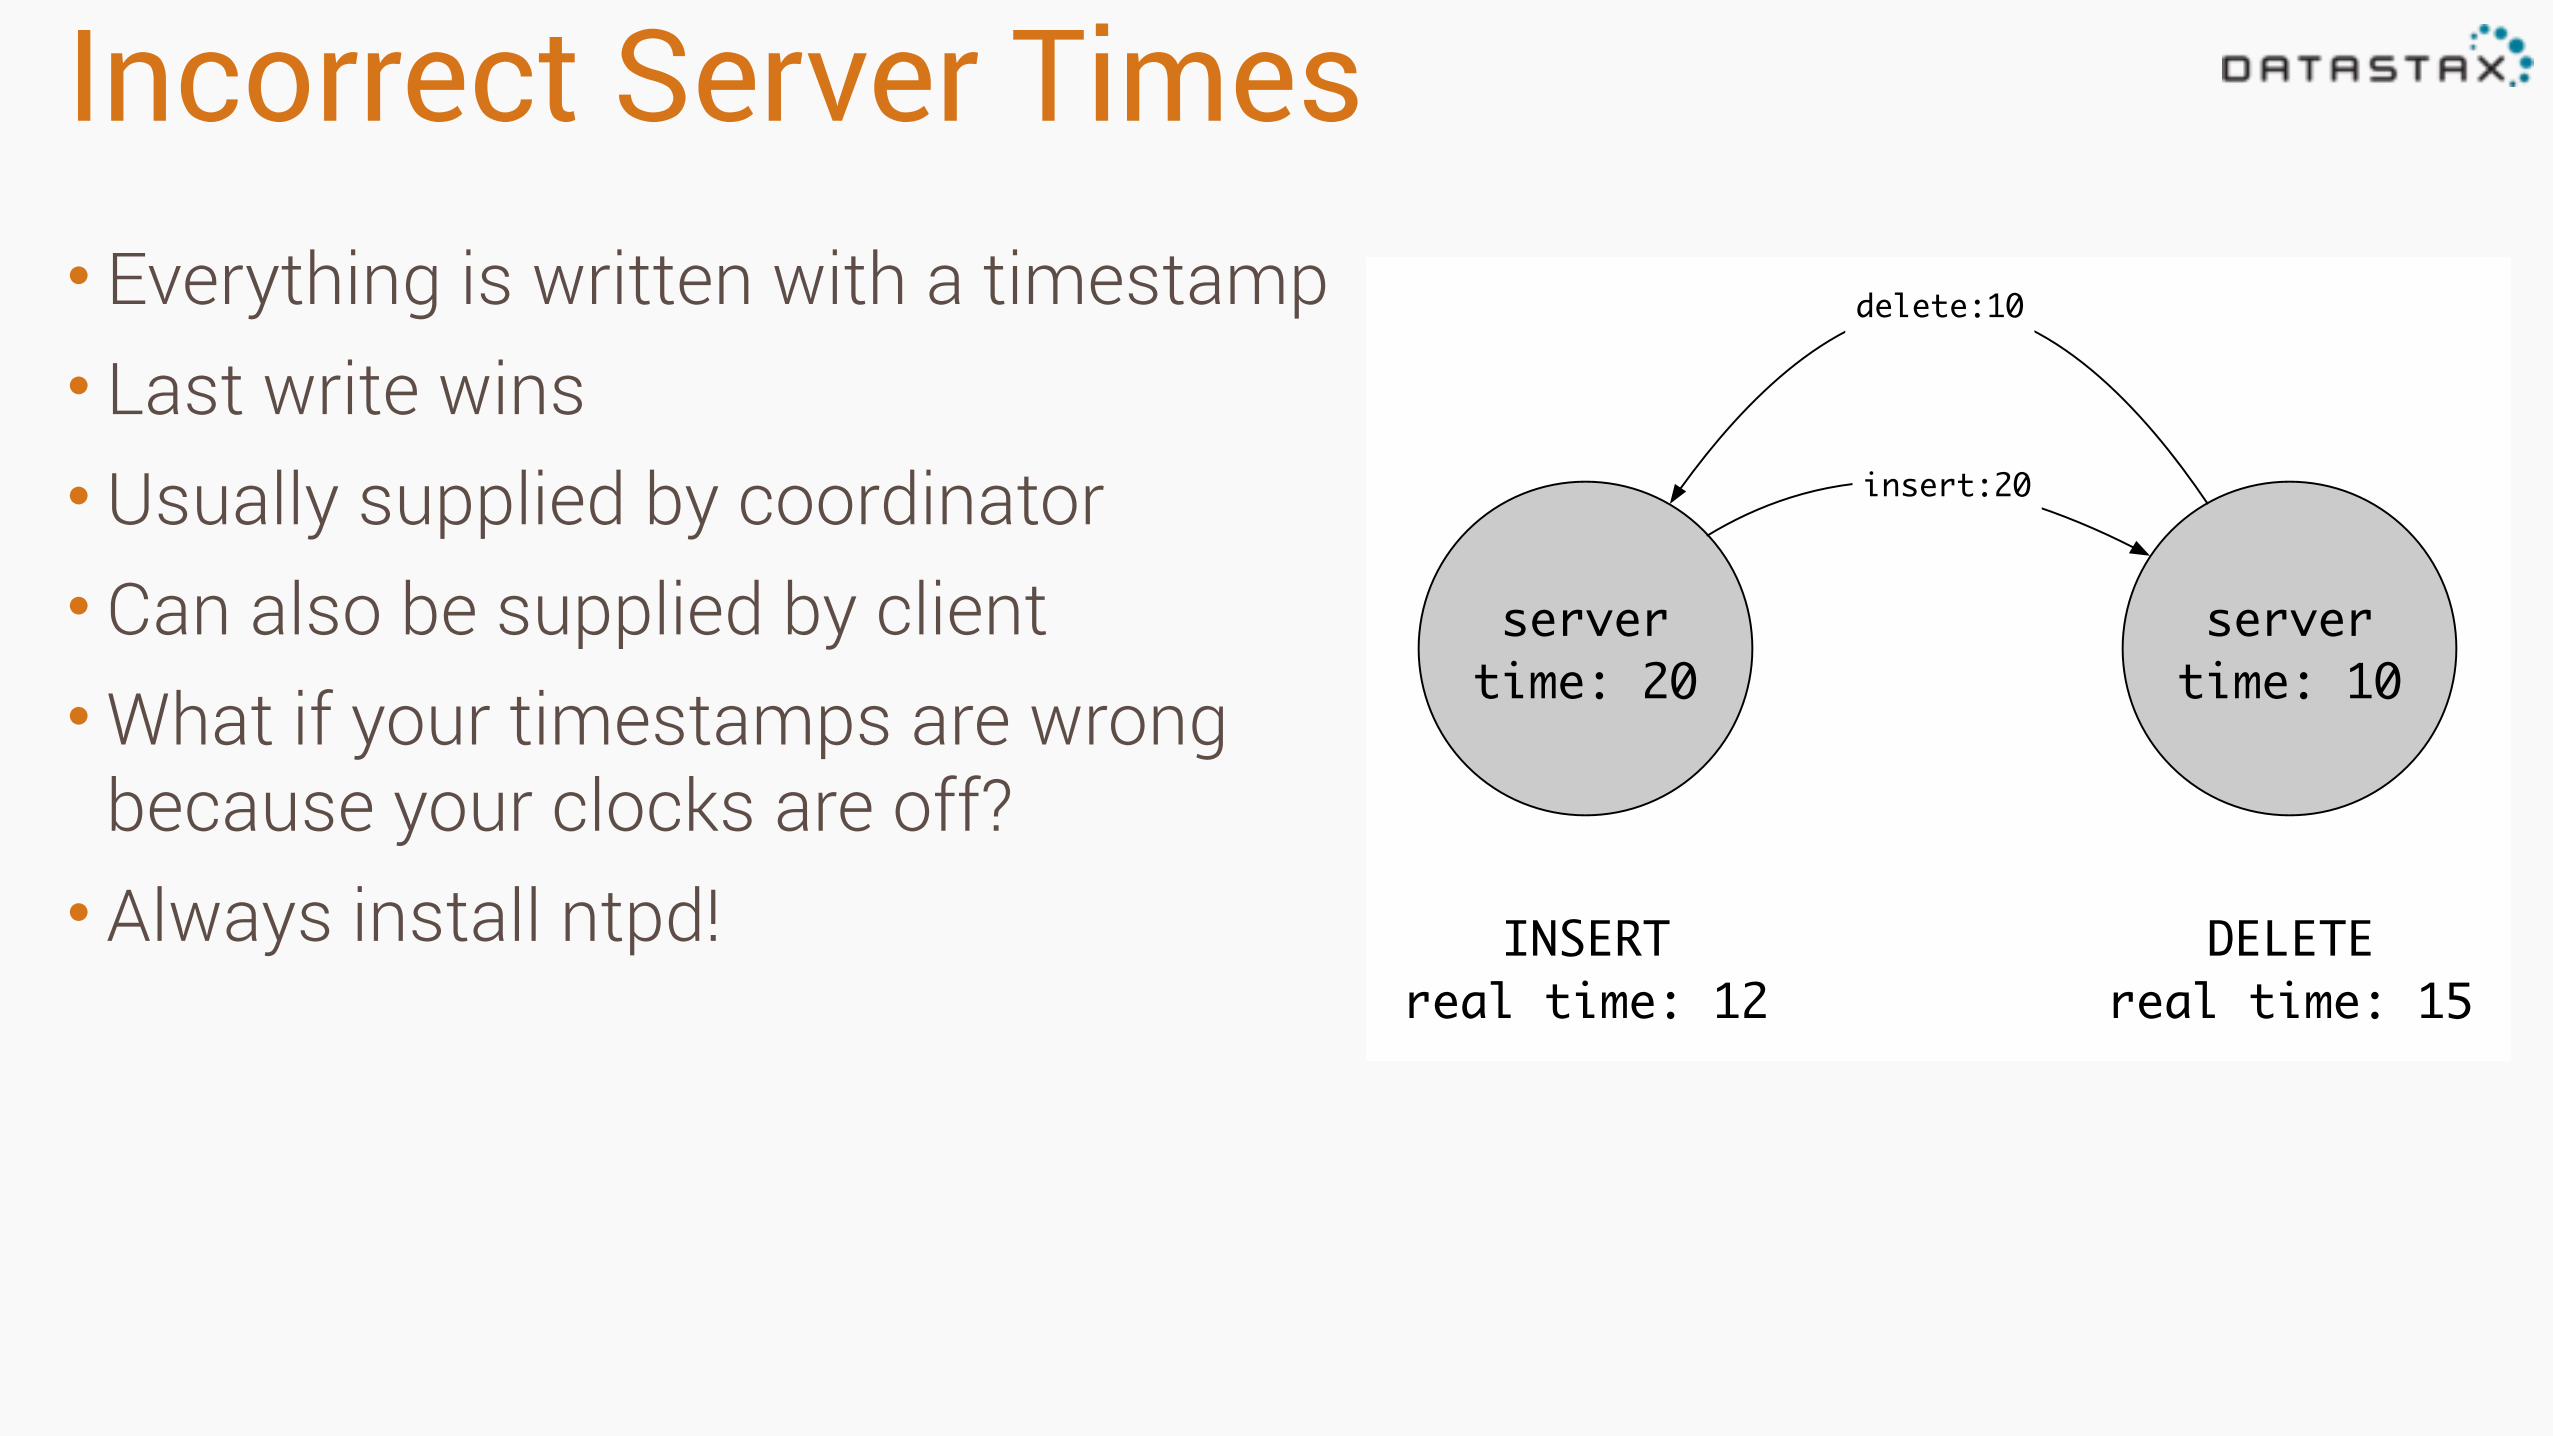
Incorrect Server Times• Everything is written with a timestamp • Last write wins • Usually supplied by coordinator • Can also be supplied by client •What if your timestamps are wrong
because your clocks are off? • Always install ntpd!
server time: 10
server time: 20
INSERTreal time: 12
DELETEreal time: 15
insert:20
delete:10
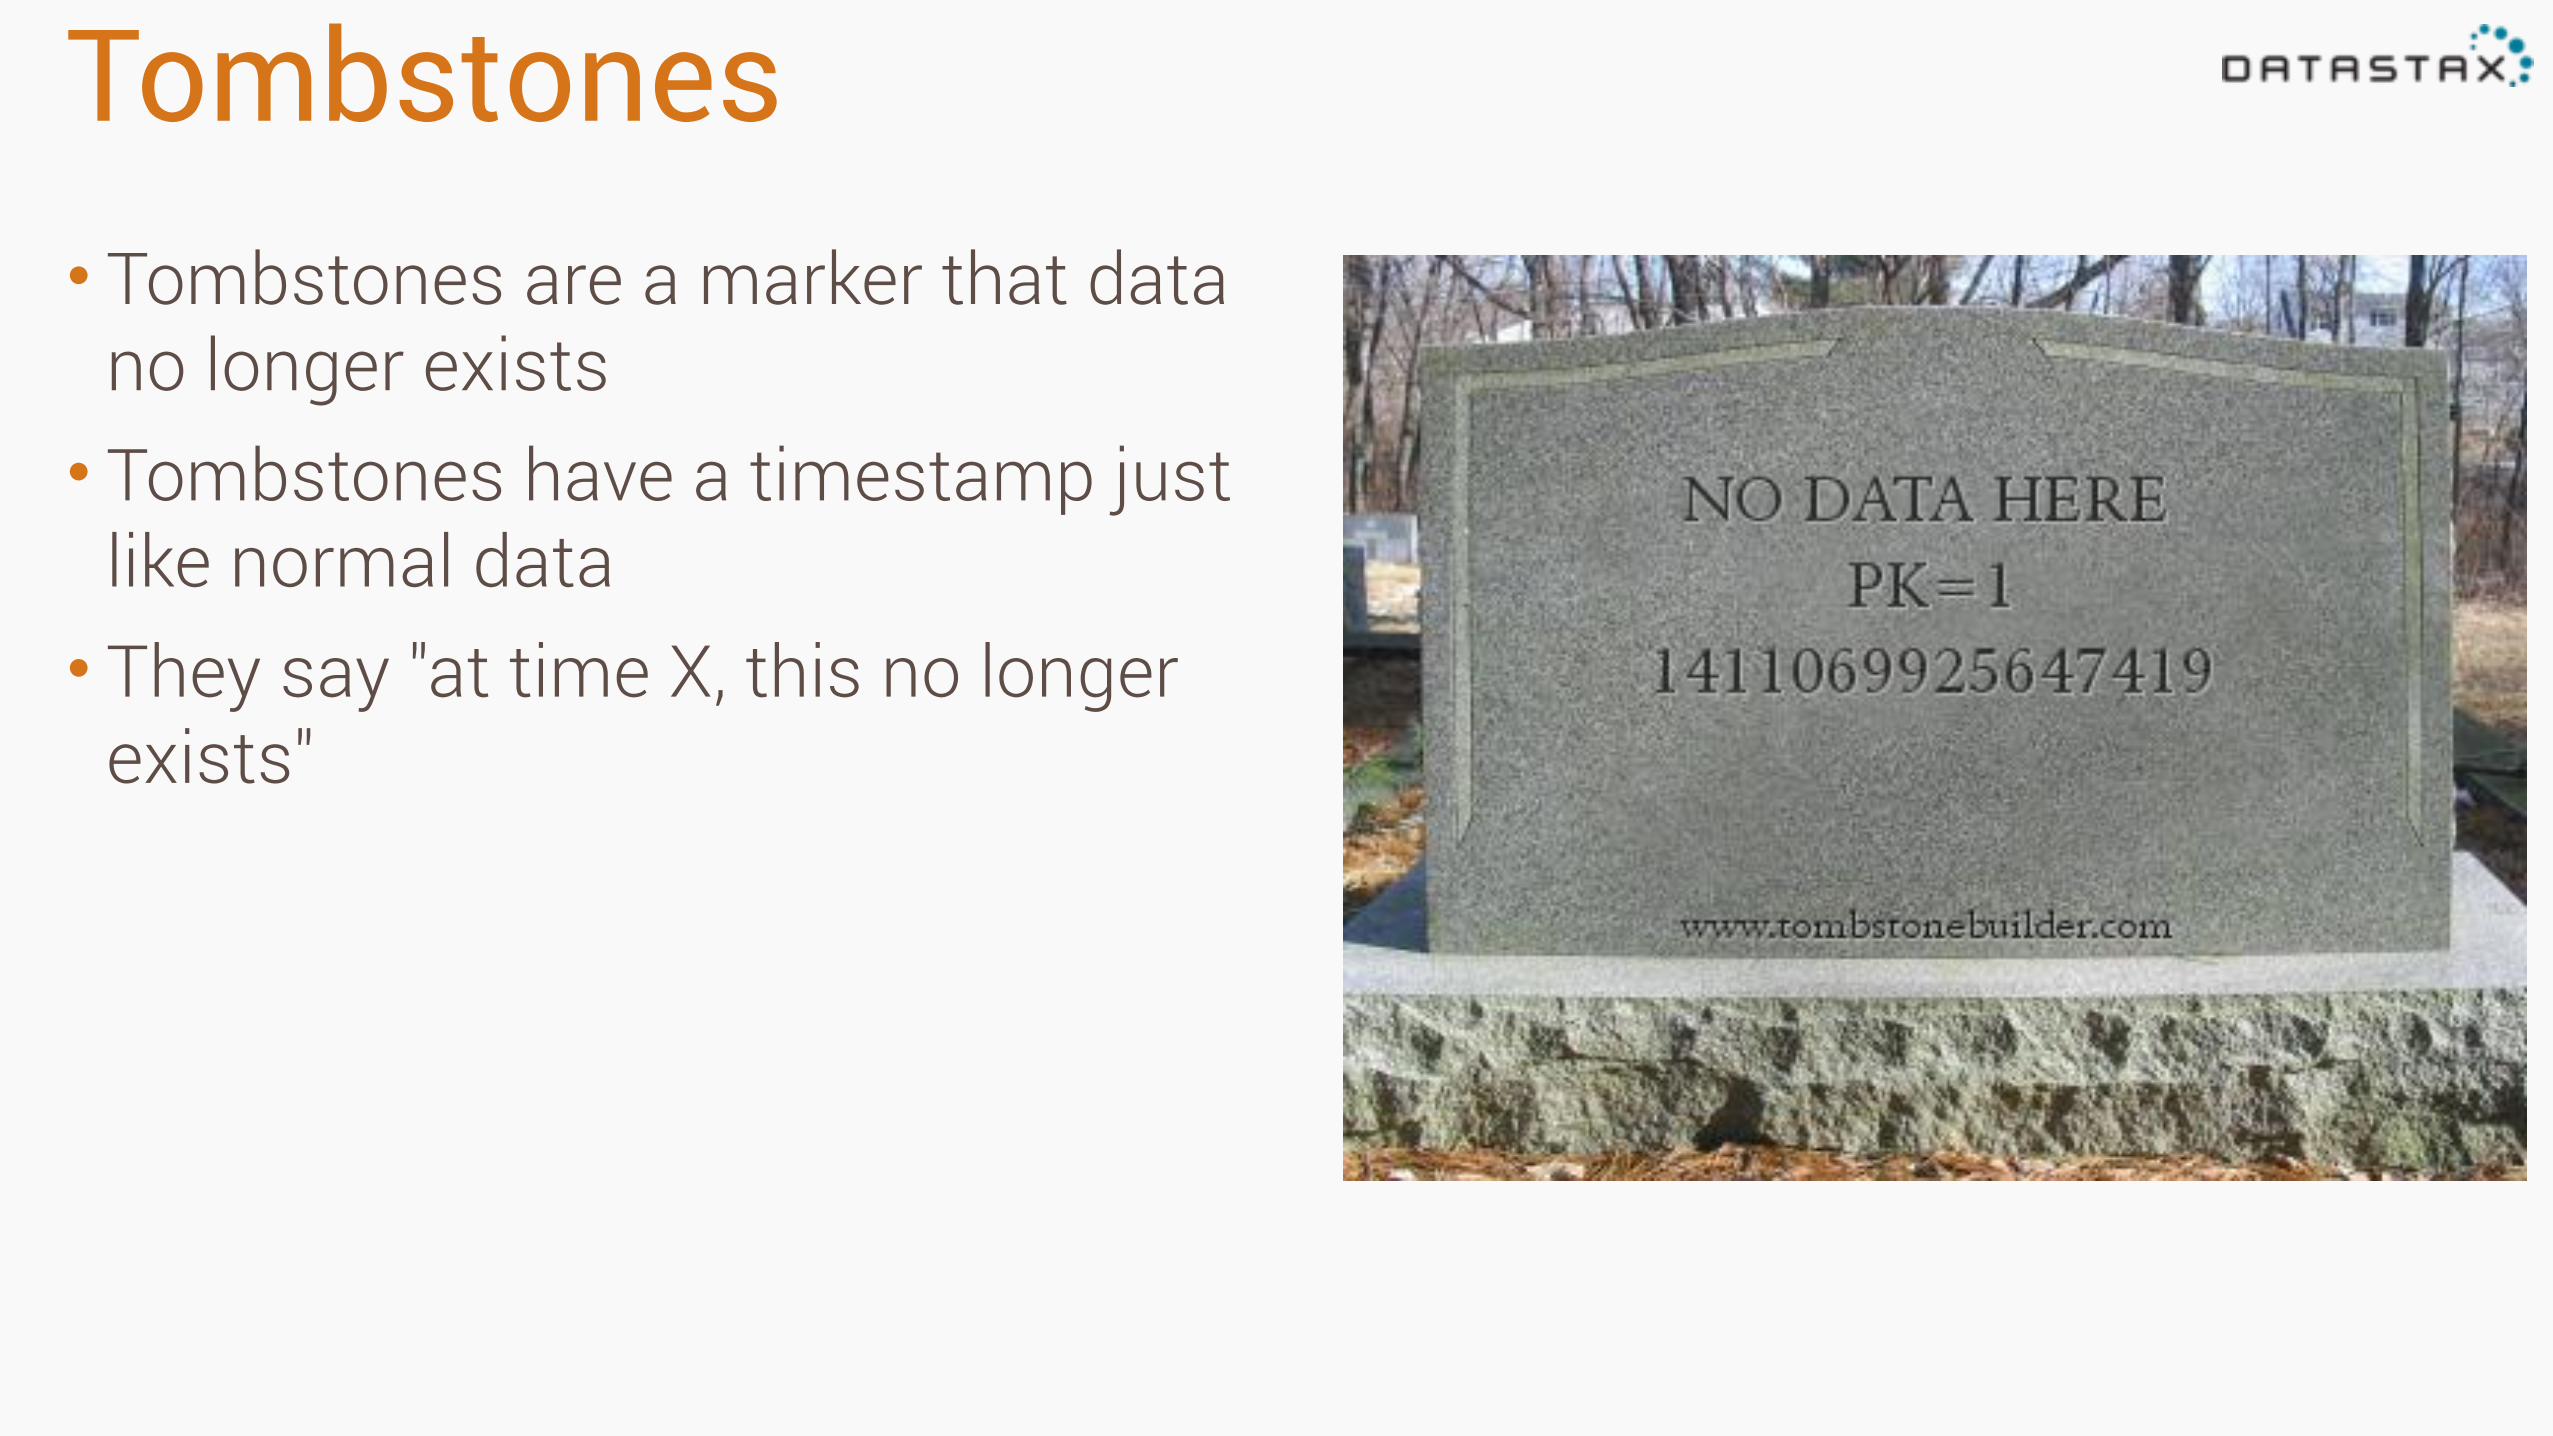
Tombstones• Tombstones are a marker that data
no longer exists • Tombstones have a timestamp just
like normal data • They say "at time X, this no longer
exists"
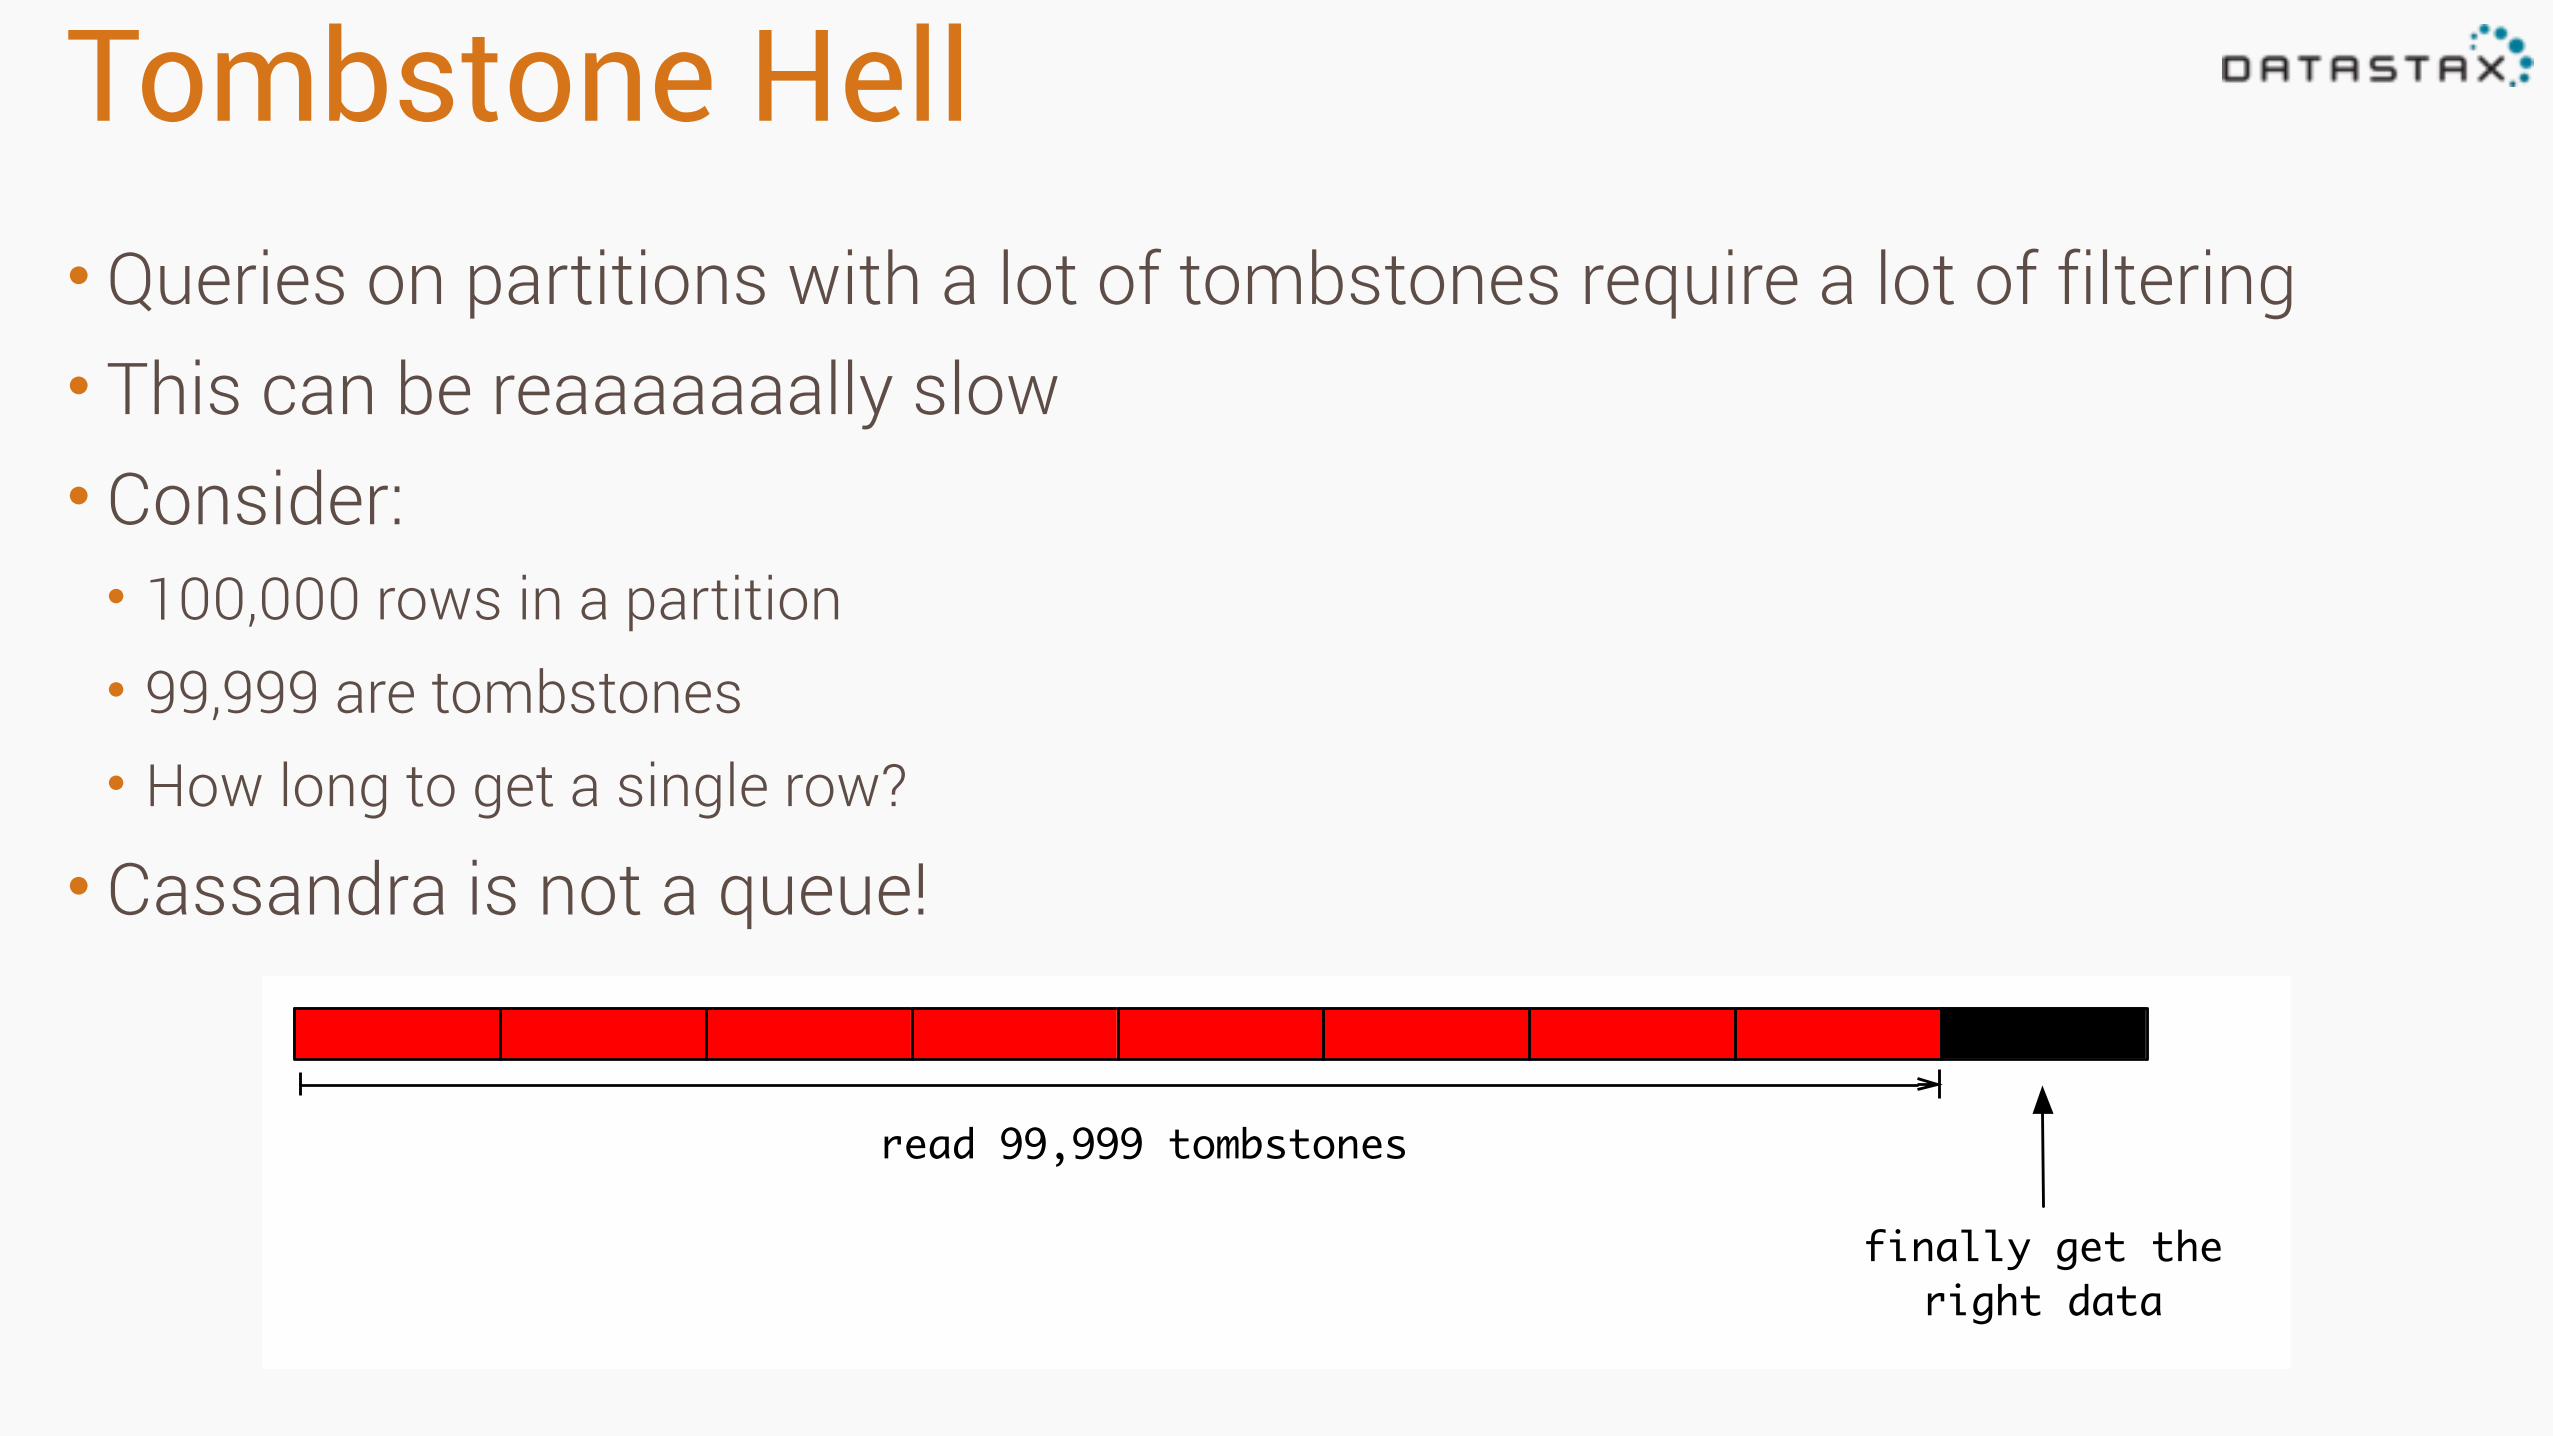
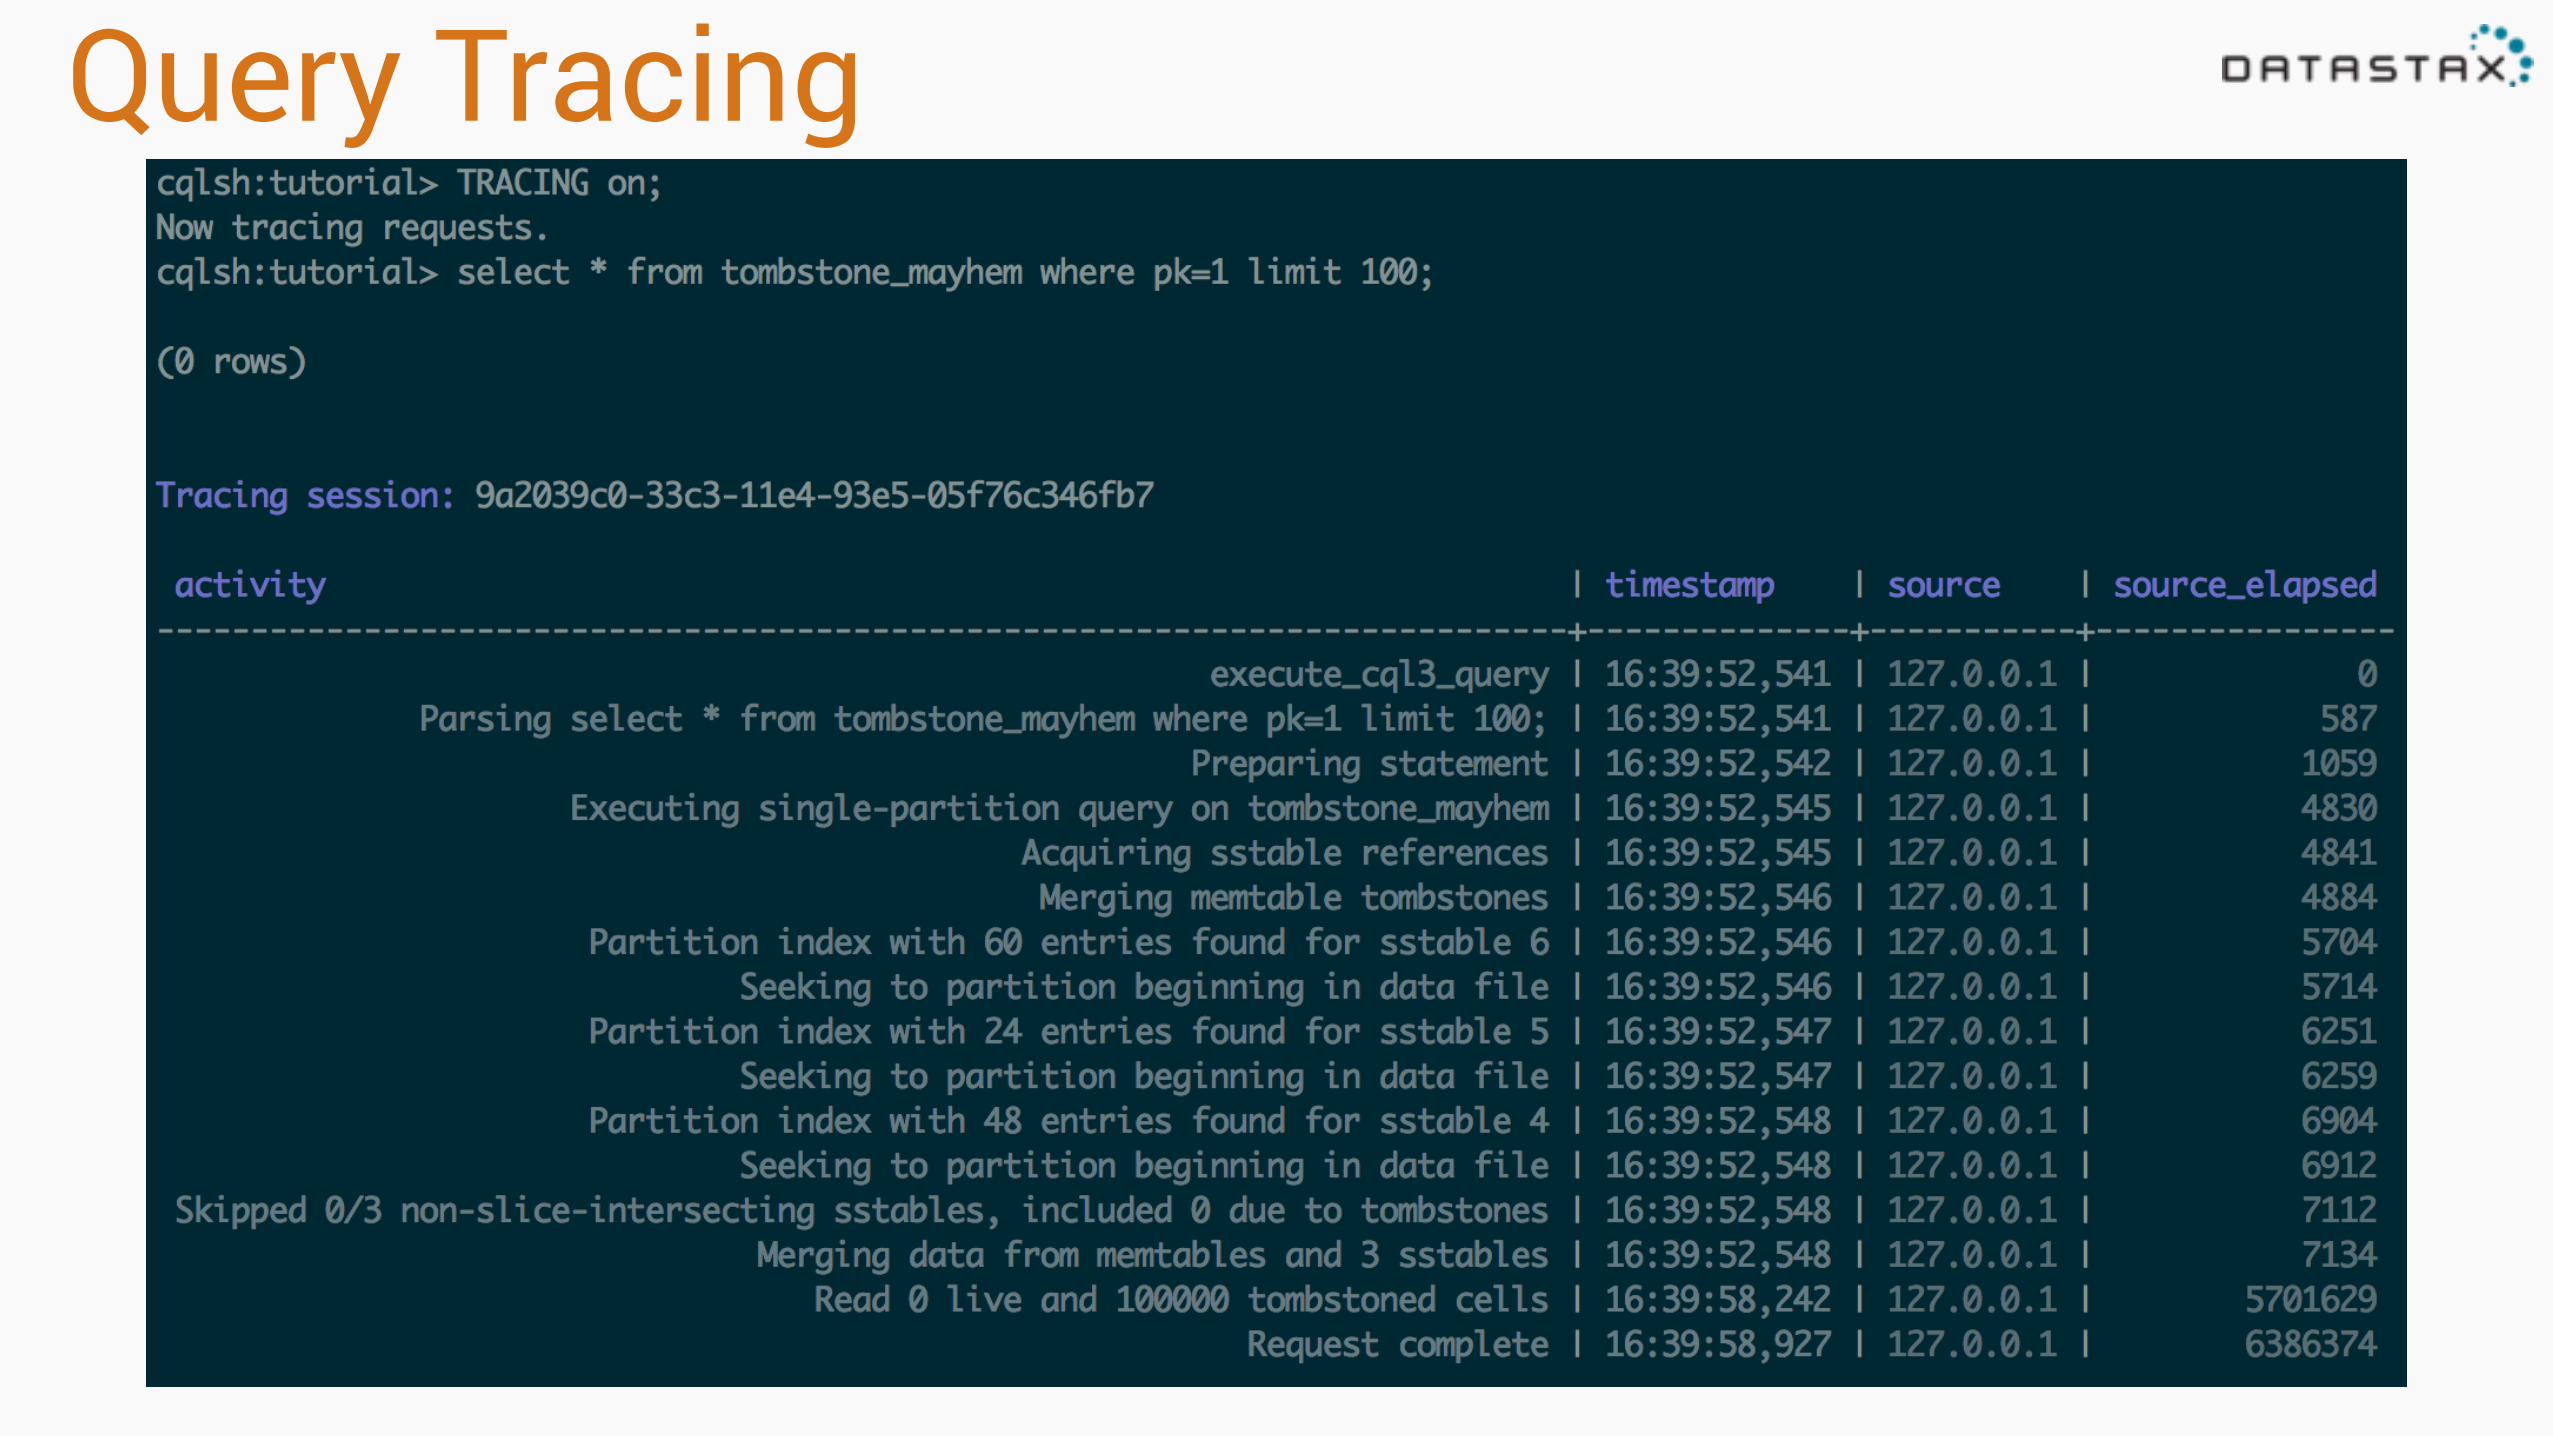
Tombstone Hell• Queries on partitions with a lot of tombstones require a lot of filtering • This can be reaaaaaaally slow • Consider: • 100,000 rows in a partition • 99,999 are tombstones • How long to get a single row?
• Cassandra is not a queue!
read 99,999 tombstones
finally get the right data
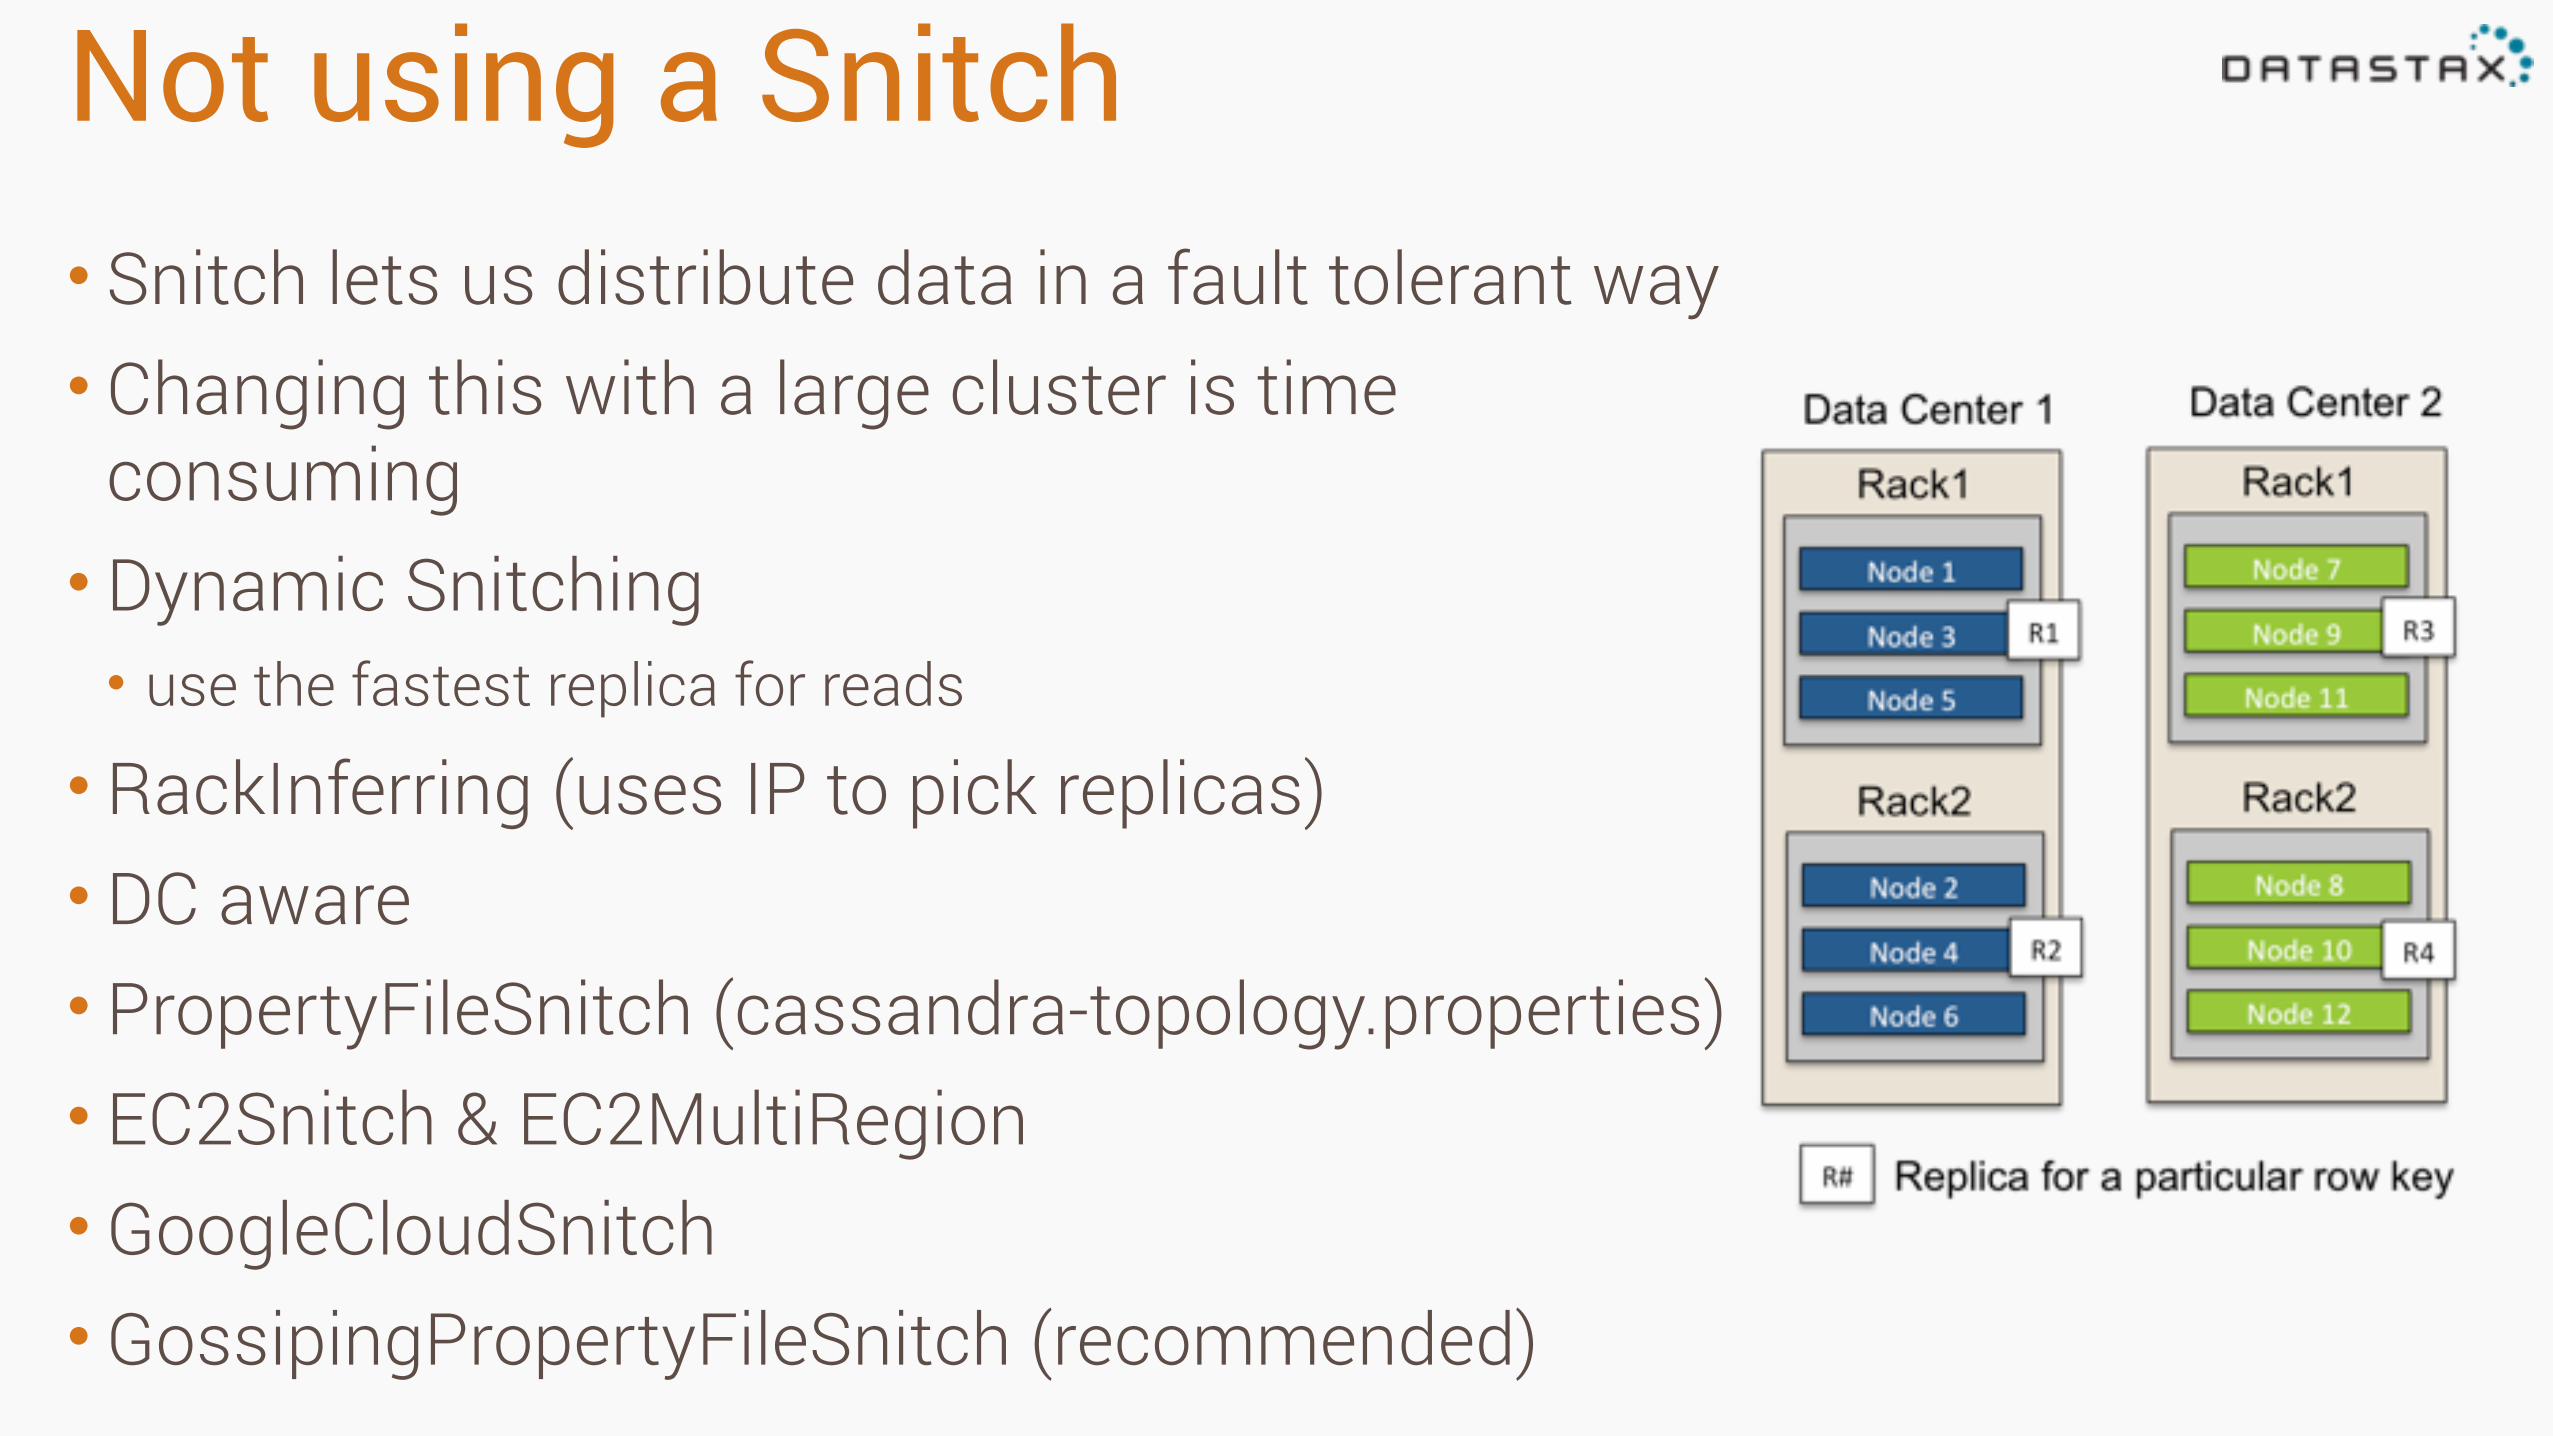
Not using a Snitch• Snitch lets us distribute data in a fault tolerant way • Changing this with a large cluster is time
consuming • Dynamic Snitching • use the fastest replica for reads
• RackInferring (uses IP to pick replicas) • DC aware • PropertyFileSnitch (cassandra-topology.properties) • EC2Snitch & EC2MultiRegion • GoogleCloudSnitch • GossipingPropertyFileSnitch (recommended)
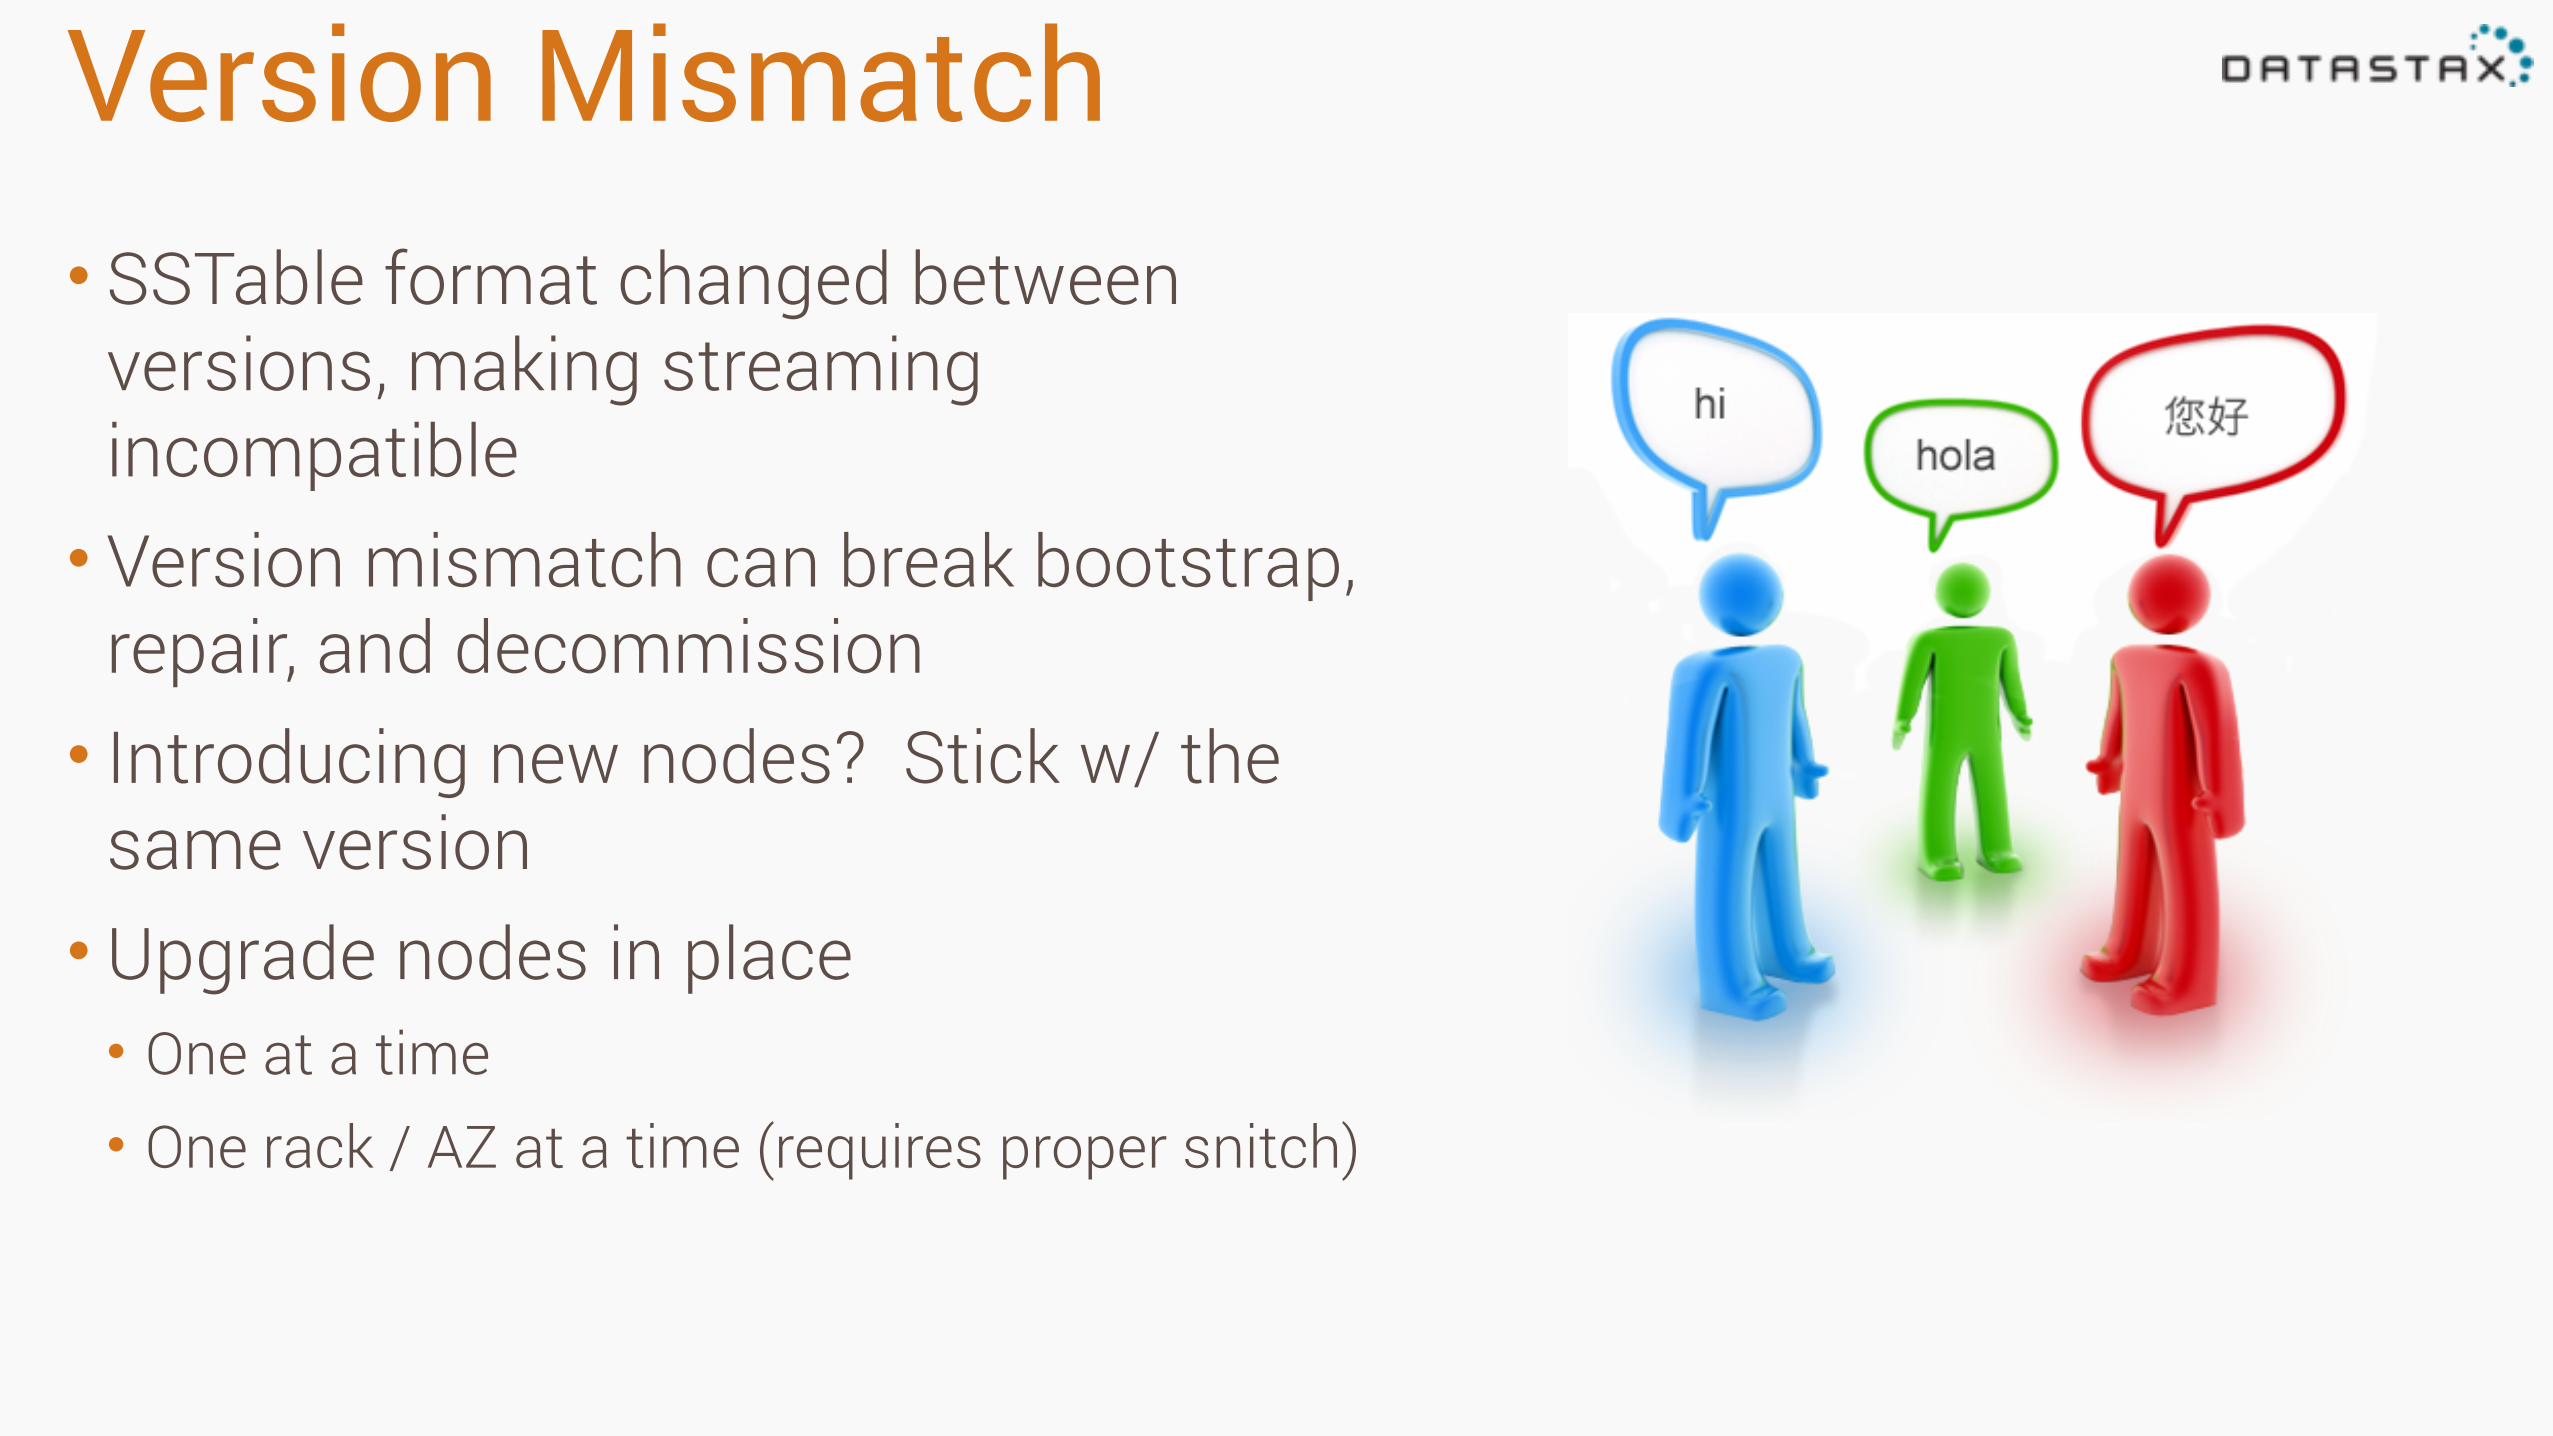
Version Mismatch• SSTable format changed between
versions, making streaming incompatible • Version mismatch can break bootstrap,
repair, and decommission • Introducing new nodes? Stick w/ the
same version • Upgrade nodes in place • One at a time • One rack / AZ at a time (requires proper snitch)
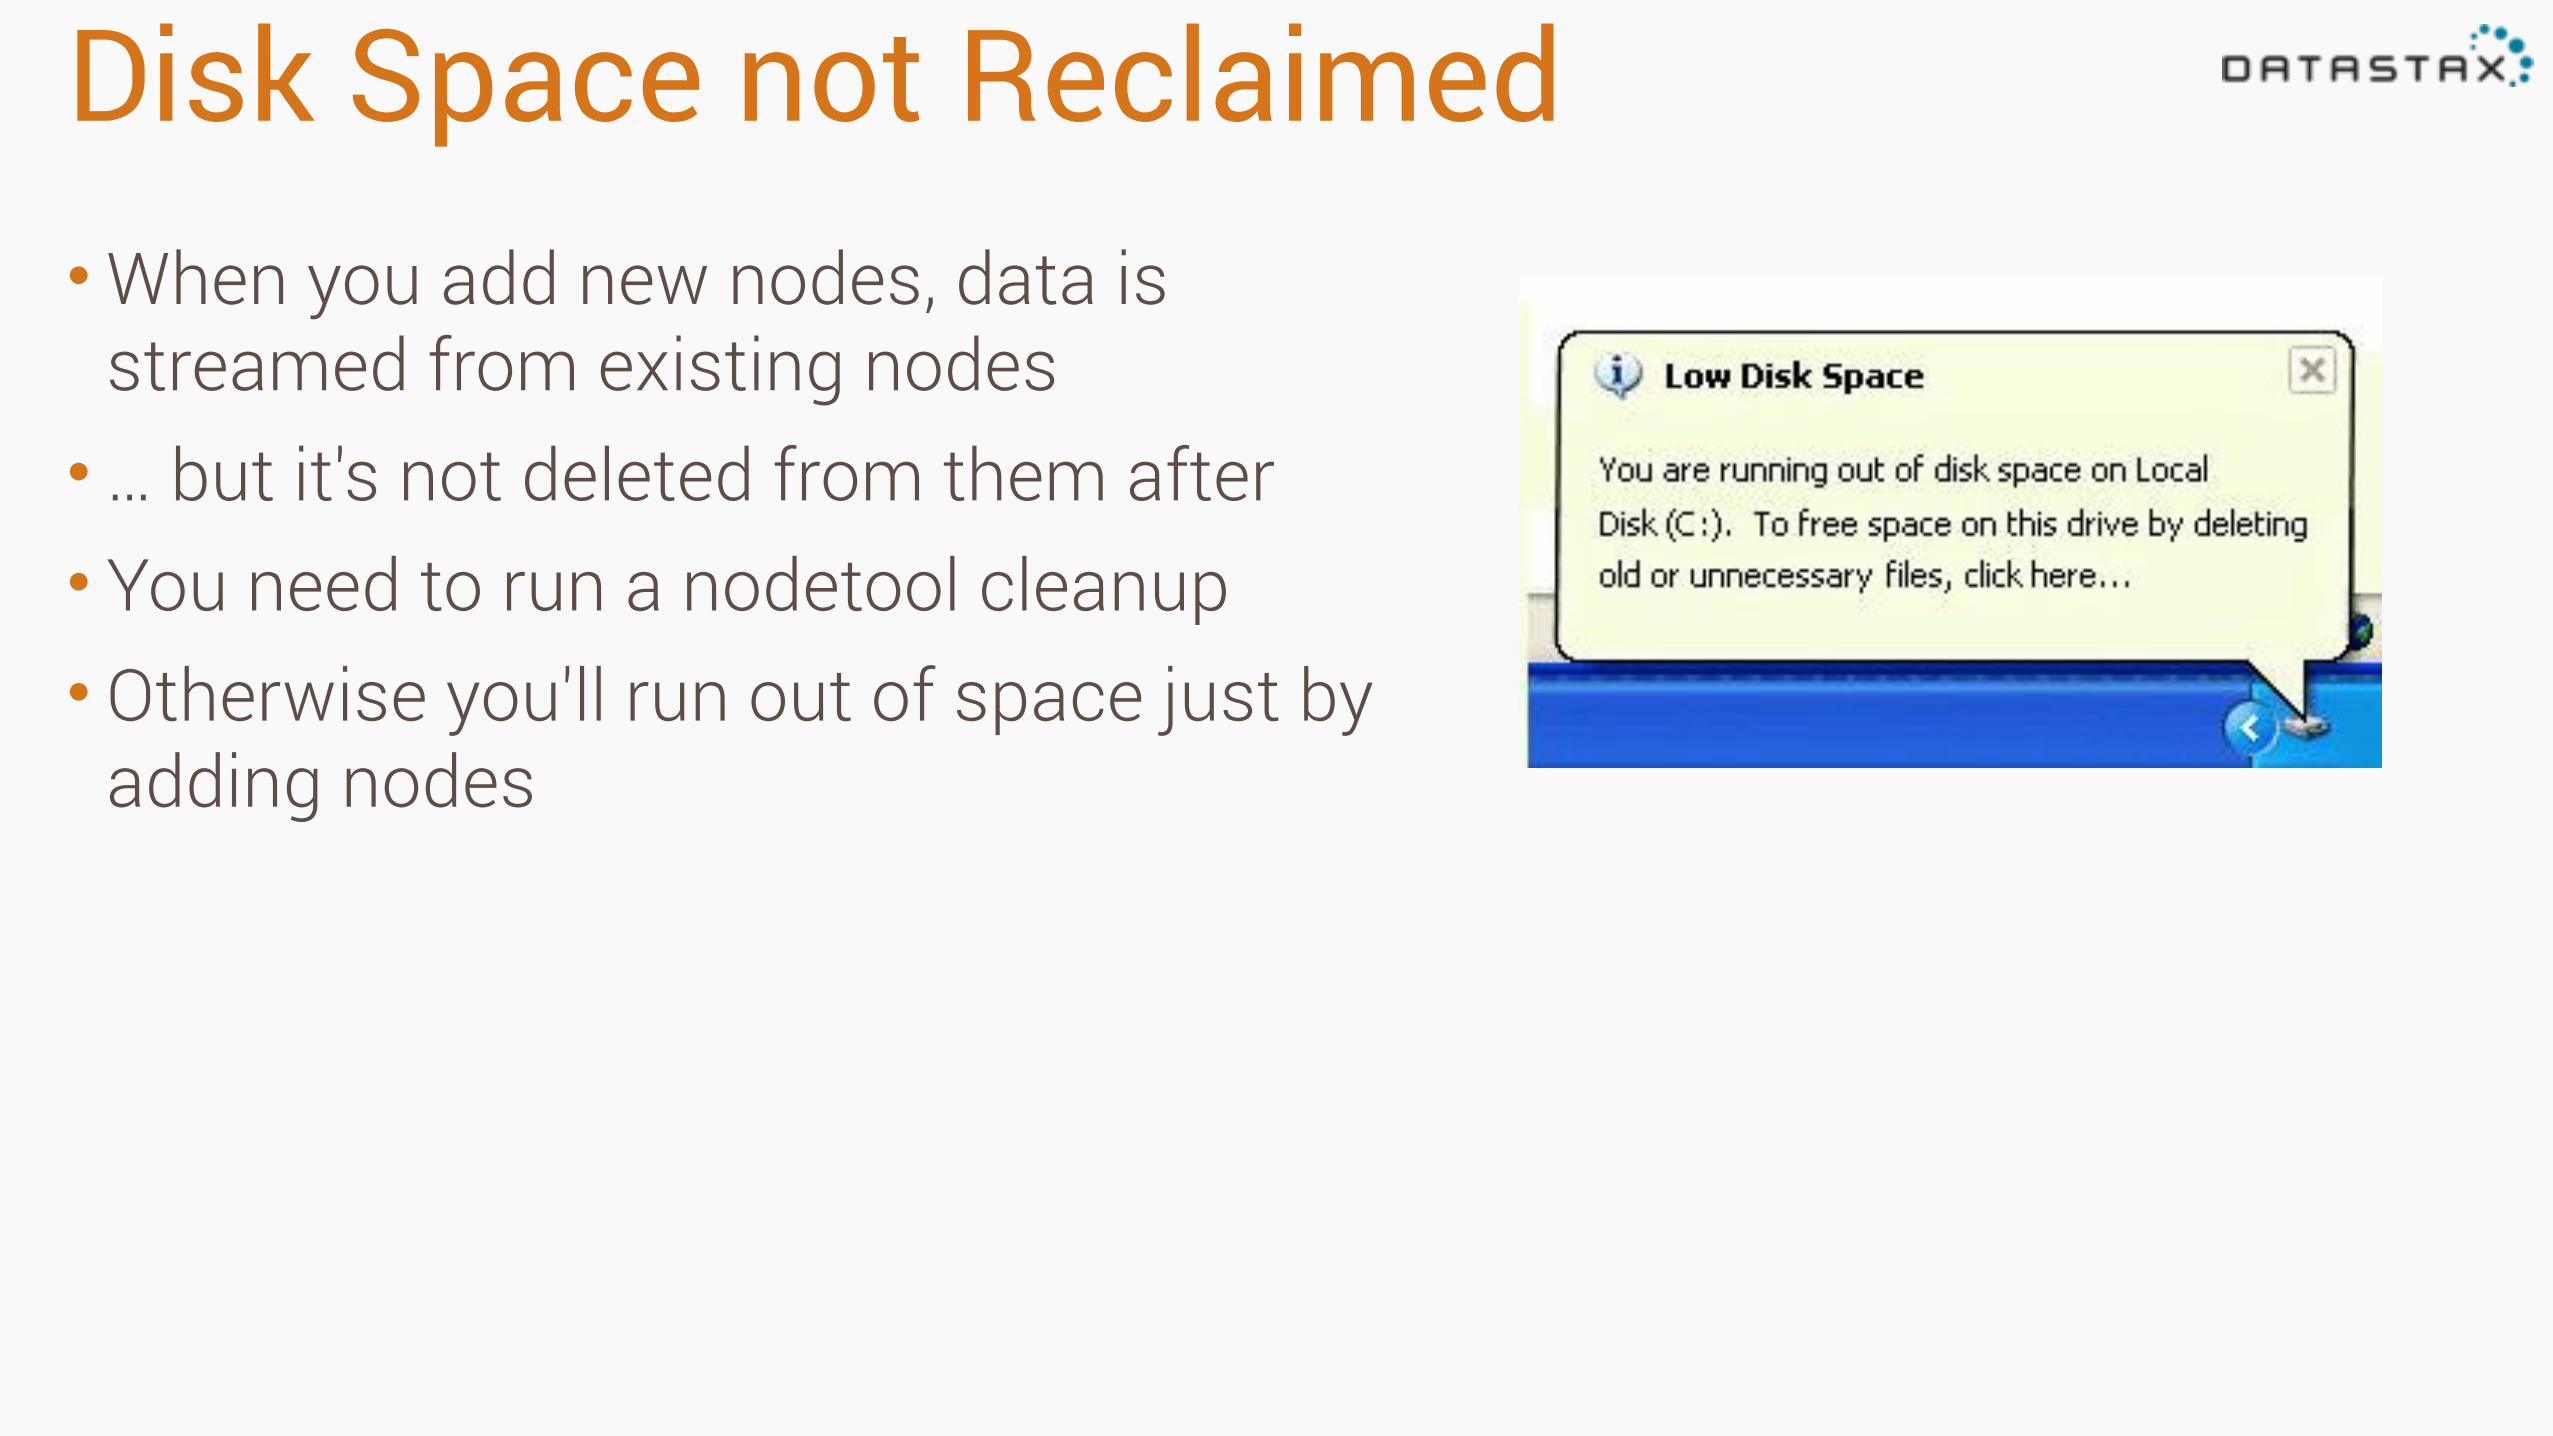
Disk Space not Reclaimed•When you add new nodes, data is
streamed from existing nodes • … but it's not deleted from them after • You need to run a nodetool cleanup • Otherwise you'll run out of space just by
adding nodes
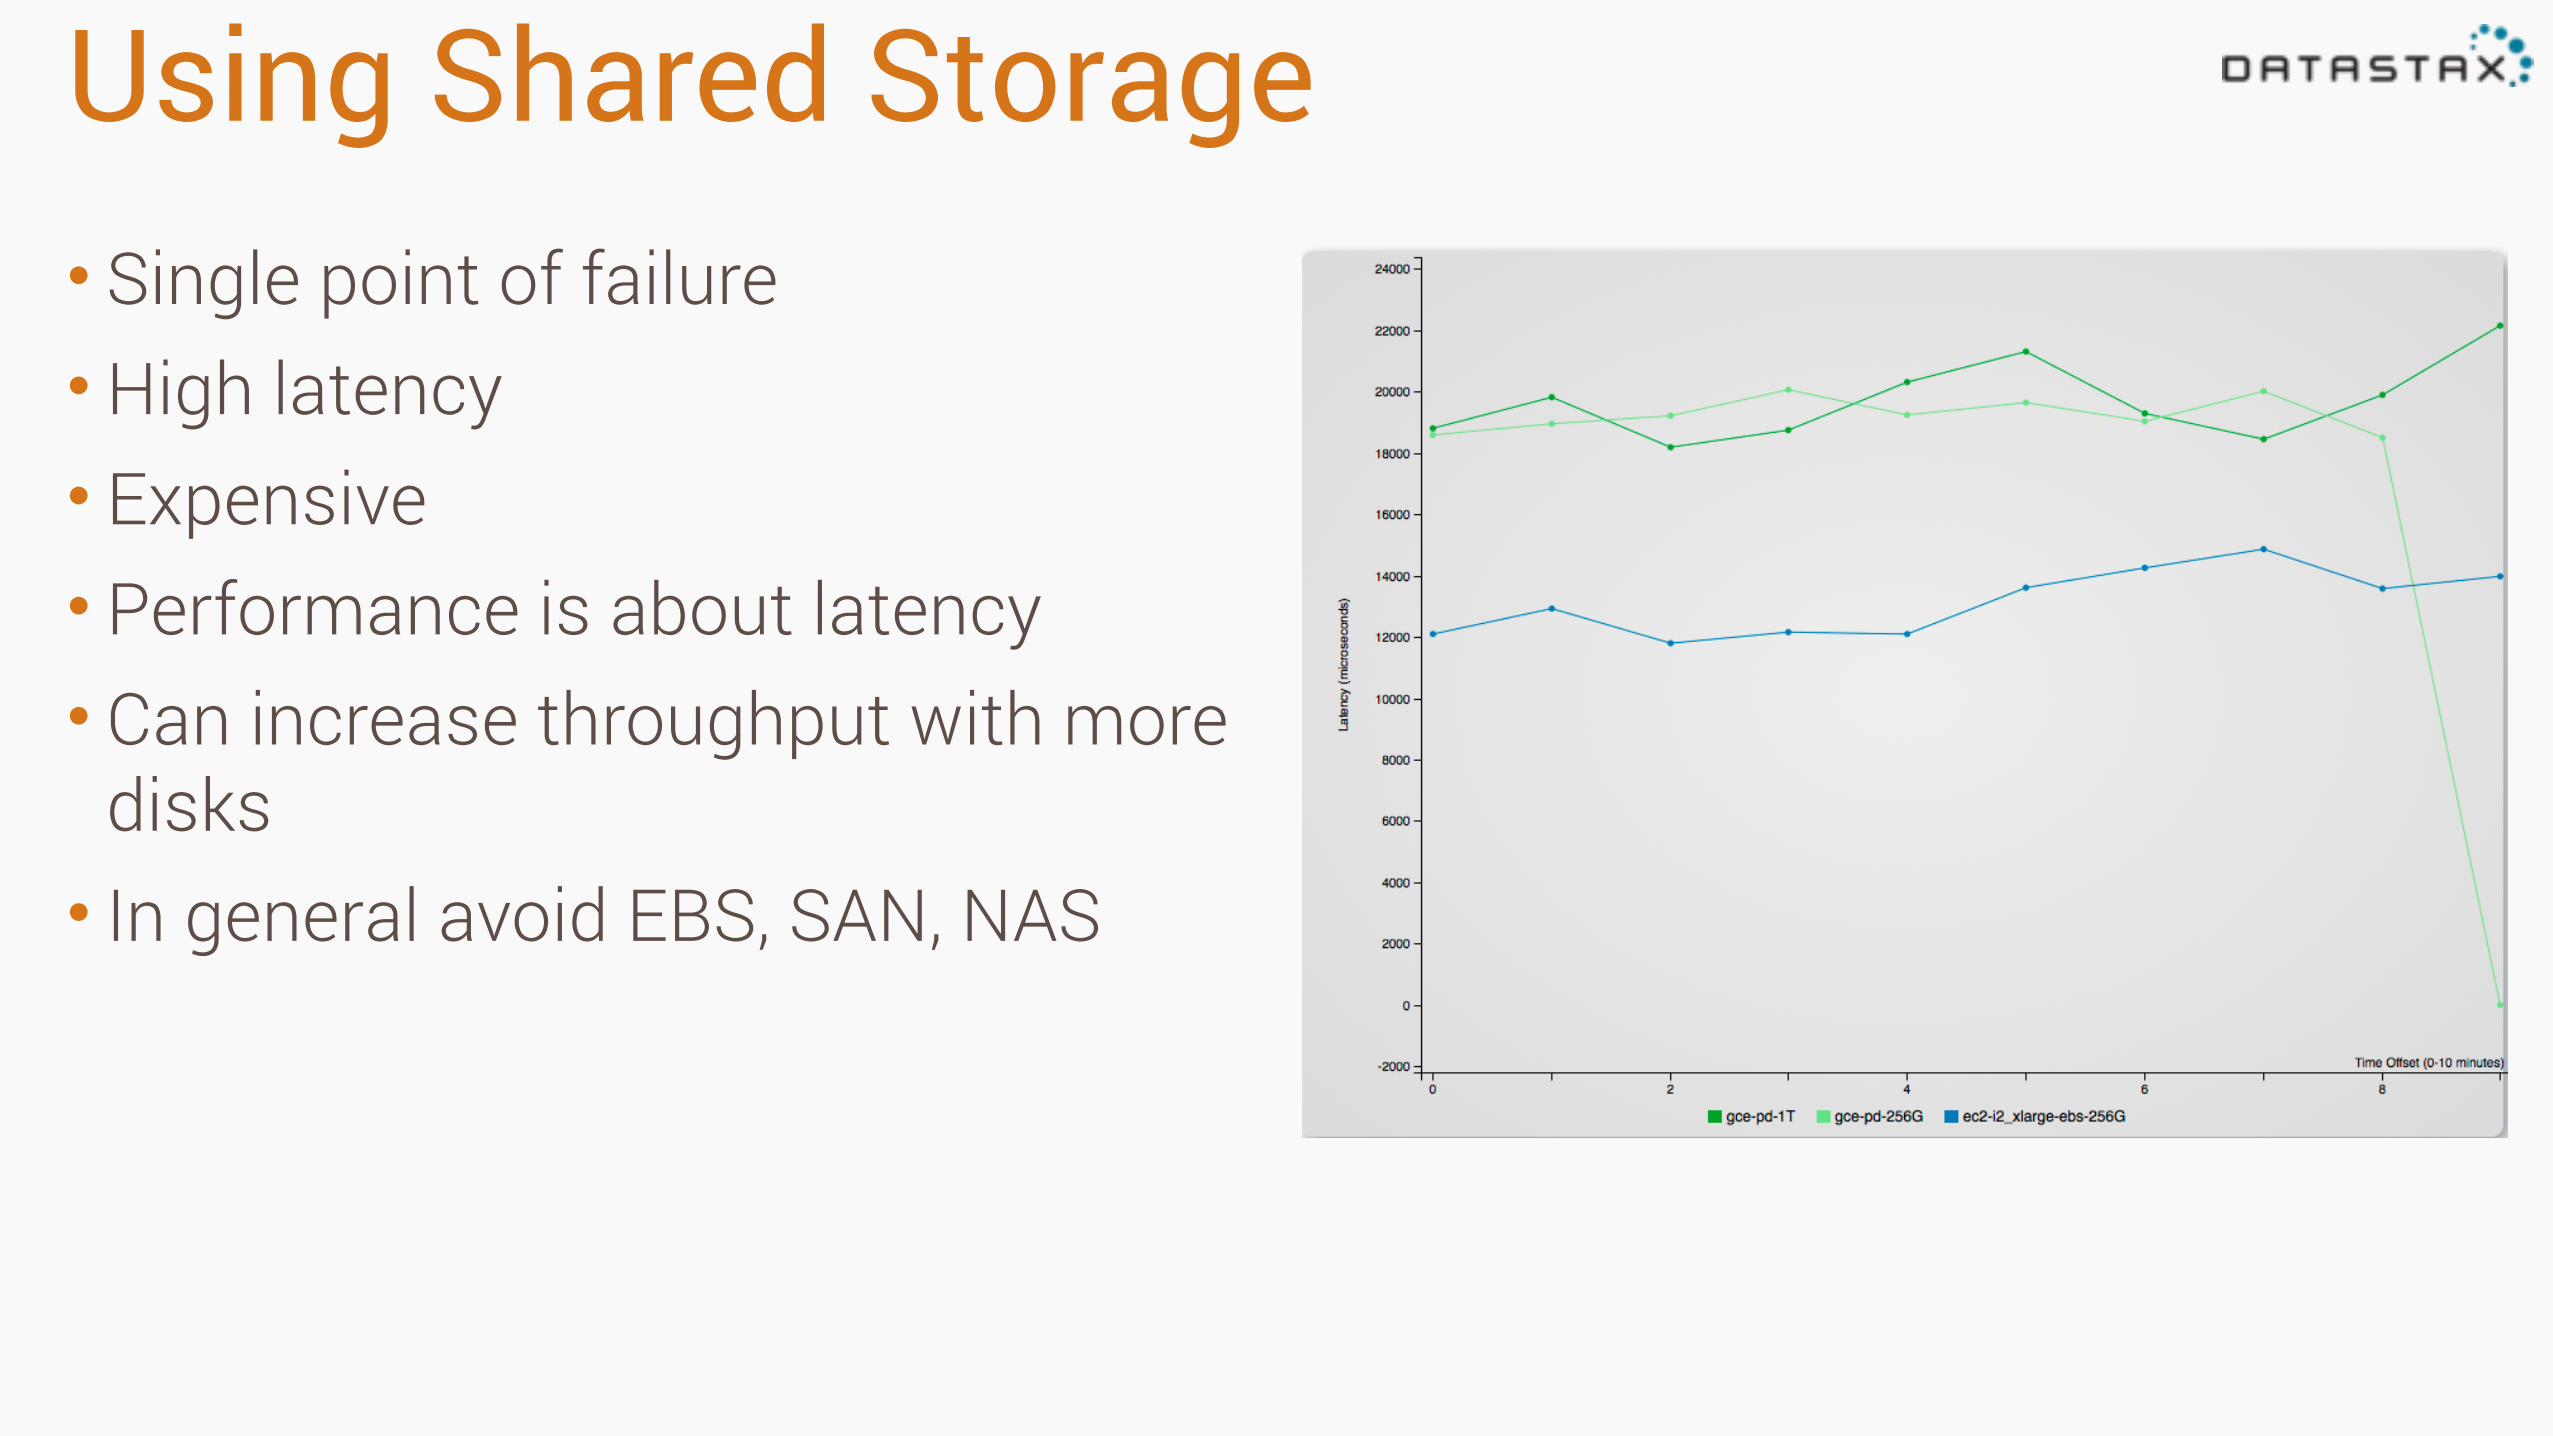
Using Shared Storage• Single point of failure •High latency • Expensive • Performance is about latency • Can increase throughput with more
disks • In general avoid EBS, SAN, NAS
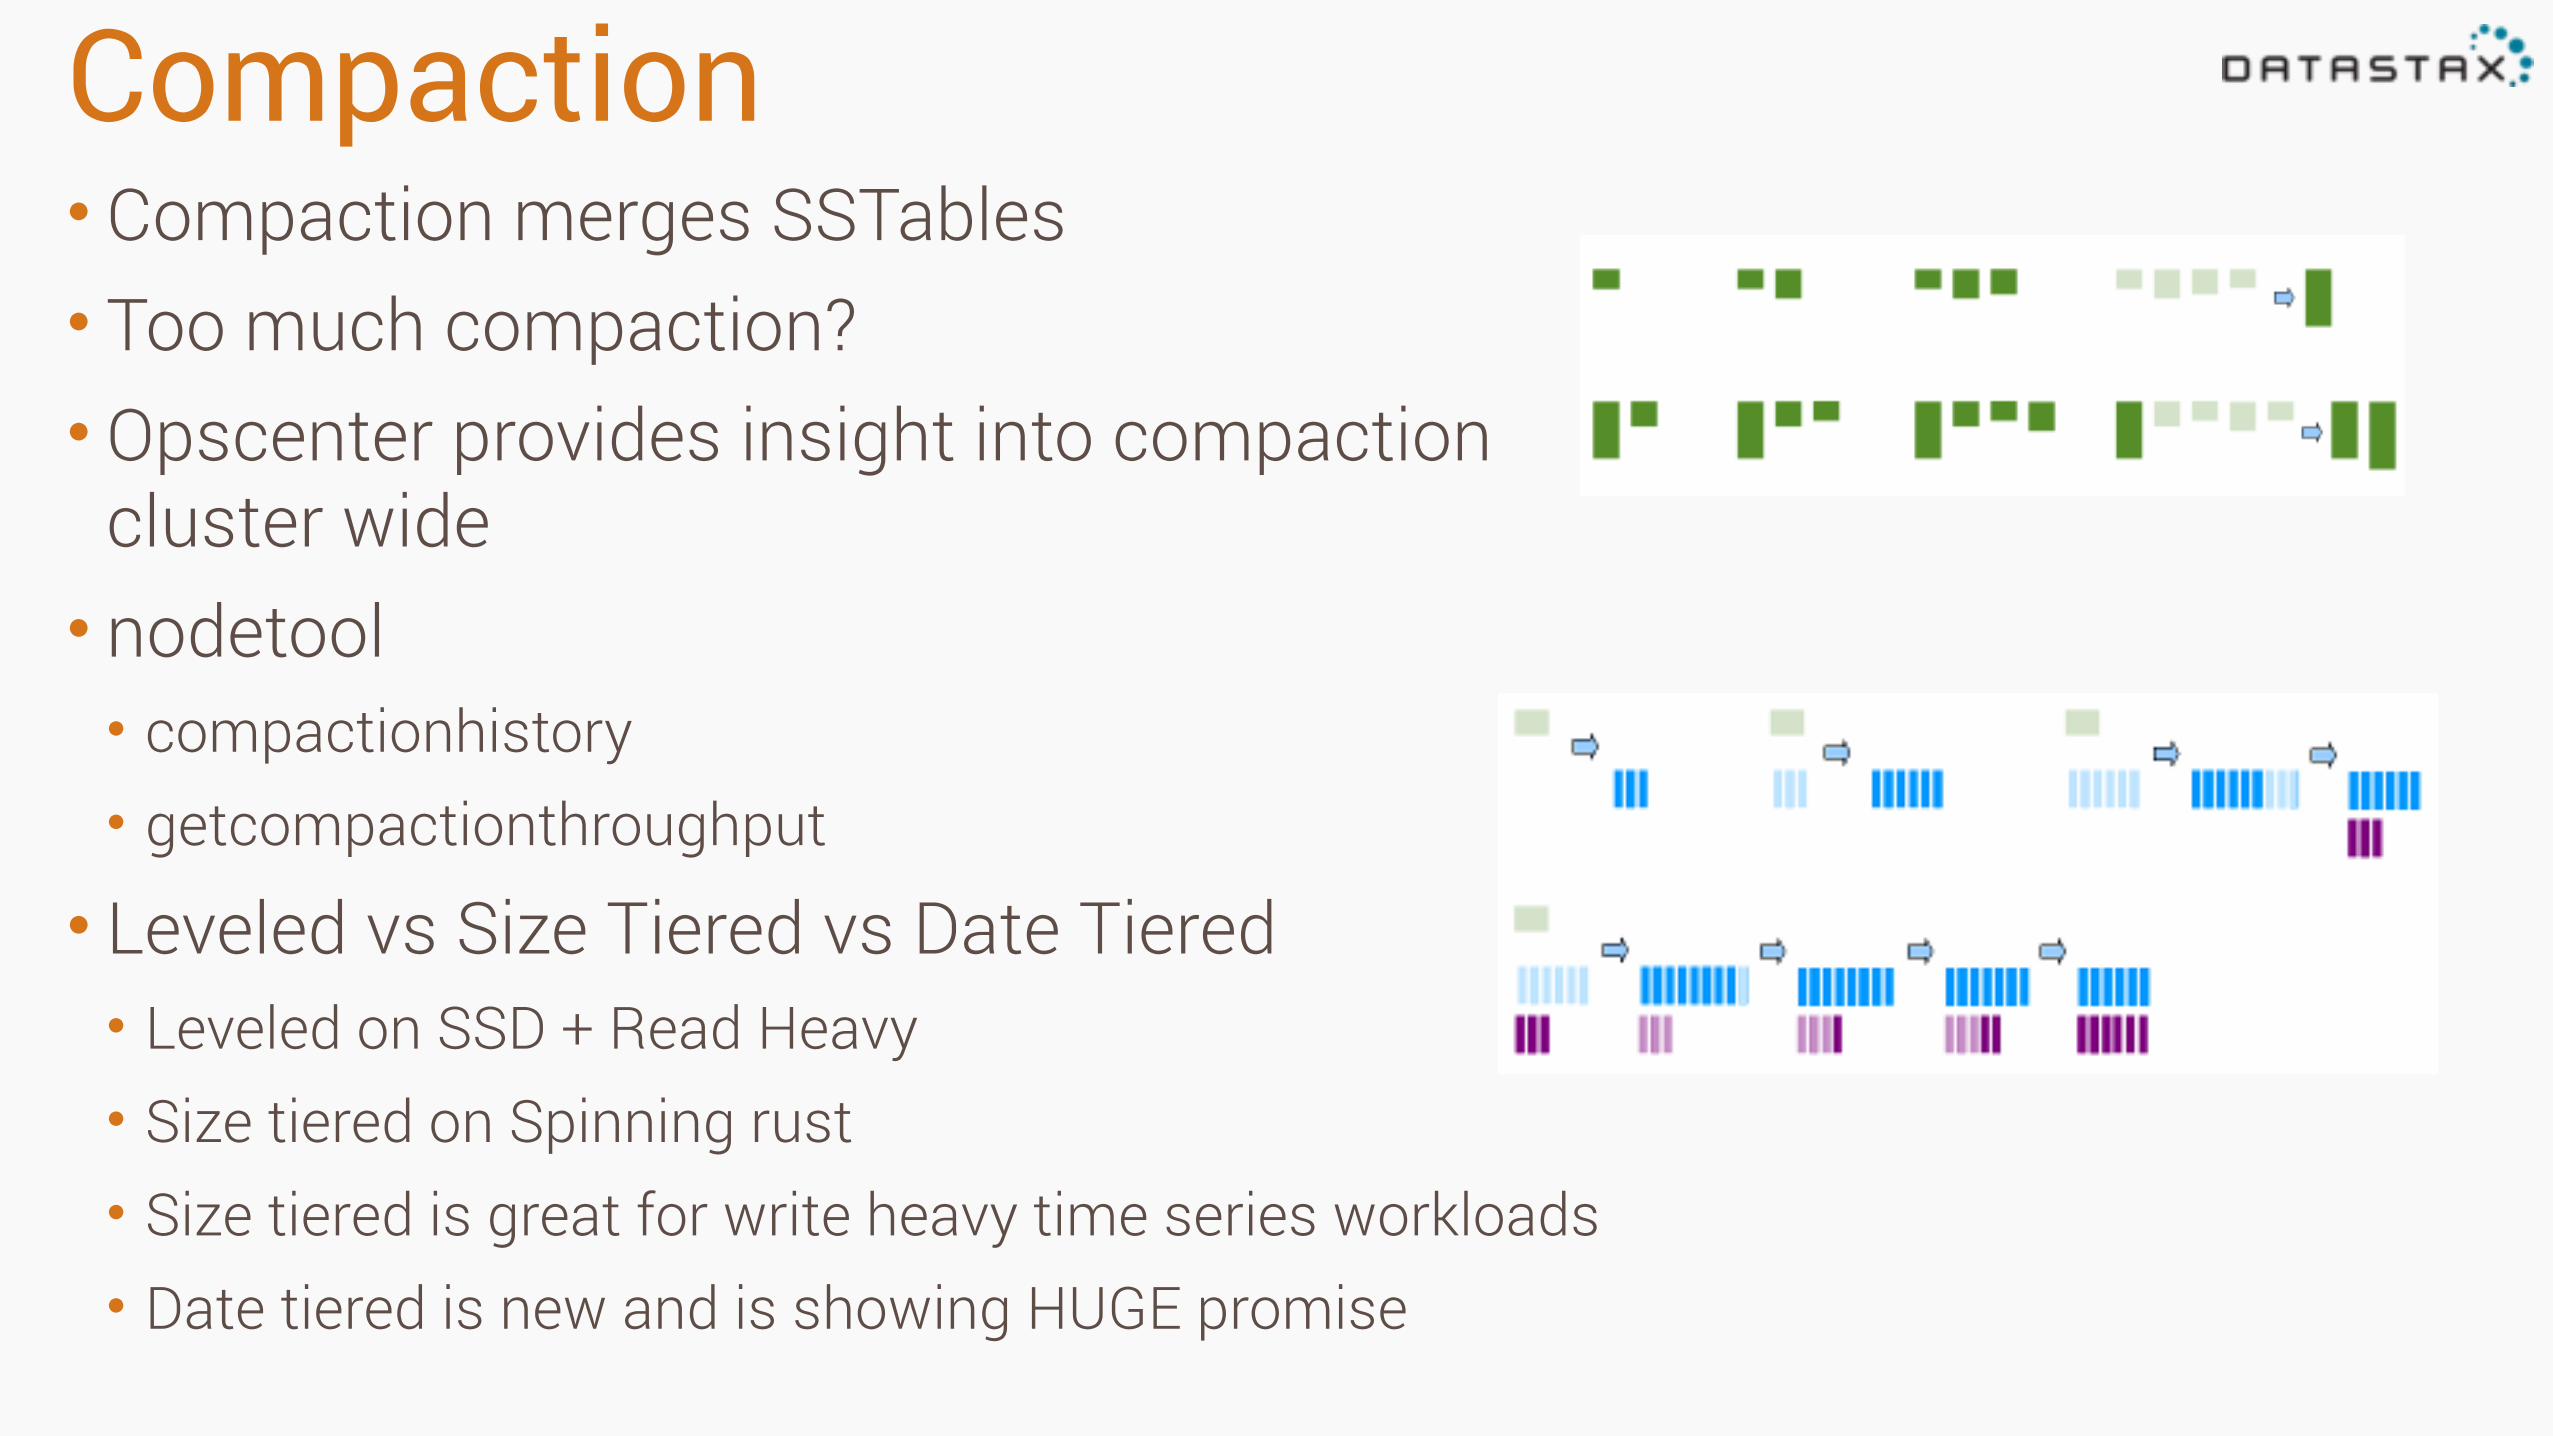
Compaction• Compaction merges SSTables • Too much compaction? • Opscenter provides insight into compaction
cluster wide • nodetool • compactionhistory • getcompactionthroughput
• Leveled vs Size Tiered vs Date Tiered • Leveled on SSD + Read Heavy • Size tiered on Spinning rust • Size tiered is great for write heavy time series workloads • Date tiered is new and is showing HUGE promise
Diagnostic Tools
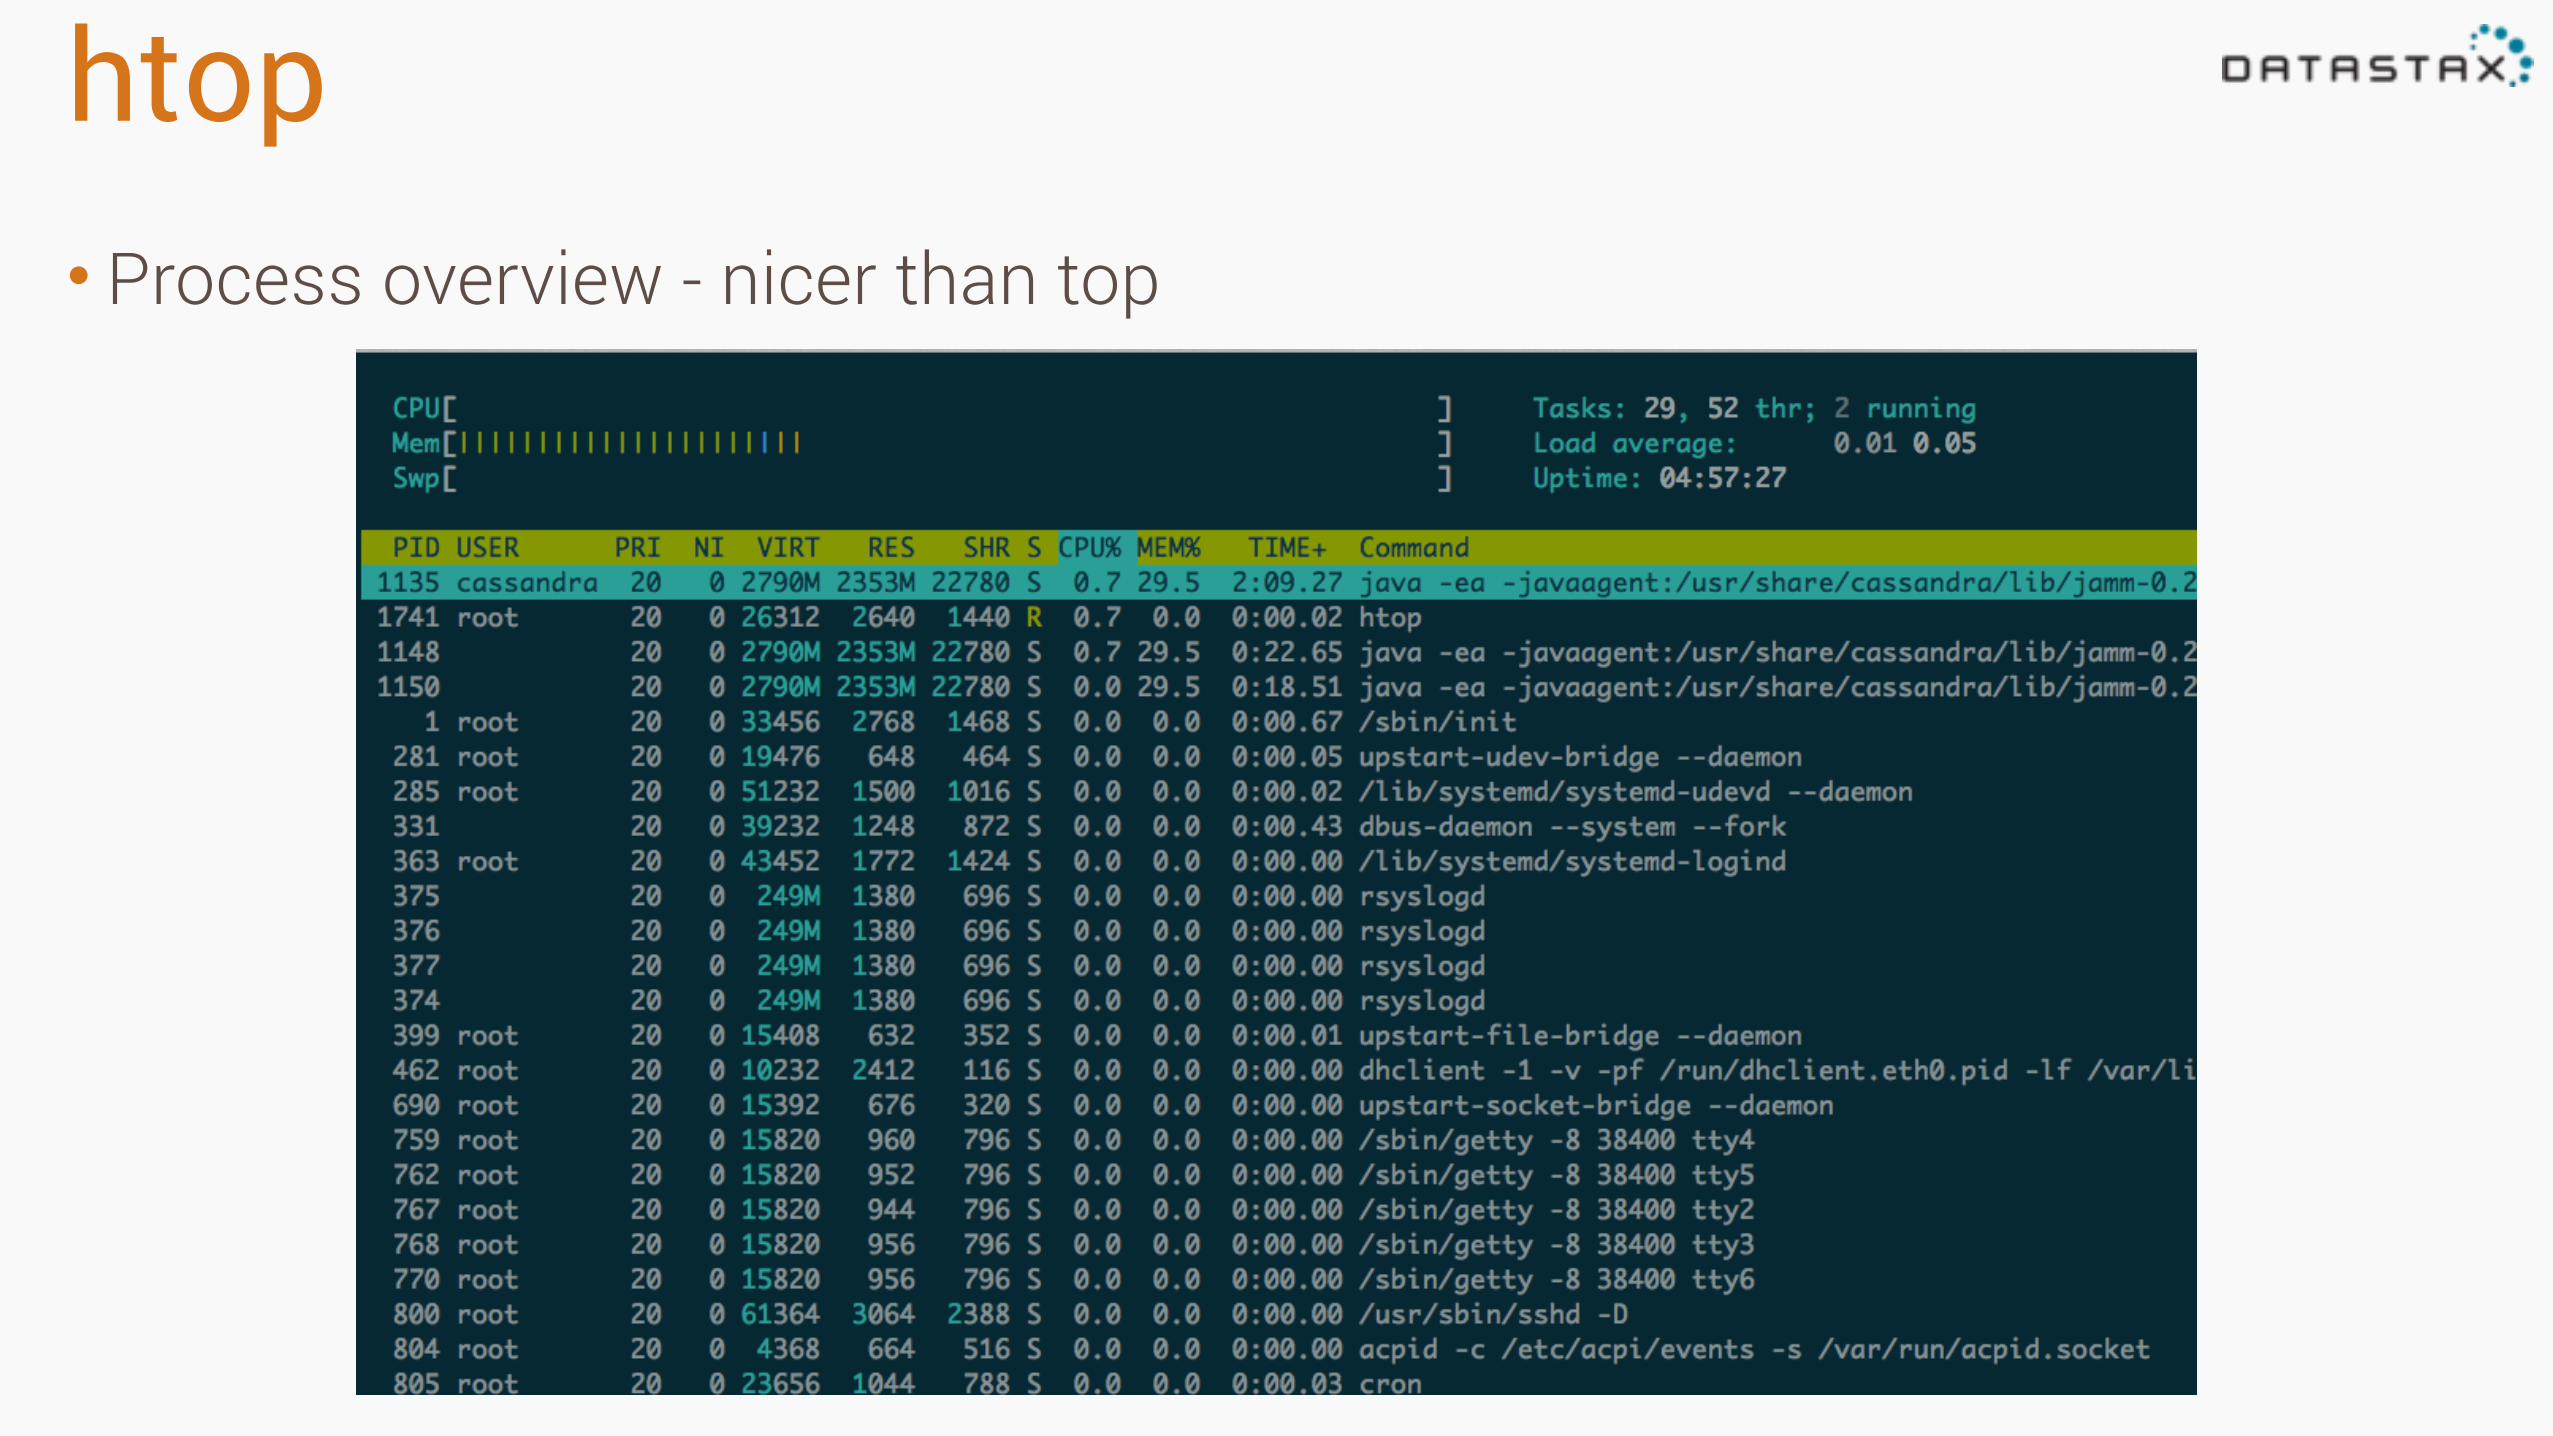
htop• Process overview - nicer than top
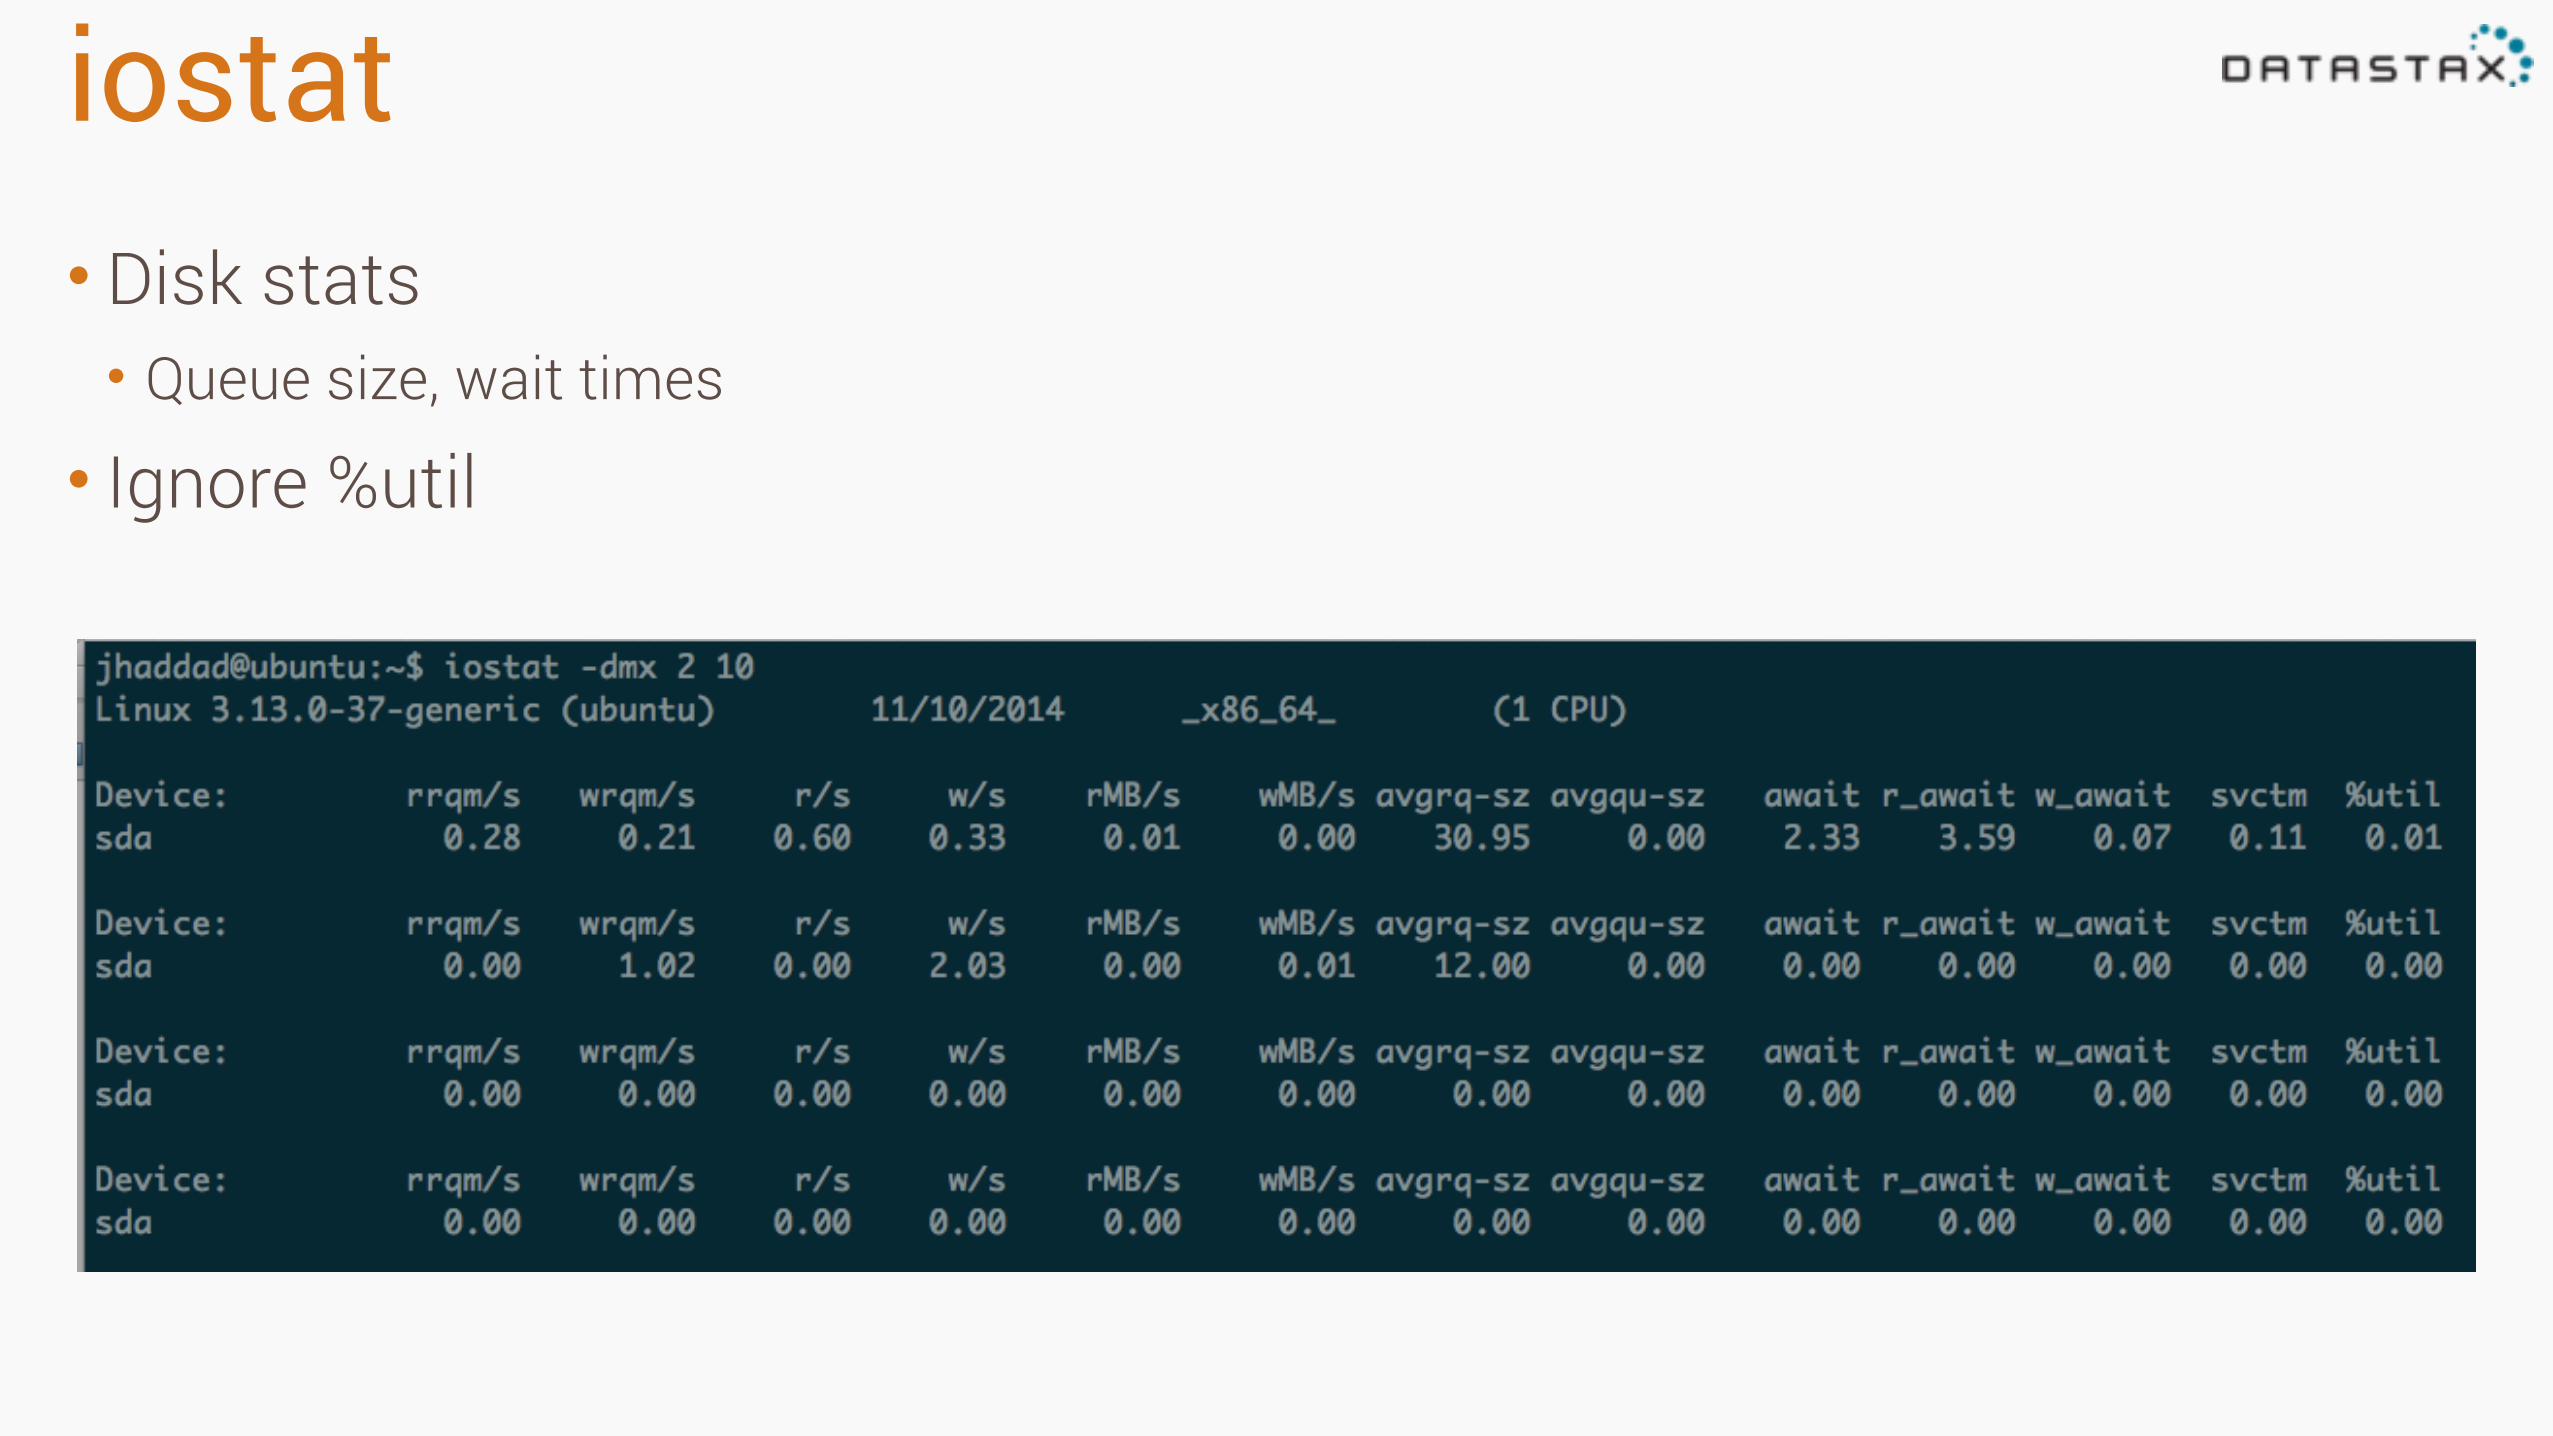
iostat• Disk stats • Queue size, wait times
• Ignore %util
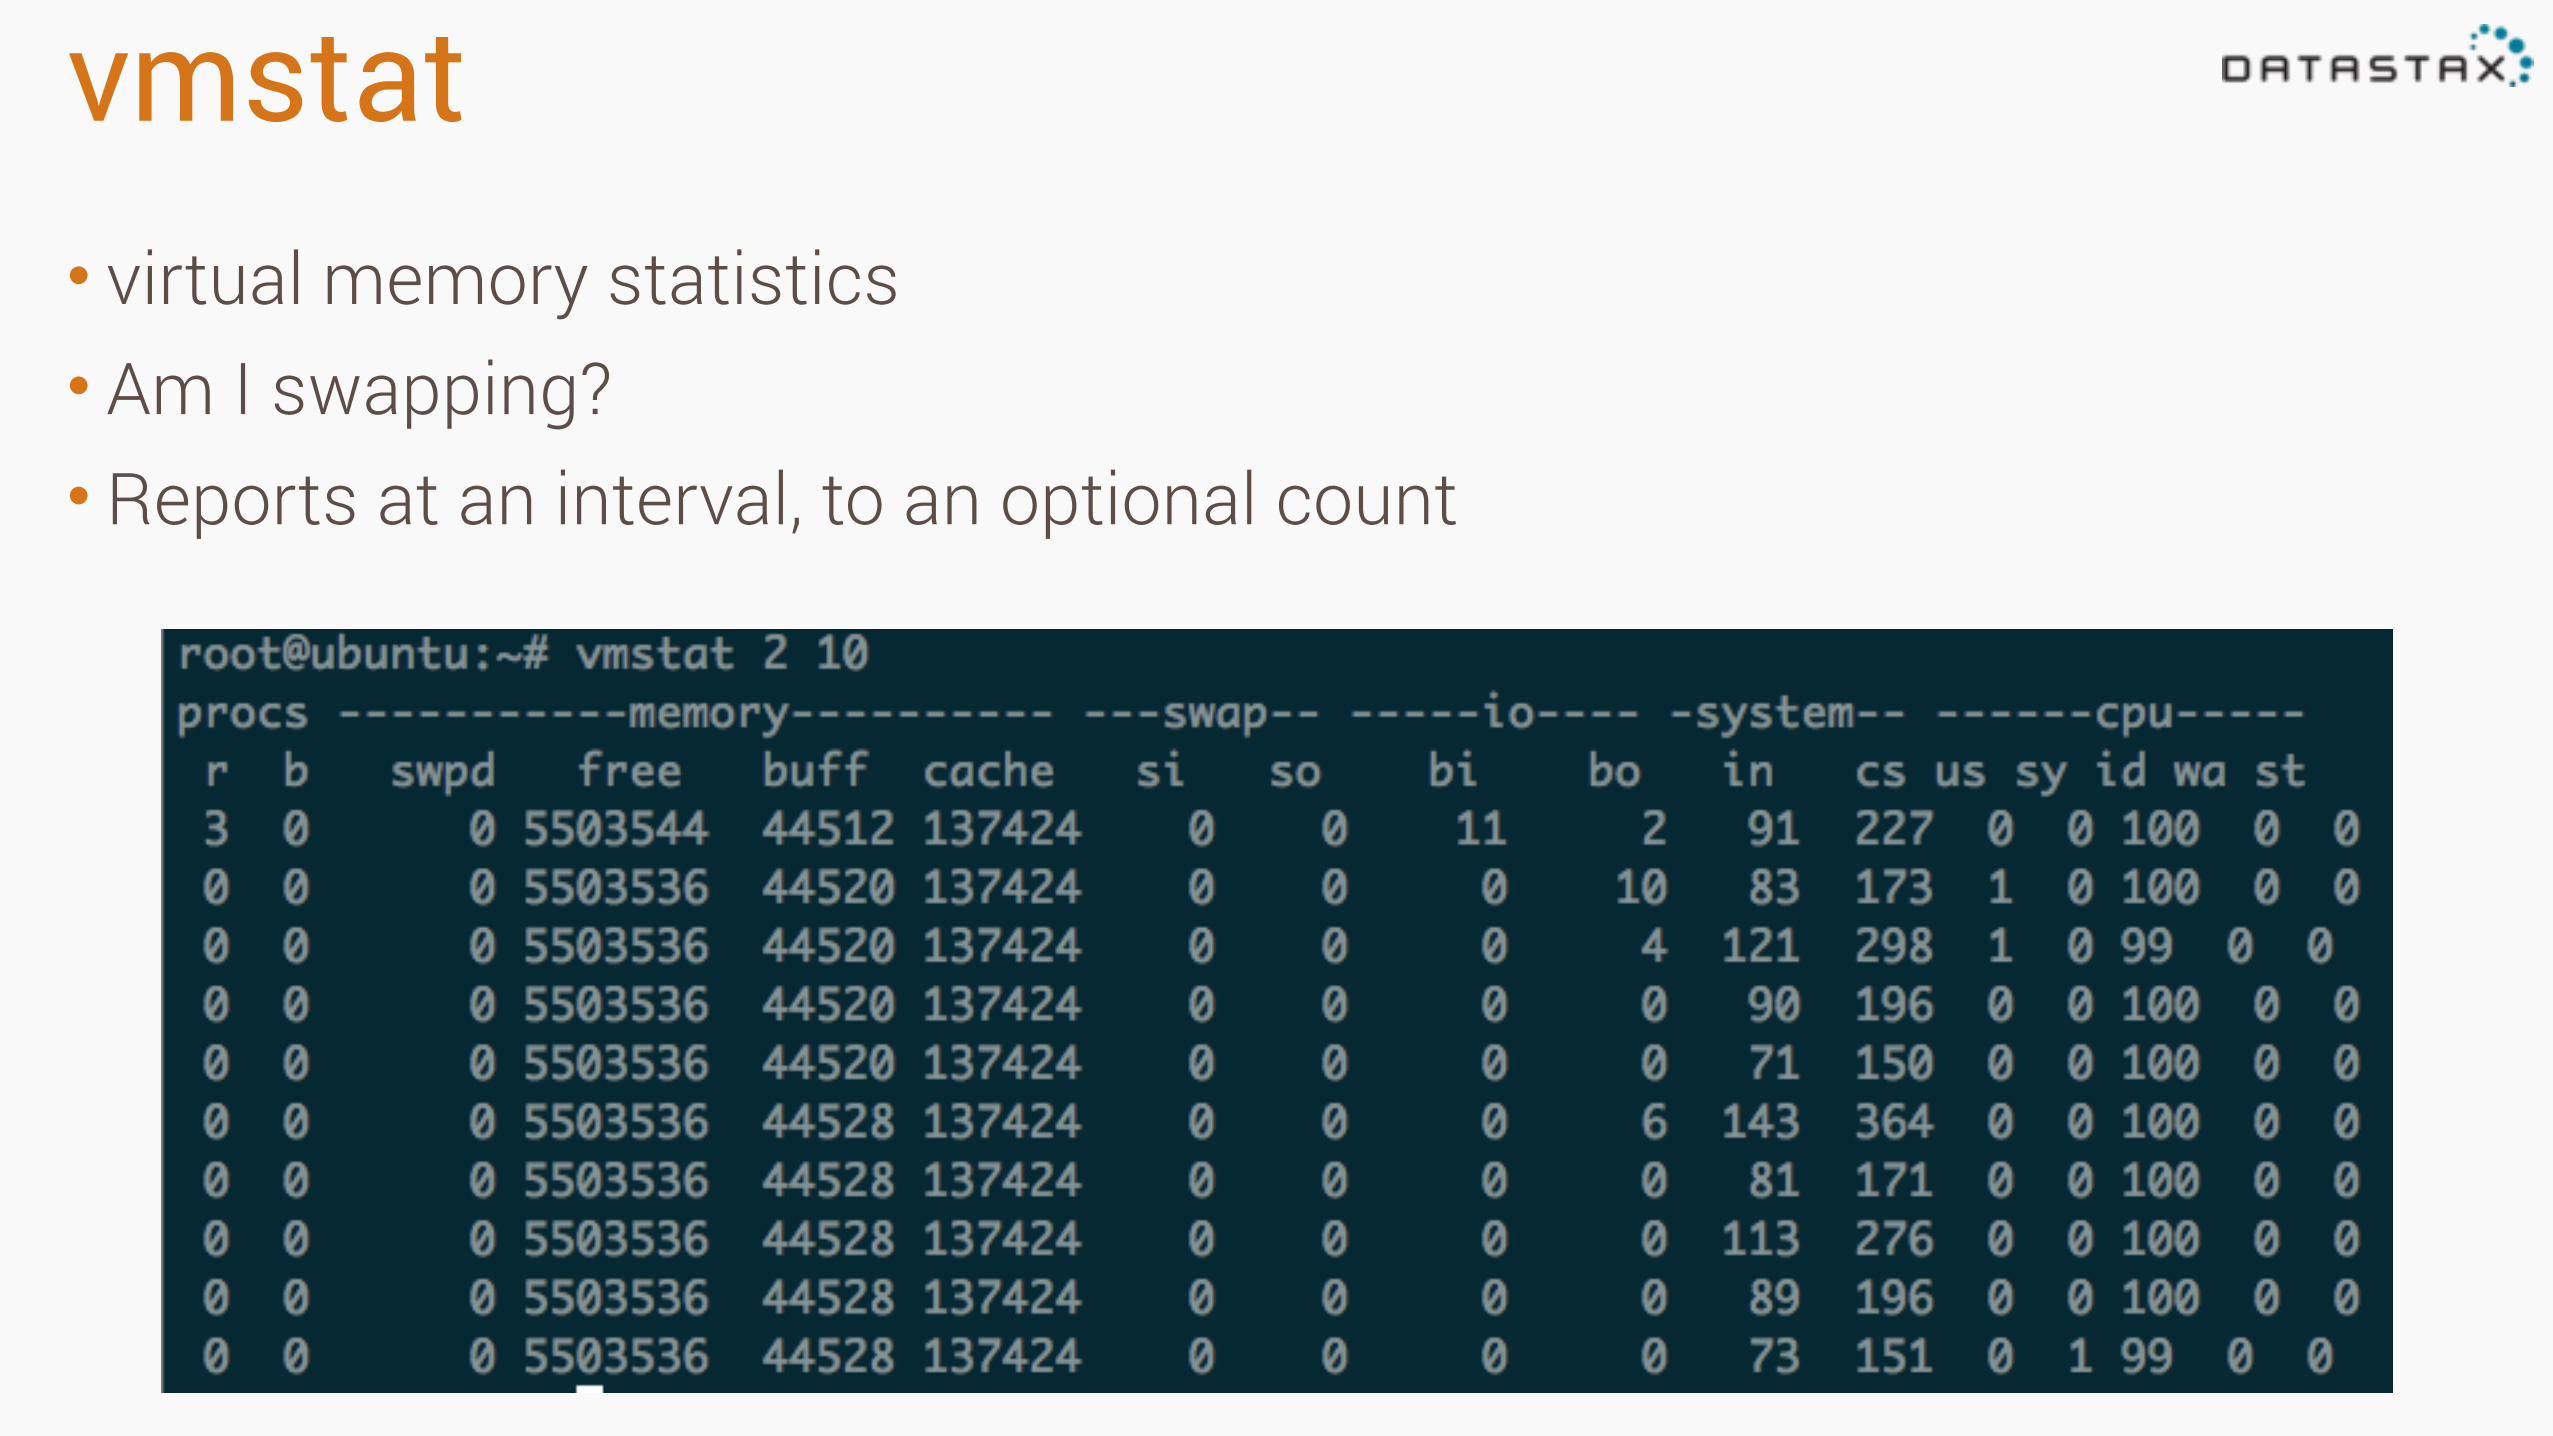
vmstat• virtual memory statistics • Am I swapping? • Reports at an interval, to an optional count
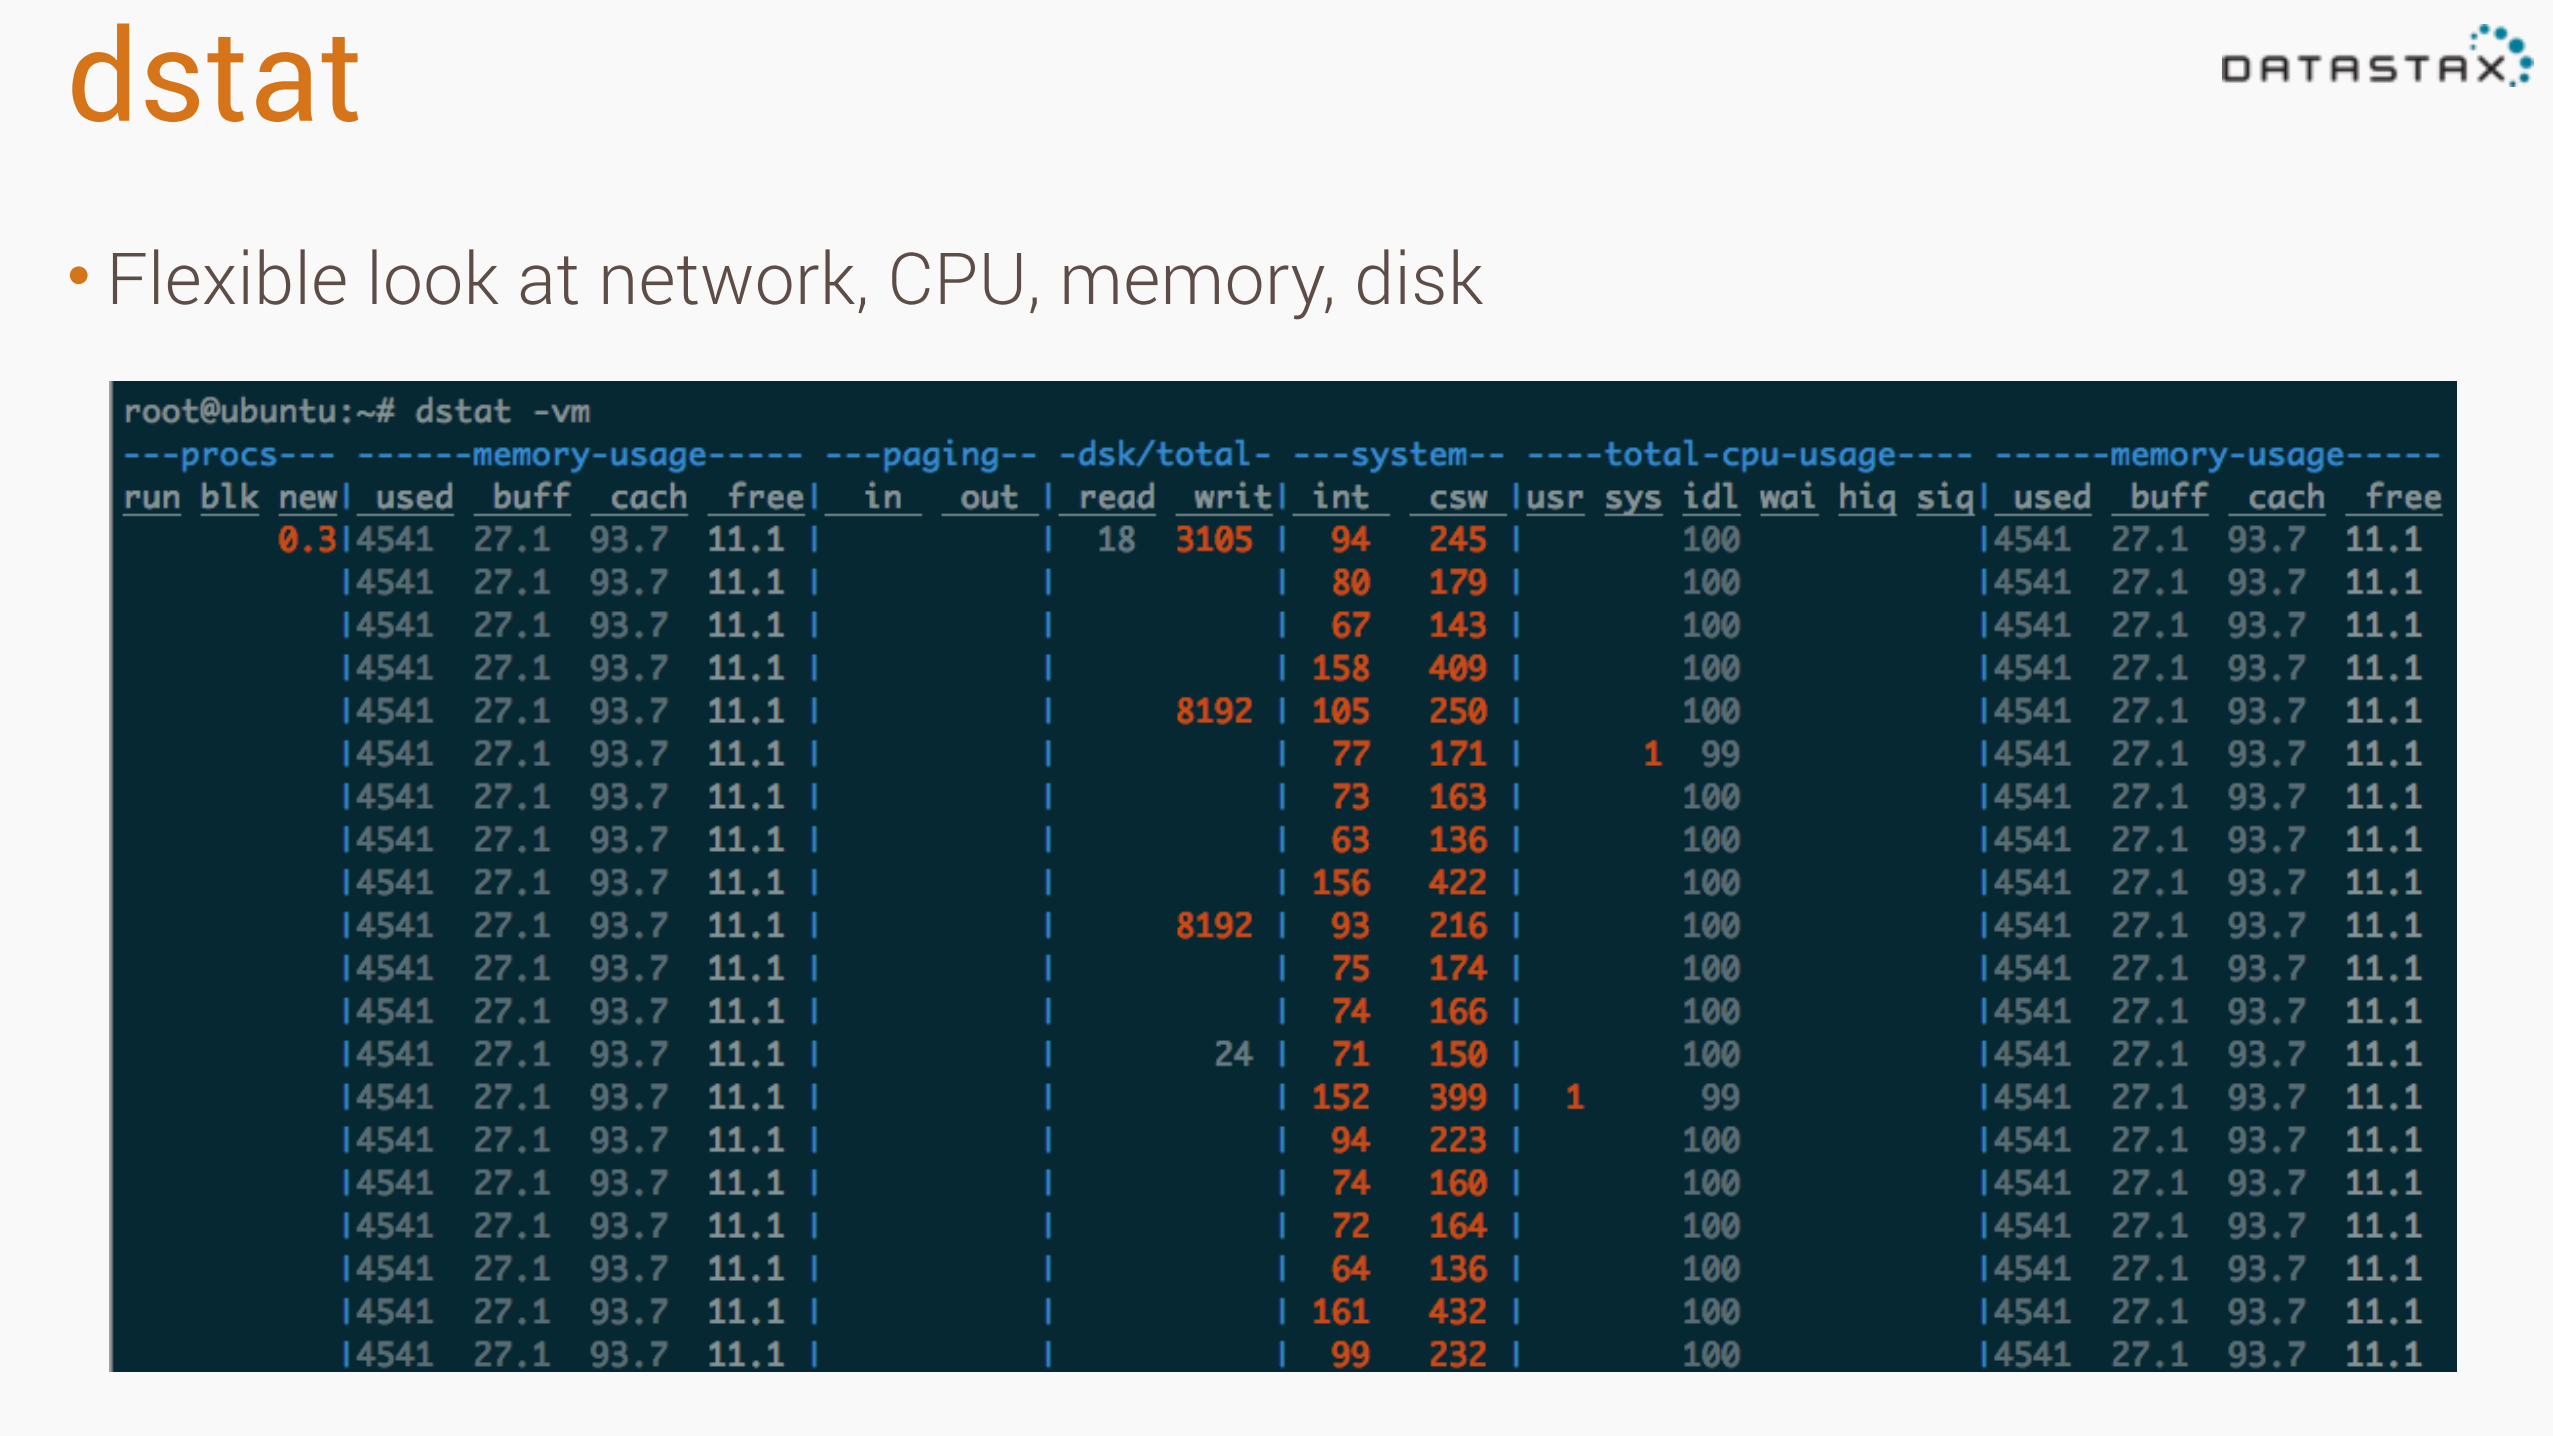
dstat• Flexible look at network, CPU, memory, disk
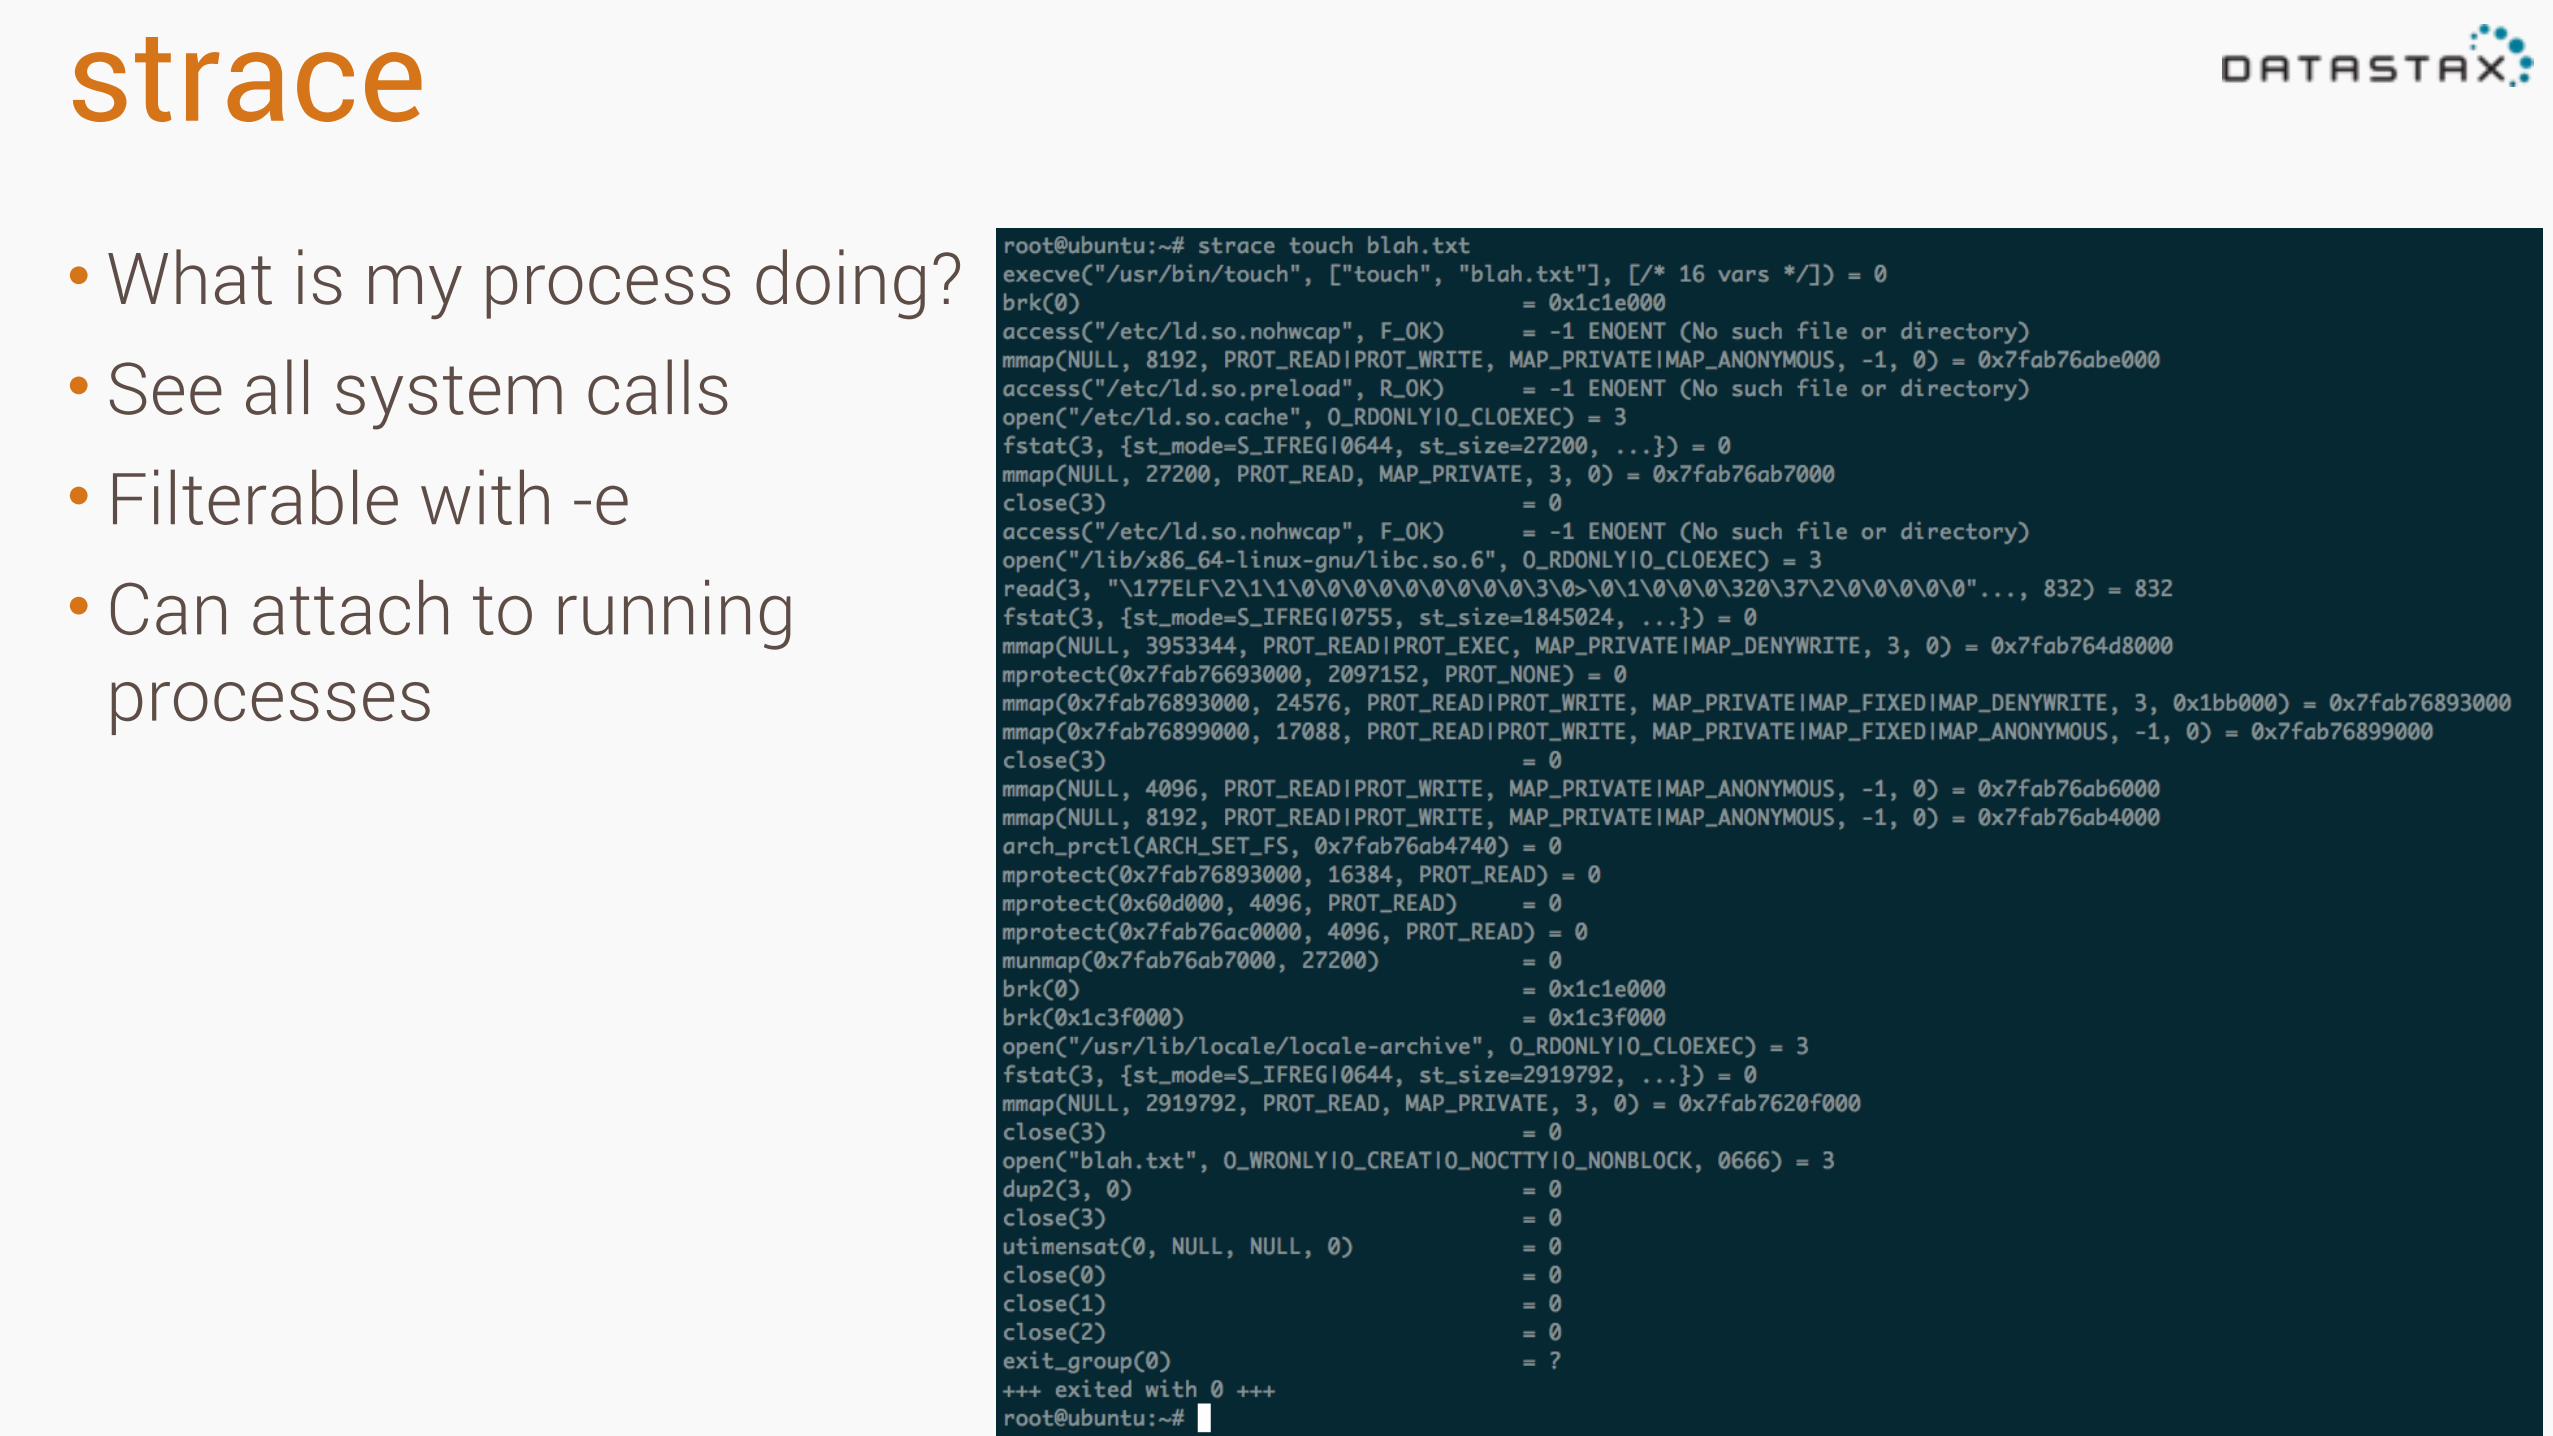
strace•What is my process doing? • See all system calls • Filterable with -e • Can attach to running
processes
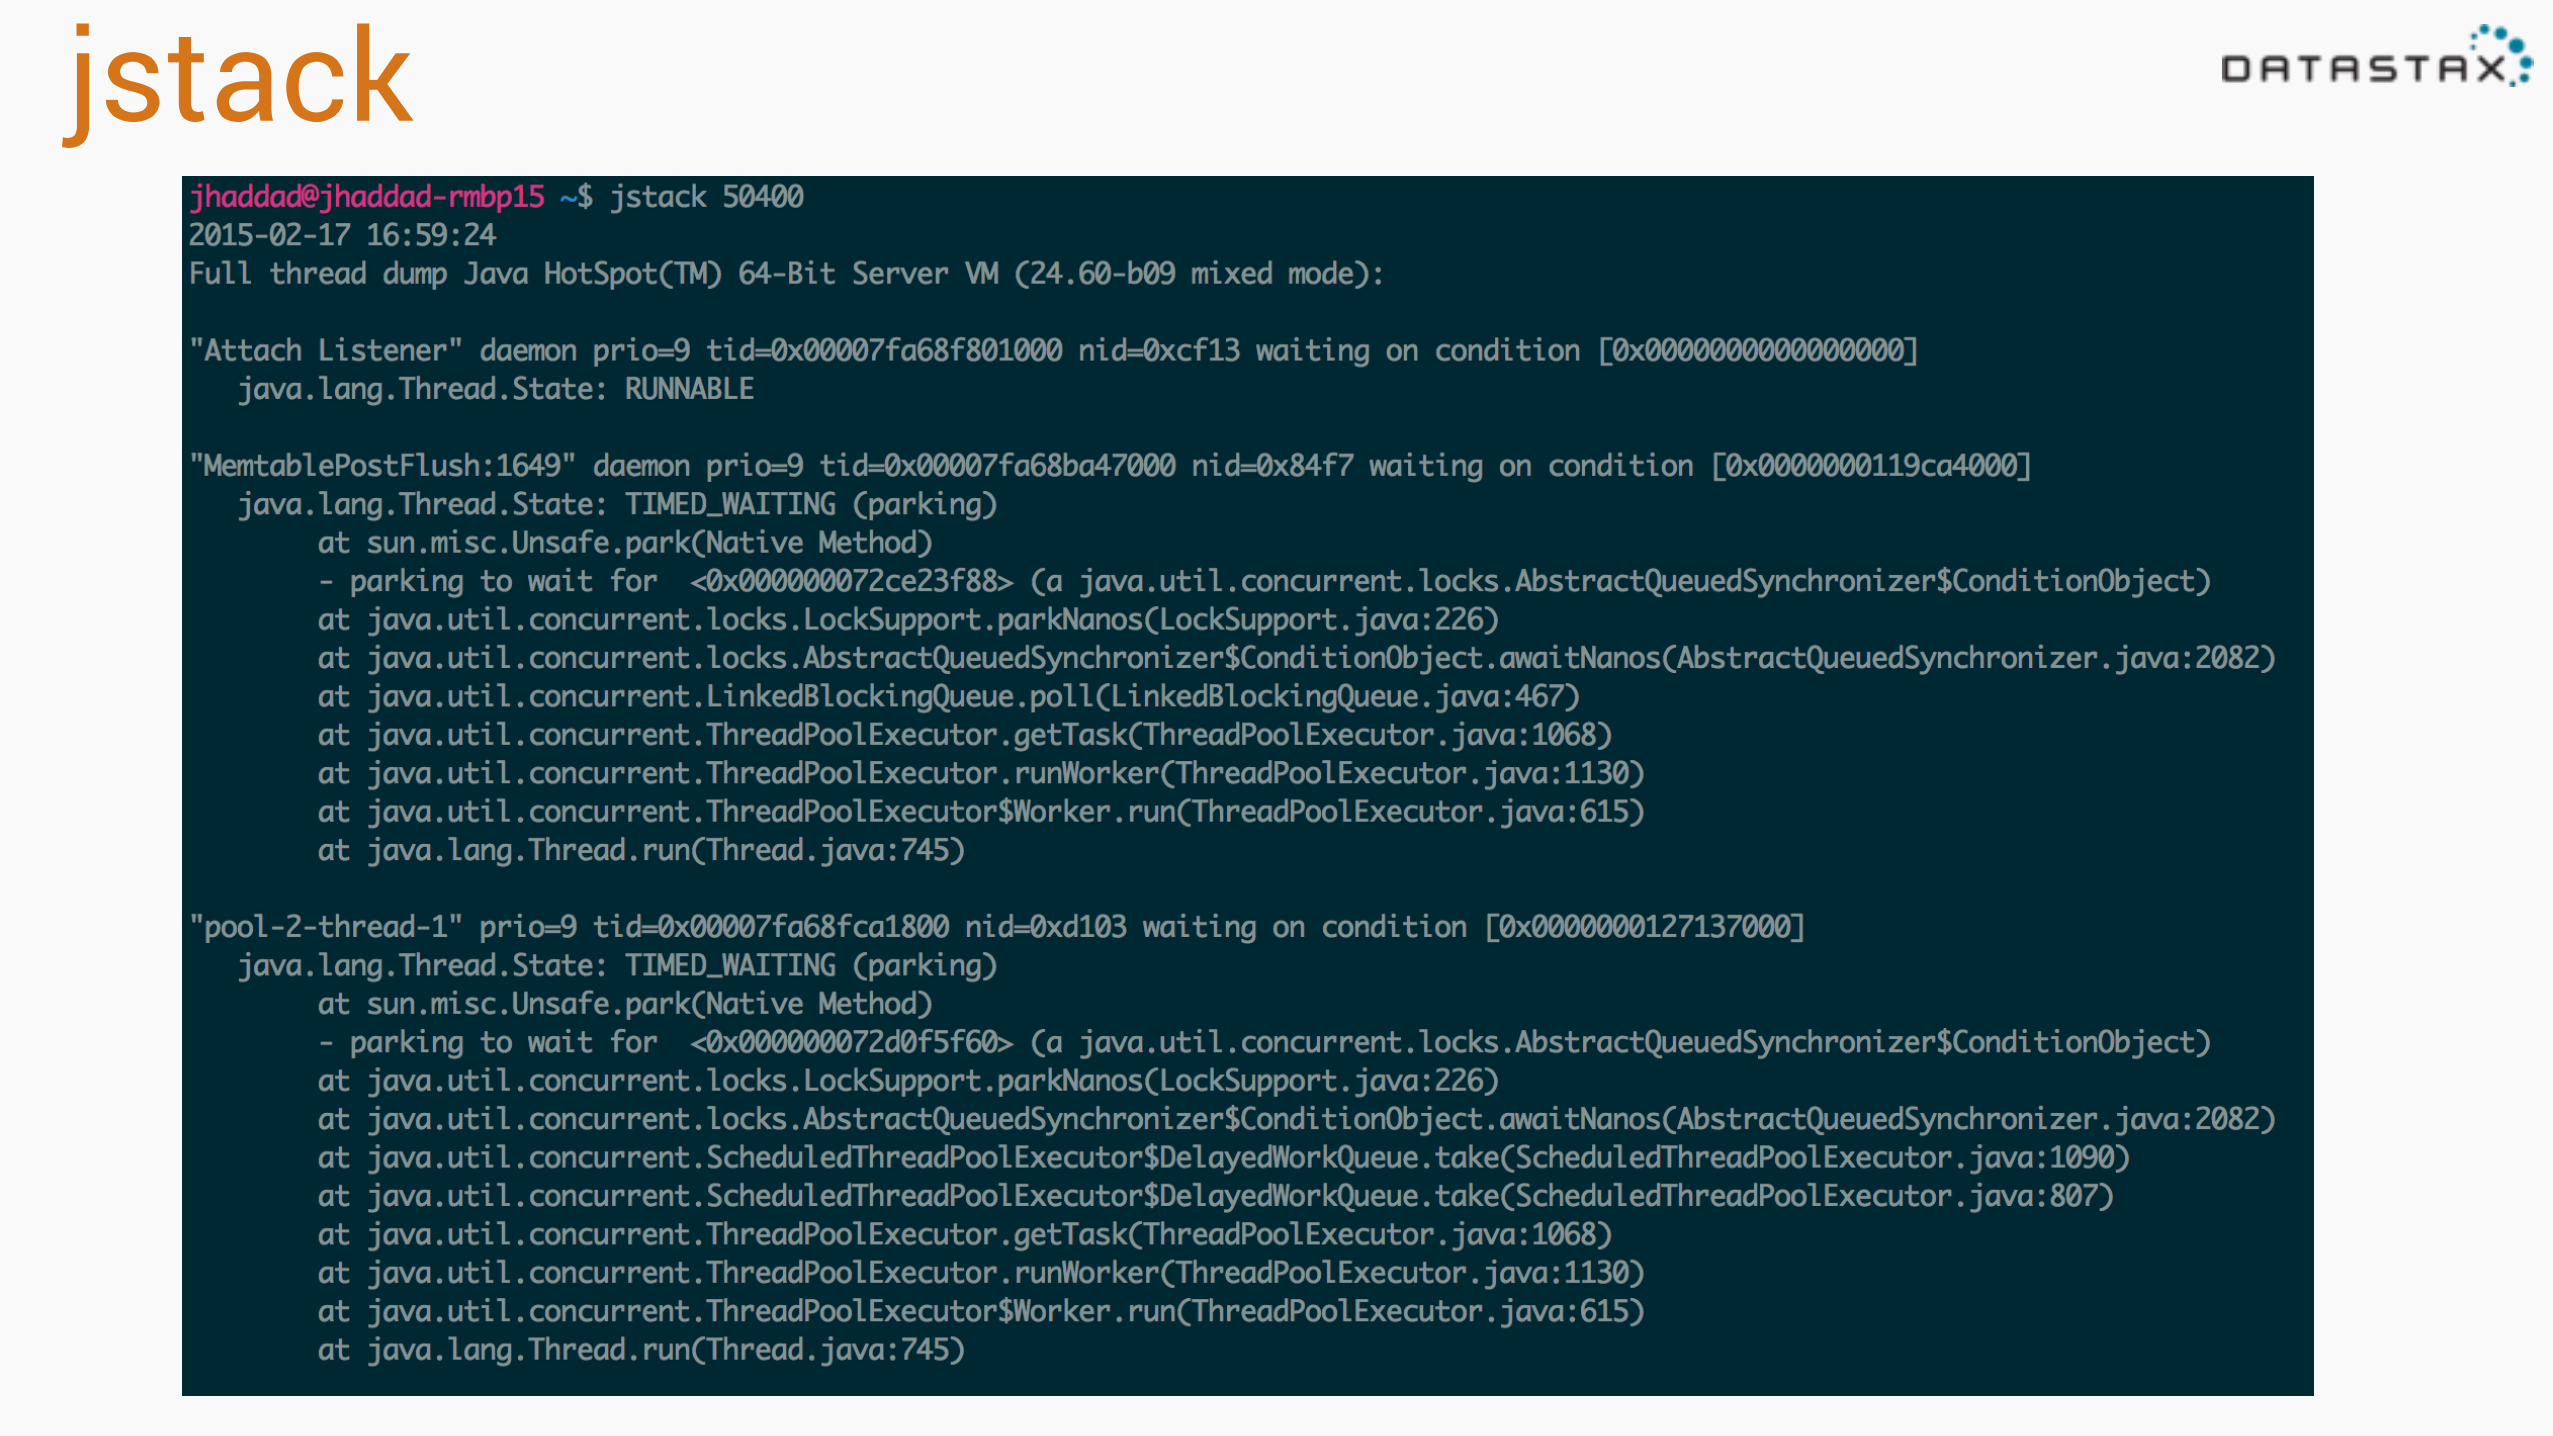
jstack
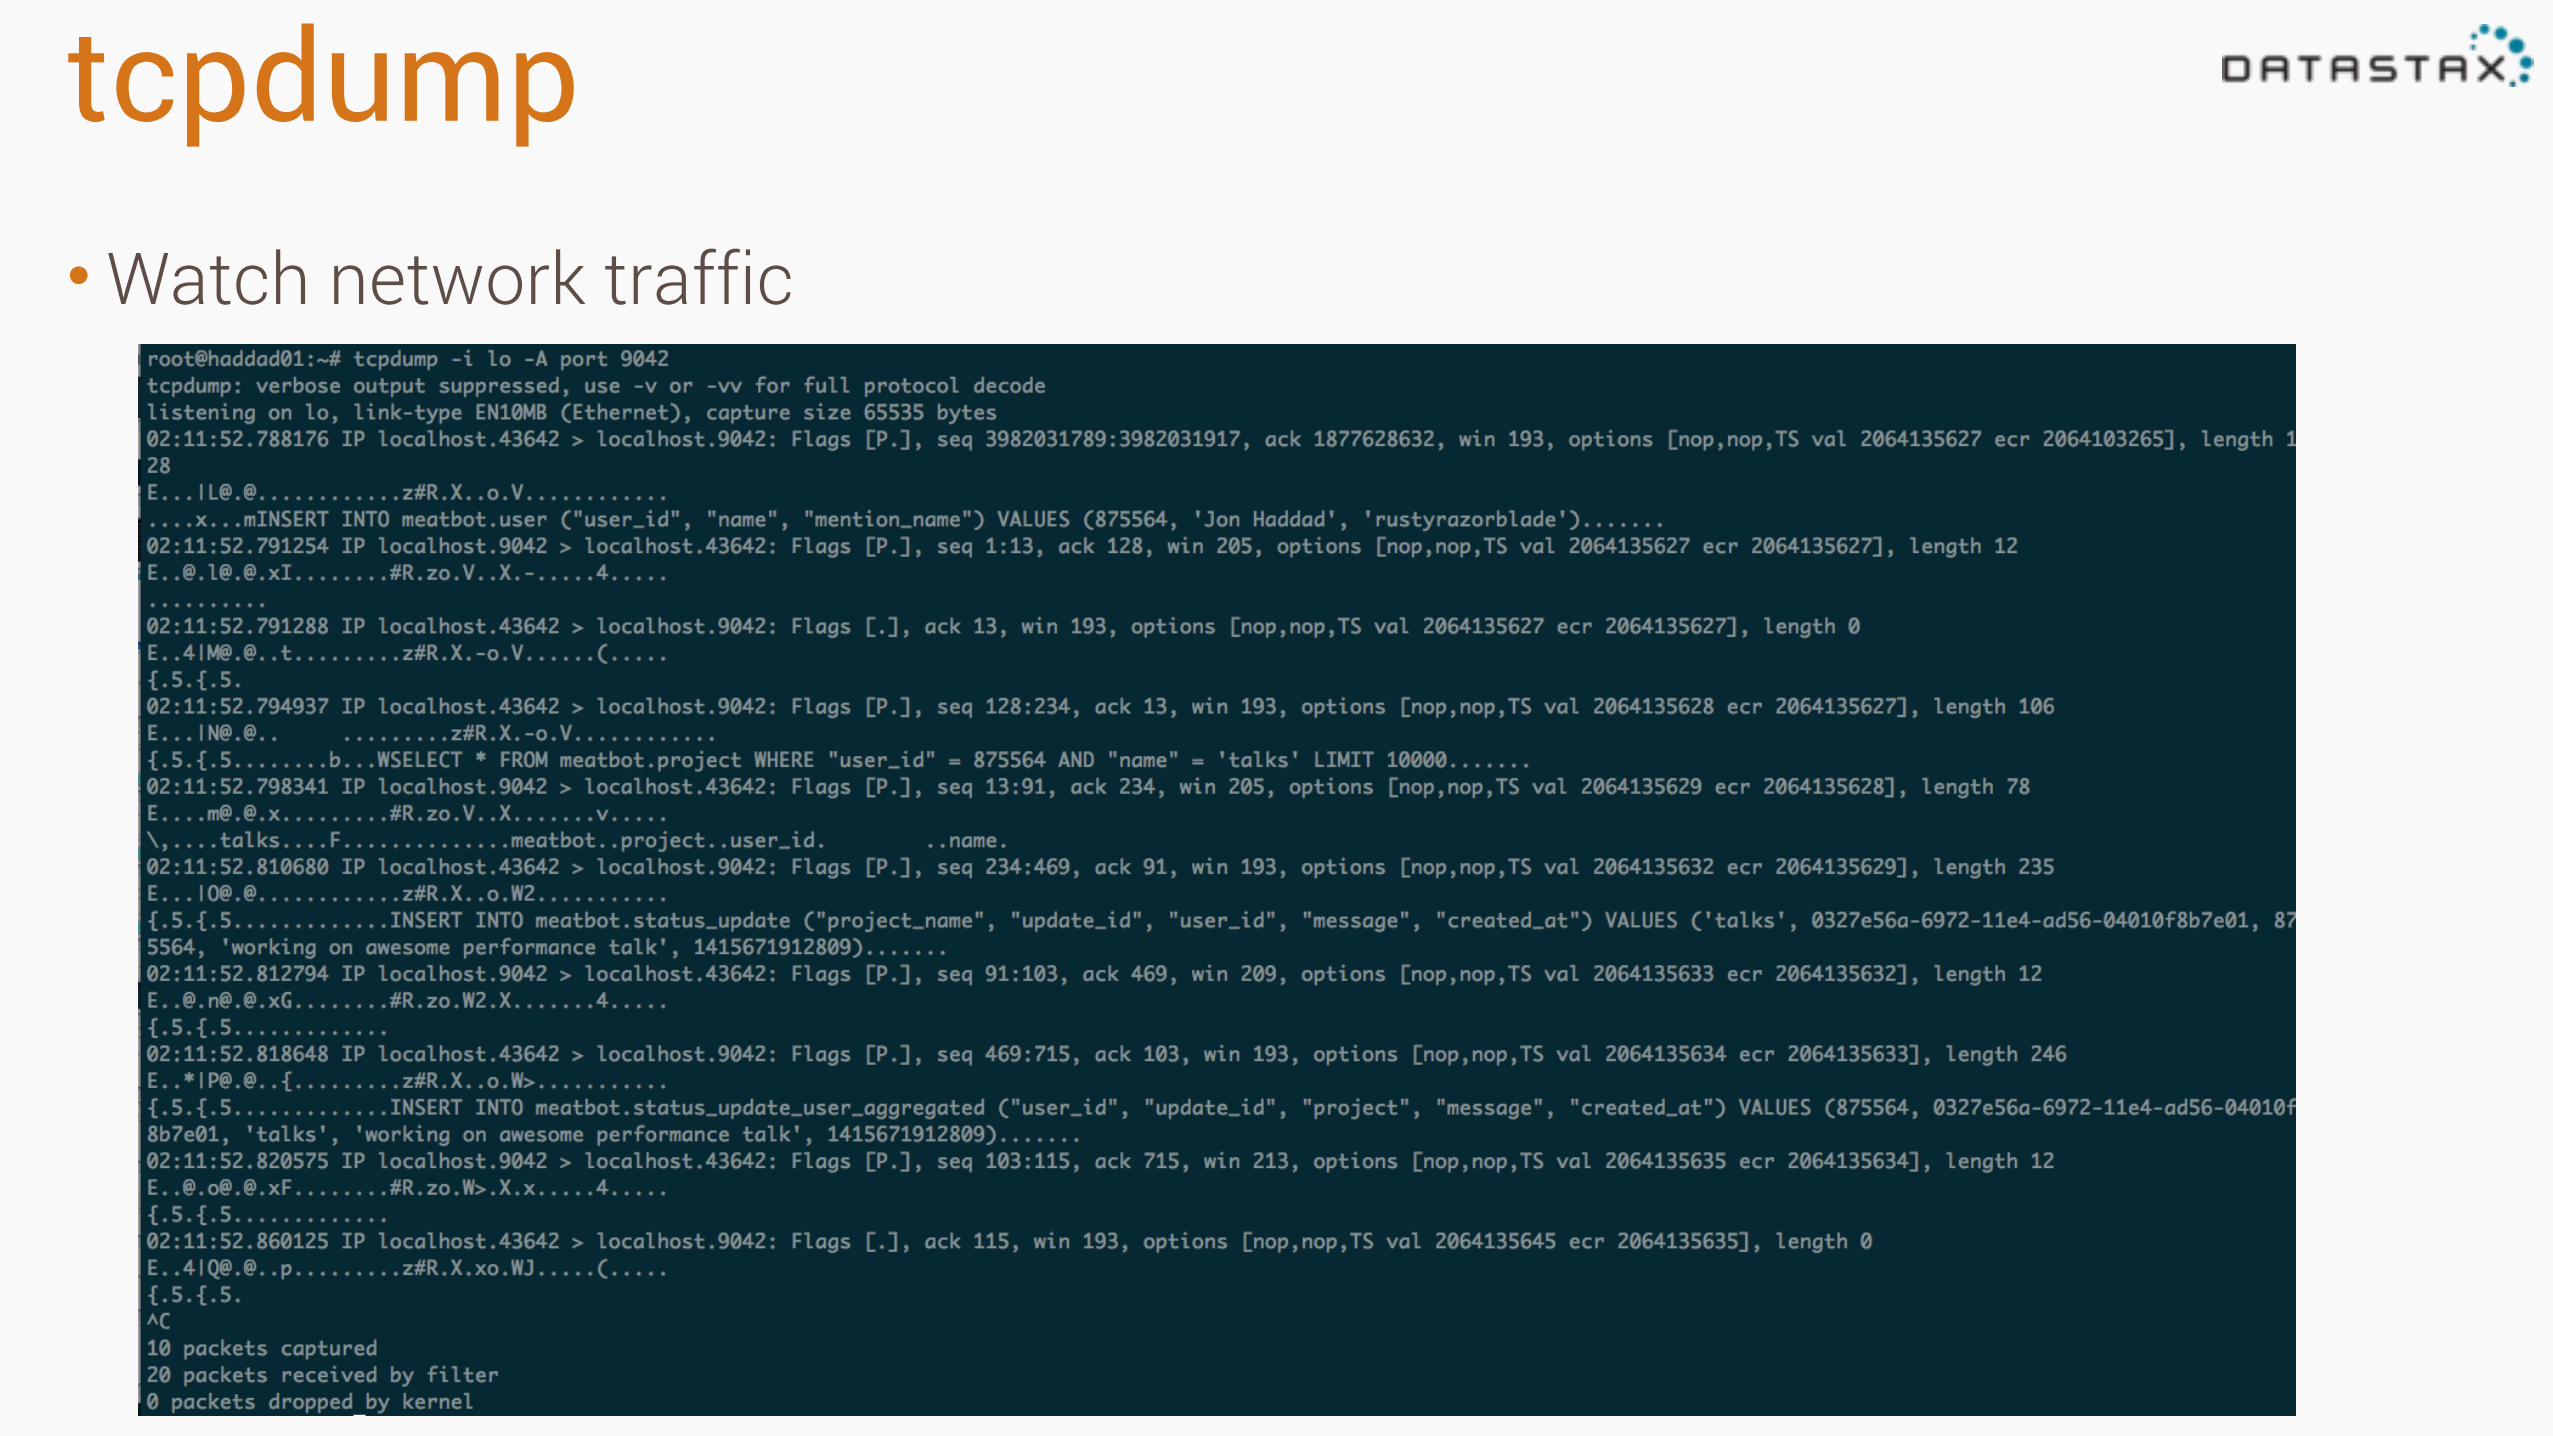
tcpdump•Watch network traffic
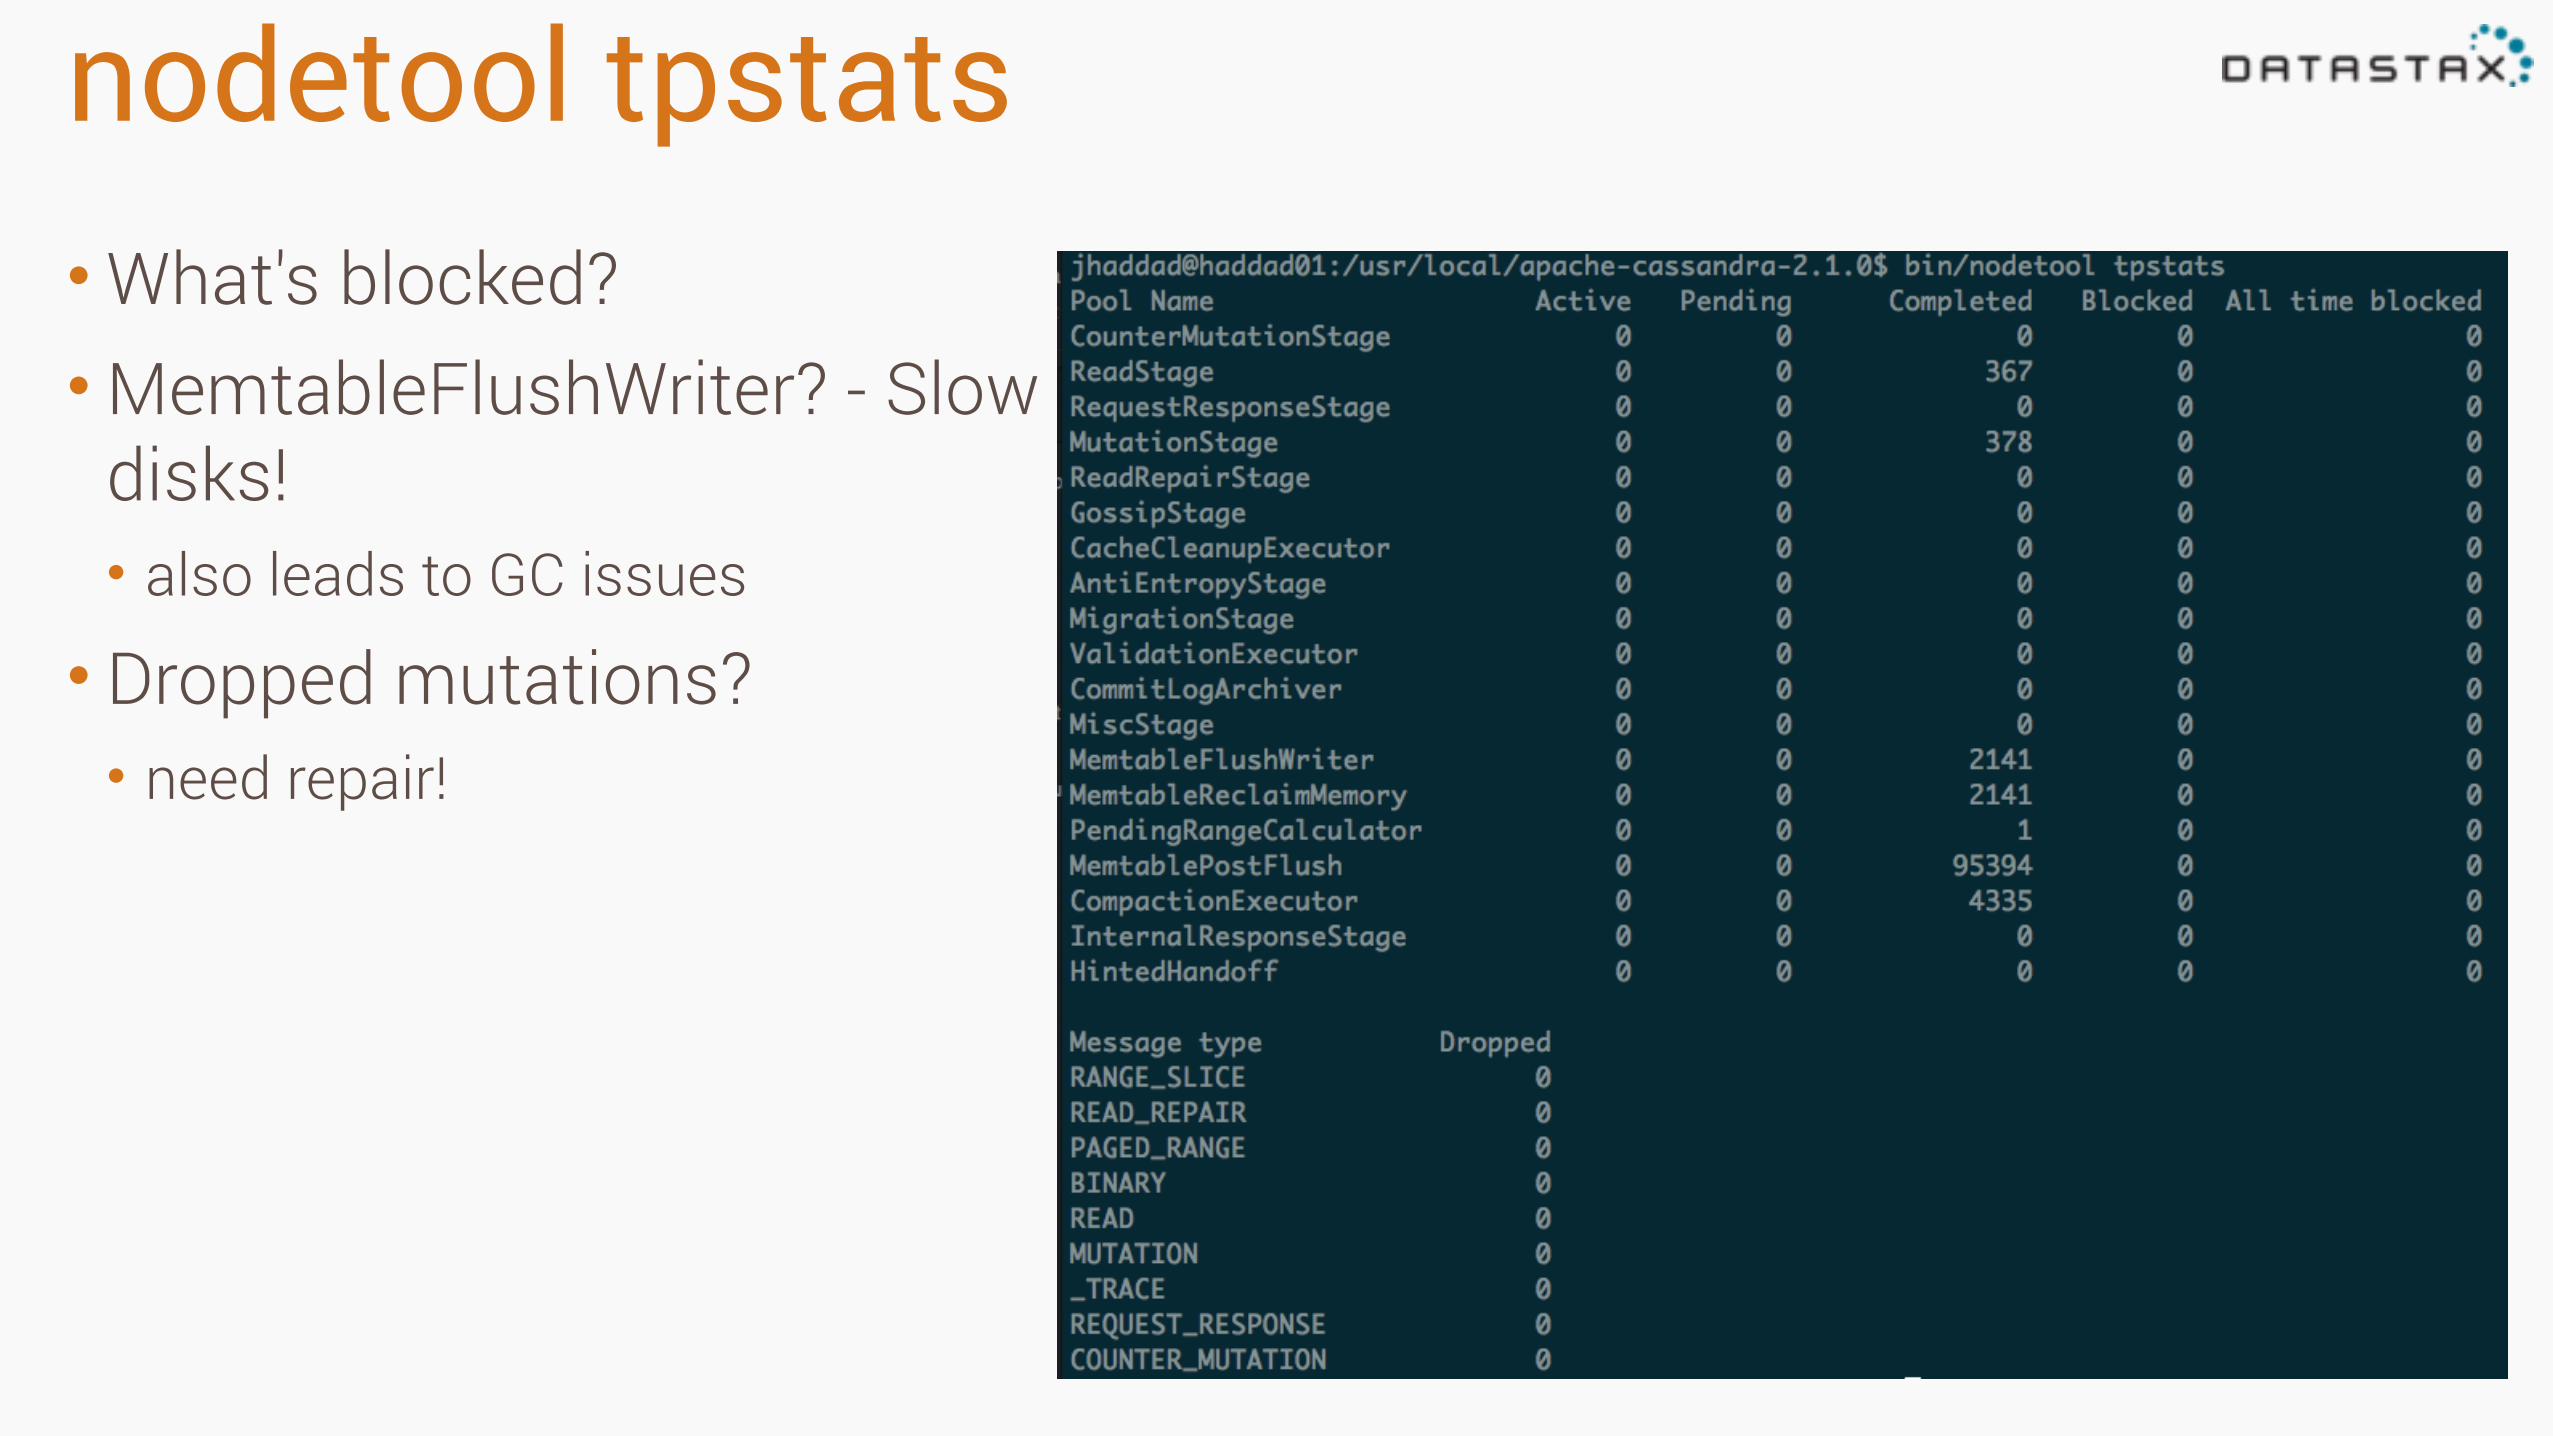
nodetool tpstats•What's blocked? •MemtableFlushWriter? - Slow
disks! • also leads to GC issues
• Dropped mutations? • need repair!
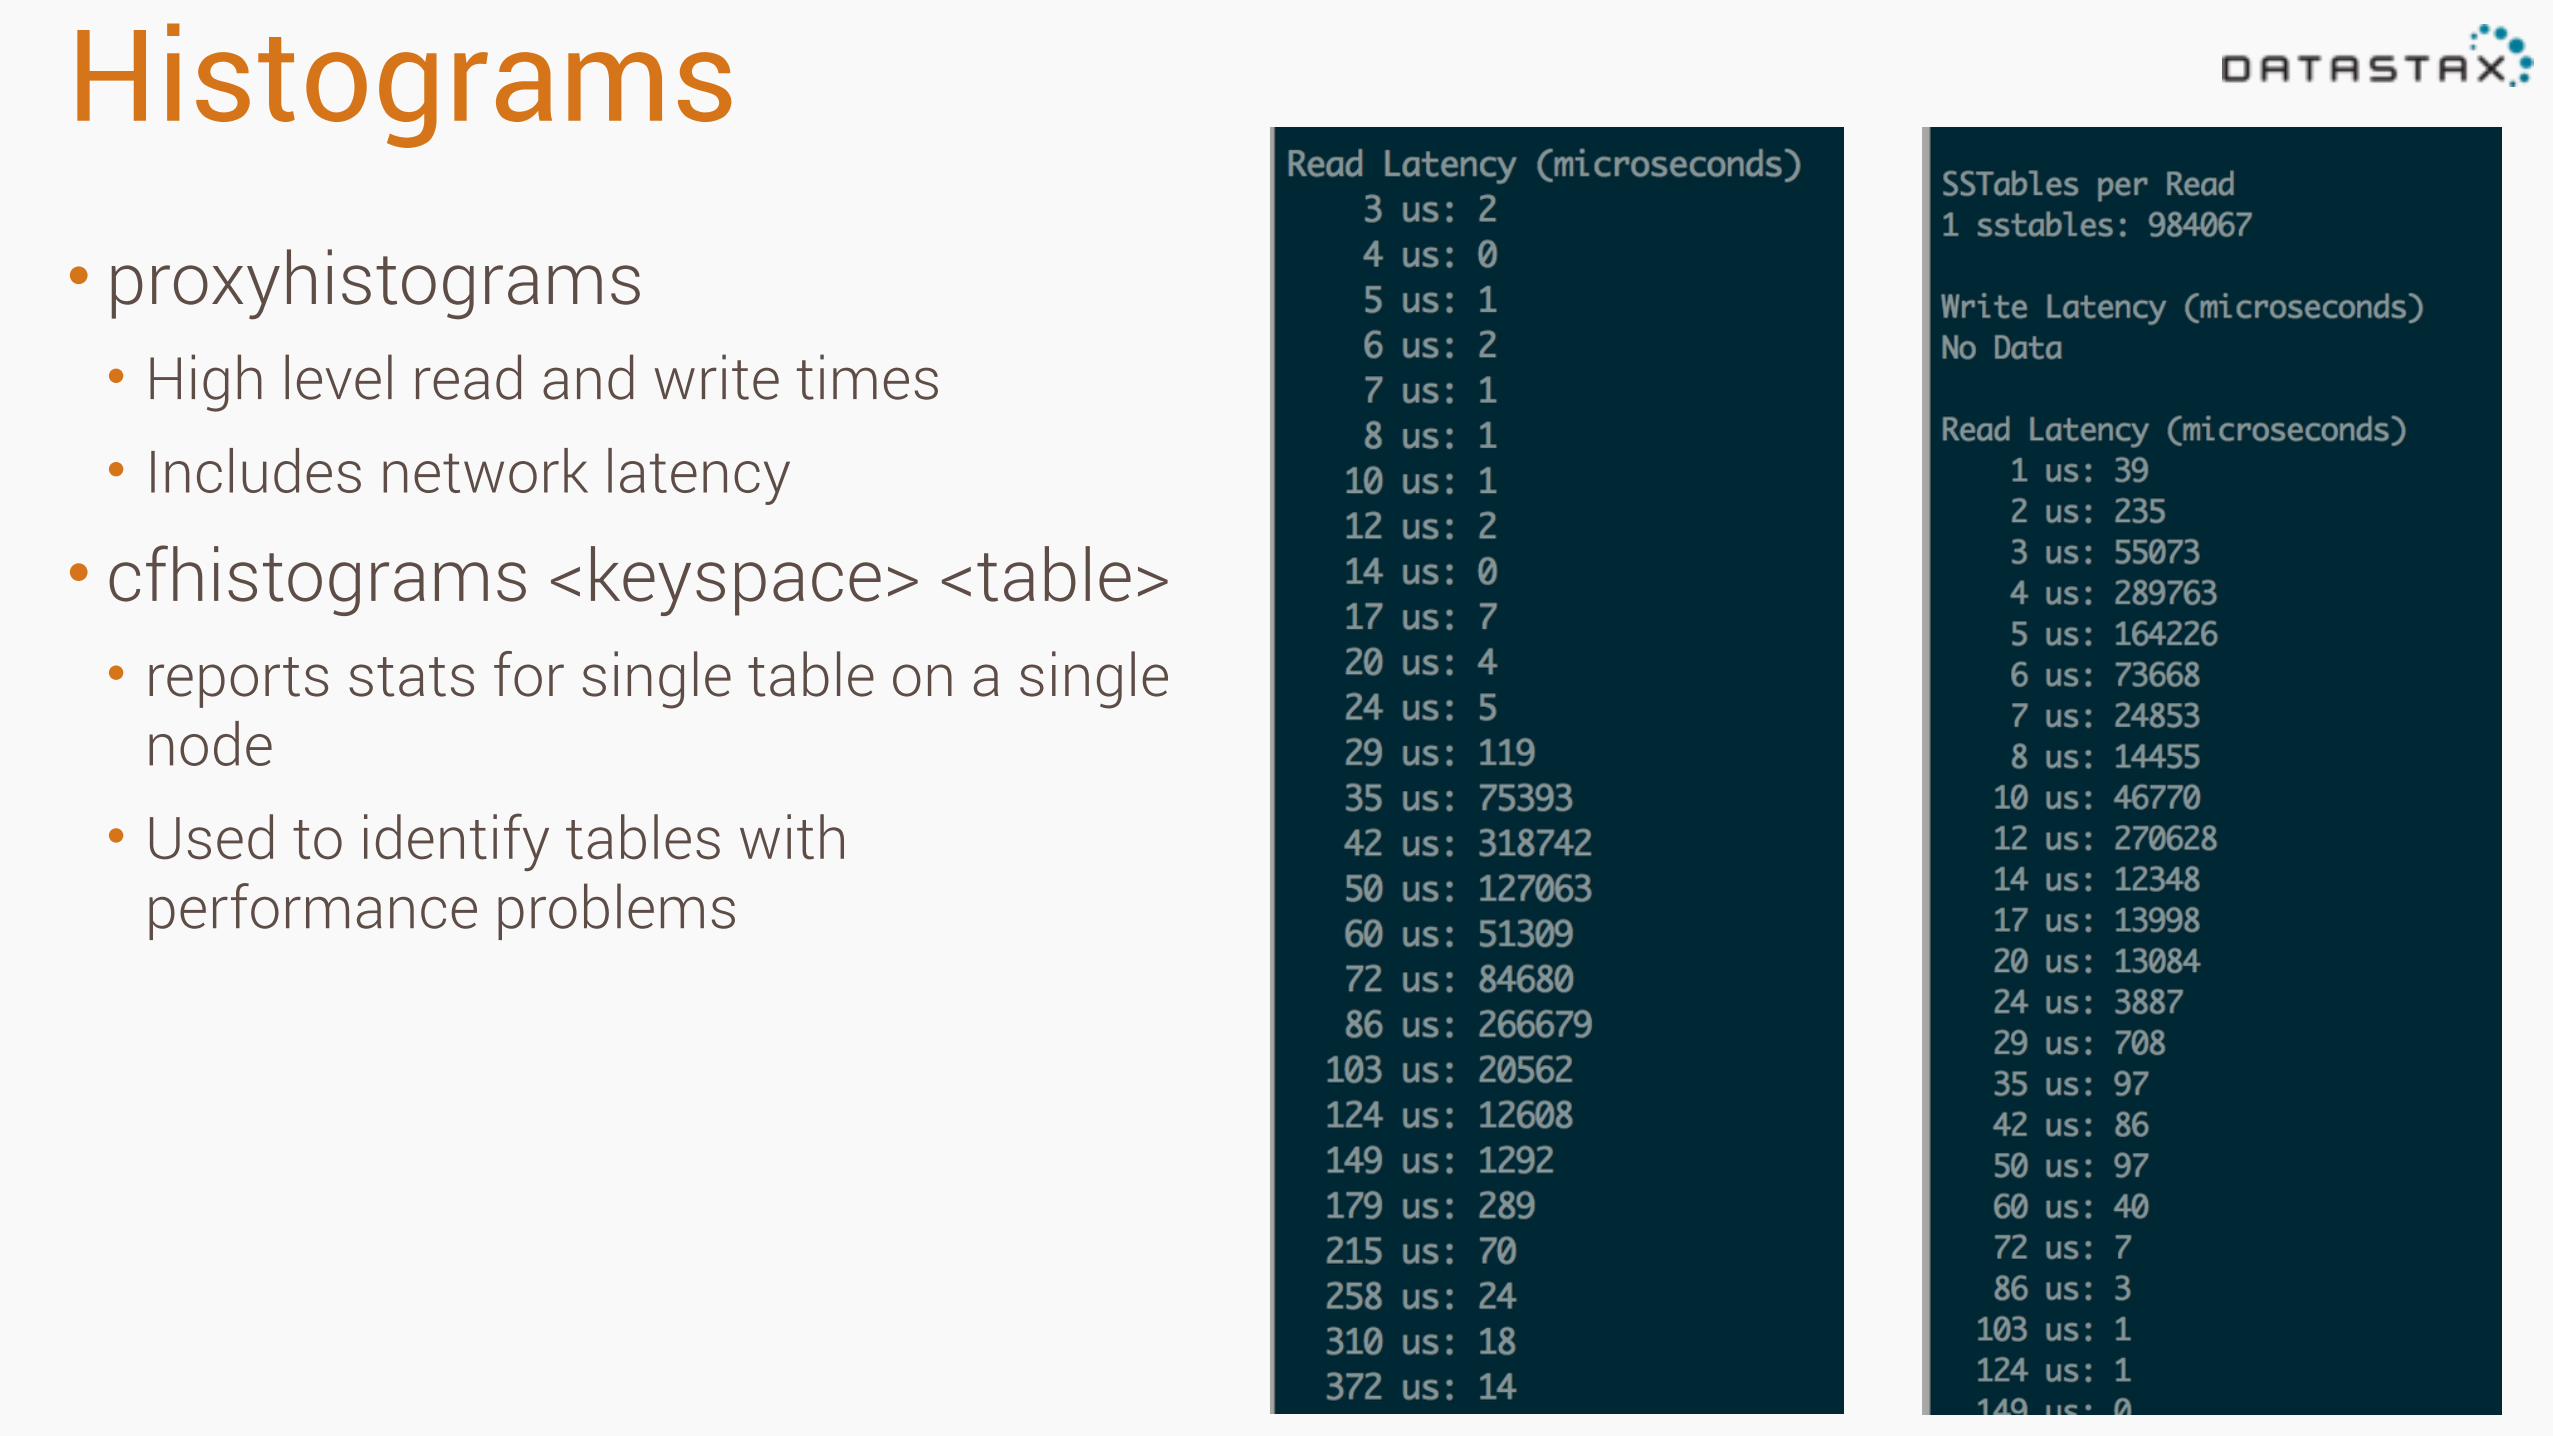
Histograms• proxyhistograms • High level read and write times • Includes network latency
• cfhistograms <keyspace> <table> • reports stats for single table on a single
node • Used to identify tables with
performance problems
Query Tracing
JVM Garbage Collection
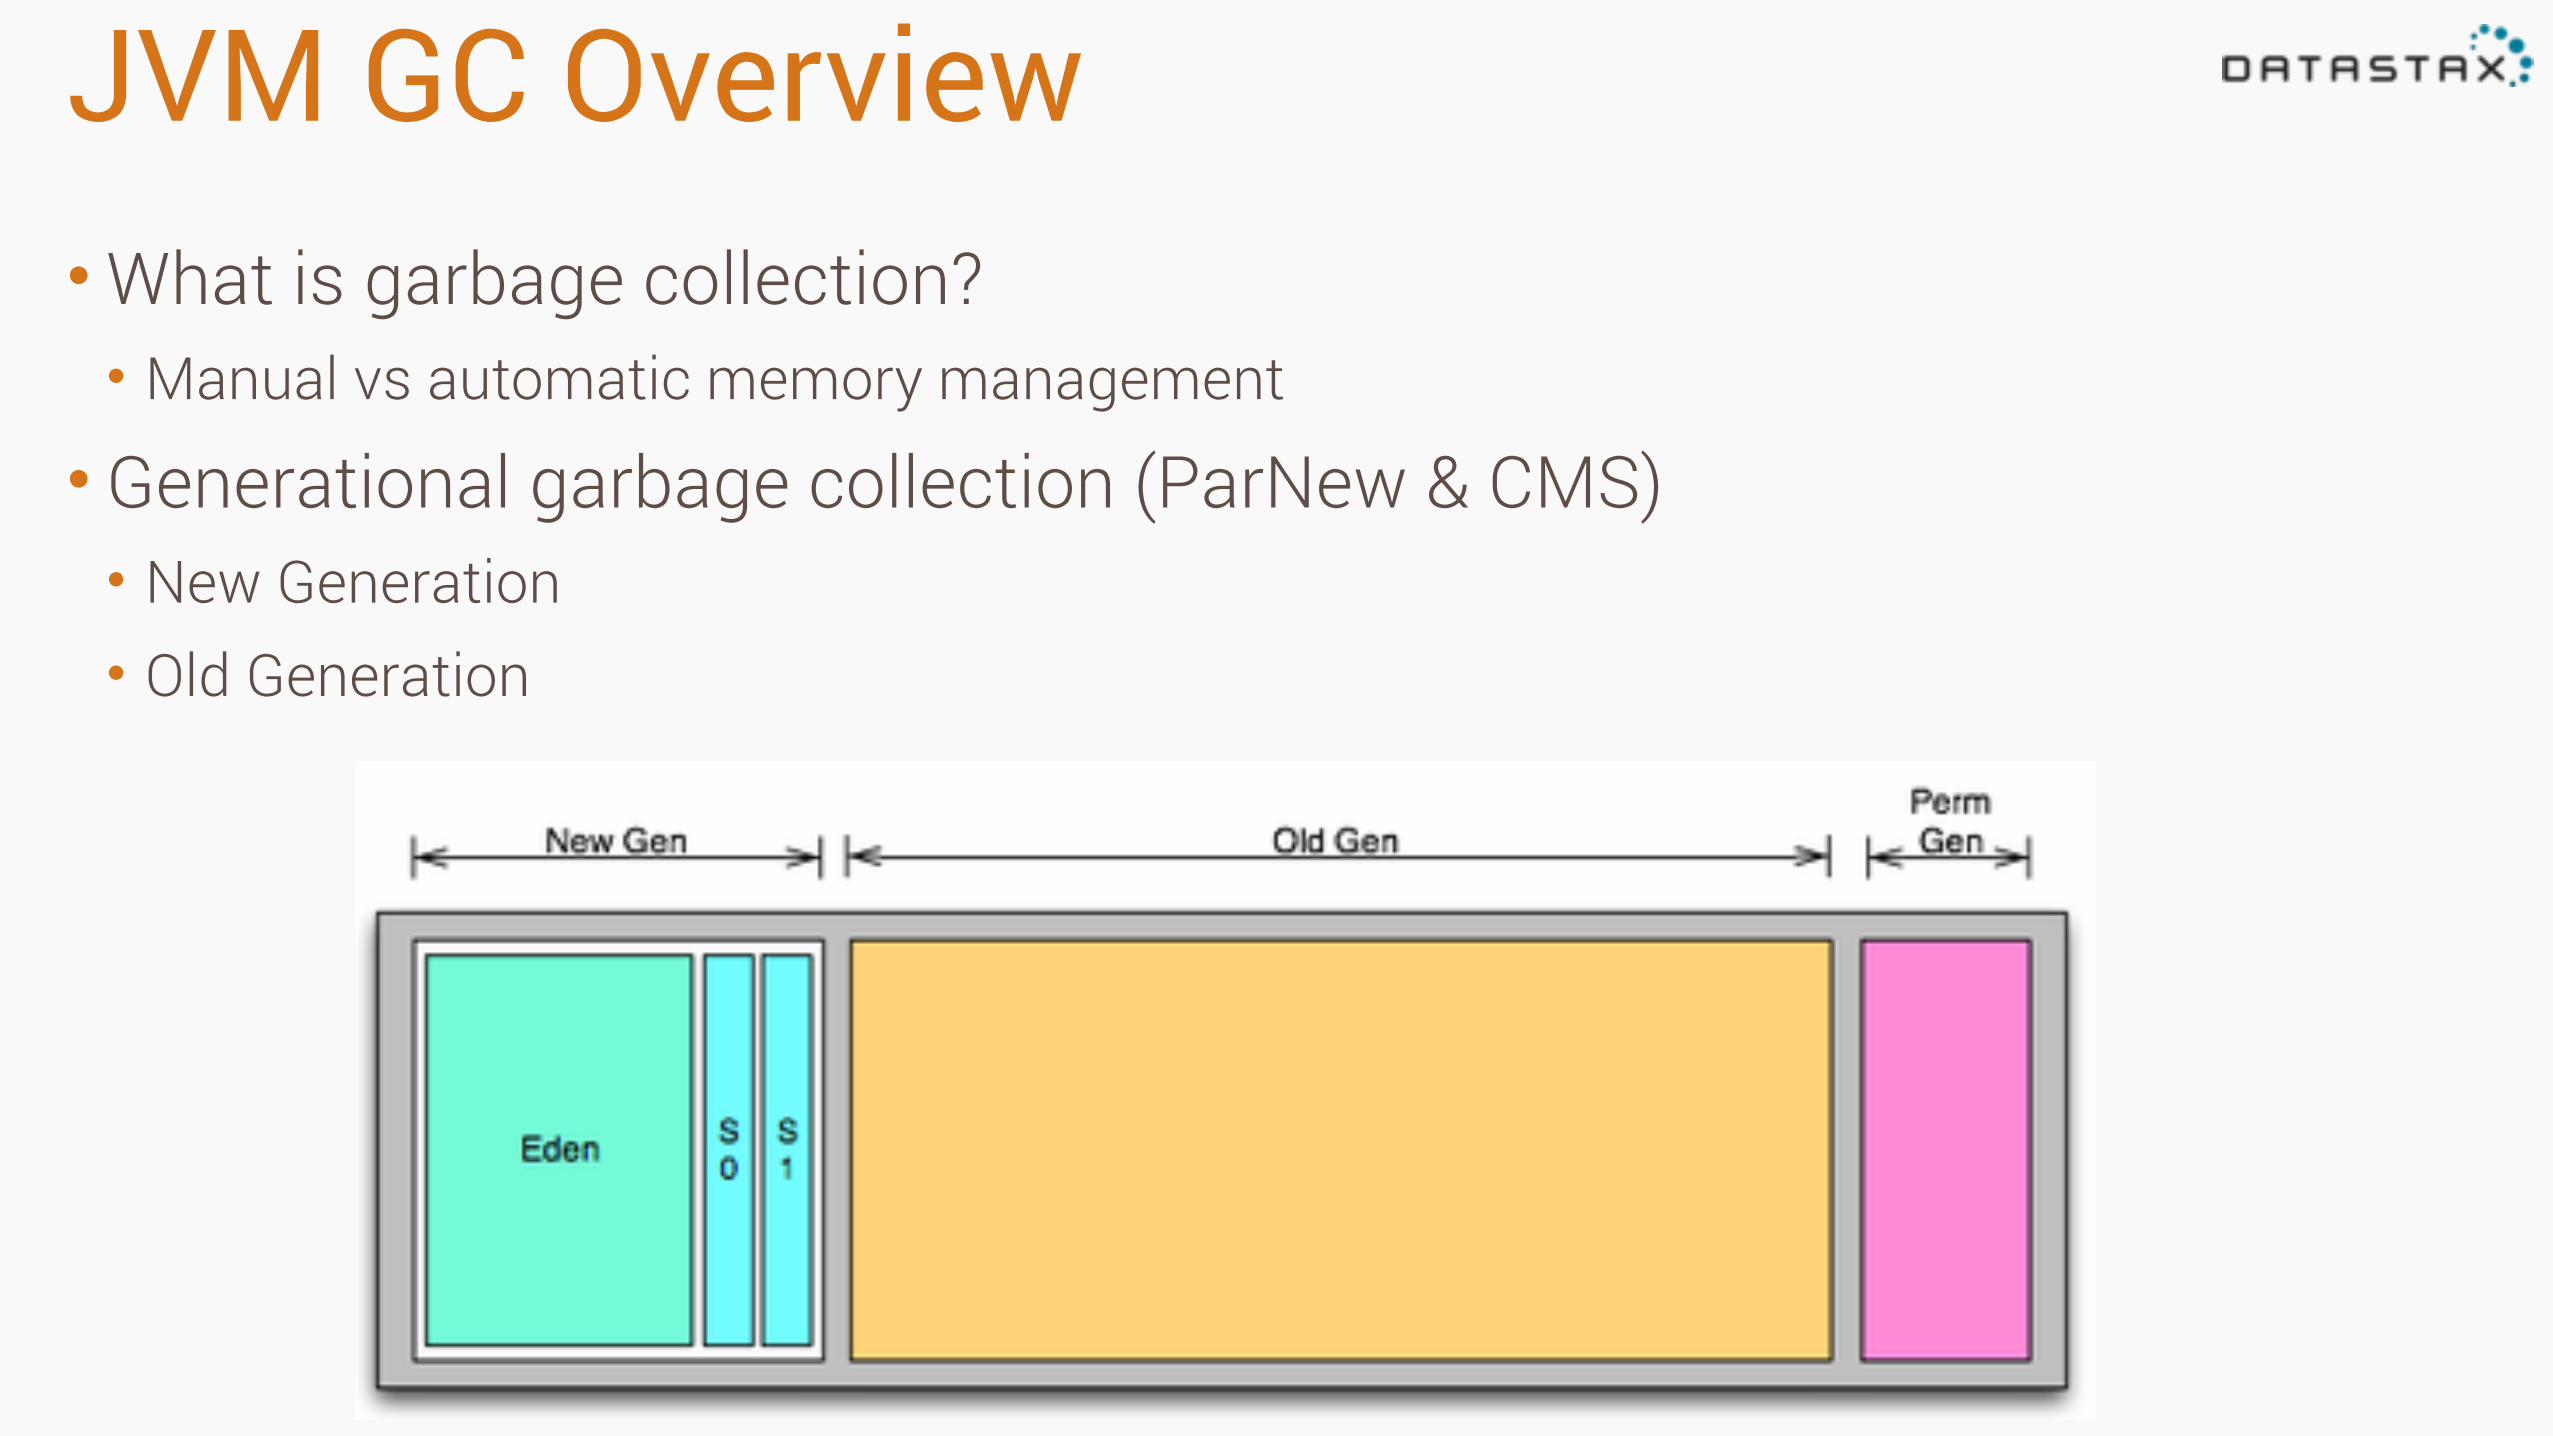
JVM GC Overview•What is garbage collection? • Manual vs automatic memory management
• Generational garbage collection (ParNew & CMS) • New Generation • Old Generation
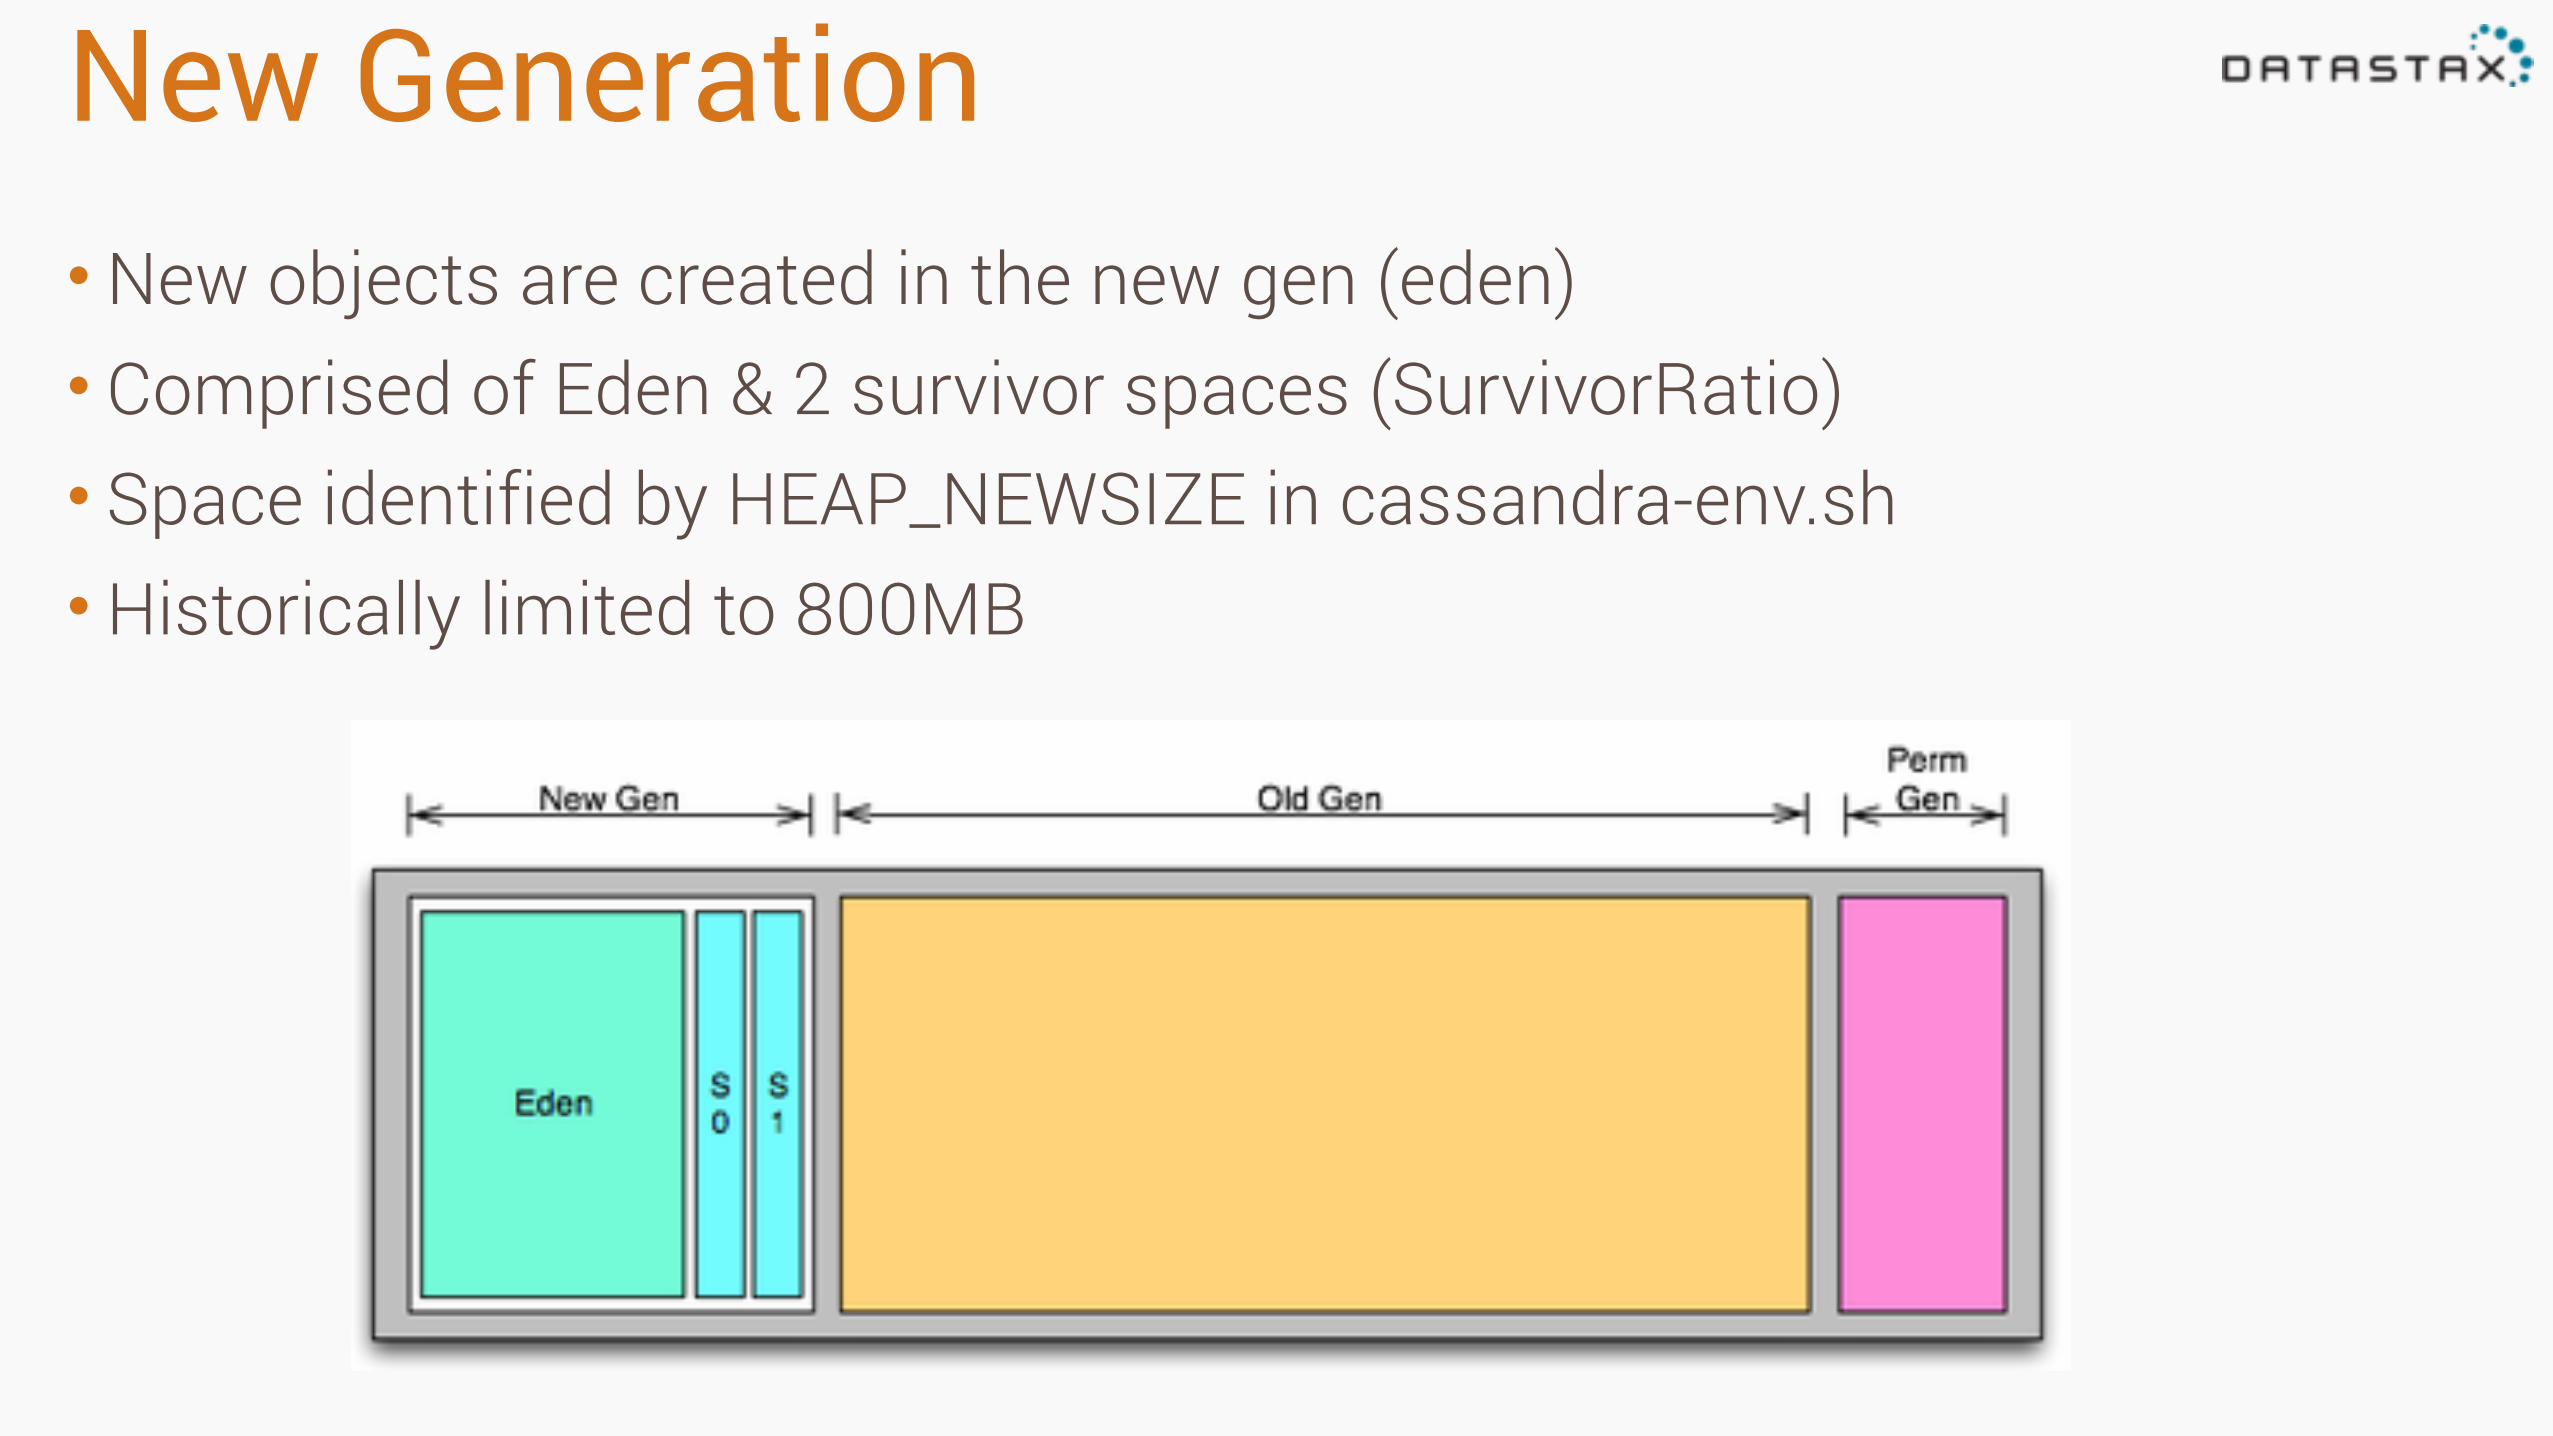
New Generation•New objects are created in the new gen (eden) • Comprised of Eden & 2 survivor spaces (SurvivorRatio) • Space identified by HEAP_NEWSIZE in cassandra-env.sh •Historically limited to 800MB
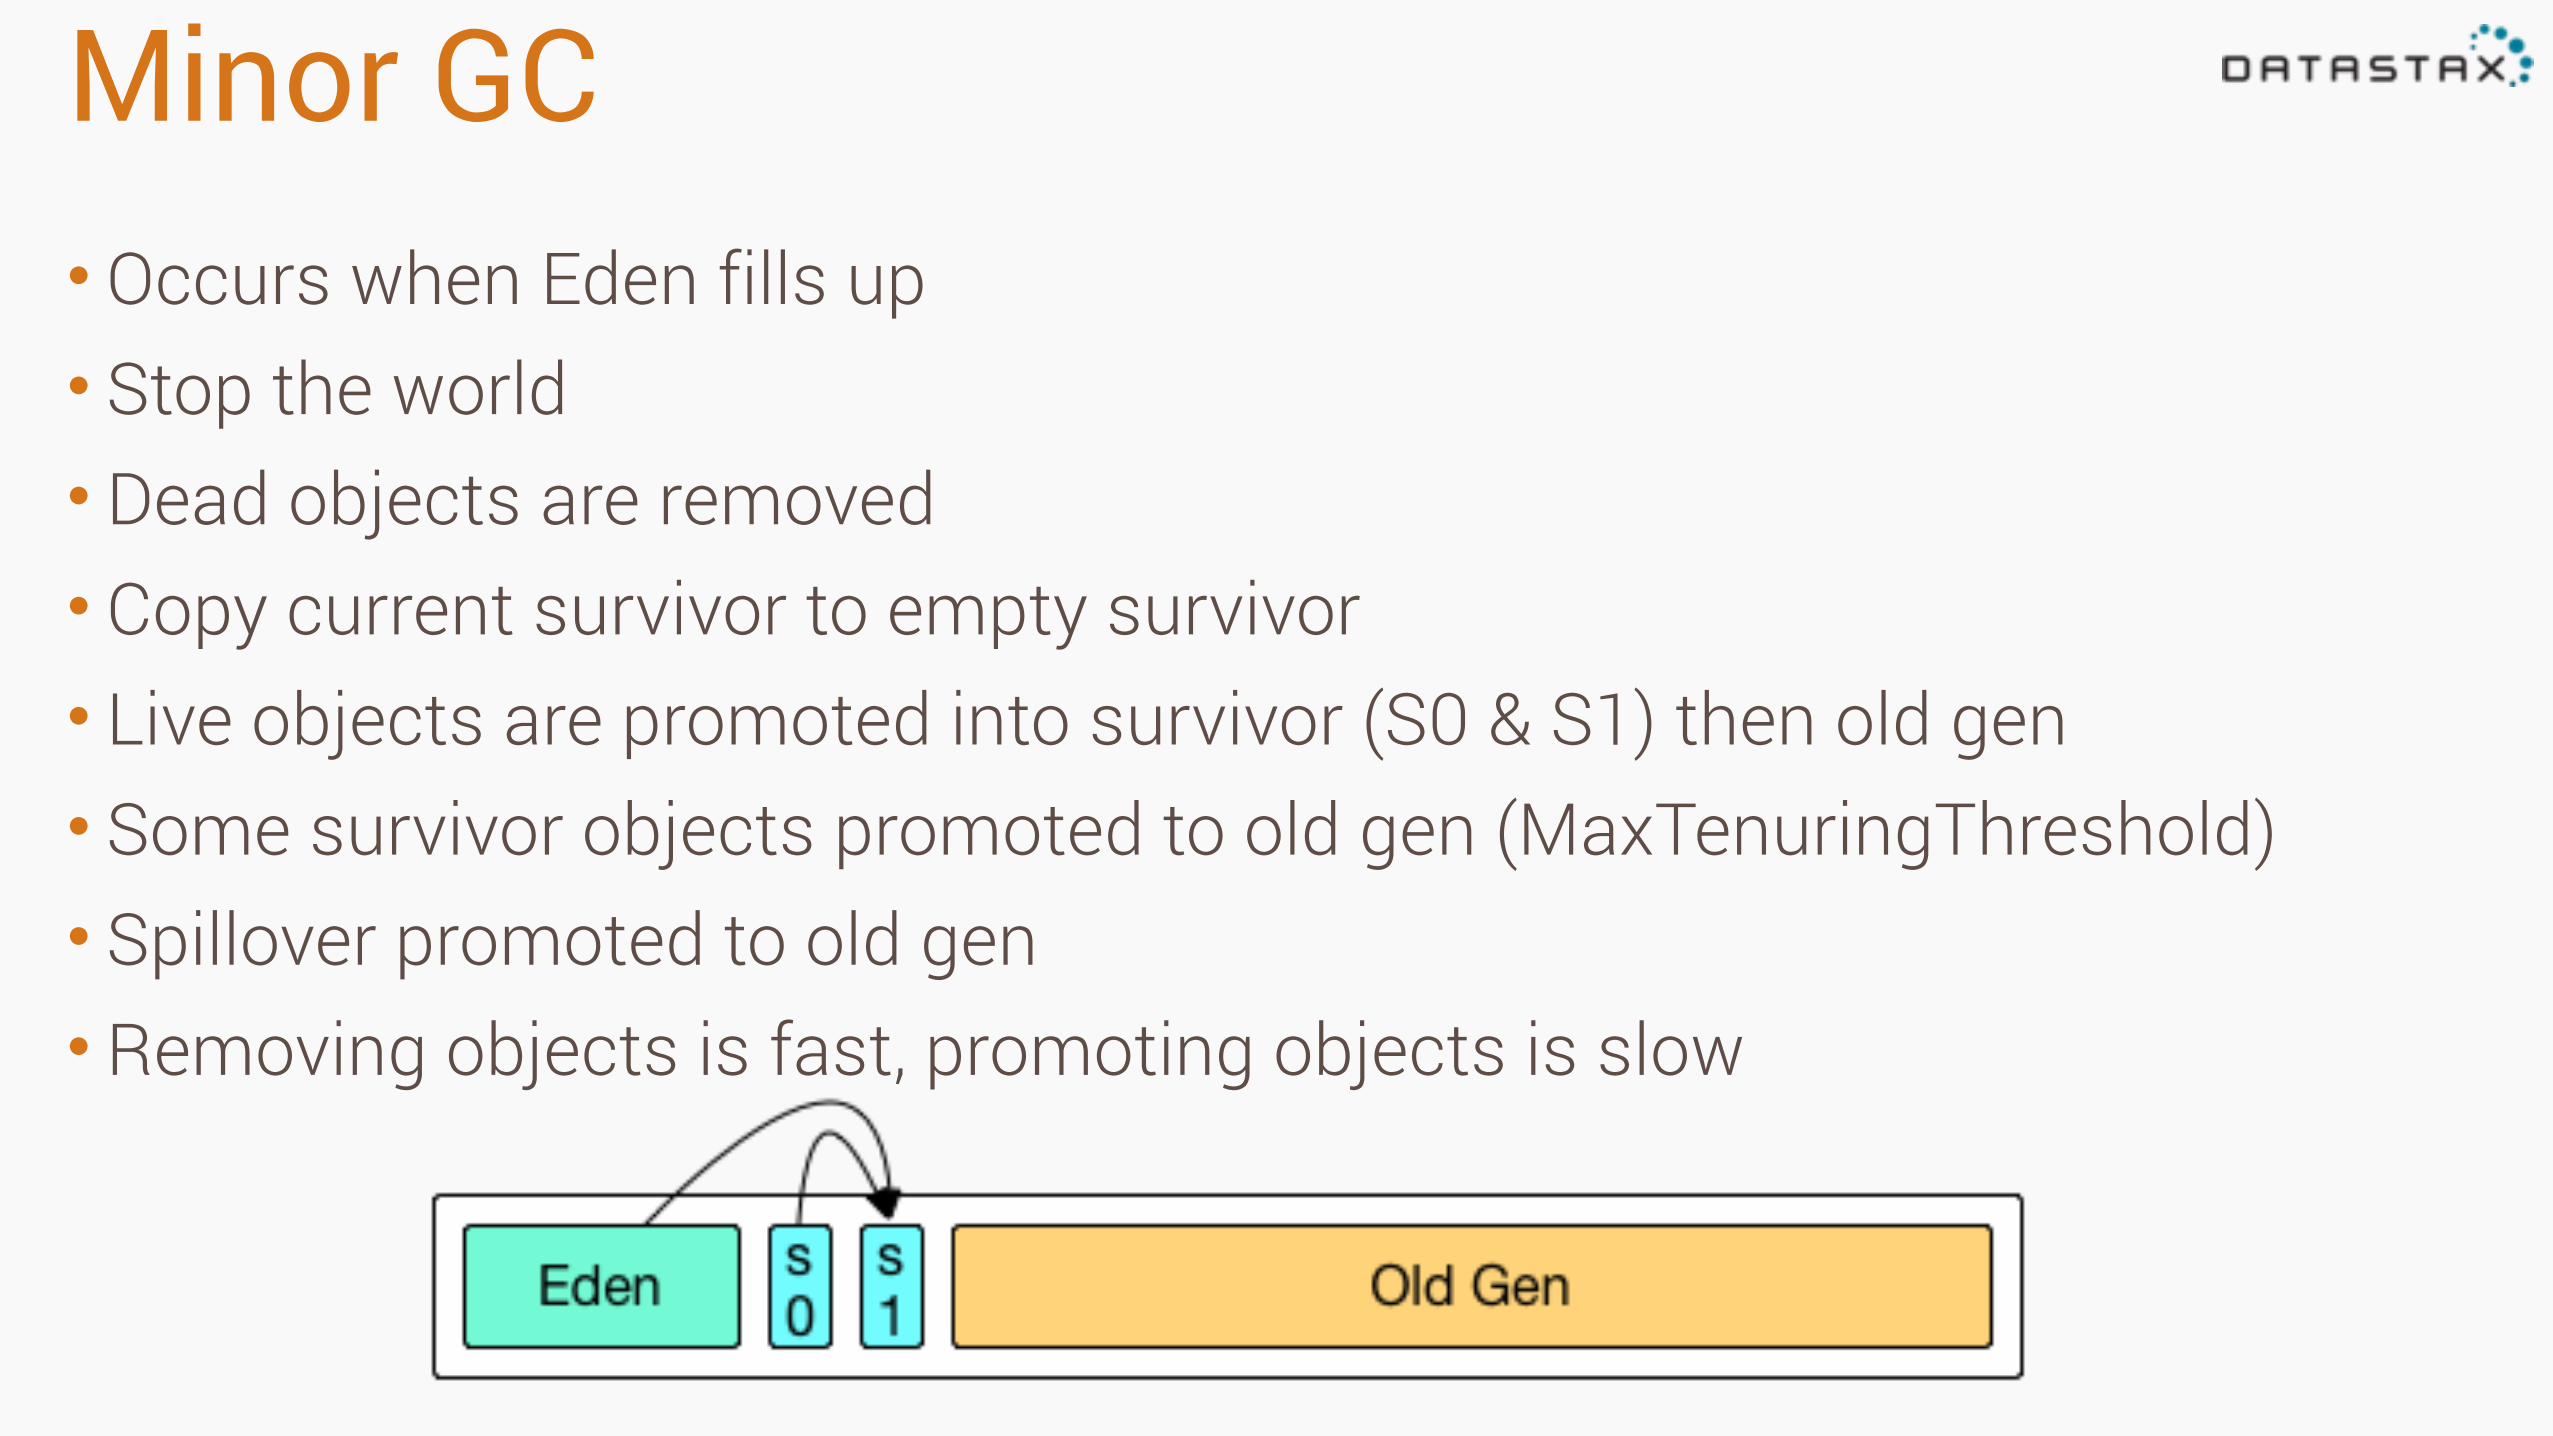
Minor GC• Occurs when Eden fills up • Stop the world • Dead objects are removed • Copy current survivor to empty survivor • Live objects are promoted into survivor (S0 & S1) then old gen • Some survivor objects promoted to old gen (MaxTenuringThreshold) • Spillover promoted to old gen • Removing objects is fast, promoting objects is slow
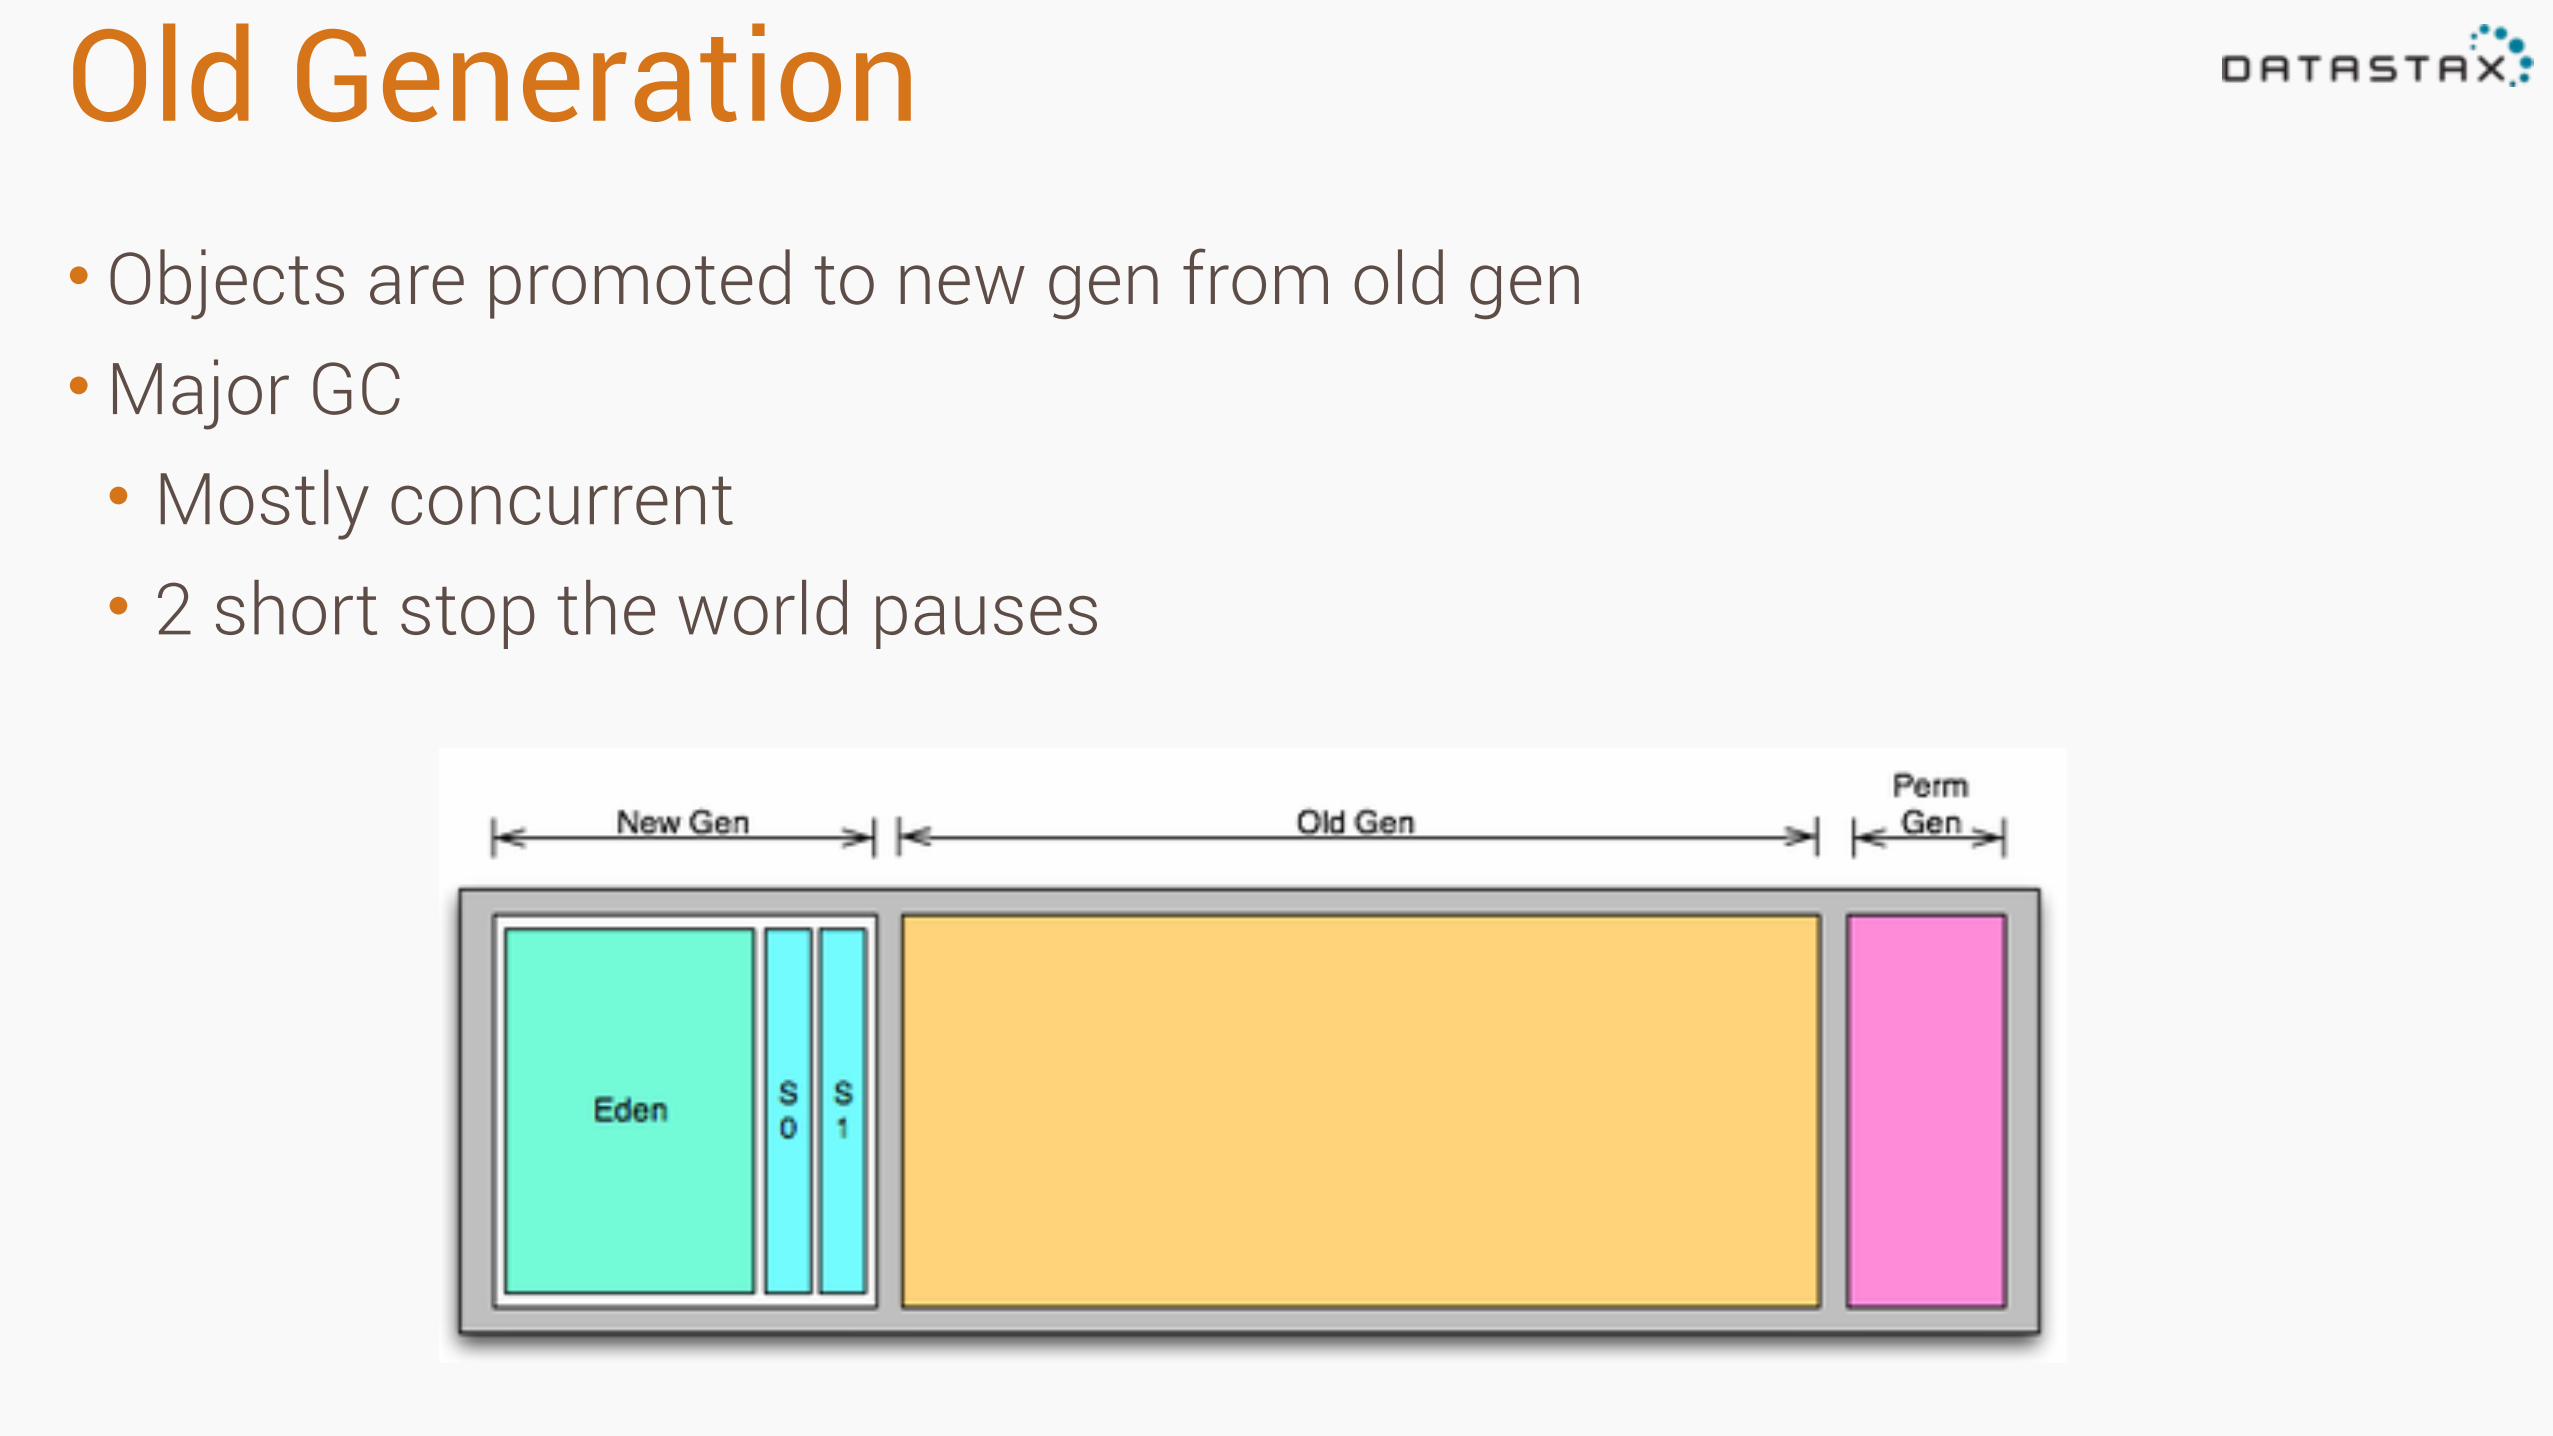
Old Generation• Objects are promoted to new gen from old gen •Major GC • Mostly concurrent • 2 short stop the world pauses
Full GC• Occurs when old gen fills up or
objects can’t be promoted • Stop the world • Collects all generations • Defragments old gen • These are bad! •Massive pauses
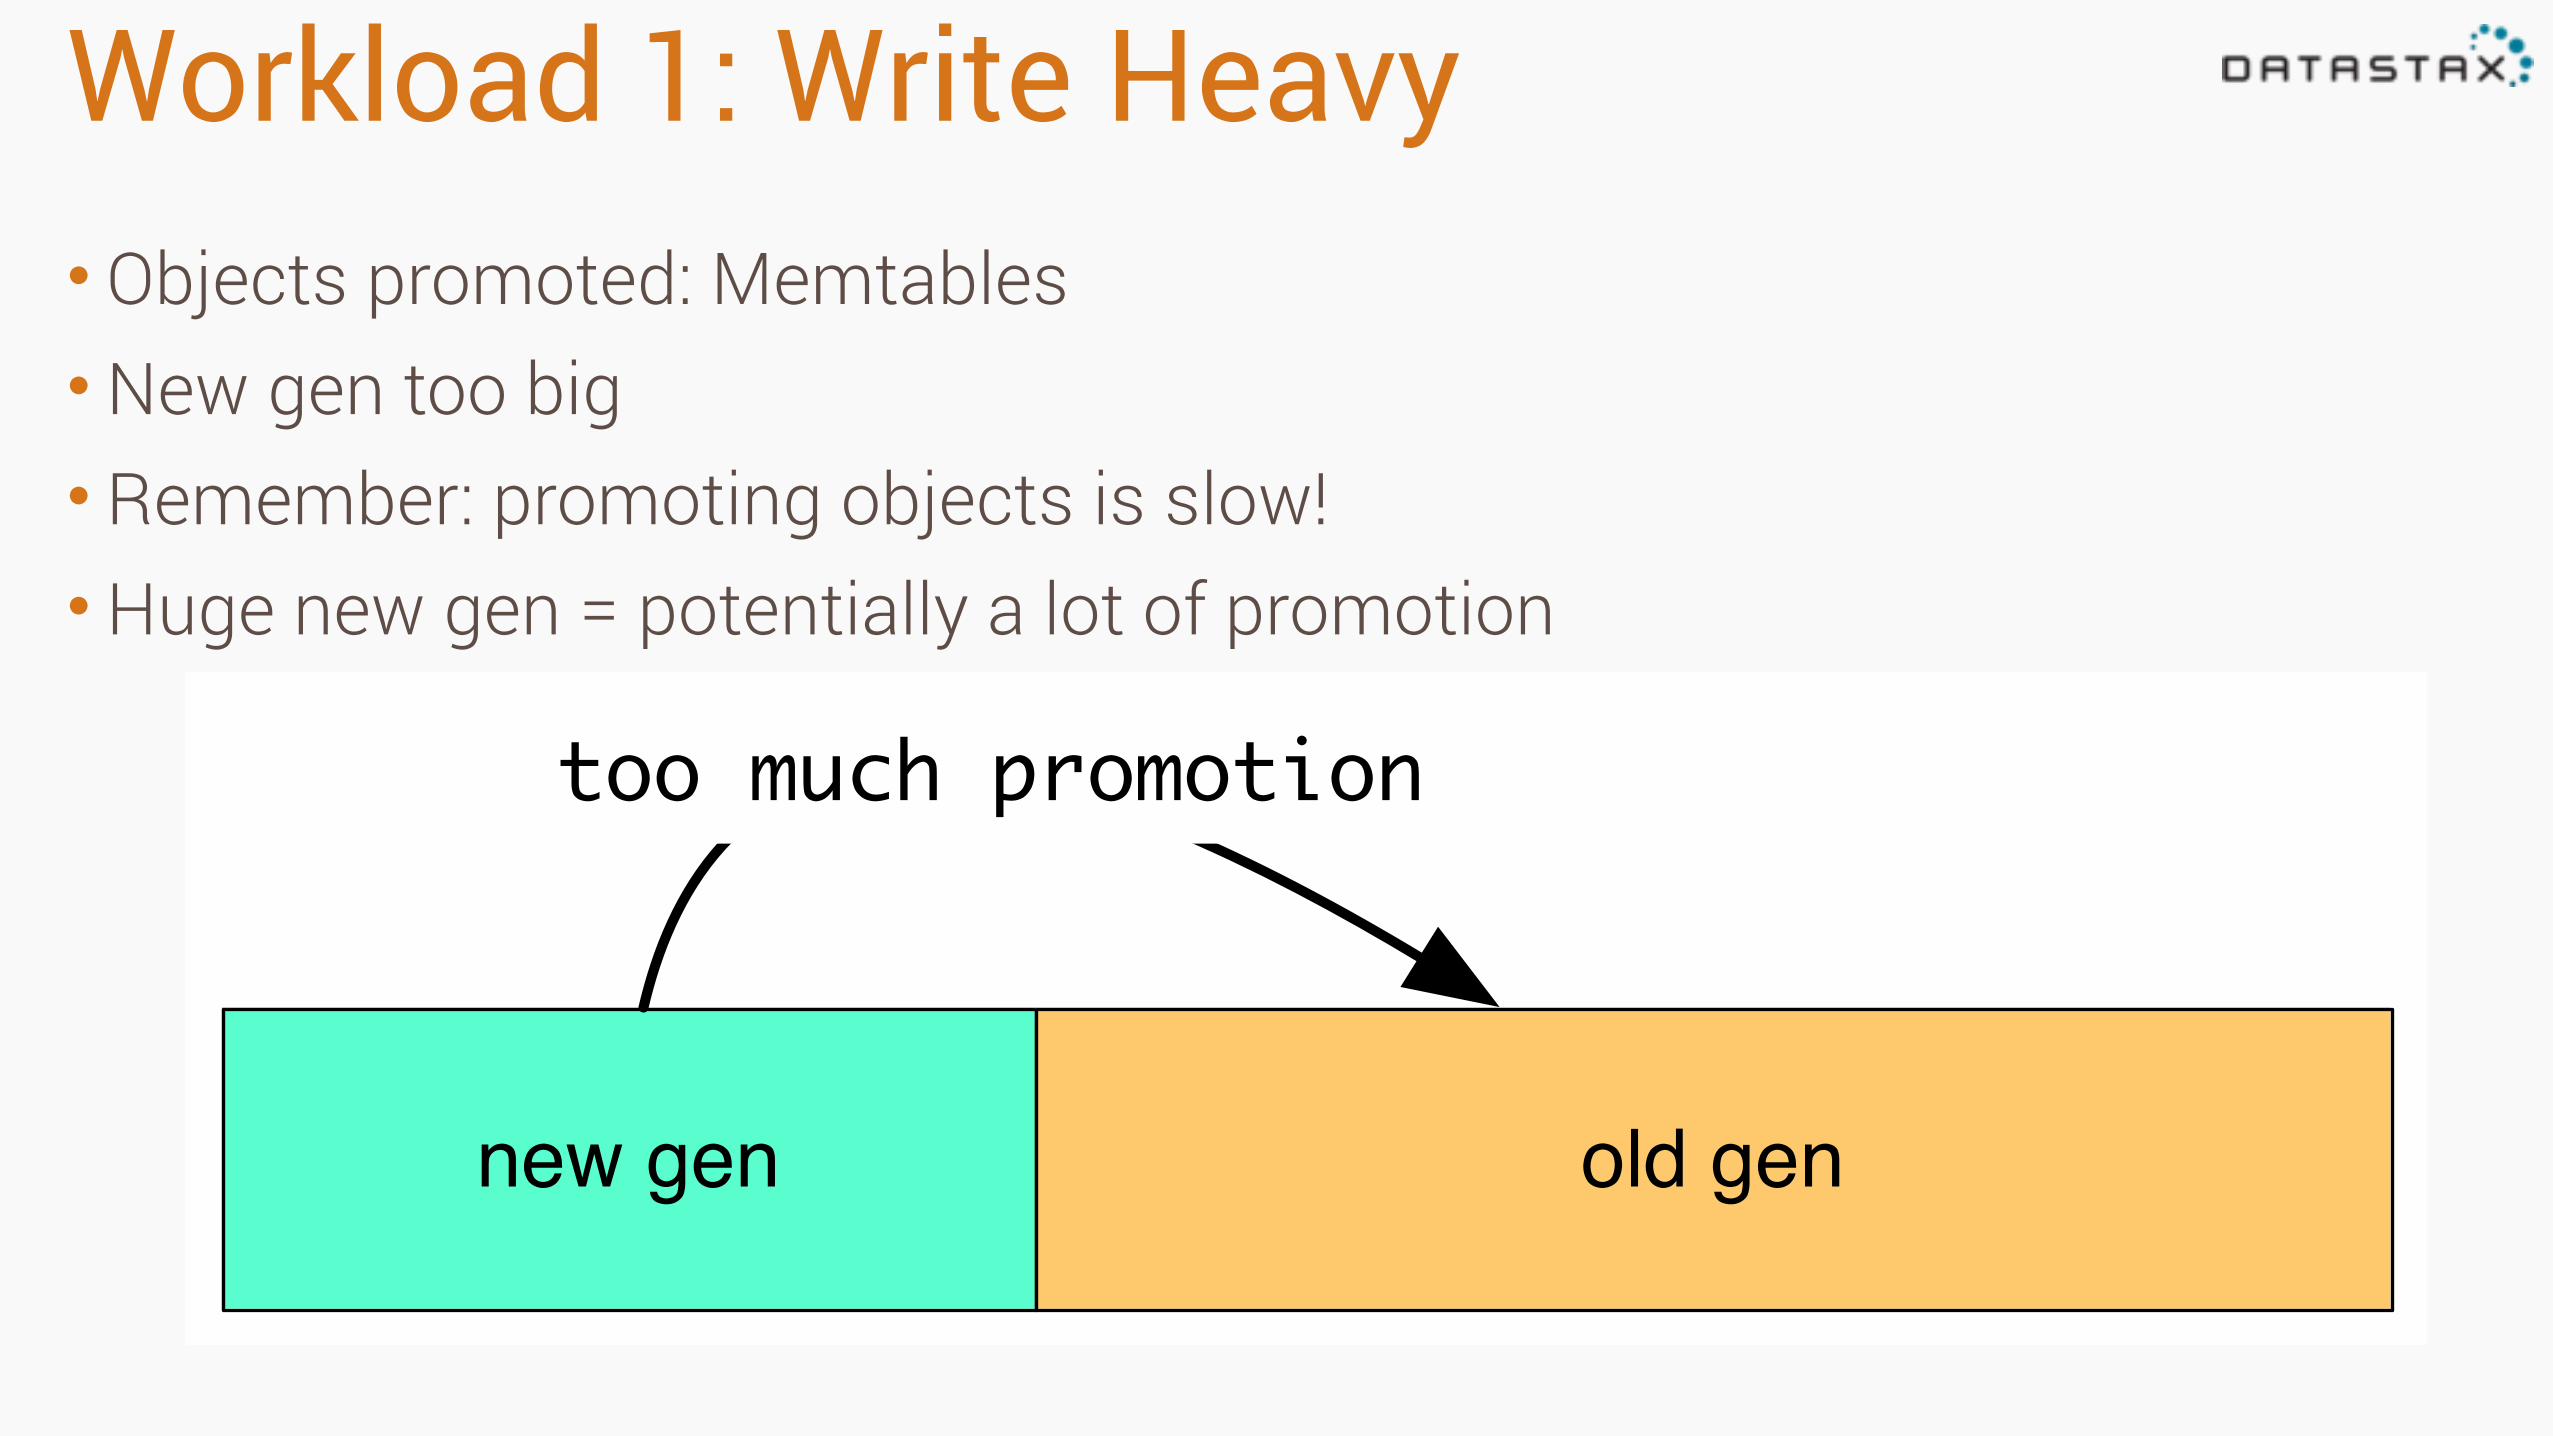
Workload 1: Write Heavy• Objects promoted: Memtables •New gen too big • Remember: promoting objects is slow! •Huge new gen = potentially a lot of promotion
new gen old gen
too much promotion
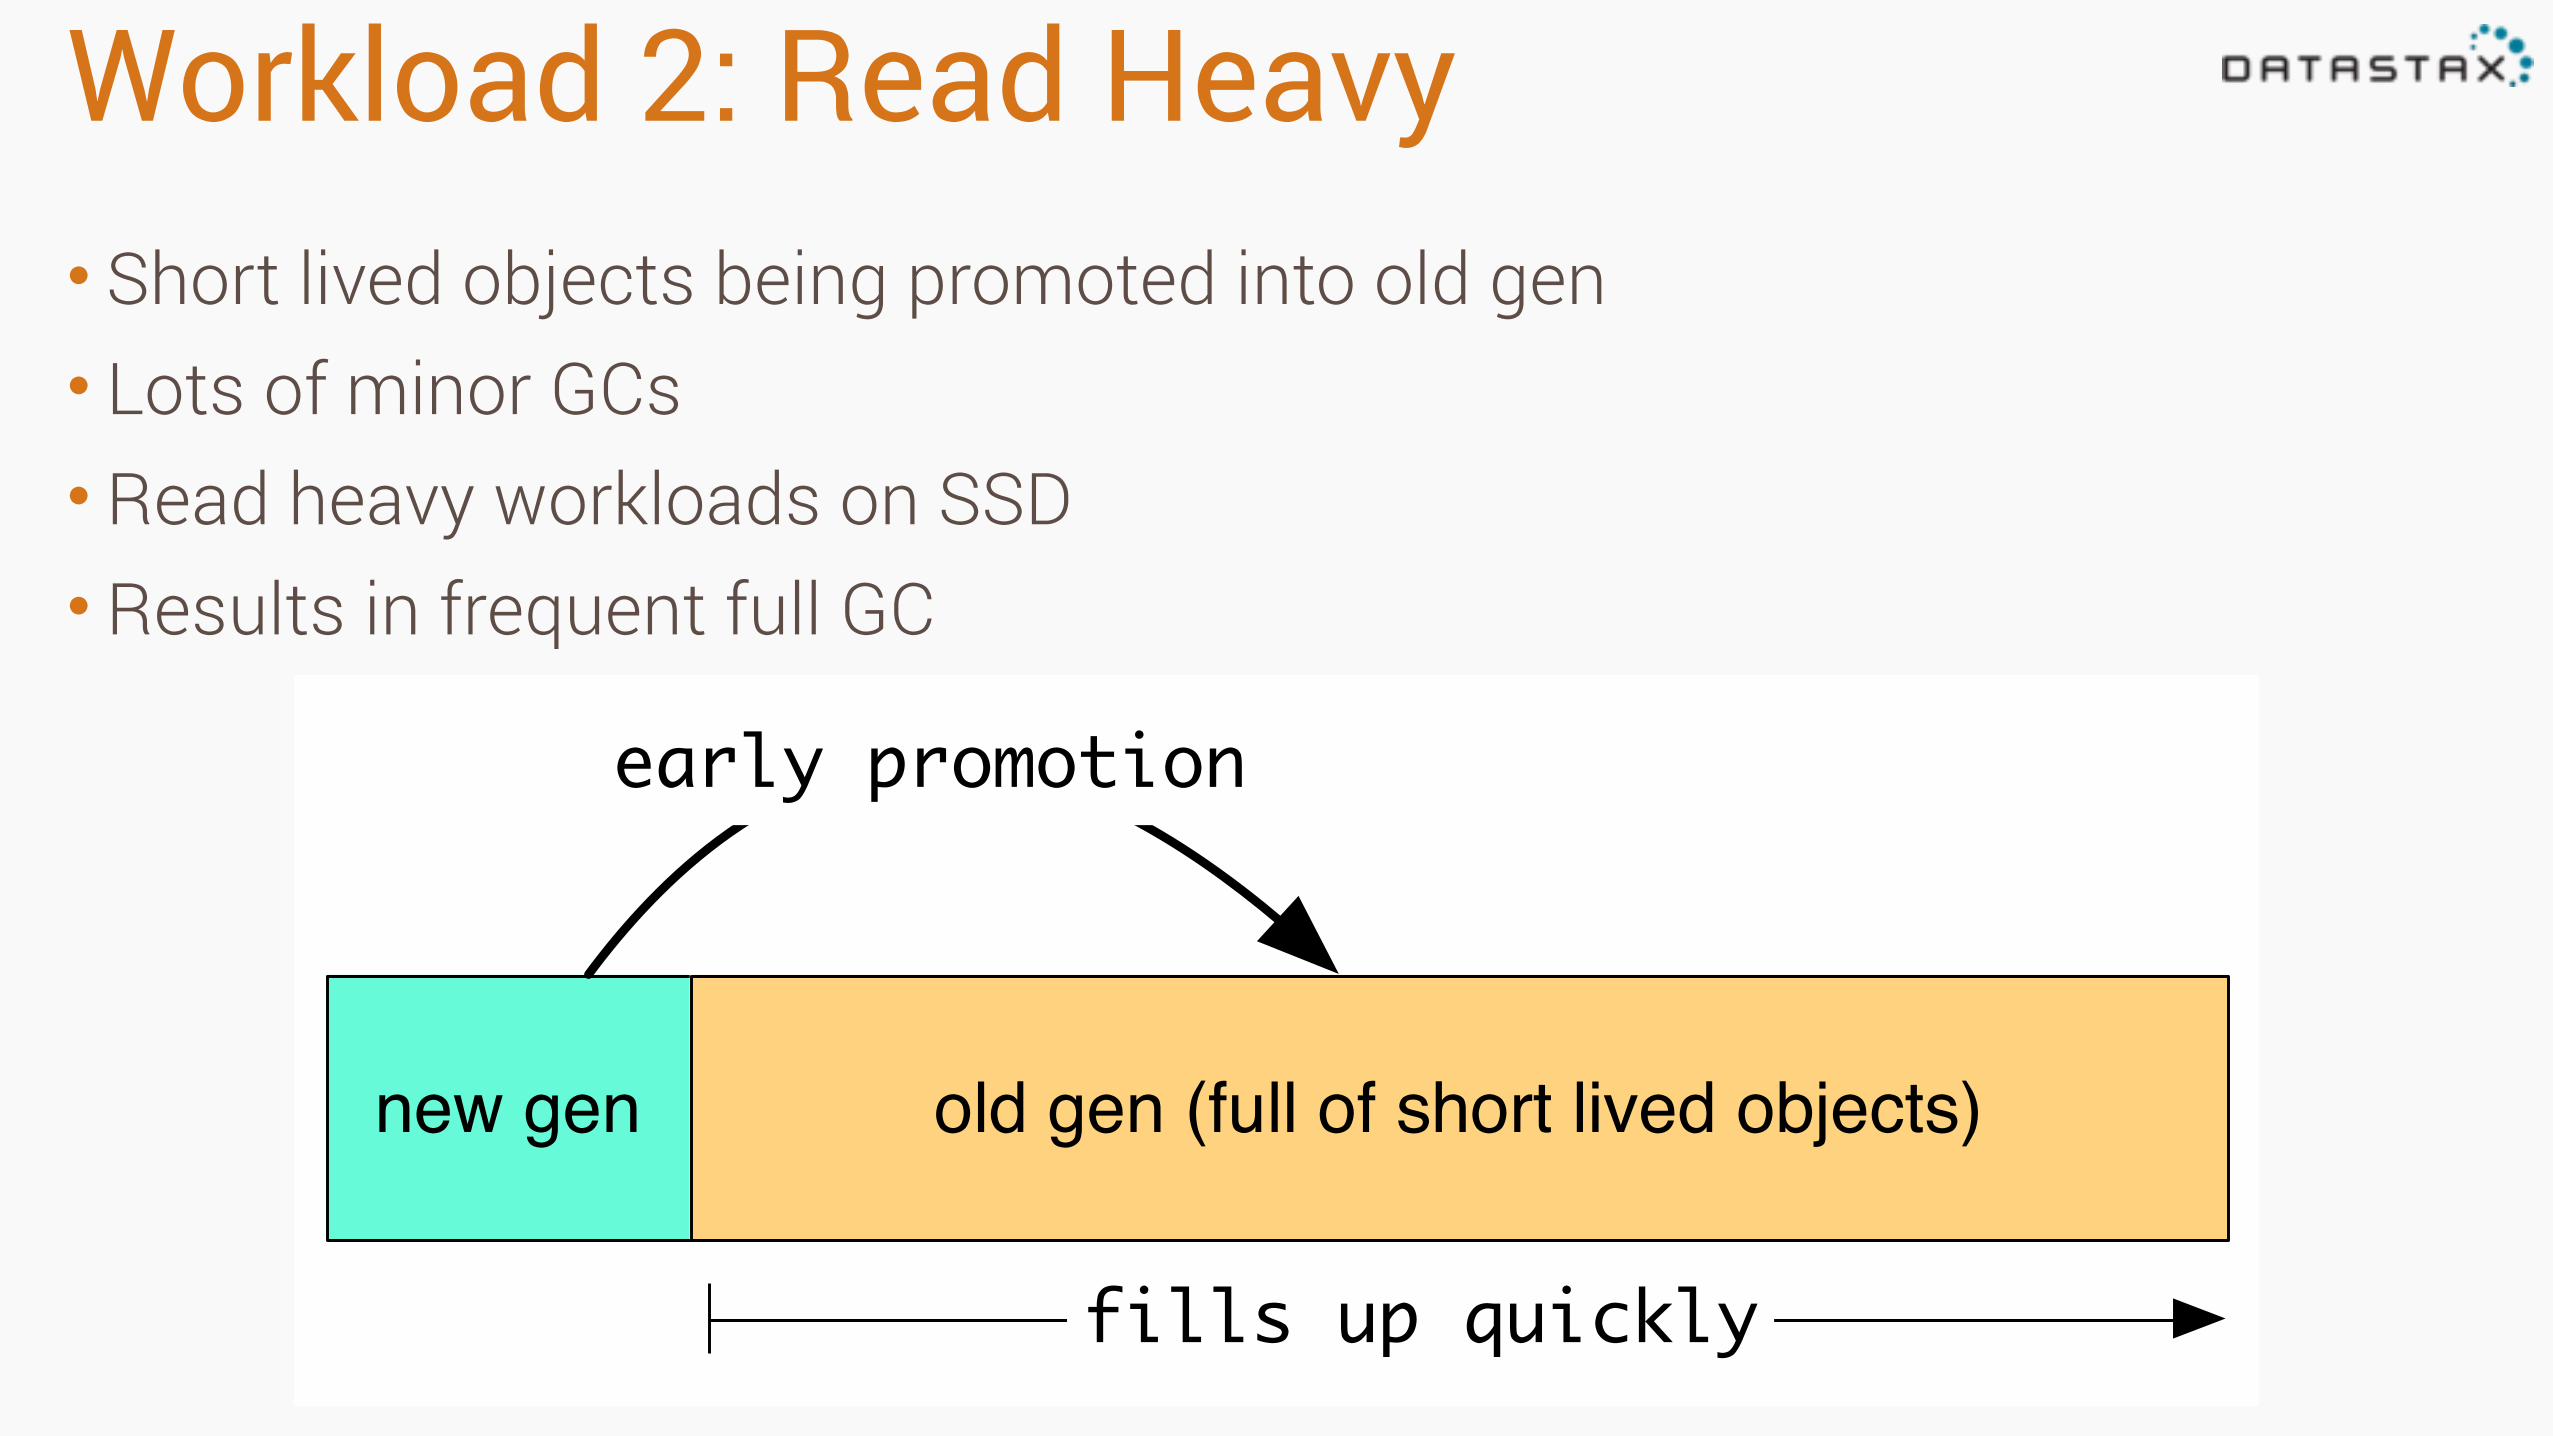
Workload 2: Read Heavy• Short lived objects being promoted into old gen • Lots of minor GCs • Read heavy workloads on SSD • Results in frequent full GC
new gen old gen (full of short lived objects)
early promotion
fills up quickly
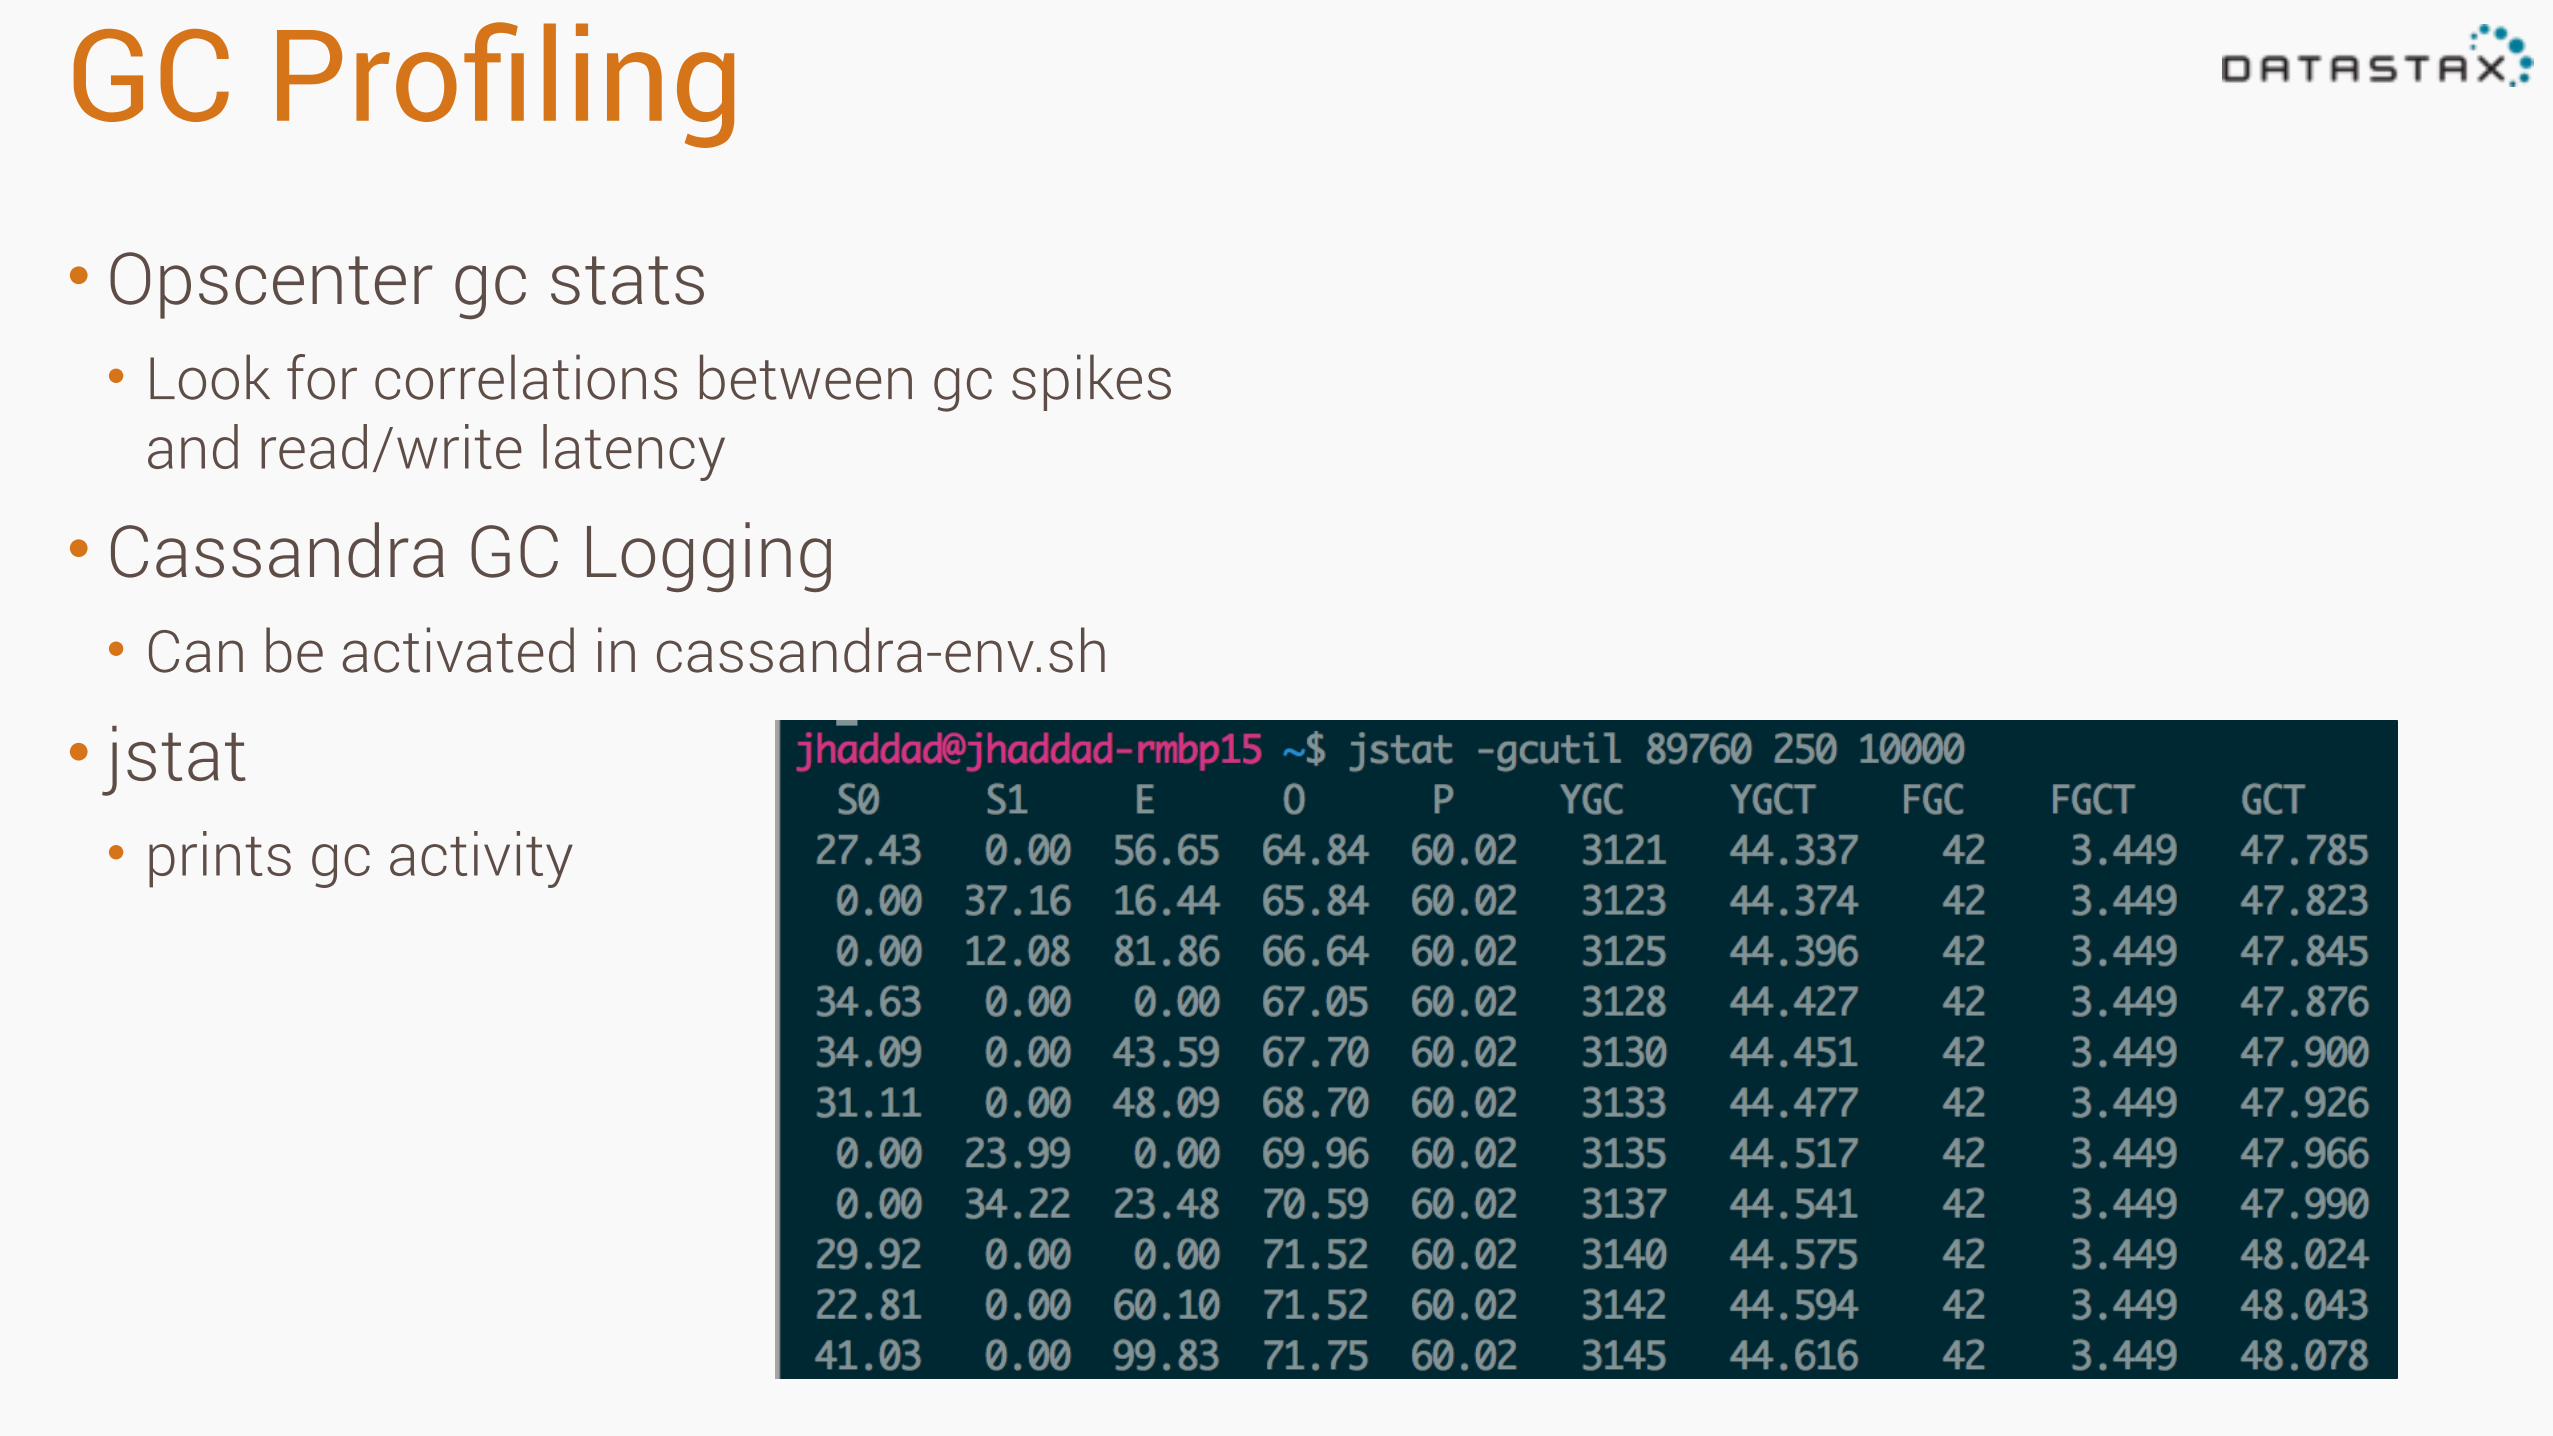
GC Profiling• Opscenter gc stats • Look for correlations between gc spikes
and read/write latency
• Cassandra GC Logging • Can be activated in cassandra-env.sh
• jstat • prints gc activity
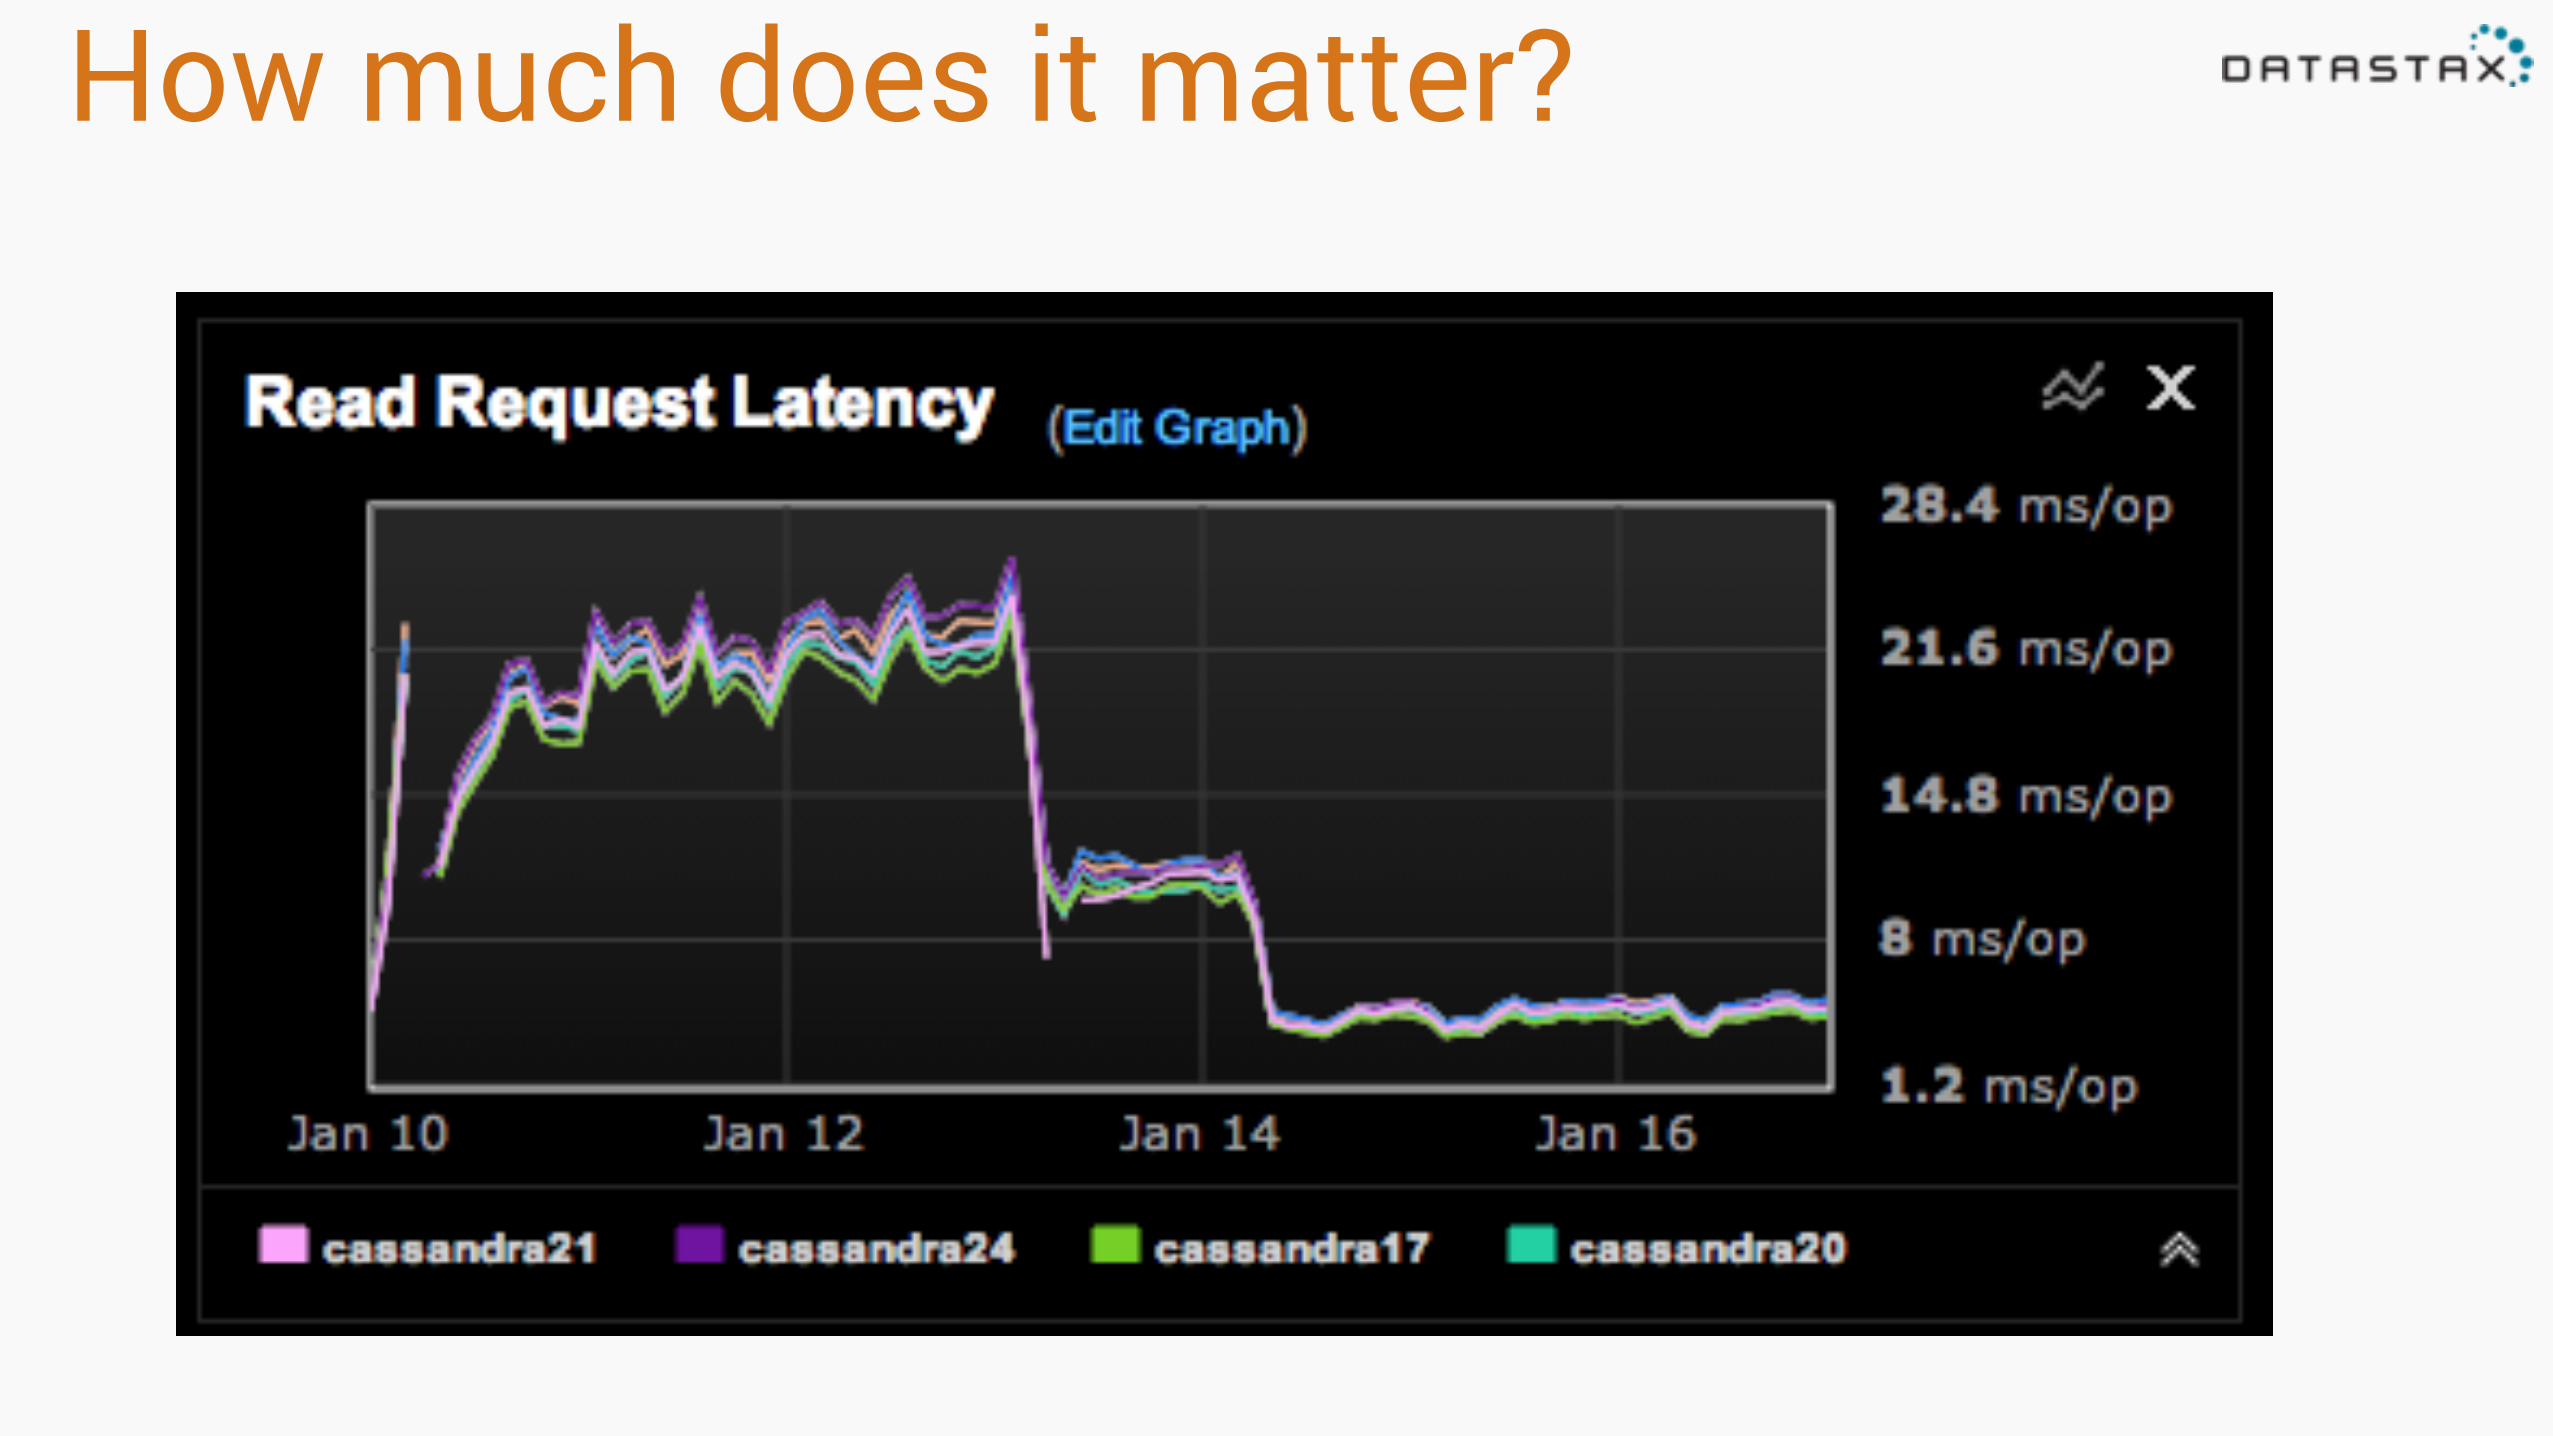
How much does it matter?
Stuff is broken, fix it!
Narrow Down the Problem• Is it even Cassandra? Check your
metrics! •Nodes flapping / failing • Check ops center • Dig into system metrics
• Slow queries • Find your bottleneck • Check system stats • JVM GC • Compaction • Histograms • Tracing
©2013 DataStax Confidential. Do not distribute without consent. 39