Casino Valuation—Business Valuation Concepts and ......Casino Valuation—Business Valuation...
96
Casino Valuation—Business Valuation Concepts and Industry Overview American Society of Appraisers International Appraisal Conference Las Vegas, Nevada October 20, 2015 Raymond Rath, ASA, CFA Globalview Advisors LLC
Transcript of Casino Valuation—Business Valuation Concepts and ......Casino Valuation—Business Valuation...
Casino Valuation—Business Valuation Concepts and
Industry OverviewAmerican Society of Appraisers
International Appraisal Conference
Las Vegas, NevadaOctober 20, 2015
Raymond Rath, ASA, CFAGlobalview Advisors LLC
Presenter’s Contact Information
Raymond Rath, ASA, CFAManaging DirectorGlobalview Advisors LLC19900 MacArthur Boulevard, Suite 810Irvine, CA [email protected]
1
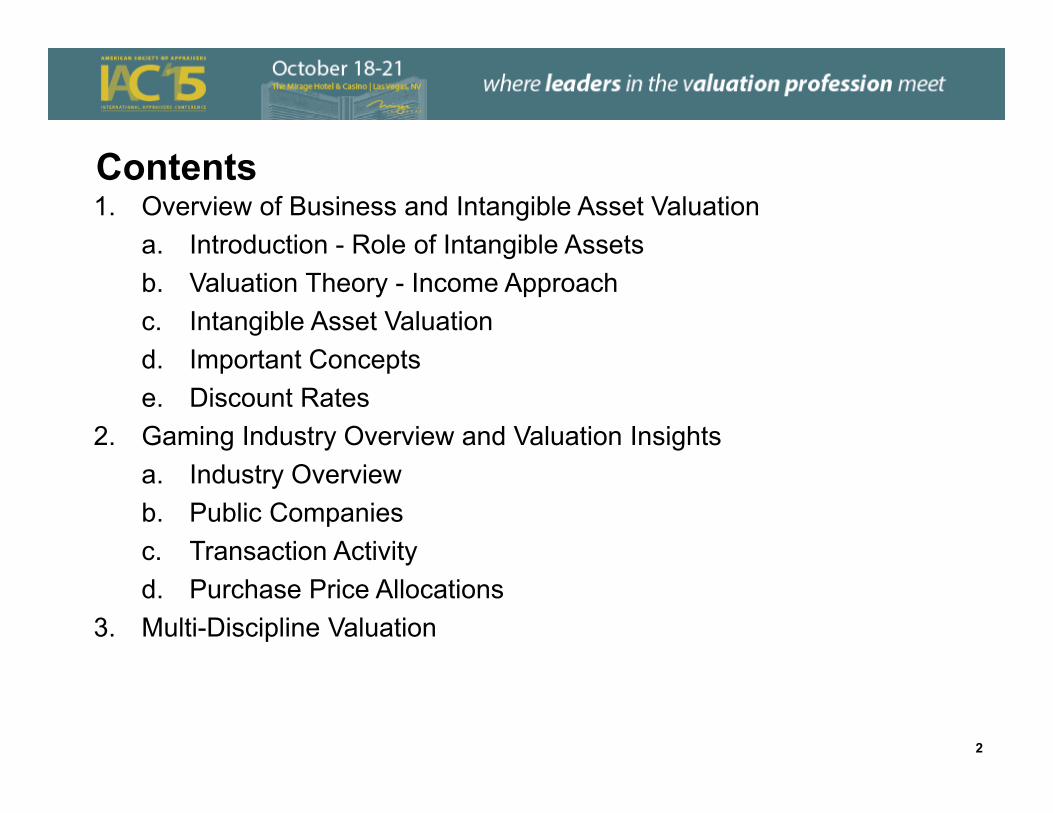
Contents1. Overview of Business and Intangible Asset Valuation
a. Introduction - Role of Intangible Assetsb. Valuation Theory - Income Approachc. Intangible Asset Valuationd. Important Conceptse. Discount Rates
2. Gaming Industry Overview and Valuation Insightsa. Industry Overviewb. Public Companiesc. Transaction Activityd. Purchase Price Allocations
3. Multi-Discipline Valuation
2
Section 1: Overview of Business and Intangible Asset Valuation
Introduction
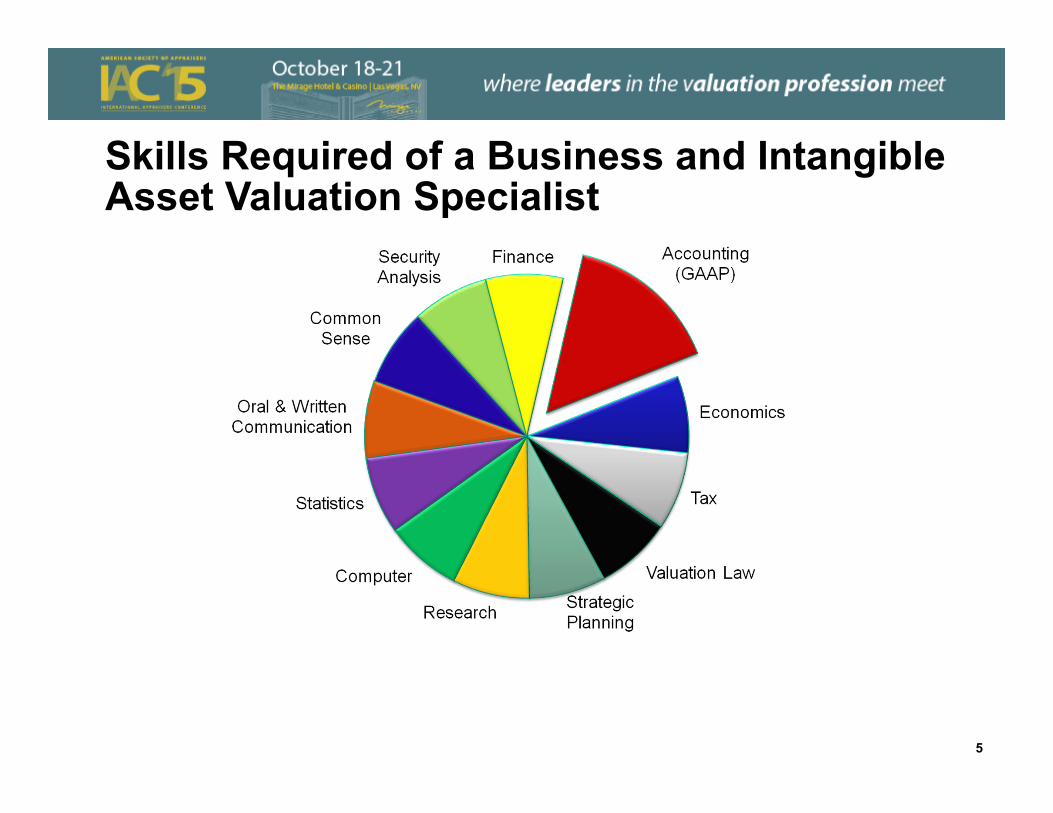
Skills Required of a Business and Intangible Asset Valuation Specialist
5
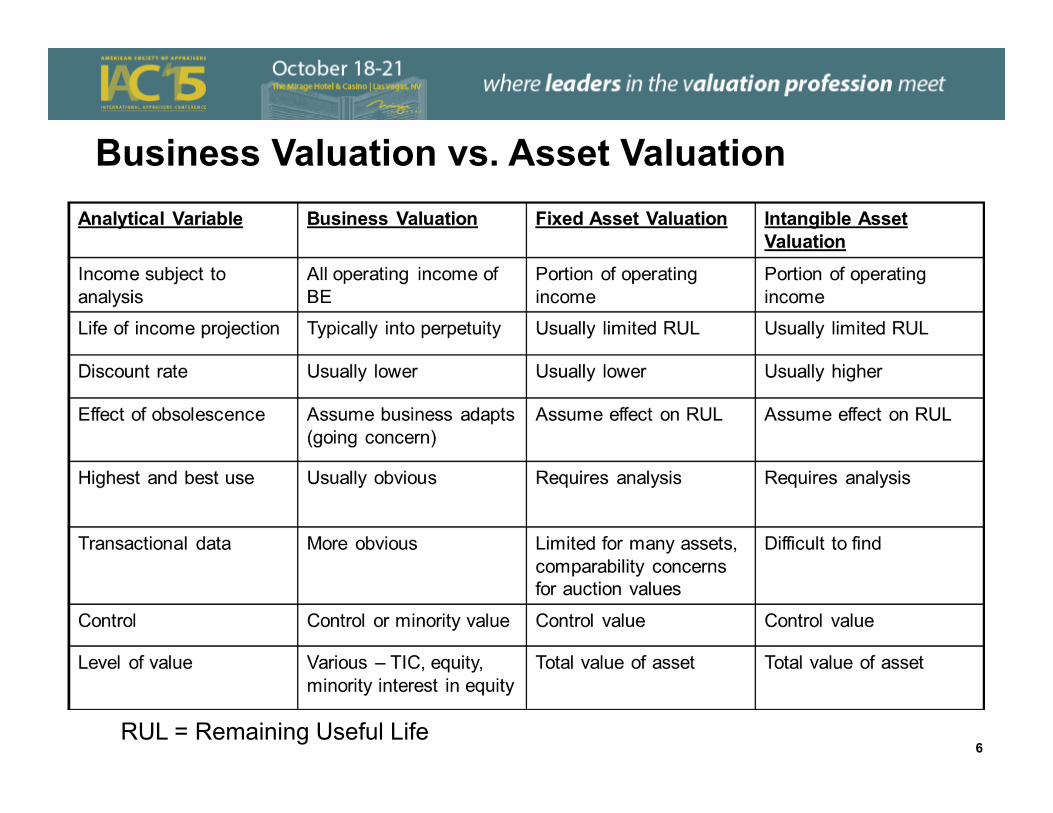
Business Valuation vs. Asset Valuation
RUL = Remaining Useful Life6
Differences between Real Estate and Businesses• Risk
• Typically greater risk for businesses• Broader forms of competition• Management much more important• Intangibles create value• Numerous other considerations
• Growth• Greater growth opportunities for businesses
• Potentially unlimited scale (Google, eBay, others)• New sites• New businesses• Acquisitions
• Implication – Greater difficulty estimating risk and wider range of possible growth rates suggest valuing a business will be more difficult in many cases
7
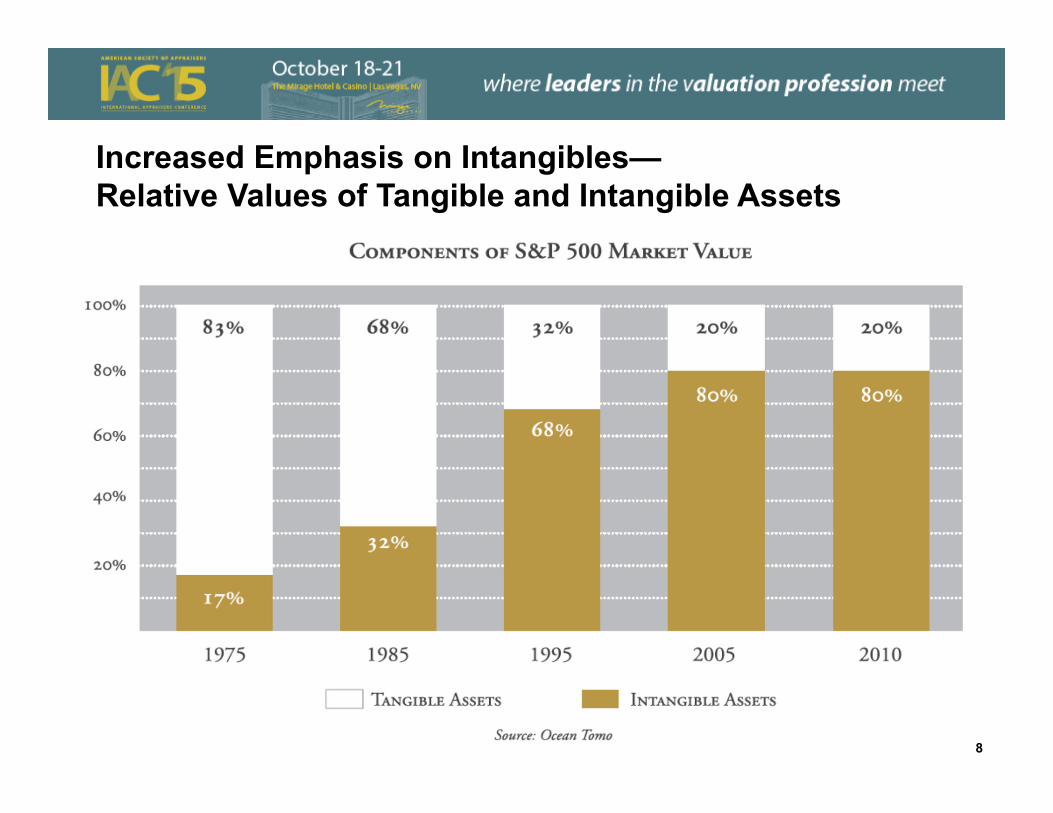
Increased Emphasis on Intangibles—Relative Values of Tangible and Intangible Assets
88
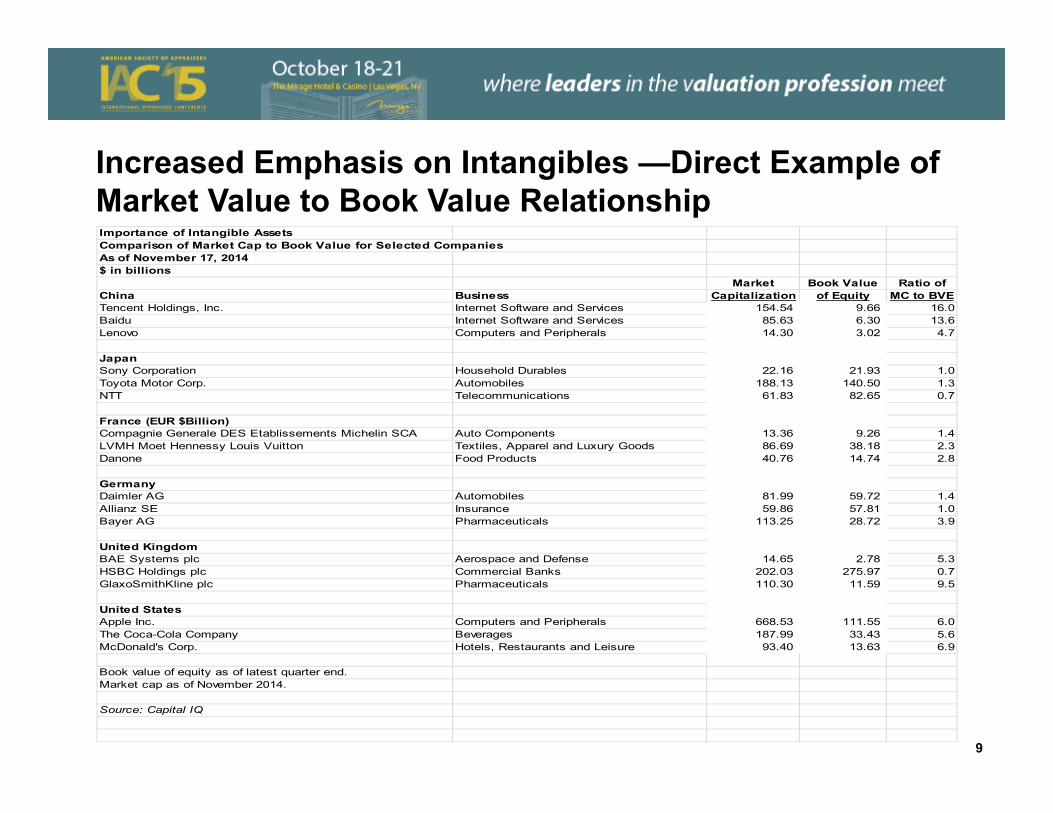
Increased Emphasis on Intangibles —Direct Example of Market Value to Book Value RelationshipImportance of Intangible AssetsComparison of Market Cap to Book Value for Selected CompaniesAs of November 17, 2014$ in billions
Market Book Value Ratio ofChina Business Capitalization of Equity MC to BVETencent Holdings, Inc. Internet Software and Services 154.54 9.66 16.0Baidu Internet Software and Services 85.63 6.30 13.6Lenovo Computers and Peripherals 14.30 3.02 4.7
JapanSony Corporation Household Durables 22.16 21.93 1.0Toyota Motor Corp. Automobiles 188.13 140.50 1.3NTT Telecommunications 61.83 82.65 0.7
France (EUR $Billion)Compagnie Generale DES Etablissements Michelin SCA Auto Components 13.36 9.26 1.4LVMH Moet Hennessy Louis Vuitton Textiles, Apparel and Luxury Goods 86.69 38.18 2.3Danone Food Products 40.76 14.74 2.8
GermanyDaimler AG Automobiles 81.99 59.72 1.4Allianz SE Insurance 59.86 57.81 1.0Bayer AG Pharmaceuticals 113.25 28.72 3.9
United KingdomBAE Systems plc Aerospace and Defense 14.65 2.78 5.3HSBC Holdings plc Commercial Banks 202.03 275.97 0.7GlaxoSmithKline plc Pharmaceuticals 110.30 11.59 9.5
United StatesApple Inc. Computers and Peripherals 668.53 111.55 6.0The Coca-Cola Company Beverages 187.99 33.43 5.6McDonald's Corp. Hotels, Restaurants and Leisure 93.40 13.63 6.9
Book value of equity as of latest quarter end.Market cap as of November 2014.
Source: Capital IQ
9
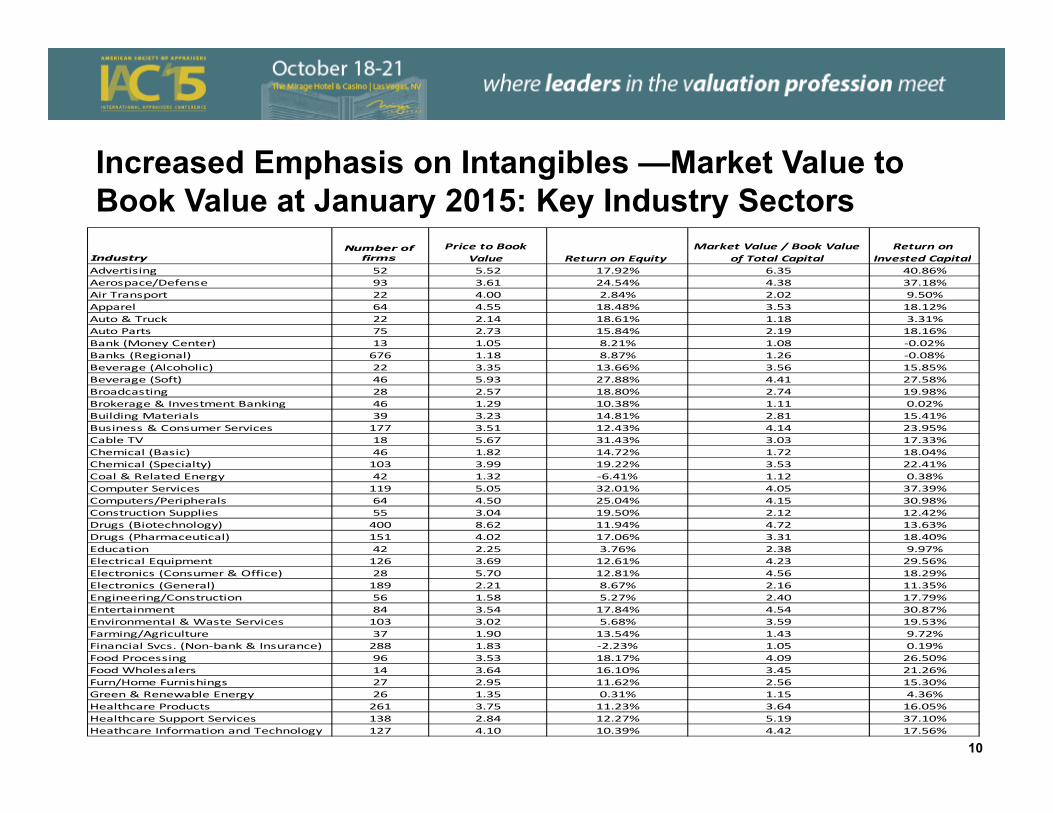
Increased Emphasis on Intangibles —Market Value to Book Value at January 2015: Key Industry Sectors
IndustryNumber of
firmsPrice to Book
Value Return on EquityMarket Value / Book Value
of Total CapitalReturn on
Invested CapitalAdvertising 52 5.52 17.92% 6.35 40.86%Aerospace/Defense 93 3.61 24.54% 4.38 37.18%Air Transport 22 4.00 2.84% 2.02 9.50%Apparel 64 4.55 18.48% 3.53 18.12%Auto & Truck 22 2.14 18.61% 1.18 3.31%Auto Parts 75 2.73 15.84% 2.19 18.16%Bank (Money Center) 13 1.05 8.21% 1.08 ‐0.02%Banks (Regional) 676 1.18 8.87% 1.26 ‐0.08%Beverage (Alcoholic) 22 3.35 13.66% 3.56 15.85%Beverage (Soft) 46 5.93 27.88% 4.41 27.58%Broadcasting 28 2.57 18.80% 2.74 19.98%Brokerage & Investment Banking 46 1.29 10.38% 1.11 0.02%Building Materials 39 3.23 14.81% 2.81 15.41%Business & Consumer Services 177 3.51 12.43% 4.14 23.95%Cable TV 18 5.67 31.43% 3.03 17.33%Chemical (Basic) 46 1.82 14.72% 1.72 18.04%Chemical (Specialty) 103 3.99 19.22% 3.53 22.41%Coal & Related Energy 42 1.32 ‐6.41% 1.12 0.38%Computer Services 119 5.05 32.01% 4.05 37.39%Computers/Peripherals 64 4.50 25.04% 4.15 30.98%Construction Supplies 55 3.04 19.50% 2.12 12.42%Drugs (Biotechnology) 400 8.62 11.94% 4.72 13.63%Drugs (Pharmaceutical) 151 4.02 17.06% 3.31 18.40%Education 42 2.25 3.76% 2.38 9.97%Electrical Equipment 126 3.69 12.61% 4.23 29.56%Electronics (Consumer & Office) 28 5.70 12.81% 4.56 18.29%Electronics (General) 189 2.21 8.67% 2.16 11.35%Engineering/Construction 56 1.58 5.27% 2.40 17.79%Entertainment 84 3.54 17.84% 4.54 30.87%Environmental & Waste Services 103 3.02 5.68% 3.59 19.53%Farming/Agriculture 37 1.90 13.54% 1.43 9.72%Financial Svcs. (Non‐bank & Insurance) 288 1.83 ‐2.23% 1.05 0.19%Food Processing 96 3.53 18.17% 4.09 26.50%Food Wholesalers 14 3.64 16.10% 3.45 21.26%Furn/Home Furnishings 27 2.95 11.62% 2.56 15.30%Green & Renewable Energy 26 1.35 0.31% 1.15 4.36%Healthcare Products 261 3.75 11.23% 3.64 16.05%Healthcare Support Services 138 2.84 12.27% 5.19 37.10%Heathcare Information and Technology 127 4.10 10.39% 4.42 17.56%
10
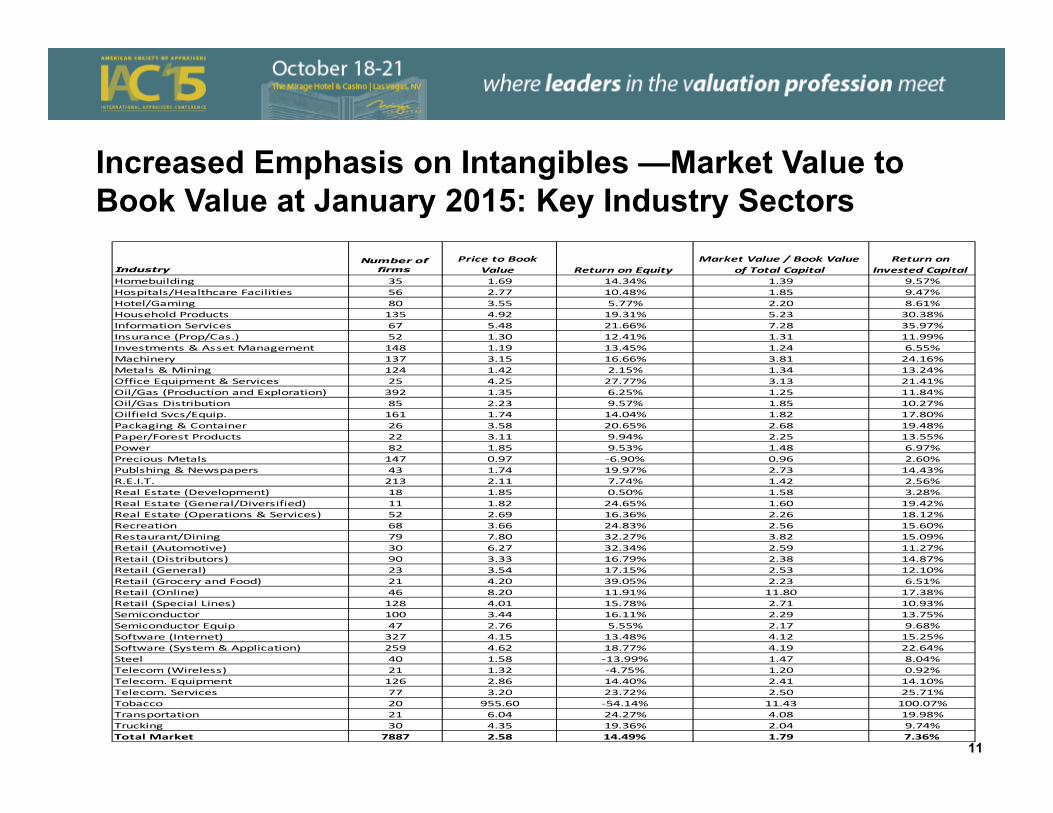
Increased Emphasis on Intangibles —Market Value to Book Value at January 2015: Key Industry Sectors
IndustryNumber of
firmsPrice to Book
Value Return on EquityMarket Value / Book Value
of Total CapitalReturn on
Invested CapitalHomebuilding 35 1.69 14.34% 1.39 9.57%Hospitals/Healthcare Facilities 56 2.77 10.48% 1.85 9.47%Hotel/Gaming 80 3.55 5.77% 2.20 8.61%Household Products 135 4.92 19.31% 5.23 30.38%Information Services 67 5.48 21.66% 7.28 35.97%Insurance (Prop/Cas.) 52 1.30 12.41% 1.31 11.99%Investments & Asset Management 148 1.19 13.45% 1.24 6.55%Machinery 137 3.15 16.66% 3.81 24.16%Metals & Mining 124 1.42 2.15% 1.34 13.24%Office Equipment & Services 25 4.25 27.77% 3.13 21.41%Oil/Gas (Production and Exploration) 392 1.35 6.25% 1.25 11.84%Oil/Gas Distribution 85 2.23 9.57% 1.85 10.27%Oilfield Svcs/Equip. 161 1.74 14.04% 1.82 17.80%Packaging & Container 26 3.58 20.65% 2.68 19.48%Paper/Forest Products 22 3.11 9.94% 2.25 13.55%Power 82 1.85 9.53% 1.48 6.97%Precious Metals 147 0.97 ‐6.90% 0.96 2.60%Publshing & Newspapers 43 1.74 19.97% 2.73 14.43%R.E.I.T. 213 2.11 7.74% 1.42 2.56%Real Estate (Development) 18 1.85 0.50% 1.58 3.28%Real Estate (General/Diversified) 11 1.82 24.65% 1.60 19.42%Real Estate (Operations & Services) 52 2.69 16.36% 2.26 18.12%Recreation 68 3.66 24.83% 2.56 15.60%Restaurant/Dining 79 7.80 32.27% 3.82 15.09%Retail (Automotive) 30 6.27 32.34% 2.59 11.27%Retail (Distributors) 90 3.33 16.79% 2.38 14.87%Retail (General) 23 3.54 17.15% 2.53 12.10%Retail (Grocery and Food) 21 4.20 39.05% 2.23 6.51%Retail (Online) 46 8.20 11.91% 11.80 17.38%Retail (Special Lines) 128 4.01 15.78% 2.71 10.93%Semiconductor 100 3.44 16.11% 2.29 13.75%Semiconductor Equip 47 2.76 5.55% 2.17 9.68%Software (Internet) 327 4.15 13.48% 4.12 15.25%Software (System & Application) 259 4.62 18.77% 4.19 22.64%Steel 40 1.58 ‐13.99% 1.47 8.04%Telecom (Wireless) 21 1.32 ‐4.75% 1.20 0.92%Telecom. Equipment 126 2.86 14.40% 2.41 14.10%Telecom. Services 77 3.20 23.72% 2.50 25.71%Tobacco 20 955.60 ‐54.14% 11.43 100.07%Transportation 21 6.04 24.27% 4.08 19.98%Trucking 30 4.35 19.36% 2.04 9.74%Total Market 7887 2.58 14.49% 1.79 7.36%
11
Five Primary Groups of Intangibles• Various sources have developed listings of intangible assets. US
GAAP and International Financial Reporting Standards (IFRS) have been vetted publicly and are presented.
• Accounting Standards Codification 805 Business Combinations (“ASC 805”) lists five principal classes of intangible assets:• Contract–based intangibles• Marketing-related intangibles• Customer or supplier-related intangibles• Technology-related intangibles• Artistic-related intangibles
• Virtually identical guidance is provided in International Financial Reporting Standard 3 Business Combinations (“IFRS 3”).
12
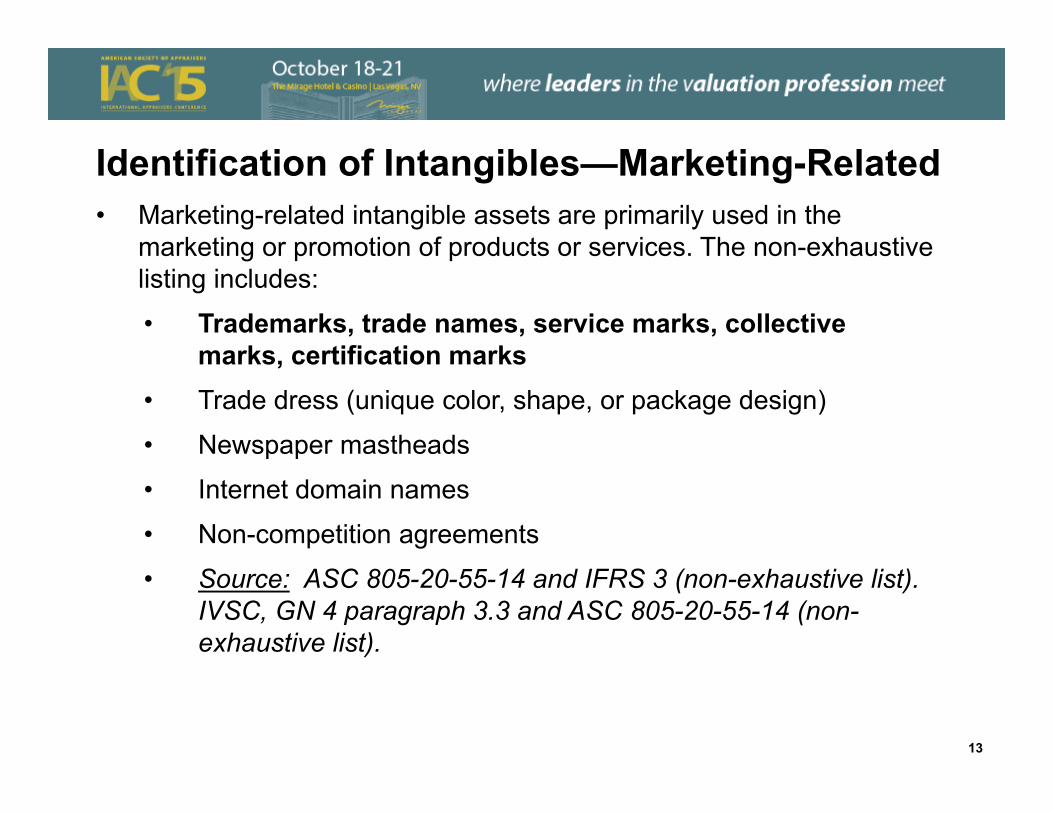
Identification of Intangibles—Marketing-Related• Marketing-related intangible assets are primarily used in the
marketing or promotion of products or services. The non-exhaustive listing includes:
• Trademarks, trade names, service marks, collective marks, certification marks
• Trade dress (unique color, shape, or package design)
• Newspaper mastheads
• Internet domain names
• Non-competition agreements
• Source: ASC 805-20-55-14 and IFRS 3 (non-exhaustive list). IVSC, GN 4 paragraph 3.3 and ASC 805-20-55-14 (non-exhaustive list).
13
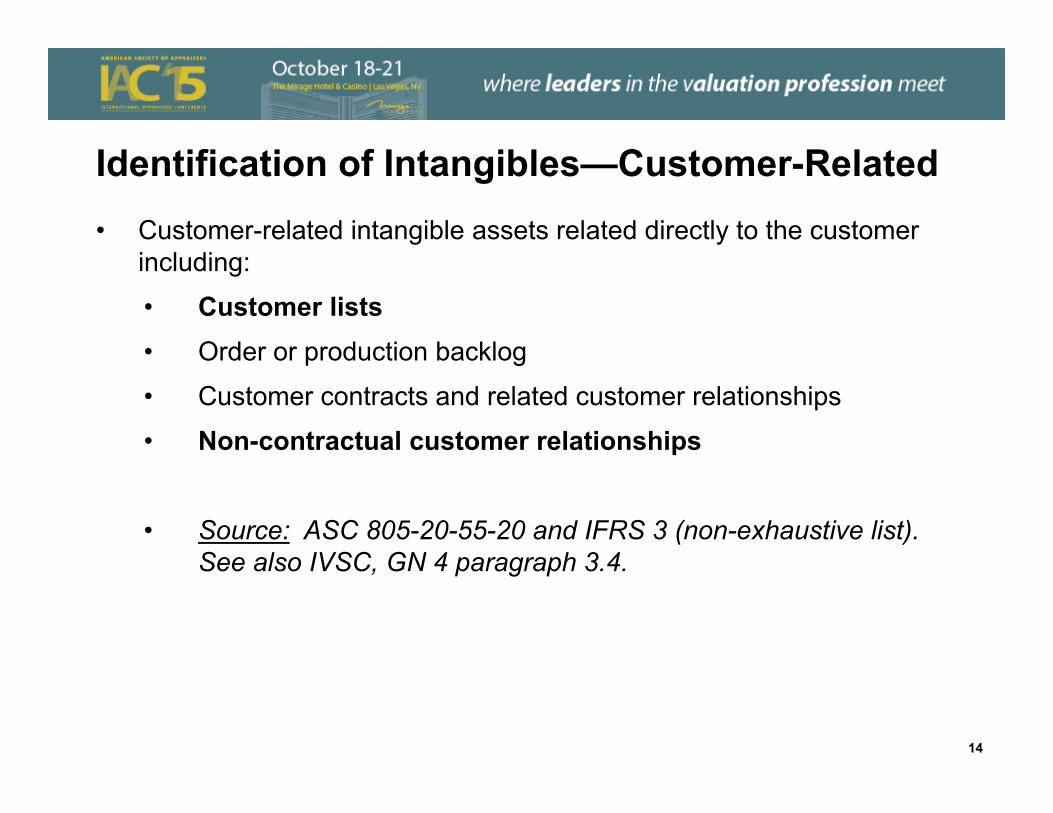
Identification of Intangibles—Customer-Related• Customer-related intangible assets related directly to the customer
including:
• Customer lists• Order or production backlog
• Customer contracts and related customer relationships
• Non-contractual customer relationships
• Source: ASC 805-20-55-20 and IFRS 3 (non-exhaustive list). See also IVSC, GN 4 paragraph 3.4.
14
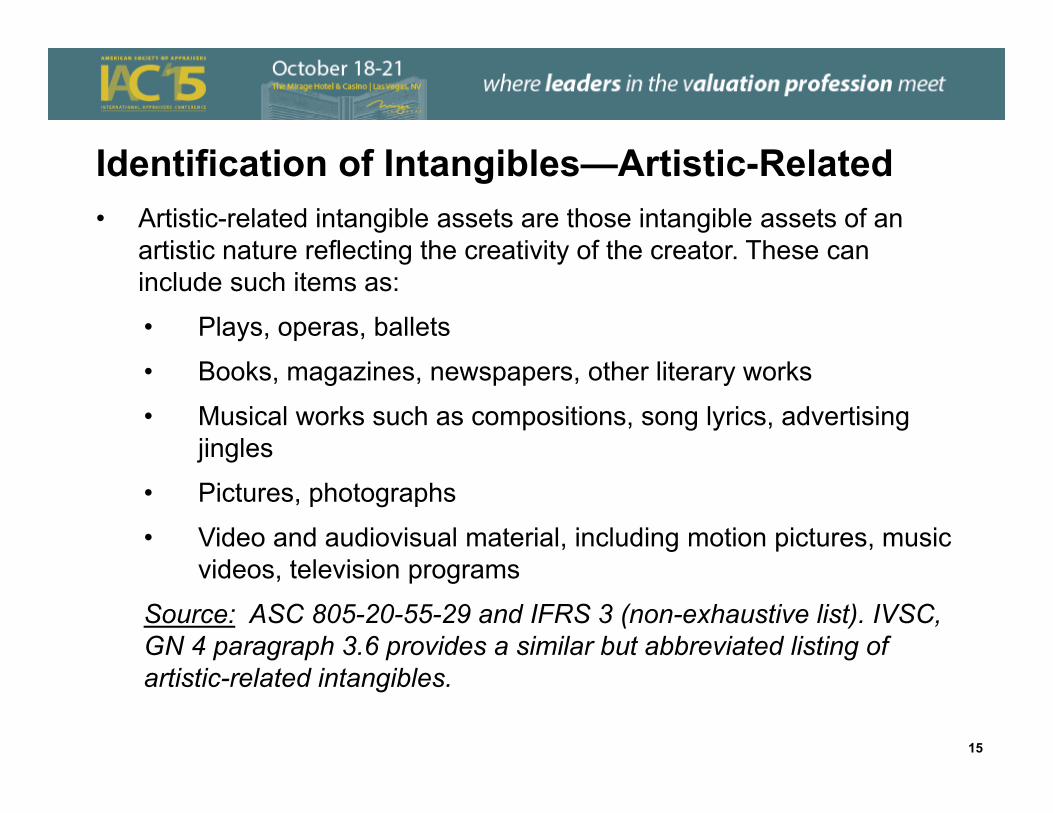
Identification of Intangibles—Artistic-Related• Artistic-related intangible assets are those intangible assets of an
artistic nature reflecting the creativity of the creator. These can include such items as:
• Plays, operas, ballets
• Books, magazines, newspapers, other literary works
• Musical works such as compositions, song lyrics, advertising jingles
• Pictures, photographs
• Video and audiovisual material, including motion pictures, music videos, television programs
Source: ASC 805-20-55-29 and IFRS 3 (non-exhaustive list). IVSC, GN 4 paragraph 3.6 provides a similar but abbreviated listing of artistic-related intangibles.
15
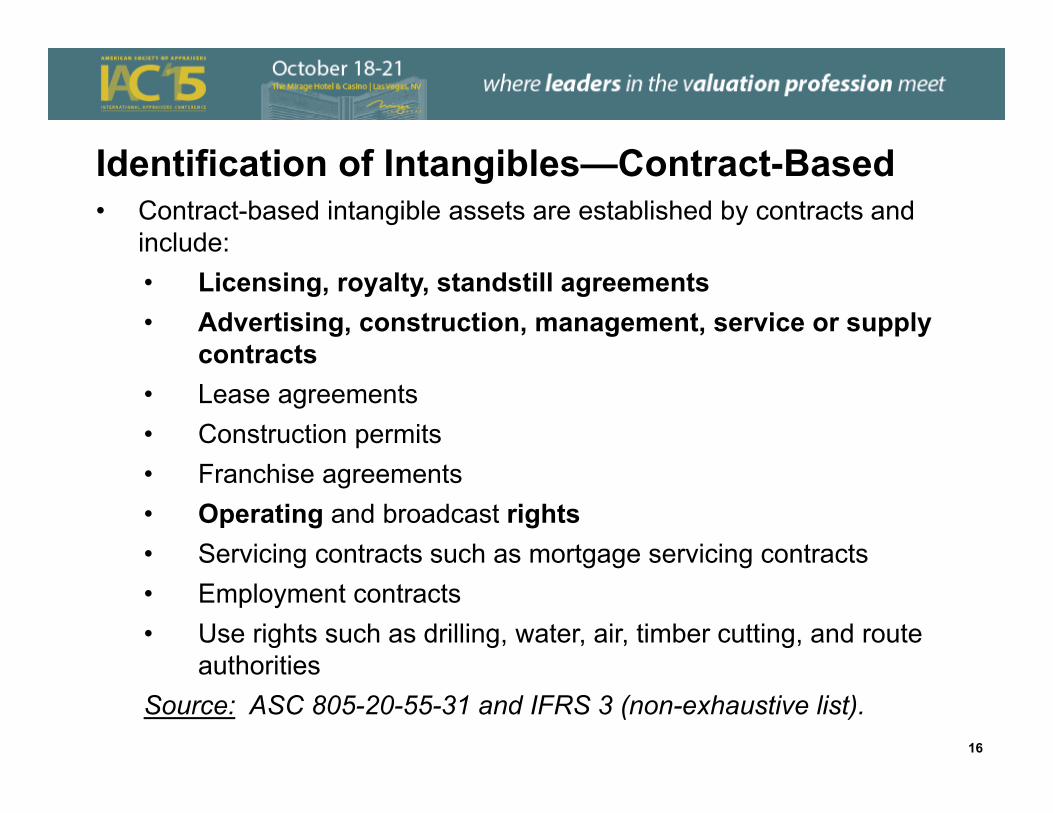
Identification of Intangibles—Contract-Based• Contract-based intangible assets are established by contracts and
include: • Licensing, royalty, standstill agreements• Advertising, construction, management, service or supply
contracts• Lease agreements• Construction permits• Franchise agreements• Operating and broadcast rights• Servicing contracts such as mortgage servicing contracts• Employment contracts• Use rights such as drilling, water, air, timber cutting, and route
authoritiesSource: ASC 805-20-55-31 and IFRS 3 (non-exhaustive list).
16
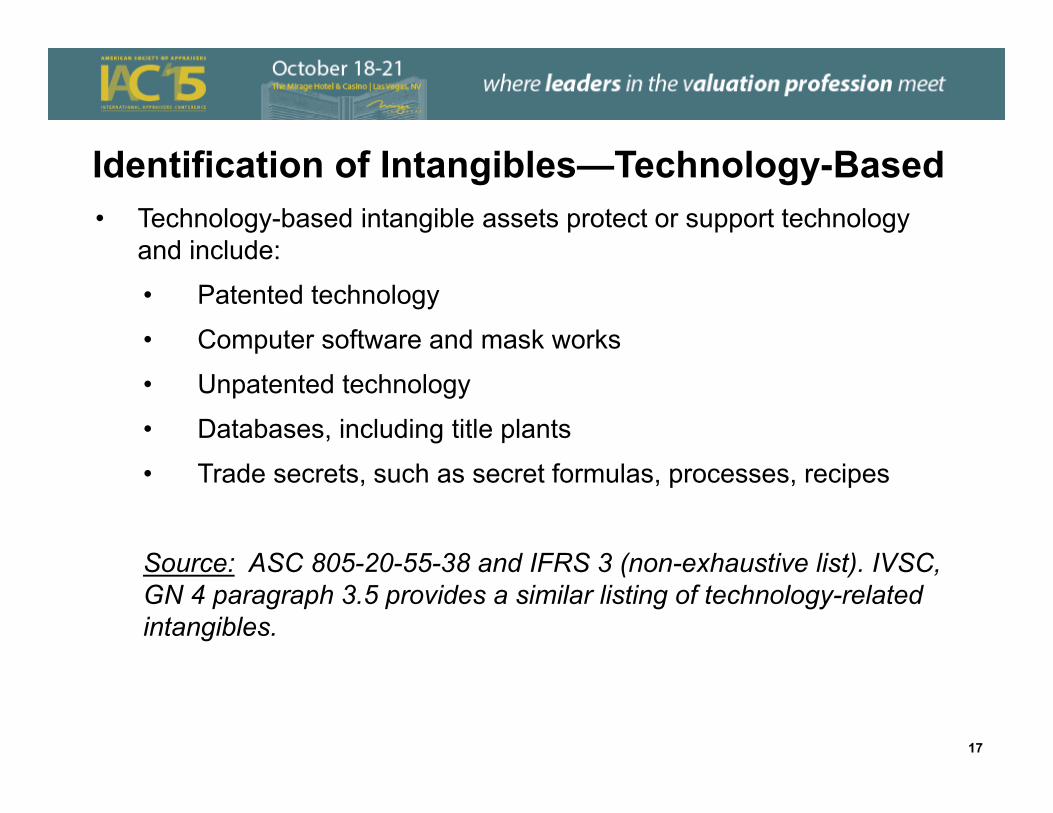
Identification of Intangibles—Technology-Based• Technology-based intangible assets protect or support technology
and include:
• Patented technology
• Computer software and mask works
• Unpatented technology
• Databases, including title plants
• Trade secrets, such as secret formulas, processes, recipes
Source: ASC 805-20-55-38 and IFRS 3 (non-exhaustive list). IVSC, GN 4 paragraph 3.5 provides a similar listing of technology-related intangibles.
17
Valuation Theory
Valuation Theory — Importance of the Income Approach
• Valuation is forward looking • Value should reflect future cash flows rather than historical
amounts.• Historical performance can be meaningful as an indicator of
future performance• Obsolescence from physical, functional and economic factors could
lower value of an asset due to a potential reduction in future cash flows
19
Income Approach—Business Valuation: Alternative Methods• For Income Approach, two methods are available to value a business:
• Discounted Cash Flow Method (“DCF Method”)• Project cash flows until cash flows stabilize (as %)• Residual value (typically from Capitalized Income Method)• Cash flow includes deductions for capital expenditures and any
working capital required to support growth.• Capitalized Income Method (“CIM”)
• Assumes growth is stabilized as a percent• Three key inputs include
• Cash flow base• Discount rate• Long-term growth rate
20
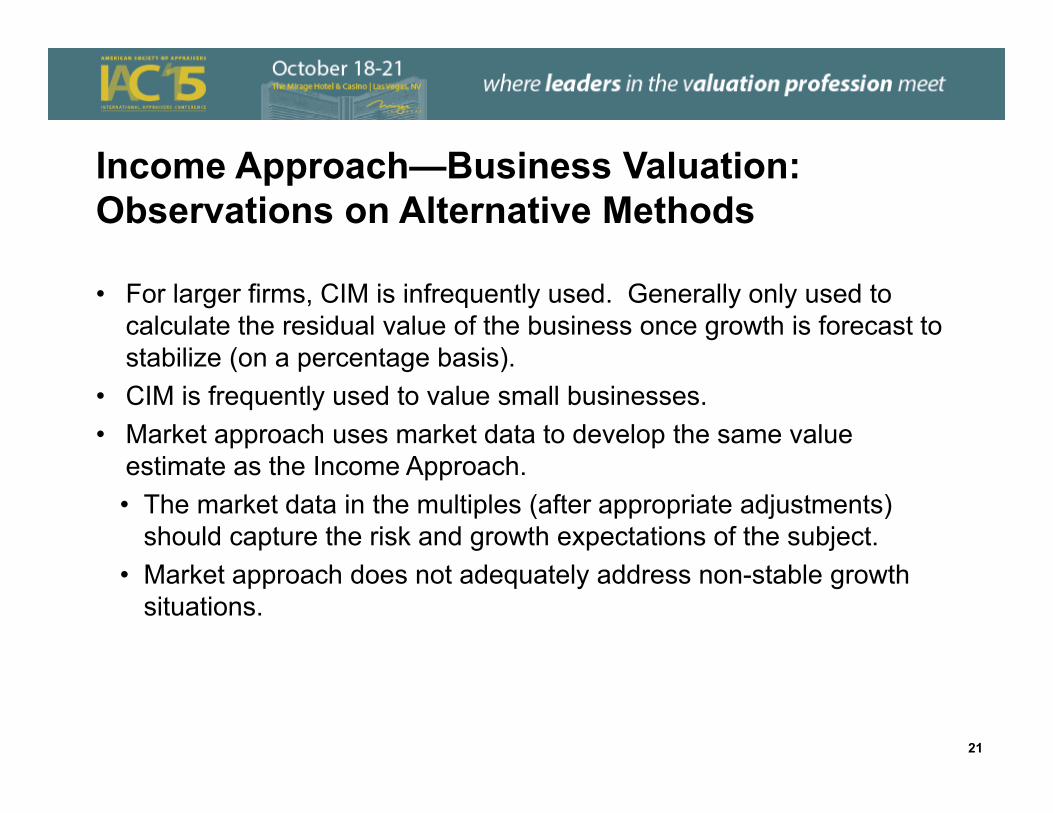
Income Approach—Business Valuation: Observations on Alternative Methods
• For larger firms, CIM is infrequently used. Generally only used to calculate the residual value of the business once growth is forecast to stabilize (on a percentage basis).
• CIM is frequently used to value small businesses.• Market approach uses market data to develop the same value
estimate as the Income Approach. • The market data in the multiples (after appropriate adjustments)
should capture the risk and growth expectations of the subject.• Market approach does not adequately address non-stable growth
situations.
21
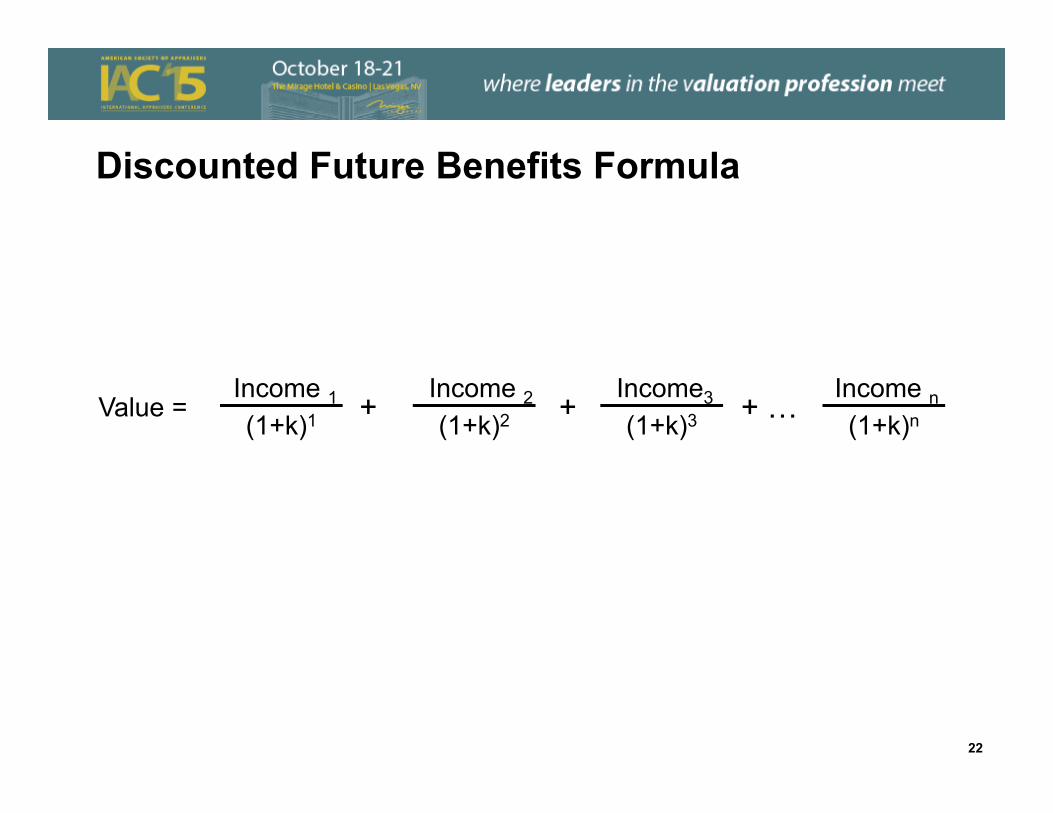
Discounted Future Benefits Formula
Value = Income 1(1+k)1
Income 2(1+k)2
Income3
(1+k)3Income n(1+k)n+ + + …
22
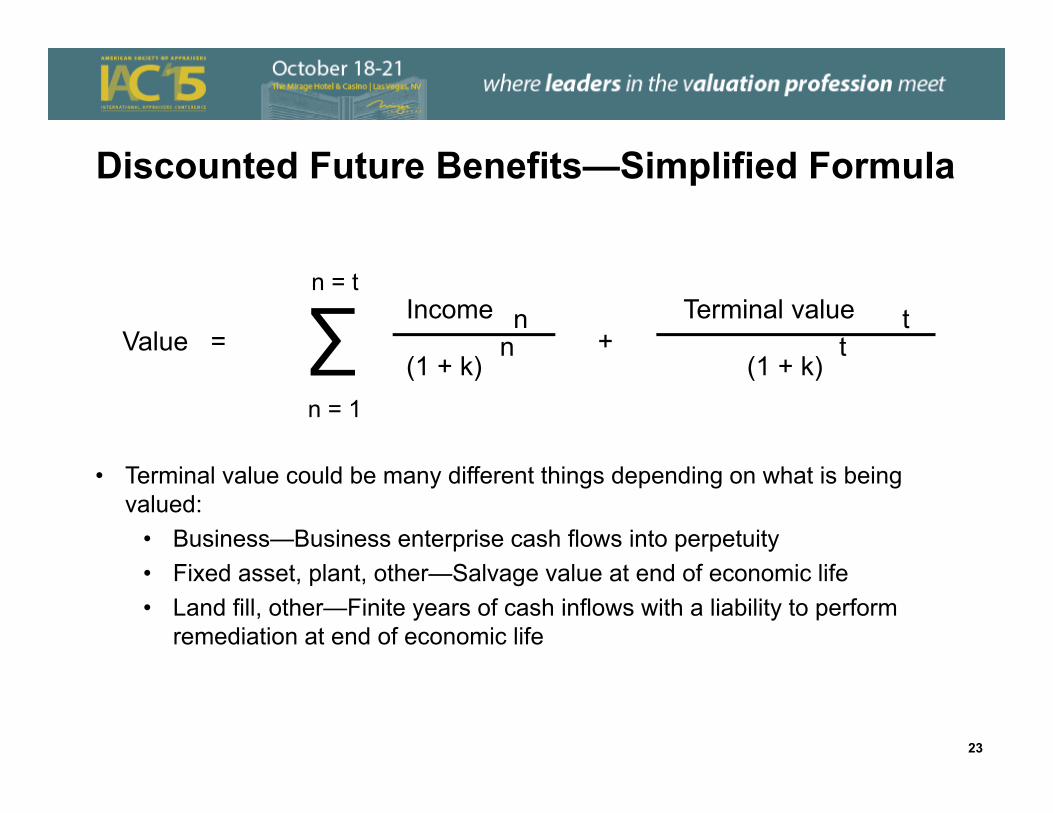
Discounted Future Benefits—Simplified Formula
• Terminal value could be many different things depending on what is being valued:
• Business—Business enterprise cash flows into perpetuity • Fixed asset, plant, other—Salvage value at end of economic life• Land fill, other—Finite years of cash inflows with a liability to perform
remediation at end of economic life
∑n = t
Income n Terminal value t
(1 + k)n
(1 + k)t
n = 1
Value = +
23
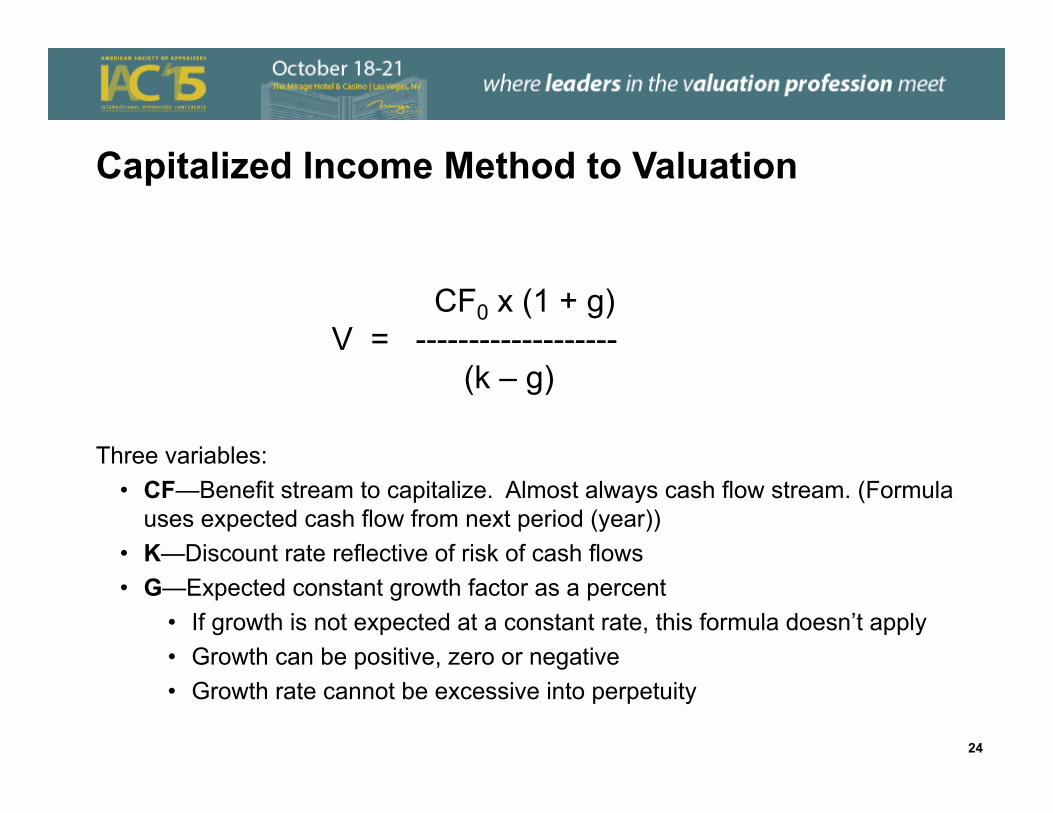
Capitalized Income Method to Valuation
Three variables:• CF—Benefit stream to capitalize. Almost always cash flow stream. (Formula
uses expected cash flow from next period (year))• K—Discount rate reflective of risk of cash flows• G—Expected constant growth factor as a percent
• If growth is not expected at a constant rate, this formula doesn’t apply• Growth can be positive, zero or negative• Growth rate cannot be excessive into perpetuity
CF0 x (1 + g)V = -------------------
(k – g)
24
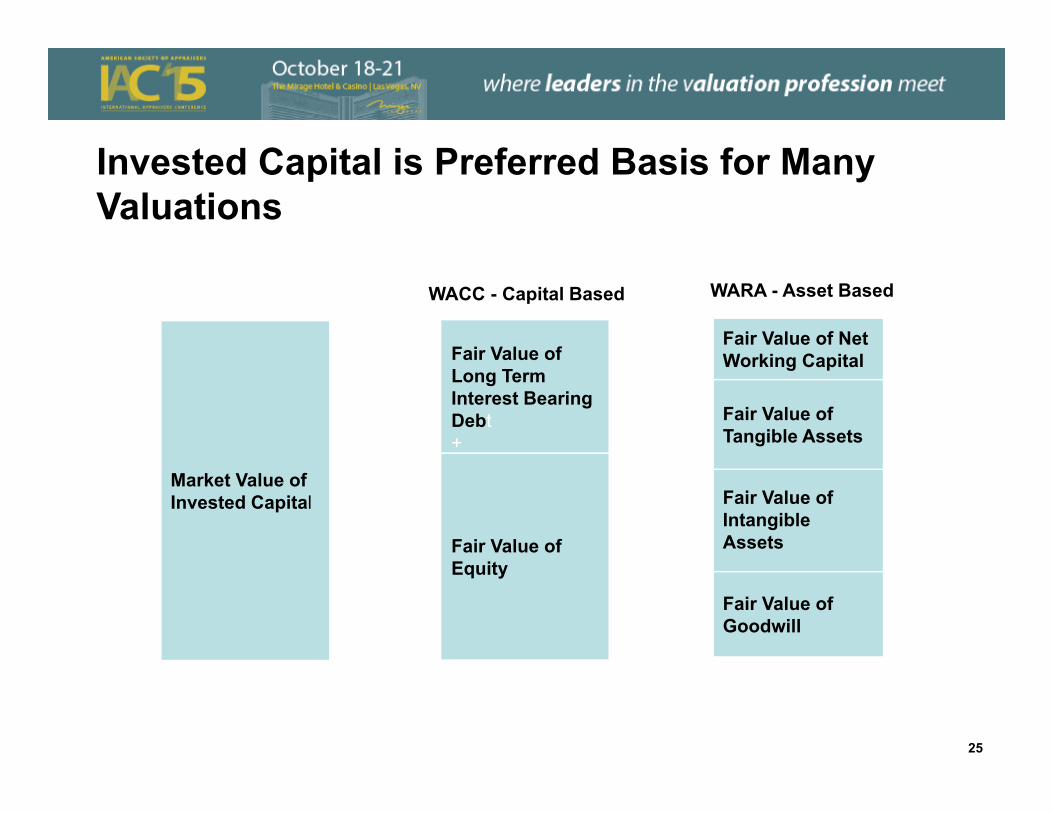
Invested Capital is Preferred Basis for Many Valuations
Fair Value of Long Term Interest Bearing Debt+
Fair Value of Equity
Market Value of Invested Capital
= =
WACC - Capital Based WARA - Asset Based
Fair Value of Intangible Assets
Fair Value of Tangible Assets
Fair Value of Net Working Capital
Fair Value of Goodwill
25
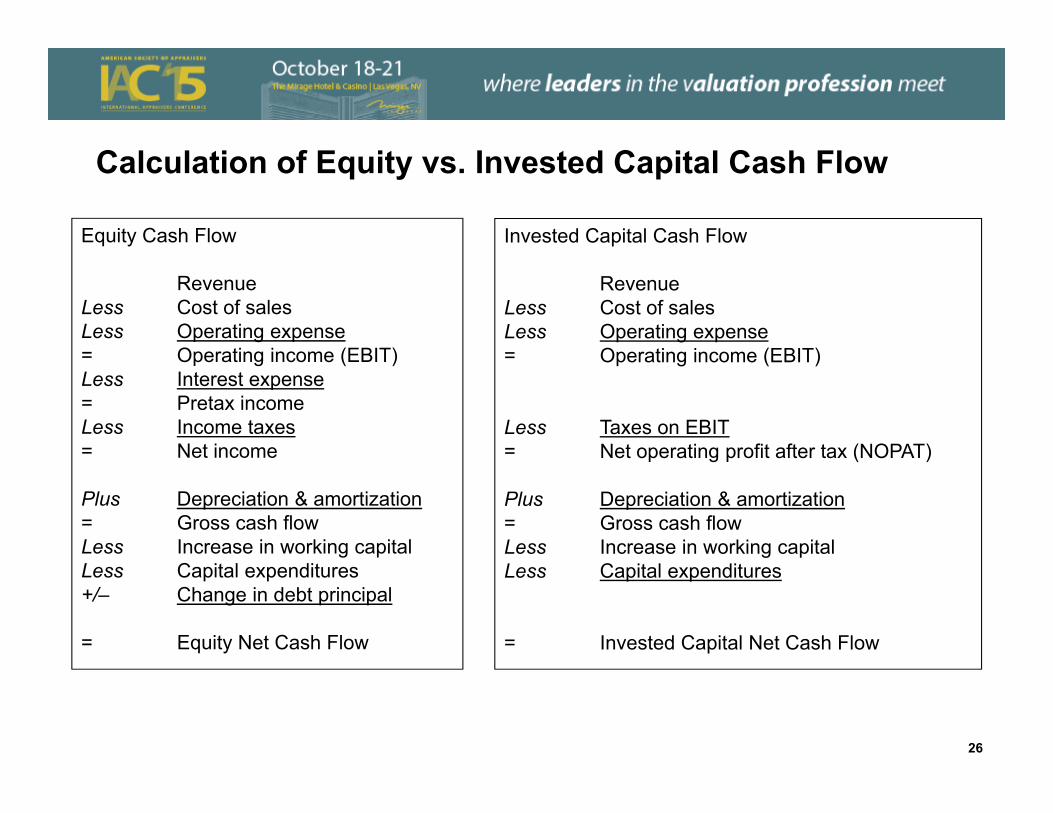
Calculation of Equity vs. Invested Capital Cash Flow
Equity Cash Flow
RevenueLess Cost of salesLess Operating expense= Operating income (EBIT)Less Interest expense= Pretax income Less Income taxes= Net income
Plus Depreciation & amortization= Gross cash flowLess Increase in working capitalLess Capital expenditures +/– Change in debt principal
= Equity Net Cash Flow
Invested Capital Cash Flow
RevenueLess Cost of salesLess Operating expense= Operating income (EBIT)
Less Taxes on EBIT= Net operating profit after tax (NOPAT)
Plus Depreciation & amortization= Gross cash flowLess Increase in working capitalLess Capital expenditures
= Invested Capital Net Cash Flow
26
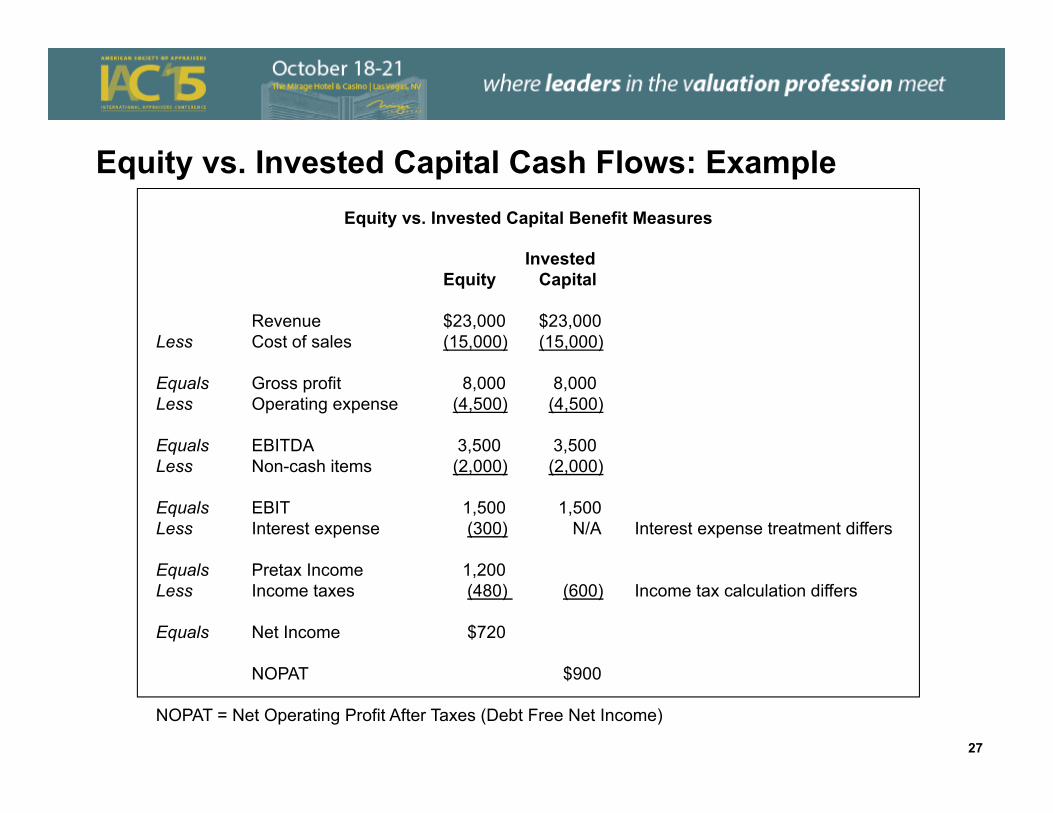
Equity vs. Invested Capital Cash Flows: ExampleEquity vs. Invested Capital Benefit Measures
InvestedEquity Capital
Revenue $23,000 $23,000Less Cost of sales (15,000) (15,000)
Equals Gross profit 8,000 8,000Less Operating expense (4,500) (4,500)
Equals EBITDA 3,500 3,500Less Non-cash items (2,000) (2,000)
Equals EBIT 1,500 1,500Less Interest expense (300) N/A Interest expense treatment differs
Equals Pretax Income 1,200Less Income taxes (480) (600) Income tax calculation differs
Equals Net Income $720
NOPAT $900
NOPAT = Net Operating Profit After Taxes (Debt Free Net Income)
27
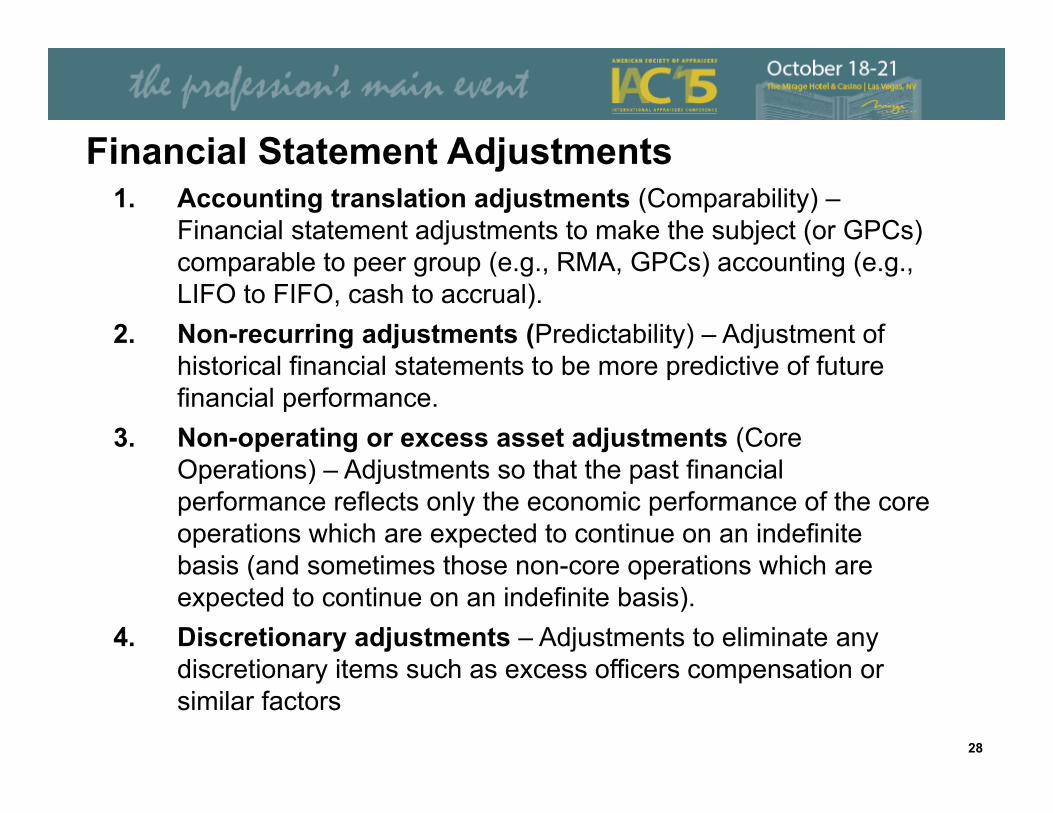
Financial Statement Adjustments1. Accounting translation adjustments (Comparability) –
Financial statement adjustments to make the subject (or GPCs) comparable to peer group (e.g., RMA, GPCs) accounting (e.g., LIFO to FIFO, cash to accrual).
2. Non-recurring adjustments (Predictability) – Adjustment of historical financial statements to be more predictive of future financial performance.
3. Non-operating or excess asset adjustments (Core Operations) – Adjustments so that the past financial performance reflects only the economic performance of the core operations which are expected to continue on an indefinite basis (and sometimes those non-core operations which are expected to continue on an indefinite basis).
4. Discretionary adjustments – Adjustments to eliminate any discretionary items such as excess officers compensation or similar factors
28

Adjustments to Income Statement - Example
29
Example Adjustment to Income StatementPrivate firm CEO is paid $1,200,000.Analyst estimates market rate for CEO is $800,000.
Reduce SG&A expenses by $400,000.
Firm leases a warehouse for $200,000/year from a family member. Analyst estimates market rate is $300,000.
Increase SG&A expenses by $100,000.
Firm owns a vacant building that has reported expenses of $90,000 and depreciation expenses of $15,000. The building is noncore.
Reduce SG&A expenses by $90,000. Reduce depreciation expenses by $15,000.
Firm may be acquired by a strategic Buyer A that expects synergies with cost savings of $230,000. Buyer B is a financial buyer.
Reduce SG&A expenses by $230,000 when calculating normalized earnings for Buyer A, but not for Buyer B.
29
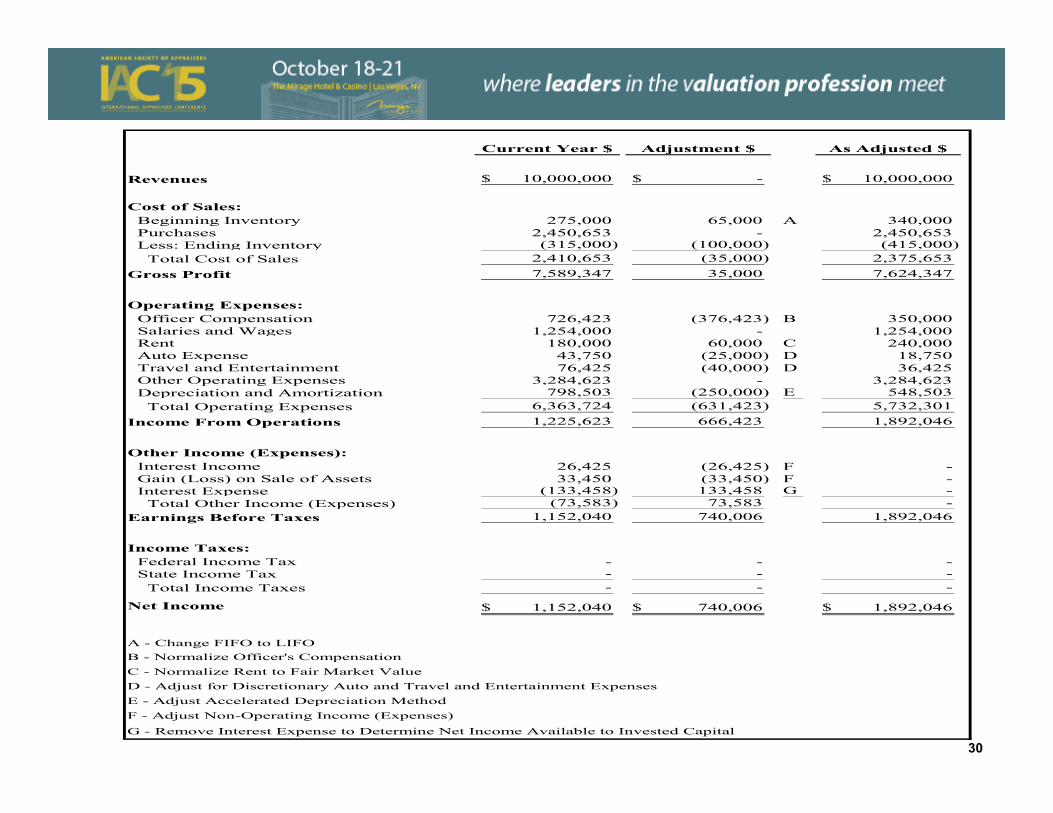
Current Year $ Adjustment $ As Adjusted $
Revenues 10,000,000$ -$ 10,000,000$
Cost of Sales: Beginning Inventory 275,000 65,000 A 340,000 Purchases 2,450,653 - 2,450,653 Less: Ending Inventory (315,000) (100,000) (415,000) Total Cost of Sales 2,410,653 (35,000) 2,375,653 Gross Profit 7,589,347 35,000 7,624,347
Operating Expenses: Officer Compensation 726,423 (376,423) B 350,000 Salaries and Wages 1,254,000 - 1,254,000 Rent 180,000 60,000 C 240,000 Auto Expense 43,750 (25,000) D 18,750 Travel and Entertainment 76,425 (40,000) D 36,425 Other Operating Expenses 3,284,623 - 3,284,623 Depreciation and Amortization 798,503 (250,000) E 548,503 Total Operating Expenses 6,363,724 (631,423) 5,732,301 Income From Operations 1,225,623 666,423 1,892,046
Other Income (Expenses): Interest Income 26,425 (26,425) F - Gain (Loss) on Sale of Assets 33,450 (33,450) F - Interest Expense (133,458) 133,458 G - Total Other Income (Expenses) (73,583) 73,583 - Earnings Before Taxes 1,152,040 740,006 1,892,046
Income Taxes: Federal Income Tax - - - State Income Tax - - - Total Income Taxes - - -
Net Income 1,152,040$ 740,006$ 1,892,046$
A - Change FIFO to LIFOB - Normalize Officer's CompensationC - Normalize Rent to Fair Market ValueD - Adjust for Discretionary Auto and Travel and Entertainment ExpensesE - Adjust Accelerated Depreciation MethodF - Adjust Non-Operating Income (Expenses)
G - Remove Interest Expense to Determine Net Income Available to Invested Capital
30
Intangible Asset Valuation
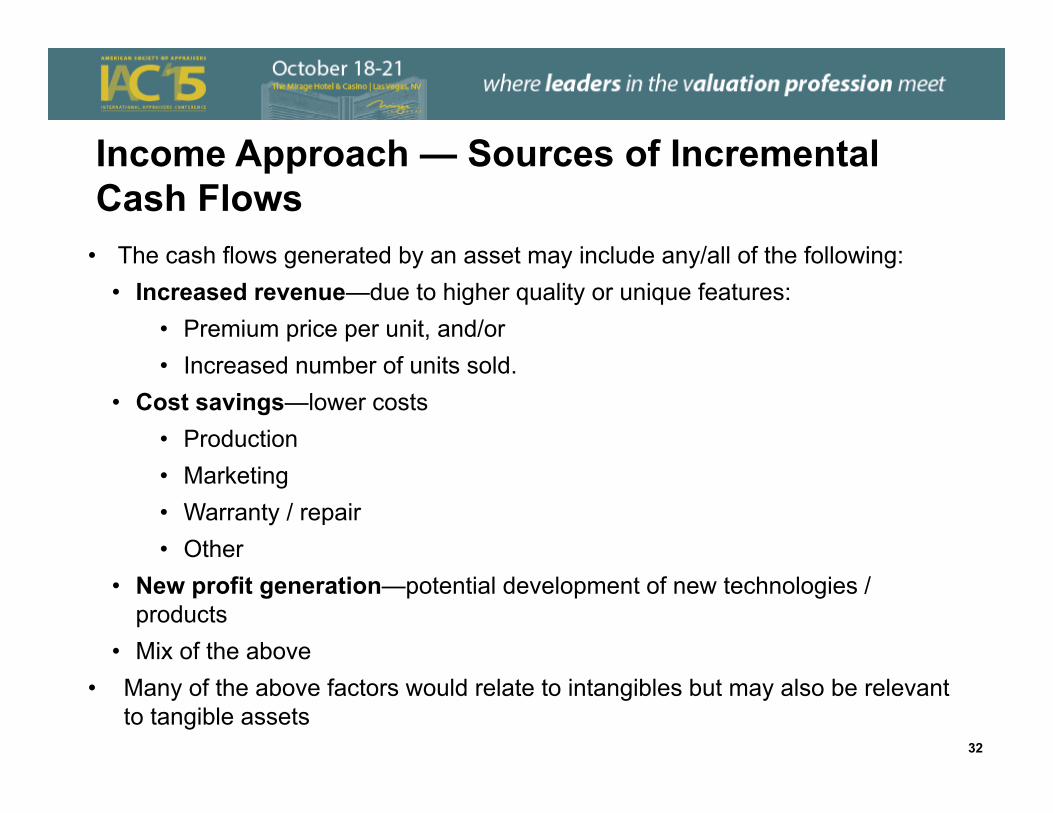
• The cash flows generated by an asset may include any/all of the following:• Increased revenue—due to higher quality or unique features:
• Premium price per unit, and/or • Increased number of units sold.
• Cost savings—lower costs • Production• Marketing• Warranty / repair• Other
• New profit generation—potential development of new technologies / products
• Mix of the above• Many of the above factors would relate to intangibles but may also be relevant
to tangible assets
Income Approach — Sources of Incremental Cash Flows
32
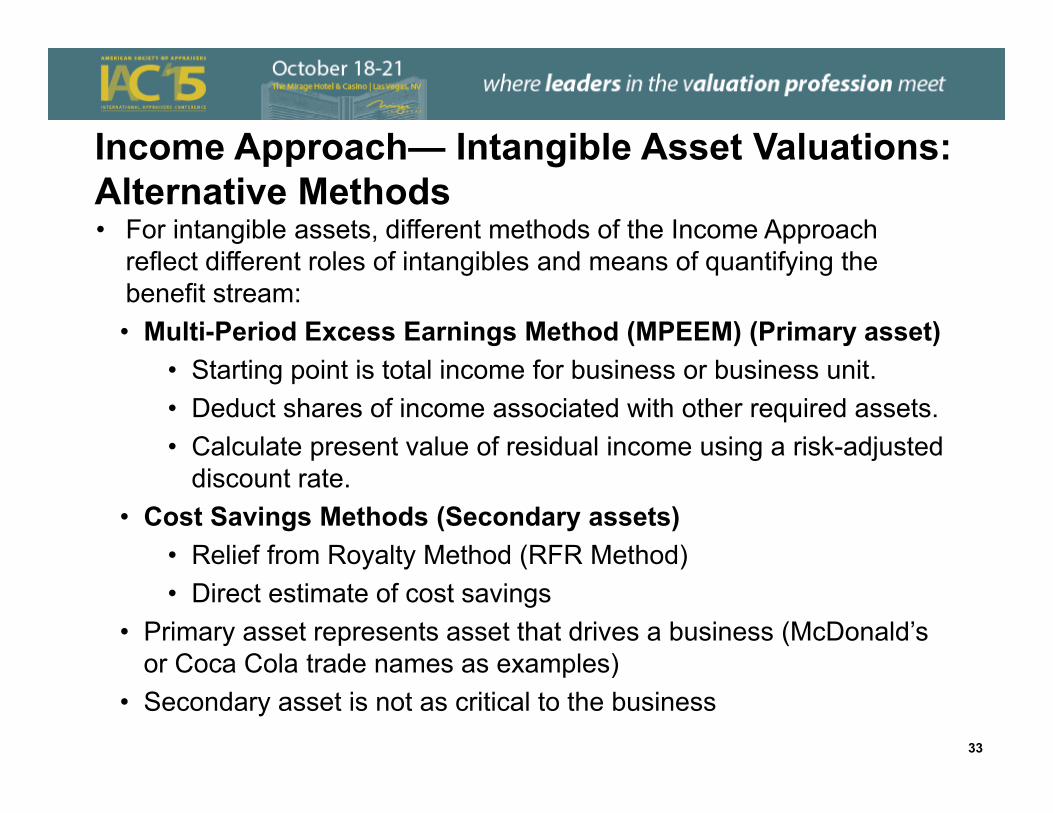
Income Approach— Intangible Asset Valuations: Alternative Methods• For intangible assets, different methods of the Income Approach
reflect different roles of intangibles and means of quantifying the benefit stream:• Multi-Period Excess Earnings Method (MPEEM) (Primary asset)
• Starting point is total income for business or business unit.• Deduct shares of income associated with other required assets.• Calculate present value of residual income using a risk-adjusted
discount rate.• Cost Savings Methods (Secondary assets)
• Relief from Royalty Method (RFR Method)• Direct estimate of cost savings
• Primary asset represents asset that drives a business (McDonald’s or Coca Cola trade names as examples)
• Secondary asset is not as critical to the business33
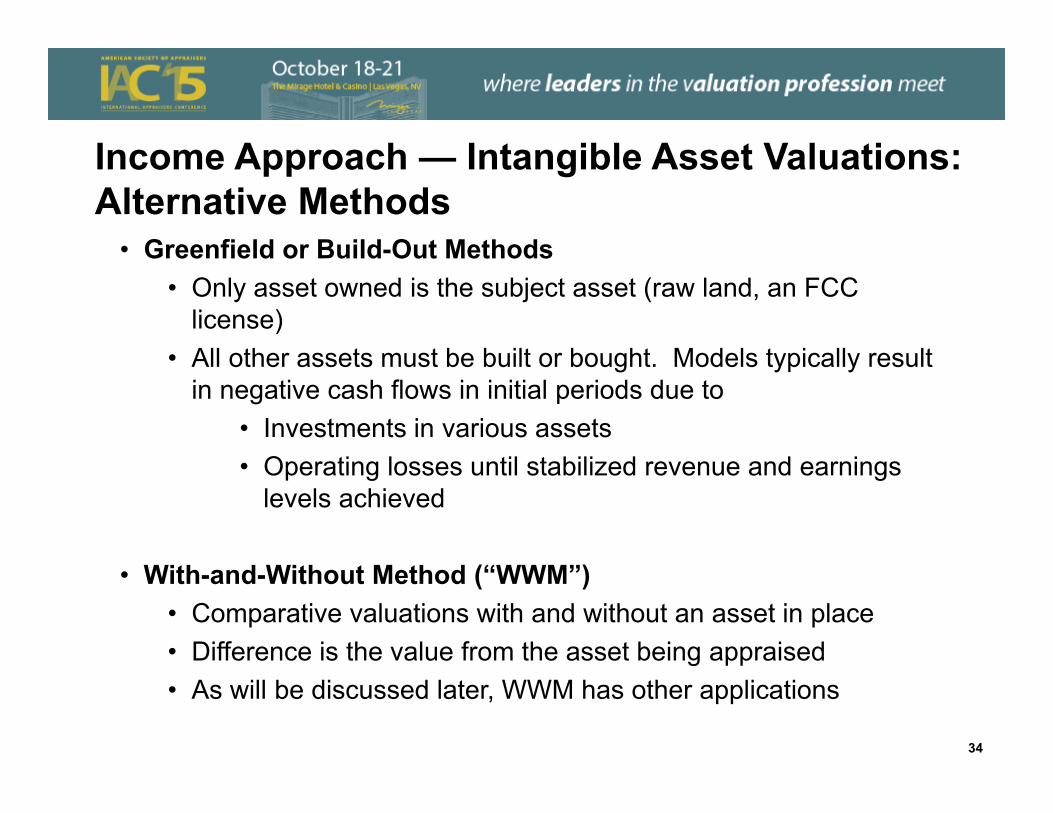
Income Approach — Intangible Asset Valuations: Alternative Methods
• Greenfield or Build-Out Methods• Only asset owned is the subject asset (raw land, an FCC
license)• All other assets must be built or bought. Models typically result
in negative cash flows in initial periods due to• Investments in various assets• Operating losses until stabilized revenue and earnings
levels achieved
• With-and-Without Method (“WWM”) • Comparative valuations with and without an asset in place• Difference is the value from the asset being appraised• As will be discussed later, WWM has other applications
34
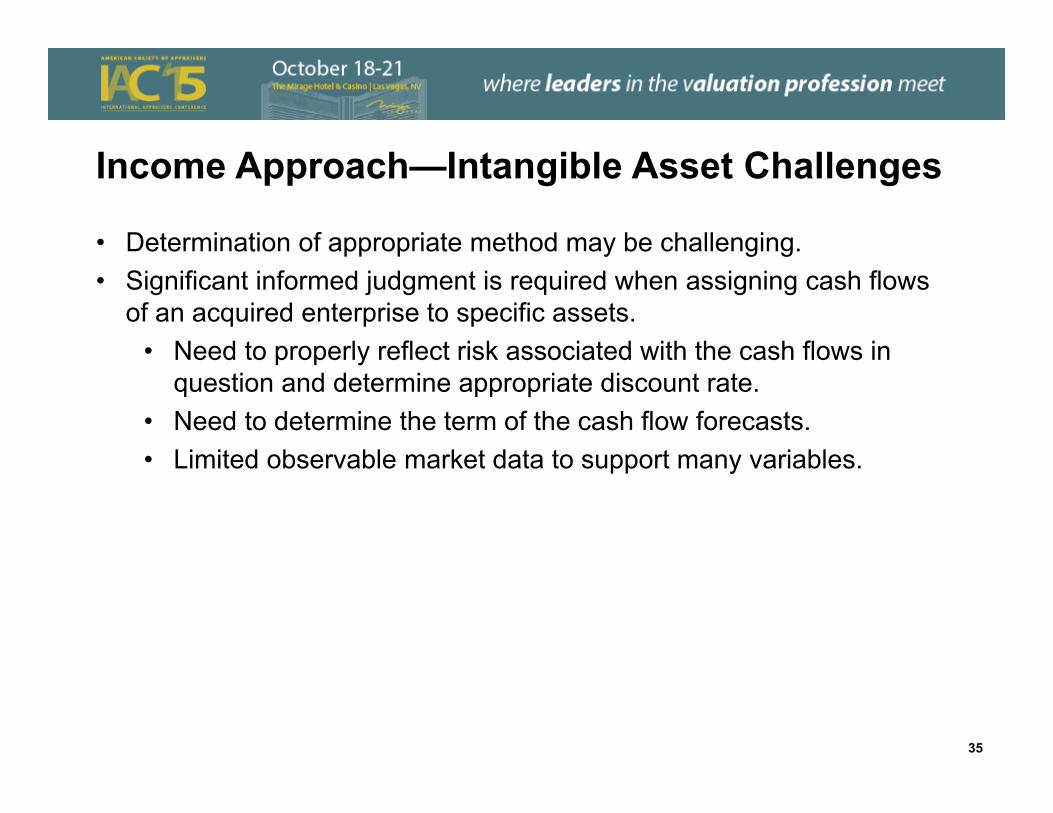
Income Approach—Intangible Asset Challenges
• Determination of appropriate method may be challenging.• Significant informed judgment is required when assigning cash flows
of an acquired enterprise to specific assets.• Need to properly reflect risk associated with the cash flows in
question and determine appropriate discount rate.• Need to determine the term of the cash flow forecasts.• Limited observable market data to support many variables.
35

Important Concepts
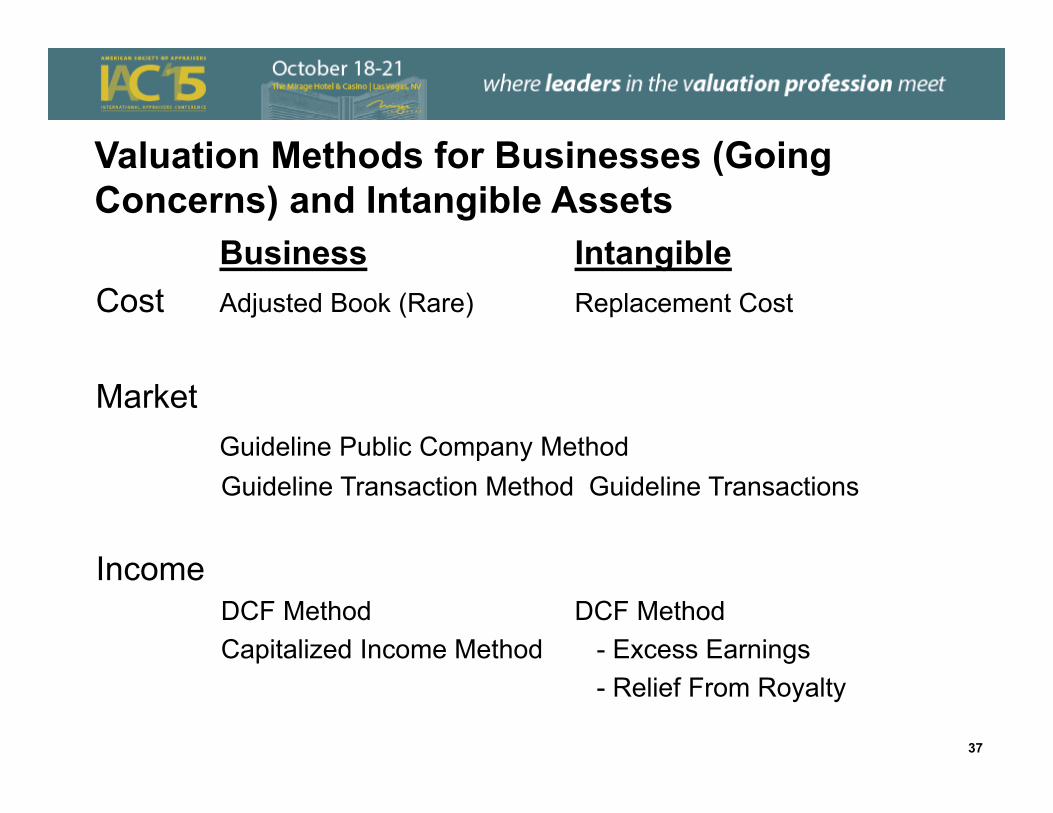
Valuation Methods for Businesses (Going Concerns) and Intangible Assets
Business IntangibleCost Adjusted Book (Rare) Replacement Cost
MarketGuideline Public Company MethodGuideline Transaction Method Guideline Transactions
IncomeDCF Method DCF MethodCapitalized Income Method - Excess Earnings
- Relief From Royalty
37
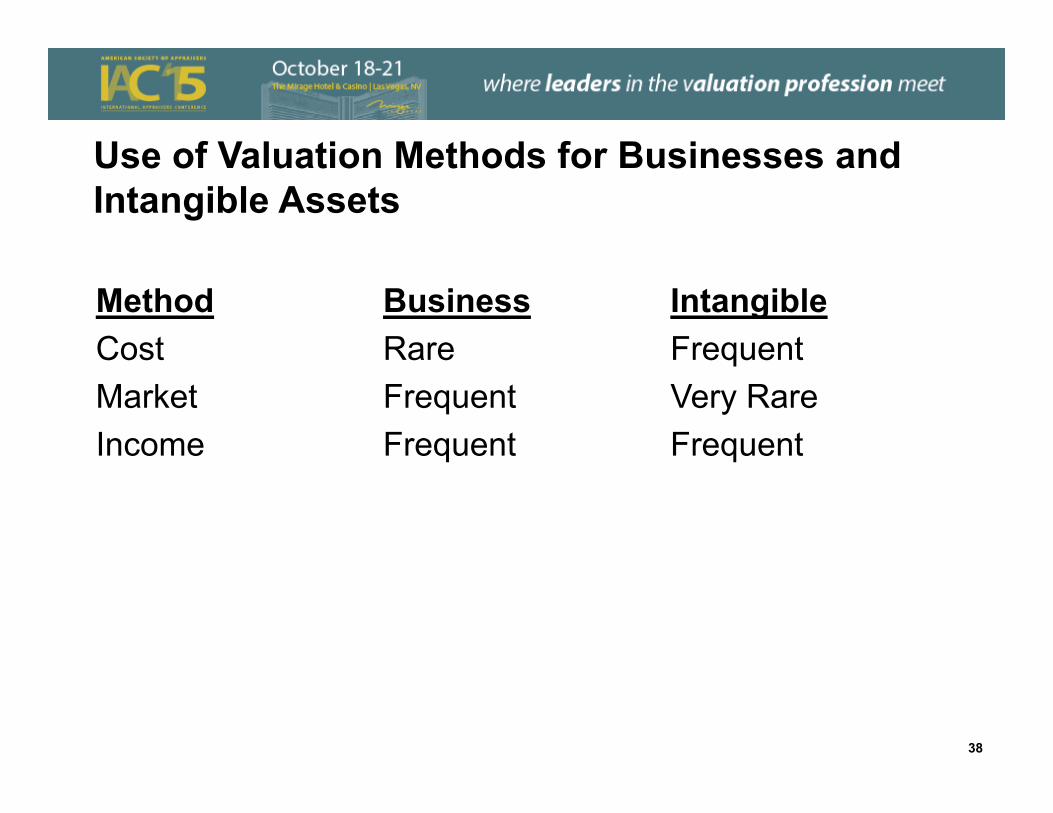
Use of Valuation Methods for Businesses and Intangible Assets
Method Business IntangibleCost Rare FrequentMarket Frequent Very RareIncome Frequent Frequent
38
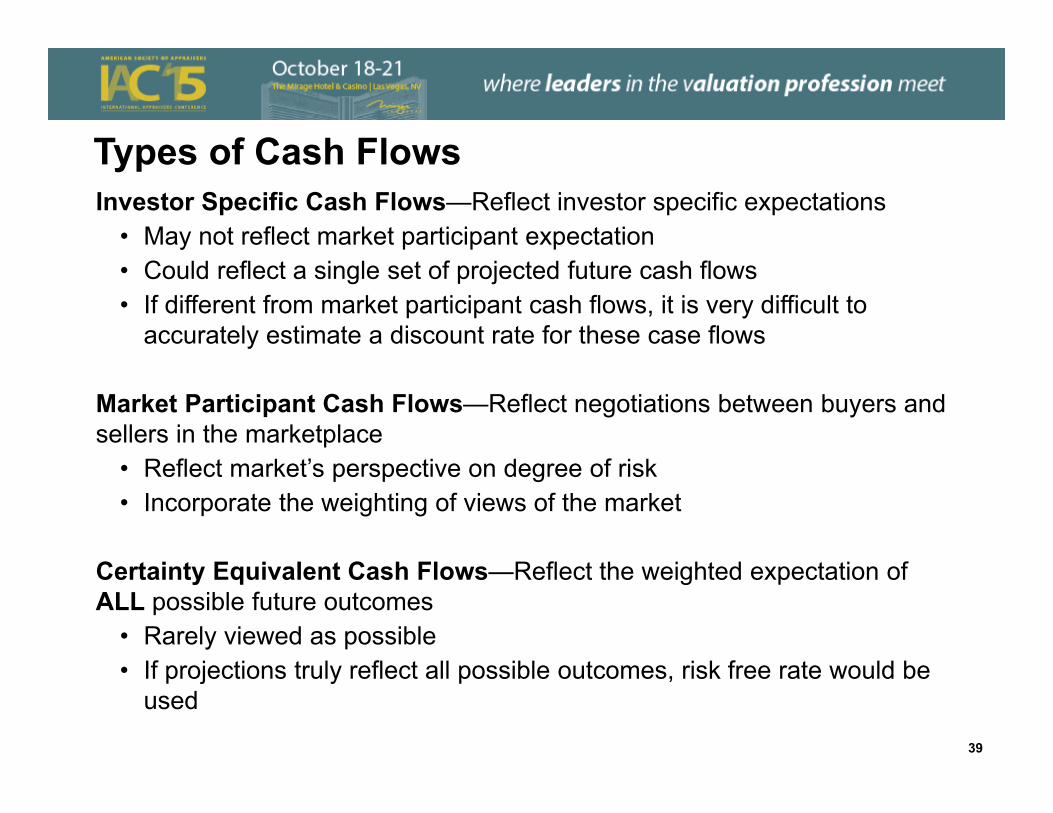
Types of Cash FlowsInvestor Specific Cash Flows—Reflect investor specific expectations
• May not reflect market participant expectation• Could reflect a single set of projected future cash flows• If different from market participant cash flows, it is very difficult to
accurately estimate a discount rate for these case flows
Market Participant Cash Flows—Reflect negotiations between buyers and sellers in the marketplace
• Reflect market’s perspective on degree of risk• Incorporate the weighting of views of the market
Certainty Equivalent Cash Flows—Reflect the weighted expectation of ALL possible future outcomes
• Rarely viewed as possible• If projections truly reflect all possible outcomes, risk free rate would be
used
39
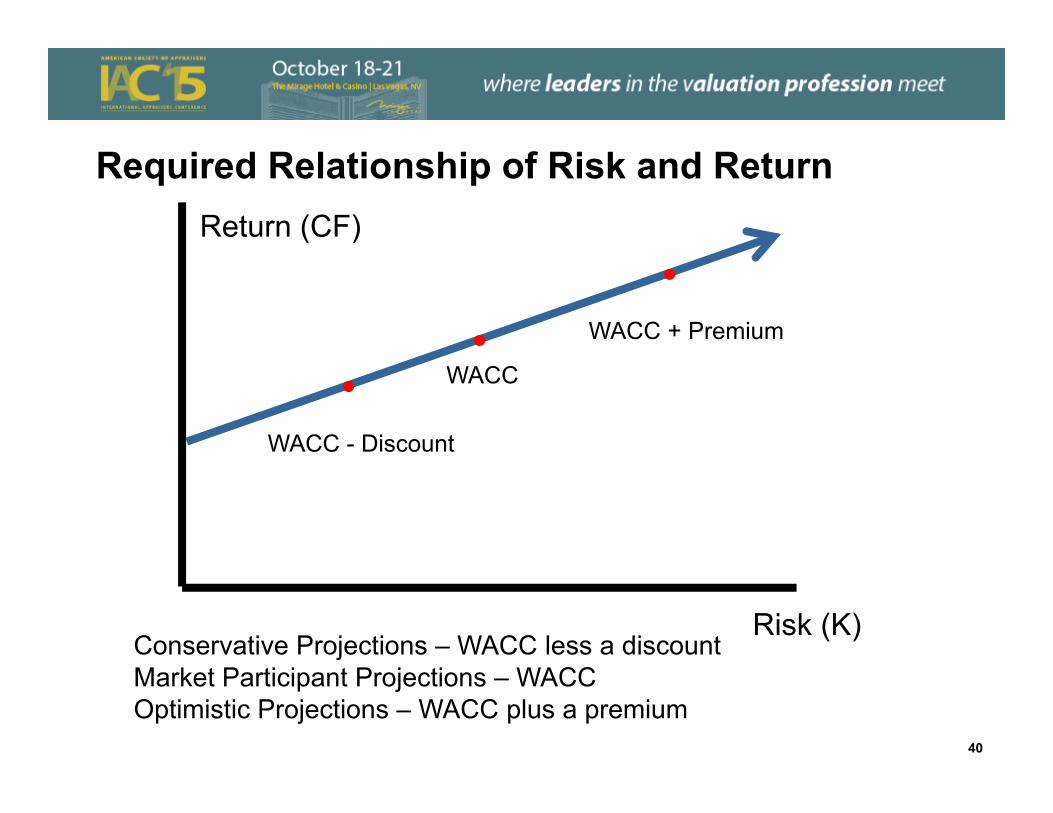
Required Relationship of Risk and ReturnReturn (CF)
Risk (K)
WACC
WACC + Premium
WACC - Discount
Conservative Projections – WACC less a discountMarket Participant Projections – WACCOptimistic Projections – WACC plus a premium
40
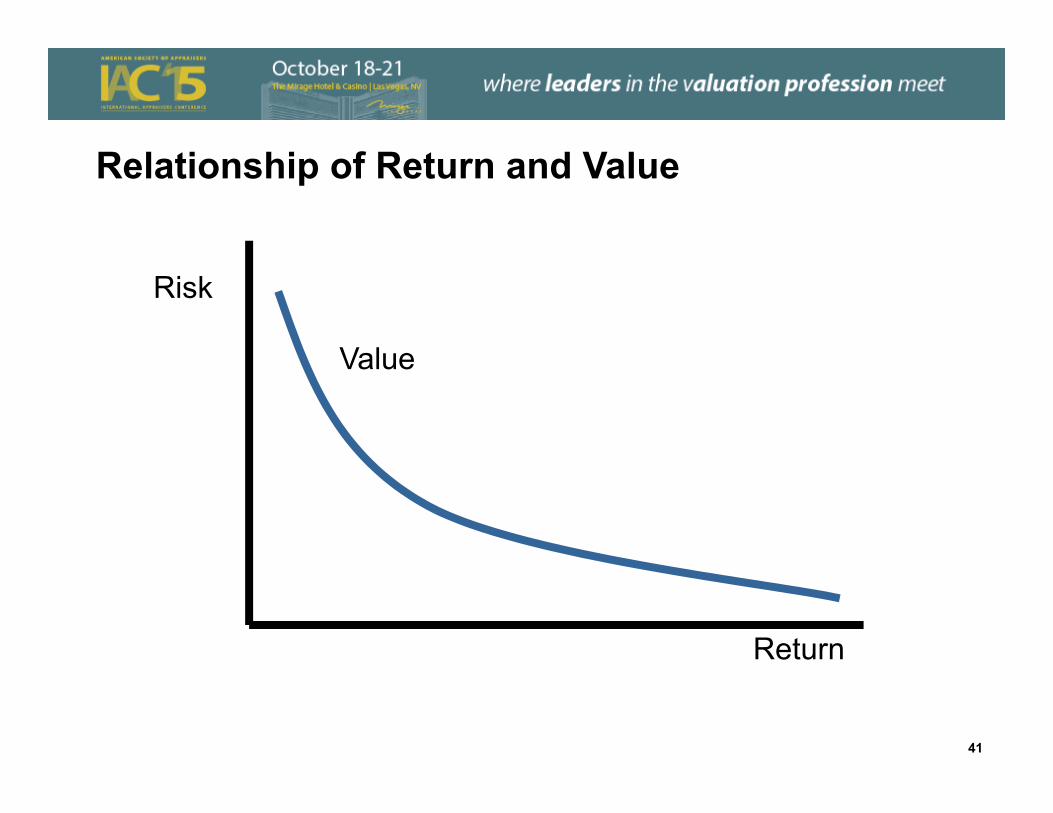
Relationship of Return and Value
Value
Return
Risk
41
Discount Rates
Discount Rate Estimates—Overview• Estimating discount rates for a business and the different assets of a
business is one of the more challenging areas of valuation. • No (or limited) market data available for returns on fixed assets• No market data available for intangible assets - customers,
technology, trade names, work forces, other• Although there is often limited direct market evidence to estimate
discount rates for specific business assets, there are several means of confirming that estimates are within a range of reason.
• The following slides present information pertaining to:• Return requirements for different asset classifications• Return requirements within the spectrum of intangible assets• General methods of confirming the reasonableness of discount rate
estimates
43
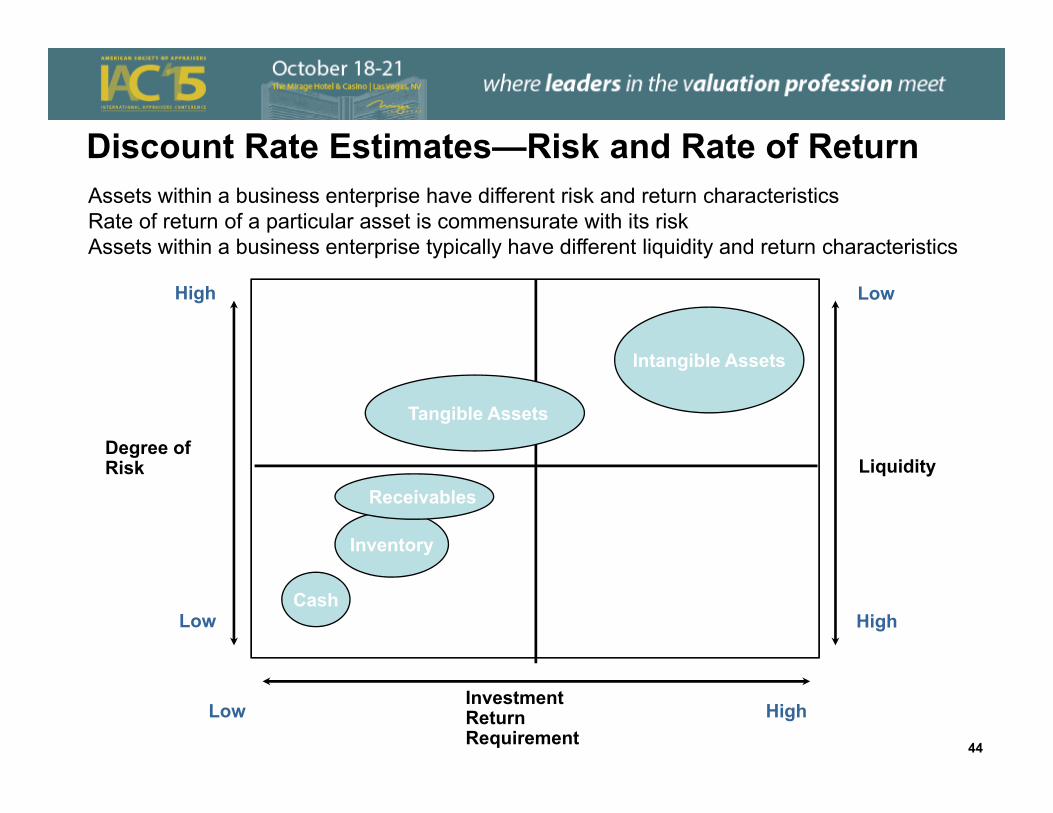
Discount Rate Estimates—Risk and Rate of ReturnAssets within a business enterprise have different risk and return characteristics Rate of return of a particular asset is commensurate with its riskAssets within a business enterprise typically have different liquidity and return characteristics
Investment Return Requirement
Low High
High
Low
Degree of Risk
Inventory
Cash
Receivables
Tangible Assets
Intangible Assets
Liquidity
Low
High
44
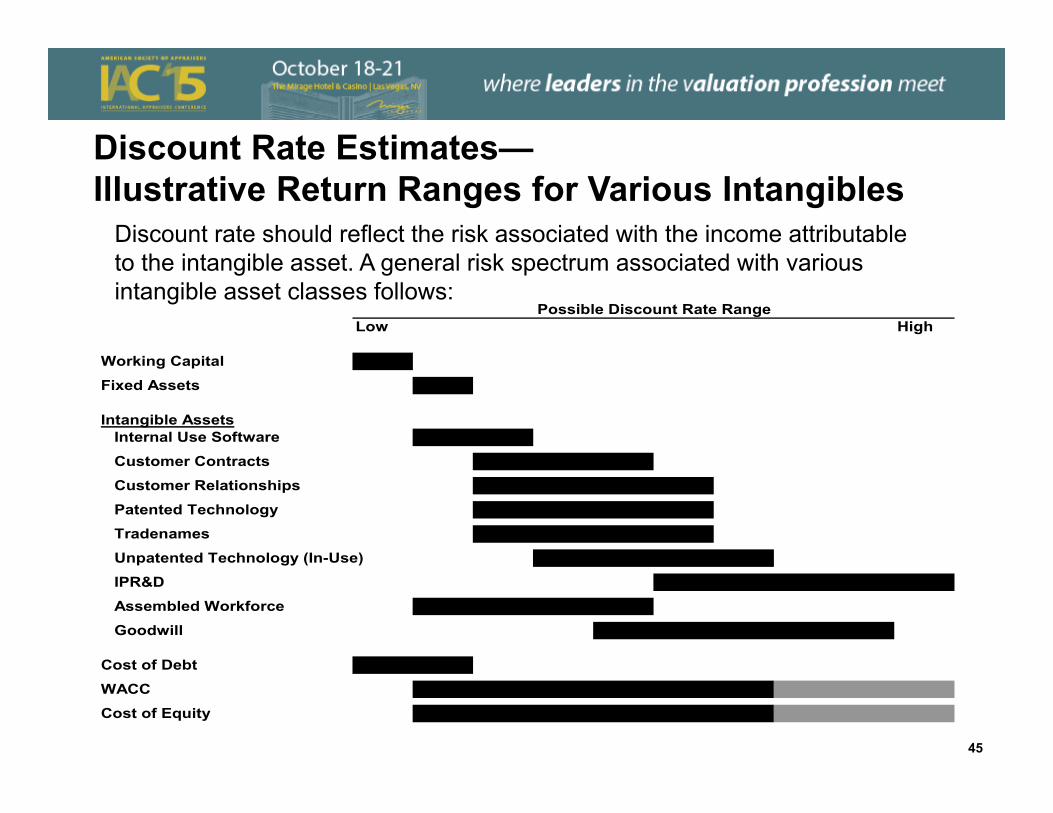
Discount Rate Estimates—Illustrative Return Ranges for Various Intangibles
Discount rate should reflect the risk associated with the income attributable to the intangible asset. A general risk spectrum associated with various intangible asset classes follows:
Low High
Working Capital xxxxxFixed Assets xxxxx
Intangible AssetsInternal Use Software xxxxx xxxxxCustomer Contracts xxxxx xxxxx xxxxxCustomer Relationships xxxxx xxxxx xxxxx xxxxxPatented Technology xxxxx xxxxx xxxxx xxxxxTradenames xxxxx xxxxx xxxxx xxxxxUnpatented Technology (In-Use) xxxxx xxxxx xxxxx xxxxxIPR&D xxxxx xxxxx xxxxx xxxxx xxxxxAssembled Workforce xxxxx xxxxx xxxxx xxxxxGoodwill xxxxx xxxxx xxxxx xxxxx xxxxx
Cost of Debt xxxxx xxxxxWACC xxxxx xxxxx xxxxx xxxxx xxxxx xxxxxCost of Equity xxxxx xxxxx xxxxx xxxxx xxxxx xxxxx
Possible Discount Rate Range
45
Section 2: Gaming Industry Overview and Valuation
Observations

Industry Overview
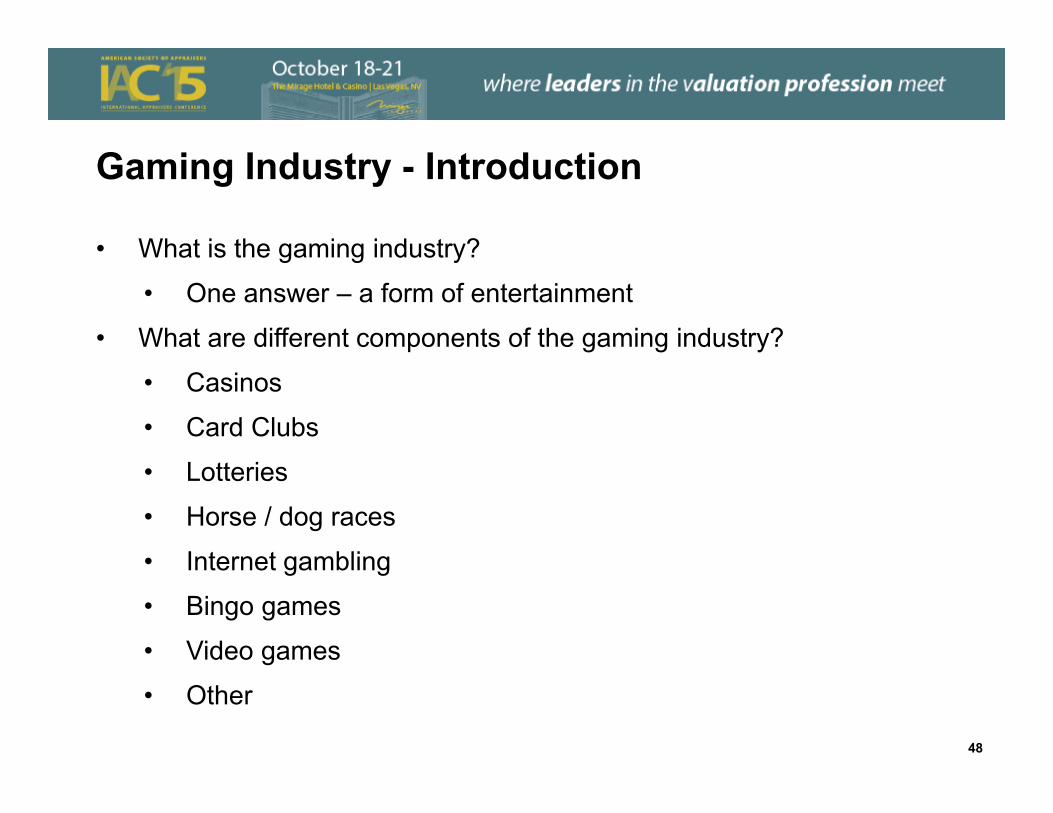
Gaming Industry - Introduction
• What is the gaming industry?
• One answer – a form of entertainment
• What are different components of the gaming industry?
• Casinos
• Card Clubs
• Lotteries
• Horse / dog races
• Internet gambling
• Bingo games
• Video games
• Other
48
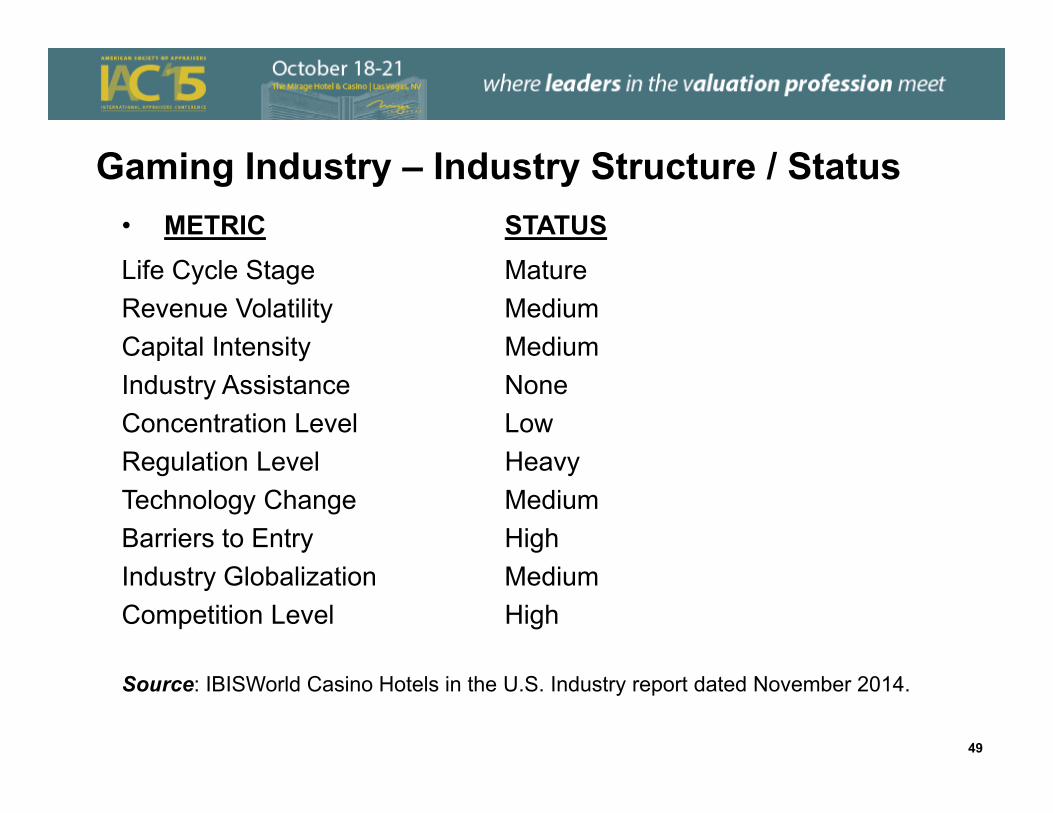
Gaming Industry – Industry Structure / Status• METRIC STATUSLife Cycle Stage Mature Revenue Volatility Medium Capital Intensity Medium Industry Assistance None Concentration Level Low Regulation Level Heavy Technology Change Medium Barriers to Entry High Industry Globalization Medium Competition Level High
Source: IBISWorld Casino Hotels in the U.S. Industry report dated November 2014.
49
Gaming Industry – Features of a Mature Industry
• Key features of mature industry
• Revenue grows at or near same pace as economy
• Company numbers stabilize;
• M&A stage
• Established technology & processes
• Total market acceptance of product & brand
• Rationalization of low margin products & brands
Source: IBISWorld Casino Hotels in the U.S. Industry report dated November 2014.
50
Gaming Industry – General Observations • Increasing competition for individual time
• Alternative forms of entertainment • Highly regulated – federal and state• More capital intensive, decreasing labor intensity but still heavy labor• Increasing competition leads to increasing expenditures to renovate• Slots are increasingly important
• High rollers staying in Asia• Increasing efficiency• For states that report separately, 62% or more of revenues is
from slots• Technology
• Cashless slot machines• Efficient• Push down to reprogram
51
Gaming Industry – General Observations (cont’d)
• Growth of non-gaming amenities
• Non-gaming revenue now 60% of Las Vegas Strip. Up from 40% a decade ago
• Technology
• Ticket-in, ticket-out
• Server based gaming machines
• Gaming machines that facilitate multi-player gambling
• Gambling machine revenues exceed gaming tables
• Increasing speed of replacement
52
Gaming Industry – General Observations (cont’d)
• Online poker and TV increase poker gambling
• Most visitors come from local area – over 90% of patron visits
• Asian growth rates
• Rising per capita incomes
• Greater acceptance of gambling
• Gambling increase from 7.5% of recreational spending in 1990 to 12.2% in 2009 per AMA study, Beyond the Casino Floor
• Gambling legal under US laws
• States determine individual perspectives
53

Gaming Industry – General Observations (cont’d)
• Industry concentration relatively flat since 2009
• Average profit margin declining due to increase in competition and spending
• High fixed cost business
• Tax bases
• Gross revenue
• Number of gaming devices or table games offered
• 6.75% of gross revenues for large casinos in LV
• 55% of gross gaming revenue for Pennsylvania
• Depreciation at 6.5% of revenue
54
Gaming Industry – General Observations (cont’d)
• Online gambling legal in Nevada, New Jersey and Delaware
• International online gambling can be accessed
• Move to splitting management companies from owners of the land and building
• Caesars real property markdown in 2013 (see page 26)
• MGM CityCenter – poor performance
• Las Vegas Sands, Inc. – 10% of revenue from LV
• Loyalty card programs
• 17 states have legalized various forms of gambling
55
Gaming Industry – Recent Geographic Changes
• Increasing locations in U.S. but flat total revenues
• Ohio 2012
• New York 2013 constitutional amendment
• Pennsylvania revenues (now second largest market) exceed New Jersey
• 2007 Macau surpassed Las Vegas as largest gambling revenue market
• Macau – Dramatic expansion and change of format in early 2000’s
• Singapore – First casino February 14, 2010
56
Publicly-Traded Gaming Companies
Publicly-Traded Gaming Companies
• U.S. stock markets have a large number of publicly traded gaming companies.
• Many are smaller with limited trading activity (trade on OTC “Pink Sheets”)
• Several trade on the NYSE and a significant number trade on the Over the Counter market
58
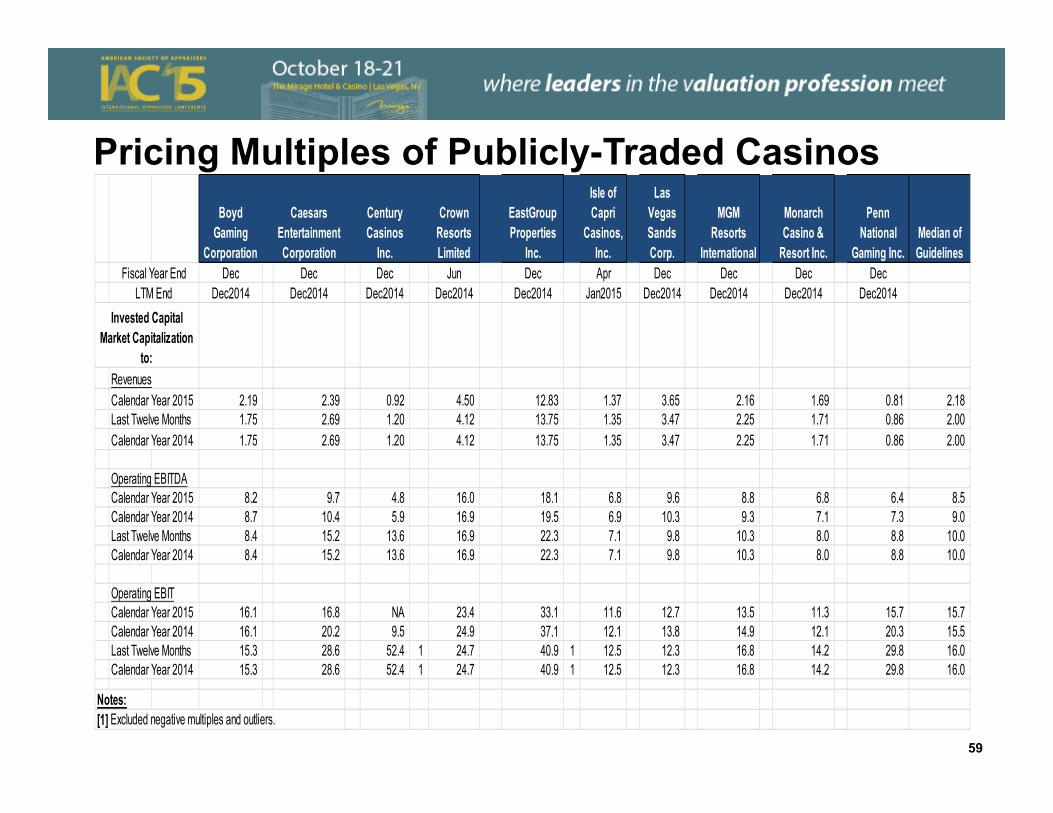
Pricing Multiples of Publicly-Traded Casinos
59
Boyd Gaming
Corporation
Caesars Entertainment Corporation
Century Casinos
Inc.
Crown Resorts Limited
EastGroup Properties
Inc.
Isle of Capri
Casinos, Inc.
Las Vegas Sands Corp.
MGM Resorts
International
Monarch Casino &
Resort Inc.
Penn National
Gaming Inc.Median of Guidelines
Dec Dec Dec Jun Dec Apr Dec Dec Dec DecDec2014 Dec2014 Dec2014 Dec2014 Dec2014 Jan2015 Dec2014 Dec2014 Dec2014 Dec2014
RevenuesCalendar Year 2015 2.19 2.39 0.92 4.50 12.83 1.37 3.65 2.16 1.69 0.81 2.18 Last Twelve Months 1.75 2.69 1.20 4.12 13.75 1.35 3.47 2.25 1.71 0.86 2.00 Calendar Year 2014 1.75 2.69 1.20 4.12 13.75 1.35 3.47 2.25 1.71 0.86 2.00
Operating EBITDACalendar Year 2015 8.2 9.7 4.8 16.0 18.1 6.8 9.6 8.8 6.8 6.4 8.5 Calendar Year 2014 8.7 10.4 5.9 16.9 19.5 6.9 10.3 9.3 7.1 7.3 9.0 Last Twelve Months 8.4 15.2 13.6 16.9 22.3 7.1 9.8 10.3 8.0 8.8 10.0 Calendar Year 2014 8.4 15.2 13.6 16.9 22.3 7.1 9.8 10.3 8.0 8.8 10.0
Operating EBITCalendar Year 2015 16.1 16.8 NA 23.4 33.1 11.6 12.7 13.5 11.3 15.7 15.7 Calendar Year 2014 16.1 20.2 9.5 24.9 37.1 12.1 13.8 14.9 12.1 20.3 15.5 Last Twelve Months 15.3 28.6 52.4 1 24.7 40.9 1 12.5 12.3 16.8 14.2 29.8 16.0 Calendar Year 2014 15.3 28.6 52.4 1 24.7 40.9 1 12.5 12.3 16.8 14.2 29.8 16.0
Notes:[1] Excluded negative multiples and outliers.
Fiscal Year EndLTM End
Invested Capital Market Capitalization
to:
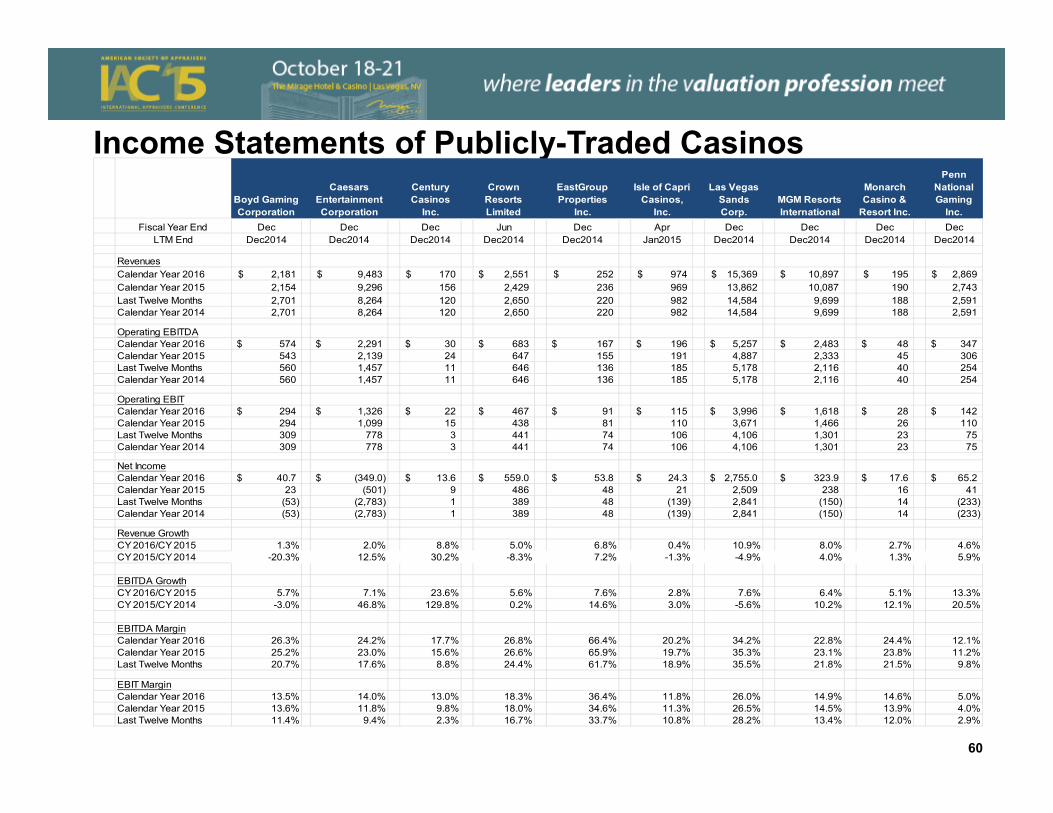
Income Statements of Publicly-Traded Casinos
60
Boyd Gaming Corporation
Caesars Entertainment Corporation
Century Casinos
Inc.
Crown Resorts Limited
EastGroup Properties
Inc.
Isle of Capri Casinos,
Inc.
Las Vegas Sands Corp.
MGM Resorts International
Monarch Casino &
Resort Inc.
Penn National Gaming
Inc.Fiscal Year End Dec Dec Dec Jun Dec Apr Dec Dec Dec Dec
LTM End Dec2014 Dec2014 Dec2014 Dec2014 Dec2014 Jan2015 Dec2014 Dec2014 Dec2014 Dec2014
RevenuesCalendar Year 2016 2,181$ 9,483$ 170$ 2,551$ 252$ 974$ 15,369$ 10,897$ 195$ 2,869$ Calendar Year 2015 2,154 9,296 156 2,429 236 969 13,862 10,087 190 2,743 Last Twelve Months 2,701 8,264 120 2,650 220 982 14,584 9,699 188 2,591 Calendar Year 2014 2,701 8,264 120 2,650 220 982 14,584 9,699 188 2,591
Operating EBITDACalendar Year 2016 574$ 2,291$ 30$ 683$ 167$ 196$ 5,257$ 2,483$ 48$ 347$ Calendar Year 2015 543 2,139 24 647 155 191 4,887 2,333 45 306 Last Twelve Months 560 1,457 11 646 136 185 5,178 2,116 40 254 Calendar Year 2014 560 1,457 11 646 136 185 5,178 2,116 40 254
Operating EBITCalendar Year 2016 294$ 1,326$ 22$ 467$ 91$ 115$ 3,996$ 1,618$ 28$ 142$ Calendar Year 2015 294 1,099 15 438 81 110 3,671 1,466 26 110 Last Twelve Months 309 778 3 441 74 106 4,106 1,301 23 75 Calendar Year 2014 309 778 3 441 74 106 4,106 1,301 23 75
Net IncomeCalendar Year 2016 40.7$ (349.0)$ 13.6$ 559.0$ 53.8$ 24.3$ 2,755.0$ 323.9$ 17.6$ 65.2$ Calendar Year 2015 23 (501) 9 486 48 21 2,509 238 16 41 Last Twelve Months (53) (2,783) 1 389 48 (139) 2,841 (150) 14 (233) Calendar Year 2014 (53) (2,783) 1 389 48 (139) 2,841 (150) 14 (233)
Revenue GrowthCY 2016/CY 2015 1.3% 2.0% 8.8% 5.0% 6.8% 0.4% 10.9% 8.0% 2.7% 4.6%CY 2015/CY 2014 -20.3% 12.5% 30.2% -8.3% 7.2% -1.3% -4.9% 4.0% 1.3% 5.9%
EBITDA GrowthCY 2016/CY 2015 5.7% 7.1% 23.6% 5.6% 7.6% 2.8% 7.6% 6.4% 5.1% 13.3%CY 2015/CY 2014 -3.0% 46.8% 129.8% 0.2% 14.6% 3.0% -5.6% 10.2% 12.1% 20.5%
EBITDA MarginCalendar Year 2016 26.3% 24.2% 17.7% 26.8% 66.4% 20.2% 34.2% 22.8% 24.4% 12.1%Calendar Year 2015 25.2% 23.0% 15.6% 26.6% 65.9% 19.7% 35.3% 23.1% 23.8% 11.2%Last Twelve Months 20.7% 17.6% 8.8% 24.4% 61.7% 18.9% 35.5% 21.8% 21.5% 9.8%
EBIT MarginCalendar Year 2016 13.5% 14.0% 13.0% 18.3% 36.4% 11.8% 26.0% 14.9% 14.6% 5.0%Calendar Year 2015 13.6% 11.8% 9.8% 18.0% 34.6% 11.3% 26.5% 14.5% 13.9% 4.0%Last Twelve Months 11.4% 9.4% 2.3% 16.7% 33.7% 10.8% 28.2% 13.4% 12.0% 2.9%
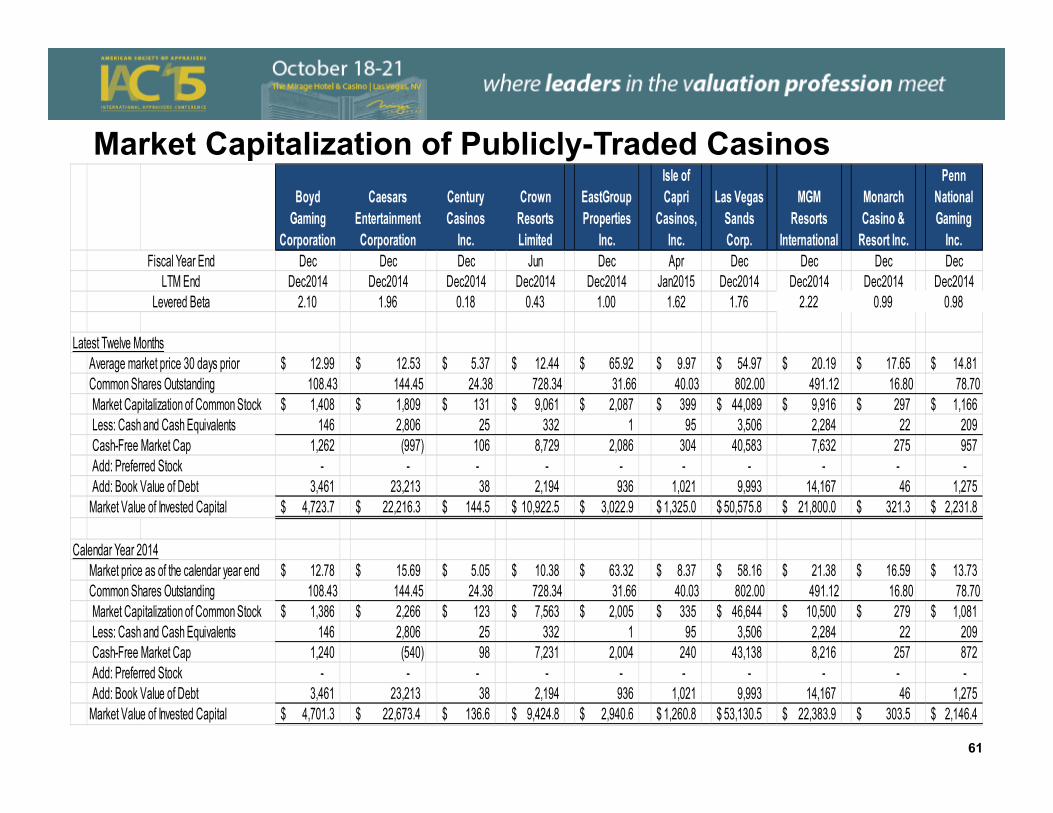
Market Capitalization of Publicly-Traded Casinos
61
Boyd Gaming
Corporation
Caesars Entertainment Corporation
Century Casinos
Inc.
Crown Resorts Limited
EastGroup Properties
Inc.
Isle of Capri
Casinos, Inc.
Las Vegas Sands Corp.
MGM Resorts
International
Monarch Casino &
Resort Inc.
Penn National Gaming
Inc.Dec Dec Dec Jun Dec Apr Dec Dec Dec Dec
Dec2014 Dec2014 Dec2014 Dec2014 Dec2014 Jan2015 Dec2014 Dec2014 Dec2014 Dec20142.10 1.96 0.18 0.43 1.00 1.62 1.76 2.22 0.99 0.98
Latest Twelve MonthsAverage market price 30 days prior 12.99$ 12.53$ 5.37$ 12.44$ 65.92$ 9.97$ 54.97$ 20.19$ 17.65$ 14.81$ Common Shares Outstanding 108.43 144.45 24.38 728.34 31.66 40.03 802.00 491.12 16.80 78.70Market Capitalization of Common Stock 1,408$ 1,809$ 131$ 9,061$ 2,087$ 399$ 44,089$ 9,916$ 297$ 1,166$ Less: Cash and Cash Equivalents 146 2,806 25 332 1 95 3,506 2,284 22 209 Cash-Free Market Cap 1,262 (997) 106 8,729 2,086 304 40,583 7,632 275 957 Add: Preferred Stock - - - - - - - - - - Add: Book Value of Debt 3,461 23,213 38 2,194 936 1,021 9,993 14,167 46 1,275
Market Value of Invested Capital 4,723.7$ 22,216.3$ 144.5$ 10,922.5$ 3,022.9$ 1,325.0$ 50,575.8$ 21,800.0$ 321.3$ 2,231.8$
Calendar Year 2014Market price as of the calendar year end 12.78$ 15.69$ 5.05$ 10.38$ 63.32$ 8.37$ 58.16$ 21.38$ 16.59$ 13.73$ Common Shares Outstanding 108.43 144.45 24.38 728.34 31.66 40.03 802.00 491.12 16.80 78.70Market Capitalization of Common Stock 1,386$ 2,266$ 123$ 7,563$ 2,005$ 335$ 46,644$ 10,500$ 279$ 1,081$ Less: Cash and Cash Equivalents 146 2,806 25 332 1 95 3,506 2,284 22 209 Cash-Free Market Cap 1,240 (540) 98 7,231 2,004 240 43,138 8,216 257 872 Add: Preferred Stock - - - - - - - - - - Add: Book Value of Debt 3,461 23,213 38 2,194 936 1,021 9,993 14,167 46 1,275
Market Value of Invested Capital 4,701.3$ 22,673.4$ 136.6$ 9,424.8$ 2,940.6$ 1,260.8$ 53,130.5$ 22,383.9$ 303.5$ 2,146.4$
Fiscal Year EndLTM End
Levered Beta
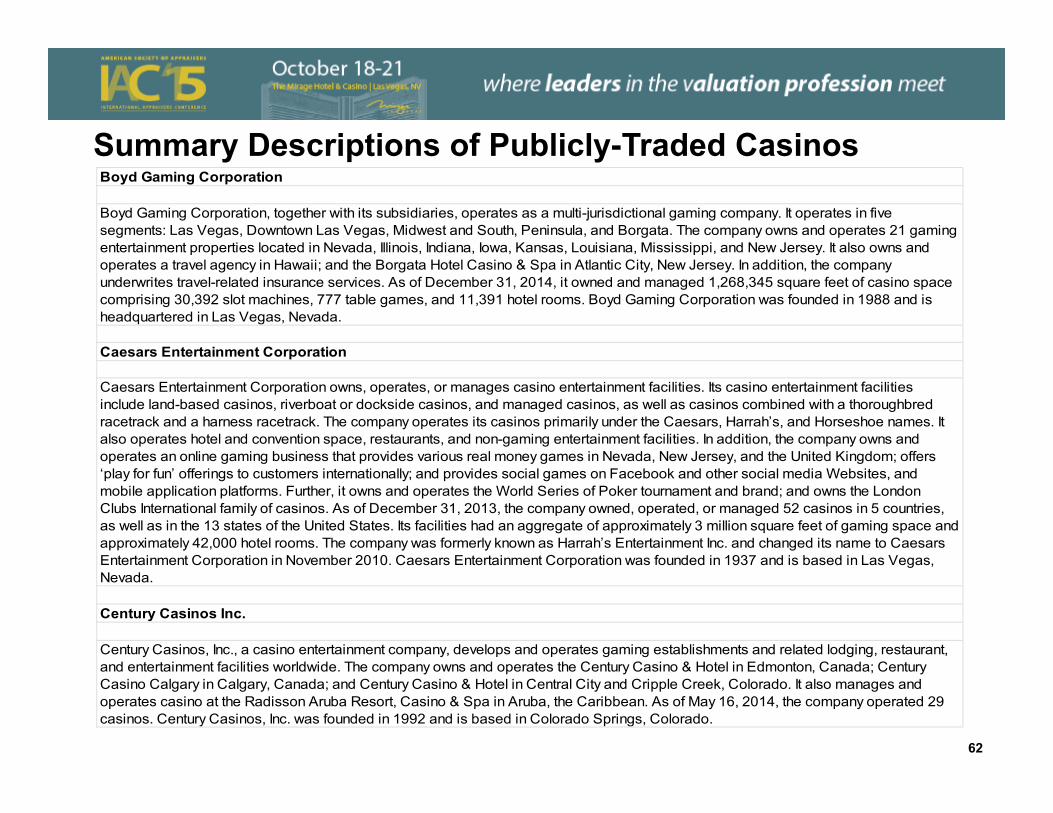
Summary Descriptions of Publicly-Traded CasinosBoyd Gaming Corporation
Boyd Gaming Corporation, together with its subsidiaries, operates as a multi-jurisdictional gaming company. It operates in five segments: Las Vegas, Downtown Las Vegas, Midwest and South, Peninsula, and Borgata. The company owns and operates 21 gaming entertainment properties located in Nevada, Illinois, Indiana, Iowa, Kansas, Louisiana, Mississippi, and New Jersey. It also owns and operates a travel agency in Hawaii; and the Borgata Hotel Casino & Spa in Atlantic City, New Jersey. In addition, the company underwrites travel-related insurance services. As of December 31, 2014, it owned and managed 1,268,345 square feet of casino space comprising 30,392 slot machines, 777 table games, and 11,391 hotel rooms. Boyd Gaming Corporation was founded in 1988 and is headquartered in Las Vegas, Nevada.
Caesars Entertainment Corporation
Caesars Entertainment Corporation owns, operates, or manages casino entertainment facilities. Its casino entertainment facilities include land-based casinos, riverboat or dockside casinos, and managed casinos, as well as casinos combined with a thoroughbred racetrack and a harness racetrack. The company operates its casinos primarily under the Caesars, Harrah’s, and Horseshoe names. It also operates hotel and convention space, restaurants, and non-gaming entertainment facilities. In addition, the company owns and operates an online gaming business that provides various real money games in Nevada, New Jersey, and the United Kingdom; offers ‘play for fun’ offerings to customers internationally; and provides social games on Facebook and other social media Websites, and mobile application platforms. Further, it owns and operates the World Series of Poker tournament and brand; and owns the London Clubs International family of casinos. As of December 31, 2013, the company owned, operated, or managed 52 casinos in 5 countries, as well as in the 13 states of the United States. Its facilities had an aggregate of approximately 3 million square feet of gaming space and approximately 42,000 hotel rooms. The company was formerly known as Harrah’s Entertainment Inc. and changed its name to Caesars Entertainment Corporation in November 2010. Caesars Entertainment Corporation was founded in 1937 and is based in Las Vegas, Nevada.
Century Casinos Inc.
Century Casinos, Inc., a casino entertainment company, develops and operates gaming establishments and related lodging, restaurant, and entertainment facilities worldwide. The company owns and operates the Century Casino & Hotel in Edmonton, Canada; Century Casino Calgary in Calgary, Canada; and Century Casino & Hotel in Central City and Cripple Creek, Colorado. It also manages and operates casino at the Radisson Aruba Resort, Casino & Spa in Aruba, the Caribbean. As of May 16, 2014, the company operated 29 casinos. Century Casinos, Inc. was founded in 1992 and is based in Colorado Springs, Colorado.
62
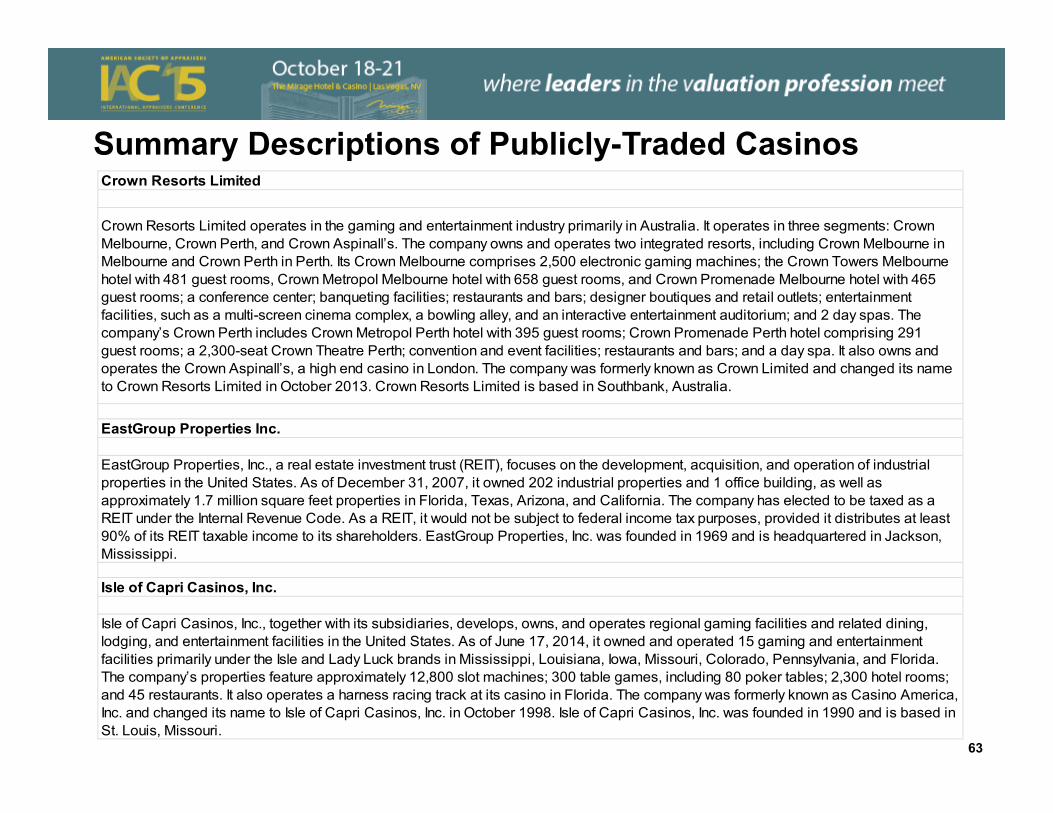
Summary Descriptions of Publicly-Traded CasinosCrown Resorts Limited
Crown Resorts Limited operates in the gaming and entertainment industry primarily in Australia. It operates in three segments: Crown Melbourne, Crown Perth, and Crown Aspinall’s. The company owns and operates two integrated resorts, including Crown Melbourne in Melbourne and Crown Perth in Perth. Its Crown Melbourne comprises 2,500 electronic gaming machines; the Crown Towers Melbourne hotel with 481 guest rooms, Crown Metropol Melbourne hotel with 658 guest rooms, and Crown Promenade Melbourne hotel with 465 guest rooms; a conference center; banqueting facilities; restaurants and bars; designer boutiques and retail outlets; entertainment facilities, such as a multi-screen cinema complex, a bowling alley, and an interactive entertainment auditorium; and 2 day spas. The company’s Crown Perth includes Crown Metropol Perth hotel with 395 guest rooms; Crown Promenade Perth hotel comprising 291 guest rooms; a 2,300-seat Crown Theatre Perth; convention and event facilities; restaurants and bars; and a day spa. It also owns and operates the Crown Aspinall’s, a high end casino in London. The company was formerly known as Crown Limited and changed its name to Crown Resorts Limited in October 2013. Crown Resorts Limited is based in Southbank, Australia.
EastGroup Properties Inc.
EastGroup Properties, Inc., a real estate investment trust (REIT), focuses on the development, acquisition, and operation of industrial properties in the United States. As of December 31, 2007, it owned 202 industrial properties and 1 office building, as well as approximately 1.7 million square feet properties in Florida, Texas, Arizona, and California. The company has elected to be taxed as a REIT under the Internal Revenue Code. As a REIT, it would not be subject to federal income tax purposes, provided it distributes at least 90% of its REIT taxable income to its shareholders. EastGroup Properties, Inc. was founded in 1969 and is headquartered in Jackson, Mississippi.
Isle of Capri Casinos, Inc.
Isle of Capri Casinos, Inc., together with its subsidiaries, develops, owns, and operates regional gaming facilities and related dining, lodging, and entertainment facilities in the United States. As of June 17, 2014, it owned and operated 15 gaming and entertainment facilities primarily under the Isle and Lady Luck brands in Mississippi, Louisiana, Iowa, Missouri, Colorado, Pennsylvania, and Florida. The company’s properties feature approximately 12,800 slot machines; 300 table games, including 80 poker tables; 2,300 hotel rooms; and 45 restaurants. It also operates a harness racing track at its casino in Florida. The company was formerly known as Casino America, Inc. and changed its name to Isle of Capri Casinos, Inc. in October 1998. Isle of Capri Casinos, Inc. was founded in 1990 and is based in St. Louis, Missouri.
63
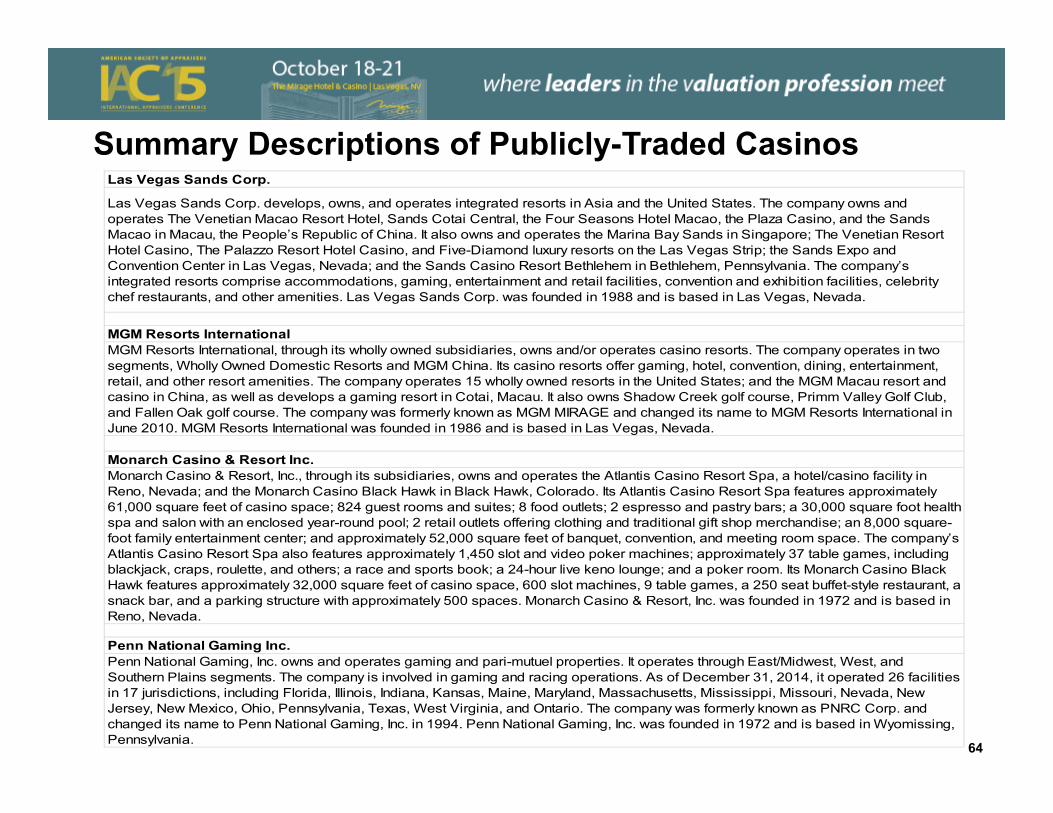
Summary Descriptions of Publicly-Traded CasinosLas Vegas Sands Corp.
Las Vegas Sands Corp. develops, owns, and operates integrated resorts in Asia and the United States. The company owns and operates The Venetian Macao Resort Hotel, Sands Cotai Central, the Four Seasons Hotel Macao, the Plaza Casino, and the Sands Macao in Macau, the People’s Republic of China. It also owns and operates the Marina Bay Sands in Singapore; The Venetian Resort Hotel Casino, The Palazzo Resort Hotel Casino, and Five-Diamond luxury resorts on the Las Vegas Strip; the Sands Expo and Convention Center in Las Vegas, Nevada; and the Sands Casino Resort Bethlehem in Bethlehem, Pennsylvania. The company’s integrated resorts comprise accommodations, gaming, entertainment and retail facilities, convention and exhibition facilities, celebrity chef restaurants, and other amenities. Las Vegas Sands Corp. was founded in 1988 and is based in Las Vegas, Nevada.
MGM Resorts InternationalMGM Resorts International, through its wholly owned subsidiaries, owns and/or operates casino resorts. The company operates in two segments, Wholly Owned Domestic Resorts and MGM China. Its casino resorts offer gaming, hotel, convention, dining, entertainment, retail, and other resort amenities. The company operates 15 wholly owned resorts in the United States; and the MGM Macau resort and casino in China, as well as develops a gaming resort in Cotai, Macau. It also owns Shadow Creek golf course, Primm Valley Golf Club, and Fallen Oak golf course. The company was formerly known as MGM MIRAGE and changed its name to MGM Resorts International in June 2010. MGM Resorts International was founded in 1986 and is based in Las Vegas, Nevada.
Monarch Casino & Resort Inc.Monarch Casino & Resort, Inc., through its subsidiaries, owns and operates the Atlantis Casino Resort Spa, a hotel/casino facility in Reno, Nevada; and the Monarch Casino Black Hawk in Black Hawk, Colorado. Its Atlantis Casino Resort Spa features approximately 61,000 square feet of casino space; 824 guest rooms and suites; 8 food outlets; 2 espresso and pastry bars; a 30,000 square foot health spa and salon with an enclosed year-round pool; 2 retail outlets offering clothing and traditional gift shop merchandise; an 8,000 square-foot family entertainment center; and approximately 52,000 square feet of banquet, convention, and meeting room space. The company’s Atlantis Casino Resort Spa also features approximately 1,450 slot and video poker machines; approximately 37 table games, including blackjack, craps, roulette, and others; a race and sports book; a 24-hour live keno lounge; and a poker room. Its Monarch Casino Black Hawk features approximately 32,000 square feet of casino space, 600 slot machines, 9 table games, a 250 seat buffet-style restaurant, a snack bar, and a parking structure with approximately 500 spaces. Monarch Casino & Resort, Inc. was founded in 1972 and is based in Reno, Nevada.
Penn National Gaming Inc.Penn National Gaming, Inc. owns and operates gaming and pari-mutuel properties. It operates through East/Midwest, West, and Southern Plains segments. The company is involved in gaming and racing operations. As of December 31, 2014, it operated 26 facilities in 17 jurisdictions, including Florida, Illinois, Indiana, Kansas, Maine, Maryland, Massachusetts, Mississippi, Missouri, Nevada, New Jersey, New Mexico, Ohio, Pennsylvania, Texas, West Virginia, and Ontario. The company was formerly known as PNRC Corp. and changed its name to Penn National Gaming, Inc. in 1994. Penn National Gaming, Inc. was founded in 1972 and is based in Wyomissing, Pennsylvania. 64
Transaction Activity
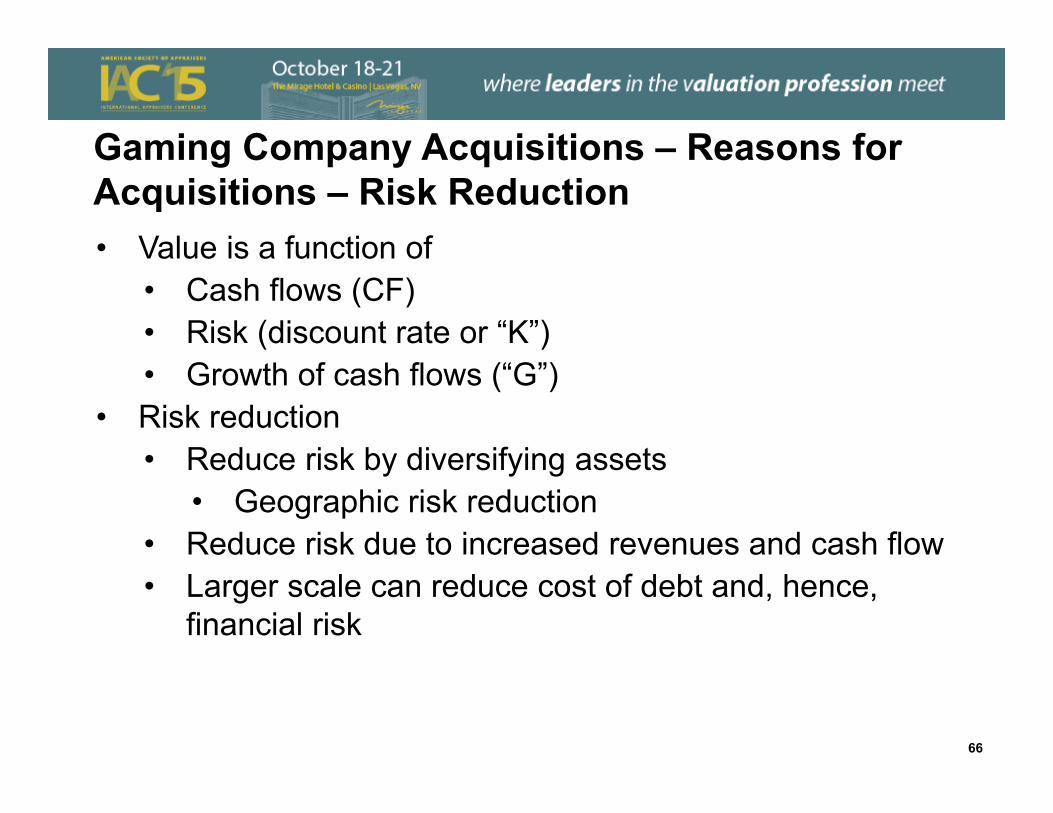
Gaming Company Acquisitions – Reasons for Acquisitions – Risk Reduction• Value is a function of
• Cash flows (CF)• Risk (discount rate or “K”)• Growth of cash flows (“G”)
• Risk reduction• Reduce risk by diversifying assets
• Geographic risk reduction• Reduce risk due to increased revenues and cash flow• Larger scale can reduce cost of debt and, hence,
financial risk
66
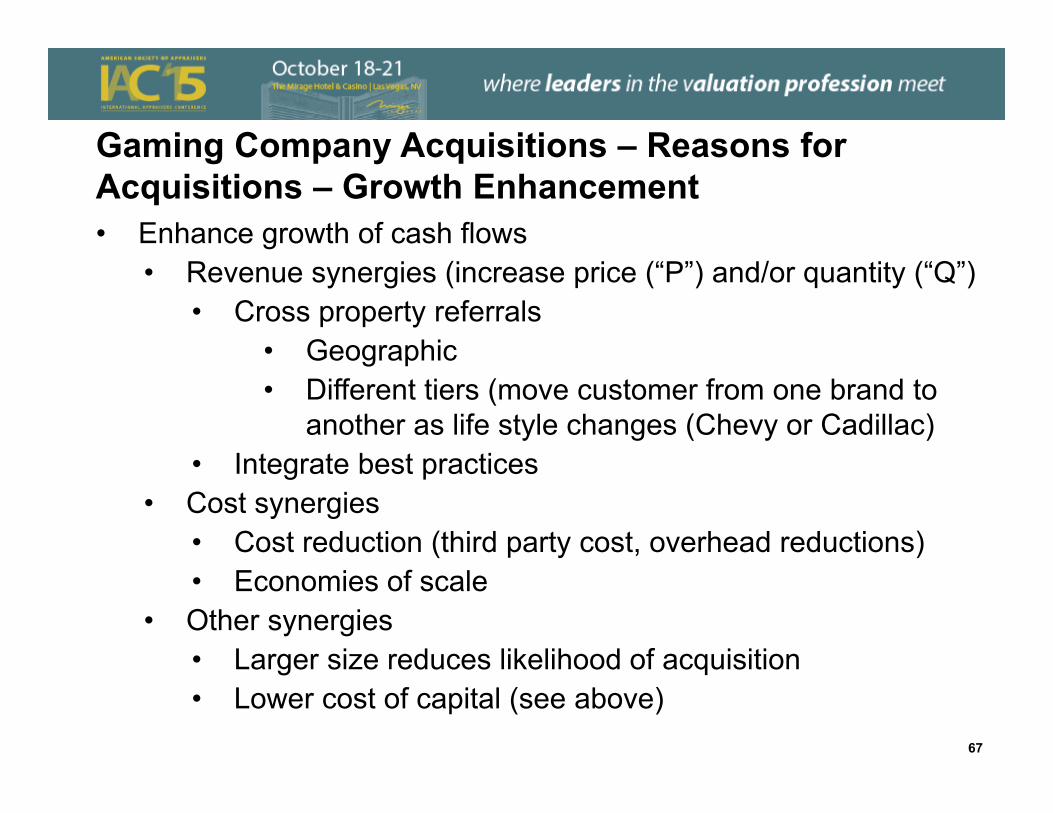
Gaming Company Acquisitions – Reasons for Acquisitions – Growth Enhancement• Enhance growth of cash flows
• Revenue synergies (increase price (“P”) and/or quantity (“Q”)• Cross property referrals
• Geographic• Different tiers (move customer from one brand to
another as life style changes (Chevy or Cadillac)• Integrate best practices
• Cost synergies• Cost reduction (third party cost, overhead reductions)• Economies of scale
• Other synergies• Larger size reduces likelihood of acquisition• Lower cost of capital (see above)
67
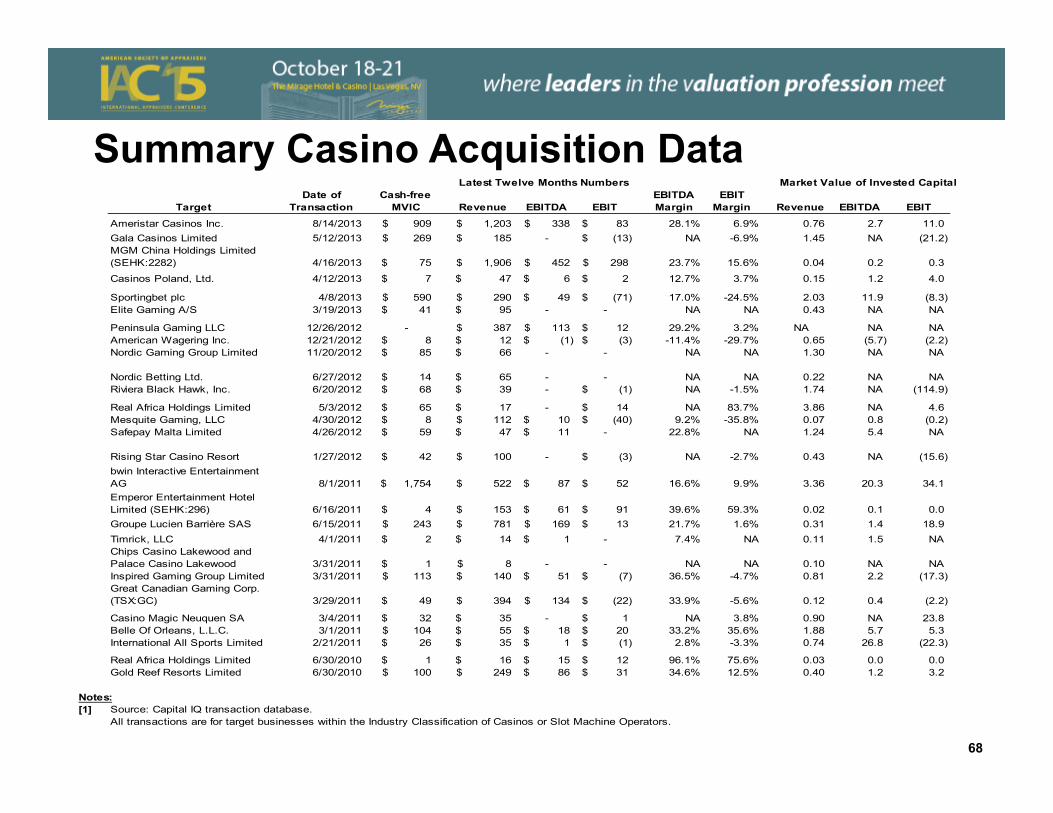
Summary Casino Acquisition Data
68
TargetDate of
TransactionCash-free
MVIC Revenue EBITDA EBITEBITDA Margin
EBIT Margin Revenue EBITDA EBIT
Ameristar Casinos Inc. 8/14/2013 909$ 1,203$ 338$ 83$ 28.1% 6.9% 0.76 2.7 11.0 Gala Casinos Limited 5/12/2013 269$ 185$ - (13)$ NA -6.9% 1.45 NA (21.2) MGM China Holdings Limited (SEHK:2282) 4/16/2013 75$ 1,906$ 452$ 298$ 23.7% 15.6% 0.04 0.2 0.3
Casinos Poland, Ltd. 4/12/2013 7$ 47$ 6$ 2$ 12.7% 3.7% 0.15 1.2 4.0
Sportingbet plc 4/8/2013 590$ 290$ 49$ (71)$ 17.0% -24.5% 2.03 11.9 (8.3) Elite Gaming A/S 3/19/2013 41$ 95$ - - NA NA 0.43 NA NA
Peninsula Gaming LLC 12/26/2012 - 387$ 113$ 12$ 29.2% 3.2% NA NA NAAmerican Wagering Inc. 12/21/2012 8$ 12$ (1)$ (3)$ -11.4% -29.7% 0.65 (5.7) (2.2) Nordic Gaming Group Limited 11/20/2012 85$ 66$ - - NA NA 1.30 NA NA
Nordic Betting Ltd. 6/27/2012 14$ 65$ - - NA NA 0.22 NA NARiviera Black Hawk, Inc. 6/20/2012 68$ 39$ - (1)$ NA -1.5% 1.74 NA (114.9)
Real Africa Holdings Limited 5/3/2012 65$ 17$ - 14$ NA 83.7% 3.86 NA 4.6 Mesquite Gaming, LLC 4/30/2012 8$ 112$ 10$ (40)$ 9.2% -35.8% 0.07 0.8 (0.2) Safepay Malta Limited 4/26/2012 59$ 47$ 11$ - 22.8% NA 1.24 5.4 NA
Rising Star Casino Resort 1/27/2012 42$ 100$ - (3)$ NA -2.7% 0.43 NA (15.6) bwin Interactive Entertainment AG 8/1/2011 1,754$ 522$ 87$ 52$ 16.6% 9.9% 3.36 20.3 34.1 Emperor Entertainment Hotel Limited (SEHK:296) 6/16/2011 4$ 153$ 61$ 91$ 39.6% 59.3% 0.02 0.1 0.0 Groupe Lucien Barrière SAS 6/15/2011 243$ 781$ 169$ 13$ 21.7% 1.6% 0.31 1.4 18.9 Timrick, LLC 4/1/2011 2$ 14$ 1$ - 7.4% NA 0.11 1.5 NAChips Casino Lakewood and Palace Casino Lakewood 3/31/2011 1$ 8$ - - NA NA 0.10 NA NAInspired Gaming Group Limited 3/31/2011 113$ 140$ 51$ (7)$ 36.5% -4.7% 0.81 2.2 (17.3) Great Canadian Gaming Corp. (TSX:GC) 3/29/2011 49$ 394$ 134$ (22)$ 33.9% -5.6% 0.12 0.4 (2.2)
Casino Magic Neuquen SA 3/4/2011 32$ 35$ - 1$ NA 3.8% 0.90 NA 23.8 Belle Of Orleans, L.L.C. 3/1/2011 104$ 55$ 18$ 20$ 33.2% 35.6% 1.88 5.7 5.3 International All Sports Limited 2/21/2011 26$ 35$ 1$ (1)$ 2.8% -3.3% 0.74 26.8 (22.3)
Real Africa Holdings Limited 6/30/2010 1$ 16$ 15$ 12$ 96.1% 75.6% 0.03 0.0 0.0 Gold Reef Resorts Limited 6/30/2010 100$ 249$ 86$ 31$ 34.6% 12.5% 0.40 1.2 3.2
Notes:[1]
All transactions are for target businesses within the Industry Classification of Casinos or Slot Machine Operators.
Latest Twelve Months Numbers Market Value of Invested Capital
Source: Capital IQ transaction database.
Public Casino Acquisitions May Include “Control” Premium
• Control premium represents the difference between the price of a firm before and after an acquisition is announced.• Stock price at $100, acquisition at $130 indicates a 30%
control premium• Control premium may reflect cash flow synergies that a buyer
would obtain• Efficient markets hypothesis makes it difficult to assume control
premium is simply due to market undervaluation of a firm
69
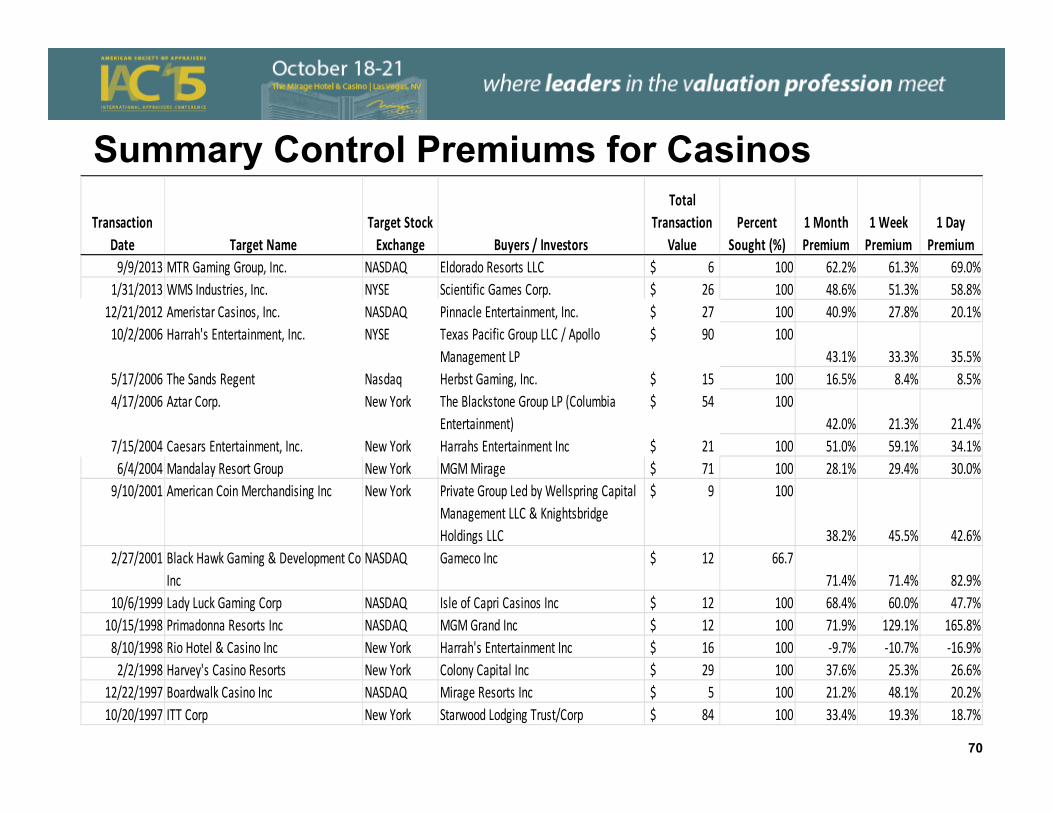
Summary Control Premiums for Casinos
70
Transaction Date Target Name
Target Stock Exchange Buyers / Investors
Total Transaction
ValuePercent
Sought (%)1 Month Premium
1 Week Premium
1 Day Premium
9/9/2013 MTR Gaming Group, Inc. NASDAQ Eldorado Resorts LLC 6$ 100 62.2% 61.3% 69.0%1/31/2013 WMS Industries, Inc. NYSE Scientific Games Corp. 26$ 100 48.6% 51.3% 58.8%12/21/2012 Ameristar Casinos, Inc. NASDAQ Pinnacle Entertainment, Inc. 27$ 100 40.9% 27.8% 20.1%10/2/2006 Harrah's Entertainment, Inc. NYSE Texas Pacific Group LLC / Apollo
Management LP90$ 100
43.1% 33.3% 35.5%5/17/2006 The Sands Regent Nasdaq Herbst Gaming, Inc. 15$ 100 16.5% 8.4% 8.5%4/17/2006 Aztar Corp. New York The Blackstone Group LP (Columbia
Entertainment)54$ 100
42.0% 21.3% 21.4%7/15/2004 Caesars Entertainment, Inc. New York Harrahs Entertainment Inc 21$ 100 51.0% 59.1% 34.1%6/4/2004 Mandalay Resort Group New York MGM Mirage 71$ 100 28.1% 29.4% 30.0%9/10/2001 American Coin Merchandising Inc New York Private Group Led by Wellspring Capital
Management LLC & Knightsbridge Holdings LLC
9$ 100
38.2% 45.5% 42.6%2/27/2001 Black Hawk Gaming & Development Co
IncNASDAQ Gameco Inc 12$ 66.7
71.4% 71.4% 82.9%10/6/1999 Lady Luck Gaming Corp NASDAQ Isle of Capri Casinos Inc 12$ 100 68.4% 60.0% 47.7%10/15/1998 Primadonna Resorts Inc NASDAQ MGM Grand Inc 12$ 100 71.9% 129.1% 165.8%8/10/1998 Rio Hotel & Casino Inc New York Harrah's Entertainment Inc 16$ 100 ‐9.7% ‐10.7% ‐16.9%2/2/1998 Harvey's Casino Resorts New York Colony Capital Inc 29$ 100 37.6% 25.3% 26.6%
12/22/1997 Boardwalk Casino Inc NASDAQ Mirage Resorts Inc 5$ 100 21.2% 48.1% 20.2%10/20/1997 ITT Corp New York Starwood Lodging Trust/Corp 84$ 100 33.4% 19.3% 18.7%
Gaming Company Acquisitions – Transaction Activity
• Globally very significant transaction activity• Domestic U.S. also significant transaction activity
71
Purchase Price Allocations
Purchase Price Allocations Involving Gaming Company Acquisitions• Public companies that acquire businesses must value all of the
underlying assets and liabilities of the acquired companies
• For material transactions, publicly disclosed financial data will include information on the allocation of values to different assets
• Many purchase price allocations will include a residual amount, goodwill, that is recognized
• Purchase price allocation results may vary significantly based on specific elements of each transaction
• The following pages provide summary information on acquisitions of firms and the values ascribed to different assets
73
Purchase Price Allocations – Allocation to Goodwill• Goodwill represents the residual (or difference) between the purchase price
paid and the net assets acquired• A simple example
• Purchase price $100• Sum of fair value of acquired assets $80• Goodwill $20
• The amount of goodwill as a percent of purchase price can vary markedly• Buyer overpays – more goodwill• Buyer gets bargain purchase (believed to be rare except for some
distress sales) – less or even no goodwill• Buyer pays seller for unique buyer specific synergies rather than market
participant synergies (synergies that strategic buyers would expect)• Mix of assets and their economic lives can have a significant influence
on the amount of residual goodwill• For financial reporting, work force is not recognized as an asset
74
Purchase Price Allocations – Allocation to Goodwill - Example• Morgans Hotel Group acquired certain assets pertaining to the Hard Rock
Hotel & Casino• Existing hotel and casino• Adjacent land which was fully entitled for expansion• Intellectual property –
• Perpetual, royalty-free license to use the “Hard Rock Hotel” and “Hard Rock Casino” trademarks for casinos in the following territories
• In the US, west of Mississippi River• Illinois and Louisiana• Greater Houston area• Australia, Brazil, Israel and Venezuela and Vancouver,
Canada• Other brands including The Joint, RockSpa, Rehab, Love Jones and
others
75
Purchase Price Allocations – Identified Intangibles• Casino acquisitions where the buyer is a public company can provide
insights on intangible assets associated with a casino. • Review of SEC filings by various firms indicated the following
intangible assets were recognized• Gaming licenses• Trademarks• Customer relationships• Customer lists• Contract rights• Patented technology• Favorable leases• Other
76
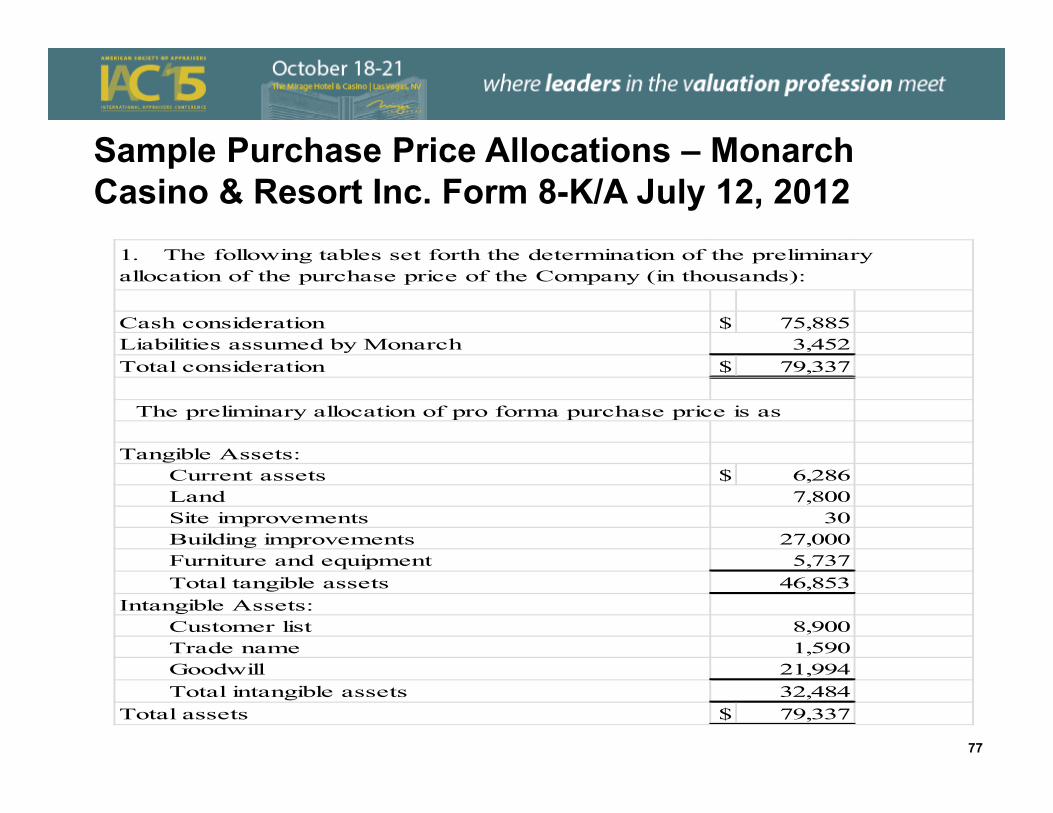
Sample Purchase Price Allocations – Monarch Casino & Resort Inc. Form 8-K/A July 12, 2012
Cash consideration $ 75,885Liabilities assumed by MonarchTotal consideration $ 79,337
Tangible Assets:Current assets $ 6,286LandSite improvementsBuilding improvementsFurniture and equipmentTotal tangible assets
Intangible Assets:Customer listTrade nameGoodwillTotal intangible assets
Total assets $ 79,337
1,59021,99432,484
1. The following tables set forth the determination of the preliminary allocation of the purchase price of the Company (in thousands):
3027,0005,737
46,853
8,900
3,452
The preliminary allocation of pro forma purchase price is as
7,800
77
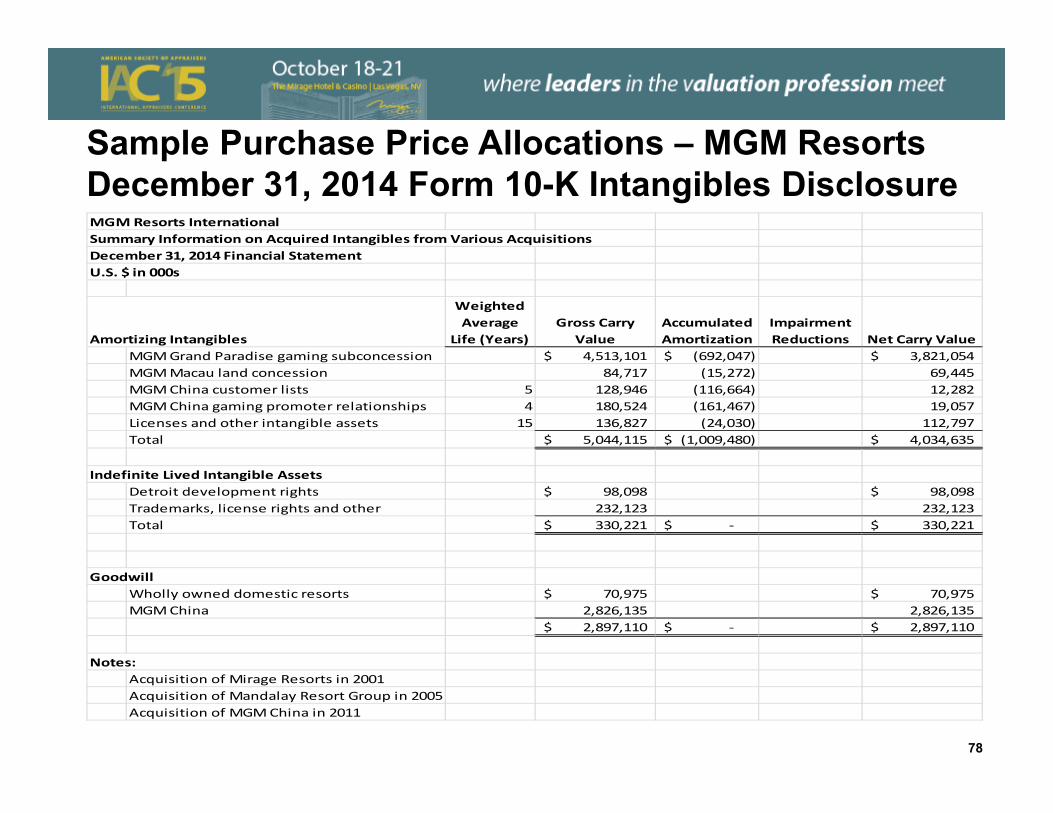
Sample Purchase Price Allocations – MGM Resorts December 31, 2014 Form 10-K Intangibles DisclosureMGM Resorts InternationalSummary Information on Acquired Intangibles from Various AcquisitionsDecember 31, 2014 Financial StatementU.S. $ in 000s
Amortizing Intangibles
Weighted Average
Life (Years)Gross Carry
ValueAccumulated Amortization
Impairment Reductions Net Carry Value
MGM Grand Paradise gaming subconcession 4,513,101$ (692,047)$ 3,821,054$ MGM Macau land concession 84,717 (15,272) 69,445 MGM China customer lists 5 128,946 (116,664) 12,282 MGM China gaming promoter relationships 4 180,524 (161,467) 19,057 Licenses and other intangible assets 15 136,827 (24,030) 112,797 Total 5,044,115$ (1,009,480)$ 4,034,635$
Indefinite Lived Intangible AssetsDetroit development rights 98,098$ 98,098$ Trademarks, license rights and other 232,123 232,123 Total 330,221$ ‐$ 330,221$
GoodwillWholly owned domestic resorts 70,975$ 70,975$ MGM China 2,826,135 2,826,135
2,897,110$ ‐$ 2,897,110$
Notes:Acquisition of Mirage Resorts in 2001Acquisition of Mandalay Resort Group in 2005Acquisition of MGM China in 2011
78
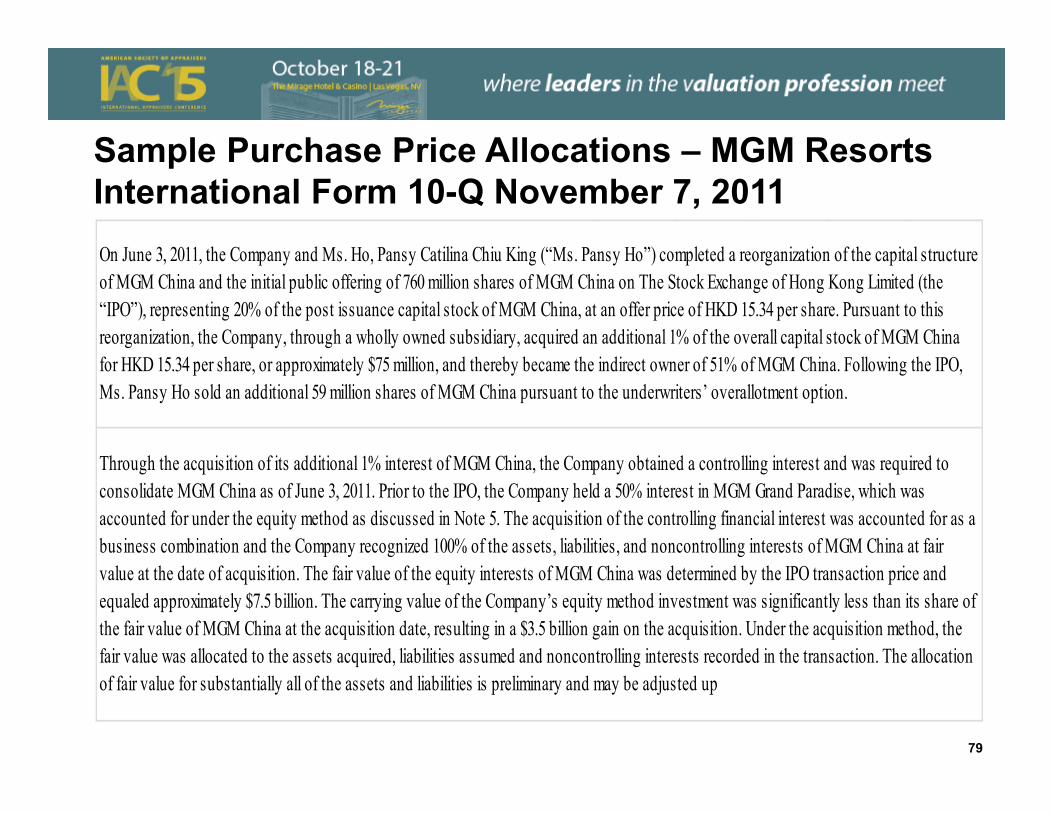
Sample Purchase Price Allocations – MGM Resorts International Form 10-Q November 7, 2011 On June 3, 2011, the Company and Ms. Ho, Pansy Catilina Chiu King (“Ms. Pansy Ho”) completed a reorganization of the capital structure of MGM China and the initial public offering of 760 million shares of MGM China on The Stock Exchange of Hong Kong Limited (the “IPO”), representing 20% of the post issuance capital stock of MGM China, at an offer price of HKD 15.34 per share. Pursuant to this reorganization, the Company, through a wholly owned subsidiary, acquired an additional 1% of the overall capital stock of MGM China for HKD 15.34 per share, or approximately $75 million, and thereby became the indirect owner of 51% of MGM China. Following the IPO, Ms. Pansy Ho sold an additional 59 million shares of MGM China pursuant to the underwriters’ overallotment option.
Through the acquisition of its additional 1% interest of MGM China, the Company obtained a controlling interest and was required to consolidate MGM China as of June 3, 2011. Prior to the IPO, the Company held a 50% interest in MGM Grand Paradise, which was accounted for under the equity method as discussed in Note 5. The acquisition of the controlling financial interest was accounted for as a business combination and the Company recognized 100% of the assets, liabilities, and noncontrolling interests of MGM China at fair value at the date of acquisition. The fair value of the equity interests of MGM China was determined by the IPO transaction price and equaled approximately $7.5 billion. The carrying value of the Company’s equity method investment was significantly less than its share of the fair value of MGM China at the acquisition date, resulting in a $3.5 billion gain on the acquisition. Under the acquisition method, the fair value was allocated to the assets acquired, liabilities assumed and noncontrolling interests recorded in the transaction. The allocation of fair value for substantially all of the assets and liabilities is preliminary and may be adjusted up
79
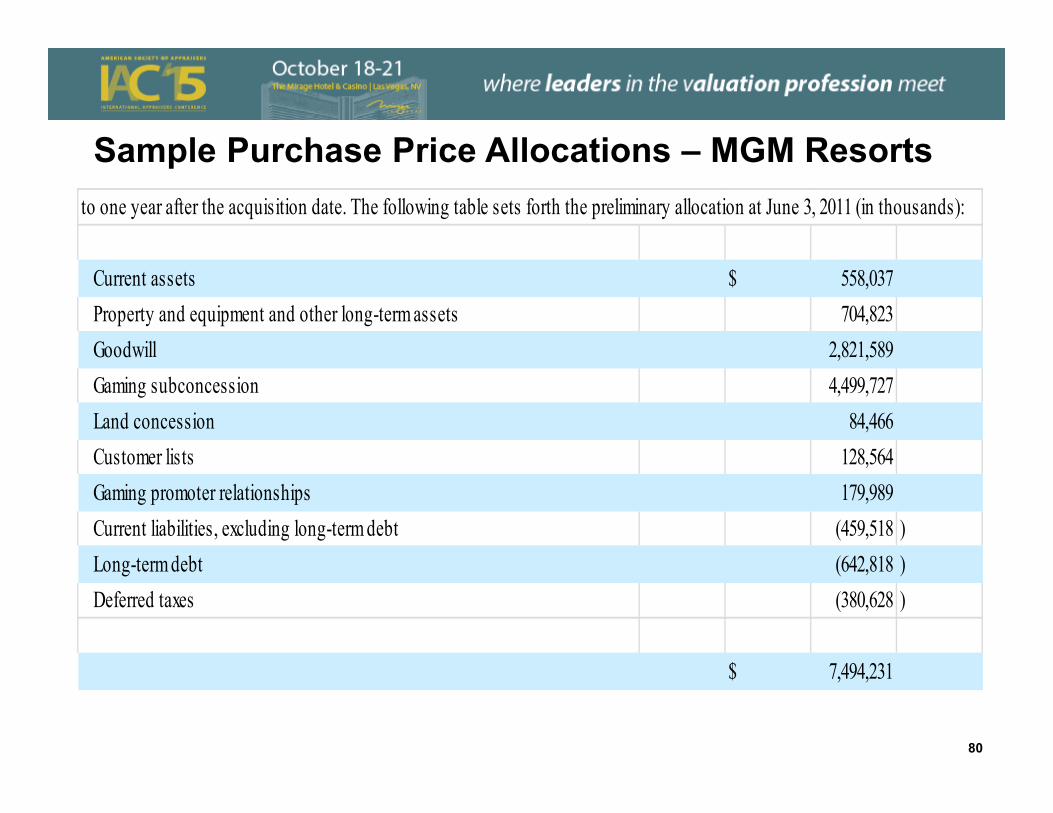
Sample Purchase Price Allocations – MGM Resorts to one year after the acquisition date. The following table sets forth the preliminary allocation at June 3, 2011 (in thousands):
Current assets $ 558,037Property and equipment and other long-term assets 704,823Goodwill 2,821,589Gaming subconcession 4,499,727Land concession 84,466Customer lists 128,564Gaming promoter relationships 179,989Current liabilities, excluding long-term debt (459,518 ) Long-term debt (642,818 ) Deferred taxes (380,628 )
$ 7,494,231
80
Sample Purchase Price Allocations – MGM Resorts
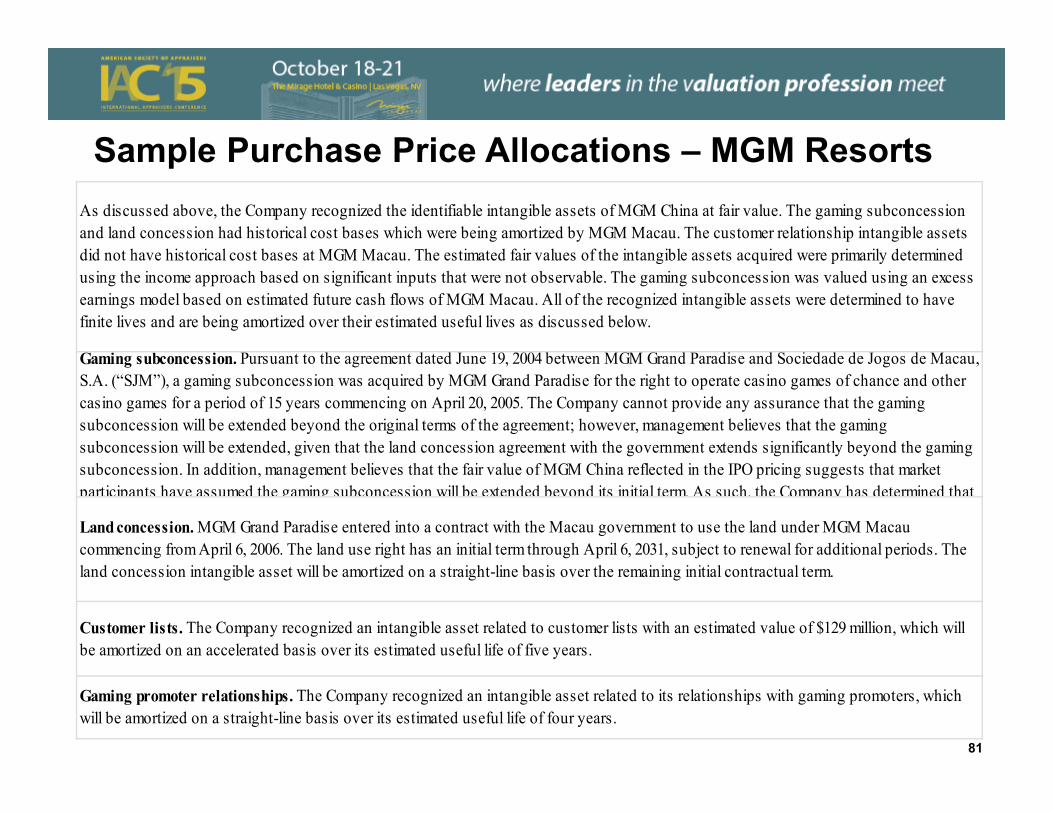
Gaming promoter relationships. The Company recognized an intangible asset related to its relationships with gaming promoters, which will be amortized on a straight-line basis over its estimated useful life of four years.
As discussed above, the Company recognized the identifiable intangible assets of MGM China at fair value. The gaming subconcession and land concession had historical cost bases which were being amortized by MGM Macau. The customer relationship intangible assets did not have historical cost bases at MGM Macau. The estimated fair values of the intangible assets acquired were primarily determined using the income approach based on significant inputs that were not observable. The gaming subconcession was valued using an excess earnings model based on estimated future cash flows of MGM Macau. All of the recognized intangible assets were determined to have finite lives and are being amortized over their estimated useful lives as discussed below.
Gaming subconcession. Pursuant to the agreement dated June 19, 2004 between MGM Grand Paradise and Sociedade de Jogos de Macau, S.A. (“SJM”), a gaming subconcession was acquired by MGM Grand Paradise for the right to operate casino games of chance and other casino games for a period of 15 years commencing on April 20, 2005. The Company cannot provide any assurance that the gaming subconcession will be extended beyond the original terms of the agreement; however, management believes that the gaming subconcession will be extended, given that the land concession agreement with the government extends significantly beyond the gaming subconcession. In addition, management believes that the fair value of MGM China reflected in the IPO pricing suggests that market participants have assumed the gaming subconcession will be extended beyond its initial term. As such, the Company has determined that
Land concession. MGM Grand Paradise entered into a contract with the Macau government to use the land under MGM Macau commencing from April 6, 2006. The land use right has an initial term through April 6, 2031, subject to renewal for additional periods. The land concession intangible asset will be amortized on a straight-line basis over the remaining initial contractual term.
Customer lists. The Company recognized an intangible asset related to customer lists with an estimated value of $129 million, which will be amortized on an accelerated basis over its estimated useful life of five years.
81
Sample Purchase Price Allocations – Full House Resorts Inc. Form 10-Q November 9, 2011
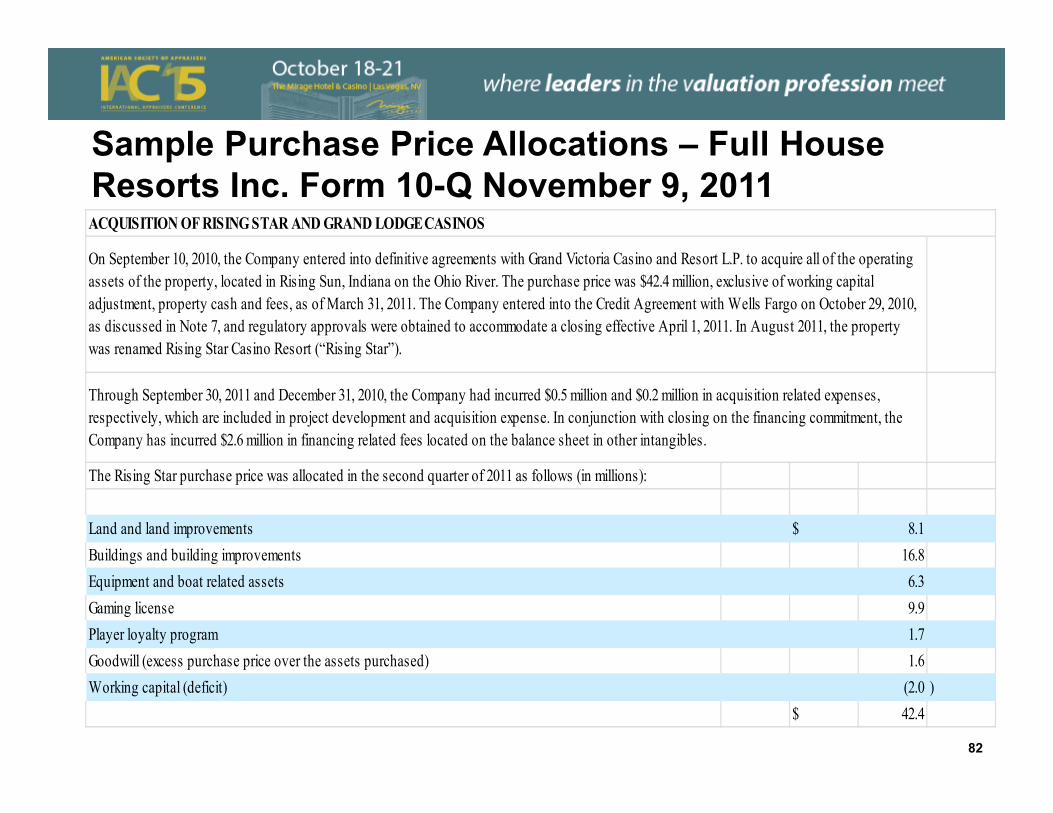
The Rising Star purchase price was allocated in the second quarter of 2011 as follows (in millions):
Land and land improvements $ 8.1Buildings and building improvements 16.8Equipment and boat related assets 6.3Gaming license 9.9Player loyalty program 1.7Goodwill (excess purchase price over the assets purchased) 1.6Working capital (deficit) (2.0 )
$ 42.4
ACQUISITION OF RISING STAR AND GRAND LODGE CASINOS
On September 10, 2010, the Company entered into definitive agreements with Grand Victoria Casino and Resort L.P. to acquire all of the operating assets of the property, located in Rising Sun, Indiana on the Ohio River. The purchase price was $42.4 million, exclusive of working capital adjustment, property cash and fees, as of March 31, 2011. The Company entered into the Credit Agreement with Wells Fargo on October 29, 2010, as discussed in Note 7, and regulatory approvals were obtained to accommodate a closing effective April 1, 2011. In August 2011, the property was renamed Rising Star Casino Resort (“Rising Star”).
Through September 30, 2011 and December 31, 2010, the Company had incurred $0.5 million and $0.2 million in acquisition related expenses, respectively, which are included in project development and acquisition expense. In conjunction with closing on the financing commitment, the Company has incurred $2.6 million in financing related fees located on the balance sheet in other intangibles.
82
Sample Purchase Price Allocations – Full House Intangible Assets per Form 10-K December 31, 2012
83
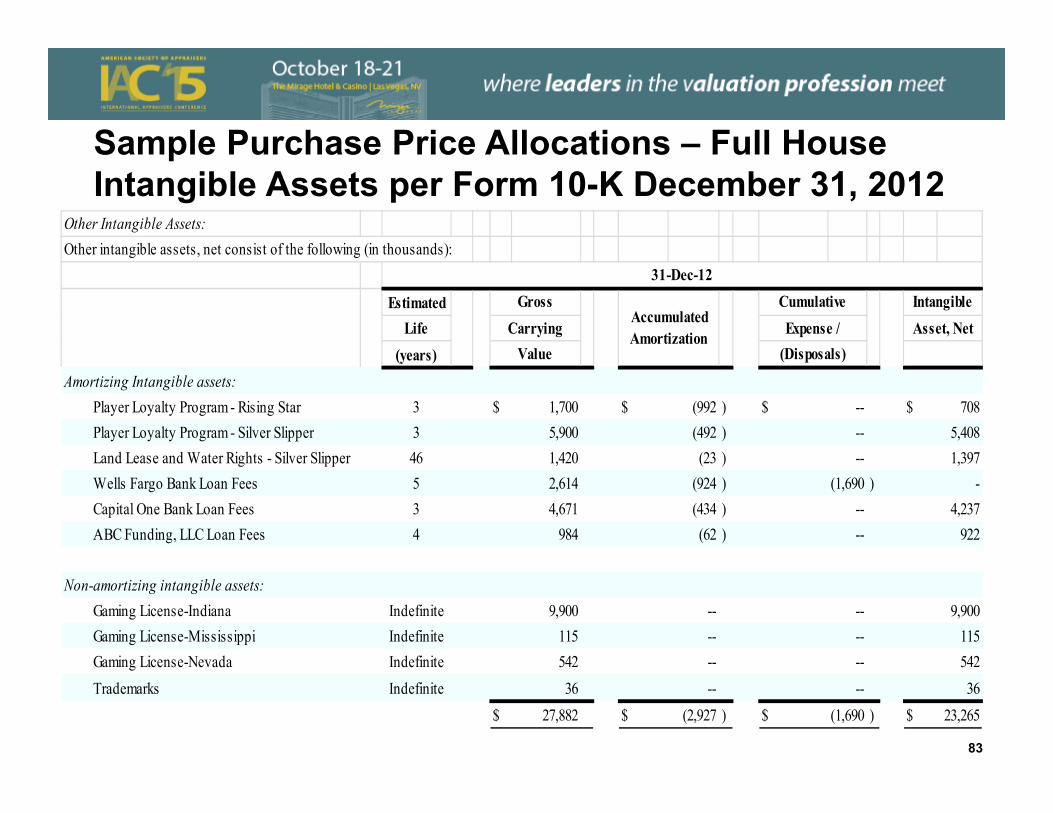
Other Intangible Assets:Other intangible assets, net consist of the following (in thousands):
EstimatedLife
(years)Amortizing Intangible assets:
Player Loyalty Program - Rising Star 3 $ 1,700 $ (992 ) $ -- $ 708Player Loyalty Program - Silver Slipper 3 5,900 (492 ) -- 5,408Land Lease and Water Rights - Silver Slipper 46 1,420 (23 ) -- 1,397Wells Fargo Bank Loan Fees 5 2,614 (924 ) (1,690 ) -Capital One Bank Loan Fees 3 4,671 (434 ) -- 4,237ABC Funding, LLC Loan Fees 4 984 (62 ) -- 922
Non-amortizing intangible assets:Gaming License-Indiana Indefinite 9,900 -- -- 9,900Gaming License-Mississippi Indefinite 115 -- -- 115Gaming License-Nevada Indefinite 542 -- -- 542Trademarks Indefinite 36 -- -- 36
$ 27,882 $ (2,927 ) $ (1,690 ) $ 23,265
CumulativeExpense /
(Disposals)Carrying
Value
Accumulated Amortization
31-Dec-12Gross Intangible
Asset, Net
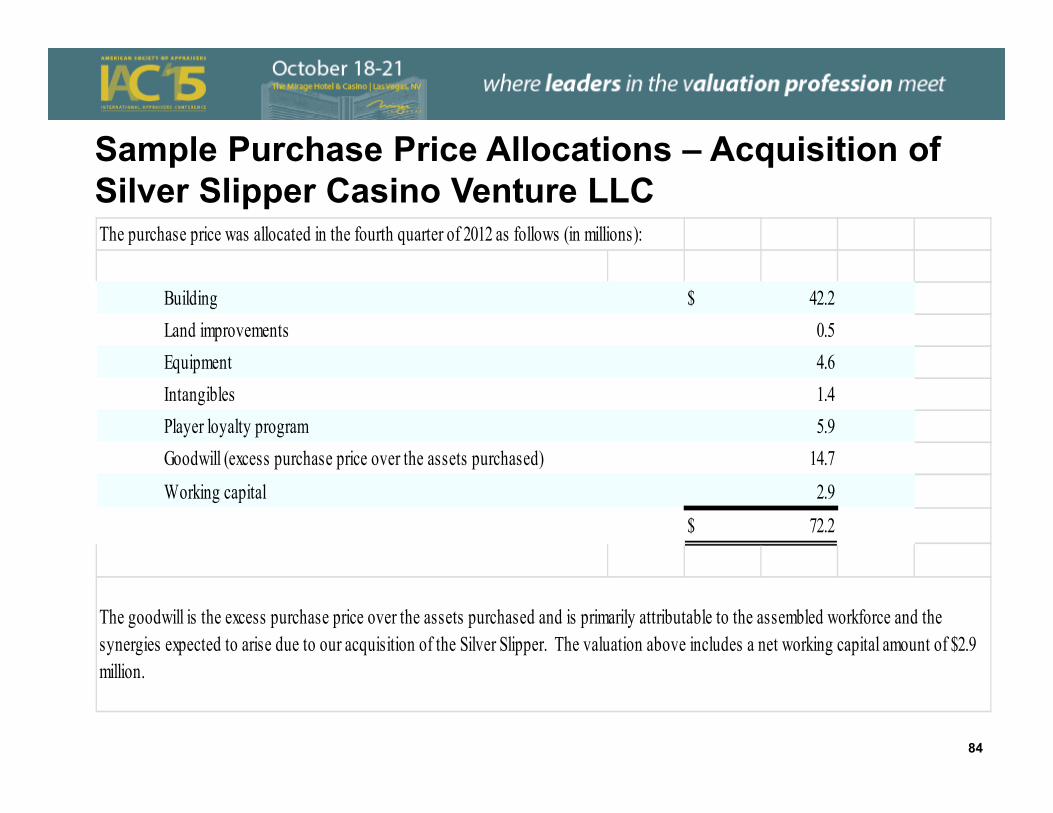
Sample Purchase Price Allocations – Acquisition of Silver Slipper Casino Venture LLC The purchase price was allocated in the fourth quarter of 2012 as follows (in millions):
Building $ 42.2Land improvements 0.5Equipment 4.6Intangibles 1.4Player loyalty program 5.9Goodwill (excess purchase price over the assets purchased) 14.7Working capital 2.9
$ 72.2
The goodwill is the excess purchase price over the assets purchased and is primarily attributable to the assembled workforce and the synergies expected to arise due to our acquisition of the Silver Slipper. The valuation above includes a net working capital amount of $2.9 million.
84
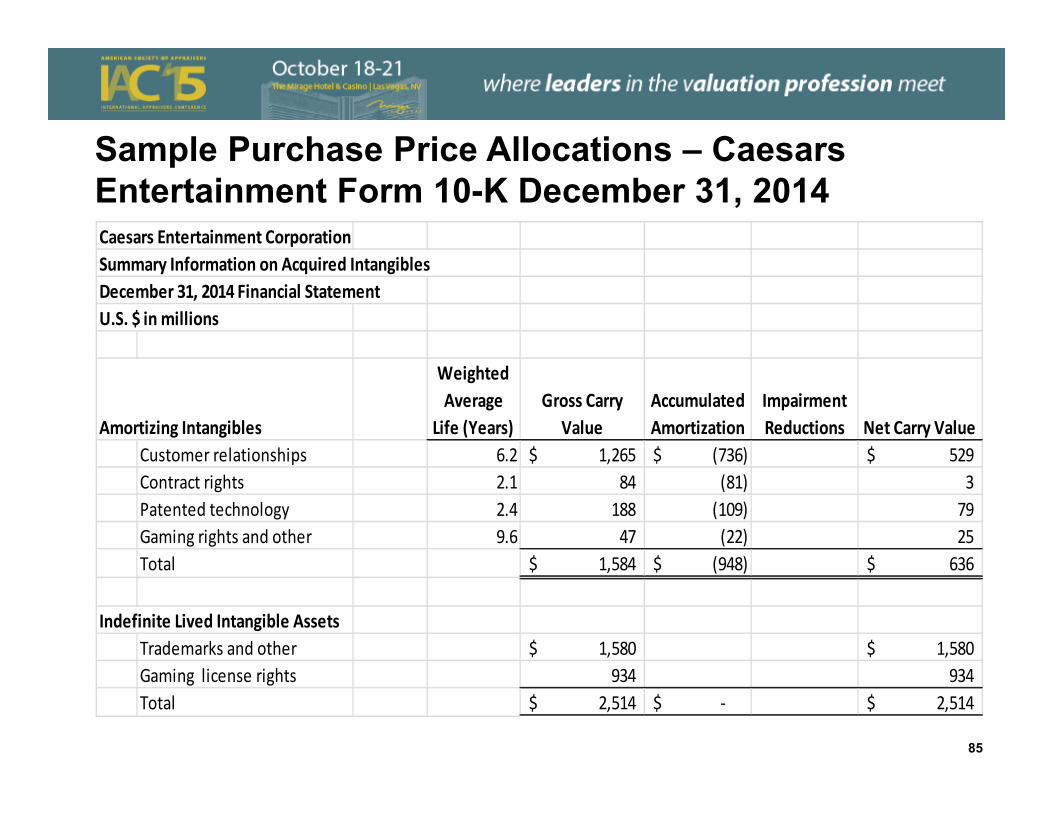
Sample Purchase Price Allocations – Caesars Entertainment Form 10-K December 31, 2014Caesars Entertainment CorporationSummary Information on Acquired IntangiblesDecember 31, 2014 Financial StatementU.S. $ in millions
Amortizing Intangibles
Weighted Average
Life (Years)Gross Carry
ValueAccumulated Amortization
Impairment Reductions Net Carry Value
Customer relationships 6.2 1,265$ (736)$ 529$ Contract rights 2.1 84 (81) 3 Patented technology 2.4 188 (109) 79 Gaming rights and other 9.6 47 (22) 25 Total 1,584$ (948)$ 636$
Indefinite Lived Intangible AssetsTrademarks and other 1,580$ 1,580$ Gaming license rights 934 934 Total 2,514$ ‐$ 2,514$
85
Section 3: Multi-Discipline Valuation Issues
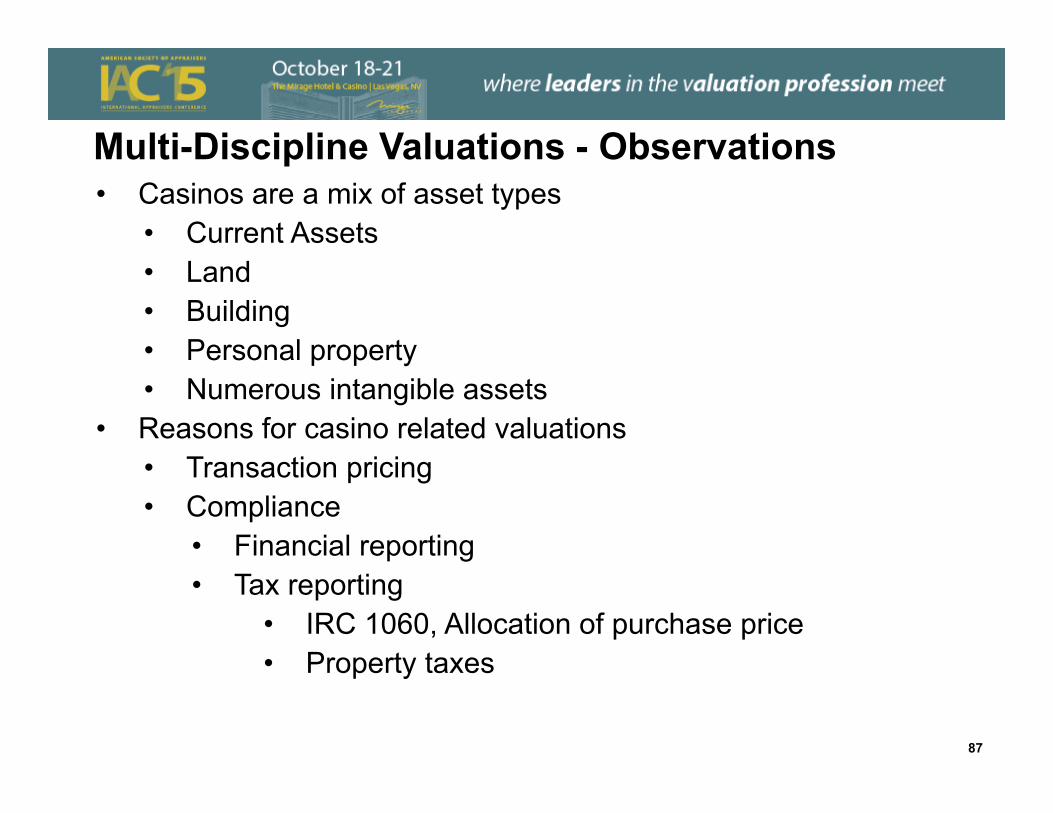
Multi-Discipline Valuations - Observations• Casinos are a mix of asset types
• Current Assets• Land• Building• Personal property• Numerous intangible assets
• Reasons for casino related valuations• Transaction pricing• Compliance
• Financial reporting• Tax reporting
• IRC 1060, Allocation of purchase price• Property taxes
87
Questions
Presenter’s Bio—Raymond RathArea of FocusManaging Director at Globalview Advisors LLC. Independent valuation firm with offices in Irvine, Boston and London.Recognized leader in the valuation of businesses, securities interests and intangible assets. Performs valuation projects for financial and tax reporting, transactions and litigation projects. Extremely active in enhancing the quality of valuation practice both domestically and internationally. Organize and moderate eight annual one-day conferences for the American Society of Appraisers on fair value issues including presentations by staff of the SEC, PCAOB, FASB and IASB. Led the development of two three-day valuation courses for the American Society of Appraisers (ASA) - Valuation of Intangible Assets and Special Topics in the Valuation of Intangible Assets. Led efforts resulting in an education and certification program for an Intangible Assets valuation specialty designation.
89
Presenter’s Bio—Raymond Rath
Professional ExperienceManaging Director, Globalview Advisors, LLC, November 2012 to present.
Director, Transaction Services, Valuation Services Practice, PricewaterhouseCoopers LLP, April 2002 to October 2012.
Senior Manager, Valuation Services Practice, KPMG LLP and KPMG Consulting, Inc. 1994 to April 2002.
Experienced Manager, Arthur Andersen & Co., 1987 to 1994, Senior Consultant, 1984 to 1987.
90
Presenter’s Bio—Raymond RathProfessional AffiliationsMember, AICPA Investment Companies Task Force for AICPA Accounting and
Valuation Guide, Determining Fair Value of Portfolio Company Investments of Venture Capital and Private Equity Firms and other Investment Companies. Guide is presently in development.
Treasurer, Business Valuation Committee of the American Society of Appraisers. Past Secretary and Member, Business Valuation Committee of the ASA. Elected
by ASA international business valuation membership twice (maximum allowed).
Past President, Los Angeles Chapter of ASA (2004-2005). Accredited Senior Appraiser (“ASA”), American Society of Appraisers. Accredited
in Business, Intangible Asset valuation & Appraisal Review & Management.Chartered Financial Analyst (“CFA”), CFA Institute.Member, Appraisal Issues Task Force.
91
Presenter’s Bio—Raymond Rath
Course Development and InstructionLead Developer and Instructor, ASA courses Valuation of Intangible Assets (BV
301) and Special Topics in the Valuation of Intangible Assets (BV 302).Organize and moderate nine ASA Annual Fair Value Conferences (May 2006 -
2014) for the ASA. Presenters include SEC, PCAOB, FASB and IFRS.Instructor, ASC courses BV 201, 202, 203 and 204. Course Developer and Instructor, IIBV 301, Valuation of Intangible Assets, in Sao
Paolo, Brazil. June 2012.Instructor, Current Developments in Valuation, Beijing, China, December 2010.
92
Presenter’s Bio—Raymond Rath
PresentationsCo-Presenter, Deferred Revenue Valuation, ASA / CICBV Business Valuation
Conference, Toronto, Canada, October 2014Presenter, Valuation Developments in the United States, 2nd International Forum
on New Developments in Valuation, WuHan, China, November 2012.Lecturer, Valuation of Intangible Assets, Zhongnan University of Economics and
Law, WuHan, China, November 2012.Moderator, Fair Value Auditor Panel, ASA Conference, Chicago, IL 2011.Panelist, IPR&D Toolkit Update Panel, ASA Conference, Chicago, IL 2011.Co-Presenter, Valuation of Debt, ASA, Miami, FL 2010.Presenter, Valuation of Intangible Assets, 25th Pan Pacific Conference, Bali,
Indonesia, September 2010. Presenter, Attrition Measurement and Estimation, ASA Conference, Boston, MA,
Oct 2009.
93
Presenter’s Bio—Raymond Rath
PublicationsAuthor, Private Company Valuation, chapter in the CFA Institute text Equity Asset
Valuation. Chapter is a required reading for CFA level 2 candidates globally.Author, Intangible Asset Valuation: The Distributor Method, Financial Valuation
and Litigation Expert, FVLE Issue 41, February/March 2013.
EducationM.B.A., University of Southern California.B.S., Business Administration, University of Kansas, Cum Laude.
94
END