
Case Study: MEA Nonthaburi District Area (Bangkok, Thailand) · 95 Chapter 4 Case Study: MEA...
23
Chapter 4 Case Study: MEA Nonthaburi District Area (Bangkok, Thailand) This chapter should be cited as Li, Y. (2015), ‘Case Study: MEA Nonthaburi District Area (Bangkok, Thailand’, in Advancing the Energy Management System in the East Asia Summit Region. ERIA Research Project Report 2014-39, Jakarta: ERIA, pp.95-116. Available at: http://www.eria.org/RPR_FY2014_No.39_Chapter_4.pdf
Transcript of Case Study: MEA Nonthaburi District Area (Bangkok, Thailand) · 95 Chapter 4 Case Study: MEA...

Chapter 4
Case Study: MEA Nonthaburi District Area (Bangkok,
Thailand)
This chapter should be cited as
Li, Y. (2015), ‘Case Study: MEA Nonthaburi District Area (Bangkok, Thailand’, in Advancing the Energy Management System in the East Asia Summit Region. ERIA Research Project Report 2014-39, Jakarta: ERIA, pp.95-116. Available at: http://www.eria.org/RPR_FY2014_No.39_Chapter_4.pdf
95
Chapter 4
Case Study: MEA Nonthaburi District Area (Bangkok, Thailand)
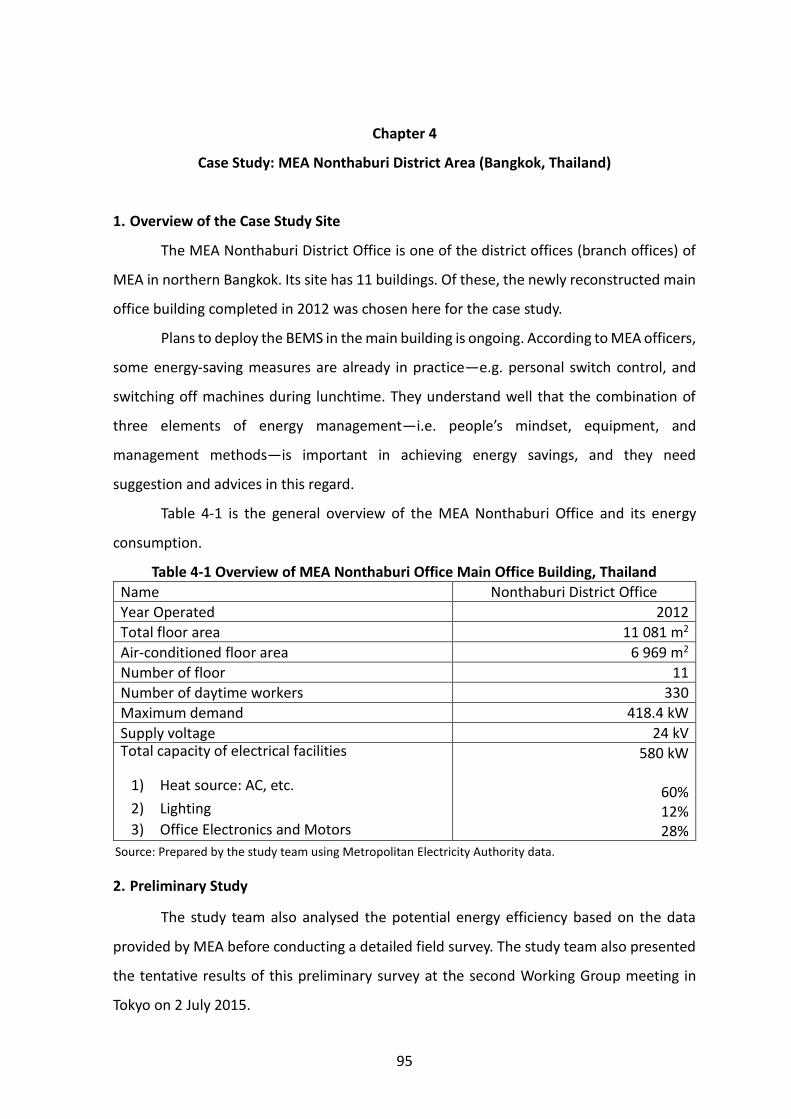
1. Overview of the Case Study Site
The MEA Nonthaburi District Office is one of the district offices (branch offices) of
MEA in northern Bangkok. Its site has 11 buildings. Of these, the newly reconstructed main
office building completed in 2012 was chosen here for the case study.
Plans to deploy the BEMS in the main building is ongoing. According to MEA officers,
some energy-saving measures are already in practice—e.g. personal switch control, and
switching off machines during lunchtime. They understand well that the combination of
three elements of energy management—i.e. people’s mindset, equipment, and
management methods—is important in achieving energy savings, and they need
suggestion and advices in this regard.
Table 4-1 is the general overview of the MEA Nonthaburi Office and its energy
consumption.
Table 4-1 Overview of MEA Nonthaburi Office Main Office Building, Thailand
Name Nonthaburi District Office
Year Operated 2012
Total floor area 11 081 m2
Air-conditioned floor area 6 969 m2
Number of floor 11
Number of daytime workers 330
Maximum demand 418.4 kW
Supply voltage 24 kV Total capacity of electrical facilities
1) Heat source: AC, etc.
2) Lighting
3) Office Electronics and Motors
580 kW
60% 12% 28%
Source: Prepared by the study team using Metropolitan Electricity Authority data.
2. Preliminary Study
The study team also analysed the potential energy efficiency based on the data
provided by MEA before conducting a detailed field survey. The study team also presented
the tentative results of this preliminary survey at the second Working Group meeting in
Tokyo on 2 July 2015.

96
2.1. Energy saving target
At the Main Office building of the MEA Nonthaburi District Office, power demand
is metered every 15 minutes. The actual load profile of the building for a week (30 March–
5 April 2015) is shown in Figure 4-1.
Figure 4-1. Weekly Load Profile of Nonthaburi Main Office Building (30 March 2015 – 5 April 2015)
Source: Prepared by the study team using Metropolitan Electricity Authority data.
Like PLN Yayasan Building, the load profile of Nonthaburi Main Office Building
follows a pattern. On weekdays, the load increases at the start of the working hours. After
maintaining a constant level (300-400 kW), it starts decreasing to the off-peak load in the
evening (about 20 kW). The load at night is almost constant at about 20 kW. On Saturdays,
it increases during the daytime although not as much as that on weekdays, because some
employees work in the office even on weekends.
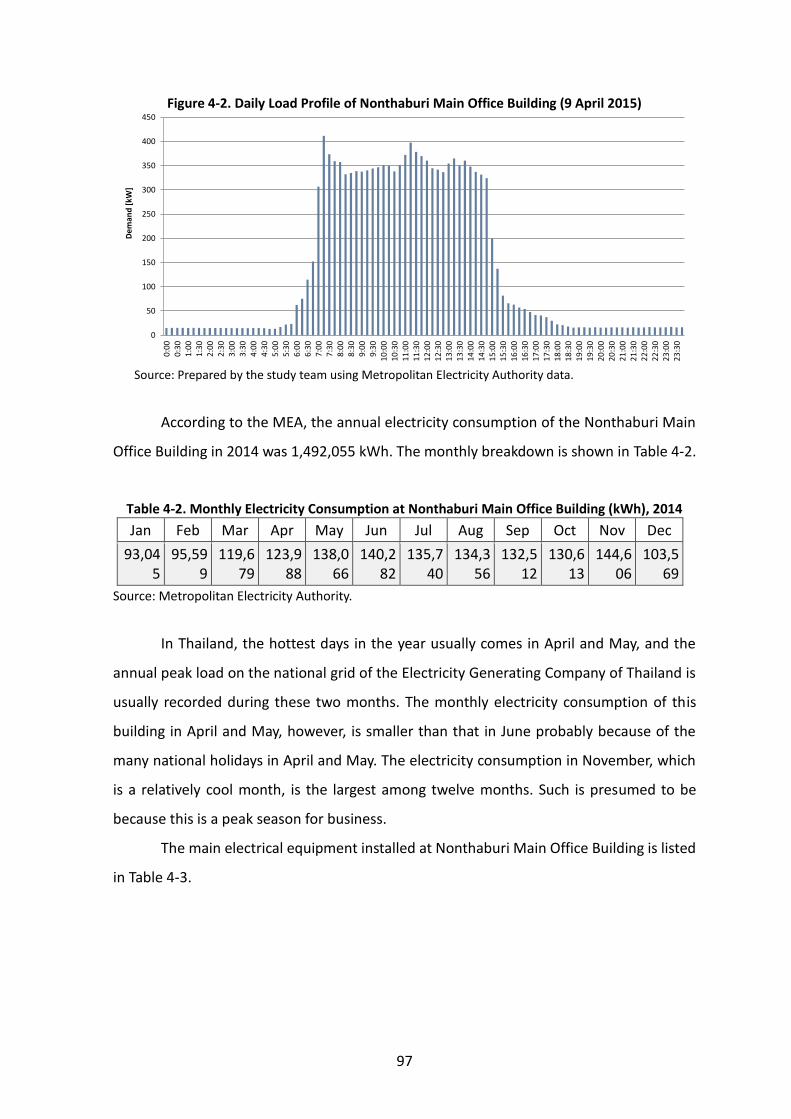
Figure 4-2 shows the daily load profile on 9 April 2015. The load starts increasing
rapidly at 05:30 and, after hitting the daily peak at 07:00, slightly decreases, before settling
at around 350 kW until 15:00. Then, the load starts dropping rapidly, although not as fast
as the increase in the morning, and almost reaches the bottom load at around 18:30.
0
50
100
150
200
250
300
350
400
450
0:0
0
3:4
5
7:3
0
11
:15
15
:00
18
:45
22
:30
2:1
5
6:0
0
9:4
5
13
:30
17
:15
21
:00
0:4
5
4:3
0
8:1
5
12
:00
15
:45
19
:30
23
:15
3:0
0
6:4
5
10
:30
14
:15
18
:00
21
:45
1:3
0
5:1
5
9:0
0
12
:45
16
:30
20
:15
0:0
0
3:4
5
7:3
0
11
:15
15
:00
18
:45
22
:30
2:1
5
6:0
0
9:4
5
13
:30
17
:15
21
:00
30 March 31 March 01 April 02 April 03 April 04 April 05 April
De
man
d [
kW]
97
Figure 4-2. Daily Load Profile of Nonthaburi Main Office Building (9 April 2015)
Source: Prepared by the study team using Metropolitan Electricity Authority data.
According to the MEA, the annual electricity consumption of the Nonthaburi Main
Office Building in 2014 was 1,492,055 kWh. The monthly breakdown is shown in Table 4-2.
Table 4-2. Monthly Electricity Consumption at Nonthaburi Main Office Building (kWh), 2014
Jan Feb Mar Apr May Jun Jul Aug Sep Oct Nov Dec
93,045
95,599
119,679
123,988
138,066
140,282
135,740
134,356
132,512
130,613
144,606
103,569
Source: Metropolitan Electricity Authority.
In Thailand, the hottest days in the year usually comes in April and May, and the
annual peak load on the national grid of the Electricity Generating Company of Thailand is
usually recorded during these two months. The monthly electricity consumption of this
building in April and May, however, is smaller than that in June probably because of the
many national holidays in April and May. The electricity consumption in November, which
is a relatively cool month, is the largest among twelve months. Such is presumed to be
because this is a peak season for business.
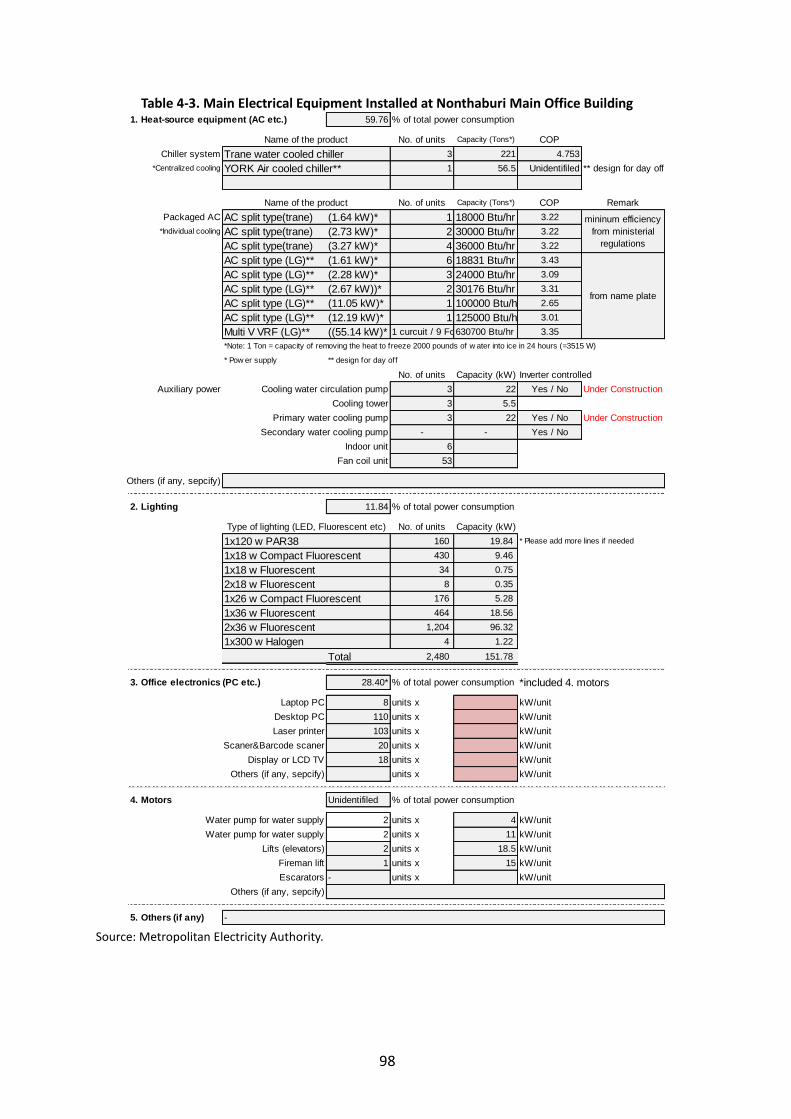
The main electrical equipment installed at Nonthaburi Main Office Building is listed
in Table 4-3.
0
50
100
150
200
250
300
350
400
450
0:0
00
:30
1:0
01
:30
2:0
02
:30
3:0
03
:30
4:0
04
:30
5:0
05
:30
6:0
06
:30
7:0
07
:30
8:0
08
:30
9:0
09
:30
10
:00
10
:30
11
:00
11
:30
12
:00
12
:30
13
:00
13
:30
14
:00
14
:30
15
:00
15
:30
16
:00
16
:30
17
:00
17
:30
18
:00
18
:30
19
:00
19
:30
20
:00
20
:30
21
:00
21
:30
22
:00
22
:30
23
:00
23
:30
De
man
d [
kW]
98
Table 4-3. Main Electrical Equipment Installed at Nonthaburi Main Office Building
Source: Metropolitan Electricity Authority.
1. Heat-source equipment (AC etc.) 59.76 % of total power consumption
Name of the product No. of units Capacity (Tons*) COP
Chiller system Trane water cooled chiller 3 221 4.753
*Centralized cooling YORK Air cooled chiller** 1 56.5 Unidentifiled ** design for day off
Name of the product No. of units Capacity (Tons*) COP Remark
Packaged AC AC split type(trane) (1.64 kW)* 1 18000 Btu/hr 3.22
*Individual cooling AC split type(trane) (2.73 kW)* 2 30000 Btu/hr 3.22
AC split type(trane) (3.27 kW)* 4 36000 Btu/hr 3.22
AC split type (LG)** (1.61 kW)* 6 18831 Btu/hr 3.43
AC split type (LG)** (2.28 kW)* 3 24000 Btu/hr 3.09
AC split type (LG)** (2.67 kW))* 2 30176 Btu/hr 3.31
AC split type (LG)** (11.05 kW)* 1 100000 Btu/hr 2.65
AC split type (LG)** (12.19 kW)* 1 125000 Btu/hr 3.01
Multi V VRF (LG)** ((55.14 kW)* 1 curcuit / 9 Fcu630700 Btu/hr 3.35
*Note: 1 Ton = capacity of removing the heat to freeze 2000 pounds of w ater into ice in 24 hours (=3515 W)
* Pow er supply ** design for day off
No. of units Capacity (kW) Inverter controlled
Auxiliary power Cooling water circulation pump 3 22 Yes / No Under Construction
Cooling tower 3 5.5
Primary water cooling pump 3 22 Yes / No Under Construction
Secondary water cooling pump - - Yes / No
Indoor unit 6
Fan coil unit 53
Others (if any, sepcify)
2. Lighting 11.84 % of total power consumption
Type of lighting (LED, Fluorescent etc) No. of units Capacity (kW)
1x120 w PAR38 160 19.84 * Please add more lines if needed
1x18 w Compact Fluorescent 430 9.46
1x18 w Fluorescent 34 0.75
2x18 w Fluorescent 8 0.35
1x26 w Compact Fluorescent 176 5.28
1x36 w Fluorescent 464 18.56
2x36 w Fluorescent 1,204 96.32
1x300 w Halogen 4 1.22
Total 2,480 151.78
3. Office electronics (PC etc.) 28.40* % of total power consumption *included 4. motors
Laptop PC 8 units x kW/unit
Desktop PC 110 units x kW/unit
Laser printer 103 units x kW/unit
Scaner&Barcode scaner 20 units x kW/unit
Display or LCD TV 18 units x kW/unit
Others (if any, sepcify) units x kW/unit
4. Motors Unidentifiled % of total power consumption
Water pump for water supply 2 units x 4 kW/unit
Water pump for water supply 2 units x 11 kW/unit
Lifts (elevators) 2 units x 18.5 kW/unit
Fireman lift 1 units x 15 kW/unit
Escarators - units x kW/unit
Others (if any, sepcify)
5. Others (if any) -
mininum efficiency
from ministerial
regulations
from name plate

99
Based on the above information, the study team estimated the breakdown of the
daytime load (averaging 1,518 kW) by equipment. This load estimate assumes that the
cooling demand accounts for about 40 percent of the daytime demand.
Cooling & Motor 221 kW (66%)
(including office electronics)
Lighting 98 kW (29%)
Base load night time 16 kW (5%)
Daytime load 335 kW (100%)
2.2. Measures for achieving the target
Figure 4-3. Energy Saving Potential of Nonthaburi Main Office Building, April 2015
Source: Prepared by the study team using Metropolitan Electricity Authority data.
0
50
100
150
200
250
300
350
400
450
0:0
0
0:3
0
1:0
0
1:3
0
2:0
0
2:3
0
3:0
0
3:3
0
4:0
0
4:3
0
5:0
0
5:3
0
6:0
0
6:3
0
7:0
0
7:3
0
8:0
0
8:3
0
9:0
0
9:3
0
10
:00
10
:30
11
:00
11
:30
12
:00
12
:30
13
:00
13
:30
14
:00
14
:30
15
:00
15
:30
16
:00
16
:30
17
:00
17
:30
18
:00
18
:30
19
:00
19
:30
20
:00
20
:30
21
:00
21
:30
22
:00
22
:30
23
:00
23
:30
De
man
d [
kW]
Ave. 335kW
Base16kW
Lighting 98kW
Cooling & motor&office electronics 221kW
Lighting & Office electronics 50% off during Lunchtime: -75kWh
Lighting & cooling 50% off after working time:
-25kWh
Elevator control or 1unit cutting operation 4hrs: -40kWh
Lighting control or 5% cutting operation 7hrs: -35kWh

100
3. Observation from Site Survey
A site survey with walkthrough and interviews with personnel were conducted on 5
August 2015 to gain an understanding of the energy-saving performance. The building that
was completed in 2012, along with all its equipment, was identified as the newest
infrastructure.
The following descriptions on the chilled water supply system, and cooling and
ventilation system relate to the diagrams below.
Chilled water supply system
Daily operating hours: 9 hours (07:30 to 15:30)
Chiller units: 221 TR × 3 units are installed but only two units are operating regularly
Chilled water supply temperature settings: 7°C, condenser water supply
temperature: 32°C.
Chilled water pump: three units, water supplied by primary pump system
Additional automatic control works were installed, with the introduction of
automatic operation control for three chiller units, and of chilled water and
condensed water pump inverter control. (These control works are recently installed,
so results shall be monitored)
Cooling and ventilation
In each cooling area, two types of cooling systems are in use. One is cooling and
ventilation by FCU, with air supplied to rooms from corridors, supplying the air
volume exhausted by ceiling fans. Air-conditioning units also provide cooling and
ventilation.
Air-conditioning units are installed in the machine room. Fresh air flows into the
machine room via air return chambers in various rooms. Air intake is naturally
provided by holes in the wall and there is no built-in air volume control.
CO2 density gauges are installed in each office and are monitored (i.e. no automatic
control).
There is natural ventilation on three car park floors (3rd to 5th). Some lighting
fixtures also switch off selectively to reduce energy consumption.

101
Figure 4-4. Simplified Diagram of Chilled Water Supply System, Nonthaburi District Office
Source: Authors.
CH-1 Turbine chiller221TR
CH-2 Turbine chiller221TR
CH-3 Turbine chiller221TR
7℃
CHP-1, 2, 3540GPM×22kW×3台
CT-3CT-1 CT-2
Fan coil units & AHUs
Pressure diff ierential valve
7℃
7℃
CDP-1, 2, 3750GPM×22kW×3台
Air cooled chiller56.5TR
Units
Units

102
Figure 4-5. Simplified Diagram of Air Conditioning and Ventilation, Nonthaburi
Source: Authors.
3.1. Energy usage conditions
Table 4-4 presents the energy consumption at the MEA Nonthaburi facilities. It gives
an assessment of the annual energy consumption and calculation conditions used to
calculate the proposed energy savings.
In 2014, monthly energy usage declined from December to February; there were no
big changes in the other months. There was an increase in November but this was due to
the number of events and seminars held at the facilities.
Table 4-4. Energy Usage, MEA Nonthaburi Facilities
Items Conditions Remarks
Annual electricity consumption (Jan 2014 to Dec 2014) 1,492,055 kWh
Including power consumption by servers in the computer block
Electricity consumption density 135 kWh/m2/year Total floor area: 13,081 m2
Electricity unit price 3.38 B/kWh Unit price for energy reduction calculations
OfficeCorridor
Fan coil unit
Exhaust fan
Office
Machine room
AHU
Outside intake air
103
Figure 4-6. Annual Electricity Consumption, 2014
Source: Prepared by the study team using Metropolitan Electricity Authority data.
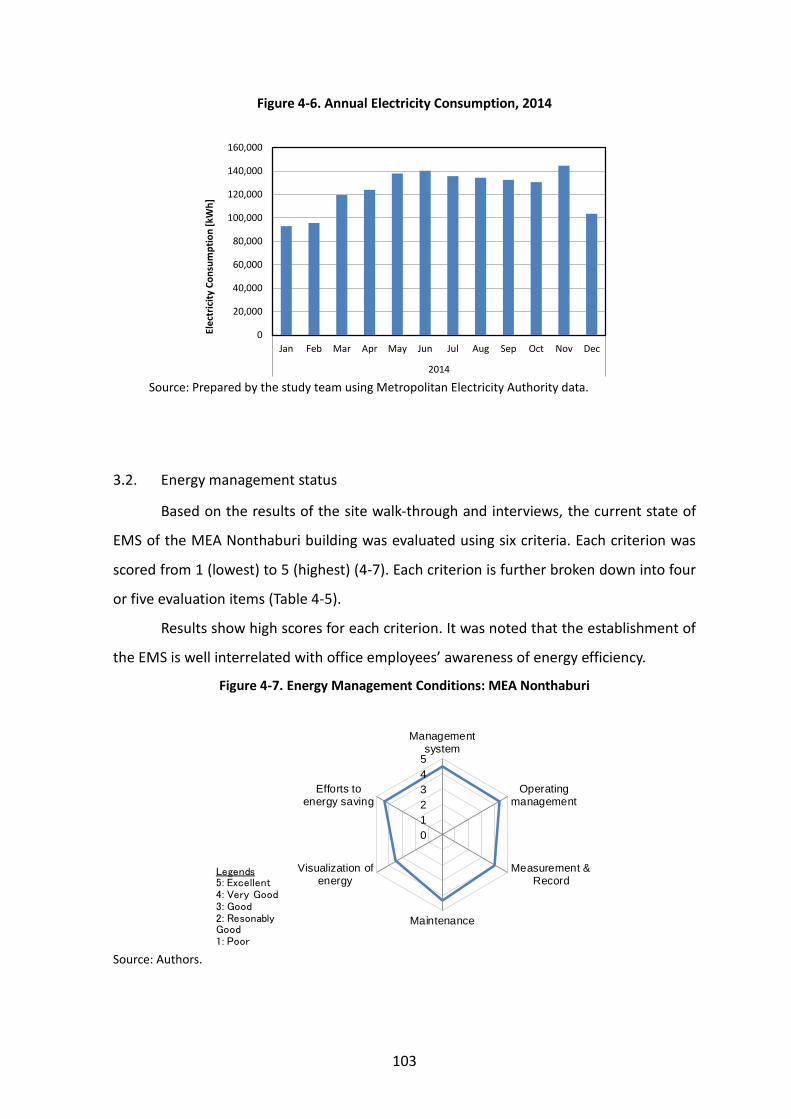
3.2. Energy management status
Based on the results of the site walk-through and interviews, the current state of
EMS of the MEA Nonthaburi building was evaluated using six criteria. Each criterion was
scored from 1 (lowest) to 5 (highest) (4-7). Each criterion is further broken down into four
or five evaluation items (Table 4-5).
Results show high scores for each criterion. It was noted that the establishment of
the EMS is well interrelated with office employees’ awareness of energy efficiency.
Figure 4-7. Energy Management Conditions: MEA Nonthaburi
Source: Authors.
0
20,000
40,000
60,000
80,000
100,000
120,000
140,000
160,000
Jan Feb Mar Apr May Jun Jul Aug Sep Oct Nov Dec
2014
Ele
ctri
city
Co
nsu
mp
tio
n [
kWh
]
0
1
2
3
4
5
Managementsystem
Operatingmanagement
Measurement &Record
Maintenance
Visualization ofenergy
Efforts toenergy saving
Legends5: Excellent4: Very Good3: Good2: Resonably Good1: Poor

104
Table 4-5. Evaluation on Energy Management Conditions
Source: Authors.
3.3. Proposals for improvement
The following is a list of energy saving proposals drafted during the site survey.
These are divided into three categories. Proposals in A and B require no investment or have
costs that can be recovered within five years, and thus can be implemented promptly.
Grade Score Sum
In practice 1.00
In practice 1.00
In practice 1.00
Under review 0.50
In practice 1.00
In practice 1.25
In practice 1.25
Under review 0.63
In practice 1.25
In practice 1.00
Under review 0.50
In practice 1.00
In practice 1.00
Under review 0.50
Under review 0.63
In practice 1.25
In practice 1.25
In practice 1.25
In practice 1.00
Under review 0.50
In practice 1.00
No action 0.00
In practice 1.00
In practice 1.25
Under review 0.63
In practice 1.25
In practice 1.25
Items Point to be checked
Management
system
Organisation in place?Is there a designated person or post with responsibility for
energy management
4.5
Announcement of main
goalsAny promotion by posters, slogans etc.
Coordination with related
postsAre several members of personnel actively participating?
Record of activities Are energy management activities recorded?
Systematic training of
personnel
Is training provided for personnel working on energy
management?
Operating
management
Operating standard Are there any operating standards for main systems?
4.4
Operation managersAre there any designated operation managers in accordance with
standards?
Peak power management Is attention paid to peak power using demand meter etc?
Review of standards Are operating standards revised on an as needed basis?
Measurement
& Record
Energy consumption Are there records (paper chits, memos etc.) of energy usage?
4
System operation periodAre operating times recorded for main combustion, cooling,
lighting systems etc.
Separate energy
measurements
Knowledge of energy usage according to different departments
or application?
Data on system operation
conditions
Are measurements of temperature, illuminance, current etc.
taken?
Quality control Is there any precision management, calibration of main meters?
Maintenance
Maintenance and
inspection standards
Are there any standards for maintenance and inspection of main
systems?
4.4
Maintenance and
inspection log
Are there any records of maintenance and inspection of main
systems?
Drawing maintenance Are as-builts and system drawings maintained?
Scheduling of repairs and
renewals
Are scheduled repairs or renewals planned based on the
inspection records?
Visualization
of energy
Energy graph preparation Are graphs showing energy data prepared?
3.5
Previous year's data
comparisonIs there energy data from the previous year?
Distribution of data Is there internal distribution of energy usage conditions?
Energy intensity
managementIs there any management of energy intensity?
Data analysis Is analysis of increases or decreases in energy usage carried out?
Efforts to
energy saving
Target setting Are there any target settings for energy saving?
4.4
Target review Is there a review of energy saving targets?
System improvementIs there any implementation or review of system improvements
or remedial measures?
Results of improvementIs there any verification of the efficacy of improvements or
remedial measures?
105
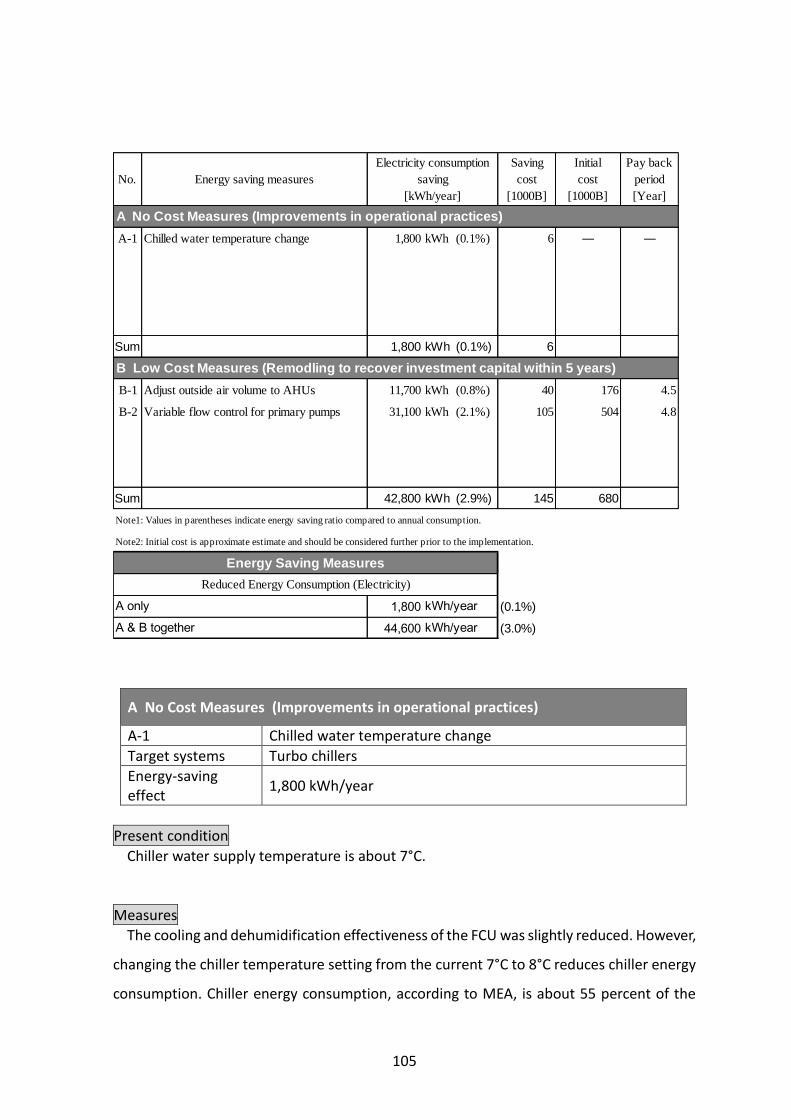
A No Cost Measures (Improvements in operational practices)
A-1 Chilled water temperature change
Target systems Turbo chillers
Energy-saving effect
1,800 kWh/year
Present condition
Chiller water supply temperature is about 7°C.
Measures
The cooling and dehumidification effectiveness of the FCU was slightly reduced. However,
changing the chiller temperature setting from the current 7°C to 8°C reduces chiller energy
consumption. Chiller energy consumption, according to MEA, is about 55 percent of the
No. Energy saving measures
Saving
cost
[1000B]
Initial
cost
[1000B]
Pay back
period
[Year]
A No Cost Measures (Improvements in operational practices)
A-1 Chilled water temperature change 1,800 kWh (0.1%) 6 ― ―
Sum 1,800 kWh (0.1%) 6
B Low Cost Measures (Remodling to recover investment capital within 5 years)
B-1 Adjust outside air volume to AHUs 11,700 kWh (0.8%) 40 176 4.5
B-2 Variable flow control for primary pumps 31,100 kWh (2.1%) 105 504 4.8
Sum 42,800 kWh (2.9%) 145 680
Note1: Values in parentheses indicate energy saving ratio compared to annual consumption.
Note2: Initial cost is approximate estimate and should be considered further prior to the implementation.
1,800 (0.1%)
44,600 (3.0%)
Electricity consumption
saving
[kWh/year]
Energy Saving Measures
Reduced Energy Consumption (Electricity)
A & B together kWh/year
A only kWh/year
106
annual energy consumption.
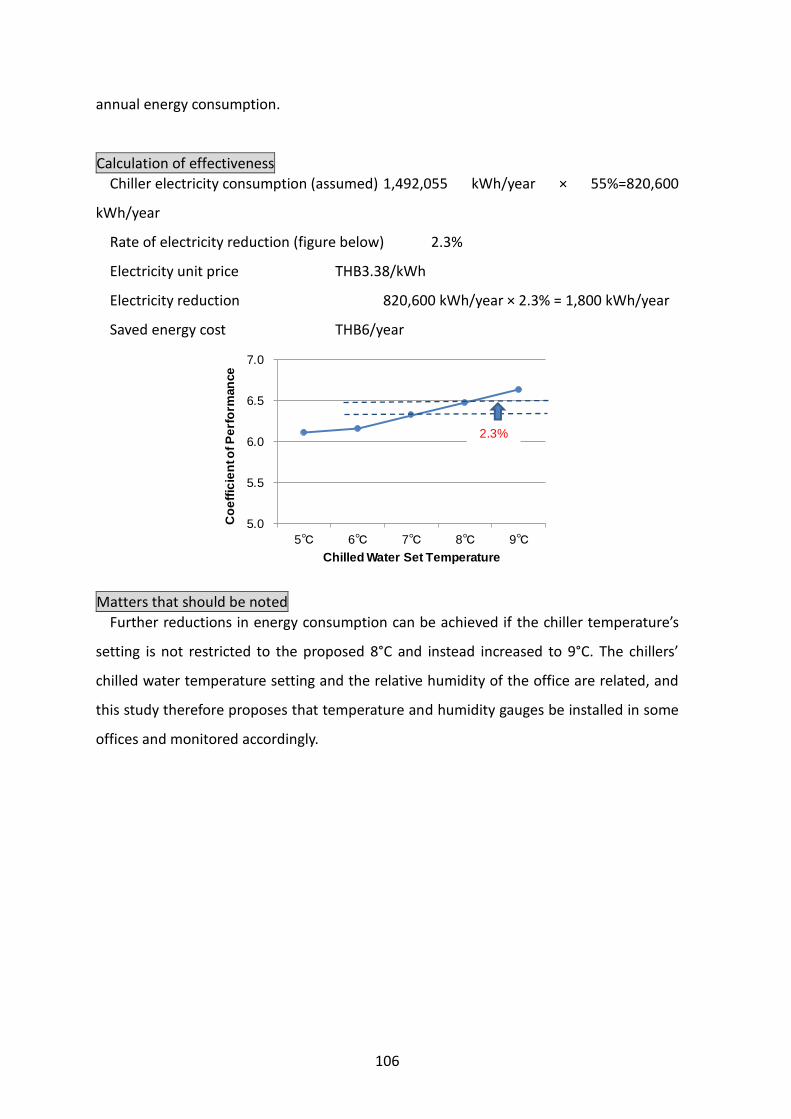
Calculation of effectiveness
Chiller electricity consumption (assumed) 1,492,055 kWh/year × 55%=820,600
kWh/year
Rate of electricity reduction (figure below) 2.3%
Electricity unit price THB3.38/kWh
Electricity reduction 820,600 kWh/year × 2.3% = 1,800 kWh/year
Saved energy cost THB6/year
Matters that should be noted
Further reductions in energy consumption can be achieved if the chiller temperature’s
setting is not restricted to the proposed 8°C and instead increased to 9°C. The chillers’
chilled water temperature setting and the relative humidity of the office are related, and
this study therefore proposes that temperature and humidity gauges be installed in some
offices and monitored accordingly.
5.0
5.5
6.0
6.5
7.0
5℃ 6℃ 7℃ 8℃ 9℃
Co
eff
icie
nt o
f P
erf
orm
an
ce
Chilled Water Set Temperature
2.3%

107
B Low Cost Measures (Remodelling to recover investment capital within 5 years)
B-1 Adjust outside air volume to AHUs
Target systems AHUs
Energy saving effect
11,700 kWh/year
AHU = air handling unit.
Present conditions
AHUs provide fresh air intake via wall openings in the machine room but with no control
damper installed.
Measures
The installation of a motor damper in wall openings and sensors to measure CO2 in offices
(and controlled from a centralised panel in the machine room) can provide variable intake
of fresh air based on the CO2 density. These measures shall reduce the energy required to
cool down areas.
Calculation of effectiveness
Outside air intake 13,900 m3/h×1.2 kg/m3×40%=6,600 kg/h
Operating time 9 h (7:30 to 15:30) ×240 day/year=2,160 h/year
Outside CO2 density 400 ppm
Office
Machine room
AHU
Outside intake air
Install motor dumper
CO2 density sensor(already installed)
Controller
Outside air intake opening

108
Average inside CO2 density 587 ppm
Acceptable inside CO2 density 900 ppm
Possible reduction of air intake 40% [1-(587-400)/(900-400)=0.40]
Cooling load reduction 6,600 kg/h × 2,160 h/year × 40% × 22.3 kJ/kg/1000
= 127,164 MJ/year → 35,300 kWh/year
COP of existing chillers (assumed) 3.0
Electricity unit price THB3.38/kWh
Electricity reduction 820,600 kWh/year ÷ 3 = 11,700 kWh/year
Saved energy cost THB39,500/year
Investment cost (estimated roughly) THB176,000 (AHU × 4 units)
Recovery period 4.5 years
AHU = air handling unit.
GPM m3/h
1 Service AHU-1-01 12,000 2,700 7:30 to 15:00 615
6 Canteen AHU-6-01 14,000 3,200 Lunch time only
7 Office AHU-7-01 14,000 3,200 7:30 to 15:00 591
7 Office AHU-7-02 14,000 3,200 7:30 to 15:00 603
9 Office AHU-9-01 21,000 4,800 7:30 to 15:00 542
Roof Conference AHU-CONF-01 15,000 3,400 as needed
Sum 13,900 except 6th & Roof floor
Supply air volume Average CO2
density [ppm]AC operationUnit No.UseFloor
Jan Feb Mar Apr May Jun Jul Aug Sep Oct Nov Dec
Monthly average anthalpy [kJ/kg]
Outside 66.6 74.2 76.2 82.0 78.0 79.7 78.0 74.6 81.2 77.2 71.2 62.6
Office area 52.8 52.8 52.8 52.8 52.8 52.8 52.8 52.8 52.8 52.8 52.8 52.8
Diff. 13.8 21.4 23.4 29.2 25.2 26.9 25.2 21.8 28.4 24.4 18.4 9.8
Room condition: temperature 25˚C & relative humidity 55% (assumed)
0
10
20
30
40
50
60
70
80
90
100
110
120
Outs
ide
air e
nth
alpy
[kJ
/kg]
Annual average outside enthalpy: 75.1 kJ/kgAnnual office area enthalpy: 52.8 kJ/kg
Diffirence: 22.3 kJ/kg
109
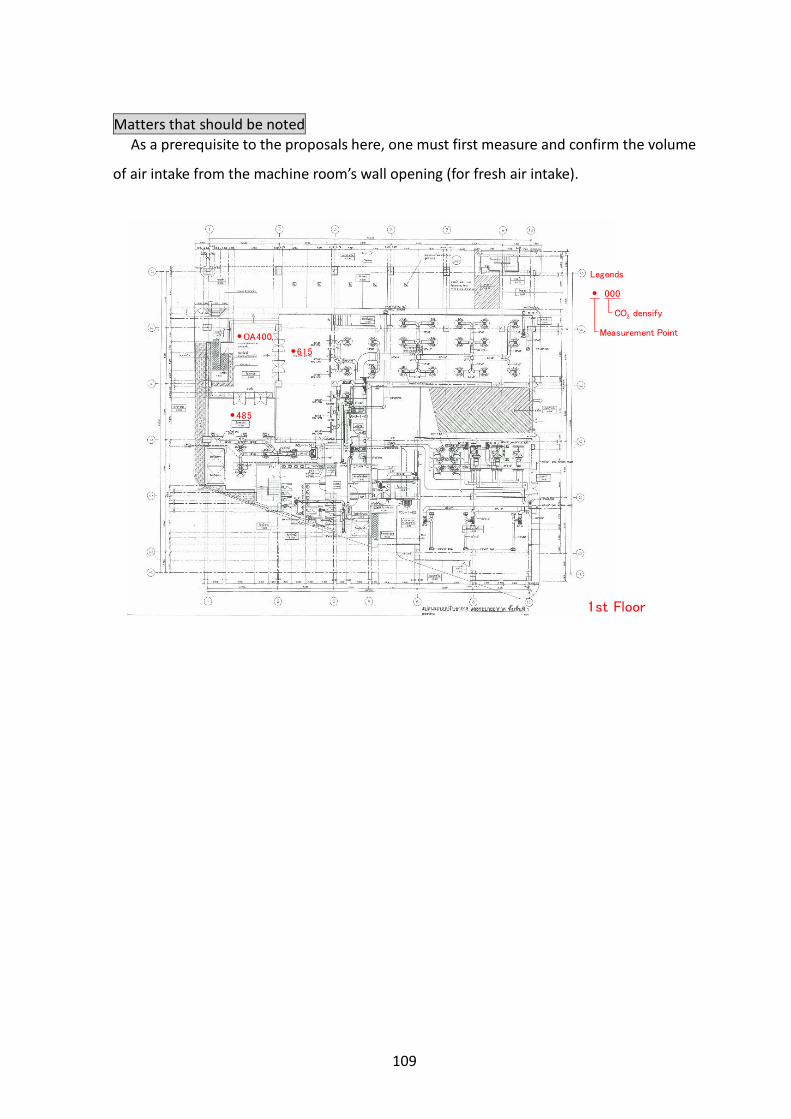
Matters that should be noted
As a prerequisite to the proposals here, one must first measure and confirm the volume
of air intake from the machine room’s wall opening (for fresh air intake).
OA400
615
485
1st Floor
Legends
000
CO2 densify
Measurement Point

110
577 580
2nd Floor
Legends
000
CO2 densify
Measurement Point

111
OA490
590
590
590
590
595
600
606
6th Floor
7th Floor
Legends
000
CO2 densify
Measurement Point
Legends
000
CO2 densify
Measurement Point

112
B-2 Variable flow control for primary pumps
Target systems Primary pumps
Energy saving effect
31,100 kWh/year
530
535
535
550
530
500
550
552
600
570
558
552
550
530
535
535
550
500
530
8th Floor
9th Floor
600
570
558
Legends
000
CO2 densify
Measurement Point
Legends
000
CO2 densify
Measurement Point

113
Present conditions
Two units of primary pump units (CHP-1 to 3) each run at a fixed speed throughout the year.
Measures
Heat load based on the number of occupants, outside climate conditions, and the absence of insulation on the windowpanes, varies with the time of day. The existing turbo chiller has a variable flow rate. If the primary pump motor has an inverter to control frequency variations, then the variable flow control can be added to the primary pump to reduce power consumption.
Calculation of effectiveness
Pump capacity 22kW × 2units Electrical load factor 0.8 Operation hour 9h (7:30 to 15:30) × 240 days = 2,160h/year Annual average thermal load 0.75 (here the annual average of 0.75 has been adopted for daily enthalpy against the high value for fresh air enthalpy) Rate of electricity reduction 1-0.753÷0.9÷0.8=0.41 Invertor efficiency: 0.9 Pump efficiency: 0.8 Electricity unit price THB3.38/kWh Electricity reduction 22kW × 2units × 0.8 × 2,160h/year × 0.41=31,100kWh/year Saved energy cost THB105,100/year Investment cost (estimated roughly) THB504,400 (Inverter and control) Recovery period 4.8 years
Matters that should be noted
Generally, 50 percent is the minimum chilled water flow rate of turbo chillers (Note that
CH-1 Turbine chiller221TR
CH-2 Turbine chiller221TR
CH-3 Turbine chiller221TR
7℃
CHP-1, 2, 3540GPM×22kW×3台
Fan coil units & AHUs
Pressure differential valve
7℃
7℃
Inverter
Differential pressure monitoring
Flow rate limiter
Flow rate limiter
Flow rate limiter
114
this varies depending on the manufacturer). Under the said flow rates, operational issues may occur. Adding a flow limiter to avoid falling below the minimum flow rates may be considered.
3.4. Examples of EMS data analysis
Data on energy consumption gathered by the BMS can be used to determine the
pattern of energy usage throughout the building, the operational performance of the
chillers, etc. Some methods of data analyses are explained below.
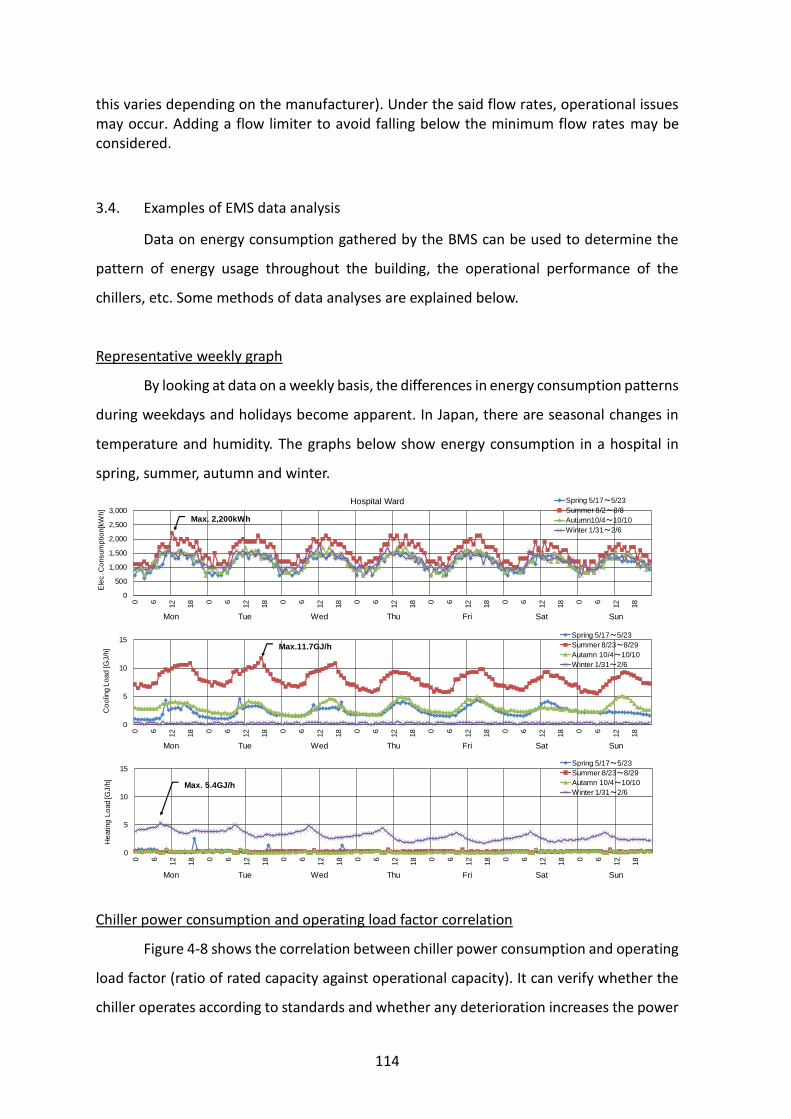
Representative weekly graph
By looking at data on a weekly basis, the differences in energy consumption patterns
during weekdays and holidays become apparent. In Japan, there are seasonal changes in
temperature and humidity. The graphs below show energy consumption in a hospital in
spring, summer, autumn and winter.
Chiller power consumption and operating load factor correlation
Figure 4-8 shows the correlation between chiller power consumption and operating
load factor (ratio of rated capacity against operational capacity). It can verify whether the
chiller operates according to standards and whether any deterioration increases the power
Mon Tue Wed Thu Fri Sat Sun
Mon Tue Wed Thu Fri Sat Sun
Mon Tue Wed Thu Fri Sat Sun
0
500
1,000
1,500
2,000
2,500
3,000
0 6
12
18 0 6
12
18 0 6
12
18 0 6
12
18 0 6
12
18 0 6
12
18 0 6
12
18
Ele
c. C
onsum
ptio
n[k
Wh]
Hospital Ward Spring 5/17~5/23
Summer 8/2~8/8
Autumn10/4~10/10
Winter 1/31~2/6
Max. 2,200kWh
0
5
10
15
0 6
12
18 0 6
12
18 0 6
12
18 0 6
12
18 0 6
12
18 0 6
12
18 0 6
12
18
Co
olin
g L
oad
[G
J/h
]
Spring 5/17~5/23
Summer 8/23~8/29
Autamn 10/4~10/10
Winter 1/31~2/6
0
5
10
15
0 6
12
18 0 6
12
18 0 6
12
18 0 6
12
18 0 6
12
18 0 6
12
18 0 6
12
18
He
ating
Lo
ad
[GJ/h
]
Spring 5/17~5/23
Summer 8/23~8/29
Autamn 10/4~10/10
Winter 1/31~2/6
Max.11.7GJ/h
Max. 5.4GJ/h

115
consumption even if the load factor remains constant.
Figure 4-8. Correlation Between Chiller Power Consumption and Operating Load Factor
Correlation between cooling load and COP
There is a correlation between cooling load and COP. The graph below evaluates the
turbo chiller’s (650 TR) performance, and confirms that changing the chilled water
temperature setting from 7˚C to 8˚C improves the COP.
Figure 4-9. Correlation Between Cooling Load and COP
y = 5.7988x + 17.912R² = 0.8632
y = 2.1627x + 10.055R² = 0.8012
0
50
100
150
200
250
300
350
400
450
0 5 10 15 20 25 30 35 40 45 50 55 60 65 70
Ch
ille
r p
ow
er
con
sum
pti
on
[kW
h]
Load factor in operation [%]
R-1 R-2
R-1冷凍機冷水温度による効率比較
0
1
2
3
4
5
6
7
8
9
10
0 500 1000 1500 2000 2500 3000
冷房負荷[kWh]
CO
P[-
]
冷水温度8℃
冷水温度7℃
R-2冷凍機冷水温度による効率比較
0
1
2
3
4
5
6
7
8
9
10
0 500 1000 1500 2000 2500 3000
冷房負荷[kWh]
CO
P[-
]
冷水温度8℃
冷水温度7℃
R-1 Turbine Chiller
Cooling Load [kWh]
Co
eff
icie
nt o
f P
erf
orm
an
ce
(C
OP
)
Chilled water Temp.
○ 7℃○ 8℃

116