CASE STUDY: CYCLONES - Iowa State Universitydicook/stat503/Cyclones.pdfCASE STUDY: CYCLONES...
41
CASE STUDY: CYCLONES DEFINITION Cyclones are defined as ``an atmospheric system in which the barometric pressure diminishes progressively to a minimum at the centre and toward which the winds blow spirally inward from all sides, resulting in a lifting of the air and eventually in clouds and precipitation...''. Hurricanes are cyclones, that originate in the tropics with windspeeds beyond 64 knots (= 74 mph, 113 km/h)
Transcript of CASE STUDY: CYCLONES - Iowa State Universitydicook/stat503/Cyclones.pdfCASE STUDY: CYCLONES...

CASE STUDY: CYCLONES
DEFINITION
Cyclones are defined as
``an atmospheric system in which the barometric pressure diminishesprogressively to a minimum at the centre and toward which the windsblow spirally inward from all sides, resulting in a lifting of the air andeventually in clouds and precipitation...''.
Hurricanes are cyclones, that originate in the tropics with windspeedsbeyond 64 knots (= 74 mph, 113 km/h)

SOME BACKGROUND ON HURRICANES(1) Average insurance claims per year $1 billion(2) Extreme “violent” hurricanes can exceed $10 billion(3) Example hurricane “Andrew” in 1992:
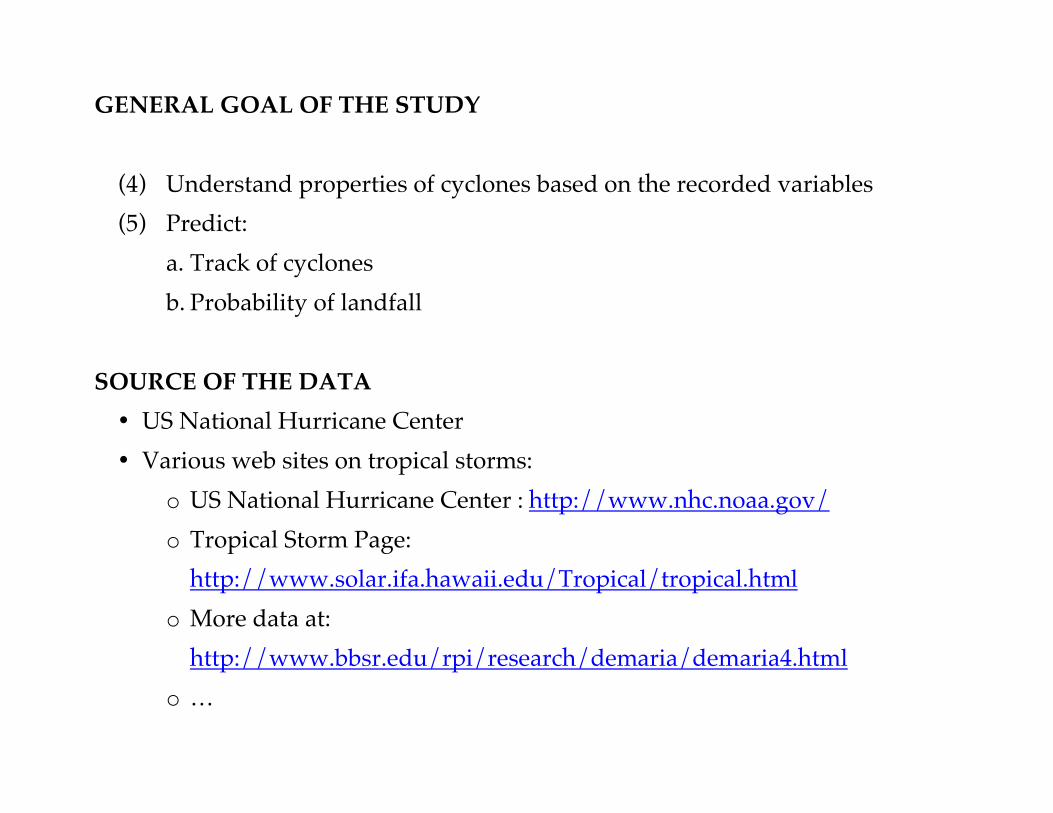
GENERAL GOAL OF THE STUDY
(4) Understand properties of cyclones based on the recorded variables(5) Predict:
a. Track of cyclonesb. Probability of landfall
SOURCE OF THE DATA• US National Hurricane Center• Various web sites on tropical storms:
o US National Hurricane Center : http://www.nhc.noaa.gov/o Tropical Storm Page:
http://www.solar.ifa.hawaii.edu/Tropical/tropical.htmlo More data at:
http://www.bbsr.edu/rpi/research/demaria/demaria4.htmlo …

DATA DESCRIPTION• Number of variables: 18
o Date 3 (Year, Month, Day)o Name, Number 2o Location, X (longitude), Y (lattitude) 2o Categorical 2
ß Stormtypeß Landfall
o Continuous 9ß Speedsß Anglesß Distance
• Number of Cases: 1819But only 334 different storms(Number of observations per storm: min 1 (42=12.5%), median 5, max 24)

OVERVIEW OF THE MEASURES
Land Sea
Windspeed
Trackspeed
Parallel to the EquatorTrack-angle
Coast-angle
Inwardspeed
Parallelspeed

SUGGESTED APPROACHES
Approach Reason Type of Question addressed
Calculate summaries ofall variables
Extract scale, location andrange information
What is the averagewindspeed of a hurricane inthis dataset?
Draw distributions ofvariables
Understand asymmetryand outlier of the variables
Which variables are usefulfor a statistical model?
Plot interactions ofvariables
Understand interactionstructure of the data
Which variables contributeinformation to a model?
Draw maps withhurricane locations
Understand geographicaldistribution
Where do hurricanes occur?
Draw tracks ofhurricanes
Look for similar tracktypes
What does a typical track of ahurricane look like?

Are there different types oftracks shapes?
Plot geographicaldistribution of variables
– or –
link information of othervariables into thescatterplot
What is the interaction oflocation with all thevariables
Do speeds and angles ofmeasurements follow ageographical pattern?
…
– Check accuracy of the data –
…
Set up statistical modelfor landfall
Try to predict a landfallfrom single measurements
What is the probability thatthis hurricane will hit land?

ACTUAL APPROACHES(1) Summaries
a. Year:> summary(Year)Min. 1st Qu. Median Mean 3rd Qu. Max.1945 1954 1964 1963 1971 1979
> barplot(table(Year))

b. Month> summary(Month)Min. 1st Qu. Median Mean 3rd Qu. Max.1.00 8.00 9.00 8.769 9.00 12.00
> barplot(table(Month))

c. Name> summary(Name)NOT CHARLIE SUBTROP EDITH BETSY ANNA ABLE DOG289 36 35 33 32 30 29 29
CAROL GLADYS GRETA INGA BECKY ELLA FLORA FRANCES28 28 28 28 27 27 27 27
…

d. Location
> plot(X,Y, col=3-Landfall)

Some example paths for “Donna” and “Anna”:> plot(X,Y, col=3-Landfall)> lines(X[Name=="DONNA"], Y[Name=="DONNA"], col=2, lwd=3)> lines(X[Stormnumber==275], Y[Stormnumber==275],col=3,lwd=3)

e. Stormtype
> table(Stormtype)Stormtype1 3 51674 76 69

f. Landfall> table(Landfall) > table(Landfall)Landfall LandfallN 0 1 0 11431 388 234 100
> 388/1431 > 234/1000.2711391 0.4273504
> barplot(table(Landfall)) > barplot(table(LandfallN))

g. Speeds
> hist(Windspeed, col=3)> hist(Windspeed[Landfall==T], add=T, col=2)


h. Angles

i. Distance

(2) RELATIONS BETWEEN VARIABLESa. Checked all variables against Landfall, but …
… highlighted subgroup is hard to compare with total in a histogram.1. alternative: Boxplots

2. alternative: SpinogramsExample: Windspeed
Histogram Spinogram

Trackangle
Histogram Spinogram

b. Dependencies of the derived variables(1) Inward speed and parallel speed are derived from track speed
Trackspeed Inwarspeed vs. Parallelspeed

(2) Coast angle and distance angle are derived from track angle
Trackangle Distanceangle vs. Costangle

(3) Distance is related to longitude and latitude
Distance Latitude vs. Longitude

c. Looking at 2-way interactions between continuous variables

d. Interactions in more than 2 dimensions: 2-d Tour

e. A SIMPLE MODEL FOR LANDFALL> m1 <- lm(Landfall ~ 1)> summary(m1)Call:lm(formula = Landfall ~ 1)…Coefficients: Estimate Std. Error t value Pr(>|t|)(Intercept) 0.213304 0.009607 22.2 <2e-16 ***…> add1(m1, cyclones[c(1:3,9:16)])Single term additionsModel:Landfall ~ 1 Df Sum of Sq RSS AIC<none> 305.2 -3244.8X 1 19.0 286.2 -3359.7Y 1 17.6 287.6 -3351.0Windspeed 1 1.2 304.1 -3249.8Trackspeed 1 6.0 299.3 -3278.8Trackangle 1 2.4 302.9 -3256.9Distance 1 3.2 302.0 -3262.1Coastangle 1 19.9 285.3 -3365.6Distanceangle 1 13.8 291.4 -3327.1Inwardspeed 1 16.7 288.5 -3345.3Parallelspeed 1 16.8 288.5 -3345.6

This stepwise regression yields the model:
Landfall ~ Coastangle + Inwardspeed + X + Windspeed + Y
with a R2 of 13.5%
Prediction: > hist(predict(m1, cyclones))

Confusion matrix:
> table(round(0.164+predict(m1, cyclones))) 0 11430 389> table(round(0.164+predict(m1, cyclones)), Landfall)Landfall 0 10 1215 2151 216 173> mosaicplot(table(round(0.164+predict(m1, cyclones)),Landfall))

INVESTIGATION OF THE RESIDUALS
• Geographic mapping of:
false positives false negatives

Approach: Partition the data into
• Gulf region• Atlantic region• North-east Atlantic region• (removing outlier “Ginger”)


R-Code:> group<-rep(1, length(X))> group[(Y>=-0.5825*X-22.5641) & X > -80]<-2> group[(Y>=-0.4806*X+7.8837) | (Distanceangle>90 & group == 2 & Landfall == 0)]<-3> group[Stormnumber==310]<-4> barplot(table(group), col=2:5)> plot(X,Y, col=group+1)

f. REESTIMATING TWO SEPARATE LOGISITC MODELS
Logistic Regression:
ordinary linear model:
Y = aX + b + e
Problem with Y:Y is dichotomous, but the linear fit will give estimates on –• to +•
Solution:Introduce sigmoid link-function to map data from ]–•, +•[ to [0, 1].
ln(p/(1-p)) = aX + b + e (logit-link)
Remarks:Other continuous link function from ]–•, +•[ to [0, 1] are used as well.
Parameter estimate no longer works with simple solution of linearequation, but needs iterative optimization methods to find a solution.
R2 can not be extracted as in the Ordinary Least Square case

i) Estimate for the Gulf region:
> g1<-glm(Landfall ~ 1, subset=(group==1), family="binomial")> add1(g1, cyclones[c(1:3,9:16)])…
Landfall ~ Trackangle + Y + Inwardspeed + Coastangle
> table(round(0.07+predict(g1, cyclones,type="response")[group==1]))
0 1253 179
> table(round(0.07+predict(g1, cyclones,type="response")[group==1]), Landfall[group==1])
0 1 0 191 62 1 62 117
R2: 20.8%

ii) Estimate for the Atlantic region:
> a1<-glm(Landfall ~ 1, subset=(group==2), family="binomial")> add1(a1, cyclones[c(1:3,9:16)])…
Landfall ~ Coastangle + Parallelspeed + Windspeed + Y + X
> table(round(0.1809+predict(a1, cyclones,type="response")[group==2]))
0 1656 185
> table(round(0.1809+predict(a1, cyclones,type="response")[group==2]), Landfall[group==2])
0 1 0 559 106 1 106 79
R2: 11.9%
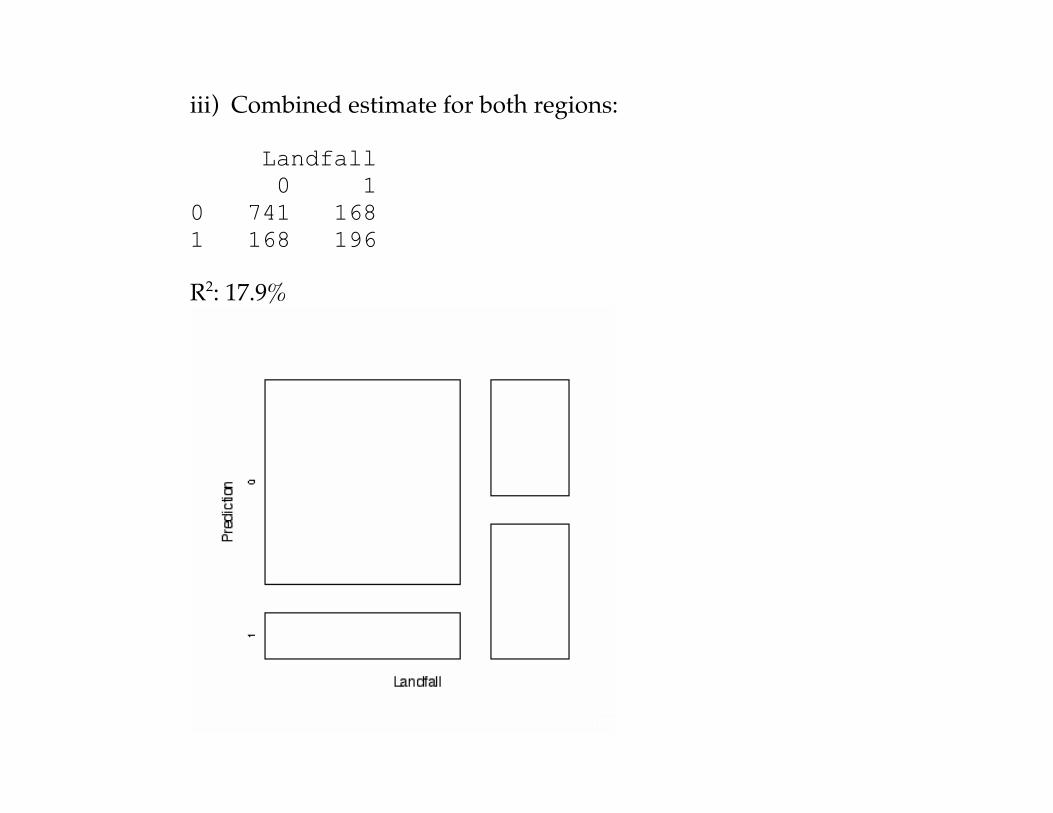
iii) Combined estimate for both regions:
Landfall 0 10 741 1681 168 196
R2: 17.9%

g. IMPROVE MODEL BY USING THE TRACK STRUCTURE
Idea:Use the predictions along a track to “vote” for landfall
Classify a complete storm as landfall, iff the “majority” of its points areclassified as landfall. Use linear weights to emphasize “latest” measures.
i) only Gulf and Atlantic Landfall 0 10 817 1401 92 224
R2: 38.1%
ii) all data Landfall 0 10 1334 1401 97 248
R2: 45.4%

tracks of “Donna” and “Anna” prediction tracks of “Donna” and “Anna”

h. INVESTIGATION OF THE NEW RESIDUALS
i) False negatives 140/1474 = 9%
No apparent structure visible.

ii) False positives 97/345 = 28%
The following storms apparently hit Cuba or Mexico:Mexico: 138, 155, 177, 246, 298Cuba: 48, 75, 83, 89, 192, 257, 282, 340, 370, 379
These storm account for 47 measurements.
-> corrected false positives: 50/345 = 14%