A Study of Affective and Metacognitive Factors for Learning Statistics ...
Upload
bart-rientiesCategory
view
354download
0
Case Study: A Longitudinal Mixed-Method Study of Learning Gain - Applying
Affective-Behaviour-Cognition Framework at Three Institutions
11-05-2016@drBartRienties & Dr Jekaterina Rogaten@learninggainshttps://twitter.com/LearningGains

ABC learning gains team
Dr Bart Rienties Dr Jekaterina Rogaten Prof Denise Whitelock
Dr Simon Cross Prof Allison Littlejohn
Prof Rhona Sharpe (OB) Dr Ian Scott (OB)
Prof Ian Kinchin (US) Prof Steven Warburton (US) Dr Simon Lygo-Baker (US)

ABC approach

Quantitative
Qualitative
Academic performance
VLE
Satisfaction
Interviews
Diary
Module design
Socio-Demographic
Structure of the ABC project

What does the literature say about Learning gain?
• The concept of learning gain is primarily used to examine the effect of any particular educational ‘intervention’
– Web of Science core collection and ERIC– The time frame of the search 2000 -
2016. – In total 231 studies were identified of
which 73 studies were selected. – All learning gains can be classified into
ABC– Meta-analytic literature review to be
submitted to the Educational Research Review in June 2016.

Example Arts AA100• The arts past and present
– 30 week, 60 credit, Level 1 module – Introduces to university-level study in the arts across a range of subject areas - art history, classical studies, English, history, philosophy,
music and religious studies.• Assignment 01 (10%) • Assignment 02 (10%); • Assignment 03 (15%); • Assignment 04 (20%); • Assignment 05 (15%); • Assignment 06 (20%);• Assignment 07 (10%)
– 25% - BA (Honours) History, 19% - BA (Honours) Humanities, 16.2% - BA (Honours) English Language and Literature, 12.5% - BA (Honours) English Literature
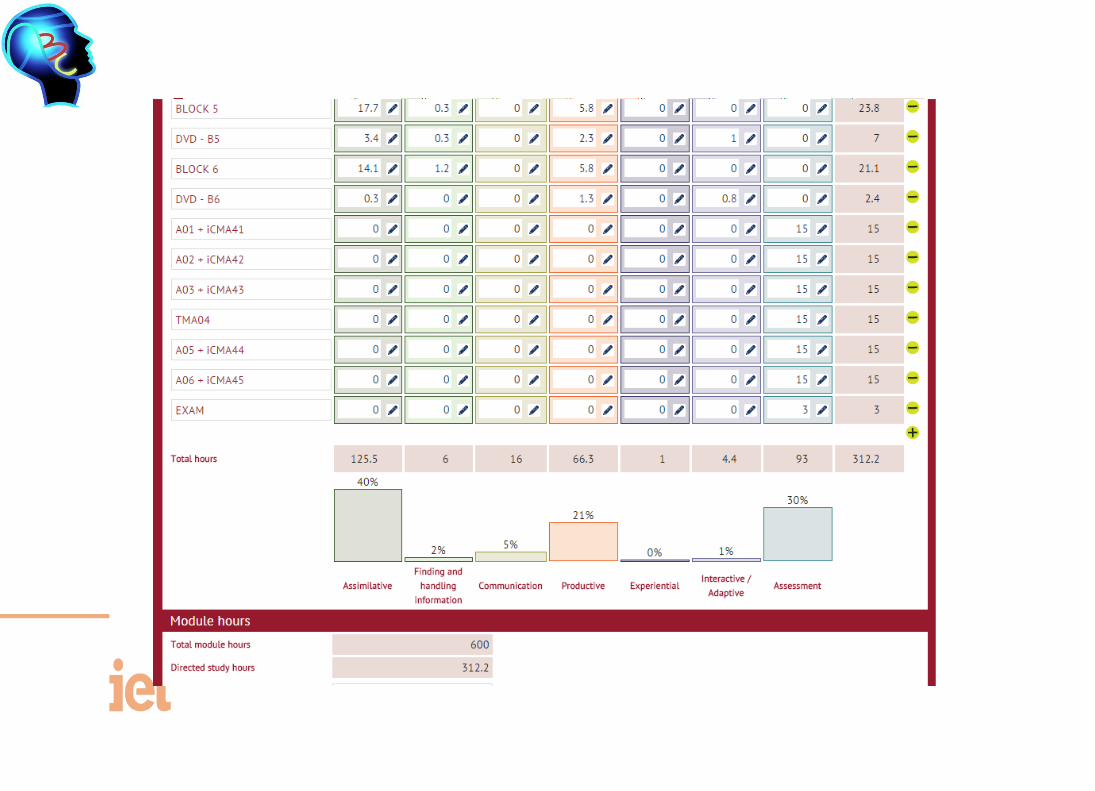
– Design: 75% Assimilative, 20% Assessment, 4% Productive

Participants
3262 students from years 2013/14 and 2014/15
2147 Females (age M=33.2, SD=12.8) & 1115 Males (age M=35.5, SD=14.2)
Motivational orientation:
36.8% - employment and personal development, 13.6% - employment, 23.9% - personal development
Occupational status:
43.9% in full-time employment, 24.2% part-time employment, 13.4% not in paid work, 10.9% unemployed
93.2% White; 19% reported study disability
50% have A level or equivalent, 30.9% have below A level, 14.3% have HE qualification
81.4% were only taking AA100 module

Example Arts AA100

Example Arts AA100

Example Arts AA100
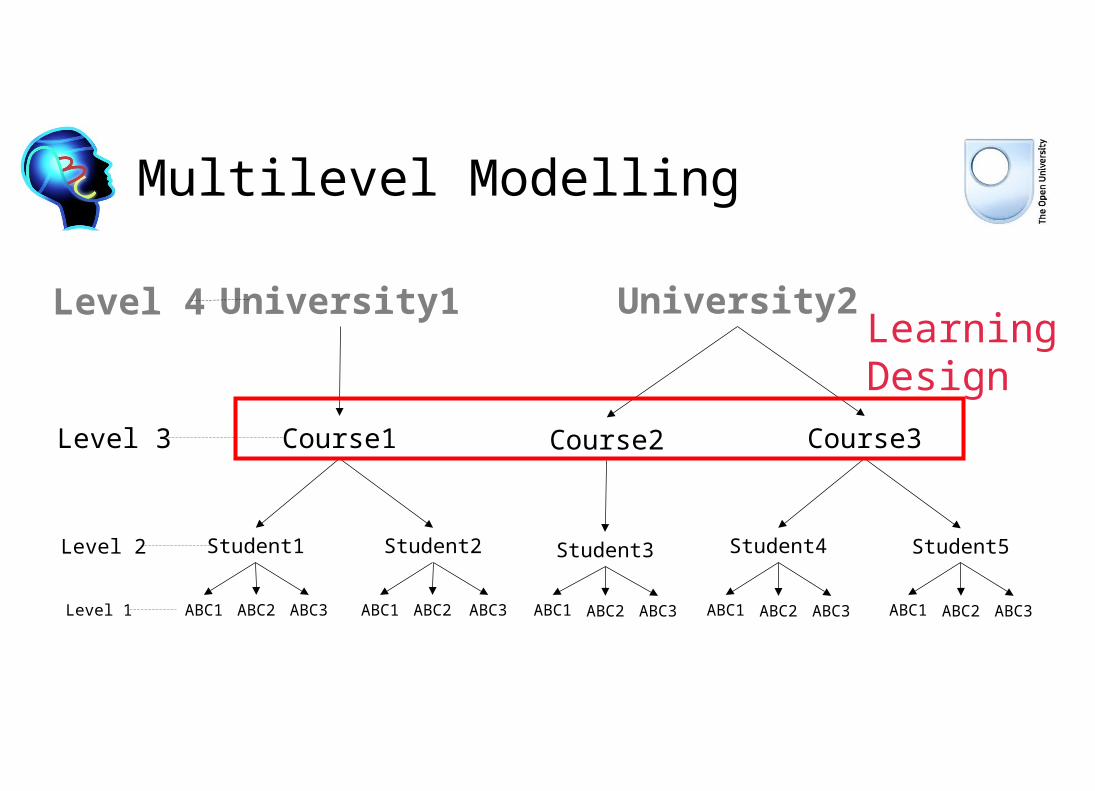
Multilevel Modelling
Level 1
Level 2
Level 4
Level 3
ABC1
Student1
ABC3 ABC1 ABC2 ABC3 ABC1 ABC2 ABC3ABC2
Student2 Student3
Course1 Course2
University1 University2
ABC1 ABC2 ABC3
Student4
ABC1 ABC2 ABC3
Student5
Course3
Learning Design


Assimilative Finding and handling information
Communication
Productive Experiential Interactive/
Adaptive
Assessment
Type of activity
Attending to information
Searching for and processing information
Discussing module related content with at least one other person (student or tutor)
Actively constructing an artefact
Applying learning in a real-world setting
Applying learning in a simulated setting
All forms of assessment, whether continuous, end of module, or formative (assessment for learning)
Examples of activity
Read, Watch, Listen, Think about, Access, Observe, Review, Study
List, Analyse, Collate, Plot, Find, Discover, Access, Use, Gather, Order, Classify, Select, Assess, Manipulate
Communicate, Debate, Discuss, Argue, Share, Report, Collaborate, Present, Describe, Question
Create, Build, Make, Design, Construct, Contribute, Complete, Produce, Write, Draw, Refine, Compose, Synthesise, Remix
Practice, Apply, Mimic, Experience, Explore, Investigate, Perform, Engage
Explore, Experiment, Trial, Improve, Model, Simulate
Write, Present, Report, Demonstrate, Critique

Method – data sets• Combination of four different data sets:
• learning design data (189 modules mapped, 276 module implementations included)
• student feedback data (140)• VLE data (141 modules)• Academic Performance (151)
• Data sets merged and cleaned• 111,256 students undertook these modules

Constructivist Learning Design
Assessment Learning Design
Productive Learning Design
Socio-construct. Learning Design
VLE Engagement
Student Satisfaction
Student retention
Learning Design151 modules
Week 1 Week 2 Week30+
Disciplines LevelsSize module
Rienties, B., Toetenel, L., (2016). The impact of learning design on student behaviour, satisfaction and performance: a cross-institutional comparison across 151 modules. Computers in Human Behavior, 60 (2016), 333-341
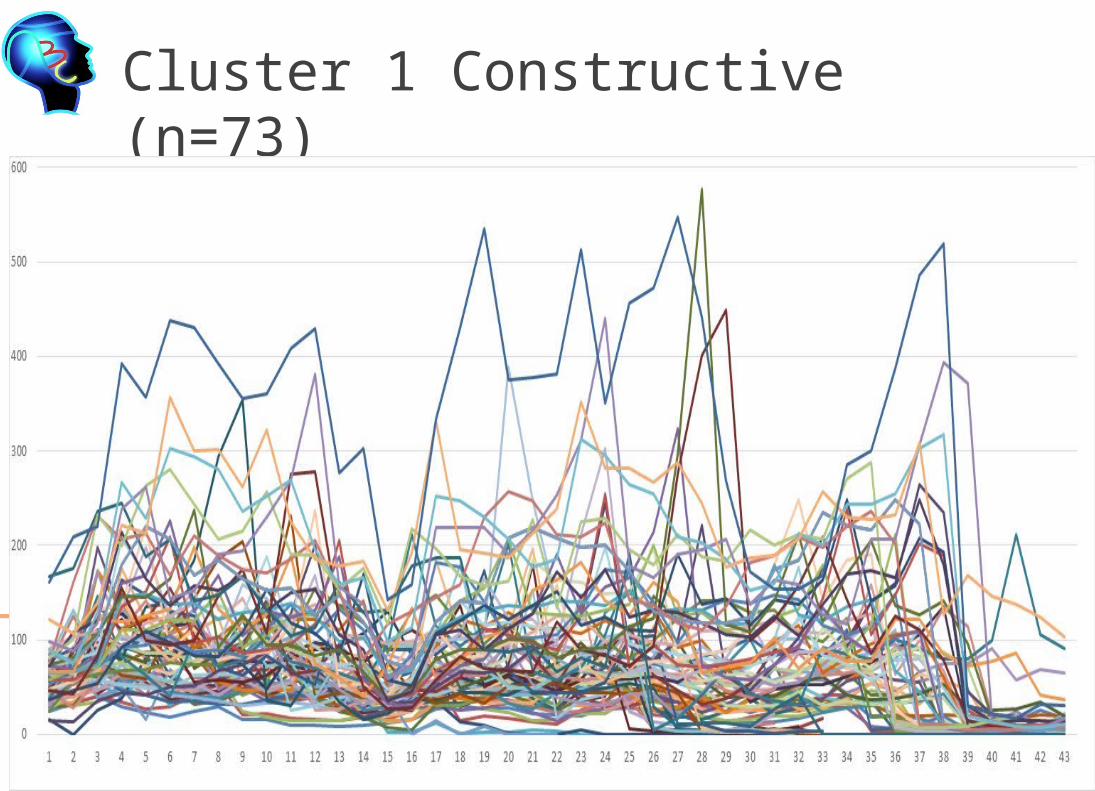
Cluster 1 Constructive (n=73)
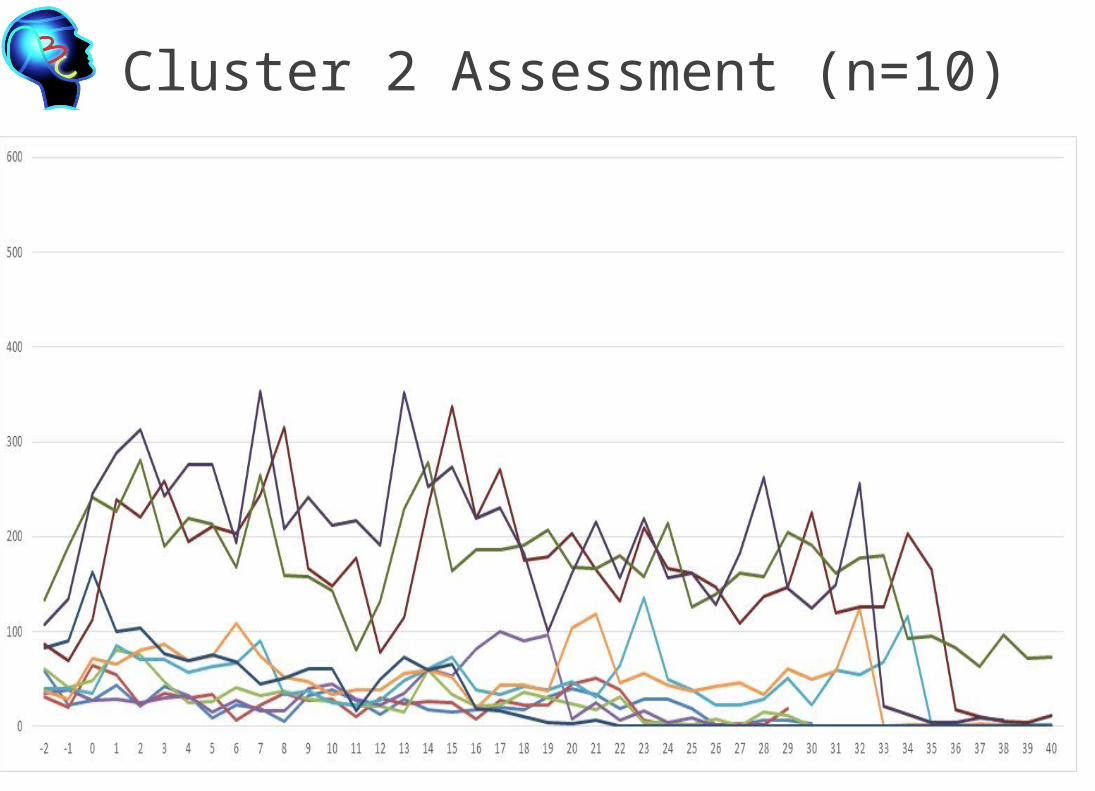
Cluster 2 Assessment (n=10)

Cluster 3 Productive (n=38)

Cluster 4 Social Constructivist (n=20)

Week Assim Find Com. Prod Exp Inter Asses Total
-2 -.03 .02 -.02 -.09 .20* -.03 .01 .35** -1 -.17* .14 .14 -.01 .30** -.02 -.05 .38**
0 -.21* .14 .37** -.07 .13 .08 .02 .48**
1 -.26** .25** .47** -.02 .28** .01 -.1 .48**
2 -.33** .41** .59** -.02 .25** .05 -.13 .42** 3 -.30** .33** .53** -.02 .34** .02 -.15 .51**
4 -.27** .41** .49** -.01 .23** -.02 -.15 .35**
5 -.31** .46** .52** .05 .16 -.05 -.13 .28**
6 -.27** .44** .47** -.04 .18* -.09 -.08 .28**
7 -.30** .41** .49** -.02 .22** -.05 -.08 .33**
8 -.25** .33** .42** -.06 .29** -.02 -.1 .32**
9 -.28** .34** .44** -.01 .32** .01 -.14 .36**
10 -.34** .35** .53** .06 .27** .00 -.13 .35**
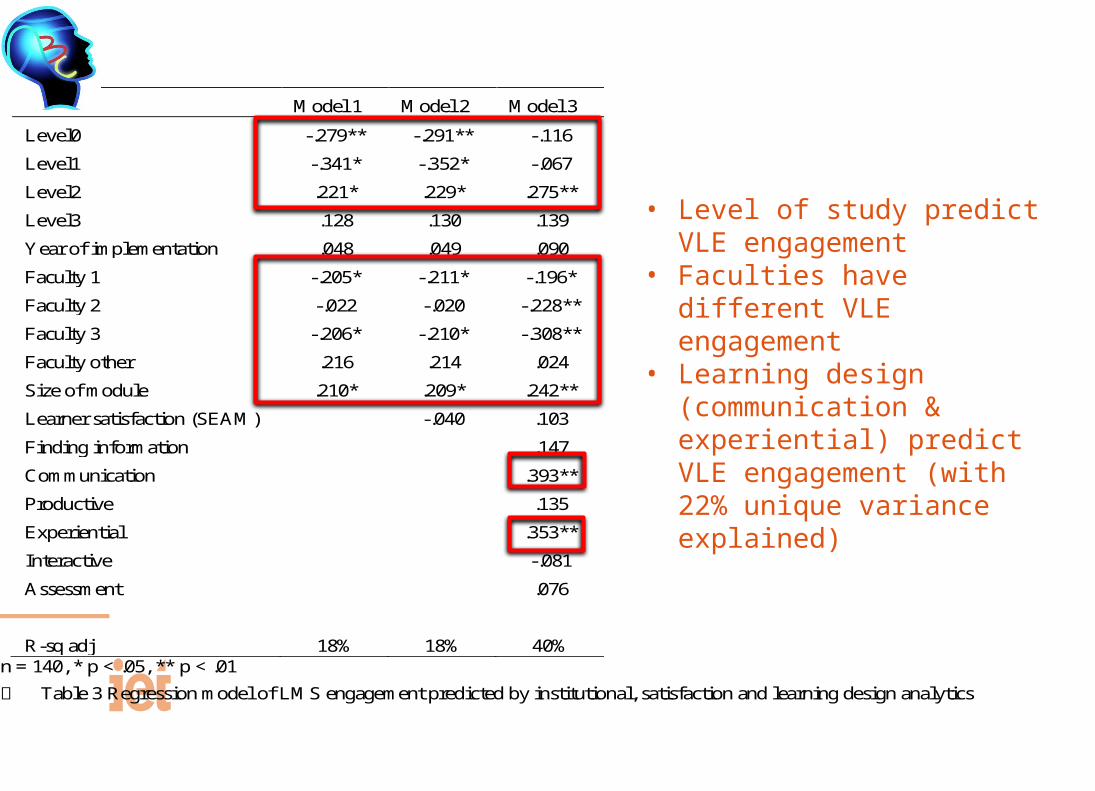
Model 1 Model 2 Model 3
Level0 -.279** -.291** -.116
Level1 -.341* -.352* -.067
Level2 .221* .229* .275**
Level3 .128 .130 .139
Year of implementation .048 .049 .090
Faculty 1 -.205* -.211* -.196*
Faculty 2 -.022 -.020 -.228**
Faculty 3 -.206* -.210* -.308**
Faculty other .216 .214 .024
Size of module .210* .209* .242**
Learner satisfaction (SEAM) -.040 .103
Finding information .147
Communication .393**
Productive .135
Experiential .353**
Interactive -.081
Assessment .076
R-sq adj 18% 18% 40%
n = 140, * p < .05, ** p < .01 Table 3 Regression model of LMS engagement predicted by institutional, satisfaction and learning design analytics
• Level of study predict VLE engagement
• Faculties have different VLE engagement
• Learning design (communication & experiential) predict VLE engagement (with 22% unique variance explained)
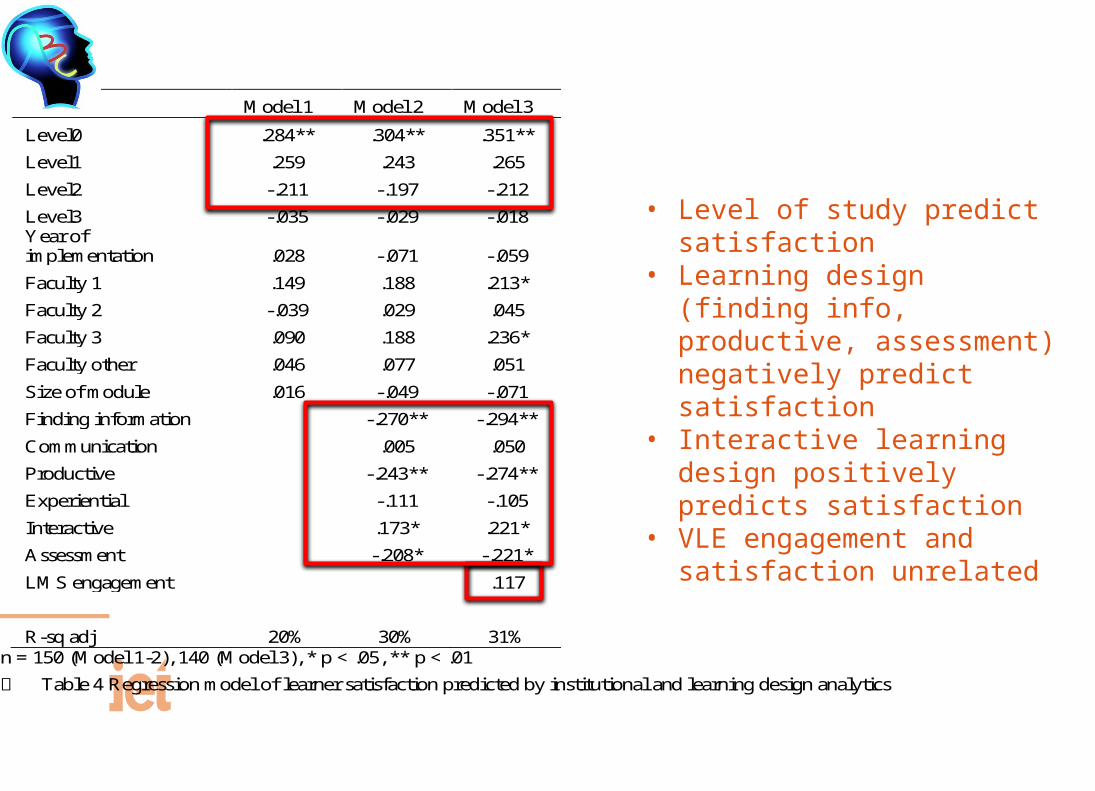
Model 1 Model 2 Model 3
Level0 .284** .304** .351** Level1 .259 .243 .265 Level2 -.211 -.197 -.212 Level3 -.035 -.029 -.018 Year of implementation .028 -.071 -.059 Faculty 1 .149 .188 .213* Faculty 2 -.039 .029 .045 Faculty 3 .090 .188 .236* Faculty other .046 .077 .051
Size of module .016 -.049 -.071 Finding information -.270** -.294**
Communication .005 .050 Productive -.243** -.274** Experiential -.111 -.105 Interactive .173* .221* Assessment -.208* -.221*
LMS engagement .117
R-sq adj 20% 30% 31% n = 150 (Model 1-2), 140 (Model 3), * p < .05, ** p < .01 Table 4 Regression model of learner satisfaction predicted by institutional and learning design analytics
• Level of study predict satisfaction
• Learning design (finding info, productive, assessment) negatively predict satisfaction
• Interactive learning design positively predicts satisfaction
• VLE engagement and satisfaction unrelated
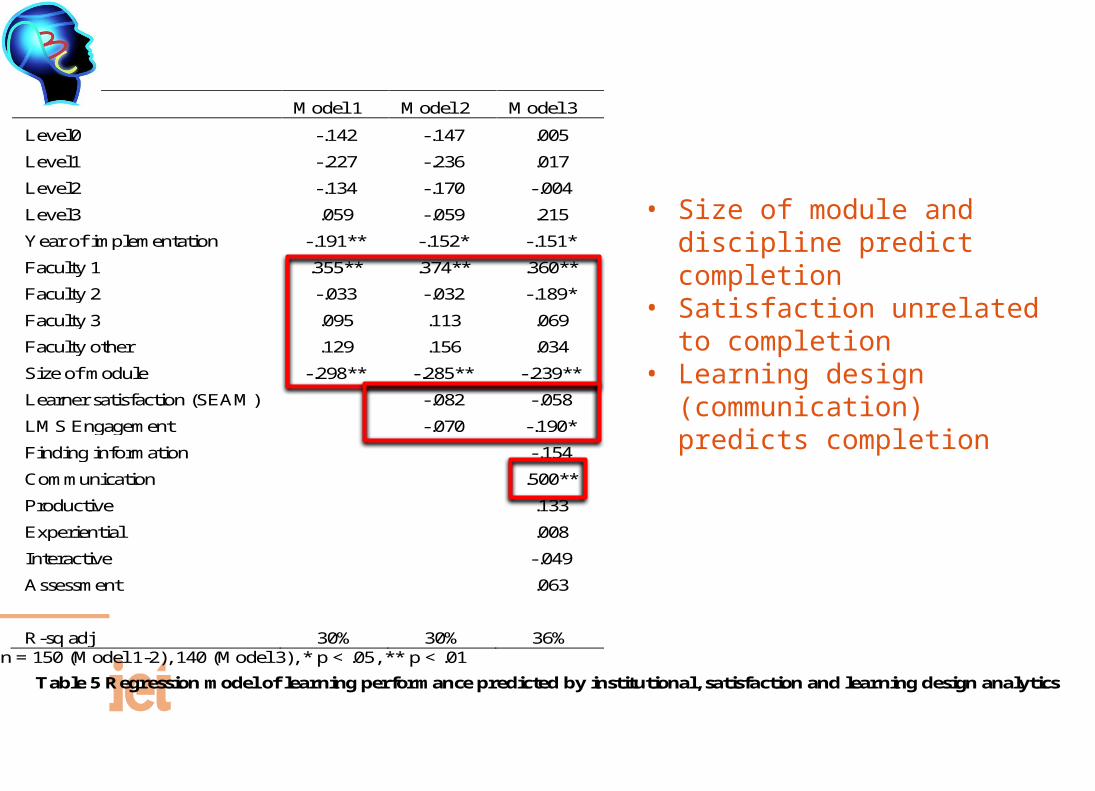
Model 1 Model 2 Model 3
Level0 -.142 -.147 .005
Level1 -.227 -.236 .017
Level2 -.134 -.170 -.004
Level3 .059 -.059 .215
Year of implementation -.191** -.152* -.151*
Faculty 1 .355** .374** .360**
Faculty 2 -.033 -.032 -.189*
Faculty 3 .095 .113 .069
Faculty other .129 .156 .034
Size of module -.298** -.285** -.239**
Learner satisfaction (SEAM) -.082 -.058
LMS Engagement -.070 -.190*
Finding information -.154
Communication .500**
Productive .133
Experiential .008
Interactive -.049
Assessment .063
R-sq adj 30% 30% 36%
n = 150 (Model 1-2), 140 (Model 3), * p < .05, ** p < .01
Table 5 Regression model of learning performance predicted by institutional, satisfaction and learning design analytics
• Size of module and discipline predict completion
• Satisfaction unrelated to completion
• Learning design (communication) predicts completion
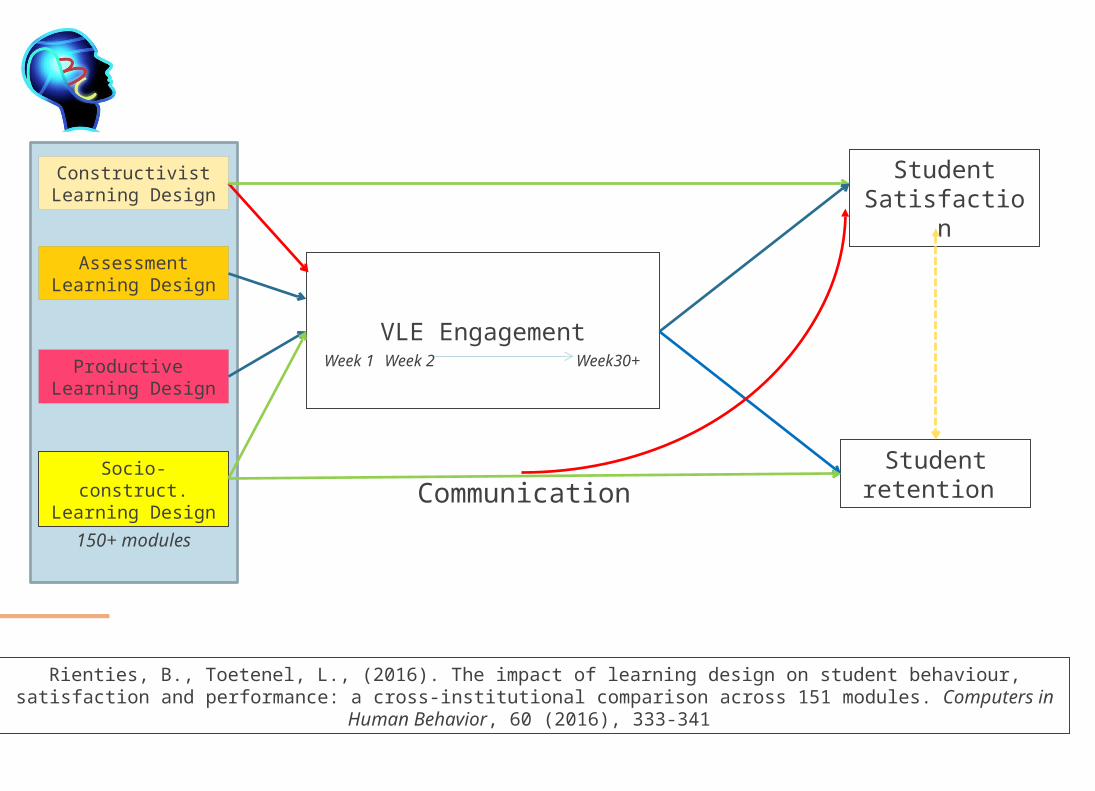
Constructivist Learning Design
Assessment Learning Design
Productive Learning Design
Socio-construct. Learning Design
VLE Engagement
Student Satisfaction
Student retention
150+ modules
Week 1 Week 2 Week30+
Rienties, B., Toetenel, L., (2016). The impact of learning design on student behaviour, satisfaction and performance: a cross-institutional comparison across 151 modules. Computers in Human Behavior, 60 (2016), 333-341
Communication

Next steps• Ethics• Data collection
Planned:• TEA conference (October)
• Modelling cognitive learning gains using learning analytics
• SRHE conference (December)• Presentation of the 4-level model for
OU+OB+US students samples
• OEB conference (December) • Modelling learning gains using learning analytics
Confirmed:• Teaching Excellence Framework: Raising Quality Standards (14th July)
• Presentation on Learning Analytics for measuring learning gains• EARLI conference (17-19th August)
• Presentation of the 3-level model for OU students sample• HEIR 2016 Conference (7-8 September)
• Presentation on ABC multi-level model OU student sample
• Data storage• Data analysis
Dissemination

Case Study: A Longitudinal Mixed-Method Study of Learning Gain - Applying
Affective-Behaviour-Cognition Framework at Three Institutions
11-05-2016@drBartRienties & Dr Jekaterina Rogaten@learninggainshttps://twitter.com/LearningGains