Case examples of the measurement of vibration and...
8
PROCEEDINGS of the 23rd International Congress on Acoustics 9 to 13 September 2019 in Aachen, Germany Case examples of vibration measurement and annoyance response in residential buildings beside roads and railways Yasunao MATSUMOTO 1 ; Shigenori YOKOSHIMA 2 ; Kentaro HAYASHI 3 1 Saitama University, Japan 2 Kanagawa Environmental Research Center, Japan 3 Benec Vibration and Sound Institute Inc., Japan ABSTRACT Vibrations induced by road traffic and railways have caused regional environmental problems in Japan where it is common that small-scale buildings for residential use are located beside roads and railways with high traffic volume. An investigation was conducted to understand the relationship between traffic-induced vibrations inside and outside of building and annoyance response of building residents. Vibration measurements were made at seven residential buildings located beside roads and railways. Those buildings were single-family houses, which were two- or three-story wooden buildings. Acceleration time histories were recorded at three locations inside and outside of buildings to understand the vibration occurring in those buildings and the dynamic characteristics of the buildings. The buildings for measurement were selected from the houses of respondents in a separate questionnaire survey on vibration annoyance. The annoyance responses obtained in the questionnaire survey were compared with the results of vibration measurements and metrics available in the international standards. Subjective responses measured in a separate laboratory experimental study were also compared with the vibration evaluation determined from vibration measurements and the annoyance responses in the questionnaire survey. Keywords: Building vibration, Traffic induced vibration, Vibration assessment, Case examples 1. INTRODUCTION Vibrations induced by road traffic and railways often degrade the habitability of surrounding buildings. The Vibration Regulation Law was enforced in 1976 in Japan. Road traffic vibration is one of the targets of regulation, although railway vibration is out of scope of the law for several reasons. According to an annual report by the Ministry of the Environment, Japan, number of complaints against vibration in residential environment showed an increasing trend in recent years (1). In addition, there were many cases in which the assessment based on the law was inconsistent with adverse comments on vibration raised from building occupant. The problems in the vibration regulation may include the fact that the regulation is applied to vibrations outside of building, which can differ from vibrations in buildings. The previous studies of community responses to vibration have been much less than the studies of community responses to noise. Therefore, a questionnaire survey on vibration annoyance and associated field vibration measurements were conducted in areas where the effect of vibrations induced by road traffic and railway could be expected (2). During the survey, vibration measurements inside of several residential buildings, from which responses to the questionnaire survey were received, were conducted to accumulate the information about the dynamic characteristics of residential buildings and the relationship between vibration exposure and annoyance response in residential buildings. This paper presents the results of those measurement as case examples of vibration measurement and annoyance response in residential buildings beside roads and railways. In addition, the results of field measurement of vibration and annoyance response were compared with the results of a laboratory experiment to understand possible 1 [email protected] 2 [email protected] 3 [email protected] 3643
Transcript of Case examples of the measurement of vibration and...

PROCEEDINGS of the 23rd International Congress on Acoustics
9 to 13 September 2019 in Aachen, Germany
Case examples of vibration measurement and annoyance response
in residential buildings beside roads and railways
Yasunao MATSUMOTO1; Shigenori YOKOSHIMA2; Kentaro HAYASHI3
1 Saitama University, Japan
2 Kanagawa Environmental Research Center, Japan
3 Benec Vibration and Sound Institute Inc., Japan
ABSTRACT
Vibrations induced by road traffic and railways have caused regional environmental problems in Japan
where it is common that small-scale buildings for residential use are located beside roads and railways with
high traffic volume. An investigation was conducted to understand the relationship between traffic-induced
vibrations inside and outside of building and annoyance response of building residents. Vibration
measurements were made at seven residential buildings located beside roads and railways. Those buildings
were single-family houses, which were two- or three-story wooden buildings. Acceleration time histories
were recorded at three locations inside and outside of buildings to understand the vibration occurring in those
buildings and the dynamic characteristics of the buildings. The buildings for measurement were selected
from the houses of respondents in a separate questionnaire survey on vibration annoyance. The annoyance
responses obtained in the questionnaire survey were compared with the results of vibration measurements
and metrics available in the international standards. Subjective responses measured in a separate laboratory
experimental study were also compared with the vibration evaluation determined from vibration
measurements and the annoyance responses in the questionnaire survey.
Keywords: Building vibration, Traffic induced vibration, Vibration assessment, Case examples
1. INTRODUCTION
Vibrations induced by road traffic and railways often degrade the habitability of surrounding
buildings. The Vibration Regulation Law was enforced in 1976 in Japan. Road traffic vibration is one
of the targets of regulation, although railway vibration is out of scope of the law for several reasons.
According to an annual report by the Ministry of the Environment, Japan, number of complaints
against vibration in residential environment showed an increasing trend in recent years (1). In addition,
there were many cases in which the assessment based on the law was inconsistent with adverse
comments on vibration raised from building occupant. The problems in the vibration regulation may
include the fact that the regulation is applied to vibrations outside of building, which can differ from
vibrations in buildings.
The previous studies of community responses to vibration have been much less than the studies of
community responses to noise. Therefore, a questionnaire survey on vibration annoyance and
associated field vibration measurements were conducted in areas where the effect of vibrations
induced by road traffic and railway could be expected (2). During the survey, vibration
measurements inside of several residential buildings, from which responses to the questionnaire
survey were received, were conducted to accumulate the information about the dynamic
characteristics of residential buildings and the relationship between vibration exposure and
annoyance response in residential buildings. This paper presents the results of those measurement as
case examples of vibration measurement and annoyance response in residential buildings beside
roads and railways. In addition, the results of field measurement of vibration and annoyance
response were compared with the results of a laboratory experiment to understand possible
1 [email protected] 2 [email protected] 3 [email protected]
3643

difference between subjective responses determined in laboratory studies and subjective responses
obtained from field measurements (3).
2. OVERVIEW OF FIELD MEASUREMENTS
The measurements of vibrations induced by road traffic and railways were conducted in seven
residential buildings. All buildings were wooden single-family detached houses with two or three
stories. The residents of those buildings gave permission for a measurement inside of the building
during a questionnaire survey on traffic induced vibration and noise reported in the reference (2).
Table 1 summarizes the information of residential buildings and sources of vibration. The table also
shows the annoyance response given by the resident of each building in the questionnaire survey to a
question to ask the degrees of annoyance caused by vibration induced by road traffic or railway in
the last 12 months (2). The responses were given by selecting among from "Extremely", "Very",
"Moderately", "Slightly" or "Not at all".
Table 1 – Summary of residential buildings
Building
No.
Number of
floors
Vibration source Questionnaire
Response (2) Type Size Approximate traffic
volume
1 2 Surface railway 8 tracks 980 trains/day
Extremely
2 2 Extremely
3 2 Elevated railway 4 tracks 600 trains/day Moderately
4 2 Underground
railway 2 tracks N/A Extremely
5 2 Surface and
elevated roads
6 lanes (surface) and
4 lanes (elevated) 120000 vehicles/day
Extremely
6 2 Very
7 3 Surface road and
railway 2 lanes
17000 vehicles/day
980 trains/day Very
The measurements were conducted at location, time and day that the permission from residents
were obtained. The duration of measurement at each building was about 1 hour for which the
residents were asked to keep quiet environment and avoid activities in the building to a possible
extent.
Three measurement locations were selected among from ground near the building, foundation, 1st
floor and 2nd floor, depending on the permission from residents. The measurement on building floor
was made at a location where the vibration magnitude was expected to be maximum in a room with
wooden floor. The measurement on the ground was made on a hard surface covering the ground, such
as on a concrete surface in garage.
The Vibration Level Meters, RION VM-53, were used to measure accelerations in three orthogonal
axes with data recorders, either RION DA-20 or TEAC es8. Acceleration time histories were recorded
at either 1000 samples/s or 1280 samples/s, depending on the available sampling rate in the data
recorders. No frequency weightings were applied to the acceleration during the measurement.
3. RESULTS OF VIBRATION MEASUREMENTS
This section presents the results of vibration measurement in all buildings described above, except
Buildings 5 and 7. In those two buildings, the vibration measurement was not possible at locations
where the residents usually stayed and felt vibration during their daily life and, therefore, the
comparison between the vibration measurement results and annoyance response discussed later may
not be appropriate. The results of Building 1 are not shown in this paper due to limitations of space.
The data presented in this paper are the results of 1/3-octave band analysis. The maximum value
3644

in each frequency band was determined during a pass-by of train for railway and a series of pass-bys
of vehicle dependent on traffic signal pattern for road traffic that induced the maximum overall
magnitude during the measurement. In the following figures, those maximum values in each
frequency band are presented using the Vibration Acceleration Level, VAL, specified in JIS C 1510
and 1517 (4, 5). Root mean square, r.m.s., accelerations were calculated for each frequency band
with the exponential averaging with a time constant of 0.63 s and converted to VAL in dB with a
reference of 10-5
ms-2
, as opposed to 10-6
ms-2
defined in ISO 1683 (6). Differences in VAL between
different measurement locations in a building are also presented in the following figures.
3.1 Building 2 - surface railway
Figure 1 shows a schematic diagram showing positional relation between the building and the
nearest rail track and the measurement results for Building 2. The dominant frequency range of
vibration transmitted to the building appeared to be 10 to 63 Hz. The vibration in Z-axis was dominant
at the ground. The vibration decreased at the foundation in all axes in the frequency range above 20 Hz.
However, the vibration in Z-axis increased at the building floor in the frequency range above 31.5 Hz,
which was thought to be caused by vibration of building floor, as reported previously. In X- and Y-axes,
the vibration increased at the 2nd floor at a frequency of 5 Hz. This increase might be caused by a
horizontal vibration mode of building structure.
Figure 1 – Building 2. Surface railway. (Grd: ground. Fnd: foundation. 2F: 2nd floor. VAL ref. 10-5
ms-2
.)
3.2 Building 3 - elevated railway
Figures 2 shows the positional relation between the building and the nearest rail track and the
measurement results for Building 3. The dominant frequency range of vibration transmitted to the
building appeared to be between 40 and 50 Hz. Vibration magnitude at the ground were similar in three
orthogonal axes, which was not observed for surface railway as shown in Figure 1. Although the
vibration magnitude was relatively small, a peak can be observed at 3.15 Hz in the vibration at the
ground in all directions, which may be caused by the dynamic characteristics of elevated structures. As
in Building 2, increases in the vibration in Z-axis at a higher frequency range and increases in the
vibrations in X- and Y-axes were observed, although the frequency range where those increases were
observed are different in those two buildings.
( : Measurement location)
15 mFoundation
x
y Ce
nte
r o
f ne
are
st
tra
ck
2nd floor
Ground
3645

Figure 2 – Building 3. Elevated railway. (Grd: ground. Fnd: foundation. 2F: 2nd floor. VAL ref. 10-5
ms-2
.)
3.3 Building 4 - underground railway
Building 4 was located about 30 m away from an underground rail tracks mainly for freight trains,
as shown in Figure 3. The measurement results presented in the figure imply that significant vertical
vibration was transmitted to the building, particularly, in the frequency range above 31.5 Hz, although
the measurement at the ground was not made for this building. In Z-axis, the vibrations in the building
showed different characteristics for the 1st and 2nd floors, which may be due to differences in the
dynamic properties of the floors. In this building, the amplification of horizontal vibrations occurred
relatively wider frequency range, i.e., 3.15 to 8 Hz, than the other buildings.
3.4 Building 6 - surface and elevated roads
Building 6 was located about 30 m away from surface and elevated roads. The effect of elevated
road on vibration along the road appeared to be minor because the traffic volume in the surface road
was much higher than the traffic volume in the elevated road. Figure 4 shows the results of
measurement. The dominant frequency range of vibration transmitted to the building appeared to be
around 10 to 16 Hz. For horizontal vibrations, the vibrations measured at the 2nd floor tended to be
greater than the vibrations at the foundation in the frequency range above 4 Hz in this building. In
particular, the horizontal vibrations in the frequency range 5 to 6.3 Hz amplified by the building had a
similar magnitude to the dominant frequency components of vertical vibration around 10 Hz. The
vertical vibration increased at frequencies above 25 Hz at the 1st and 2nd floor, compared to the
foundation, as observed in the other buildings.
26 m
x
y
( : Measurement location)
FoundationC
ente
r o
f ne
are
st
tra
ck
2nd floor
Ground
3646

Figure 3 – Building 4. Underground railway.
(Fnd: foundation. 1F: 1st floor. 2F: 2nd floor. VAL ref. 10-5
ms-2
.)
Figure 4 – Building 6. Surface and elevated road.
(Fnd: foundation. 1F: 1st floor. 2F: 2nd floor. VAL ref. 10-5
ms-2
.)
30 m
x
y( : Measurement location)
Foundation
1st floor
2nd floor
( : Measurement location)
28.5 m
Foundation
x
y
Ce
nte
r o
f ne
are
st
lane
1st floor
2nd floor
3647
4. VIBRATION EVALUATION AND ANNOYANCE RESPONSE
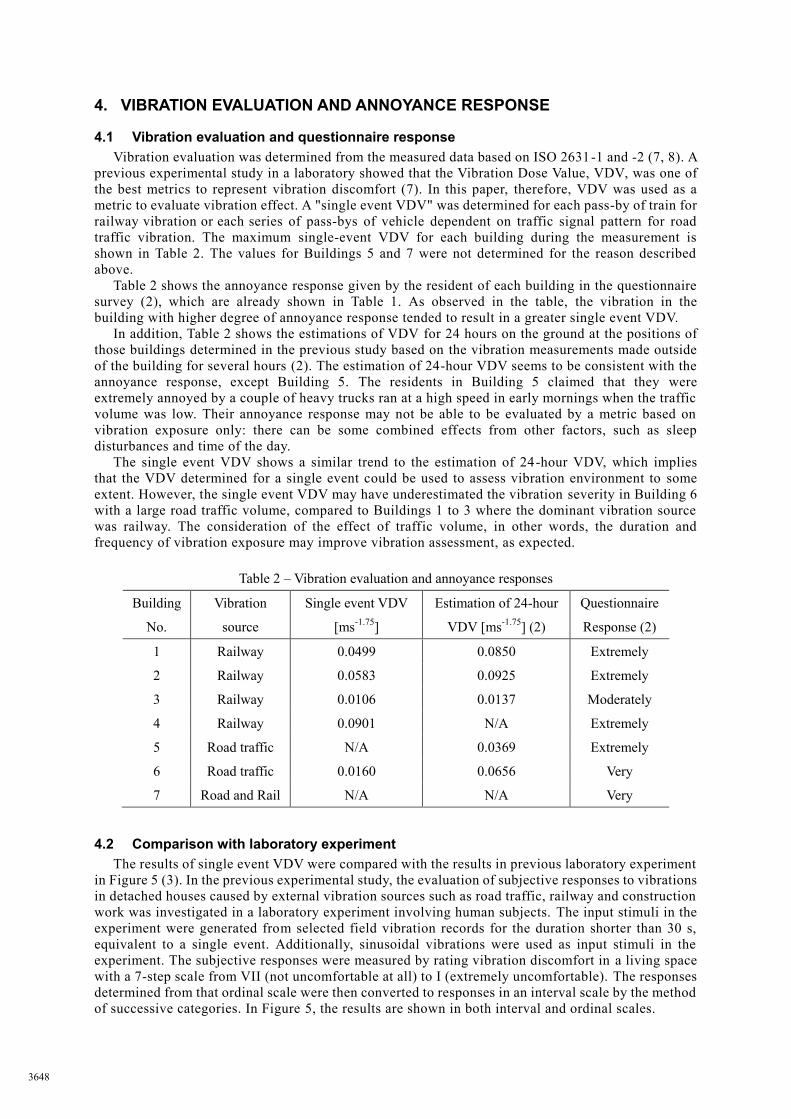
4.1 Vibration evaluation and questionnaire response
Vibration evaluation was determined from the measured data based on ISO 2631-1 and -2 (7, 8). A
previous experimental study in a laboratory showed that the Vibration Dose Value, VDV, was one of
the best metrics to represent vibration discomfort (7). In this paper, therefore, VDV was used as a
metric to evaluate vibration effect. A "single event VDV" was determined for each pass-by of train for
railway vibration or each series of pass-bys of vehicle dependent on traffic signal pattern for road
traffic vibration. The maximum single-event VDV for each building during the measurement is
shown in Table 2. The values for Buildings 5 and 7 were not determined for the reason described
above.
Table 2 shows the annoyance response given by the resident of each building in the questionnaire
survey (2), which are already shown in Table 1. As observed in the table, the vibration in the
building with higher degree of annoyance response tended to result in a greater single event VDV.
In addition, Table 2 shows the estimations of VDV for 24 hours on the ground at the positions of
those buildings determined in the previous study based on the vibration measurements made outside
of the building for several hours (2). The estimation of 24-hour VDV seems to be consistent with the
annoyance response, except Building 5. The residents in Building 5 claimed that they were
extremely annoyed by a couple of heavy trucks ran at a high speed in early mornings when the traffic
volume was low. Their annoyance response may not be able to be evaluated by a metric based on
vibration exposure only: there can be some combined effects from other factors, such as sleep
disturbances and time of the day.
The single event VDV shows a similar trend to the estimation of 24-hour VDV, which implies
that the VDV determined for a single event could be used to assess vibration environment to some
extent. However, the single event VDV may have underestimated the vibration severity in Building 6
with a large road traffic volume, compared to Buildings 1 to 3 where the dominant vibration source
was railway. The consideration of the effect of traffic volume, in other words, the duration and
frequency of vibration exposure may improve vibration assessment, as expected.
Table 2 – Vibration evaluation and annoyance responses
Building
No.
Vibration
source
Single event VDV
[ms-1.75
]
Estimation of 24-hour
VDV [ms-1.75
] (2)
Questionnaire
Response (2)
1 Railway 0.0499 0.0850 Extremely
2 Railway 0.0583 0.0925 Extremely
3 Railway 0.0106 0.0137 Moderately
4 Railway 0.0901 N/A Extremely
5 Road traffic N/A 0.0369 Extremely
6 Road traffic 0.0160 0.0656 Very
7 Road and Rail N/A N/A Very
4.2 Comparison with laboratory experiment
The results of single event VDV were compared with the results in previous laboratory experiment
in Figure 5 (3). In the previous experimental study, the evaluation of subjective responses to vibrations
in detached houses caused by external vibration sources such as road traffic, railway and construction
work was investigated in a laboratory experiment involving human subjects. The input stimuli in the
experiment were generated from selected field vibration records for the duration shorter than 30 s,
equivalent to a single event. Additionally, sinusoidal vibrations were used as input stimuli in the
experiment. The subjective responses were measured by rating vibration discomfort in a living space
with a 7-step scale from VII (not uncomfortable at all) to I (extremely uncomfortable). The responses
determined from that ordinal scale were then converted to responses in an interval scale by the method
of successive categories. In Figure 5, the results are shown in both interval and ordinal scales.
3648

Figure 5 shows the comparison of the single event VDV determined for Buildings 2, 3 4 and 6
with the previous experimental results. Buildings 2 and 4, whose annoyance response were
"extremely", had the single event VDV in the range of subjective scale in the experiment between III
and V, and from II to IV, respectively. Building 3 with the annoyance response of "moderately"
showed the single event VDV corresponding to the subjective scale of VII , i.e., "not uncomfortable
at all". The single event VDV for Building 6 also in the same range, although the annoyance
response was "very".
It is sometimes claimed that subjective responses measured in laborator ies are severer than
responses in real residential environments for several reasons. The comparison made in Figure 5 may
not necessarily support such a view. It can be interpreted that, for the same VDV, the annoyance
responses in questionnaire survey were severer than the discomfort responses measured in laboratory
experiment. However, a direct comparison between the responses in laboratory and the responses in
real residential environments was not appropriate in this investigation, partly because the response to
single vibration event was not determined in real residential environments. The annoyance responses
obtained from the building residents shown here were based on the evaluation of vibration
annoyance in the last 12 months, which may have been affected not only by vibration magnitude but
by the traffic volume, combined effect from noise, and so on.
Figure 5 – Comparison of measurement with previous laboratory experiment results (3). ●: input stimuli from
field records; △: sinusoidal vibration. (Annoyance response - Building 2: Extremely; Building 3:
Moderately; Building 4: Extremely; Building 6: Very.)
5. CONCLUSIONS
The case examples of vibration measurement and annoyance response in detached single-family
houses discussed in this paper may show actual situations of habitability in residential buildings
located beside roads and railways in Japan. The vibration measurement results showed examples of
the characteristics of traffic induced vibrations and the dynamic properties of residential detached
buildings. The comparison between vibration measurements and annoyance responses implied that
metrics of vibration assessment that considered the magnitude, duration and frequency of vibration
events could be used to predict a subjective response in residential environment for a long term, such
as for one year in the study referred to in this paper. The Vibration Dose Value determined from a
single vibration event might represent a long-term response to some extent and be used for an initial
survey. Subjective responses measured in the previous laboratory study showed some consistency
with annoyance responses in residential environment.
ACKNOWLEDGEMENTS
The assistances in the questionnaire survey and the field vibration measurement provided by Dr.
Hidetaka Shiraishi from the Center for Environmental Science in Saitama, and Ms. Aya Tanaka, Ms.
Kaho Fujii, Mr. Atomu Shimada, former students of Saitama University, are acknowledged.
Bld. 2
Bld. 3
Bld. 4
Bld. 6
: Extremely uncomfortable
: Not uncomfortable at all
3649

REFERENCES
1. Ministry of the Environment, Japan. FY 2017 Survey on the Enforcement Status of the Vibration
Regulation Law. 2019. (in Japanese)
2. Matsumoto Y, Yokoshima S, Shiraishi H. An investigation of exposure-response relationships for
vibrations induced by ground transportation. Proc 11th ICBEN; 1-5 June 2014, Nara, Japan 2014, Paper
6-36, p. 1-8.
3. Hayashi K, Matsumoto Y. An experimental investigation of evaluation method of horizontal vibrations
in detached houses. Proc 46th Internoise; 27-30 August 2017, Hong Kong, p. 2307-2314
4. Japanese Industrial Standard. Vibration level meters. JIS C 1510: 1995. (in Japanese)
5. Japanese Industrial Standard. Vibration level meters - Measuring instruments used in transaction or
certification. JIS C 1517: 2014. (in Japanese)
6. International Standard. Acoustics - Preferred reference values for acoustical and vibratory levels. ISO
1683: 2015.
7. International Standard. Mechanical vibration and shock - Evaluation of human exposure to whole-body
vibration - Part 1: General requirements. ISO 2631-1: 1997.
8. International Standard. Mechanical vibration and shock - Evaluation of human exposure to whole-body
vibration - Part 1: Building vibration (1 Hz to 80 Hz). ISO 2631-2: 2003.
3650