Carrying capacity methodology for tourism · MODUL University Vienna () is an international private...
45
Carrying capacity methodology for tourism Technical Offer Submitted by: ÖIR GmbH Modul University Vienna GmbH University of Ljubljana alohas
Transcript of Carrying capacity methodology for tourism · MODUL University Vienna () is an international private...

Carrying capacity methodology for tourism
Technical Offer
Submitted by: ÖIR GmbH Modul University Vienna GmbH University of Ljubljana alohas

2_Tech-Offer_10.docx
Contracting authority: ESPON EGTC; Rue Erasme 4, 1468 Luxembourg
ÖIR GmbH (100% subsidiary of the association Österreichisches Institut für Raumplanung/
Austrian Institute for Regional Studies and Spatial Planning)
AT, 1010 Vienna, Franz-Josefs-Kai 27 | Phone +43 1 533 87 47-0, Fax -66 | www.oir.at
Modul University Vienna GmbH
AT, 1190 Vienna, Am Kahlenberg 1 │ Phone +43 1 320 35 55 – 0 │www.modul.ac.at
University of Ljubljana, School of Economics and Business (SEB LU)
SI, 1000 Ljubljana, Kardeljeva pl. 17 │ Phone +386 1 5892 – 0 │ www.ef.uni-lj.si
Alohas, Miša Novak s.p. ALOHAS
Sedež: Groharjeva 5, 1230 Domžale Spodnje Jarše Pisarna: Ljubljanska cesta 12F, SI-1236 Trzin
Phone +386.1.546.23.06 │ www.alohas.si
3 June 2019 | ANr. 801262

Carrying capacity methodology for tourism
Technical Offer
CONTENTS
1. Concept 7 1.1 Context 7
1.1.1 Overview on existing carrying capacity approaches in tourism 7 1.1.2 Tourism related ESPON studies 8
1.2 Objectives and outcomes 8 1.3 General Approach 11
2. Approaches and methods 12 2.1 Task 1: Identification and critical review of existing methodologies for measuring the carrying
capacity of tourist destinations and models for management of visitors 12 2.1.1 Objective and scope 12 2.1.2 Methodological approach 13 2.1.3 Partners involved 14
2.2 Task 2: Development of a methodology for measuring tourist capacity for each different type of stakeholders’ territory 14 2.2.1 Objective and scope 14 2.2.2 Methodological approach 15 2.2.3 Partners involved 16
2.3 Task 3: Territorial evidence, including interactive visualisation based on the methodology developed on the carrying capacity of territories and tourist flows 17 2.3.1 Objective and Scope 17 2.3.2 Methodological approach 17 2.3.3 Partners involved 21
2.4 Task 4: Cases studies and interactive visualisation of tourist flows 21 2.4.1 Objective and Scope 21 2.4.2 Methodological approach 22 2.4.3 Partners involved 25
2.5 Task 5: Preparation of strategic guidelines and policy recommendations 25 2.5.1 Objective and scope 25 2.5.2 Methodological approach 26 2.5.3 Partners involved 26
2.6 Main outcomes and results 27 2.6.1 Methodology for measuring carrying capacity 27 2.6.2 Evidence for Stakeholders 28
3. Organisation, milestones and management of the work 29 3.1 Project organisation 29
3.1.1 Project team 30 3.2 Allocation of human resources 31 3.3 Work plan, timetable and deliverables 31
3.3.1 Work plan, timetable and milestones 32 3.4 Potential challenges and quality control measures 32
3.4.1 Potential challenges and risk management 32 3.4.2 Quality control measures 33
References 35
Annex 38 A.1 Communication lines 38 A.2 Deliverables 40 A.3 Milestones and Meetings 41 A.4 Risk management 42 A.5 Quality control measures 43 A.6 Allocation of working days per team member 45

Carrying capacity methodology for tourism
Technical Offer
Tables and figures
Table 1: Working steps, methods and major outcomes in Task 1 12 Table 2: Partners involved in Task 1 14 Table 3: Working steps, methods and major outcomes in Task 2 14 Table 4: Partners involved in Task 2 16 Table 5: Working steps, methods and major outcomes in Task 3 17 Table 6: Partners involved in Task 3 21 Table 7: Working steps, methods and major outcomes in Task 4 22 Table 8: Partners involved in Task 4 25 Table 9: Working steps, methods and major outcomes in Task 5 25 Table 10: Partners involved in Task 5 26 Table 11: Methodology handbook for measuring carrying capacity 27 Table 12: Distribution of tasks 30 Table 13: Allocation of human resources 31 Table 14: Work steps and outcomes from a project management perspective (Task 6) 32
Figure 1: The overall order and flow of the project tasks 11 Figure 2: Overview of tasks 12 Figure 3: Displaying different statistical indicators from TourMIS, World Bank and Eurostat on the same chart 19 Figure 4: An example of the WYSDOM metric visualisation 19 Figure 5: Geomap with flows between sources and targets displayed 19 Figure 6: webLyzard visual analytics dashboard example 20 Figure 7: Heat map for tourist infrastructure hotspot identification 23 Figure 8: Territorial transportation maps 24 Figure 9: Territorial transportation maps 24 Figure 10: Spatio-temporal heat maps 24 Figure 11: Outcomes of the project 27 Figure 12: Project organisation 29 Figure 13: Work steps and related methodologies in Task 6 (project management) 31 Figure 14: Timetable 34
Carrying capacity methodology for tourism
Technical Offer
Introduction
The tenderer ÖIR GmbH (100% subsidiary of the association Austrian Institute for Regional Studies, “ÖIR” in the following), together with its partner organisations MODUL University GmbH, University of Ljubljana and ALOHAS is offering its services for the “Carrying Capacity Methodology for Tourism” ESPON activity. The consortium synergizes a team of well-known experts with complementing expertise in the area of territorial development, tourism devel-opment, sustainability, carrying capacity, big data extraction and analysis as well as interactive visualization.
Below are presented short profiles of our partners.
ÖIR GmbH (www.oir.at) is a private consulting firm established in 2011. The company is a 100% subsidiary of the association “Österreichisches Institut für Raumplanung” (Austrian Institute for Regional Studies) established in 1957. Through our participation in the ESPON programme, our studies and consulting work for the Commission (DG Regio, DG Agri), the European Parliament, the European Investment Bank and the Committee of Regions, ÖIR has acquired a vast experience in dealing with European territorial development issues. Such expertise notably comprises espe-cially the evaluation of operational programs including cross border programs. We have vast experience in territorial impact assessment. ÖIR lead the ESPON ARTS project, developing the TIA web application and preparing, moderat-ing and documenting workshops and trainings. We developed the ESPON TIA Quick Check which is applied in several workshops at the committee of region and DG Regio. So we can offer excellent knowledge of the theory of TIA. .Due to our projects’ transdisciplinary approach, which connects different stakeholders, notably, representatives of the administration and policy makers, we have proven experience in translating scientific knowledge into concrete mes-sages suitable for stakeholders.
MODUL University Vienna (www.modul.ac.at) is an international private university founded by the Vienna Chamber of Commerce its mission is to provide cutting-edge research and teaching in an international and culturally diverse study and research environment. All study programs are accredited by the Agency for Quality Assurance and Ac-creditation Austria, a member of the European Association for Quality Assurance in Higher Education (ENQA). Since all programs offer research-driven curricula, MODUL University’s international faculty is engaged in innovative re-search which has developed substantially over the first ten years. While at the beginning the institution focused primarily on tourism, new media technology, sustainable development and governance related research, new re-search areas of a more diverse faculty are pursued today. A lot of interdisciplinary research activities shape the institution’s research profile, for example in the areas of entrepreneurship, tourism and sustainable development, with a clear focus on entrepreneurial challenges in fast changing environments. Other researchers try to tackle the challenges of time-space-compression in a globalized economy, some by taking advantage of the knowledge in management and new media concentrated at MODUL University, with others leaning on management, governance and sustainable development backgrounds to develop transition management approaches which help to under-stand and anticipate long-term systemic effects.
University of Ljubljana, School of Economics and Business (SEB LU) belongs to an elite group of business schools worldwide with the Triple Crown accreditations EQUIS, AACSB and AMBA. SEB UL is ranked 95th by the Financial Times among the best business schools in Europe. It is also the top education institution in the field of tourism in Europe – SEB LU Master tourism programs are among top 10 Master Programs in EU and its tourism programmes hold the UNWTO’s prestigious TedQual international accreditation. SEB LU is considered a key stakeholder with strategic significance within Slovenia and the CEE countries in a number of areas. Throughout its history, SEB LU has had a vital influence on the national economy and the wider region.
ALOHAS is a company founded in 2007, with the aim of providing sustainable marketing solutions in tourism. The name is an acronym for A Lifestyle of Health and Sustainability.
It is managed by Misa Novak, with 22 years of professional experience in tourism industry including hotel manage-ment, product development, strategic destination planning, branding, corporate communications, sustainable man-agement in hotels and destinations. The core team is expanded with experts in different fields, according to the specific needs of each project. This business model enables big flexibility and delivers best value for the client.
The business strategy of ALOHAS is to offer dedicated and tailored solutions in the field of tourism, in the following areas:
Strategic destination planning (destination strategies).
Management of strategic flows.
Stakeholders mapping and partnership models.
Sustainable practices – planning and support in implementation.

Carrying capacity methodology for tourism
Technical Offer
Product development.
Business models evaluation and re-invention.
Customer experience management.
Brand strategies.
Facilitated workshops.

Carrying capacity methodology for tourism
Technical Offer 7
1. Concept
1.1 Context
Carrying capacity in tourist destinations is an intensively discussed topic with relevance for policy, practitioners and academia. The concept of carrying capacity is originally coming from ecology and has to be understood in conjunc-tion with ecosystem resilience in order to assess environmental sustainability (see Arrow et al. 1995, Holling et al. 2000). Human carrying capacity (Rees and Wackernagel 1994) is discussed in the literature in the context of regional sustainability and implies resilience of regions’ social-ecological systems. If regions have a limited capacity to provide resources and services (Graymore et al. 2010) then tourism as one of the major economic activities as well as tour-ism destinations and their residents are negatively affected. Thus, the question of how to manage destinations on the basis of their measured carrying capacity becomes a core question for territorial development.
1.1.1 Overview on existing carrying capacity approaches in tourism
Discussion on the growth limits and carrying capacity of tourism destinations is not new. Already for decades, carry-ing capacity has been at the core of sustainable tourism and aims at offering “time/space-specific answers” at the individual localities (Saarinen, 2006, p. 1125). There are many definitions of this concept, arguably the most promi-nent one being “the maximum number of people that may visit a tourist destination at the same time, without caus-ing destruction of the physical, economic and sociocultural environment and an unacceptable decrease in the qual-ity of visitors’ satisfaction” (UNWTO, 2018, p. 3). Reality is that calculation of this “magic number” is not feasible for reasons such as differences in threshold established by tourists and residents, territorially determined ecological limits, multitude of resources, and so on (Saarinen, 2006; Jurado et al., 2012). However, in spite of not measuring an absolute limit, one can still use it for identifying critical thresholds and for examining changes over time (O’Reilly, 1986). Thus, carrying capacity can be understood as a tool for destinations to become more sustainable (Jurado, Damian, & Fernández-Morales, 2013), and as such more competitive, as “competitiveness without sustainability is illusory” (Ritchie & Crouch, 2003, p. 9).
Besides the negative influence on satisfaction on the tourists’ side, this implies the above impact on the overall social-ecological systems in the respective tourist destination and is linked to the concept of regional sustainability. Based on the three dimensions of sustainability (social, economic, environmental) the tourist capacity needs to be measured at the territorial level.
Nowadays, there is a lot of attention geared towards overtourism. Although this buzzword entered our vocabulary only in 2016 after Skift had trademarked the term, there is nothing novel about it. Its definition focuses on the nega-tive impacts of tourism on a destination, more specifically, on the quality of life of its residents and the quality of experiences for its visitors (UNWTO, 2018), which is all under the domain of sustainable tourism, toying with the concept of carrying capacity. The boost in its popularity was triggered with the media articles on a dire situation in cities such as Barcelona, Venice, and Dubrovnik. As a result, many research initiatives have been introduced on how to protect a city destination from overtourism (e.g., Roland Berger, 2018; UNWTO, 2018, 2019). For instance, Ro-land Berger (2018) consultancy focused on comparing tourism density versus revenue per available room (RevPAR) of 52 European cities. Or in other words, contrasting quantity and quality. In addition, they proposed seven meas-ures for dealing with overtourism, both proactive (short term, medium term, long term) and reactive measures, depending on whether destinations are already experiencing the problem of overtourism or not. Proposed meas-ures that are in line with the current discussion on carrying capacity are for instance: (1) distribution of guests across the city and seasons, (2) regulation of capacities, and (3) limitation of access (entry tickets, slot allocation, flexible pricing) (Roland Berger, 2018, p. 11).
At the European policy level, the “Agenda for Sustainable and Competitive European Tourism”1, which is a long-term commitment of the European Commission, identified challenges of European tourism and a need to define a strong framework for action. In their principles they mention carrying capacity of individual sites and wider areas as an important step to set and respect limits. Therefore, destinations started to think about mechanisms to overcome impacts on carrying capacity but without systematically developing and or applying appropriate methodologies for measuring tourist capacity.
1 https://eur-lex.europa.eu/legal-content/EN/TXT/?uri=celex%3A52007DC0621

Carrying capacity methodology for tourism
8 Technical Offer
The first foundational report for managing overcrowding in tourism destinations is “Coping with success – managing overcrowding in tourism destinations”2 published by the World Travel & Tourism Council. The report sketches the problem of defining overcrowding more generally for tourism destinations and discussed a well-known phenome-non that every territorial unit is unique and needs to develop and implement its own strategies to overcome this problem. Nevertheless, there are similarities that help destinations to learn from each other. The report identifies five major challenges resulting from overcrowding: alienated local residents; degraded tourist experience; over-loaded infrastructure, damage to nature, threats to culture and heritage. The presented metrics can be seen as a valuable set of potential measures. In addition, the report presents four best practices in tourism management which have the potential to help destinations to pro-actively overcome challenges of overcrowding.
The European Tourism Indicator System (ETIS) toolkit for sustainable management3 launched by the European Commission in 2013 is designed as a monitoring and measuring instrument for destinations in form of a self-assessment. The available set of sustainability indicators helps destinations to measure their overall destination management, the impact on their local economy, their community and the environment. ETIS defines destinations as “geographic areas attractive to visitors and tourists; places or areas which are recognised and can easily be de-fined as a visitor destination and have a range of facilities and products in place for tourism purposes; places or areas which are promoted as destinations; places or areas where it is possible to measure the supply of and demand for tourism services; places or areas where the visitor management process usually includes a range of public and private-sector stakeholders together with the host community” (p. 10).
1.1.2 Tourism related ESPON studies
The study EuroFutures4 is a preparatory study of spatially relevant aspects of tourism and the study clearly identified three concepts relevant for analysing and measuring tourism and its impacts for regional development and spatial planning: tourism flows; economic contributions; sustainability impacts. The study is valuable for the service con-tract since it offers insights into the importance of tourism for spatial planning and the European territorial devel-opment and it includes sustainability.
The Feasibility study on analytical tools based on big data (ESPON Tool (20111-2014))5 provides a broad overview of different types of big data available for territorial analysis as well as methodological options for integrating big data with ESPON and official statistical data. In the recommendations for future work targeted analyses on user demand are mentioned as important orientation support for decision makers. Tourism is not explicitly mentioned but some of the presented case study cities are tourism destinations.
The study BRIDGES – territories with geographical specificities6 specifically focuses on sustainable tourism and links it to territorial aspects and provides an overview of challenges of territories with geographical specificities (TGS) in their transition to sustainable tourism. It includes valuable information and evidence about specific pressures affect-ing carrying capacity in specific types of regions. Which can be used for the service contract.
1.2 Objectives and outcomes
Overall objectives
The overall goal of the service contract is to determine the carrying capacity in regions dominated by tourism. This will help local leaders in destinations to analyse and assess the impact of tourism in their regions based on indicators for the economic, social and environmental aspects affected. The focus will lie on big data, new technologies, artifi-cial intelligence and high-performance computing. This needs to be conditioned for European tourist destinations. In the context of this service contract local, national and EU policies will be advised in managing and measuring carry-ing capacity in tourist destinations.
The project will provide a carrying capacity methodology for tourism and should focus on questions like the ones listed under specific objectives:
2 https://www.wttc.org/-/media/files/reports/policy-research/coping-with-success---managing-overcrowding-in-tourism-destinations-
2017.pdf 3 https://ec.europa.eu/docsroom/documents/21749
4 https://www.espon.eu/programme/projects/espon-2006/studies-and-scientific-support-projects/study-spatially-relevant
5 https://www.espon.eu/participate/espon-2013-calls/procurements/previous-procurements/espon-tools-2011-2014-%E2%80%93-feasibility
6 https://www.espon.eu/geographical-specifities

Carrying capacity methodology for tourism
Technical Offer 9
Conceptual aspects of carrying capacity
How to approach carrying capacities considering the growing number of tourists in many destinations?
What conceptual framework, methodology and assessment tools can be developed and/or applied for measuring carrying capacity and tourist flows?
Data collection, analysis and visualisation
What are the different data sources and what related data sets/indicators can be collected (covering the three pillars of sustainability – economic, environmental and social) and used to measure and compare car-rying capacities in tourism?
What are the possibilities and methodologies for using alternative data sources and new technologies (such as big data analysis, analytical intelligence, cloud computing, sensors) for measuring carrying capacity (in-cluding tourist flows)?
How can tourist flow in relation to carrying capacity be visualised interactively using alternative data sources?
Policy recommendations
What are the main policy recommendations in the study area and in the case studies that can be given to practitioners to measure the carrying tourist capacity of their territories and what are the main challenges?
Overall Outcome
The main outcome is a methodology for measuring tourist carrying capacity in specific destinations. The methodol-ogy will be tested by applying a case-based methodology from which generalized recommendations will be de-ducted. The use of statistical and structural data will be complemented and enriched by big data stemming from a broad range of different sources and visualised interactively in order to detect hotspots of overcrowded areas within specific destinations as well as representative destination types. The visualisation will help to raise awareness and to guide stakeholders to develop pro-active policies and strategies according to their specific needs.
Stakeholder specific results
The objective of the project is to develop a specific and useful tool including a case-specific methodology for guiding the involved stakeholders – The Ministry of Economic Development and Technology in Slovenia, the Slovenian mu-nicipalities Bled, Brezice and Divaca, INFORMEST (Italy), Association of Cities of the Republic of Croatia – to better target policies for measuring carrying capacity and for managing sustainable tourism. The outcomes of the targeted analysis will be presented by these stakeholders and introduced to UNWTO, the European Committee of Regions, NALAS and several events in the region and Europe.
Stakeholder specific outcome
Evidence of carrying capacity impacts in the case study areas and guiding recommendations for overcoming risks and challenges. A methodology to tackle the problem of tourism guidance by assessing the carrying capacity and identifying adequate answers.
Overview of existing methodologies for measuring carrying capacity of tourist destinations
The consortium will provide an overview of existing methodologies in order to critically reflect upon the already existing knowledge and to detect weaknesses and missing links. The purpose is to take into account and build upon relevant evidence and to identify alternative ways to analyse and visualise specific territorial vulnerabilities.
Methodology related outcome
Overview of existing methodologies and critical assessment with respect to their applicability and usefulness in the context of the cases at hand (strengths and weaknesses).
Strategic guidelines for the involved stakeholders
The involved stakeholders are an important target group for gaining knowledge and evidence of the methodology to be developed in the course of this service contract. This includes knowledge about how to detect challenges and risks, possible alternative and complementing data retrieving processes as well as a practical application of the

Carrying capacity methodology for tourism
10 Technical Offer
methodology. Stakeholders will be actively involved in the process in order to guarantee a fruitful exchange of knowledge and expertise (Feedback-loop).
Outcome
Strategic guidelines for tailor-made and place-based recommendations and management recommendations
The fact that all four cases are representing four different types of tourist destinations (Alpine, Spa/thermal, Medi-terranean, Urban) safeguards that the overall methodology developed will be applicable in this wide range of types of tourist destinations and allows for transferability to similar types of destinations as well as more generally regions across Europe. The case study areas will receive detailed case study reports which will help them to develop and implement efficient strategies for their future tourist capacity. The guidelines will enable destinations to start a self-assessment process and to decide for the best suitable future policy according to their needs (governance process).

Carrying capacity methodology for tourism
Technical Offer 11
1.3 General Approach
Following the intended objectives of this project the working steps constitute a clear flow towards the overall goal to create a methodology for tourist destinations to assess the carrying capacity and to find appropriate policy an-swers on this basis. Consequently, the four tasks foreseen are flowing logically in the following order:
Figure 1: The overall order and flow of the project tasks
Source: Consortium 2019
The starting point and entry into the project will be a thor-ough literature review of existing approaches and methods to asses tourism carrying capacity. This includes a review of tourism related concepts and other concepts in territorial impact assessment (e.g. vulnerability) which safeguards an interpretation of carrying capacity along the three dimen-sions of sustainability (social, environmental, economic). Thus, it will help finding new approaches more capable and practical to assess these problems.
Then these findings shall be put on a more general basis and flow into a methodology, which will still be applicable to concrete cases but at the same time be designed in a way to allow transferability to other regions. The applica-tion and adaptation to the concrete four cases requests an assessment and dialogue as of what the actual challenges and application contexts for tourism carrying capacity are (territorial specifics) and will finally lead to aligning the method to the cases. This includes data collection and se-lection of big data and visualisation techniques for the cases at hand.
Next step will be highly interactive in order to conduct tailor made case studies in each of the four case study regions. The interactions are needed for taking into account the specific needs of the regions, tackling the challenge of de-fining and dealing with different territories (demarcation of regions and related data issues), tackling the different spe-cifics of tourism carrying capacity in the different territorial settings and types of regions (urban vs. rural, city tourism vs. nature tourism, concentration effects vs. guidance and control effects). Finally, the findings will be first fed back to the regions themselves thus allowing for a self-learning loop and reaping the benefits for these tailor-made approaches.
The results will then be taken and processed so that gener-alisable lessons will lead to a general methodology for the assessment of tourist carrying capacity and the subsequent policy responses to be given on the different territorial scales (regional, national, EU).
Existingmethodologies&critical review
AdaptedMethodology on tourism carrying
capacity fordestinations
Case studyspecification
Territorial Evidence – tailor
made for the casestudies (big data ,
visualisation)
Case studies
Strategic guidelines and
generallyapplicable
methods for EU tourist regions
Carrying capacity methodology for tourism
12 Technical Offer
2. Approaches and methods
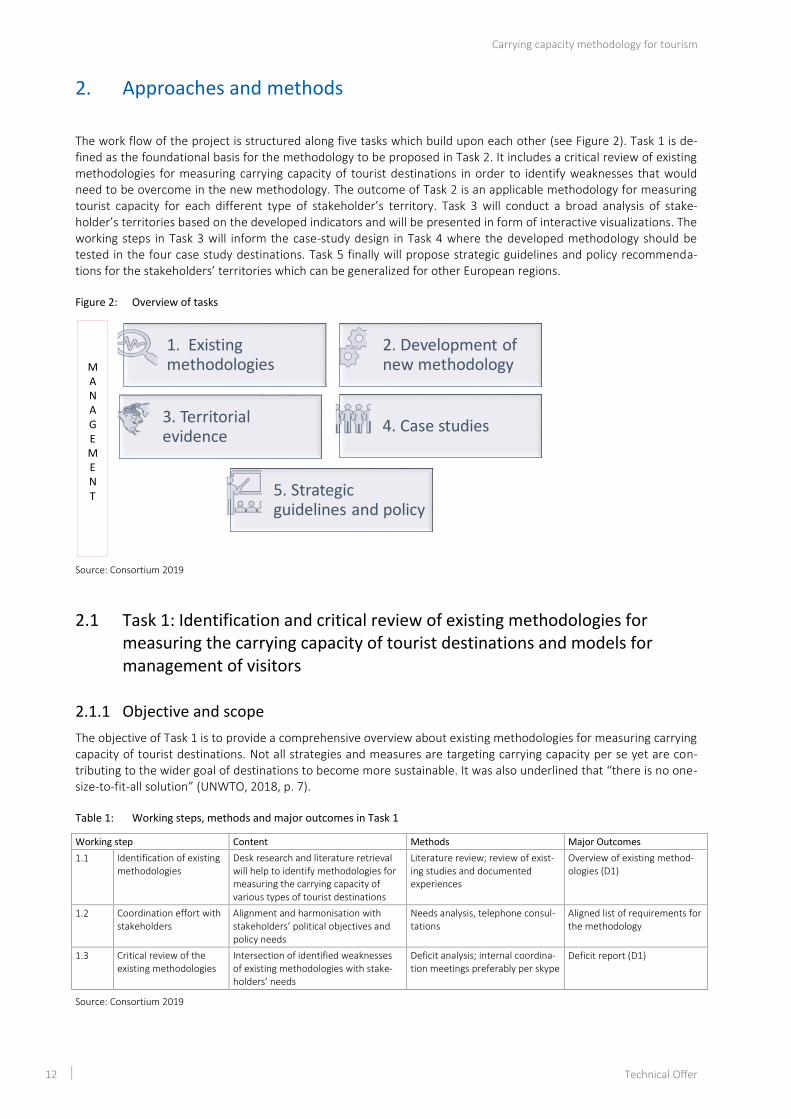
The work flow of the project is structured along five tasks which build upon each other (see Figure 2). Task 1 is de-fined as the foundational basis for the methodology to be proposed in Task 2. It includes a critical review of existing methodologies for measuring carrying capacity of tourist destinations in order to identify weaknesses that would need to be overcome in the new methodology. The outcome of Task 2 is an applicable methodology for measuring tourist capacity for each different type of stakeholder’s territory. Task 3 will conduct a broad analysis of stake-holder’s territories based on the developed indicators and will be presented in form of interactive visualizations. The working steps in Task 3 will inform the case-study design in Task 4 where the developed methodology should be tested in the four case study destinations. Task 5 finally will propose strategic guidelines and policy recommenda-tions for the stakeholders’ territories which can be generalized for other European regions.
Figure 2: Overview of tasks
Source: Consortium 2019
2.1 Task 1: Identification and critical review of existing methodologies for measuring the carrying capacity of tourist destinations and models for management of visitors
2.1.1 Objective and scope
The objective of Task 1 is to provide a comprehensive overview about existing methodologies for measuring carrying capacity of tourist destinations. Not all strategies and measures are targeting carrying capacity per se yet are con-tributing to the wider goal of destinations to become more sustainable. It was also underlined that “there is no one-size-to-fit-all solution” (UNWTO, 2018, p. 7).
Table 1: Working steps, methods and major outcomes in Task 1
Working step Content Methods Major Outcomes
1.1 Identification of existing methodologies
Desk research and literature retrieval will help to identify methodologies for measuring the carrying capacity of various types of tourist destinations
Literature review; review of exist-ing studies and documented experiences
Overview of existing method-ologies (D1)
1.2 Coordination effort with stakeholders
Alignment and harmonisation with stakeholders’ political objectives and policy needs
Needs analysis, telephone consul-tations
Aligned list of requirements for the methodology
1.3 Critical review of the existing methodologies
Intersection of identified weaknesses of existing methodologies with stake-holders’ needs
Deficit analysis; internal coordina-tion meetings preferably per skype
Deficit report (D1)
Source: Consortium 2019
1. Existing methodologies
2. Development of new methodology
3. Territorial evidence
4. Case studies
5. Strategic guidelines and policy
MANAGEMENT

Carrying capacity methodology for tourism
Technical Offer 13
2.1.2 Methodological approach
2.1.2.1 Working step 1.1: Identification of existing methodologies
Section 1 describes some of the most important existing methodologies for measuring carrying capacity. Taking above into account, the first working step is to look into various initiatives concerning the assessment of sustainabil-ity (in general) and of carrying capacity (in particular) at the different types of tourist destinations. This is done in order to acquire a full overview of the existing methodologies, which will consequently point towards the strengths and weaknesses of each approach in measuring sustainability (to be addressed in working step 1.3). In the working step 1.1, a broader approach (i.e., assessment of sustainability, overtourism solutions, visitor management models, etc.) is preferred over a narrow one (i.e., looking only at the carrying capacity-related studies) as the purpose is to capture as many topic-relevant methodologies as possible and since there is evidence that there is no one superior methodology to measure the sustainability (i.e., carrying capacity) of tourist destinations.
The overview will be designed to allow for a first strengths and weaknesses comparison along for example the criti-cal aspects of tourism and sustainability dimensions (social, environmental, and economic), the management prac-tices to overcome overcrowding at tourism destinations, impact analysis and policy response strategies to overtour-ism. Since many existing methodologies are tailored for destinations (e.g. city destinations, etc.) the overview will put particular emphasis on highlighting their potential for being applied to different scales of destinations.
Apart from specific methodologies developed for the tourism sector, the consortium will conduct a broader assess-ment of methodological inputs. Carrying capacity for example can be linked to the vulnerability concept. The latter can be used as surrogate for carrying capacity and serves as practicable and well-established approach to territorial analysis. The vulnerability of a region being defined as a product of the exposure (i.e. the inflow of tourists) and the sensitivity (i.e. the regions susceptibility to influence) can be used in the indicator development process. Indicators measuring the carrying capacity in this case have to be able to accurately depict the sensitivity of a region. The broader concept is well established in fields such as ecology and especially climate change research.
Taking above into account, it can be concluded that there is no one solution that fits all destinations and that vari-ous initiatives should be considered. The current proposal has attempted to provide a glimpse into such initiatives, while highlighting the link between carrying capacity, visitor flows, proposed overtourism solutions, and various visitor management models. Thus, the major outcome of working step 1.1 is the detailed overview of existing meth-odologies for measuring the carrying capacity of various types of tourist destinations (D1).
2.1.2.2 Working step 1.2: Coordination effort with stakeholders
With the provided overview of existing methodologies an alignment and harmonisation with stakeholders’ political objectives and policy needs is planned. Working step 1.2 will start with desk research aiming at retrieving informa-tion and data from ongoing research such as the project “Guidelines for destination management based on carrying capacity and tourism flow models”. This project will feed in tailored information and existing knowledge on carrying capacity in the defined Slovenian tourist destinations. The project’s model for measuring carrying capacity and visi-tor management provides an excellent basis for the planned coordination effort. In addition, further desk research and telephone consultations with stakeholders in the case study areas (Task 4) will help to integrate specific needs. In order to organise this needs elicitation a list of identified (in working step 1.1) core areas and indicators will be compiled and used for structured telephone interviews (concept-based interviews). Before interviewing the stake-holders, the consortium will send out those elements of the overview of existing methodologies (list of identified core areas and indicators) which will be considered as being crucial for the stakeholders’ needs. This pre-step helps to structure the interviews along the relevant areas needed for developing the methodology in Task 2.
This in conjunction with the elaborated overview of existing methodologies (working step 1.1) will help to incorpo-rate specific political objectives and needs. The overall goal of working step 1.2 is the compilation of an aligned list of requirements for the methodology (D1) to be proposed in task 2.
2.1.2.3 Working step 1.3: Critical review of existing methodologies
After an elaborate overview of existing methodologies and a stakeholders’ needs analysis, a critical review of exist-ing methodologies will be conducted in working step 1.3. Such a critical review will identify strengths and weak-nesses along certain carrying capacity and vulnerability dimensions. This will help to detect deficits for a destination-specific application and lead to a deficit report (D1), which will help to contribute to better decisions of local au-thorities for sustainable tourism development.
Carrying capacity methodology for tourism
14 Technical Offer
It can happen that a proposed approach is not operational in spite of its comprehensiveness. On the one hand, data needed for the assessment may not be available; same goes for the resources needed for such endeavour (e.g., time, human resources). On the other hand, it may be the case that tens of (not necessarily relevant/unweighted) indicators are required, which may discourage destinations to initiate such a comprehensive assessment. It can also be the case that the data are available for one time period only. Such situation does not allow a continuous monitor-ing and improvement, which after all, should be an end goal of any type of assessment. Therefore, working step 1.3 is crucial: the overall outcome being the identification of strengths and weaknesses of various approaches, which will steer the development of the methodology to be developed in Task 2.
2.1.3 Partners involved
Table 2: Partners involved in Task 1
Partner Position Expertise and justification Main responsibility
Modul University Vienna (MU) Task Leader Extensive expertise on carrying capacity in tourism and destination man-agement
WS 1.1, 1.2, 1.3
ÖIR Task Partner Extensive expertise on carrying capacity and vulnerability WS 1.3
SEB LU Task Partner Extensive expertise in over tourism and sustainable tourism; local experts WS 1.1, 1.2
Source: Consortium 2019
2.2 Task 2: Development of a methodology for measuring tourist capacity for each different type of stakeholders’ territory
2.2.1 Objective and scope
Based on the results of Task 1, the objective of the current task is to develop a methodology for measuring tourist carrying capacity for each type of the stakeholders’ territory, which would be possible to replicate on a wider scale beyond Slovenia, Croatia and Italy. The methodology will be displayed in a handbook, which serves as the analytical basis for the planned application in the four case study areas in Task 4. Task 2 will provide the conceptual frame-work for measuring tourist capacity for the different types of destinations and serves as the basic element for Task 3 where a Web based dashboard for big data analysis and visualisation will be applied as well as Task 4 where the methodology will be applied in the four case study areas. The overall goal of Task 2 is therefore to provide a solid and widely applicable methodology.
Table 3: Working steps, methods and major outcomes in Task 2
Working step Content Methods Major Outcomes
2.1 Measuring sustainability in tourist destinations
Enrichment of sustainability meas-urement indicators based on the deficit analysis in Task 1
Literature review; review of exist-ing studies and documented experiences
Matrix of sustainability indicators relevant for measuring tourist capacity for each different type of stakeholders’ territory
2.2 Development of the methodology
Develop the methodology based on the specificities in the case study area
Step-by-step process which allows adaptations (feedback loops) based on stakeholders’ needs
Analytical framework for the methodology and a methodology handbook (D2)
2.3 Preparation of a consoli-dated methodology handbook
Comprise handbook and check for handbook quality
Wrapping up of results and depict-ing the process by example
Checking for clarity and compre-hensiveness (internal coordination meetings preferably via skype)
Consolidated methodology hand-book (D2)
2.4 Revision of the method-ology handbook
Revise the handbook based on the comments recorded from the case studies (Task 4)
Integrate list of questions and answers and clarifications from the backstopping
Revised handbook, checked to be clear and concise by the experi-ence from the 4 cases (D2)
Source: Consortium 2019

Carrying capacity methodology for tourism
Technical Offer 15
2.2.2 Methodological approach
2.2.2.1 Working step 2.1: Measuring carrying capacity in tourist destinations
Based on the results of the deficit analysis in Task 1, working step 2.1 will focus on existing measurement indicators in the literature and will review relevant studies and documented experiences and combine it into a matrix of carry-ing capacity indicators relevant for measuring tourist capacity for each different type of stakeholders’ territory.
Starting point is to look into the indicators that can be used for measuring sustainability of tourist destinations. Ex-isting knowledge in the consortium (i.e. comprehensive list of indicators in Önder, Wöber and Zekan 2017) about potential objectives and indicators for destinations and their policymakers will be used as the basis for the develop-ment of the methodology and modified to fit the needs of the individual territories in the case study area. In addi-tion, other relevant sources will be used to compile a matrix of sustainability indicators relevant for measuring tour-ist capacity for each different type of stakeholders’ territory
The plan is to use all objectives and indicators that are classified as economic, social, or environmental. The pro-posed objectives range from maximizing competitiveness and growth to maximizing satisfaction of employees and residents with tourism.
Examples
For instance, a destination’s objective may be to minimize congestion and intrusion, which can be measured by the tourism density rate (e.g. bednights/population) and percentage of same day visitors to total number of visitors to the city, both of which are perfect examples of the indicators that assess carrying capacity from the environmental pillar. This type of measures is certainly of interest to destinations like Bled that welcome many same day visi-tors/excursionists. On the other hand, if destinations are aiming at maximizing growth, there is a pure economic perspective, which can be measured by bednights, arrivals, tourism revenues, and value added (absolute values or market share).
One further possibility to assess carrying capacity from an environmental pillar point of view is measuring the CO2 emissions of tourists, in particular when traveling to and from a destination. For 62 major European city destinations, there already exists a ready-to-use possibility to assess the travel-related CO2 emissions of European city tourism by source market, travel distance, and transportation mode (Gunter and Wöber, 2019). The approximation of CO2 emis-sions should help tourism planners and local politicians in the four case study areas and beyond to rethink their tour-ism development strategies and enable better informed discussions on the environmental impact of traveling and on assessing their environmental carrying capacity.
Going beyond CO2 emissions, one should look into measures such as density and seasonality into more detail, which arguably, pose a problem for all four case studies. These indicators would certainly need to be integrated in the final model on assessing carrying capacity. For instance, Önder, Wöber and Zekan (2017) applied data envelopment analy-sis on a set of indicators that incorporate all dimensions of sustainability on a sample of 27 European cities with a purpose of inspecting their sustainability efforts. Although such analytical approach cannot be undertaken in the current project due to a small sample size (four case studies), alternative benchmarking approaches can be taken into account that could group same type of destinations into clusters (e.g., Bled benchmarked against its competitors; same for the other case study localities).
2.2.2.2 Working step 2.2: Development of the methodology
While working step 2.1 is defined as a tailored indicator selection process, working step 2.2 is dedicated to the de-velopment of the methodology based on the specificities in the case study area. It is conceptualized as a step-by-step process which allows adaptations (feedback loops) based on stakeholders’ needs and will lead to an analytical framework for the methodology and a methodology handbook (D2).
The methodology needs to be designed in a way that it can be easily adapted for the envisaged four case studies (see Task 4). This implies a concise definition of data needed (in conjunction with task 3) for the case study analysis in Task 4 and needs to be consolidated with the compiled matrix of indicators in working step 2.1. While tourist flow data are not available from for example TourMIS7 at this granular level (small municipalities and single attractions),
7 see http://www.tourmis.info/index_e.html

Carrying capacity methodology for tourism
16 Technical Offer
the different big data measures suggested in Task 3 to measure tourist flows can be consulted not only at the an-nual but also at higher frequencies. Since the four case studies differ in terms of their characteristics and the type of tourists visiting (Nova Gorica: city tourism in a cross-border environment; Bled: Alpine landscape and a lot of excur-sionists; Brežice: thermal springs and predominantly spa tourism; Divača: Karst and sun and beach tourism), differ-ent results are expected for their individual environmental carrying capacity levels and therefore also different pol-icy measures will need to be recommended (e.g., how the carbon footprint of visitors could be minimized in the case of Divača). However, the “beauty” of the proposed methodology is that it is universally applicable.
In summary, the proposed approach is a bottom-up approach, which needs to foresee feedback-loop circles at vari-ous stages of the project. In other words, needs analysis is to be done at the individual case study areas, which calls upon the involvement of their stakeholders at an early stage (working step 1.2). Upon identification of the objec-tives they have for their destinations (structured interviews in working step 1.2 and additional contacts if needed in working step 2.2), a set of indicators for measuring carrying capacity for the specific type of locality will be proposed (e.g., CO2 emissions, density, seasonality, etc.). The set of indicators for each destination will differ according to their exposure overtourism (needs) and their pre-set policy goals. The idea of the project is not to come up with the new indicators, but rather to: (1) synergize existing initiatives, (2) utilize opportunities provided by the new media technologies, and (3) propose an optimal set of indicators for each case study all of which will be part of the analyti-cal framework (D2). This type of approach will allow for a comparison between the four case destinations and desti-nations that are similar to them and will be integrated in one methodology handbook (D2). Some (i.e., core) indica-tors will certainly overlap between the case studies as they are important for the assessment of carrying capacity irrespective of a type of tourist destination. Equally important, one should limit the number to a handful of indica-tors, which can be collected over time so that carrying capacity could be monitored on a continuous basis. All these considerations would need to feed into the methodology handbook (D2).
2.2.2.3 Working step 2.3: Preparation of a consolidated methodology handbook
To guarantee for a concise and comprehensible result the methodology developed in working step 2.2 has to be presented in a reviewed handbook for measuring carrying capacity. The handbook will act as a standalone guidance without any needs for further explanation. This is an important feature to enable other experts or persons who want to conduct the assessment on their own to do so later on. A concrete step-by-step guide and recommenda-tions will be produced as understandable for all involved stakeholders. The handbook shall be available online as a printable version. To do so, a draft version of the handbook describing the step-by-step methodology is developed. It is used by the partners conducting the case studies in Task 4.
2.2.2.4 Working step 2.4: Revision of the methodology handbook
After the case studies have been conducted in Task 4, the handbook is revised (D2). This is based on the questions and clarifications that have been recorded in the course of conducting the case studies. This revision will contain clarifications and changes that have been found to be clear and unanimously accepted. All further issues and possi-ble solutions will be added as proposals on how to revise the methodology in accordance with the stakeholder as described in working step 4.4.
2.2.3 Partners involved
Table 4: Partners involved in Task 2
Partner Position Expertise and justification Main responsibility
Modul University Vienna (MU) Task Partner Extensive expertise on carrying capacity in tourism and destina-tion management
WS 2.1, WS 2.2, 2.3, 2.4
ÖIR Task Leader Extensive expertise on carrying capacity and vulnerability; experience with handbook compilation and revision
WS 2.1, WS 2.2, 2.3, 2.4
Source: Consortium 2019

Carrying capacity methodology for tourism
Technical Offer 17
2.3 Task 3: Territorial evidence, including interactive visualisation based on the methodology developed on the carrying capacity of territories and tourist flows
2.3.1 Objective and Scope
The New Media Technology department at MODUL University Vienna co-develops an innovative, state of the art Web based dashboard for big data analysis and visualisation, known as webLyzard. We will adapt and configure webLyzard for the interactive visualisations of and reporting on carrying capacity and tourist flows in the target regions. Therefore in this task, we collect data from heterogeneous sources, combine it for analysis and visualise the results in the interactive Web based dashboard. The objective is to allow stakeholders to understand the territorial evidence, combining an intuitive understanding of past carrying capacity and tourism flows with an innovative pre-diction tool for modelling potential future capacity and flows under current conditions. Significantly, this is a funda-mental necessity for the means to make informed strategic decisions and influence public policy, seeking to opti-mally balance the economic, environmental and social effects on the regions. The data pipeline – collection, analysis and visualisation – can be applied to data from other regions and cities in Europe, meaning the same territorial evidence and interactive visualisations used here could be applied elsewhere to the benefit of tourism stakeholders anywhere in Europe. The same tools can produce PDF reports of the data analyses and visualisations which are available through the Web based dashboard. Both the dashboard and reports will support the case studies of Task 4 and strategic guidelines/policy recommendations of Task 5.
Table 5: Working steps, methods and major outcomes in Task 3
Working step Content Methods Major Outcomes
3.1 Detailed description of different data sources and related data/indicators to measure carrying capacity and tourist flows
Retrieving and measuring geo-tagged tourist flow data from social media and the Web. This type of data will be overlaid with statistical and structural data.
Configuration of source-specific data collection tools (e.g. API queries, Web crawler) and internal mappings of source-specific data formats to a com-mon internal data model, using NLP, NER and Linked Open Data to extract and use shared identi-fiers for concepts.
A repository of integrated, annotated data from multiple sources conform to a shared metadata model, available to query and visualisation services.
3.2 Interactive visualization of tourist flows considering the three pillars of SD
Visualization of tourist flows and identification of overcrowding which will help to provide data-based insights into tourist capacities by region.
Analysis of data for measuring tourist flows at different geo-graphical levels, combination with carrying capacity to identify (social, economic, environ-mental) issues
Interactive visualisations that can be dynamically generated for any topic or combination of topics; including trend charts with predictions, WYSDOM metric, and geomaps.
3.3 Use of the existing visualisation and analytical platform we-bLyzard.
Provide a pre-configured dashboard for searching, brows-ing and extracting insights regarding tourist flows and carrying capacity in the regions.
Connect the data repository (3.1) and interactive visualiza-tions (3.2) with the webLyzard dashboard, define topics for the three pillars of sustainability.
Dashboard for tourist flows and carrying capacity, automated export of PDF reports for regions
3.4 Verification/Feedback loop with stakeholders
Dashboard with the interactive visualisations and the reports will be presented to stake-holders
Stakeholder workshop (Task 4) Interactive visualisations and summary reports support the case studies (Task 4) and future policy making (Task 5)
Source: Consortium 2019
2.3.2 Methodological approach
2.3.2.1 Working step 3.1: Detailed description of different data sources and related data/indicators to measure carrying capacity and tourist flows
Working step 3.1 involves setting up a data pipeline for collecting and combining the necessary data, annotating and analysing it to generate a measure of tourism flows and a comparison with carrying capacity measures. The gener-ated flows and comparisons can be interactively visualised in the webLyzard dashboard and PDF reports generated for the stakeholders. The innovation in our data processing offer lies in the ability to collect and combine various heterogeneous data sources at big data scale, also capturing the changes in values over time and the relationship of data values to spatial regions. MODUL University is well-positioned to ingest this wealth of available data as its pipe-
Carrying capacity methodology for tourism
18 Technical Offer
lines represent a fusion of multiple Semantic Web, Natural Language Processing, Machine Learning and Information Visualization methods like semantic modelling, sentiment analysis, entity extraction, classification, prediction and visualization engines, each a difficult problem on its own. Firstly, we can capture public opinion and discussion re-garding the tourism regions by collecting and analysing online news articles, fora (e.g. Reddit), social media (Insta-gram, Facebook, Twitter) and traveller reviews (Foursquare, TripAdvisor).
A NLP annotation pipeline that includes topic and concept extraction (Scharl et al., 2016) combined with a Word Sense Disambiguation/Named Entity Linking engine (Weichselbraun et al., 2018) enables the semantic annotation of these textual resources. This supports analysis of the data with respect to extracted keywords and entities (i.e. with what the regions are more/less often associated, what topics are the subject of public discussion and debate). By defining sets of terms related to the various aspects of carrying capacity – social, economic and environmental – we can analyse each aspect separately or together. In particular, our semantic analysis pipeline relies on a strong set of topic and concept extraction algorithms that is supported by a large repository of documents extracted from the web, as well as by a large internal Knowledge Base that aggregates entity data from Linked Open Data sources (Wikidata (Erxleben et al., 2014), DBpedia (Lehman et al., 2015)) and Geographical Open Data sources (GeoNames (Maltese et al, 2013) and OpenStreetMaps (Haklay et al., 2008)). Location references can be extended by the Linked Open Data to include information about territorial size, population and other characteristics which also may be used in comparison of carrying capacity or in browsing and visualisation by the dashboard. Geographical knowledge from the other Open Data sources includes meronomy (that a location is physically and/or administratively part of an-other) adjacency (that a location is located next to another, i.e. they share a border).
With regard to text mining, sentiment analysis can be used to understand how public opinion towards a region changes and opinion mining to determine why (e.g. due to overcrowding or environmental damage) (Kuščer and Mihalič, 2019). Sentiment Analysis engines (Cambria et al, 2017) rely on multiple small components that sit on the three layers of Syntax (e.g. POS tagging and dependency parsing), Semantics (e.g., named entities and relations) and Pragmatics (e.g., discourse analysis). MODUL has developed its own aspect-based sentiment analysis engine de-scribed in (Weichselbraun et al, 2017). The current iteration of the sentiment analysis engine goes beyond SOA and uses an internal Semantic Knowledge Base in order to highlight lexemes (e.g., synonyms, antonyms, hypernyms), aspects and associations.
Several statistical tourism resources that can be integrated into this pipeline include TourMIS (Wöber et al, 2000) or its Linked Data version TourMISLOD (Sabou et al, 2013), 3cixty city exploration (Troncy et al, 2017) and general pub-lic data about cities similar to those from the Open City Data Pipeline (Bischof et al, 2017), and the Semantic Trials Dataset (Monti, 2018), which allows destination specific data import. TourMIS and TourMISLOD resources have been jointly developed by the TourMIS consortium and MODUL University. Among the indicators included in the TourMIS KB: Arrivals, Capacity, Bednights and several others are uniquely positioned to help predict the tourist flow. The ability to create new statistical indicators by deriving or composing existing ones will also be added to this pipe-line in the near future, therefore enhancing its SOA status. Such operations would allow us to create some country-specific indicators that would show us how the target cities or regions from Slovenia may expect to deal with future tourism flows based on their carrying capacities.
Predictions of future changes in indicators may also be inferred using trend and seasonality models for time-series data such as ARIMA/SARIMA. We can also detect future time references in text documents and use this to connect tourism regions with future events that can affect their carrying capacity or influence the future tourism flows (e.g. a major sports event can be expected to bringer higher-than-usual incoming tourism). Future events are extracted from public Knowledge Graphs such as Wikidata. Predicting these future variations can be learnt from analysis of the past data connected with past events in combination with machine learning algorithms: we currently implement a similar approach for the prediction of TV audiences (Nixon et al., 2018).
2.3.2.2 Working step 3.2: Interactive visualization of tourist flows considering the three pillars of SD
The resulting data pipeline (Brasoveanu et al, 2017) can be used for visualizing statistical Linked Data indicators from multiple sources including TourMIS, WorldBank or Eurostat and is currently one of the few SOA engines available for such tasks. Changes in statistical indicators may be visualised over time (cf. Figure 3). By adding some of the visuali-zations described in (Scharl et al, 2016) and (Scharl et al, 2017), the resulting dashboard is able to integrate both fictional and real-world data that is needed for understanding tourist flows that are often dependent on seasonal events. Future values for indicators will also be included using the predictive analytics based on detection of under-lying trends and seasonality variations.

Carrying capacity methodology for tourism
Technical Offer 19
Figure 3: Displaying different statistical indicators from TourMIS, World Bank and Eurostat on the same chart
Source: MODUL University Vienna
WYSDOM (www.weblyzard.com/wysdom-success-metric/) is a metric and data visualisation used as a complemen-tary form for extracting more fine-grained positive or negative feeling than “one dimensional” sentiment analysis from the large textual collections ingested by our platform. Co-developed by MODUL University, WYSDOM captures the extent to which a target (e.g. a tourism region) is successfully associated with desirable associations (such as “clean”) and successfully not associated with undesirable associations (such as “polluted”), visualised through green (desirable) and red (undesirable) bars in a time-series chart (Figure 4). We will integrate the carrying capacity indica-tor generated according to the methodology described in Task 2 to the WYSDOM metric allowing intuitive compari-sons of tourist flow volume and carrying capacity in the dashboard, correlated to the public discussion about the region in the Web and social media (e.g. visitor mentions of overtourism or environmental degradation).
Figure 4: An example of the WYSDOM metric visualisation
Source: webLyzard technology GmbH
Figure 5: Geomap with flows between sources and targets displayed
Source: webLyzard technology GmbH

Carrying capacity methodology for tourism
20 Technical Offer
Since our end goal is to process, understand and predict tourist flows, a key component of our pipelines is repre-sented by the set of internal d3.js libraries (Bostock et al, 2011) that support geomaps, complex metrics like WYS-DOM or graph analytics. Since interactivity and explainability are important in order to analyse large collections of text using modern NLP models, the new visualization pipelines also support a wide array of operators for data alignment, entities and sentiment extraction (Kucher et al, 2017), space-time operations (Bach et al, 2014), dynamic graph operations (Beck et al, 2017) or the predictive visual analytics (Lu et al, 2017). The data alignment operators are similar to the ontology alignment operators described in (Ivanova et al, 2017) and are needed in order to align external data sets with our internal data formats. The time-space visualization operators (Bach et al, 2014) include extraction, flattening, filling, geometry transformations and content transformation. The interactive visualizations are typically designed around the idea of localization and upon the philosophy that change is the only constant. The predictive interaction (Heer et al, 2015) elements needed in the NLP visualization (e.g., autocomplete, predictive correction) will be designed in such a way as to merge seamlessly with the available data operators. In addition to this, the number of NLP visualizations will be increased due to the focus on text analytics: one of the planned com-ponents is adding threaded views (e.g., for visualizing unstructured content extracted from forums or blogs).
The large-scale geolocation visualization of tourism flows will improve upon the mobility patterns visualizations (Figure 5) presented in (Brasoveanu et al, 2017) and (Andrienko et al, 2017), whereas the graph visualizations will include extensions to support different clustering visualizations like graph embeddings (Goyal et al, 2017) and dif-ferent methods for representing the origin-destination flows (Guo et al, 2014). The extensions to geolocation visu-alizations are not designed in order to complicate current visualizations, but rather in order to make them more flexible and easier to adapt for various domains.
2.3.2.3 Working step 3.3: Use of the existing visualisation and analytical platform webLyzard
All of the collected data and its analyses (sentiment, WYSDOM extended with carrying capacity, extraction of tour-ism flows) can be interactively visualised in the webLyzard dashboard, according to pre-defined topics or searches. The dashboard will be pre-configured with topics for the three pillars of sustainability – social, economic and envi-ronmental (e.g. the analyses can be shown according to the individual pillars of sustainability or aggregated). Figure 6 shows the dashboard with a search for news media coverage related to migration in Jan-Feb 2019. Note the BOOKMARKS in the bottom left: these store the topics defined for a particular dashboard instance. In this case, for example, the data may be explored according to different cities or any combination of them (e.g. is public sentiment about migration higher in Berlin or Paris?). The graphical user interface synchronises interactive visual widgets to help explore query results along multiple context dimensions including temporal (trend charts), lexical (word tree), regional (geographic map) and semantic (tag cloud, keyword graph) aspects. One of the main goals of the dashboard is to be highly responsive with sub-second loading times while also managing to display complex visuali-zations with thousands of elements.
Figure 6: webLyzard visual analytics dashboard example
Source: webLyzard technology GmbH

Carrying capacity methodology for tourism
Technical Offer 21
2.3.2.4 Working Step 3.4: Verification/Feedback loop with stakeholders
Analytical reports can also be automatically generated in easily digestible online or print (e.g. PDF) formats. While not typically the focus of big data projects, flexible annotations are included in the generated graphics in order to support automated generation of reports. The generated reports are especially useful for consultants as they will help them prepare their use cases much better by including good abstracts and visualizations out-of-the-box. For the stakeholder workshops, we will provide training in the use of the pre-configured dashboard as well as generate automatically reports for the stakeholder regions. This will be based on a pre-selection of the data analysis and visu-alisations to be included, as tested and validated by usage of the dashboard in the case studies.
Big data analysis: state of the art
In order to measure tourist flows (i.e., tourists’ spatiotemporal behavior patterns) at different levels of geographic granularity (i.e., from countries and regions over municipalities to single attractions) at different temporal frequen-cies (i.e., from monthly and weekly over daily to intra-daily), various big data measures are particularly attractive. Li et al. (2018) differentiate the following three big-data categories that have been successfully employed in tourism research for various purposes: (1) user-generated content data (e.g., online reviews, social media interactions), (2) device data (e.g., GPS data from smartphones), and (3) transaction data (e.g., online bookings, web searches). For measuring tourist flows in particular, categories (1) and (2) play a major role.
In more detail, category (1) big data cover data created by users such as online reviews on TripAdvisor (e.g., Fang et al., 2016; Li et al., 2018), Yelp (e.g., Nakayama and Wan, 2018, Xiang et al., 2017), Twitter (e.g., Bokunewicz and Shulman, 2017, Park et al., 2016), geotagged photos uploaded on social media or on photo-sharing platforms such as Flickr, Instagram, or Picasa (e.g., Gunter and Önder, 2019; Önder et al., 2016; Önder, 2017), or social media inter-actions on Facebook (e.g., Gunter et al., 2019; Ketter, 2016; Leung et al., 2017; Önder et al., 2019).
On the other hand, category (2) big data comprise data stemming from devices and includes GPS data from mobile phones, radio frequency identification and Wi-Fi data (Li et al., 2018). Published mainly analyze GPS data, mobile tracking, Bluetooth tracking, as well as social media messages and photos possessing geotags (Shoval and Ahas, 2016). The emergence of smartphones with integrated GPS technology has made research in this field considerably easier and more comprehensive compared to the necessity of distributing GPS trackers to tourists in the past. Re-search on the device big data category has included tourists’ spatiotemporal behavior patterns in the Summer Pal-ace in China (Huang and Wu, 2012), activity patterns of theme park visitors (Birenboim et al., 2013), as well as visitor movements in a zoo (Birenboim et al., 2015).
For these reasons, the use of geotagged data including a time stamp (e.g., geotagged photos from Instagram, online reviews from TripAdvisor, and/or check-in data from Foursquare) is recommended to measure tourist flows for the four envisaged case studies and later on also for other European municipalities and regions in general. We have budgeted a small sum to cover access to this data via API (as all platforms only provide limited or no free access, certainly not enough to collect enough data for an analysis of value to the stakeholders). All of these sources will be connected to our data pipeline.
2.3.3 Partners involved
Table 6: Partners involved in Task 3
Partner Position Expertise and justification Main responsibility
Modul University Vienna (MU) Task Leader Big data analysis and visualisation, Dashboard owner WS 3.1, WS 3.2, WS 3.3, WS 3.4
ÖIR Task Partner GeoData processing WS 3.1, WS 3.4
SEB LU Task Partner Big data analysis and tourist flow data analysis WS 3.1, WS 3.2, WS 3.4
Source: Consortium 2019
2.4 Task 4: Cases studies and interactive visualisation of tourist flows
2.4.1 Objective and Scope
The developed methodology (Tasks 2 and 3) for measuring carrying capacity in tourism will be applied in the four case study regions, the regions Bled, Brežice, Divača, and the cross-border city area Nova Gorica/Gorizia. The devel-oped methodology is flexible and designed in a way that it allows specific adaptations for the involved stakeholder

Carrying capacity methodology for tourism
22 Technical Offer
territories. The different characteristics and types of touristic activities in the single destinations necessitates an individual selection of criteria and the case specific analysis will lead to different individual environmental and hu-man carrying capacity levels.
The four case studies will be maintained and conducted by the Slovenian case study team in order to safeguard local knowledge and language skills as well as close local network contacts but will be backed-up by the methodological team and team members with specific linguistic (Croatian, Italian) and cultural background. The case study team is experienced in field work and brings in destination specific expertise and competences related to e.g. the Green Scheme of Slovene tourism, political dimensions of tourism in the case study territories. The experts will be guided by the methodology handbook to select and calculate indicators as well as available data and will be guided by the methodological team.
Table 7: Working steps, methods and major outcomes in Task 4
Working step Content Methods Major Outcomes
4.1 Case study design In-depth case studies: Bled, Brežice, Divača, Nova Gorica/Gorizia
Methodology handbook and face-to-face consultations with case study stakeholders
Detailed case study analysis grids
4.2 Case study data collec-tion
Tailored data collection for each case study which includes stake-holders’ needs
Data collection, field work (inter-views, informed meetings, tele-phone consultation)
Four full sets of case study data consisting of statistical, structural and big data
4.3 Case study analysis Detailed analysis of local data sources
Data analysis and visualisation and feedback consultations
Four detailed case study reports with tailored interactive visualisa-tion maps and graphs (D3)
4.4 Reflecting on the meth-odology with feedback Workshop
Feedback from stakeholders and preparation for policy recommen-dations
Workshop Meta level results
Source: Consortium 2019
2.4.2 Methodological approach
2.4.2.1 Working step 4.1: Case study design
The task leader will plan and coordinate the case study design and will prepare detailed case study analysis grids. The methodology handbook (Task 2) will help the experts to apply the proposed methodology and to communicate the specific data and information needs to the stakeholders (face-to-face stakeholder consultations). The communi-cation and information exchange process with the local stakeholders is an essential success factor for measuring destination specific environmental and human carrying capacity.
2.4.2.2 Working step 4.2: Case study data collection
The case study data collection process will be accompanied by the specific case study analysis grids and will take place simultaneously. The case study grid will help to include the stakeholders’ needs. The case study team will therefore apply a mix of methods including interviews, informed meetings and telephone consultation depending on the availability of the set of stakeholders. This working step is aiming at (a) collecting and harmonising tailored statistical and structural data (including national and regional statistics, Green scheme data, ETIS data, etc.) and (b) collecting information about visitation and overcrowding. The outcome of this step is to provide four full sets of case study data consisting of statistical, structural and big data.
2.4.2.3 Working step 4.3: Case study analysis
The four full sets of case study data will help the experts to analyse each case study individually along the proposed methodology. This working step includes again a close stakeholder approach where the case study team will en-courage to incorporate the direct feedback of stakeholders (feedback consultations) into the ongoing analysis in order to prepare detailed case study reports with tailored interactive visualisation maps and graphs (D3). The idea is to apply a step-by-step approach for the case study analysis phase where the case study team and the methodologi-cal experts are providing input on the basis of the collected data (working step 4.2) which will then be reflected by feedback loops from the stakeholders and again in another step adapted by the case study team.
The following visualizations exemplify first ideas how additional tourist related information will be presented for the three requested municipalities Bled, Brežice and Divača, as well as the study region Nova Gorica. They can analo-

Carrying capacity methodology for tourism
Technical Offer 23
gously be applied to any other study area and/or regional data source grasped in the course of the project as well. OpenStreetMap (OSM) data is frequently used when it comes to geographical information system (GIS) related solutions (e.g. navigation). The big advantage is the worldwide and free availability as it is offered under the open database license (ODbL) by the OpenStreetMap community. Several different useful geographical information is offered in layered GIS format as spatial polygon, line and point information. All three can be used to describe the regional situation on sight. Generalization of ideas is allowed as data is available for all 28 EU member states.
Four Examples each for a different case study area
Figure 7 below shows the surrounding of Bled including Lake Bled (Blejsko Jezero) in the center of the plot. Tourism related infrastructure points-of-interest (POIs) are visualized as green dots to quickly detect tourist related hotspots.
Figure 7: Heat map for tourist infrastructure hotspot identification
Source: Weismayer 2019
Figure 8 shows the transportation infrastructure around Brežice. A clear overview is of utmost importance to be able to provide the necessary connections between relevant tourist hotspots and to identify problematic areas with a lack of transportation facilities as soon as connected with tourist flow data. Also for observing tourist paths this is of crucial information. The following public transportation information is highlighted: streets (grey), railways (black), larger railway stations of mainline rail services (black) and smaller local railway stations or subway stations (dark-grey), waterways (blue) and ferry terminals (darkblue), and bus stops or large bus stations with multiple platforms (red). Geo locations of tram stations, airports, helipads, cable cars, lifts, or traffic related infrastructure like gas sta-tions or car parks are also available if present. From a more detailed perspective one could bring in information like the different types of roads to direct tourists with private cars through the city, taking into consideration informa-tion about the street coverage due to their different conditions (freeway, important/national/regional or local roads, paths unsuitable for cars, pedestrian only streets, oneway roads, or the speed limit).
Figure 9 presents a Google Earth overlay of touristic POIs to provide a different and more detailed information about touristic hotspots. This might be of special interest for smaller tourist destinations like Divača as density plots do not offer too much information about touristic hotspots like the UNESCO world heritage Škocjanske jame caves close to Divača. On the left side one layer is listed, namely tourist related POIs. However, any other kind of layers, be it spatial points, lines, or polygons can be incorporated depending on the matter of interest.
GoogleEarth further allows for the visualization of spatio-temporal information using the slide at the top left corner of Figure 10. To exemplify such interactive heatmaps, the maximum temperature (http://gis.arso.gov.si/wfs_web/ faces/WFSLayerExportAttSingle.jspx) around Nova Gorica is visualized. This logic can be applied to any kind of tourist related data available over time.

Carrying capacity methodology for tourism
24 Technical Offer
Figure 8: Territorial transportation maps
Source: Weismayer 2019
Figure 9: Territorial transportation maps
Source: Weismayer 2019
Figure 10: Spatio-temporal heat maps
Source: Weismayer 2019

Carrying capacity methodology for tourism
Technical Offer 25
2.4.2.4 Working Step 4.4: Conclusion Workshop
The final step in Task 4 focuses on feedback and policy recommendations and is aiming at compiling meta level results in order to guarantee a comparative and generalized analysis result. The workshop would need to be de-signed in a way that both experts and stakeholders can work commonly on a strength and weakness analysis of the applied methodology. Such a reflection effort helps (a) improving the methodology and (b) answering the following questions:
What are the main challenges and potential opportunities for collecting, processing and analysing carrying capacity related data?
What can be learned from individual applications?
How can the methodology be used for other applications?
The reflections on the methodology will feed into the conclusions of Task 5.
2.4.3 Partners involved
Table 8: Partners involved in Task 4
Partner Position Expertise and justification Main responsibility
Modul University Vienna (MU) Task Partner Extensive expertise on carrying capacity in tourism and destination management
WS 4.1, 4.2, 4.3, 4.4
SEB LU Task Leader Extensive expertise on carrying capacity in tourism and destination management, Regional experts
WS 4.1, 4.2, 4.3, 4.4
alohas Extensive expertise on carrying capacity in tourism and destination management, Regional experts
WS 4.1, 4.2, 4.3, 4.4
Source: Consortium 2019
2.5 Task 5: Preparation of strategic guidelines and policy recommendations
2.5.1 Objective and scope
Task 5 represents the methodological synopsis of tasks 1 through 4, aiming at both providing policy recommenda-tions for the stakeholders involved as well ensuring the possibility to readily apply the methodology in other territo-ries. The subtasks are thus twofold:
Distil recommendations out of the results of applying the methodology in the stakeholders’ territories. These recommendations will be tailored to the stakeholders’ knowledge needs as specified and agreed on during the kick-off meeting and over the course of the project. Furthermore, wherever possible generaliz-able recommendations for wider use will be included
Consolidate the experience gathered through the case studies to provide future users with concrete guide-lines in the application of the methodology.
Table 9: Working steps, methods and major outcomes in Task 5
Working step Content Methods Major Outcomes
5.1 Generalization of the meth-odology
Detailed guidance on how to apply the methodology
Production of a practical user guidance
Guidelines for transferability of the meth-odology to other regions across Europe
5.2 Formulation of strategic guidelines and policy rec-ommendations
Guidance on how to put the results of applying the methodology to good use in the regions
Desk research, develop-ment of a guidance sheet for each case study
Recommendations for both project stake-holders as well as other regions
5.3 Workshop with stakeholders Preliminary recommendations and draft guidance documents will be discussed with stakeholders
Moderated workshop Interactive communication process with the workshop as key element in order to discuss and impart the findings of task 1-4
Source: Consortium 2019

Carrying capacity methodology for tourism
26 Technical Offer
2.5.2 Methodological approach
2.5.2.1 Working step 5.1: Generalization of the methodology, strategic guidelines to regions
Throughout the case studies, any input both by the case study team as well as by the stakeholders will be recorded. Firstly, this will be used for improving the methodology as described in working step 2.2. Secondly, this input will be revisited in task 5 for drafting general recommendations on applying the methodology. The synopsis of inputs out of the different case studies will be translated into a practical user guidance document for any tourism region that wants to apply the methodology to measure carrying capacity. The document will thus focus on the following core elements:
Context of the pillars of sustainable tourism
Description of the methodology and its steps
Specific guidance for the use of alternative data sources and new technologies
Guidance on how to translate results into policy recommendations
The result will be a strategic guidance document that contains the updated methodology readily available for tour-ism regions to apply including advice on complementing measures (e.g. specific types of data collection) and use of results.
2.5.2.2 Working step 5.2: Formulation of policy recommendations
Based on the guidance on translating study results into policy recommendations, working step 5.2 will in accordance with working step 4.4 after thorough analysis of the case studies provide a set of specific policy recommendations. For each case study region, a leaflet with a brief summary on the outcomes of the case study and recommendations deduced thereof will be prepared. These recommendations will be formulated with the generalizability in mind, thus enabling other similar regions to make use of the recommendations as well. The leaflets will be published as part of the final delivery of the project.
2.5.2.3 Working step 5.3: Workshop with stakeholders
Draft versions of the guidance’s shall be discussed with the project stakeholders as well as other key actors (such as the Committee of the Regions, national tourism associations etc.) who will be invited. In order to make workshops an effective tool for communication with stakeholders, it should be embedded in a communicative process which creates ownership and actively involves these relevant groups. The workshop will cover the following issues:
Presentation of the findings of each case study;
Interpretation of the project findings in the light of the needs and capacities of the tourism regions in Europe;
Elaboration and discussion of key messages to the policy level;
Feedback on the guidance documents;
Wrap up of the outcomes of the workshop.
The workshop will be organized at the final stage of the project, providing input for the final delivery. Participants will receive draft versions of any documents produced in WS 5.1 and 5.2 in order to adequately prepare for the workshop.
2.5.3 Partners involved
Table 10: Partners involved in Task 5
Partner Position Expertise and justification Main responsibility
Modul University Vienna (MU) Task Partner Development of the methodology and overall knowledge about Euro-pean destinations
WS 5.1, 5.2, 5.3
ÖIR Task Leader Extensive knowledge about European territorial development, translat-ing results into policy recommendations
WS 5.1, 5.2, 5.3
SEB LU Task Partner Case study and regional knowledge as well as overall knowledge about European destinations
WS 5.2, 5.3
alohas Task Partner Case study and regional knowledge as well as overall knowledge about European destinations
WS 5.3
Source: Consortium 2019

Carrying capacity methodology for tourism
Technical Offer 27
2.6 Main outcomes and results
The activities presented in in the five tasks are defined as interlinked and complementary steps with included feed-back mechanisms in order to guarantee the best possible and valuable outcomes of the project under the given objectives. The outcomes defined for the project have to be interpreted according to the logic of the targeted analysis task. Firstly, outcomes directly serve the involved stakeholders who are intensively integrated into the pro-ject and they will receive tailor-made applications for their destinations, which will help to develop effective policy strategies along the destinations’ needs. Secondly, outcomes will provide guidance for transferability to other Euro-pean tourism regions and will therefore contribute to an overall European policy development process. The out-comes presented in Figure 11 need to be understood as interlinked results.
Figure 11: Outcomes of the project
Source: Consortium 2019
2.6.1 Methodology for measuring carrying capacity
2.6.1.1 Methodology handbook
The project will produce a concise methodology handbook, which will describe step-by-step how to measure carry-ing capacity and how to easily adapt the methodology for the envisaged four case studies and beyond. The hand-book shall be as clear as possible in order to be used by other experts. It could be available as print version and as online version. An example of a preliminary structure is presented in Table 11.
Table 11: Methodology handbook for measuring carrying capacity
Methodology handbook for measuring carrying capacity in tourist destinations
1. Purpose of measuring carrying capacity
2. Characteristics of carrying capacity relevant aspects
3. Preparation for performing a measurement
4. Methodology step-by-step
a. Identification of challenges and needs
b. Identification of relevant indicators (indicator matrix)
Overview of existing
methodologies
A critical review of existing methodologies will benefit the targeted stakeholders as well as other European regions.
Methodology for measuring
carrying capacity
The development of anew methodology willbenefit both the targetedstakeholder and otherEuropean regions
Guidance for transferability
to regions across Europe
Stakeholder workshop focusing on the case study findings and its applicability and transferability to European tourism regions.
Management recommendations for stakeholders

Carrying capacity methodology for tourism
28 Technical Offer
i. Classification of indicators along the sustainability dimensions
ii. Implications of indicator selection
c. Development of a tailor-made indicator matrix for specific case study area
i. Exposure level of the destination (needs)
ii. Pre-set policy goals
iii. Concise definition of data needed
d. Measurement of carrying capacity
i. Identification of data sources based on the defined indicator matrix
i. Identification of data gaps and finding alternative data sources in case of non-availability
ii. Identification of different types of interactive visualisation of tourist flows
iii. Identification of tourist related hotspots
5. Producing tourist related hotspots report
6. Communicating results to stakeholders and producing recommendations
7. Annexes
a. List of indicators and data sources
Source: Consortium 2019
2.6.2 Evidence for Stakeholders
The project will provide management recommendations for stakeholders how to manage destinations in order to reduce the risk of exceeding the carrying capacity of their destinations. This implies an intensive examination of existing policies and practices in the respective destinations as well as awareness of signs and signals indicating an overload of tourists in the respective regions (overtourism). The project is designed to safeguard that stakeholders are intensively integrated in all five tasks, however in different ways and at different levels of involvement:
Kick-off Meeting: Collection of needs
Task 1: Needs analysis requests telephone consultation with stakeholders in order to include specific needs
Task 2: Feedback-loop related to the methodology handbook
Task 3: Verification/feedback loop with stakeholders (Stakeholder workshop)
Task 4: Interviews, informed meetings, telephone consultation and stakeholder workshop
Task 5: moderated workshop including broader range of stakeholders

Carrying capacity methodology for tourism
Technical Offer 29
3. Organisation, milestones and management of the work
3.1 Project organisation
The project organisation follows a lean an efficient structure which is oriented along the 5 tasks. The organisational structure was designed according to the tight time schedule foreseen for the service contract where the conceptual, the methodological and the case study work needs to be conducted within the given timeframe. Quality of the de-liveries was the primary indicator for organising the project in the presented way.
Figure 12: Project organisation
Source: Consortium 2019
Within the research team the following roles are important:
The project manager is a senior expert with a track record in the field of European territorial studies with more than 20 years experience. He will be responsible for the smooth functioning of all components of the workload.
The project manager is supported by a deputy project manager who will substitute the project manager in case.
The core team experts include the project manager, the deputy project manager, task leader 1, 2, and 4. They are responsible for coordinating the methodology and case study related work and the stakeholder related communication and exchange.
The task leaders are responsible for organising the work within the task under their leadership as well as preparing the contributions to the deliverables. In addition, task leaders are linking their respective task’s contents with other tasks.
The methodological team combines expertise for Task 1, 2 and 3. They are responsible for developing the methodology, for big data analysis and visualisation.
The case study team experts execute the case studies (Task 4) according to the methodology developed in Task 2 and 3 and are the local experts.
Task 1 Task 2 Task 3 Task 4 Task 5
Methodology and Case Study Team
Project Manager: Bernd Schuh (ÖIR)Deputy Project Manager: Sabine Sedlacek (MU)
ESPON EGTC
STAKEHOLDER
LeaderB. Zekan(MU)
LeaderE. Dallhammer(ÖIR)
LeaderL. Nixon(MU)
LeaderT. Mihalič(SEB LU)
LeaderR. Gaugitsch(ÖIR)
U. Gunter (MU)B. Zekan (MU)
H. Gorny (ÖIR)R. Gaugitsch (ÖIR)
T. Mihalič (SEB LU)K. Kuščer (SEB LU)M. Novak (SEB LU)C. Weismayer (MU)
L. Nixon (MU)D. Dan (MU)
Core Team = Names in blue colour

Carrying capacity methodology for tourism
30 Technical Offer
3.1.1 Project team
The table below presents the team and their tasks/roles.
Table 12: Distribution of tasks
Name Role within the team Tasks Competences
Bernd Schuh (ÖIR) Project Manager, core team
Overall lead of the project, communication with ESPON and the lead stakeholder, elabo-rating the deliverables
European policy, Indicators, sustainability
Erich Dallhammer (ÖIR) Core team, Leader Task 2, methodological expert
Quality Control and Backstopping for project management, lead of Task 2
European policy, indicators
Roland Gaugitsch (ÖIR) Leader Task 5 Lead of Task 5 European policy, indicators, vulnerability
Helene Gorny (ÖIR) Case study and sustain-ability expert
Support Task 2 and 5 European policy, sustainability, vulnerabil-ity
Sabine Sedlacek (MU) Deputy Project Man-ager, core team, sus-tainability expert
Substitute of the project manager in case of his absence, coordination of methodology development and case study integration
Measuring sustainability, regional devel-opment, transition management, govern-ance
Ulrich Gunter (MU) Methodological expert Methodological development, big data analy-sis
Measuring carrying capacity, indicators, tourism economics
Bozana Zekan (MU) Core team, Leader Task 1, Methodological and case study expert
Literature analysis, methodological develop-ment, big data analysis
Measuring carrying capacity, indicators, tourism and destination management
Lyndon Nixon (MU) Leader Task 3, Meth-odological expert
Big data analysis, data visualization, Leading Task 3
Methodological expertise in the area of new media, big data
Christian Weismayer (MU) Methodological expert Statistical analysis, big data analysis, geodata analysis
Methodological expertise in the area of statistics, big data, geo-visualization, tour-ism management
Daniel Dan (MU) Methodological expert Big data analysis, data visualization, statistical analysis, machine learning
Methodological expertise in the area of new media, big data, machine learning, statistics
Tanja Mihalič (SEB LU) Core team, Leader Task 4, Case study expert
Lead of Task 4, coordination of methodology development and case study integration, regional expertise
Tourism economics, sustainability and responsibility and carrying capacity
Kir Kuščer (SEB LU) Case study expert Support Task 4, regional expertise Overtourism, carrying capacity
Miša Novak (alohas) Case study expert Support Task 4, regional expertise Sustainable destination management, strategic destination planning
Source: Consortium 2019
The team is equipped with a broad range of different expertise, the single team members ideally complement each other. In order to safeguard the important coordination efforts between the methodology and case study related work as well as the stakeholder related communication and exchange flows, a core team consisting of five experts with different competences is installed. This core team ensures that all tasks are interconnected and every single group of experts, either methodological or case study experts are not working isolated, this includes also the infor-mation and knowledge exchange between team and stakeholders (participative process). The participative proc-esses of the project including extensive cases study work require experts with knowledge of the respective stake-holder area as well as languages spoken by the stakeholders. For this reason, the project team has made sure to have experts in the team with the relevant language coverage as well as regional expertise.
Stakeholder areas Name Tasks Competencies
Slovenia Tanja Mihalič (SEB LU) Case study leader; communication with Slovenian stakeholders
Extensive expertise in sustainability and responsi-bility, and in economic sustainability and carrying capacity; Extensive expertise in over tourism and sustainable tourism; local expertise
Kir Kuščer (SEB LU) Contribution to case study part; communi-cation with Slovenian stakeholders
Extensive expertise in over tourism and sustain-able tourism; local expertise
Miša Novak (alohas) Contribution to case study part; communi-cation with Slovenian stakeholders
Extensive expertise in over tourism and sustain-able tourism; local expertise
Italy Daniel Dan (MU) Communication with Italian stakeholders; contribution to case study part
Methodological expertise in the area of new media, big data, machine learning, statistics
Croatia Bozana Zekan (MU) Communication with Croatian stake-holders; contribution to case study part
Measuring carrying capacity, indicators, tourism and destination management
The allocation of working days per team members is to be found in annex A.6.

Carrying capacity methodology for tourism
Technical Offer 31
3.2 Allocation of human resources
Table 13: Allocation of human resources
Source: Consortium 2019
3.3 Work plan, timetable and deliverables
To guarantee a smooth and result oriented project flow, the project will be structured in work packages according
to project management standards.
Figure 13: Work steps and related methodologies in Task 6 (project management)
Source: Consortium, 2019
6.1 Project start
6.2 Drafting deliveries and quality checks
6.3 Meetings with ESPON EGTC and 3
outreach events
6.4 Project close-down
Project launch
Project close-down
Work breakdown structure, time plan, list of milestones and deliverables, organisational chart, role description, resource planning, communication plan, list of meetings, risk analysis, plan of quality control measures
Working steps Specific methods milestones
Task 6: Project organisation

Carrying capacity methodology for tourism
32 Technical Offer
Table 14: Work steps and outcomes from a project management perspective (Task 6)
Work step Content Major Outcomes
6.1 Project start Achieving a common understanding of the project objectives, responsibilities, timeline
Agreed project plans
6.2 Drafting deliveries and quality checks
Communication lines in the project organisation, project market-ing, ensure to deliver deliveries in time and with high quality
Smooth project flow; compliance resource planning; high quality deliveries
6.3 Meetings with ESPON EGTC and 3 outreach events
discussion and feedback on the deliveries, presentation of (in-terim) results
presentations, improved deliveries
6.4 Project close-down Remaining work after acceptance of the final deliverables, trans-ferring know-how
Final project plans, project documentation
Source: Consortium 2019
Within the first weeks after the signature of the contract, the objectives, requirements and responsibilities as well as the working schedule are finally determined by the consortium. In the kick-off meeting with steering group the approach is discussed and the management plan will be further developed. To guarantee a sound project manage-ment, the project structure will be set up by developing at least the following project management methods which are described later in this section:
a detailed and robust work breakdown structure and a detailed and agreed timetable (Gantt chart);
a list of milestones and deliverables;
an agreed design of project organisation (organisational chart, role description);
a project communication plan and a list of meetings;
a sound resource planning;
a communication plan;
a project risk analysis to be able to address challenges and a plan of quality control measures.
It is important to stress that all project management methods and charts in this proposal are to be considered as drafts that have to be fine-tuned and agreed during the kick-off process and further adapted and customised during the project’s lifetime.
3.3.1 Work plan, timetable and milestones
Our work breakdown structure starts off from the four tasks from the ToR, adds one task “Project organisation” and breaks down the tasks into manageable and controllable working steps. For the timetable please refer to Figure 14. Furthermore, a list of deliverables and their content as well as an overview on the tasks and milestones is provided in annexes A.2 and A.3.
3.4 Potential challenges and quality control measures
3.4.1 Potential challenges and risk management
Potential challenges and Risk management
Sound project management requires consideration of potential challenges in order to prepare for them. A project of this kind is especially connected to the following challenges:
Cooperation with stakeholders,
Data availability,
Project management.
The table in annex A.4 lists the principal risks identified, according to the abovementioned challenges that could affect the course of the research. This list will be completed, discussed and adjusted with the contractor to antici-pate the resolution of potential conflicts.
The critical steps for the organisation of the workshops and stakeholder dialogues, as identified by the project team are the following: 1) preparation, 2) role of the participants, 3) preliminary documents, 4) process design, 5) process facilitation, 6) recording/follow up.

Carrying capacity methodology for tourism
Technical Offer 33
3.4.2 Quality control measures
We elaborated a set of measures to secure a high quality of the deliverables including the following steps:
Internal project management standards
Internal review
Transparent workflows
Internal feed-back loops when elaborating a deliverable
Editorial review and proofreading
Proper referencing – no plagiarism
Continuity of the service
We do not see quality control of the project’s content as a part of organisation and management of the work, but rather as integrated in each scientific and reporting task at hand. However, to relate to the ToR, we describe the quality measures proposed in this chapter together with project management controlling.
Controlling quality is an integral part of every deliverable process. We have vast experience in such quality manage-ment procedures and know about their importance to ensure that understanding of the issue at stake covers all per-spectives and nuances and that the analysis provided is fully robust. Right from the initial work planning until the final delivery of the document, the quality is controlled by various sources (and hence a broad/mutually agreed standard of quality). The inbuilt procedures ensure that the quality of the document is the highest possible. For details please refer to annex A.5.
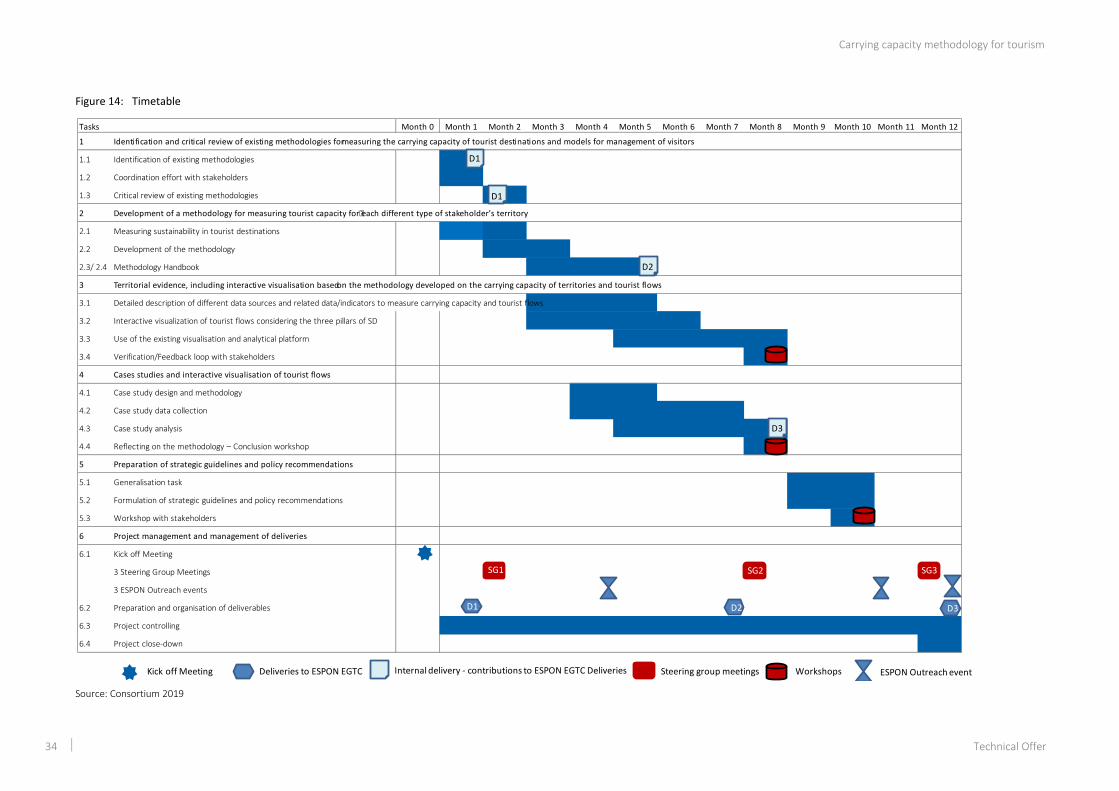
Carrying capacity methodology for tourism
34 Technical Offer
Figure 14: Timetable
Source: Consortium 2019
Tasks Month 0 Month 1 Month 2 Month 3 Month 4 Month 5 Month 6 Month 7 Month 8 Month 9 Month 10 Month 11 Month 12
1 Identification and critical review of existing methodologies for measuring the carrying capacity of tourist destinations and models for management of visitors
1.1 Identification of existing methodologies
1.2 Coordination effort with stakeholders
1.3 Critical review of existing methodologies
2 Development of a methodology for measuring tourist capacity for each different type of stakeholder’s territory
2.1 Measuring sustainability in tourist destinations
2.2 Development of the methodology
2.3/ 2.4 Methodology Handbook
3 Territorial evidence, including interactive visualisation based on the methodology developed on the carrying capacity of territories and tourist flows
3.1 Detailed description of different data sources and related data/indicators to measure carrying capacity and tourist flows
3.2 Interactive visualization of tourist flows considering the three pillars of SD
3.3 Use of the existing visualisation and analytical platform
3.4 Verification/Feedback loop with stakeholders
4 Cases studies and interactive visualisation of tourist flows
4.1 Case study design and methodology
4.2 Case study data collection
4.3 Case study analysis
4.4 Reflecting on the methodology – Conclusion workshop
5 Preparation of strategic guidelines and policy recommendations
5.1 Generalisation task
5.2 Formulation of strategic guidelines and policy recommendations
5.3 Workshop with stakeholders
6 Project management and management of deliveries
6.1 Kick off Meeting
3 Steering Group Meetings
3 ESPON Outreach events
6.2 Preparation and organisation of deliverables
6.3 Project controlling
6.4 Project close-down
D1
D1
D2
D2 D3
SG1 SG2 SG3
D3
Kick off Meeting Deliveries to ESPON EGTC Internal delivery - contributions to ESPON EGTC Deliveries Steering group meetings Workshops ESPON Outreach event
D1

Carrying capacity methodology for tourism
Technical Offer 35
References
Andrienko, G., Andrienko, N., Fuchs, G., & Wood, J. (2017). Revealing patterns and trends of mass mobility through spatial and temporal abstraction of origin-destination movement data. IEEE transactions on visualization and com-puter graphics, 23(9), 2120-2136.
Arrow, K, Bolin, B., Costanza, R., Dasgupta, P., Folke, C., Holling, H.S., Jansson, B.-O., Levine, S., Mäler, K.G., Perrings, G., Pimentel, D. (1995). Economic Growth, Carrying Capacity, and the environment. Ecological Economics 15, 91-95.
Bach, B., Dragicevic, P., Archambault, D., Hurter, C., & Carpendale, S. (2014). A review of temporal data visualiza-tions based on space-time cube operations. In Eurographics conference on visualization. pp. 1-19.
Beck, F., Burch, M., Diehl, S., & Weiskopf, D. (2017). A taxonomy and survey of dynamic graph visualization. In Com-puter Graphics Forum (Vol. 36, No. 1, pp. 133-159).
Birenboim A, Clave S, Russo A, et al. (2013) Temporal activity patterns of theme park visitors. Tourism Geographies 15: 601–619.
Birenboim A, Reinau KH, Shoval N, et al. (2015) High resolution measurement and analysis of visitor experiences in time and space: the case of Aalborg Zoo in Denmark. The Professional Geographer 67: 620–629.
Bokunewicz JF and Shulman J (2017) Influencer identification in Twitter networks of destination marketing organiza-tions. Journal of Hospitality and Tourism Technology 8: 205–219.
Bostock, M., Ogievetsky, V., & Heer, J. (2011). D³ data-driven documents. IEEE transactions on visualization and computer graphics, 17(12), 2301-2309.
Brasoveanu, A.M.P., Sabou, M., Scharl, A., Hubmann-Haidvogel, A. and Fischl, D. (2017). Visualizing Statistical Linked Knowledge for Decision Support. Semantic Web Journal, 8(1): 113-137.
Cambria, E., Poria, S., Gelbukh, A., & Thelwall, M. (2017). Sentiment analysis is a big suitcase. IEEE Intelligent Sys-tems, 32(6), 74-80.
Erxleben, F., Günther, M., Krötzsch, M., Mendez, J., & Vrandečić, D. (2014). Introducing Wikidata to the linked data web. In International Semantic Web Conference (pp. 50-65). Springer, Cham.
Fang B, Ye Q, Kucukusta D, et al. (2016) Analysis of the perceived value of online tourism reviews: influence of read-ability and reviewer characteristics. Tourism Management 52: 498–506.
Goyal, P., & Ferrara, E. (2017). Graph embedding techniques, applications, and performance: A survey. arXiv pre-print arXiv:1705.02801.
Graymore, M.L.M., Sipe, N.G. and Rickson, R.E. (2010). Sustaining human carrying capacity: A tool for regional sus-tainability assessment. Ecological Economics 69, 459-468.
Gunter U and Önder I (2019) An exploratory analysis of geotagged photos from Instagram for residents of and visi-tors to Vienna: Mimeo.
Gunter U and Wöber K (2019) Estimating CO2 emissions of European city tourism by source market, travel distance, and transportation mode. Presentation at the 54th TRC Meeting, Palma de Mallorca, Spain (April 4 – 6, 2019).
Gunter U, Önder I and Gindl S (2019) Exploring the Predictive Ability of Likes of Posts on the Facebook Pages of Four Major City DMOs in Austria. Tourism Economics 25: 375–401.
Guo, D., & Zhu, X. (2014). Origin-destination flow data smoothing and mapping. IEEE transactions on visualization and computer graphics, 20(12), 2043-2052.
Haklay, M., & Weber, P. (2008). Openstreetmap: User-generated street maps. IEEE Pervasive Computing, 7(4), 12-18.
Heer, J., Hellerstein, J. M., & Kandel, S. (2015). Predictive Interaction for Data Transformation. In CIDR 2015.
Ivanova, V., Bach, B., Pietriga, E., & Lambrix, P. (2017). Alignment cubes: Towards interactive visual exploration and evaluation of multiple ontology alignments. In International Semantic Web Conference (pp. 400-417). Springer, Cham.

Carrying capacity methodology for tourism
36 Technical Offer
Jurado, E.N., Tejada, M.T., García, F.A., González, J.C., Macías, R.C., Peña, J.D., Gutiérrez, F.F., Fernández, G.G., Gallego, M. L., García, G.M., Gutiérrez, O.M., Concha, F.N., Ruiz de la Rúa, F., Sinoga, J. R., & Becerra, F.S. (2012). Carrying capacity assessment for tourist destinations. Methodology for the creation of synthetic indicators applied in a coastal area. Tourism Management, 33(6), 1337-1346.
Ketter E (2016) Destination image restoration on Facebook: the case study of Nepal’s Gurkha earthquake. Journal of Hospitality and Tourism Management 28: 66–72.
Kucher, K., Paradis, C., & Kerren, A. (2017). The state of the art in sentiment visualization. In Computer Graphics Forum (Vol. 37, No. 1. 71-96)
Kuščer, K., & Mihalič, T. (2019). Residents’ Attitudes towards Overtourism from the Perspective of Tourism Impacts and Cooperation–The Case of Ljubljana. Sustainability, 11(6), 1823.
Lehmann, J., Isele, R., Jakob, M., Jentzsch, A., Kontokostas, D., Mendes, P. N., Hellmann, S., Morsey, M., van Kleef, P., Auer, S., & Bizer, C. (2015). DBpedia–a large-scale, multilingual knowledge base extracted from Wikipedia. Semantic Web, 6(2), 167-195.
Leung XY, Tanford S and Jiang L (2017) Is a picture really worth a thousand words? An experiment on hotel Facebook message effectiveness. Journal of Hospitality and Tourism Technology 8: 19–38.
Li J, Xu L, Tang L, et al. (2018) Big data in tourism research: a literature review. Tourism Management 68: 301–323.
Lu, Y., Garcia, R., Hansen, B., Gleicher, M., & Maciejewski, R. (2017). The State‐of‐the‐Art in Predictive Visual Ana-lytics. In Computer Graphics Forum (Vol. 36, No. 3, pp. 539-562).
Maltese, V., & Farazi, F. (2013). A semantic schema for GeoNames. Università di Trento.
Monti, D., Palumbo, E., Rizzo, G., Troncy, R., & Morisio, M. (2018). Semantic Trails of City Explorations: How Do We Live a City. CoRR, abs/1812.04367.
Nakayama M and Wan Y (2018) Is culture of origin associated with more expressions? An analysis of Yelp reviews on Japanese restaurants. Tourism Management 66: 329–338.
Nixon L. et al. (2018) Temporal Annotation and Metrics Extraction, ReTV Project Deliverable 2.1, October 2018. http://retv-project.eu/deliverables/
Önder I (2017) Classifying multi-destination trips in Austria with big data. Tourism Management Perspectives 21: 54–58.
Önder I, Gunter U and Gindl S (2019) Utilizing Facebook Statistics in Tourism Demand Modeling and Destination Marketing. Journal of Travel Research. https://doi.org/10.1177/0047287519835969
Önder I, Koerbitz W and Hubmann Haidvogel A (2016) Tracing tourists by their digital footprints: the case of Austria. Journal of Travel Research 55: 566–573.
Önder I, Wöber K and Zekan B. 2017. Towards a sustainable urban tourism development in Europe: The role of benchmarking and tourism management information systems e a partial model of destination competitiveness. Tourism Economics 23: 243–259.
O'Reilly, A. M. (1986). Tourism carrying capacity: Concept and issues. Tourism Management, 7(4), 254-258.
Park SB, Ok CM and Chae BK (2016) Using Twitter data for cruise tourism marketing and research. Journal of Travel and Tourism Marketing 33: 885–898.
Rees, W.E., Wackernagel, M., 1994. Ecological footprints and appropriated carrying capacity: measuring the natural capital requirements of the human economy. In: Jansson, A.M., Hammer, M., Folke, C., Costanza, R. (Eds.), Investing in Natural Capital: the Ecological Economics Approach to Sustainability. Washington D.C, Island Press, pp. 362–390. Ritchie, J.R.B., & Crouch, G.I. (2003). The competitive destination: A sustainable tourism perspective. Wallingford, UK: CAB International.
Roland Berger. (2018). Protecting your city from overtourism. European city tourism study 2018. Retrieved April 07, 2019, from https://www.rolandberger.com/en/Publications/Overtourism-in-Europe's-cities.html
Saarinen, J. (2006). Traditions of sustainability in tourism studies. Annals of Tourism Research, 33(4), 1121–1140.
Sabou, M., Arsal, I., & Braşoveanu, A. M. (2013). Tourmislod: A tourism linked data set. Semantic Web, 4(3), 271-276.

Carrying capacity methodology for tourism
Technical Offer 37
Scharl, A., Herring, D., Rafelsberger, W., Hubmann-Haidvogel, A., Kamolov, R., Fischl, D., Fols, M., & Weichselbraun, A. (2017). Semantic systems and visual tools to support environmental communication. IEEE Systems Journal, 11(2), 762-771.
Scharl, A., Lalicic, L., & Önder, I. (2017). Tourism intelligence and visual media analytics for destination management organizations. In Analytics in Smart Tourism Design (pp. 165-178). Springer, Cham.
Scharl, A., Weichselbraun, A., et al. (2016). Scalable Knowledge Extraction and Visualization for Web Intelligence. 49th Hawaii International Conference on System Sciences (HICSS-2016). Kauai, USA: IEEE Press. 3749-3757.
Shoval N and Ahas R (2016) The use of tracking technologies in tourism research: the first decade. Tourism Geogra-phies 18: 587–606.
Troncy, R., Rizzo, G., Jameson, A., Corcho, O., Plu, J., Palumbo, E., Ballesteros Hermida, J.C., Spirescu, A., Kuhn, K.D., Barbu, C., Rossi, M., Celino, I., Agarwal, R., Scanu, C., Valla, M. & Haaker, T. (2017). 3cixty: Building comprehensive knowledge bases for city exploration. Web Semantics: Science, Services and Agents on the World Wide Web, 46, 2-13.
UNWTO. (2018). ‘Overtourism’? Understanding and managing urban tourism growth beyond perceptions. Executive summary. Madrid, Spain: UNWTO.
UNWTO. (2019). ‘Overtourism’? Understanding and managing urban tourism growth beyond perceptions. Volume 2: Case studies. Madrid, Spain: UNWTO.
Weichselbraun, A., Gindl, S., et al. (2017). Aspect-Based Extraction and Analysis of Affective Knowledge from Social Media Streams. IEEE Intelligent Systems, 32(3): 80-88.
Weichselbraun, A., Kuntschik, P., & Braşoveanu, A. M. (2018, June). Mining and leveraging background knowledge for improving named entity linking. In Proceedings of the 8th International Conference on Web Intelligence, Mining and Semantics (p. 27). ACM.
Wöber, K. W. (2003). Information supply in tourism management by marketing decision support systems. Tourism Management, 24(3), 241-255.
Xiang Z, Du Q, Ma Y, et al. (2017) A comparative analysis of major online review platforms: implications for social media analytics in hospitality and tourism. Tourism Management 58: 51–65.

Carrying capacity methodology for tourism
38 Technical Offer
Annex
A.1 Communication lines
In a project of this size it is crucial to thoughtfully plan the communication lines. We foresee certain formats of communication that are presented in the following table.
Communication plan – List of meetings
Format Target group Objective media Duration frequency Internal project team kick-off
Full team developing a common understanding, explaining the tasks and work steps
Phone or Skype
0,5 days Once
Project coordina-tion
Task leader and all other team members according to the respective tasks
achieving the project objectives as envisaged
Phone, Skype, e-mail
according to requirements
Ongoing
Kick-off group meeting
ESPON EGTC, project stakeholders, project manager, deputy project manager
Steering the project lifecycle, pre-senting interim results, giving feed-back on deliverables
Face to face 1 day once
Steering commit-tee meetings
ESPON EGTC, project stakeholders, project manager, deputy project manager
Steering the project lifecycle, pre-senting interim results, giving feed-back on deliverables
Face to face, Skype, Tele-conference
0,5 days three times
Communication with EGTC
ESPON EGTC, project stakeholders, project manager, deputy project manager
Steering the project lifecycle Phone, Skype, e-mail
according to requirements
Approx. monthly
Core team meet-ings
project manager, deputy project manager, task leaders
Coordinating the tasks and work steps
Face to face, Skype
according to requirements
At least twice
Internal coordi-nation meeting
Full team
Discussion and development of methodology and indicators,
Preferably Skype
1 day Once
Workshop with Stakeholders
core team, stakeholders discussing suggestions according to task 3 and 4
Face to face 1 day Once
Internal task coordination
task leaders, methodological team members Coordinating the tasks and working steps
Phone, Skype, e-mail
according to requirements
Ongoing
Coordination of case studies
case study team and methodological team efficient implementation of the case study
Phone, Skype, e-mail
according to requirements
Ongoing
Workshop with stakeholders
all task leader, project manager, deputy project manager
Interactive communication process with the workshop as key element in order to discuss and impart the findings of task 1-4
Face to Face 1 day Once
ESPON outreach events
project manager or deputy project manager presenting interim/final results Face to face according to requirements
three times
Source: Consortium 2019
Communication with the ESPON EGTC
The core team and the ESPON EGTC will be in contact on a regularly basis, mainly via telephone and e-mail. The purpose of communication with the ESPON EGTC is not only to receive feedback from ESPON but also from Project Stakeholders, given that ESPON EGTC acts as intermediary between the project team and project stakeholders.
Communication with project stakeholders
If project stakeholders will have the need to communicate their feedback to the project team directly, project team will be open to such communication channels, keeping ESPON EGTC informed about it. The project team aims to provide quality work that will help project stakeholders measuring carrying capacity in their regions, therefore, we will aim to address and satisfy all needs of project stakeholders.
Coordination between the consortium members and the different experts
The relationships between the consortium members are governed by the contract with the ESPON EGTC as well as an internal consortium agreement which will be drawn up for the operation of this service contract. The consortium agreement is approved by all consortium partners and it sets out the precise allocation of project resources and the deliverables that are expected from each partner, the internal process for responding to requests and the quality assurance procedures.
Kick-off meeting
The kick-off meeting is a dialogue between the project team, ESPON EGTC and project stakeholders in order to achieve a common understanding of the objectives and tasks of the service contract and the detailed plan and time-

Carrying capacity methodology for tourism
Technical Offer 39
line for implementation. In addition, at the kick-off meeting the service provider will receive feedback from the tender evaluation process, advise on suggested improvements to the methods proposed to implement service con-tract; and written guidelines on how to produce maps in line with the appropriate ESPON templates; technical re-quirements on the integration of data/indicators into the ESPON database and web interfaces; as well as all relevant information concerning the proper application of the ESPON EGTC corporate identity.
Steering Group meetings
As stated in the ToR, the objectives of the Steering Group meetings are: to discuss the progress on the implementa-tion of the service and to provide feedback received from project stakeholders. The service provider will present interim results and discuss them with the EGTC and stakeholders.
Communication with stakeholders as part of Tasks
The project team has assigned partners as well as supporting partners that are responsible for the case study areas. They will maintain constant contact with the relevant stakeholders in order to ensure their participation in the stakeholder workshop as well as exchange on data, studies available as well as consultation on the results.
ESPON outreach events
We have budgeted resources for either the Project Manager or Deputy Project Manager to take part in up to four ESPON events in either in one of the countries holding the EU Presidency during the implementation period of this service. We also consider that the ESPON EGTC Coordination meetings can take place back-to-back with ESPON Outreach events.
Storing of information and knowledge transfer within the consortium
In order to ensure efficient communication and working between the project manager and the core team, an online project web will be set up. We will use a web solution that allows for secure uploading and downloading of key documents and communication. The project web is pass-word protected and secure.

Carrying capacity methodology for tourism
40 Technical Offer
A.2 Deliverables
The deliveries foreseen by the ToR are summarized below. All deliveries will be delivered in electronic (pdf and doc) format and will have gone through a thorough language check.
Delivery Contents
1 First delivery
Inception Report (appr. 20 pages)
– Description of the conceptual framework to be applied
– Specific approaches and methods to be applied
– Sources and data to be used
– Practical steps to be taken for implementation of the activity
– Overview and interpretation of stakeholders’ political objectives and policy needs
– Elaborated proposal for the case studies
– Brief description: project implementation, analytical work
2: Interim report (appr. 30 pages)
– Final overview of the stakeholders’ objectives and policy needs
– Overview of data and data sources to be used
– Final results task 1 and 2
– Interim results on task 3, including examples of interactive visualization and draft narratives
– Overview and first results of the case studies (task 4)
– Draft strategic guidelines and policy recommendations (task 5)
3
Final Delivery
Final report (appr. 50 pages)
– Executive summary (max. 3 pages) focusing on conclusions and policy recommendations based on stakeholders’ knowledge needs
– Results and analysis of task 1-5
– Policy recommendations for the study area and how recommendations could be applied across Europe
– Proposal for further research
Synthesis report (max. 8 pages) including:
– Data gathered according to ESPON metadata template.
– Main results of the targeted analysis and policy recommendations
– Content to be discussed and agreed with the ESPON EGTC
Scientific annexes including:
– Everything that has to be known to make study repeatable and verifiable
– Case study reports
Website content (max. 12 pages) showcasing the key results and insights of the main report, based on guidelines and templates to be provided by the ESPON EGTC
A PowerPoint presentation (max. 30 slides), consisting of the main components of the final report, including the key maps and re-sults of the study, to be agreed with the ESPON EGTC after Delivery 2.
Maps (approx. 2-5, as appropriate) and accompanying text following the structure of the ESPON Online MapFinder, selection based on consultations with ESPON EGTC.
Source files for the maps and figures included in the delivery (incl. vector format).
Overview table of maps, figures and data, based on a template to be provided by the ESPON EGTC.
Data gathered according to ESPON metadata template and proof of integration of data into the ESPON database.

Carrying capacity methodology for tourism
Technical Offer 41
A.3 Milestones and Meetings
Work step Milestone/meeting Months after kick-off
6.1 Project team kick-off before kick-off
6.1 Coordination group kick-off 0
1.2 Internal coordination Meeting 0,5
1.3 Internal delivery of deficit report 0,5
6.2 D1 Inception delivery 1
6.3 Steering committee meeting/teleconference 2
2.1 Sustainability indicator matrix 2
2.2 Analytical framework and methodology handbook draft 3
2.3/2.4 Handbook for methodology 5
3.1 Shared metadata model 5
3.2 Interactive visualization drafts 6
4.2 Draft case study analysis reports 7
6.2 D2 Interim Delivery report 8
6.3 Steering committee meeting/teleconference 8
3.3 Dashboard for tourist flows 8
3.4/4.3 Stakeholder reflection workshop 8,5
4.3 Case study analysis reports 8,5
5.1 Guidance for application 9,5
5.2 Strategic guidelines 10
6.3 Steering committee meeting/teleconference 10,5
6.2 D3 Final delivery 12
6.3 Project close-down 12
Source: Consortium 2019, based on ToR

Carrying capacity methodology for tourism
42 Technical Offer
A.4 Risk management
Task No.
Task name (short)
Risks Level of risk
Probability of risk
Measures to reduce anticipated risk
1 Existing meth-odologies
Project partners having differing views on importance and usabil-ity of existing method-ology
Me-dium
Low Each partner is an experienced expert in the field that can add valuable knowledge and inputs into the process; even though some ideas may be differing, partners’ competences and understanding of the processes will allow to build on these ideas rather than allow them to cause conflict. A consensus between all partners on methodology will be reached.
2 Methodology development
Stakeholders unwilling or unable to cooperate
High Low Since stakeholders have expressed their interest in the project to ESPON this is not very probable.
The project team, however, will maintain a constant communication as well as will make sure to understand their expectations for the project and present the added-value of the project to their programmes.
2 Methodology development
Difficulties finding appropriate indicators
High Medium One of the most essential elements of assessing carrying capacity is understanding and framing tourism impacts in terms of appropriate indicators. For this reason, finding and coming up with such indicators is an important element of the methodology. However, the chosen indica-tors must not only be appropriate in this aspect; they must also be realistic in terms of data, which is a considerable challenge. Project team deals with this through including a step on indicator testing; this shall help experts select realistic indicators.
3 Interactive visualisation
Difficulties in finding the agreed geotagged tourist flow data from social media and the Web for the respective regions
High Medium It is possible that there might occur problems in retrieving the quality of geotagged tourist flow data in the needed granularity. Project team deals with this through integrating a broad variety of possible data sources.
3 Interactive visualisation
Mismatch between needed data and the used dashboard
High Medium It might be the case that stakeholder asked for very specific tourist flow data which might be incompatible with the used dashboard. Project team covers methodological experts with complementary expertise for calculating and visualizing OSM data with R.
4 Case Studies Difficulties in applying the methodology hand-book in case study areas
High Low It might be the case that the methodology handbook cannot easily applied in specific case study regions. The project organisation foresees a stringent cross-task workflow where internal communication and infor-mation flows help to identify as soon as possible difficulties in under-standing how the methodology handbook needs to be applied in the case studies. Constant communication with the stakeholders will also help to avoid misunderstandings ore misinterpretation of the methodol-ogy handbook.
4 Case Studies Case study data collec-tion might be difficult
High Medium It is possible that the data collection for specific case studies might be difficult in terms of quality of the data, availability of the data and deliv-ery within a short period of time. This might specifically occur when specific statistical and structural data needs to be harmonized with big data. Even though the stakeholders will be highly committed to the project, it might happen that data provision turns out critical. The re-gional experts in the team bring in a lot of first hand contacts in the regions under study (social networks) as well as extensive experience with the particular situation in the specific destinations (expertise), which will help to overcome this risk.
5 Guidelines Stakeholders from other regions unable to make use of the guidelines
High Low Project team keeps in mind that project outputs have to be used beyond the involved programmes, therefore it will make sure that the guidelines are useful for stakeholders that have not participated in the project by consulting the involved stakeholders on the appropriate design of the guidelines.
5 Guidelines Strict timeline and unexpected problems
High Low Controlled management of the team by the project manager; using a highly qualified and experienced team.
6 Project man-agement
Loss of Project Manager or Deputy Project Manager
high low Provide Project Management experts as substitutes.
6 Project man-agement
Loss of a member of the study team
high low At least double occupancy of all crucial roles
Source: Consortium, 2017.

Carrying capacity methodology for tourism
Technical Offer 43
A.5 Quality control measures
Internal review
Internal feed-back and control loops when elaborating the report (including language check)
In order to gain a as high quality as possible, we have foreseen several internal quality-checks and feed-back loops when preparing the deliverable and other milestone results:
Linked to the structure a guideline will be elaborated serving as checklist, whether all relevant issues and research questions are covered within the report.
A preliminary internal version of all deliveries as highlighted above is prepared for circulation within the core team in order to get internal feedback. The preliminary deliveries will be reviewed by those core team members who are not authors of a deliverable.
Based on the comments of the core team members the delivery is prepared by the task leader.
The review will undergo an editorial check and a language check in order to secure a high language stan-dard.
Based on the comments the final document is prepared. This document meets already all quality standards.
The final report is delivered to the ESPON EGTC.
Transparent Workflow
Transparency is important to ensure high quality. We will set up a shared folder system available to all experts work-ing on the assignment. This will serve as structured storage and sharing platform for the materials prepared and allow all experts involved in the assignment to have an insight in the work going and double-check the materials prepared. The project manager will ensure that all experts involved in an assignment are regularly informed about the progress of the work.
Ensuring the continuity of the service
The continuity of service is ensured throughout the contract duration. For this, the consortium has dedicated impor-tant human resources to this project.
The project is managed by one project manager, supported by two deputy project managers. The consortium pro-poses this combination to be able to handle assignments at once but also to ensure, that either deputy project manager can take over, if the project manager would be unavailable. This structure furthermore guarantees the flexibility within the team and the continuity of the organisation and of the service if a key expert is not available.
Linguistic quality standards, style and layout rules
Editing – proof reading – layouting
An editor will verify that the best professional standards are achieved at an operational level and that each docu-ment is prepared in accordance with the editing style required by the ESPON EGTC. They will be responsible for verifying that:
the content of the document is complete
the text does not include even small factual errors, imprecise or ambiguous wording;
the document does not include non-essential data or information, and technical language is not used – or, when technical terms are unavoidable, these are clearly explained in a non-technical way;
all sources and references are clearly and appropriately quoted;
the most recently available information and data is always included from each of the sources;
the use of charts and tables are appropriate to support the overall findings
A specialised layout designer will then finalise the layout according to the stylesheet of the EC within the same day of receiving it.

Carrying capacity methodology for tourism
44 Technical Offer
Proper referencing – no plagiarism
ÖIR and its partners show a long standing tradition in research work; approximately one-half of the ÖIR operational staff is also involved in academia, such as lecturing at universities within Austria and internationally. Similarly, the partners of the consortium are involved in academia as part of their work.
All team members are therefore familiar with working with literature and academic papers, including proper refer-encing and citing, as well as excellent knowledge of the rules associated with plagiarism. This includes clear refer-encing and identifying others’ ideas, using systematically the Harvard in-text referencing system (Author, Date: page). Proper referencing is not limited to analogous publications only, but is also used for texts available online (hyperlinks).

Carrying capacity methodology for tourism
Technical Offer 45
A.6 Allocation of working days per team member
Tasks
ÖIR Modul SEB LU
Senior Junior Senior Junior Sen. Jun. Sub.
Schuh Dall-ham-mer
Gau-gitsch
Gorny Sed-lacek
Gunter Zekan Nixon Dan Weis-mayer
Mi-halic
Kuscer Novak
1 Identification and critical review of existing methodologies for measuring the carrying capacity of tourist destinations and models for management of visitors
1.1 Identification of existing methodologies 3 2 3 2 2 2 2
1.2 Coordination effort with stakeholders 2 3 2 2 1 2 2 2 2
1.3 Critical review of existing methodologies 4 1 3 1 3 2 1 1 1 2 1
2 Development of a methodology for measuring tourist capacity for each different type of stakeholder’s territory
2.1 Measuring sustainability in tourist destinations 3 2 3 2 4 3 4 2 2 3
2.2 Development of the methodology 4 3 3 3 4 4 2 2 2
2.3/2.4 Methodology Handbook 7 2 4 4 3 2 2 1
3 Territorial evidence, including interactive visualisation based on the methodology developed on the carrying capacity of territories and tourist flows
3.1 Detailed description of different data sources and related data/indicators to measure carrying capacity and tourist flows 1 3 2 1 1 2 5 2 2 1
3.2 Interactive visualization of tourist flows considering the three pillars of SD 1 1 1 7 2 5 1
3.3 Use of the existing visualisation and analytical platform 1 1 7 3 5
3.4 Verification/Feedback loop with stakeholders 1 1 1 1 1 1 3 4
4 Cases studies and interactive visualisation of tourist flows
4.1 Case study design and methodology 1 2 1 2 6 9 6
4.2 Case study data collection 1 3 2 1 2 1 1 2 12 18 10
4.3 Case study analysis 1 2 2 2 2 3 1 3 3 4 10 6
4.4 Reflecting on the methodology – Conclusion workshop 1 2 1 1 2 3 3
5 Preparation of strategic guidelines and policy recommendations
5.1 Generalisation task 3 4 3 1 1 2
5.2 Formulation of strategic guidelines and policy recommendations 2 3 3 2 1 1 1 1 1 2
5.3 Workshop with stakeholders 1 1 3 2 1 3 2
6 Project management and management of deliveries
6.1 Kick off Meeting 1 1
3 Steering Group Meetings 1 1 1 1
3 ESPON Outreach events 1 1
6.2 Preparation and organisation of deliverables 1 1 1 1 1 1 2
6.3 Project controlling 2 2 2
6.4 Project close-down 3 2 6 1 1 1
Total 414 46 64 57 122 37 57 31