CARROTS, STICKS, AND BROKEN WINDOWS...carrots, sticks, and broken windows 237 We have made the...
32
235 [Journal of Law and Economics, vol. XLVIII (April 2005)] 2005 by The University of Chicago. All rights reserved. 0022-2186/2005/4801-0010$01.50 CARROTS, STICKS, AND BROKEN WINDOWS* HOPE CORMAN Rider University and NACI MOCAN University of Colorado at Denver Abstract This paper investigates the effect of economic conditions (carrots) and sanctions (sticks) on murder, assault, robbery, burglary, motor vehicle theft, grand larceny, and rape in New York City, using monthly time-series data spanning 1974–99. Carrots are measured by the unemployment rate and the real minimum wage; sticks are measured by the number of felony arrests, size of the police force, and number of New York City residents in prison. In addition, the paper tests the validity of the “broken windows” hypothesis. Consistent with its implementation by the New York Police Department, we use misdemeanor arrests as a measure of broken-windows policing. The broken-windows hypothesis has validity in the case of robbery, motor vehicle theft, and grand larceny. While both economic and deterrence variables are important in explaining the decline in crime, the contribution of deterrence measures is larger than those of economic variables. I. Introduction I n the decade ending in 1999, there were significant decreases in serious crime throughout the United States. From 1990 to 1999, violent crime rates fell by about 28 percent, and property crime rates fell by about 26 percent nationally. 1 Many metropolitan areas fared even better than national trends in crime reduction. The decrease in violent crime rates in Atlanta, Boston, Chicago, Los Angeles, Miami, and San Diego ranged from 33 percent to 53 percent. 2 Although it followed the general trends, New York City (NYC) experienced even more dramatic declines in crime: violent crimes declined by over 56 percent, and property crimes fell by about 65 percent. Many * This is the revised version of National Bureau of Economic Research (NBER) Working Paper No. 9061. This research is supported by the Independent Budget Office (IBO) of New York City. Kaj Gittings, Norovsambuu Tumennasan, and Alicia Edwardson provided excellent research assistance. We thank seminar participants at Georgia State University, an anonymous referee, and the editor, Sam Peltzman, for helpful suggestions. We wish to thank Perston Niblack and Bernard O’Brien for the insights they provided. Any opinions expressed are those of the authors and not those of the NBER or the IBO. 1 U.S. Department of Justice, Bureau of Justice Statistics, Sourcebook of Criminal Justice Statistics, 2000 (2001). 2 Id.; and U.S. Department of Justice, Bureau of Justice Statistics, Sourcebook of Criminal Justice Statistics, 1991 (1992).
Transcript of CARROTS, STICKS, AND BROKEN WINDOWS...carrots, sticks, and broken windows 237 We have made the...

235
[Journal of Law and Economics, vol. XLVIII (April 2005)]� 2005 by The University of Chicago. All rights reserved. 0022-2186/2005/4801-0010$01.50
CARROTS, STICKS, AND BROKEN WINDOWS*
HOPE CORMANRider University
and NACI MOCANUniversity of Colorado
at Denver
Abstract
This paper investigates the effect of economic conditions (carrots) and sanctions(sticks) on murder, assault, robbery, burglary, motor vehicle theft, grand larceny, andrape in New York City, using monthly time-series data spanning 1974–99. Carrotsare measured by the unemployment rate and the real minimum wage; sticks aremeasured by the number of felony arrests, size of the police force, and number ofNew York City residents in prison. In addition, the paper tests the validity of the“broken windows” hypothesis. Consistent with its implementation by the New YorkPolice Department, we use misdemeanor arrests as a measure of broken-windowspolicing. The broken-windows hypothesis has validity in the case of robbery, motorvehicle theft, and grand larceny. While both economic and deterrence variables areimportant in explaining the decline in crime, the contribution of deterrence measuresis larger than those of economic variables.
I. Introduction
In the decade ending in 1999, there were significant decreases in seriouscrime throughout the United States. From 1990 to 1999, violent crime ratesfell by about 28 percent, and property crime rates fell by about 26 percentnationally.1 Many metropolitan areas fared even better than national trendsin crime reduction. The decrease in violent crime rates in Atlanta, Boston,Chicago, Los Angeles, Miami, and San Diego ranged from 33 percent to 53percent.2 Although it followed the general trends, New York City (NYC)experienced even more dramatic declines in crime: violent crimes declinedby over 56 percent, and property crimes fell by about 65 percent. Many
* This is the revised version of National Bureau of Economic Research (NBER) WorkingPaper No. 9061. This research is supported by the Independent Budget Office (IBO) of NewYork City. Kaj Gittings, Norovsambuu Tumennasan, and Alicia Edwardson provided excellentresearch assistance. We thank seminar participants at Georgia State University, an anonymousreferee, and the editor, Sam Peltzman, for helpful suggestions. We wish to thank Perston Niblackand Bernard O’Brien for the insights they provided. Any opinions expressed are those of theauthors and not those of the NBER or the IBO.
1 U.S. Department of Justice, Bureau of Justice Statistics, Sourcebook of Criminal JusticeStatistics, 2000 (2001).
2 Id.; and U.S. Department of Justice, Bureau of Justice Statistics, Sourcebook of CriminalJustice Statistics, 1991 (1992).

236 the journal of law and economics
attribute NYC’s crime reduction to specific policies carried out by MayorRudolph Giuliani’s administration with its “get tough” approach to crimefighting. The most prominent of the policy changes was the aggressive po-licing of lower-level crimes, a policy that has been called the “broken win-dows” approach to law enforcement. Skeptics believe that NYC’s experiencewas attributable to other factors such as the economic boom of the 1990s,enjoyed both in NYC and nationally. For example, the national unemploy-ment rate declined by 25 percent between 1990 and 1999, and it declinedby 39 percent between 1992 and 1999 in NYC.3
The question of whether economic conditions or deterrence policies aremore effective tools of crime control has become an important political issuein other countries as well. For example, crime control has been one of themost important policy issues in the United Kingdom recently, and it was thenumber one issue in the 2002 presidential election campaign in France.4
The aim of this paper is twofold. First, it analyzes the effect of economicconditions (carrots) and various deterrence measures (sticks) on seven felonycrimes in NYC between 1974 and 1999. The ability to include these variablesjointly in a crime supply equation allows us to determine the relative mag-nitudes of economic and deterrence measures in a coherent framework. Thesecond contribution of the paper is the investigation of the validity of thebroken-windows hypothesis, which is summarized in a 1998 press conferenceby Giuliani, where he alluded to an oft-cited article by James Wilson andGeorge Kelling:5
3 Another explanation offered as a factor contributing to the decrease in crime is reductionin the cohort size owing to decline in fertility because of the legalization of abortion in theUnited States following the 1973 Supreme Court decision inRoe v. Wade (410 U.S. 959(1973)). John J. Donohue III & Steven D. Levitt, The Impact of Legalized Abortion on Crime,116 Q. J. Econ. 379 (2001). If most of the averted pregnancies are for women with economicallydisadvantaged backgrounds, then the legalization of abortion reduces the number of crime-prone children, and this would have an impact on crime 16–20 years after the legalization.We do not directly address the impact of legalized abortion on crime in New York City (NYC).However, in note 62infra, we discuss the potential relevance of this issue.
4 Jim Bittermann, Crime Tops French Election Issues (April 17, 2002) (http://www.CNN.com/2002/WORLD/europe/03/26/france.crime/index.html), France’s prime minister, Lionel Jospin,indicated that he was “naı¨ve” to believe that lowering unemployment would solve the crimeproblem in France, and in both Britain and France, conservative as well as liberal politiciansare proposing “get-tough” policies in addition to economic ones to battle their rising crimerates (Stephen Baker, Kerry Cappel, & Kate Carlisle, Crime and Politics, Bus. Wk., March18, 2002, at 50). British Prime Minister Tony Blair was quoted in theObserver as intendingto pursue radical reforms of the criminal justice system (to implement tougher penalties, suchas on-the-spot fines for antisocial behavior such as public drunkenness). Kamel Ahmed, BlairPledge to Wage New Crime War: PM Admits Public Feel Unsafe as Criminals Walk Free,Observer, November 10, 2002, at 1.
5 Rudolph W. Guiliani, The Next Phase of Quality of Life: Creating a More Civil City(February 24, 1998) (http://www.nyc.gov/html/rwg/html/98a/quality.html), citing James Q.Wilson & George L. Kelling, Broken Windows, Atl. Monthly, March 1982, at 29.

carrots, sticks, and broken windows 237
We have made the “Broken Windows” theory an integral part of our law enforcementstrategy. This theory says that the little things matter. As James Q. Wilson describesit, “If a factory or office window is broken, passersby observing it will concludethat no one cares or no one is in charge. In time, a few will begin throwing rocksto break more windows. Soon all the windows will be broken, and now passersbywill think that, not only no one is in charge of the building, no one is in charge ofthe street on which it faces. . . so more and more citizens will abandon the streetto those they assume prowl it. Small disorders lead to larger ones, and perhaps evento crime.” . . . There’s a continuum of disorder. Obviously, murder and graffiti aretwo vastly different crimes. But they are part of the same continuum, and a climatethat tolerates one is more likely to tolerate the other.
We use monthly time-series data between 1974 and 1999 from NYC toinvestigate the extent to which carrots (the unemployment rate and the realminimum wage), sticks (arrests, size of the police force, and prison popu-lation), and the broken-windows approach to crime control are responsiblefor the decrease in NYC crime from the early to late 1990s. We use mis-demeanor arrests as a measure of the extent of the broken-windows approachto policing and find support for the broken-windows hypothesis in the caseof robberies, motor vehicle thefts, and grand larcenies. Although carrots andsticks both explain crime fluctuations in NYC, the impact of sticks was foundto be stronger than the impact of carrots during the 1990s.6
In Section II, we briefly summarize recent literature on the economics ofcrime and provide a description of the broken-windows hypothesis. SectionsIII and IV present the empirical model and the data, respectively. Section Vcontains the results, Section VI discusses the interpretation and robustnessof the results, Section VII presents the relative impacts of carrots and sticks,and Section VIII concludes.
II. Literature Review and the Broken-Windows Theory
A. The Effect of Sanctions and Economic Conditions on Crime
Recent research has demonstrated a significant effect of sanctions on crim-inal activity.7 Although varied in both choice of variables and econometric
6 Most of the recent crime research relied on panel data of states, cities, or counties. Althoughwe employ high-frequency time-series data from one city, our basic results are consistent withthose obtained by earlier studies.
7 David B. Mustard, Reexamining Criminal Behavior: The Importance of Omitted VariableBias, 85 Rev. Econ. & Stat. 205 (2003); H. Naci Mocan & Robert Kaj Gittings, Getting offDeath Row: Commuted Sentences and the Deterrent Effect of Capital Punishment, 46 J. Law& Econ. 453 (2003); Hope Corman & H. Naci Mocan, A Time-Series Analysis of Crime,Deterrence, and Drug Abuse in New York City, 90 Am. Econ. Rev. 584 (2000); Steven D.Levitt, Why Do Increased Crime Arrest Rates Appear to Reduce Crime: Deterrence, Incapac-itation, or Measurement Error? 36 Econ. Inquiry 353 (1998); Steven D. Levitt, Using ElectoralCycles in Police Hiring to Estimate the Effect of Police on Crime, 87 Am. Econ. Rev. 270(1997); and Steven D. Levitt, The Effect of Prison Population Size on Crime Rates: Evidencefrom Prison Overcrowding Litigation, 111 Q. J. Econ. 319 (1996). What these articles have

238 the journal of law and economics
technique, each of these papers addresses previous empirical problems(mainly the simultaneity between deterrence and crime), and all find thatvariables associated with expected punishment are more significantly relatedto crime than found in the previous studies. Even though earlier work onjoblessness and crime and on wages and crime did not provide conclusiveevidence, recent papers have demonstrated a stronger effect of labor marketconditions on crime.8 However, whether economic conditions or deterrencemeasures have a larger impact on crime is an unresolved issue. Data limi-tations prevented most research from simultaneously controlling for the im-pact of labor market variables and deterrence measures. Microlevel data setsmay contain information on individuals’ criminal behavior and their wagesand unemployment spells, but they typically lack information on deterrencemeasures.9 Researchers who employed aggregate data sets did not alwaysinclude extensive deterrence and economic variables.10 As a result, much ofthe current inference about the relative impact of economic conditions and
in common is an attempt to address some of the empirical issues that have made identificationof the crime supply function so difficult. Two articles by Steven Levitt (Using Electoral Cyclesin Police Hiring,supra, and The Effect of Prison Population Size on Crime Rates,supra), forexample, use election- or litigation-related variables as instruments to help identify the crimesupply function. Another article by Levitt (Why Do Increased Crime Arrest Rates Appear toReduce Crime,supra) used cross-crime arrest rates to distinguish between deterrence andincapacitation effects. Corman & Mocan,supra, uses high-frequency data and modern time-series techniques to circumvent the simultaneity issue between deterrence and crime. Mocan& Gittings, supra, uses panel data that contain detailed information on death row inmates toassess the impact of executions and removals from death row on homicide. Mustard,supra,includes convictions and length of imprisonment to investigate the extent of the omitted-variablebias.
8 Examples of earlier work are Hope Corman, Theodore Joyce, & Norman Lovitch, CrimeDeterrence and the Business Cycle in New York City: A VAR Approach, 69 Rev. Econ. &Stat. 695 (1987); Richard B. Freeman, Crime and Unemployment, in Crime and Public Policy89 (James Q. Wilson ed. 1983); Richard B. Freeman, The Labor Market, in Crime 171 (JamesQ. Wilson & Joan Petersilia eds. 1995). Examples of more recent work are Eric D. Gould,Bruce A. Weinberg, & David B. Mustard, Crime Rates and Local Labor Market Opportunitiesin the United States: 1979–1997, 84 Rev. Econ. & Stat. 45 (2002); Steven Raphael & RudolfWinter-Ebmer, Identifying the Effect of Unemployment on Crime, 44 J. Law & Econ. 259(2001); Richard B. Freeman & William M. Rodgers III, Area Economic Conditions and theLabor Market Outcomes of Young Men in the 1990s Expansion, in Prosperity for All? TheEconomic Boom and African Americans 50 (Robert Cherry & William M. Rodgers III eds.2000); and Jeff Grogger, Market Wages and Youth Crime, 16 J. Lab. Econ. 756 (1998).
9 For example, Grogger,supra note 8, investigated the impact of wages on youth crime, butthe National Longitudinal Survey of Youth data used did not include measures of sanctions.Masanori Hashimoto, The Minimum Wage Law and Youth Crimes: Time-Series Evidence, 30J. Law & Econ. 443 (1987), used arrests as a proxy for crime and investigated the effect ofminimum wages on youth crime with no controls for deterrence.
10 For example, in its investigation of the effect of unemployment on crime, Raphael &Winter-Ebmer,supra note 8, included only state prison population as a control. Gould, Wein-berg, & Mustard,supra note 8, focuses on the effect of local labor market conditions on crime,adding county arrest rates and state-level per capita police spending and police employmentin county-level crime regressions in one of the specifications but excluding them from theanalysis in other models.

carrots, sticks, and broken windows 239
sanctions relies on information obtained from multiple papers that use dif-ferent data sets and employ different empirical methods.11
B. The Broken-Windows Theory
We measure the extent of broken-windows policing by using misdemeanorarrests as a measure of police signaling in a model that controls for thenumber of police as well as felony arrests.12 This implementation is consistentwith how Giuliani and Police Commissioner William Bratton interpreted thebroken-windows hypothesis and with the way the NYC police administeredit. For example, in his account of the implementation of the broken-windowspolicing, Bratton wrote that following the increase in arrests for misdemeanoroffenses such as disorderly conduct, public drunkenness, and damaging prop-erty, “the word would get out” regarding the increased police vigilance tochange the behavior of individuals.13 Similarly, Bratton wrote that crime anddisorder in New York subways went down following a significant increasein the arrests of fare beaters. He indicated that “crime, disorder, and fareevasion began to go down. . . . All from arrestingpeople for a buck-fifteencrime. We were proving the Broken Windows theory.”14
11 See Richard B. Freeman, The Economics of Crime, in 3C Handbook of Labor Economics3529 (Orley Ashenfelter & David Card eds. 1999), for a recent summary.
12 The small number of empirical studies that investigate the impact of aggressive policingon felony crime do not shed substantial light on the issue because of their empirical short-comings. In addition to standard identification difficulties, these papers suffer from potentialomitted-variable biases. This is because they include a measure of police aggressiveness inthe model without controlling for other deterrence measures. Robert J. Sampson & JacquelineCohen, Deterrent Effects of the Police on Crime: A Replication and Theoretical Extension, 22Law & Soc’y Rev. 163 (1988), investigated the effects of “aggressive” policing on serious-crime rates, where police aggressiveness is measured as the sum of the number of arrests fordisorderly conduct and driving while intoxicated per police officer. Using a cross-sectionaldata set of 156 cities, in a model that did not control for felony arrests, the study reported aninverse relationship between police aggressiveness and the robbery crime rate. David Giacopassi& David R. Forde, Broken Windows, Crumpled Fenders, and Crime, 28 J. Crim. Just. 397(2000), tests the broken-windows hypothesis using motor vehicle fatality rates as a measureof social disorder. In a cross section of two time periods, the study finds that traffic fatalitiesare significantly related to homicides after controlling for the number of police (but not thehomicide arrest rate) and population and concludes that social disorder, captured by motorvehicle fatalities, causes homicide. George L. Kelling & William H. Sousa, Jr., Do PoliceMatter? An Analysis of the Impact of New York City’s Police Reforms (Civic Rep. No. 22,Manhattan Inst. 2001), examines the effect of misdemeanor arrests on police precincts for 2years in NYC and concludes that broken-windows policing works. In the study, however, bothfelony arrests and the size of the police force are omitted from the analysis, and number ofmisdemeanor arrests is the only criminal-justice-related variable.
13 William Bratton & Peter Knobler, Turnaround: How America’s Top Cop Reversed theCrime Epidemic 229 (1998).
14 Id. at 156. Increased misdemeanor arrests may reduce felony crimes by incapacitatingindividuals who would have committed those crimes. We document later in the paper thatincapacitation is not a plausible explanation for a negative relationship between misdemeanorarrests and felony crimes.

240 the journal of law and economics
III. Empirical Model
We estimate crime equations of the following form:
CR p l � Sa CR � Sd ARR � SF POLit i ij i,t�j ik i,t�k ip t�p
� Sh MISARR � Sp PRIS � Sb UR (1)im t�m in t�n iq t�q
� Sg RMINW � Sm TEENS � SJ SEAS � � ,ir t�r t�s t�s iw w it
where CRi,t stands forith crime in montht ( , murder; , burglary,i p 1 i p 2and so on). The two variables that capture economic conditions in NYC arethe NYC unemployment rate (UR) and the real minimum wage (RMINW).The arrest rate (arrests per crime) is a standard measure of deterrence. How-ever, it is well known that the use of arrest rate as an explanatory variablecreates biased estimates. This is because crime, which is the dependent var-iable, appears in the denominator of the arrest rate as an explanatory variable.Potential solutions are to deflate arrests by population or to substantially lagthe arrest rate.15 In our case, none of these strategies are feasible becausepopulation figures are available only at census dates and in any case changelittle from month to month. Furthermore, it is unclear exactly how many lagsto impose with the high-frequency data we employ.16 Therefore, we use arrests(ARR) as an explanatory variable as we have done elsewhere17 but convertthe estimated arrest elasticity of crime to the arrest rate elasticity of crime.
The term PRIS stands for the number of NYC residents incarcerated instate correctional facilities. The term POL is the size of the NYC policeforce. Adding police to the model in addition to felony and misdemeanorarrests allows us to investigate whether police presence has an additionaleffect on crime, after controlling for police actions. The term MISARR standsfor the number of misdemeanor arrests. If the broken-windows hypothesishas merit, then after controlling for economic conditions and deterrencemeasures (including crime-specific arrests), an increase in misdemeanor ar-rests should have a negative effect on crime.
To control for the impact of changing demographics on crime, we includethe number of 14–17-year-olds in NYC (TEENS). The term SEAS representsa vector of 11 monthly dichotomous variables to control for the impact ofseasonality on crime.
The use of monthly data allows us to address the simultaneity between
15 Levitt, Why Do Increased Crime Arrest Rates Appear to Reduce Crime,supra note 7;Mustard,supra note 7.
16 In models that use panel data with annual frequency, the arrest rate is typically lagged 1year (Mustard,supra note 7; Mocan & Gittings,supra note 7; Levitt, Why Do Increased CrimeArrest Rates Appear to Reduce Crime,supra note 7).
17 Corman & Mocan,supra note 7.

carrots, sticks, and broken windows 241
crime and deterrence. As in our earlier work18 in equation (1), , ,j ≥ 1 k ≥ 1, . Put differently, it is postulated that the number of crimes com-m ≥ 1 n ≥ 1
mitted in montht depends on the past dynamics of the same criminal activity(represented byj), the past number of arrests for that crime (k), and the pastnumber of misdemeanor arrests (m) and incarcerations (n). These variablesare lagged 1 month to avoid reverse causality from crime. On the other hand,
, , , ; that is, the contemporaneous values for the un-q ≥ 0 r ≥ 0 p ≥ 0 s ≥ 0employment rate (when ), the minimum wage (r), and the numberq p 0teens (s) and police (p) are included. This means that variations in crimecannot affect the current values of these variables. This is obvious for monthlydata regarding economic and demographic variables, and it also applies tothe number of police, because as we have explained elsewhere,19 it takes atleast 6 months to increase the size of the police force. Thus, an increase incrime in a given month cannot generate an increase in the police force inthe same month.20
IV. Data
The data are compiled from a number of different sources. Crime andarrest data were obtained from the Crime Analysis Unit of the NYC PoliceDepartment. Monthly crime data are available for seven Federal Bureau ofInvestigation index crimes: murder, assault, robbery, burglary, motor vehicletheft, grand larceny, and rape.21 Crimes are measured as reported complaints.22
Because data on prison population and the number of 14–17-year-olds areavailable starting in 1974, empirical analyses are conducted for the period1974–99. Figure 1 displays the trends for the sum of all seven crimes in
18 Id.19 Id.20 If an increase in arrests in a given month influences crimes in that same month through
the incapacitation effect, lagging arrests by 1 month would be a specification error. However,Steven D. Levitt, Juvenile Crime and Punishment, 106 J. Pol. Econ. 1156 (1998), and Corman& Mocan, supra note 7, demonstrated that the incapacitation effect is insignificant.
21 The nominal value of a grand-larceny crime was increased from $250 to $1,000 in No-vember 1986. This resulted in a decrease in reported grand larcenies and recorded grand-larceny arrests. To create consistency between pre– and post–November 1986 grand-larcenyfigures, we ran grand-larceny crime and arrest regressions on time dummies and a structuralchange dummy. The estimated coefficient of the dummy was added to the post–November1986 series. The reporting rate for rape has fluctuated significantly between 1980 and 1999(U.S. Department of Justice, Bureau of Justice Statistics, Criminal Victimization in the UnitedStates (1982–2000)). If the same pattern holds in NYC, this would induce measurement errorin reported rape cases, adding noise to the values of the dependent variable. Thus, rape resultsmust be interpreted with caution.
22 The census estimates for NYC population are 7.9 million in 1970, 7.1 million in 1980,7.3 million in 1990, and 8 million in 2000. Thus, on the basis of census data, NYC populationwas fairly stable during the study period. Because neither monthly nor annual populationinformation is available, interpolation of monthly population values from 4 census years wouldnot be sensible. For this reason, and because the size of the population was rather stable, wedid not deflate crimes by population.

Figure 1.—Total felony crimes, New York City

carrots, sticks, and broken windows 243
NYC during this time period and demonstrates that the total number of crimesdeclined substantially, reaching its minimum in 1999.23 Later in the paperwe investigate the extent to which our models explain the decline in crimebetween 1990 and 1999. Figure 2 displays the total number of felony arrestsand total misdemeanor arrests. The total number of felony arrests exhibits aslight decline between 1990 and 1999, which is not surprising because crimedeclined during the same period. Arrest rates (arrests per crime) increaseover the same time period because the percentage decrease in arrests is smallerthan the percentage decrease in crime.24
We include misdemeanor arrests in the analysis to capture the changingnature of policing policies during the 1990s, which is related to the broken-windows hypothesis. Misdemeanor arrests are arrests made for crimes suchas petty larceny, assault in the third degree, prostitution, criminal mischief,and theft of services. Figure 2 shows that the number of misdemeanor arrestsincreased somewhat in the early 1980s and then experienced a large, sustainedincrease around 1994.
It is difficult to find a single, consistent measure of the overall economichealth of NYC and its residents. We use the unemployment rate and the realminimum wage as measures of economic conditions facing potential crim-inals in NYC. Each of these indicators measures a different aspect of theeconomy; therefore, each has a different pattern over the 3 decades. The rateof unemployment among young men or among low-skilled and less educatedworkers should be more closely linked to crime than overall unemployment.However, such more refined measures are not available.25 Figure 3 presentsthe real minimum wage in NYC, computed as the New York State or federal(whichever was higher) minimum wage and adjusted for inflation using theNYC Consumer Price Index (base years, 1982–84).26 After an erosion in thevalue of the minimum wage in 1980s, there were two nominal wage increasesin 1990 and 1991, and two other increases were implemented in 1996 and1997. Overall, the real minimum wage remained rather stable during the1990s. Figure 4 displays the city’s unemployment rate, which was in double-digit levels for sustained periods during both the mid-1970s and the early
23 The behavior of each individual crime is similar to the trend shown in Figure 1. Time-series graphs of individual crimes can be seen in Hope Corman & Naci Mocan, Carrots, Sticksand Broken Windows (Working Paper No. 9061, Nat’l Bur. Econ. Res., July 2002).
24 The arrest rates of individual crimes are presented inid.25 In Section VI, we report results from models in which the total number of recipients of
public assistance is used instead of the unemployment rate.26 Minimum wage data were obtained from the State of New York Department of Labor,
Division of Research and Statistics (personal correspondence, October 9, 2001). The ConsumerPrice Index represents prices for all urban consumers (CPI-U) for the New York–NorthernNew Jersey metropolitan area and were obtained from the Middle Atlantic Regional Office ofthe Bureau of Labor Statistics (personal correspondence, September 6, 2001).

244
Figure 2.—Total felony and misdemeanor arrests, New York City
245
Figure 3.—Real minimum wage, New York City (base years, 1982–84)

Figure 4.—Unemployment rate, New York City

carrots, sticks, and broken windows 247
1990s. According to the unemployment rate, economic conditions were worsetoward the early to mid-1990s and improved in the latter half of that decade.27
Figure 5 presents the number of uniformed officers at all ranks, measuredon the left vertical axis. In April 1995, the Transit Police were merged withthe New York Police Department, and in May, the Housing Police wereadded. To account for this merger, and to have a consistent series, we sub-tracted the number of Transit and Housing Police from the total number ofofficers after April 1995.28 The size of the police force varied considerablyover the 3 decades under consideration. In 1970, there were around 32,000uniformed officers in the New York Police Department. In conjunction withNYC’s 1970s fiscal crisis, the number of officers fell dramatically between1970 and 1980, attaining an annual low point in 1980—a decrease of almost30 percent. Since 1980, the overall trend has been one of growth in thenumber of officers, ending in 1999 with almost 35,000. This represents aquite modest change from the level in early 1970s, but it is a dramatic (morethan 50 percent) increase from the lowest level in 1980.
Data sources allow an annual count of prison inmates from NYC who arein state correctional facilities from December 1974 through December 1988.We interpolated the monthly figures from the annual ones up to January1988, when prison population data began to be recorded monthly. As Figure5 demonstrates, the prison population from NYC grew through most of thesample period and then leveled off during the last half of the 1990s.29
Consideration of the population’s demographic composition is important;however, most demographic data rely on the decennial censuses, with yearlyvalues interpolated in between. Rather than use census-based data, we proxythe number of teens by the total number of students entering ninth grade inthe current and previous 3 years for both public and private schools in NYC.30
Because we have only September counts for each year, we used the Hodrick-Prescott filter to obtain the trend of the data (Figure 6), which is employed
27 These data represent seasonally unadjusted unemployment rates for NYC and were ob-tained from the Middle Atlantic Regional Office of the U.S. Bureau of Labor Statistics (personalcorrespondence, September 6, 2001).
28 We have subtracted rather than added because we were not able to obtain separate Transitand Housing Police numbers beginning in January 1970. Police data were obtained from theOffice of Management and Planning at the New York City Police Department.
29 Prison population data were obtained from the Independent Budget Office of New YorkCity.
30 Data on arrests from the New York State Division of Criminal Justice Services are con-sistent with the observation that teens generally commit more crimes than young or olderadults. In 1999, arrest rates for index crimes in New York State per 100 teens aged 16 and 17were 3.15–16 percent higher than arrest rates for youth aged 18–20 and were 60 percent higherthan arrest rates for adults aged 21–22. (Population data were derived from the 2000 census.)Similarly, in 2001, teens aged 15–17 composed 16.5 percent of the arrestees for felony indexcrimes in the United States (U.S. Department of Justice, Bureau of Justice Statistics, Sourcebookof Criminal Justice Statistics, 2001 (2002) (http://www.albany.edu/sourcebook/)), while ac-cording to the 2000 census, this age group composed only 4 percent of the U.S. population.

248
Figure 5.—Number of police officers and number of New York City residents in state prisons

249
Figure 6.—Actual and smoothed values of number of youths aged 14–17, New York City

250 the journal of law and economics
TABLE 1
Descriptive Statistics, December 1974–December 1999
Variable Mean Standard Deviation
Arrests:Total misdemeanor 11,149.33 4,131.30Motor vehicle 742.10 281.31Burglary 1,116.04 445.09Grand larceny 1,124.64 221.19Assault 1,534.62 302.70Murder 95.87 19.42Rape 120.73 25.78Robbery 1,851.90 329.35
Incidence of crime:Motor vehicle theft 7,790.27 2,357.92Burglary 10,697.71 4,130.67Grand larceny 13,172.66 2,960.88Assault 2,777.89 703.37Murder 130.69 40.26Rape 268.74 67.83Robbery 6,554.41 1,663.83
Number of police officers 27,426.92 3,612.21Number of prisoners from NYC 29,708.17 13,406.24NYC unemployment rate 8.59 1.61Youth population 486,920.74 30,923.23Real minimum wage ($) 3.05 .47
Note.—NYC p New York City.
in empirical analysis.31 Table 1 presents the descriptive statistics of the var-iables over the sample period.
V. Empirical Implementation
Estimated Effects
Following our earlier work and the literature cited there, we applied unitroot tests to investigate the trend behavior of the variables using standardaugmented Dickey-Fuller tests.32 The results provide evidence for unit roots(stochastic trends) in all variables except for prison population and teen
31 We used the Hodrick-Prescott filter (Robert J. Hodrick & Edward C. Prescott, PostwarU.S. Business Cycles: An Empirical Investigation, 29 J. Money Credit & Banking 1 (1997))to obtain the slowly evolving trend component. In this procedure, the trend component in thevariable under investigation,G, is obtained by solving the following convex minimizationproblem: , whereX is the variable of interest andT 2 T 2minS (X � G ) � lS (X � 2G � G )tp1 t t tp1 t t�1 t�2
l is the weight on the squared second difference of the growth component, which penalizesacceleration in the trend. Following previous examples (for example, Keith Blackburn & MortenO. Ravn, Business Cycles in the United Kingdom: Facts and Fictions, 59 Economica 383(1992); and H. Naci Mocan, Structural Unemployment, Cyclical Unemployment, and IncomeInequality, 81 Rev. Econ. & Stat. 122 (1999)),l is set to 1,600, but the decomposition wasnot sensitive to the variations in the value ofl.
32 Corman & Mocan,supra note 7; Mocan,supra note 31.

carrots, sticks, and broken windows 251
population. This means that the proper specification of equation (1) shouldinvolve regressing the first difference of the crime variables on the firstdifference of the right-hand-side variables with unit roots and should notinclude a time trend as a regressor.33 Cointegration tests suggest that thereis evidence of cointegration between the crime and the right-hand-side var-iables in all cases, indicating that the estimated regressions should includean error correction term. This means that even though crime and its deter-minants are governed by random trends, there exists an equilibrium rela-tionship between them, which keeps them together in the long run. The laglength of each variable is determined by the Akaike Information Criterion(AIC). The natural logarithms of the variables are taken before differencing,and estimations are carried out using a heteroskedasticity and serial corre-lation robust covariance matrix with serial correlation up to lag 24.
Table 2 displays a summary of the results of the estimation of equation(1) for the seven different crimes. It reports summed coefficients and standarderrors.34 The sum of the coefficients represents the long-run impact of theexplanatory variables on crime. The numbers in parentheses after the vari-ables represent the range of the lag length. For example, “Arrests (1–5)” inthe murder regression indicates that murders are influenced by five past valuesof murder arrests as determined by the AIC. The sensitivity of the results toalternative lag lengths is discussed below. Because the prison populationvariable was measured beginning in December 1974, regressions span fromDecember 1974 through December 1999.
As Table 2 demonstrates, felony arrests have a negative and statisticallysignificant impact on all seven index crimes analyzed. An increase in prisoninmates from NYC has a negative effect on all crimes but assault and rape.When other measures of deterrence are controlled for, the size of the policeforce has an effect only on motor vehicle theft and grand larceny.
Misdemeanor arrests have a significant negative effect on robbery, motorvehicle theft, and grand larceny. This indicates that, holding constant theirown arrests, the size of the police force, and the prison population, the growthrates in robberies, motor vehicle thefts, and grand larcenies decline as thegrowth rate of misdemeanor arrests increases. This result provides supportfor the broken-windows hypothesis in the case of these three crimes.
It can be argued that the effect of misdemeanor arrests on robbery, motorvehicle theft, and grand larceny is observed because of an incapacitationeffect. However, there is evidence that, for most misdemeanor arrests, in-carcerations occur in a small minority of cases and tend to be short term.James Nelson studied misdemeanor arrests occurring in New York State
33 The teen population variable and the prison variable do not contain unit roots, and thereforethese variables enter the models in levels rather than first differences.
34 Because the summed coefficients of teen population were never significant, they are notreported in Table 2.

TABLE 2
Results of the Estimation of Equation (1): Sum of Coefficients
Crime CoefficientStandard
Error
Murder:Arrests (1–5) �.668** .226Police (0–2) �.508 1.035Total misdemeanor arrests (1–5) �.618 .405Number of prisoners from NYC (1–8) �.075* .036NYC unemployment rate (0–3) .432 .328NYC minimum wage (0) �.660** .228
Burglary:Arrests (1–21) �.471* .199Police (0–1) �.276 .227Total misdemeanor arrests (1–2) �.054 .058Number of prisoners from NYC (1–18) �.058** .023NYC unemployment rate (0–2) .162� .083NYC minimum wage (0–2) .327 .321
Assault:Arrests (1–4) �.247* .121Police (0–1) �.031 .218Total misdemeanor arrests (1–2) .075 .090Number of prisoners from NYC (1–5) �.007 .010NYC unemployment rate(0–1) .078 .105NYC minimum wage (0–1) .181 .189
Robbery:Arrests (1–12) �1.322** .340Police (0–2) �.390 .453Total misdemeanor arrests (1–2) �.247** .050Number of prisoners from NYC (1–11) �.029* .008NYC unemployment rate (0–2) �.150 .099NYC minimum wage (0–1) �.374� .205
Motor vehicle theft:Arrests (1–14) �1.043** .250Police (0–2) �.577* .254Total misdemeanor arrests (1–2) �.157* .065Number of prisoners from NYC (1–8) �.028** .008NYC unemployment rate (0) .124* .041NYC minimum wage (0–2) �.267 .359
Grand larceny:Arrests (1–2) �.107** .035Police (0–1) �.673** .247Total misdemeanor arrests (1) �.049** .019Number of prisoners from NYC (1–4) �.020* .010NYC unemployment rate (0–4) �.022 .083NYC minimum wage (0–1) �.401� .216
Rape:Arrests (1–4) �.425* .193Police (0–1) �.133 .525Total misdemeanor arrests (1–3) �.052 .201

carrots, sticks, and broken windows 253
TABLE 2 (Continued )
Crime CoefficientStandard
Error
Number of prisoners from NYC (1) �.029 .019NYC unemployment rate (0) �.068 .138NYC minimum wage (0–2) �.144 .222
Note.—Results presented are the sum of the effect of lagged (and, in some cases, current) valuesof the variables listed on the number of each type of felony crime. The numbers in parenthesesnext to each variable represent the number of current (0) and lagged (1 or more) values in theregressions. Also included in the regressions were teen population and monthly dummies. For allvariables except teens and prison population, variables are employed in first differences. NYCpNew York City.
� Significant at the 10% level.* Significant at the 5% level.** Significant at the 1% level.
between January 1, 1985, and December 31, 1986.35 During this period, thetotal number of misdemeanor arrests for the largest four counties in NYC(excluding Richmond) was 122,797. Of these arrests, 9.4 percent resulted ina conviction with a jail sentence. For those sentenced to a jail term, theaverage length of stay was 27.5 days. Thus, the expected jail sentence formisdemeanor arrest was 2.6 days.36
Some defendants who were convicted of a misdemeanor offense receiveda sentence of “time served,” meaning that they spent some time in jail priorto their conviction. Approximately 13 percent of those arrested for a mis-demeanor received a sentence of time served. The average time betweenarrest and arraignment for December of that year was slightly over 24 hours,down from the 40 hours in 1989.37 This information indicates that misde-meanor arrests result in negligible incarceration effects for most offenders.Therefore, it is unlikely that the effect of misdemeanor arrests on robbery,motor vehicle theft, and grand larceny is due to incapacitation.
Increases in the real minimum wage are found to significantly reduce
35 James F. Nelson, Racial and Ethnic Disparities in Processing Persons Arrested for Mis-demeanor Crimes: New York State, 1985–1986 (1991), examined the first arrest during theperiod for any individual and only lower-court processing, since almost all persons arrestedfor misdemeanor charges were disposed in the lower courts. The study excluded prostitutionand driving-while-intoxicated arrests. There is specific information for four of the five NYCcounties: New York, Kings (Brooklyn), Queens, and the Bronx. Richmond (Staten Island) isnot reported as a separate county and is therefore excluded from these results.
36 Note that this number will be considerably lower than the expected incarceration for thoseconvicted of a misdemeanor or the expected incarceration for those in jail. This is becausemany individuals arrested for more serious (felony) crimes are convicted of lesser offensesand/or are sentenced to jail terms (rather than prison). In a study of felony-case processing inNew York between 1990 and 1992, James F. Nelson, Disparities in Processing Felony Arrestsin New York State, 1990–1992 (1995), found that individuals convicted of a felony were morelikely to be sent to jail than to prison, and about 40 percent of those who were arrested for afelony and were convicted had been convicted of (most likely plea bargained) a misdemeanoroffense.
37 Michael Cooper, You’re under Arrest, N.Y. Times, December 1, 1996, sec. 13, at 1.

254 the journal of law and economics
robberies, murders, and grand larcenies, and higher unemployment is sig-nificantly related to increased burglaries and motor vehicle thefts. Thus,although it is not always the same economic indicator, there is evidence thateconomic conditions affect all felony crimes except assault and rape.38
The lack of very robust evidence on the effect of economic conditions oncrime is well documented in the literature.39 As summarized by RichardFreeman, this could be because although potential criminals may be respon-sive to their own unemployment or wage prospects, these prospects may beonly weakly linked to measures of aggregate unemployment rate and wages.40
Furthermore, the phenomenon of joint participation in legal and criminalactivities, especially for younger individuals, is well documented.41 Becausecrime and legal work are not exclusive activities, the elasticity of the supplyof crime is expected to be high, which in turn suggests that it would takesubstantial swings in the unemployment rate and wages to register significantchanges in criminal activity.42
B. Magnitudes
To assess the magnitudes of the effects of each variable on crime, we usedthe sum of the coefficients reported in Table 2 and calculated the elasticitiesof own felony arrest rates, misdemeanor arrest rates, prison population, un-employment rate, and real minimum wage. The calculated elasticities arereported in Table 3. Note that we have converted the results from numberof felony arrests to the felony arrest rate to allow our results to be comparedwith similar elasticity estimates.43
Table 3 includes elasticities only for statistically significant variables. Thefirst row in each column reports the elasticity calculated using a zero-growthsteady-state scenario for the variables in the system. The elasticities reportedin the second row are calculated using the average of the year-to-year growthrates of the explanatory variables. Table 3 demonstrates, for example, that a10 percent increase in the murder arrest rate generates about a 4 percent
38 Although the estimated models include a large number of deterrence variables, there areother potentially important variables, such as conviction rates, which are not included. Mustard,supra note 7, shows that conviction rates are negatively correlated with arrest rates, whichsuggests that the true effect of the arrest rates may be larger than reported here.
39 Freeman, Labor Market,supra note 8.40 Freeman, Crime and Unemployment,supra note 8.41 Grogger,supra note 8; Richard B. Freeman, Why Do So Many Young American Men
Commit Crimes and What Might We Do About It? 10 J. Econ. Persp. 25 (1996).42 Freeman,supra note 11.43 We calculate the elasticity of crime with respect to the arrest rate as follows: ARRTp
, where ARRT is the arrest rate, AR is the number of arrests, and CR is crime. ThatAR/CRmeans that and .ln(ARRT) p ln(AR) � ln(CR) �ln(ARRT)/�ln(CR)p �ln(AR)/�ln(CR)� 1Let E denote the elasticity of crime with respect to its own arrest rate, and letK represent theelasticity of crime with respect to arrests. Then .E p K/(1� K)

carrots, sticks, and broken windows 255
TABLE 3
Elasticity of Crime Estimates
Explanatory Variable Murder Assault Burglary Robbery
MotorVehicleTheft
GrandLarceny Rape
(Own) felony arrest rate �.40 �.20 �.32 �.57 �.51 �.14 �.32�.39 �.24 �.27 �.59 �.50 �.10 �.30
Total misdemeanor arrests �.25 �.16 �.06�.32 �.21 �.05
Number of police officers �.56 �.67�.59 �.70
NYC unemployment rate .16 .13.19 .16
Real minimum wage �.69 �.37 �.40�.63 �.34 �.36
Number of prisonersfrom NYC �.08 �.06 �.03 �.03 �.02
Note.—Elasticity estimates are calculated only for significant variables. The top estimate uses a zero-growth steady-state scenario, and the bottom estimate is calculated using the average of the year-to-year growth rate of the explanatory variable. NYCp New York City.
reduction in murders, and a 10 percent increase in the real minimum wageresults in a 6.3–6.9 percent decrease in murders.
Robberies and motor vehicle theft rates are more responsive than othercrimes to changes in their own arrest rates. Also, robberies and motor vehicletheft rates are affected more significantly by misdemeanor arrests than isgrand larceny, another crime affected by misdemeanor arrests. A 10 percentincrease in misdemeanor arrests generates a 1.6–2.1 percent decline in motorvehicle theft, a 2.5–3.2 percent decline in robbery, and a .5–.6 percent declinein grand larceny.44
The average unemployment rate between 1974 and 1999 was 8 percentin NYC. Using the unemployment rate elasticities reported in Table 3, wesee that a 1-percentage-point decline in the unemployment rate (a 12.5 percentdecline) generates about a 2.2 percent decline in burglaries and 1.8 percentdecline in motor vehicle thefts. These magnitudes are remarkably similar tothose reported in previous research.45
The mean values for felony arrest rates are 65.6 percent for murder, 56percent for assault, 9.5 percent for burglary, 24.2 percent for robbery, 8.6percent for motor vehicle theft, 8.3 percent for grand larceny, and 44.8 percentfor rape. Thus, a 1-percentage-point increase in each arrest rate would gen-erate the following declines: .6 percent decline in murder, .4 percent declinein assault, 3.1 percent decline in burglary, 2.4 percent decline in robbery,
44 These results underscore the fact that robbery is affected more strongly than any othercrime category. Studies that infer the effects of misdemeanor arrests on all crimes on the basisof the results for robberies will, most likely, overstate the effects of broken-windows policing.
45 Gould, Weinberg, & Mustard,supra note 8; Freeman & Rodgers,supra note 8.

256 the journal of law and economics
5.9 percent decline in motor vehicle theft, 1 percent decline in grand larceny,and .7 percent decline in rape.
Although prison population is statistically significantly related to five ofthe crimes, the magnitudes of the elasticities are low, ranging from�.02 to�.08. Thomas Marvell and Carlisle Moody report similarly low incapaci-tation elasticities for violent crimes; their elasticity for all index crimes is�.16.46 Levitt estimates larger incapacitation elasticities, although John Do-nohue and Peter Siegelman argue that these elasticities may be too high.47
VI. Interpretation and Sensitivity Analysis
A. Shifts in Police Productivity and/or Morale
In our empirical specification, consistent with the rhetoric of the Giulianiadministration, we used misdemeanor arrests as a measure of broken-windows policing. It can, however, be argued that pursuing low-level crimes(increased misdemeanor arrests) has an effect on more serious crimes, notbecause of a signaling effect as claimed by the broken-windows hypothesis,but because it captures some other influence. For example, it may be thecase that police morale increased after Giuliani became mayor in January1994. If improved morale makes police more vigilant against misdemeanorsas well as serious crimes, the observed relationship between misdemeanorarrests and felony crimes may not imply a signaling-related broken-windowseffect. Rather, in this scenario, misdemeanor arrest would act as a proxy forpolice morale. Along the same lines, new policing procedures may haveimproved police productivity across the board.48
To entertain the possibility that improved police morale and/or productivitymay have confounded the estimated relationship between misdemeanor ar-rests and felony crimes, we reestimated the models with a dichotomousindicator variable, which takes the value of one after January 1994, to capturethe time span of the Giuliani administration in the data. This Giuliani indicatorvariable was negative and statistically significant for the violent crimes of
46 Thomas B. Marvell & Carlisle E. Moody, Prison Population Growth and Crime Reduction,10 J. Quantitative Criminology 109 (1994).
47 Levitt, Effect of Prison Population Size on Crime Rates,supra note 7; John J. DonohueIII & Peter Siegelman, Allocating Resources among Prisons and Social Programs in the Battleagainst Crime, 27 J. Legal Stud. 1 (1998).
48 One such example is the computer statistics (Compstat) process, which was implementedin 1994. Under Compstat, twice weekly meetings were held at the police headquarters, whereprecinct commanders, detective squad commanders, and other command staff analyzed district-level data on district maps regarding criminal activity ranging from shootings to car thefts andnarcotics. Precinct commanders were expected to be knowledgeable about the details of criminalactivity and police reaction and to come up with a plan to attack crime. Bratton,supra note13, at 233.

carrots, sticks, and broken windows 257
murder and robbery.49 However, adding the Giuliani indicator did not influ-ence the effect of misdemeanor arrests on robbery, motor vehicle theft, andgrand larceny reported in Table 2.50 These results suggest that although therewas a negative “Giuliani” effect on the growth rates of robbery and murder,misdemeanor arrests have an additional, separate effect on robbery, motorvehicle theft, and grand larceny. When we estimated the models using dataending in December 1993, we obtained the same significant effect of mis-demeanor arrests on robbery and motor vehicle theft, although the magnitudeof the effect was somewhat smaller in the case of motor vehicle theft.51,52
B. Lag Lengths and Incarceration Effects
The lag lengths are determined by a statistical procedure (AIC), whichsuggested short lags for misdemeanor arrests (see Table 2). However, it canbe argued that broken-windows policing would have beneficial impacts withlonger lags because it takes time for people to observe and react to signals.Furthermore, the theoretical discussion in Section I suggests path dependencein the behavior of breaking windows, which would again imply that longerlags would be important. Similarly, if low-level policing builds social capital,which then reduces crime, one would expect an impact on crime of broken-windows policing with a relatively longer lag. To address this issue, wereestimated the models by extending the lags of misdemeanor arrests. Spe-cifically, we estimated the model with 6, 9, 12, 15, 18, 21, 24, 27, and 30lags for misdemeanor arrests. The results are presented in Table 4, wherethe sums of the coefficients of lagged misdemeanor arrests are reported. Theeffect of misdemeanor arrests on robbery and motor vehicle theft is veryrobust. The sum of the coefficients is no longer statistically significant in thecase of grand larceny when the number of lags exceeds 9. On the other hand,misdemeanor arrests with increased lag lengths have a significant impact in
49 Specifically, the coefficient of the Giuliani indicator was estimated as�.13 ( ) inp p .00the murder regression, and it was�.02 ( ) in the robbery equation.p p .05
50 The sum of the misdemeanor arrest coefficients was�.236 ( ) in the robberyp p .00regression,�.159 ( ) for motor vehicle thefts, and�.047 ( ) for grand larceny.p p .01 p p .01
51 That is,�.106 ( ) for motor vehicle theft,�.262 ( ) for robbery, and�.040p p .07 p p .00( ) for grand larceny.p p .10
52 Steven D. Levitt, Understanding Why Crime Fell in the 1990s: Four Factors That Explainthe Decline and Six That Do Not, 18 J. Econ. Persp. 163 (2004), voiced skepticism regardingthe impact of NYC’s policing strategy on crime. Levitt asserts that crime started to declinebefore Guiliani became mayor and suggests that the increase in the size of the police forcesince the early 1990s might be primary reason for the decline in crime. Our analyses addressthese concerns. First, our results are obtained holding constant the change in the police force.Furthermore, the impact of broken-windows policies changes little when the models are es-timated with a post-Guiliani dummy or for the period before Guiliani.

258 the journal of law and economics
TABLE 4
Effect of Misdemeanor Arrests with Long Lags
Lags Murder Assault Robbery Burglary
MotorVehicleTheft
GrandLarceny Rape
6 �.845* .399 �.385� �.217 �.228 �.265� �.2549 �.915* .547* �.693** �.228 �.460* �.302* �.27312 �.937* .512* �.981** �.524* �.606 �.257 .43915 �.960* .188 �.964** �.561* �.700** �.274 .03518 �.964* .127 �.811** �.403 �.523* �.175 .07321 �1.034* �.037 �.952** �.602� �.476* �.302 .05724 �1.030* .029 �1.232** �.871* �.560* �.232 .04027 �1.010* �.084 �1.272** �.828� �.746** .034 �.28530 �1.055* .252 �1.460** �.645 �.633* �.029 .105
Note.—Values presented are the sums of the estimated coefficients of lagged misdemeanor arrests.� Significant at the 10% level.* Significant at the 5% level.** Significant at the 1% level.
the case of murder. Furthermore, in some cases burglary is also affected bymisdemeanor arrests, although the statistical significance is spotty.53
To investigate further the robustness of the results, we performed a numberof exercises. First, we subtracted drug-related misdemeanor arrests from totalmisdemeanor arrests and obtained total nondrug misdemeanor arrests. Usingthis measure of misdemeanor arrests, we obtained very similar results. Sec-ond, we replaced the unemployment rate with total number of recipients ofpublic assistance in NYC.54 The results remain unchanged, and an increasein total recipients was positively related to robberies and motor vehicle thefts.Finally, we imposed the same arbitrary lag length to each variable and triedlag lengths of 3, 6, 9, and 12. The results, which are not reported here, werereasonably consistent with those obtained from the earlier specifications.55
53 Note that the sum of the lagged coefficients reported in Table 4 represents the long-runeffect of misdemeanor arrests. Consistent with expectations, the effect of misdemeanor arrestsincreases with longer lag lengths (with the exception of assault and rape, where there is nosignificant relation to misdemeanor arrests). We also estimated these models in the pre-1994period. Because the sample is shorter, we employed up to 24 lags. Even in this case, the effectof misdemeanor arrests on robbery and to some extent on burglary and motor vehicle theftwas evident. The point estimates were reasonably similar to those reported in Table 4 for agiven lag length in the cases of robbery, motor vehicle theft, and grand larceny.
54 These numbers were obtained from the Office of Data Analysis and Research of the NewYork City Human Resources Administration. Public assistance recipients include those re-ceiving Family Assistance Program (formerly under the Aid to Families with Dependent Chil-dren program) and those receiving Safety Net Assistance (formerly under the Home Reliefprogram). Note that the welfare programs were changed by the New York State Welfare ReformAct of 1997 (1997 N.Y. Laws, ch. 436(B) (August 20, 1997)).
55 There were some interesting similarities between these results and those reported in Table4. Specifically, misdemeanor arrests had a negative and significant effect in some lag lengthspecifications for murder and burglary, which suggests that broken-windows policing may havean effect on these crimes as well.
carrots, sticks, and broken windows 259
As discussed previously, the incarceration effect for misdemeanor arrestsis small, given that time served for such arrests is short. The results in Table4 give further evidence that the incarceration effect does not drive the effectof misdemeanor arrests. This is because misdemeanor arrests have an influ-ence on both robberies and motor vehicle thefts 12–30 months later, butalmost no misdemeanor arrest results in incarceration of 1 year or more.56
VII. What Accounted for the Large Decreasesin Felony Crimes?
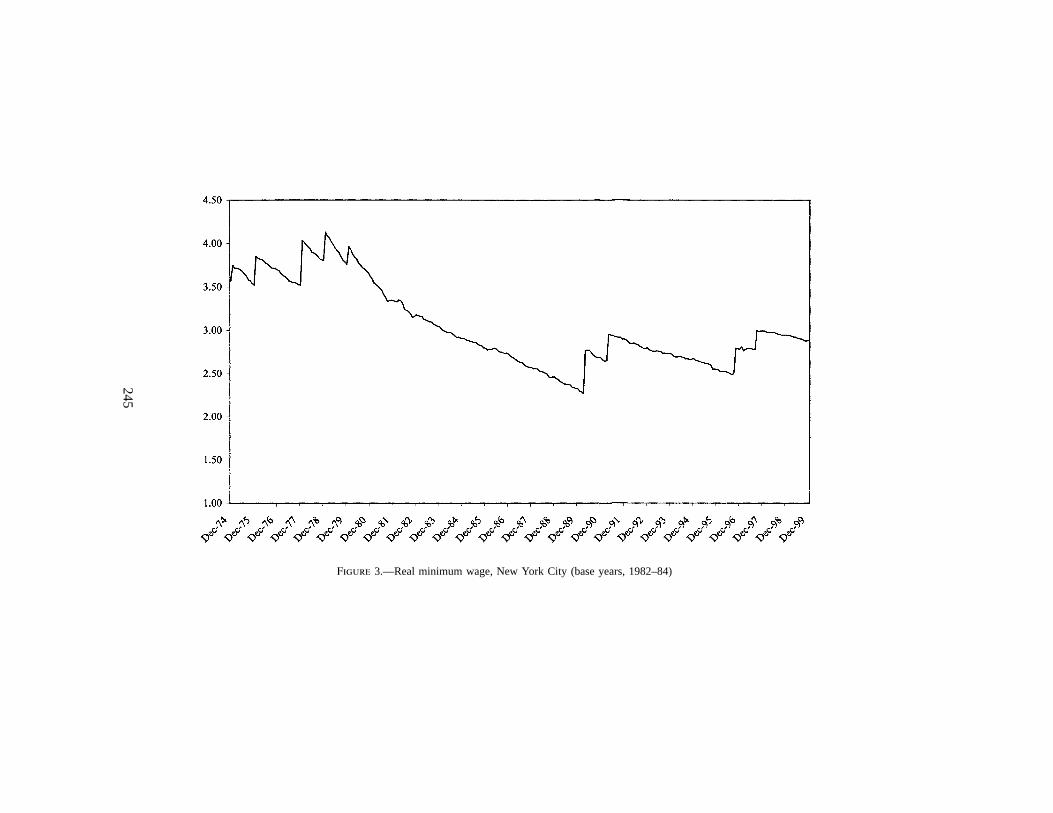
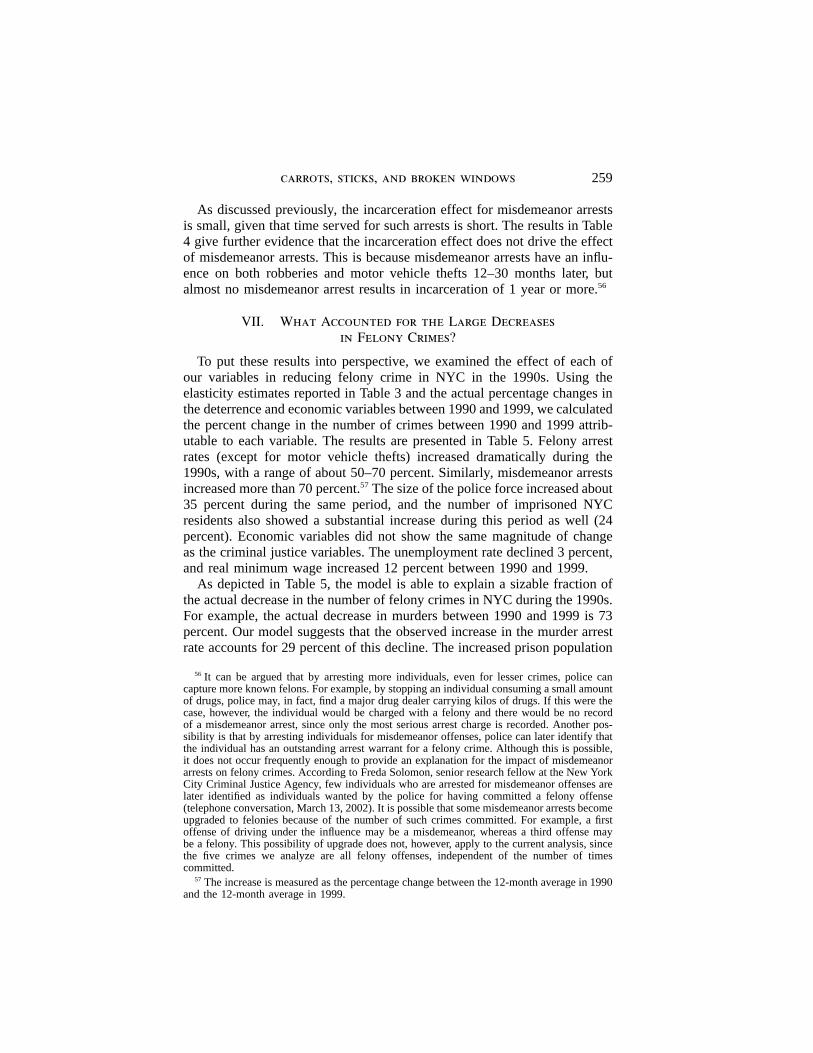
To put these results into perspective, we examined the effect of each ofour variables in reducing felony crime in NYC in the 1990s. Using theelasticity estimates reported in Table 3 and the actual percentage changes inthe deterrence and economic variables between 1990 and 1999, we calculatedthe percent change in the number of crimes between 1990 and 1999 attrib-utable to each variable. The results are presented in Table 5. Felony arrestrates (except for motor vehicle thefts) increased dramatically during the1990s, with a range of about 50–70 percent. Similarly, misdemeanor arrestsincreased more than 70 percent.57 The size of the police force increased about35 percent during the same period, and the number of imprisoned NYCresidents also showed a substantial increase during this period as well (24percent). Economic variables did not show the same magnitude of changeas the criminal justice variables. The unemployment rate declined 3 percent,and real minimum wage increased 12 percent between 1990 and 1999.
As depicted in Table 5, the model is able to explain a sizable fraction ofthe actual decrease in the number of felony crimes in NYC during the 1990s.For example, the actual decrease in murders between 1990 and 1999 is 73percent. Our model suggests that the observed increase in the murder arrestrate accounts for 29 percent of this decline. The increased prison population
56 It can be argued that by arresting more individuals, even for lesser crimes, police cancapture more known felons. For example, by stopping an individual consuming a small amountof drugs, police may, in fact, find a major drug dealer carrying kilos of drugs. If this were thecase, however, the individual would be charged with a felony and there would be no recordof a misdemeanor arrest, since only the most serious arrest charge is recorded. Another pos-sibility is that by arresting individuals for misdemeanor offenses, police can later identify thatthe individual has an outstanding arrest warrant for a felony crime. Although this is possible,it does not occur frequently enough to provide an explanation for the impact of misdemeanorarrests on felony crimes. According to Freda Solomon, senior research fellow at the New YorkCity Criminal Justice Agency, few individuals who are arrested for misdemeanor offenses arelater identified as individuals wanted by the police for having committed a felony offense(telephone conversation, March 13, 2002). It is possible that some misdemeanor arrests becomeupgraded to felonies because of the number of such crimes committed. For example, a firstoffense of driving under the influence may be a misdemeanor, whereas a third offense maybe a felony. This possibility of upgrade does not, however, apply to the current analysis, sincethe five crimes we analyze are all felony offenses, independent of the number of timescommitted.
57 The increase is measured as the percentage change between the 12-month average in 1990and the 12-month average in 1999.
TABLE 5
Contribution of Variables to the Decrease in Crime, 1990–99
Predicted Decrease in Crime due to Actual Changes in: Murder Burglary Assault
MotorVehicleTheft Robbery
GrandLarceny Rape
Felony arrest ratea 29 19 11 1 32 3 16Misdemeanor arrest rate (increased 72%) 14 21 4Number of police officers (increased 35%) 20 23Number of prisoners from NYC (increased 24%) 2 1 1 1 !.5NYC unemployment rate (decreased 3%) 1 !1Real minimum wage (increased 12%) 8 4 4Total predicted decrease in crime 39 21 11 36 58 34 16Actual decrease in crime 73 66 40 73 67 29 46Predicted decrease/actual decrease 53 32 28 49 86 117 35Contribution of economic variables (carrots) to the actual
decrease in crime 11 1.5 0 1 6 14 0Contribution of deterrence variables (sticks) to the actual
decrease in crime 42 30 27.5 49 81 103 35Share of deterrence measures in explained decrease in crime 79 95 100 98 93 88 100
Note.—Values are percentages. NYCp New York City.a Increases in annual arrest rates from 1990 to 1999 were as follows: murder, 72%; burglary, 65%; assault, 49%; robbery, 56%; motor vehicle theft, 2%; grand larceny,
23%; and rape, 52%.

carrots, sticks, and broken windows 261
accounts for 2 percent of the decline in murders, and the increase in the realminimum wage explains 8 percent of this decrease. Thus, these three factorstogether predict a 39 percent decline in murders between 1990 and 1999.The actual decline is 73 percent; thus we are able to explain 53 percent ofthe decrease in murders between 1990 and 1999 (39 percent of the observed73 percent decline). Similarly, arrests, police, prison population, and eco-nomic variables account for 86 percent of the actual decrease in robberiesand between a third and a half of the decrease in burglaries, rapes, and motorvehicle thefts.58 As Table 5 demonstrates, the primary reason for the decreasein felony crimes in the decade of the 1990s is due to felony arrests andmisdemeanor arrests. Although the size of the prison population and eco-nomic variables were found to be significant, their effect is not as large.Increased police presence accounts for 20 percent of the decline in motorvehicle thefts and 23 percent of the decline in grand larcenies but has nodirect influence on other crimes.
The reason for the weak effect of economic variables is that their elasticitiesare relatively smaller and the actual change in the unemployment and min-imum wage in the 1990s was not big enough to generate a large effect oncrime.59 For example, the minimum wage increased from an average of $2.77in 1990 to $3.09 in 1999, which is a 12 percent increase. The mean valueof real minimum wage was $3.86 in the first half of the 1970s. Had the realminimum wage been increased to that level from 1990 to 1999, its effect onthe decline in murders would have been 26 percent and its effect on thedeclines in robberies and grand larcenies would have been 14 percent and15 percent, respectively.60
VIII. Summary and Discussion
While U.S. crime rates declined in the 1990s, the reverse is true for mostEuropean Union countries.61 In both cases, scholars and policy makers tryto understand the relative importance of economics factors and deterrencemeasures on criminal activity. For example, it has been debated whether theremarkable decline in criminal activity in NYC between 1990 and 1999 is
58 The model predicts a larger decrease in grand larceny than that actually realized.59 Most accounts of drug usage in NYC indicate that the increase of cocaine-related drug
use in the early 1990s was more dramatic than the subsequent decline later in the decade, sococaine drug usage increased from 1990 to 1999. Thus, a dramatic decrease in drug usagecould not account for the decrease in crime.
60 Also, if we were to select 1994–99 as the comparison years for unemployment, theunemployment rate in NYC fell by 30 percent, and the decrease in unemployment would haveaccounted for 5–6 percent of the decrease in burglaries and motor vehicle thefts.
61 Gordon Barclay, Cynthia Tavares, & Arsalaan Siddique, International Comparisons ofCriminal Justice Statistics 1999 (2001); Christian Pfeiffer, Trends in Juvenile Violence inEuropean Countries (Nat’l Inst. Just. Res. Preview 1998); John Vinocur, Candidates Skirt Factson Crime in France, Int’l Herald Trib., April 3, 2002, at 1.

262 the journal of law and economics
attributable to improved economic conditions or to “get tough” policies.62
More specifically, Giuliani and Bratton implemented a strategy in NYC inwhich the police department aggressively pursued misdemeanor public-orderoffenses such as vandalism, public intoxication, and prostitution. Public of-ficials reiterated numerous times that increased misdemeanor arrests werebeing used as a tool for broken-windows policing.63 Consistent with thestatements of the New York Police Department and Giuliani, in this paperwe use misdemeanor arrests as a measure of broken-windows strategy andinvestigate its effect, along with those of economic conditions (carrots) andsanctions (sticks) on seven index crimes in NYC using monthly data spanning1974–99.
The unemployment rate has an effect on burglary and motor vehicle theft,while real minimum wage has an effect on murder, robbery, and grand lar-ceny. An increase in the number of NYC residents in state correctionalfacilities reduces all crimes but assault, but the magnitude of the influenceis not large.
When economic conditions and deterrence (real minimum wage, unem-ployment rate, felony arrests, prison population, and the size of the policeforce) are controlled for, misdemeanor arrests have an impact on motor ve-hicle theft, robbery, and grand larceny. A 10 percent increase in misdemeanorarrests decreases motor vehicle thefts by 1.6 to 2.1 percent, robberies by 2.5to 3.2 percent, and grand larcenies by .5 to .6 percent. We do not find strongevidence to support the contention that a broken-windows policing strategyaffects the other crimes. We present evidence that shows that the effect ofmisdemeanor arrests is not likely due to an unobserved increase in policemorale or efficiency that may have been experienced in NYC after 1993,when Giuliani became mayor.
Our models explain from about one-third to all of the observed declinein index crime in NYC between 1990 and 1999. While both economic anddeterrence variables are important in explaining the decline, the contributionof deterrence measures is larger than those of economic variables. It is im-portant to emphasize that arrests for felonies have the largest effect on felonycrimes and that the effects of broken-windows policing, although significant
62 Another potential explanation is legalized abortion. Donohue & Levitt,supra note 3, showsthat legalized abortion had an effect on crime rates with a 20-year lag. The study finds thatcrime was 15–25 percent lower in 1997 in comparison with what would have been observedhad abortion remained illegal. New York City liberalized its abortion law in July 1970. TheodoreJ. Joyce & Naci H. Mocan, The Impact of Legalized Abortion on Adolescent Childbearing inNew York City, 80 Am. J. Pub. Health 273 (1990), shows that legalization of abortion had asignificant impact on adolescent childbearing in NYC. Thus, it is likely that some of theresidual decrease in observed crime in NYC (one that is not explained by our model) isattributable to legalized abortion.
63 Bratton writes, “If you [urinated] in the street, you were going to jail. We were going tofix the broken windows and prevent anyone from breaking them again.” Bratton,supra note13, at 156.

carrots, sticks, and broken windows 263
for some crimes, are not universally significant, nor are they of great mag-nitude. To put the broken-windows hypothesis in perspective, note that othercities also experienced significant decreases in crime during the 1990s, with-out the dramatic increase in misdemeanor arrests. In California, for example,Los Angeles, San Diego, and San Francisco experienced decreases in indexcrime rates of 50 percent, 56 percent, and 41 percent, respectively, comparedwith the 58 percent decline in NYC.64 In contrast, misdemeanor arrests de-clined in the three counties containing these cities.65 According to our results,if these three California cities had increased misdemeanor arrests by 70percent, crime rates would have fallen another 10 percent (or 4–6 percentagepoints),66 making the decrease in crime more comparable to that of NYC.
One final point that needs to be considered is that significant increases inmisdemeanor arrests may be costly not only in terms of police resources butalso because of the potential social costs. For example, some analysts arguethat increased police vigilance has a dimension that negatively affects civilliberties, especially for minorities. Furthermore, given the evidence that anarrest record diminishes the future labor market potential of the arrestee,excessive misdemeanor arrests may impose additional costs on the individualand the society.
Bibliography
Baker, Stephen; Cappel, Kerry; and Carlisle, Kate. “Crime and Politics.”Business Week, March 18, 2002, p. 50.
Barclay, Gordon; Tavares, Cynthia; and Siddique, Arsalaan.InternationalComparisons of Criminal Justice Statistics 1999. London: Research De-velopment and Statistics Directorate, Home Office, 2001.
Bittermann, Jim. “Crime Tops French Election Issues.” http://www.CNN.com/, April 17, 2002.
Blackburn, Keith, and Ravn, Morten O. “Business Cycles in the UnitedKingdom: Facts and Fictions.”Economica 59 (1992): 383–401.
Bratton, William, and Knobler, Peter.Turnaround: How America’s Top CopReversed the Crime Epidemic. New York: Random House, 1998.
California Department of Justice. Division of California Justice InformationServices.Crime and Delinquency in California, 2001. Sacramento: Cal-ifornia Justice Information Services, 2002.
64 U.S. Department of Justice,supra note 1. Crime rates for all index crimes are used forpurposes of comparison.
65 California Department of Justice, Division of California Justice Information Services,Crime and Delinquency in California, 2001 (2002). We chose California for comparison becauseof the availability of misdemeanor arrest data.
66 New York City’s misdemeanor arrest rate increased by about 70 percent between 1990and 1999. A weighted average of the elasticity of crime to misdemeanor arrests for the sevencrimes (based on the number of crimes in the three California cities in 1990 and elasticityvalues from Table 2) yields a value of about�.10.

264 the journal of law and economics
Cooper, Michael. “You’re under Arrest.”New York Times, December 1, 1996,sec. 13, p. 1.
Corman, Hope; Joyce, Theodore; and Lovitch, Norman. “Crime, Deterrenceand the Business Cycle in New York City: A VAR Approach.”Review ofEconomics and Statistics 69 (1987): 695–700.
Corman, Hope, and Mocan, H. Naci. “A Time-Series Analysis of Crime,Deterrence, and Drug Abuse in New York City.”American EconomicReview 90 (2000): 584–604.
Corman, Hope, and Mocan, Naci. “Carrots, Sticks and Broken Windows.”Working Paper No. 9061. Cambridge, Mass.: National Bureau of EconomicResearch, July 2002.
Donohue, John J., III, and Levitt, Steven D. “The Impact of Legalized Abor-tion on Crime.”Quarterly Journal of Economics 116 (2001): 379–420.
Donohue, John J., III, and Siegelman, Peter. “Allocating Resources amongPrisons and Social Programs in the Battle against Crime.”Journal of LegalStudies 27 (1998): 1–43.
Freeman, Richard B. “Crime and Unemployment.” InCrime and PublicPolicy, edited by James Q. Wilson, pp. 89–106. San Francisco: ICS Press,1983.
Freeman, Richard B. “The Labor Market.” InCrime, edited by James Q.Wilson and Joan Petersilia, pp. 171–91. San Francisco: ICS Press, 1995.
Freeman, Richard B. “Why Do So Many Young American Men CommitCrimes and What Might We Do about It?”Journal of Economic Per-spectives 10 (1996): 25–42.
Freeman, Richard B. “The Economics of Crime.” InHandbook of LaborEconomics, edited by Orley Ashenfelter and David Card, pp. 3C:3529–71.Amsterdam: North-Holland, 1999.
Freeman, Richard B., and Rodgers, William M., III. “Area Economic Con-ditions and the Labor Market Outcomes of Young Men in the 1990s Ex-pansion.” InProsperity for All? The Economic Boom and African Amer-icans, edited by Robert Cherry and William M. Rodgers III, pp. 50–87.New York: Russell Sage Foundation, 2000.
Giacopassi, David, and Forde, David R. “Broken Windows, Crumpled Fend-ers, and Crime.”Journal of Criminal Justice 28 (2000): 397–405.
Gould, Eric D.; Weinberg, Bruce A.; and Mustard, David B. “Crime Ratesand Local Labor Market Opportunities in the United States: 1979–1997.”Review of Economics and Statistics 84 (2002): 45–61.
Grogger, Jeff. “Market Wages and Youth Crime.”Journal of Labor Eco-nomics 16 (1998): 756–91.
Hashimoto, Masanori. “The Minimum Wage Law and Youth Crimes: Time-Series Evidence.”Journal of Law and Economics 30 (1987): 443–64.
Hodrick, Robert J., and Prescott, Edward C. “Postwar U.S. Business Cycles:An Empirical Investigation.”Journal of Money, Credit and Banking 29(1997): 1–16.

carrots, sticks, and broken windows 265
Joyce, Theodore J., and Mocan, Naci H. “The Impact of Legalized Abortionon Adolescent Childbearing in New York City.”American Journal ofPublic Health 80 (1990): 273–78.
Kelling, George L., and Sousa, William H., Jr.Do Police Matter? An Analysisof the Impact of New York City’s Police Reforms. Civic Report No. 22.New York: Center for Civic Innovation at the Manhattan Institute, 2001.
Levitt, Steven D. “The Effect of Prison Population Size on Crime Rates:Evidence from Prison Overcrowding Litigation.”Quarterly Journal ofEconomics 111 (1996): 319–51.
Levitt, Steven D. “Using Electoral Cycles in Police Hiring to Estimate theEffect of Police on Crime.”American Economic Review 87 (1997):270–90.
Levitt, Steven D. “Juvenile Crime and Punishment.”Journal of PoliticalEconomy 106 (1998): 1156–85.
Levitt, Steven D. “Why Do Increased Crime Arrest Rates Appear to ReduceCrime: Deterrence, Incapacitation, or Measurement Error?”Economic In-quiry 36 (1998): 353–72.
Levitt, Steven D. “Understanding Why Crime Fell in the 1990s: Four FactorsThat Explain the Decline and Six That Do Not.”Journal of EconomicPerspectives 18 (2004): 163–90.
Marvell, Thomas B., and Moody, Carlisle E. “Prison Population Growth andCrime Reduction.” Journal of Quantitative Criminology 10 (1994):109–40.
Mocan, H. Naci. “Structural Unemployment, Cyclical Unemployment, andIncome Inequality.”Review of Economics and Statistics 81 (1999): 122–34.
Mocan, H. Naci, and Gittings, R. Kaj. “Getting off Death Row: CommutedSentences and the Deterrent Effect of Capital Punishment.”Journal ofLaw and Economics 46 (2003): 453–78.
Mustard, David B. “Reexamining Criminal Behavior: The Importance ofOmitted Variable Bias.”Review of Economics and Statistics 85 (2003):205–11.
Nelson, James F.Racial and Ethnic Disparities in Processing Persons Ar-rested for Misdemeanor Crimes: New York State, 1985–1986. Albany:New York State Division of Criminal Justice Services, Office of JusticeSystems Analysis, July 1991.
Nelson, James F.Disparities in Processing Felony Arrests in New YorkState, 1990–1992. Albany: New York State Division of Criminal JusticeServices, Bureau of Research and Evaluation, September 1995.
Pfeiffer, Christian. “Trends in Juvenile Violence in European Countries.”Research in Progress Seminar Series. Washington, D.C.: U.S. Departmentof Justice, Office of Justice Programs, May 1998.
Raphael, Steven, and Winter-Ebmer, Rudolf. “Identifying the Effect of Un-employment on Crime.”Journal of Law and Economics 44 (2001): 259–84.
Sampson, Robert J., and Cohen, Jacqueline. “Deterrent Effects of the Police

266 the journal of law and economics
on Crime: A Replication and Theoretical Extension.”Law and SocietyReview 22 (1988): 163–90.
U.S. Department of Justice. Bureau of Justice Statistics.Victimization in theUnited States. Washington, D.C.: Bureau of Justice Statistics, 1982–2000.
U.S. Department of Justice. Bureau of Justice Statistics.Sourcebook of Crim-inal Justice Statistics, 1991. Washington, D.C.: Bureau of Justice Statistics,1992.
U.S. Department of Justice. Bureau of Justice Statistics.Sourcebook of Crim-inal Justice Statistics, 2000. Washington, D.C.: Bureau of Justice Statistics,2001.
Vinocur, John. “Candidates Skirt Facts on Crime in France.”InternationalHerald Tribune, April 3, 2002.
Wilson, James Q., and Keeling, George L. “Broken Windows.”AtlanticMonthly, March 1982, pp. 29–38.