CAROTID ULTRASOUND - Lansing Radiology · PDF filewhich the performance of carotid ultrasound...
21
UPDATE ON ULTRASONOGRAPHY 0033-8389/01 $15.00 + .OO CAROTID ULTRASOUND Joseph F. Polak, MD, MPH This article provides an overview of carotid ultrasound. Much of diagnostic carotid ultra- sound is focused on the detection of high- grade carotid stenosis amenable to surgical intervention. This goal is achieved when the basic principles of Doppler ultrasound are followed and integrated into the imaging pro- tocol. In the first section the results of the major clinical trials that have justified the value of carotid artery surgery are reviewed. The use of carotid ultrasound and the lessons learned from these studies are discussed. The second section covers the underlying principles, strengths, and weaknesses of the Doppler methodology in the context of evaluating the severity of carotid artery stenosis. The next section reviews the use of gray- scale ultrasound imaging for evaluating ca- rotid plaque. There is increasing evidence that the texture and elements within the carotid plaque can predict future cardiovascular out- comes. Although traditionally viewed in the context of surgical intervention, these new concepts in imaging may shift therapeutic op- tions toward noninvasive therapies. The fourth section focuses on the quantita- tive evaluation of the wall thickness of the common carotid artery. This intima-media- thickness measurement is gaining increasing popularity as a technique for evaluating the effects of exposure to atherosclerotic risk fac- tors in the general population. In the final section, new methodologies that may add to the diagnostic value of carotid ultrasound are reviewed. This includes the use of three-dimensional imaging for evaluat- ing rare pathologies. In addition, the use of contrast-enhanced techniques is reviewed. Two aspects of contrast-enhanced imaging are covered: (1) following the intravenous admin- istration of ultrasound contrast agents and (2) using new ultrasound pulse sequences. CAROTID STENOSIS: WHAT IS SIGNIFICANT? Started in the late 1980s and conducted throughout the 1990s, two major carotid end- arterectomy trials have shown that surgical intervention for significant carotid artery ste- nosis offers benefits to the patient.32, These endarterectomy trials have not only given data on the value of the surgical intervention but have also standardized the technique for evaluating the severity of carotid artery steno- sis on angiography.'j2 This gold standard method of evaluating carotid stenosis, despite its limitations, serves as the common denomi- nator against which the results of carotid ar- tery Doppler ultrasound must be com- pared!, 79 Carotid Endarterectomy Trials Two large trials have been conducted in symptomatic patients: (1) the North American Symptomatic Carotid Endarterectomy Trial (NASCET) and (2) the European Carotid Sur- From the Department of Radiology, Harvard Medical School, and Department of Radiology, Brigham and Women's Hospital, Boston, Massachusetts RADIOLOGIC CLINICS OF NORTH AMERICA VOLUME 39 * NUMBER 3 MAY 2001 569
Transcript of CAROTID ULTRASOUND - Lansing Radiology · PDF filewhich the performance of carotid ultrasound...
UPDATE ON ULTRASONOGRAPHY 0033-8389/01 $15.00 + .OO
CAROTID ULTRASOUND
Joseph F. Polak, MD, MPH
This article provides an overview of carotid ultrasound. Much of diagnostic carotid ultra- sound is focused on the detection of high- grade carotid stenosis amenable to surgical intervention. This goal is achieved when the basic principles of Doppler ultrasound are followed and integrated into the imaging pro- tocol.
In the first section the results of the major clinical trials that have justified the value of carotid artery surgery are reviewed. The use of carotid ultrasound and the lessons learned from these studies are discussed. The second section covers the underlying principles, strengths, and weaknesses of the Doppler methodology in the context of evaluating the severity of carotid artery stenosis.
The next section reviews the use of gray- scale ultrasound imaging for evaluating ca- rotid plaque. There is increasing evidence that the texture and elements within the carotid plaque can predict future cardiovascular out- comes. Although traditionally viewed in the context of surgical intervention, these new concepts in imaging may shift therapeutic op- tions toward noninvasive therapies.
The fourth section focuses on the quantita- tive evaluation of the wall thickness of the common carotid artery. This intima-media- thickness measurement is gaining increasing popularity as a technique for evaluating the effects of exposure to atherosclerotic risk fac- tors in the general population.
In the final section, new methodologies that
may add to the diagnostic value of carotid ultrasound are reviewed. This includes the use of three-dimensional imaging for evaluat- ing rare pathologies. In addition, the use of contrast-enhanced techniques is reviewed. Two aspects of contrast-enhanced imaging are covered: (1) following the intravenous admin- istration of ultrasound contrast agents and (2) using new ultrasound pulse sequences.
CAROTID STENOSIS: WHAT IS SIGNIFICANT?
Started in the late 1980s and conducted throughout the 1990s, two major carotid end- arterectomy trials have shown that surgical intervention for significant carotid artery ste- nosis offers benefits to the patient.32, These endarterectomy trials have not only given data on the value of the surgical intervention but have also standardized the technique for evaluating the severity of carotid artery steno- sis on angiography.'j2 This gold standard method of evaluating carotid stenosis, despite its limitations, serves as the common denomi- nator against which the results of carotid ar- tery Doppler ultrasound must be com- pared!, 79
Carotid Endarterectomy Trials
Two large trials have been conducted in symptomatic patients: (1) the North American Symptomatic Carotid Endarterectomy Trial (NASCET) and (2) the European Carotid Sur-
From the Department of Radiology, Harvard Medical School, and Department of Radiology, Brigham and Women's Hospital, Boston, Massachusetts
RADIOLOGIC CLINICS OF NORTH AMERICA
VOLUME 39 * NUMBER 3 MAY 2001 569
570 POLAK
gery Trial (ECST). Both studies enrolled pa- tients in the late 1980s and published their preliminary results in the early 1 9 9 0 ~ . ~ ~ ,
The NASCET showed definite value for op- erative intervention for patients with stenosis of 70% diameter narrowing or more.61 The differences between the medically treated population and the surgically treated patients were so dramatic that an alert was generated in 1990 on the recommendations of the data safety monitoring board. The results of NAS- CET clearly indicated a benefit for surgical intervention when the degree of stenosis in the proximal internal carotid artery was 70% or greater. This benefit was also a function of disease severity: the more severe the stenosis, the greater the benefit of surgical intervention (Fig. 1). For example, the absolute risk reduc- tion for stroke or death at 2 years with surgi- cal intervention increased from 12 k 4.8% for stenoses between 70% and 79% to 18 k 6.2% for stenoses between 80% and 89% and then to 26 * 8.1% for stenoses between 90% and
The NASCET study used a nontraditional 99y0.~'
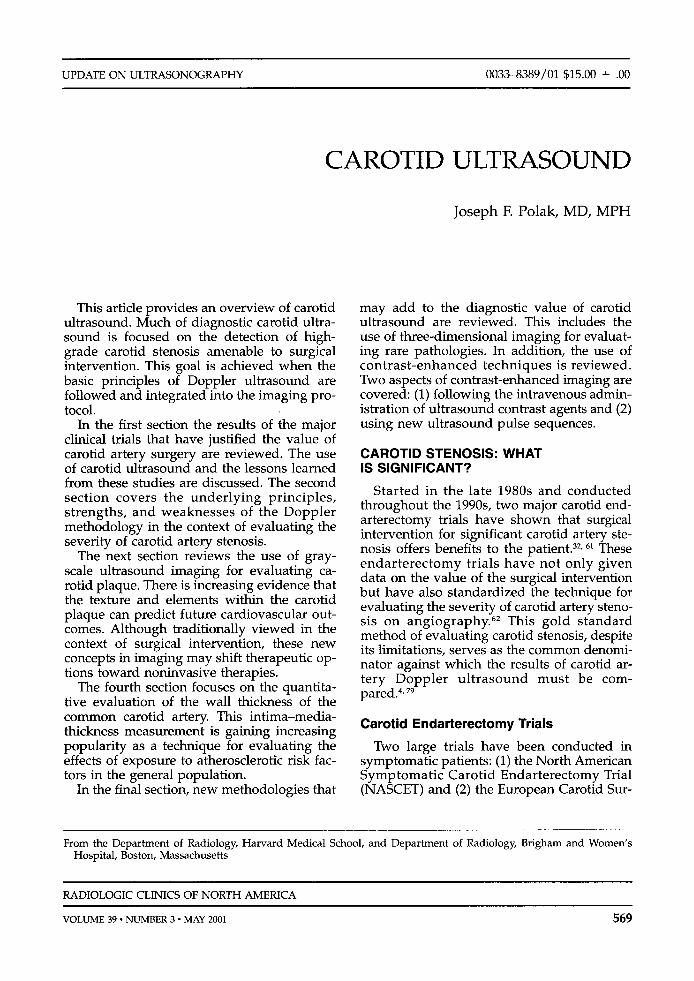
method to grade the severity of internal ca- rotid artery stenosis seen on a carotid arte- riogram. This technique for grading carotid stenosis is shown in Figure 2. In essence, the degree of residual lumen seen at the stenosis is compared with the lumen of the internal carotid artery more distally.
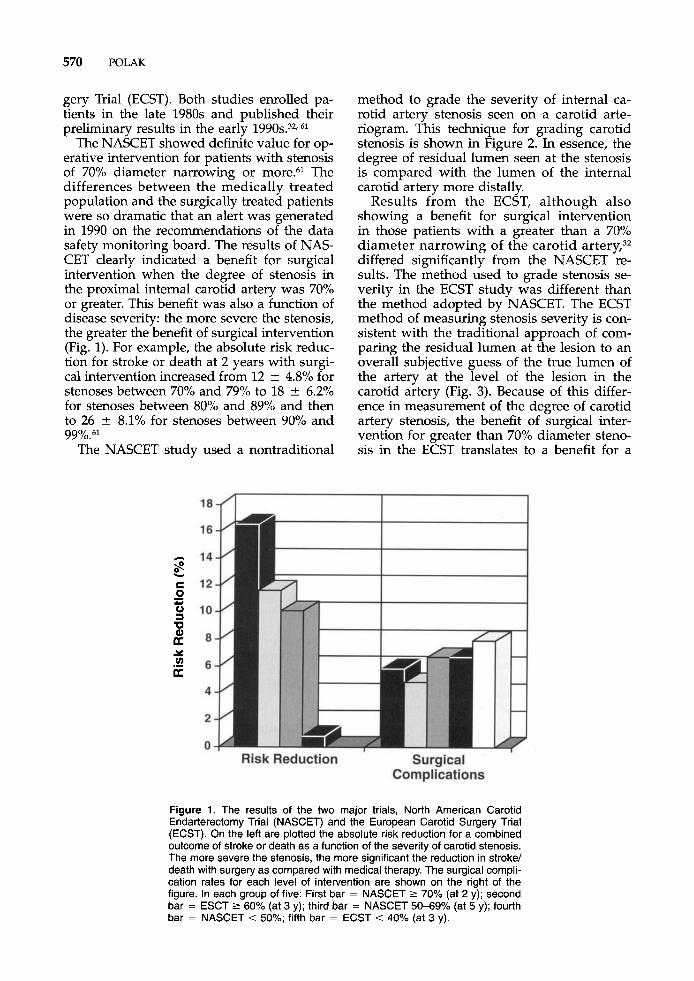
Results from the ECST, although also showing a benefit for surgical intervention in those patients with a greater than a 70% diameter narrowing of the carotid artery,32 differed significantly from the NASCET re- sults. The method used to grade stenosis se- verity in the ECST study was different than the method adopted by NASCET. The ECST method of measuring stenosis severity is con- sistent with the traditional approach of com- paring the residual lumen at the lesion to an overall subjective guess of the true lumen of the artery at the level of the lesion in the carotid artery (Fig. 3). Because of this differ- ence in measurement of the degree of carotid artery stenosis, the benefit of surgical inter- vention for greater than 70% diameter steno- sis in the ECST translates to a benefit for a
Figure 1. The results of the two major trials, North American Carotid Endarterectomy Trial (NASCET) and the European Carotid Surgety Trial (ECST). On the left are plotted the absolute risk reduction for a combined outcome of stroke or death as a function of the severity of carotid stenosis. The more severe the stenosis, the more significant the reduction in stroke/ death with surgery as compared with medical therapy. The surgical compli- cation rates for each level of intervention are shown on the right of the figure. In each group of five: First bar = NASCET 2 70% (at 2 y); second bar = ESCT 2 60% (at 3 y); third bar = NASCET 50-69% (at 5 y); fourth bar = NASCET < 50%; fifth bar = ECST < 40% (at 3 y).
CAROTID ULTRASOUND 571
Figure 2. The carotid bifurcation showing the location at which the minimal residual lumen diameter is measured in the proximal internal carotid artery (a). The reference point for the calculation of the % stenosis is the internal carotid artery (b) just above the bifurcation (beyond any area .of possible poststenotic dilatation). The degree of stenosis is then: (b - a)/b x 100%. This method was used in the NASCET study.
degree of stenosis of 50% or more by NAS- CET measurement^.^^
The first publication from the NASCET study showed an advantage for identifying patients who have high-grade lesions of at least 70% diameter stenosis and then per- forming a surgical intervention.'j* The same report showed the lack of any benefit for sur- gery on lesions of 30% diameter narrowing or less.61 This left an unanswered question: at what degree of stenosis should surgery be performed? The final results of the NASCET study showed that a net benefit to the patient can be shown for surgery of a carotid stenosis causing between 50% and 69% diameter nar- rowing3 These data, published in 1998, unfor- tunately include all of the outcome results into the broad category of 50% to 69% diame- ter stenosis. The data do not present evidence of any better advantage of surgery for a more severe stenosis (e.g., between 60% and 69% as compared with the group with a stenosis
between 50% and 59%). An aggregate of the results from both the ECST and NASCET is shown in Figure 1. To compare the results of the NASCET with the ECST studies, the angiographic measurements of ECST have been translated to the standard method of grading stenosis severity used by NASCET.79 These estimates of disease severity show a definite benefit for surgical intervention for stenoses of 50% diameter narrowing or more. These benefits take into consideration the sur- gical complication rates that count towards the overall morbidity to the patient. There is an early disadvantage for performing carotid surgery, more dramatic in the first 30 days of the perioperative period. Following this, the long-term benefits to the patient show up as a prolonged time interval with lessened risk of future carotid strokes.
The recently published results from the NASCET and ECST trials have somewhat calmed the confusion that arose in the mid
Figure 3. The traditional method of grading the severity of internal carotid artery stenosis. The reference diameter is the expected location of the carotid wall at the level of the lesion. The equation ([b - a]/b x 100%) will give a more severe degree of stenosis. This method of measuring stenosis was used in the ECST study.
572 POLAK
1990s with the publication of results from the asymptomatic carotid artery surgery trials. The Asymptomatic Carotid Artery Surgery Trial (ACAS) showed a distinct advantage for surgical intervention for patients who had at least a 60% s t e n ~ s i s . ~ ~ After the results of this trial were published in 1995, a confusing situ- ation existed. A surgical intervention seemed indicated in symptomatic patients with lesions of at least 70% diameter stenosis whereas asymptomatic patients seemed to benefit from surgical intervention at lower degrees of stenosis (60%). An important factor that af- fects the interpretation of the results for symptomatic and asymptomatic patients is the lower overall required complication rate on the side of the asymptomatic study, which accepted up to 3% surgical complication rates, whereas the North American trial accepted up to 6% complication rates for enrollment.
There is a benefit for surgical intervention in symptomatic patients who have at least a 50% diameter stenosis. This benefit is depen- dent on a low surgical complication rate. For asymptomatic patients, it seems that surgical intervention can be done for carotid stenosis of 60% or more. The NASCET and ACAS studies have had an impact on carotid ultra- sound in two ways: (1) defining a new way of grading stenosis severity and (2) giving attention to quality assurance issues needed to minimize errors on carotid ultrasound.
Gold Standard Method of Grading the Severity of Carotid Stenosis
The NASCET and the ACAS studies intro- duced a standard method of grading the se- verity of carotid stenosis. In essence, the point of maximal lumen diameter narrowing as seen on multiple projections of the carotid angiogram is compared with the lumen of the artery in a more cranial location (see Fig. 2). This creates an internal self reference for grading the severity of the stenosis. It trans- lates poorly in estimating the amount of plaque burden that might be present at the level of the proximal internal carotid artery. This region, the carotid sinus, is typically as- sociated with a local dilatation of the outer wall of the internal carotid artery. Plaque shows a tendency to deposit into this area of slow flow.
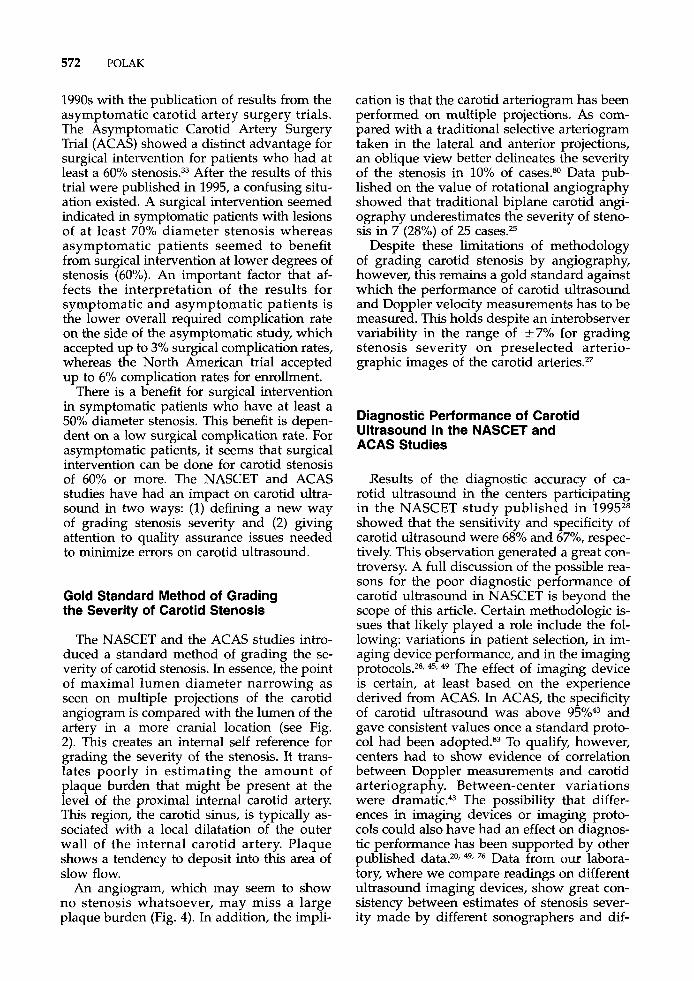
An angiogram, which may seem to show no stenosis whatsoever, may miss a large plaque burden (Fig. 4). In addition, the impli-
cation is that the carotid arteriogram has been performed on multiple projections. As com- pared with a traditional selective arteriogram taken in the lateral and anterior projections, an oblique view better delineates the severity of the stenosis in 10% of cases.8o Data pub- lished on the value of rotational angiography showed that traditional biplane carotid angi- ography underestimates the severity of steno- sis in 7 (28%) of 25 cases.25
Despite these limitations of methodology of grading carotid stenosis by angiography, however, this remains a gold standard against which the performance of carotid ultrasound and Doppler velocity measurements has to be measured. This holds despite an interobserver variability in the range of k7Y0 for grading stenosis severity on preselected arterio- graphic images of the carotid arteries.27
Diagnostic Performance of Carotid Ultrasound in the NASCET and ACAS Studies
Results of the diagnostic accuracy of ca- rotid ultrasound in the centers participating in the NASCET study published in 199528 showed that the sensitivity and specificity of carotid ultrasound were 68% and 679'0, respec- tively. This observation generated a great con- troversy. A full discussion of the possible rea- sons for the poor diagnostic performance of carotid ultrasound in NASCET is beyond the scope of this article. Certain methodologic is- sues that likely played a role include the fol- lowing: variations in patient selection, in im- aging device performance, and in the imaging
45, 49 The effect of imaging device is certain, at least based on the experience derived from ACAS. In ACAS, the specificity of carotid ultrasound was above and gave consistent values once a standard proto- col had been adopted.83 To qualify, however, centers had to show evidence of correlation between Doppler measurements and carotid arteriography. Between-center variations were dramatic.43 The possibility that differ- ences in imaging devices or imaging proto- cols could also have had an effect on diagnos- tic performance has been supported by other published data.2O. 49* 76 Data from our labora- tory, where we compare readings on different ultrasound imaging devices, show great con- sistency between estimates of stenosis sever- ity made by different sonographers and dif-
CAROTID ULTRASOUND 573
Figure 4. A, Gray-scale image of the carotid artery bifurcation shows a large plaque burden sitting in the proximal internal carotid artery. 6, The corresponding Doppler waveform shows increased peak systolic velocity consistent with a 50% diameter stenosis. C, The arteriogram shows a plaque. The residual lumen at the level of the lesion, however, is the same as the diameter of the internal carotid artery. The arteriogram is interpreted as not showing a significant stenosis (0%) despite a large plaque burden.
ferent ultrasound devices as long as a consistent imaging protocol is followed.
ULTRASOUND EVALUATION OF THE SEVERITY OF CAROTID ARTERY STENOSIS
Principles of Velocity Estimation Using Doppler Ultrasound
With carotid ultrasound, a sound pulse of carrier frequency somewhere between 3 and 5 MHz is transmitted into the patient’s soft tissues. The returning echoes from blood moving in the carotid artery give information on the relative motion of blood with respect
to the direction of this ultrasound beam. The angle between the ultrasound beam and the direction of blood flow is kept at 60 degrees or less. The sonographer then estimates the direction of blood flow and applies an appro- priate angle correction. This frequency shift information is transformed to the velocity of moving blood.
The first manuscript to describe a system- atic way of using the Doppler frequency shift to estimate the severity of internal carotid artery stenosis was published in 1979.85 This article is commonly quoted and is the source of the figure relating stenosis severity in the carotid artery to Doppler frequency shift (Fig. 5). At a point of maximal narrowing in the carotid artery, the velocity of moving blood
574 POLAK
6oo 1
0 20 40 60 80 1 00
Lumen Narrowing %
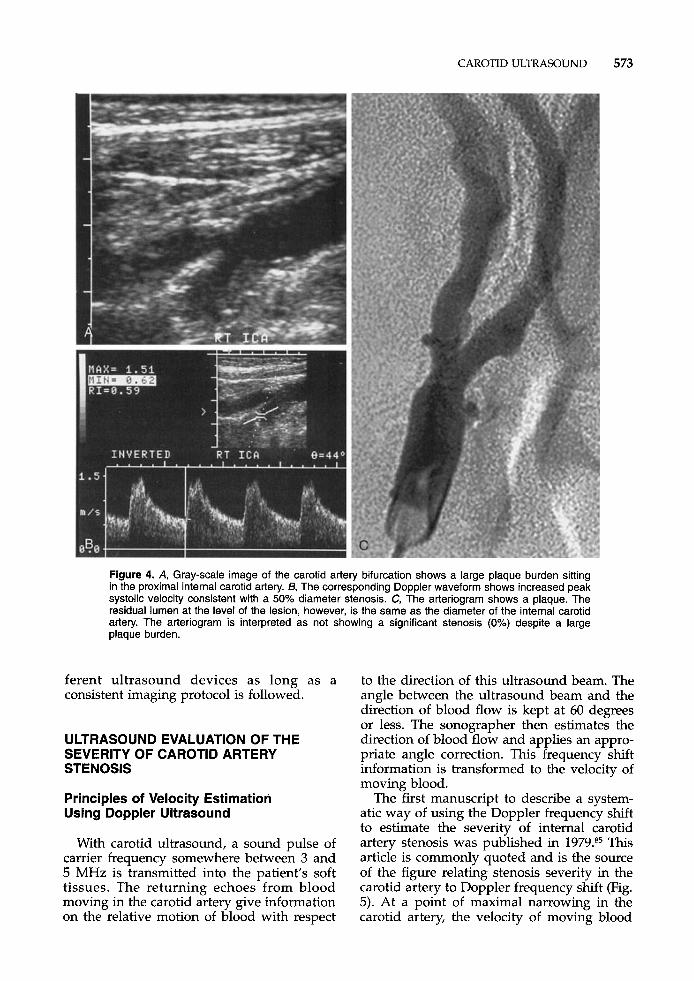
Figure 5. This diagram is a representation of the association of peak- systolic velocity in the internal carotid artery to the degree of stenosis. With high-grade stenoses, the absolute volume of blood flow through the diseased carotid decreases because of developing collateral pathways to the point that blood flow velocity also decreases. This creates a situation in which two different stenoses can give the same value of peak-systolic velocity by Doppler.
increases because of the restriction of the lu- men of the artery. As the degree of stenosis increases, the velocity of blood and the mea- surable Doppler frequency shift increase. At higher grades of carotid stenosis, because of the overall increased resistance to blood flow, the amount of blood being delivered into the diseased carotid artery decreases.
Compensatory flow typically develops in collateral branches either from the ipsilateral external carotid artery, vertebral artery, or from the contralateral arteries. This decrease in the amount of blood being delivered into the diseased artery causes the association be- tween the Doppler velocity to start decreasing as a function of disease severity. The positive association, increasing blood flow velocity with increasing stenosis severity, is main- tained until the stenosis is critically severe (somewhere near to 90% or 95%). This leads to a paradoxical situation: it is possible to have, for the same Doppler velocity, two dif- ferent degrees of stenosis. These critical steno- ses can be detected by noting alteration of the
Doppler waveform distal to the lesion or by observing the size of the narrowed lumen on a color Doppler or power Doppler image. From a practical point of view, however, color Doppler flow imaging facilitates the evalua- tion of these high-grade stenoses.', 7, 40
There are, however, certain elements of an imaging protocol that improve the reliability of Doppler velocity for grading the severity of carotid artery stenosis. The first element is the capability of identifying the location of the point of maximal narrowing. At this point, two physical phenomena should be ob- served. First, this is the point of highest blood flow velocity. This site corresponds to the lo- cation where blood has the highest amount of kinetic energy. In addition, because the zone of blood flow is severely restricted, all red cells at the stenosis move at the same velocity. This translates into what is called plug flow. A Doppler velocity spectrum (Fig. 6) acquired at this point shows cohesive mo- tion of the red cells and a relatively clear spectral window (Fig. 6A; see also Color Plate
CAROTID ULTRASOUND 575
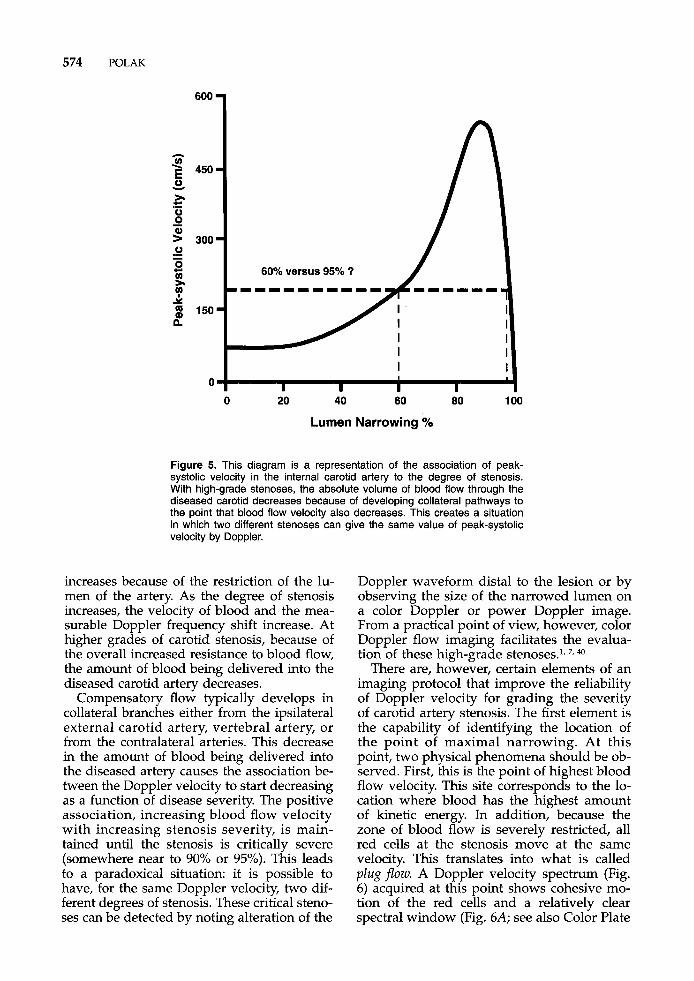
Figure 6. A, The Doppler sample gate is placed at the point of maximal narrowing in the internal carotid artery. A relatively clear Doppler spectral window and an increase in peak-systolic velocity are shown. (See also Color Plate V; Fig. 38.) B, Sampling 1 cm downstream from the point of maximal narrowing shows a mild loss in peak systolic velocity and a filling-in of the spectral window. (See also Color Plate V, Fig. 39.) C, Sampling further downstream from the last site shows some flow reversal and a persistent increase in velocity. (See also Color Plate V, Fig. 40.) 0, Three centimeters down- stream, the Doppler waveform has returned to normal. (See also Color Plate V, Fig. 41 .)
V; Fig. 38). Estimating the severity of carotid stenosis is focused on locating this point. An additional physical phenomenon comes into play just distal to the point of maximal nar- rowing: the presence of a velocity jet. The red cells that have acquired increased kinetic energy at the stenosis then dissipate this en- ergy over a short distance but maintain some cohesive pattern of blood flow called the ve- Iocity jet.
The Velocity Jet
As indicated previously, the point of maxi- mal narrowing in the carotid artery causes a zone of increased velocity where blood flow is very cohesive. Red cells move at the same velocity, a phenomenon referred to as plug pow. Detecting this point is the basic goal of any sonographer trying to estimate the sever- ity of a carotid stenosis. As such, the sonogra- pher must keep in mind certain basic princi- ples. Distal to the stenosis, the zone of increased velocity translates into a jet of in- creased velocity, the so-called velocity jet .
Within this jet, which tends to diverge rela- tively quickly, the peak velocity of red blood cells tends to decrease relatively slowly over a distance of 1 to 2 cm (Fig. 6B; see also Color Plate V, Fig. 39). For a distance of 1 to 2 cm, it is possible to get a relatively accurate Doppler tracing of the velocity increase caused by a stenosis.6 The measurement ob- tained downstream tends to underestimate the peak velocity of blood and tends to un- derestimate the severity of the lesion located more proximally. Knowledge of the hemody- namic behavior of a carotid stenosis is espe- cially important in cases where there is exten- sive carotid calcification. The point of maximal narrowing might be masked within a zone of calcification that cannot be pene- trated by the ultrasound beam. Evidence of a high-grade stenosis is seen distally and mani- fests as a zone of increased velocity and alter- ations in the overall Doppler tracing.
The appearance of the Doppler waveform downstream to the stenosis shows both broadening and reversal of blood flow (Fig. 6C; see also Color Plate V, Fig. 40). The broad- ening of the Doppler envelope is caused by
576 POLAK
divergence of the red cells from the velocity jet and a change in the direction of red cells as they slow down at the sides of the velocity jet. More to the side of the velocity jet, a zone of vorticeal blood flow is established. Red cells in this zone are reversing their direction and show up on the Doppler waveform as a region with negative velocity with respect to the main component of forward blood flow. At a point 1 to 2 cm downstream to the steno- sis proper, a zone of turbulence is established. Here, the bulk flow velocity of the red cells is still high despite the widening of the velocity, jet. The velocity of moving blood can then reach the critical Reynolds' number. The Reynolds' number is strongly dependent on the overall diameter of the artery and on ve- locity and viscosity of the fluid that is moving at a given velocity. Above a given Reynolds' number, blood flow becomes turbulent or dis- organized. This zone of transition with a high enough Reynolds' number is likely to occur at a distance of between 1 and 2 cm from the point of maximal narrowing (Fig. 6D; see also Color Plate V, Fig. 41).'j
The direction of the velocity jet indicates the direction of moving blood and is a useful index for the proper angle correction of the Doppler frequency shifts into estimates of the velocity of blood flow. Although limited by sample rates and artifacts, the color Doppler image offers a good estimate of the direction of blood flow. This can be achieved by sam- pling from multiple longitudinal projections,
until on one projection a velocity jet of suffi- cient length can be identified and used to measure the direction of blood flow. This strategy is especially useful in cases of hypo- echoic lesions that are not identified on gray- scale imaging alone.
Estimation of the velocity of blood flow with Doppler measurements still requires that the relative angle between the direction of blood flow and the ultrasound beam be kept at 60 degrees or less. There are two reasons for following this recommendation: (1) above 60 degrees, errors engendered by the person performing the angle correction increase dra- matically; and (2) artifacts associated with the detection of velocity signals taken closer to 90 degrees to the direction of motion are signifi- cant.
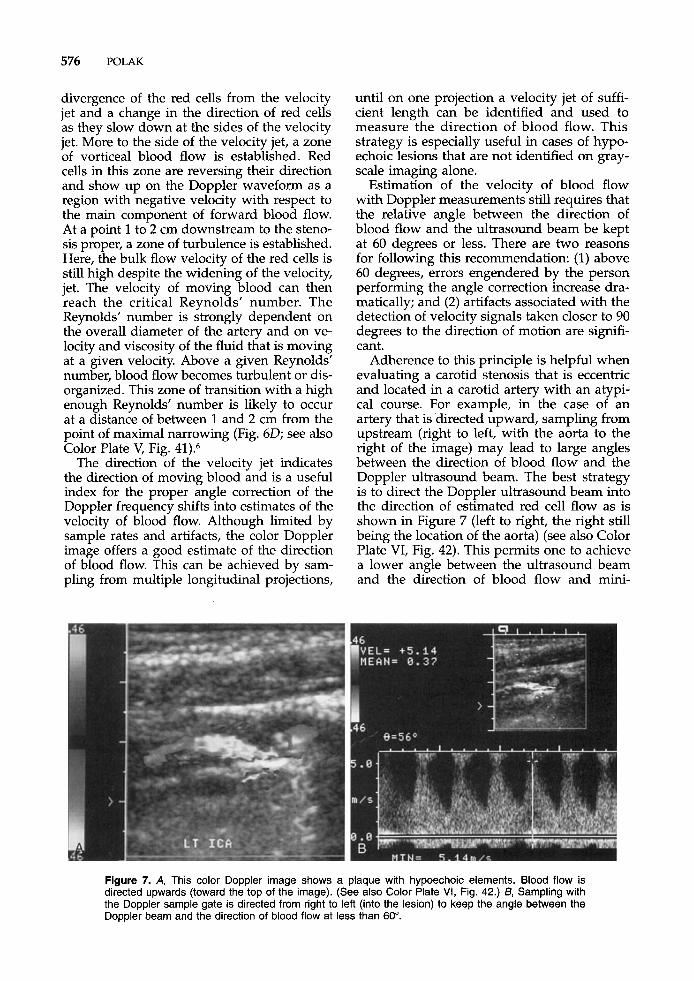
Adherence to this principle is helpful when evaluating a carotid stenosis that is eccentric and located in a carotid artery with an atypi- cal course. For example, in the case of an artery that is 'directed upward, sampling from upstream (right to left, with the aorta to the right of the image) may lead to large angles between the direction of blood flow and the Doppler ultrasound beam. The best strategy is to direct the Doppler ultrasound beam into the direction of estimated red cell flow as is shown in Figure 7 (left to right, the right still being the location of the aorta) (see also Color Plate VI, Fig. 42). This permits one to achieve a lower angle between the ultrasound beam and the direction of blood flow and mini-
Figure 7. A, This color Doppler image shows a plaque with hypoechoic elements. Blood flow is directed upwards (toward the top of the image). (See also Color Plate VI, Fig. 42.) 6, Sampling with the Doppler sample gate is directed from right to left (into the lesion) to keep the angle between the Doppler beam and the direction of blood flow at less than 60".
CAROTID ULTRASOUND 577
mizes the error engendered by the operation of angle correcting between the direction of blood flow and the direction of the ultra- sound beam.
The ability to obtain accurate velocity esti- mates may also be affected by the algorithm used for angle correction in the ultrasound device, especially for linear array transducers. A deficient algorithm for estimating the angle between the ultrasound beam and the direc- tion of flowing blood leads to overestimation of blood velocity.21 This artificial spectral broadening effect may have led to poor or inconsistent performance of some ultrasound machines in different clinical studies.@ This may also be one of the reasons why the per- formance of Doppler ultrasound in the NAS- CET study showed poor
The Subtotally Occluded Carotid
The NASCET and ECST studies showed that the risk of stroke is directly linked to the severity of carotid stenosis. Although the major pathologic mechanism for stroke is an actual atheroembolic event, the likelihood of artheroembolism is positively associated to the degree of stenosis. As such, the more se- vere the stenotic artery, the more likely the patient is to experience a stroke over the next few months and years. This leads to the de- velopment of an interesting scenario where continued restriction of flow of the carotid artery leads to the point where the artery is subtotally occluded. Volume blood flow is directed away from the diseased carotid to other collaterals, as mentioned previously. In this situation, absolute blood flow and veloci- ties in the artery decrease dramatically. It seems, however, that the lesion's potential for causing stroke is maintained.59
Because the velocity of moving red cells is decreased dramatically in these situations, it is possible that the Doppler measurements might fail to detect slowly moving blood in the still open vessel. This has significant im- pact on the patient because operative inter- vention in this subtotally occluded artery de- creases the risk of subsequent stroke. Ignoring the subtotally occluded carotid artery and let- ting it occlude leads to a persistent risk of stroke of approximately 5% per year.39
Because of the limitation of the Doppler technique that might fail to detect very slow blood flow velocities, it is almost routine clini- cal practice to recommend some form of an-
cillary diagnostic testing to supplement ca- rotid ultrasound in patients who have internal carotid arteries that appear totally occluded. Diagnostic testing with MR angiog- raphy, CT angiography, or carotid arteriogra- phy are all useful in the evaluation of these lesions.17, 30, 65, 77 The traditional carotid angio- gram with the prolonged infusion of contrast while filming still remains a gold standard. The character and residual lumen of the distal internal carotid artery seems, however, more easily evaluated with the cross-sectional im- aging modalities, such as CT. There is a sug- gestion, based on some published data, that color Doppler imaging has improved the di- agnostic accuracy of carotid ultrasound to the point that testing with other modalities might no longer be necessary7, 40, 51
Velocity Parameters
Various velocity parameters have been used for estimating the severity of carotid stenosis. Typically, the peak-systolic velocity is measured at the point of maximal nar- rowing in the carotid artery. Another single parameter that may be used is the end-dia- stolic velocity. Both measurements are made by placing a cursor or using automatic edge detection to identify the top of an appropri- ately acquired Doppler spectrum. The end- diastolic velocity came into vogue mainly because of the inherent limitation of some ultrasound devices. At points of maximal ste- nosis, some ultrasound devices were not ca- pable of processing the high-frequency shift information contained in the returning echoes from the Doppler ultrasound beam. This led to a paradoxical situation where the highest velocities close to peak systole were folded (or aliased) into the spectrum below it. This led to ambiguities in terms of obtaining an actual peak-systolic velocity. In such cases, the severity of the carotid stenosis can still be estimated by using the end-diastolic velocity. The end-diastolic velocity, by virtue of being much lower than peak-systolic values, is less likely to alias and can be more consistently obtained.
Reliance on a single peak-systolic or end- diastolic value for estimating a stenosis seems somewhat simplistic and many clinicians be- lieve that this approach does not take into consideration changes in cardiac output and other sources of interindividual variations in blood flow velocities. Using the velocity of
578 POLAK
blood in the common carotid artery, specifi- cally a point of 2 to 4 cm from the bifurcation, it is possible to obtain a ratio of the velocity in the internal carotid artery to that in the common carotid artery. The internal carotid artery to common carotid artery peak-systolic velocity ratio offers the advantage of correct- ing for alterations in cardiac output or cardiac arrhythmias. This advantage must be weighed against the increased error associated with the mathematical operation of dividing one number by another number. As such, the op- erator error in estimating the velocity of the internal carotid artery is added to the opera- tor error in estimating the velocity of the com- mon carotid artery. The estimated peak-sys- tolic velocity ratio tends to have, in the same patient, slightly more error than the simple peak-systolic velocity measurement. There are two velocity ratios based on end-diastolic velocities: (1) the end-diastolic velocity in the internal carotid artery divided by the com- mon carotid artery end-diastolic velocity or (2) the peak-systolic velocity in the internal carotid artery divided by end-diastolic veloc- ity in the common carotid artery. These two parameters can be used for estimating the severity of carotid artery stenosis. Consider- ation should, however, be given to normal fluctuations in the Doppler velocities or ve- locity patterns in the common carotid artery. For example, the common carotid artery ve- locities are typically higher by 10 to 20 cm near the origin (so-called low common ca- ofi id)^^, 56 and decrease when nearing the level of the carotid bifurcation. Near the flow di- vider, the zone dividing the external from the internal carotid artery, blood flow patterns are perturbed by the presence of the bifurcation. The direction of blood flow is altered and preferentially directed toward the inner wall of the internal carotid artery. Blood flow pat- terns tend to be relatively consistent and close to laminar pattern approximately 3 cm from the level of the carotid bifurcation. A consis- tent estimate of common carotid artery peak- systolic (or diastolic) velocity is made at this point in the absence of any lesion or plaque formation.
Various values have been used for estimat- ing the stenosis severity on carotid arteriogra- phy. The values published in the 1980s com- pared the results of carotid ultrasound with arteriographic measurements made using a traditional method (see Fig. 3) of grading9 With the adoption of NASCET and the ACAS studies, it became necessary to recalibrate the
system of velocity estimates made by Doppler ultrasound to match the new method of esti- mating the severity of internal carotid artery disease on arteriography (see Fig. 2).
Velocity Cut-Points for Detecting Significant Stenosis of the Internal Carotid Artery
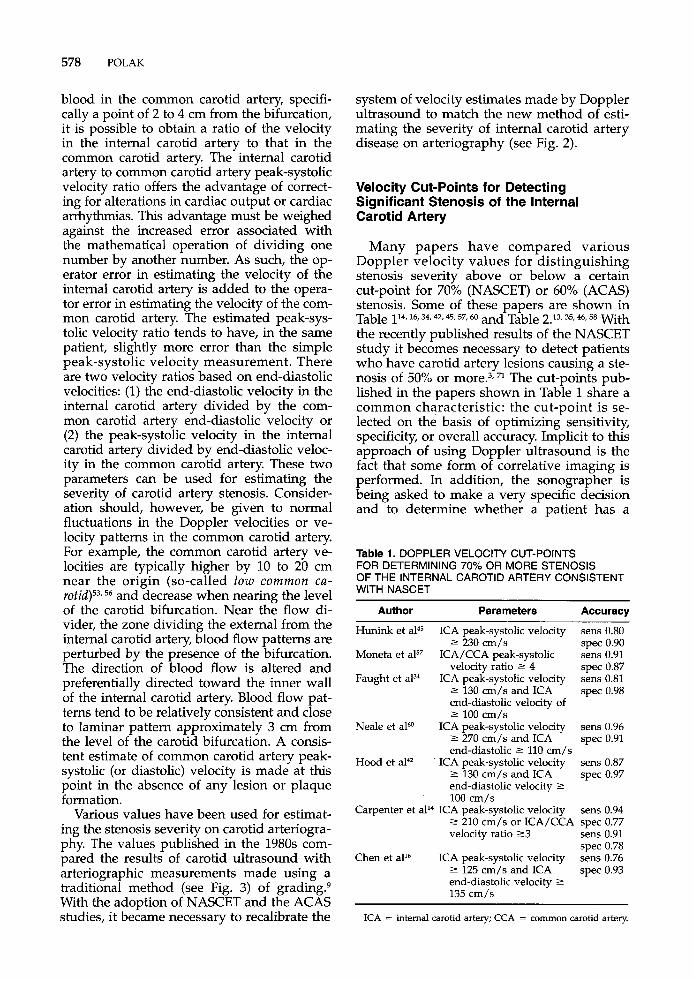
Many papers have compared various Doppler velocity values for distinguishing stenosis severity above or below a certain cut-point for 70% (NASCET) or 60% (ACAS) stenosis. Some of these papers are shown in
the recently published results of the NASCET study it becomes necessary to detect patients who have carotid artery lesions causing a ste- nosis of 50% or more.3, 71 The cut-points pub- lished in the papers shown in Table 1 share a common characteristic: the cut-point is se- lected on the basis of optimizing sensitivity, specificity, or overall accuracy. Implicit to this approach of using Doppler ultrasound is the fact that some form of correlative imaging is performed. In addition, the sonographer is being asked to make a very specific decision and to determine whether a patient has a
Table 114.16,34,Qr 45,57,60 and Table 2.13,35.46.58 With
Table 1. DOPPLER VELOCITY CUT-POINTS FOR DETERMINING 70% OR MORE STENOSIS OF THE INTERNAL CAROTID ARTERY CONSISTENT WITH NASCET
Author Parameters Accuracy
Hunink et a145 ICA peak-systolic velocity sens 0.80 2 230 cm/s spec 0.90
Moneta et a157 ICA/CCA peak-systolic sens 0.91 velocity ratio 2 4 spec 0.87
Faught et alM ICA peak-systolic velocity sens 0.81 2 130 cm/s and ICA spec 0.98 end-diastolic velocity of 2 100 cm/s
2 270 cm/s and ICA end-diastolic 2 110 cm/s
2 130 cm/s and ICA end-diastolic velocity 2 100 cm/s
Carpenter et all4 ICA peak-systolic velocity sens 0.94 2 210 cm/s or ICA/CCA spec 0.77 velocity ratio 2 3 sens 0.91
spec 0.78 Chen et all6 ICA peak-systolic velocity sens 0.76
spec 0.93
Neale et aPO ICA peak-systolic velocity sens 0.96 spec 0.91
Hood et ala ICA peak-systolic velocity sens 0.87 spec 0.97
2 125 cm/s and ICA end-diastolic velocity 2
135 cm/s
ICA = internal carotid artery; CCA = common carotid artery.
CAROTID ULTRASOUND 579
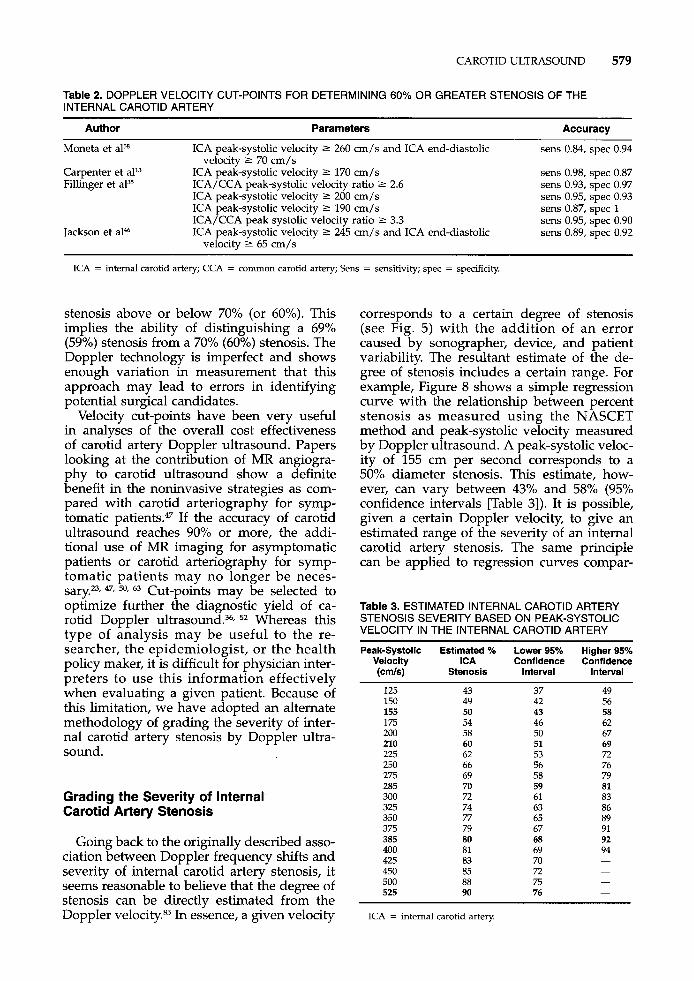
Table 2. DOPPLER VELOCITY CUT-POINTS FOR DETERMINING 60% OR GREATER STENOSIS OF THE INTERNAL CAROTID ARTERY
Author Parameters Accuracy
Moneta et a15*
Carpenter et all3 Fillinger et aP5
ICA peak-systolic velocity 2 260 cm/s and ICA end-diastolic
ICA peak-systolic velocity 2 170 cm/s ICA/CCA peak-systolic velocity ratio 2 2.6 ICA peak-systolic velocity 2 200 cm/s ICA peak-systolic velocity 2 190 cm/s ICA/CCA peak systolic velocity ratio 2 3.3 ICA peak-systolic velocity 2 245 cm/s and ICA end-diastolic
velocity 2 70 cm/s
Jackson et a146 velocity 2 65 cm/s
sens 0.84, spec 0.94
sens 0.98, spec 0.87 sens 0.93, spec 0.97 sens 0.95, spec 0.93 sens 0.87, spec 1 sens 0.95, spec 0.90 sens 0.89, spec 0.92
ICA = internal carotid artery; CCA = common carotid artery; Sens = sensitivity; spec = specificity.
stenosis above or below 70% (or- 60%). This implies the ability of distinguishing a 69% (59%) stenosis from a 70% (60%) stenosis. The Doppler technology is imperfect and shows enough variation in measurement that this approach may lead to errors in identifying potential surgical candidates.
Velocity cut-points have been very useful in analyses of the overall cost effectiveness of carotid artery Doppler ultrasound. Papers looking at the contribution of MR angiogra- phy to carotid ultrasound show a definite benefit in the noninvasive strategies as com- pared with carotid arteriography for symp- tomatic ~atients.4~ If the accuracy of carotid ultrasound reaches 90% or more, the addi- tional use of MR imaging for asymptomatic patients or carotid arteriography for symp- tomatic patients may no longer be neces- ~ a r y . ~ J 47, 50, 63 Cut-points may be selected to optimize further the diagnostic yield of ca- rotid Doppler ultrasound.36, 52 Whereas this type of analysis may be useful to the re- searcher, the epidemiologist, or the health policy maker, it is difficult for physician inter- preters to use this information effectively when evaluating a given patient. Because of this limitation, we have adopted an alternate methodology of grading the severity of inter- nal carotid artery stenosis by Doppler ultra- sound.
Grading the Severity of Internal Carotid Artery Stenosis
Going back to the originally described asso- ciation between Doppler frequency shifts and severity of internal carotid artery stenosis, it seems reasonable to believe that the degree of stenosis can be directly estimated from the Doppler velocity.85 In essence, a given velocity
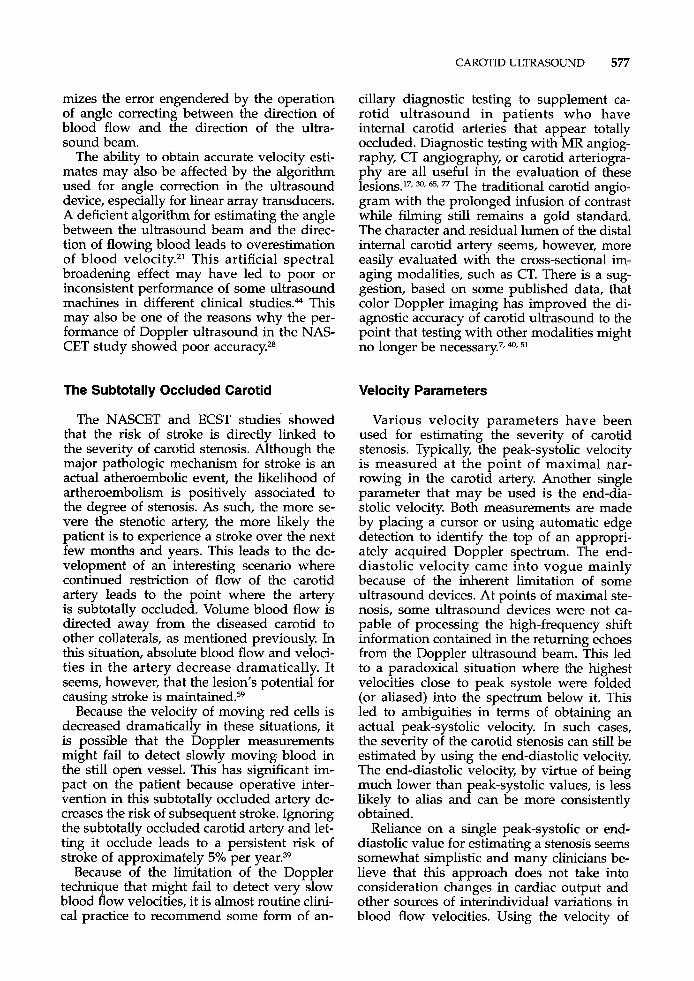
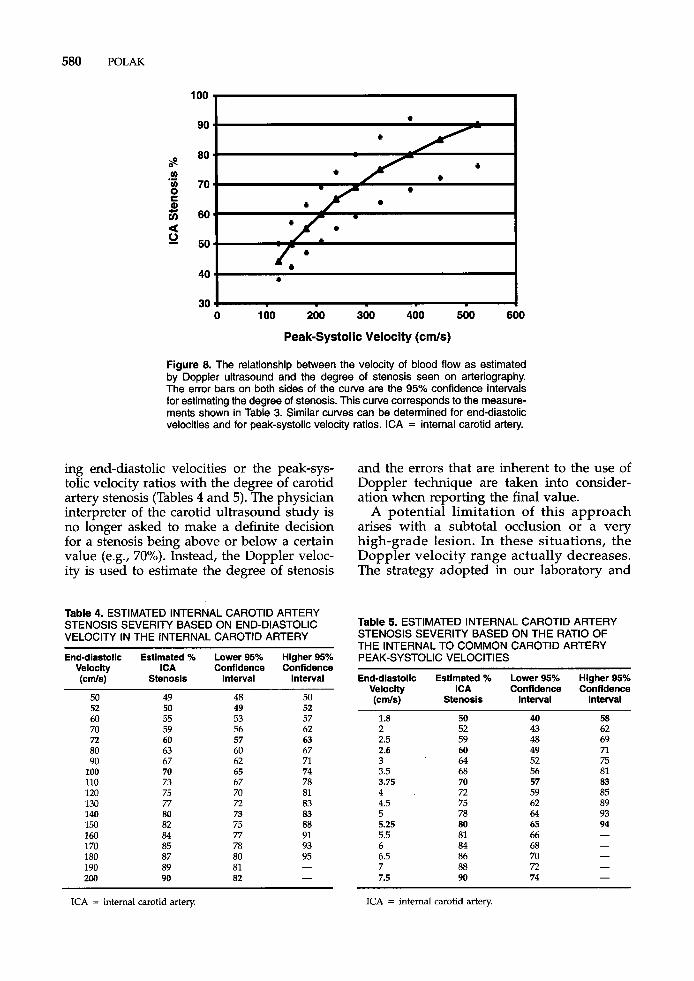
corresponds to a certain degree of stenosis (see Fig. 5) with the addition of an error caused by sonographer, device, and patient variability. The resultant estimate of the de- gree of stenosis includes a certain range. For example, Figure 8 shows a simple regression curve with the relationship between percent stenosis as measured using the NASCET method and peak-systolic velocity measured by Doppler ultrasound. A peak-systolic veloc- ity of 155 cm per second corresponds to a 50% diameter stenosis. This estimate, how- ever, can vary between 43% and 58% (%% confidence intervals [Table 31). It is possible, given a certain Doppler velocity, to give an estimated range of the severity of an internal carotid artery stenosis. The same principle can be applied to regression curves compar-
Table 3. ESTIMATED INTERNAL CAROTID ARTERY
VELOCITY IN THE INTERNAL CAROTID ARTERY STENOSIS SEVERITY BASED ON PEAK-SYSTOLIC
Peak-Systolic Estimated % Lower 95% Higher 95% Velocity ICA Confidence Confidence (cm/s) Stenosis Interval Interval
125 150 155 175 200 210 225 250 275 285 300 325 350 375 385 400 425 450 500 525
43 49 50 54 58 60 62 66 69 70 72 74 77 79 80 81 83 85 88 90
37 42 43 46 50 51 53 56 58 59 61 63 65 67 68 69 70 72 75 76
49 56 58 62 67 69 72 76 79 81 83 86 89 91 92 94 - - - -
ICA = internal carotid artery.
580 POLAK
100 I
a 0
I 0 100 200 300 400 500 600
Peak-Systolic Velocity (cmls)
Figure 8. The relationship between the velocity of blood flow as estimated by Doppler ultrasound and the degree of stenosis seen on arteriography. The error bars on both sides of the curve are the 95% confidence intervals for estimating the degree of stenosis. This curve corresponds to the measure- ments shown in Table 3. Similar curves can be determined for end-diastolic velocities and for peak-systolic velocity ratios. ICA = internal carotid artery.
ing end-diastolic velocities or the peak-sys- tolic velocity ratios with the degree of carotid artery stenosis (Tables 4 and 5). The physician interpreter of the carotid ultrasound study is no longer asked to make a definite decision for a stenosis being above or below a certain value (e.g., 70%). Instead, the Doppler veloc- ity is used to estimate the degree of stenosis
Table 4. ESTIMATED INTERNAL CAROTID ARTERY
VELOCITY IN THE INTERNAL CAROTID ARTERY
End-diastolic Estimated % Lower 95% Higher 95% Velocity ICA Confidence Confidence (cds) Stenosls Interval Interval
STENOSIS SEVERITY BASED ON END-DIASTOLIC
50 52 60 70 72 80 90
100 110 120 130 140 150 160 170 180 190 200
49 50 55 59 60 63 67 70 73 75 77 80 82 84 85 87 89 90
48 49 53 56 57 60 62 65 67 70 72 73 75 77 78 80 81 82
50 52 57 62 63 67 71 74 78 81 83 83 88 91 93 95 - -
and the errors that are inherent to the use of Doppler technique are taken into consider- ation when reporting the final value.
A potential limitation of this approach arises with a subtotal occlusion or a very high-grade lesion. In these situations, the Doppler velocity range actually decreases. The strategy adopted in our laboratory and
Table 5. ESTIMATED INTERNAL CAROTID ARTERY STENOSIS SEVERITY BASED ON THE RATIO OF THE INTERNAL TO COMMON CAROTID ARTERY PEAK-SYSTOLIC VELOCITIES
End-diastolic Estimated % Lower 95% Higher 95% Velocity ICA Confidence Confldence (CdS) Stenosis Interval Interval
1.8 2 2.5 2.6 3 3.5 3.75 4 4.5 5 5.25 5.5 6 6.5 7 7.5
50 52 59 60 61 68 70 72 75 78 80 81 84 86 88 90
40 43 48 49 52 56 57 59 62 64 65 66 68 70 72 74
58 62 69 7l 75 81 83 85 89 93 94 -
ICA = internal carotid artery ICA = internal carotid artery
CAROTID ULTRASOUND 581
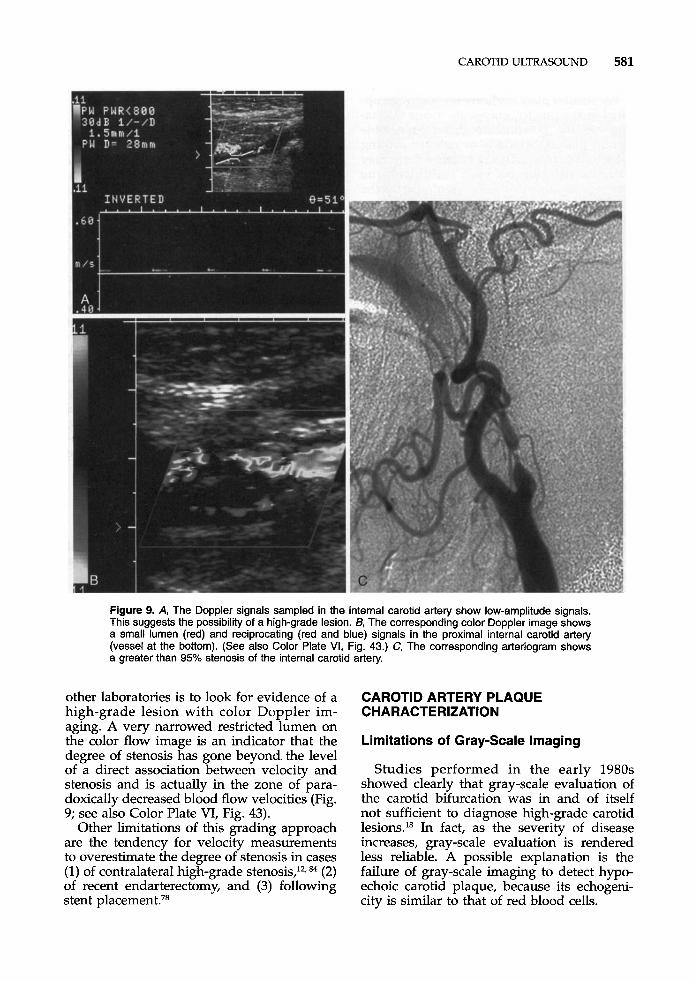
Figure 9. A, The Doppler signals sampled in the internal carotid artery show low-amplitude signals. This suggests the possibility of a high-grade lesion. B, The corresponding color Doppler image shows a small lumen (red) and reciprocating (red and blue) signals in the proximal internal carotid artery (vessel at the bottom). (See also Color Plate VI, Fig. 43.) C, The corresponding arteriogram shows a greater than 95% stenosis of the internal carotid artery.
other laboratories is to look for evidence of a high-grade lesion with color Doppler im- aging. A very narrowed restricted lumen on the color flow image is an indicator that the degree of stenosis has gone beyond the level of a direct association between velocity and stenosis and is actually in the zone of para- doxically decreased blood flow velocities (Fig. 9; see also Color Plate VI, Fig. 43).
Other limitations of this grading approach are the tendency for velocity measurements to overestimate the degree of stenosis in cases (1) of contralateral high-grade stenosis,’*, 84 (2) of recent endarterectomy, and (3) following stent p l a~emen t .~~
CAROTID ARTERY PLAQUE CHARACTERIZATION
Limitations of Gray-Scale Imaging
Studies performed in the early 1980s showed clearly that gray-scale evaluation of the carotid bifurcation was in and of itself not sufficient to diagnose high-grade carotid lesions.18 In fact, as the severity of disease increases, gray-scale evaluation is rendered less reliable. A possible explanation is the failure of gray-scale imaging to detect hypo- echoic carotid plaque, because its echogeni- city is similar to that of red blood cells.
582 POLAK
For smaller plaques, however, and with op- timal image quality, gray-scale image evalua- tion has the potential to detect vulnerable carotid plaque, which is at risk for causing subsequent stroke. This is because there may be an association between carotid plaque composition and stroke that is similar to the association between coronary artery plaque and myocardial infarction.
Pathophysiology: Model of Vulnerable Plaque
Pathologic correlation and arteriographic evaluation of the coronary arteries suggest that acute myocardial infarction relates to acute rupture of coronary artery plaques. This model proposes that thrombus formation de- velops in the region of plaque rupture, and this leads to subsequent occlusion of the coro- nary artery.*, 19, 22 The vulnerable plaque is believed to be composed primarily of lipid- rich material that is surrounded by a cap of fibrous material. This lipid-rich plaque is susceptible to mechanical forces that are asso- ciated with local blood flow dynamics. The presence of high metalloproteinase activity at the leading edge of the plaque (where the shear stress rate is greatest) may be responsi- ble for the propensity of plaque rupture at this site.
In the carotid circulation, the equivalent of lipid-rich plaque is hypoechoic plaque. Al- though data remain sparse, hypoechoic plaque has been shown to be associated with subsequent stroke.” As such, the hypothesis that plaque rupture contributes to cerebrovas- cular disease is being increasingly accepted.
Unfortunately, the literature on carotid plaque evaluation is based primarily on re- view of surgically extracted specimens.8, 54, 61, 89
As such, only larger plaques associated with greater than 50% stenosis have been investi- gated. Hypoechoic areas visible within subse- quently removed carotid plaque have been reported as areas of intraplaque hemor- rhage.37 From the ultrasound perspective, it is not possible to distinguish lipid-rich material from intraplaque hemorrhage. Both result in low-intensity echoes when imaged by gray scale. At pathology, these plaques have a het- erogeneous composition with mixtures of lipid, thrombus, and fibrous material.
Plaque Echogenicity
The signal intensity of returning echoes can be used to characterize plaque echogenicity. High-intensity or hyperechoic signals are comparable with those detected from fascia1 layers, or the adventitial layer of the artery, whereas isoechoic signal intensities are com- parable with those arising from the muscles of the neck. Both hyperechoic and isoechoic material presumably represent fibrous con- stituents of plaque material.
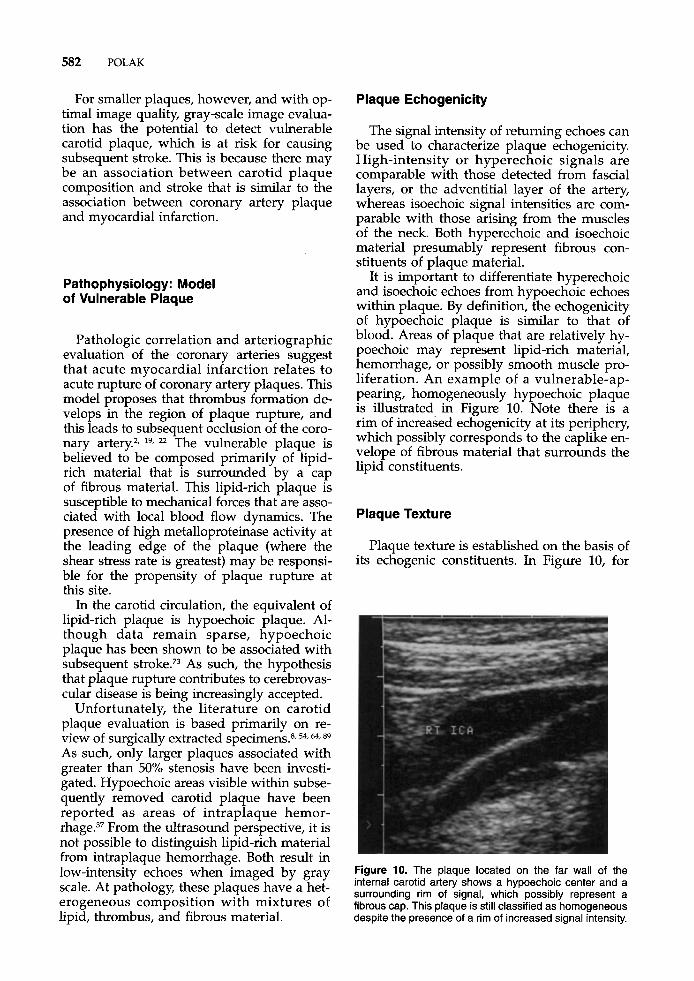
It is important to differentiate hyperechoic and isoechoic echoes from hypoechoic echoes within plaque. By definition, the echogenicity of hypoechoic plaque is similar to that of blood. Areas of plaque that are relatively hy- poechoic may represent lipid-rich material, hemorrhage, or possibly smooth muscle pro- liferation. An example of a vulnerable-ap- pearing, homogeneously hypoechoic plaque is illustrated in Figure 10. Note there is a rim of increased echogenicity at its periphery, which possibly corresponds to the caplike en- velope of fibrous material that surrounds the lipid constituents.
Plaque Texture
Plaque texture is established on the basis of its echogenic constituents. In Figure 10, for
Figure 10. The plaque located on the far wall of the internal carotid artery shows a hypoechoic center and a surrounding rim of signal, which possibly represent a fibrous cap. This plaque is still classified as homogeneous despite the presence of a rim of increased signal intensity.
CAROTID ULTRASOUND 583
example, the plaque is homogeneous, al- though close inspection reveals varying echo- genicity. From the perspective of classifica- tion, an almost totally hypoechoic plaque or one that is centrally hypoechoic with a rim of increased echogenicity is classified as a homogeneous hypoechoic plaque. A plaque that is homogeneously echogenic is classified as a homogeneously hyperdense plaque (Fig.
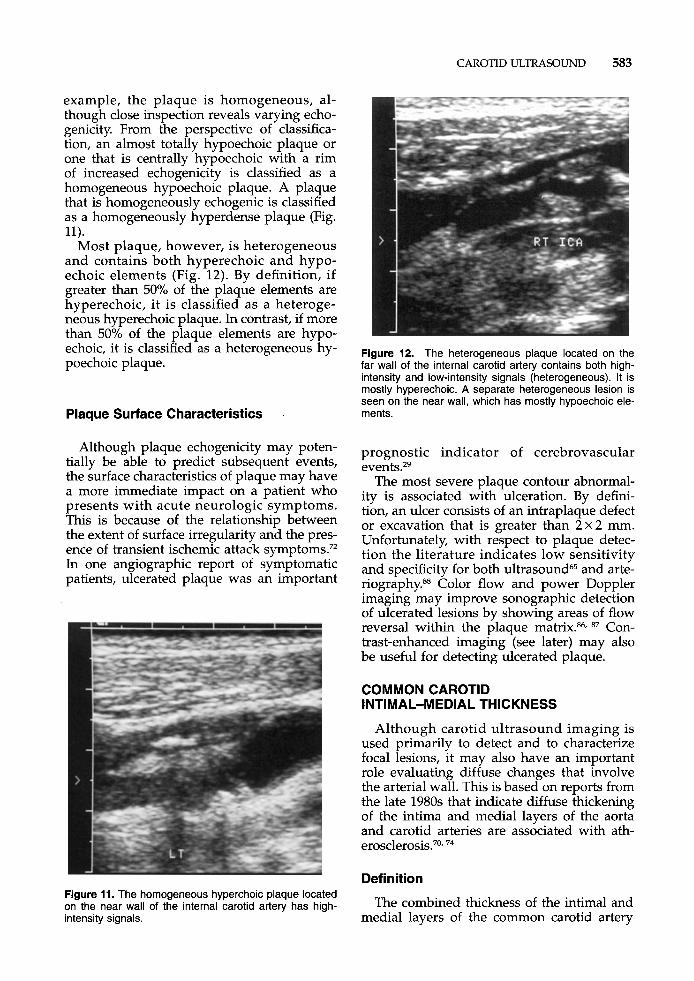
Most plaque, however, is heterogeneous and contains both hyperechoic and hypo- echoic elements (Fig. 12). By definition, if greater than 50% of the plaque elements are hyperechoic, it is classified as a heteroge- neous hyperechoic plaque. In contrast, if more than 50% of the plaque elements are hypo- echoic, it is classified as a heterogeneous hy- poechoic plaque.
11).
Plaque Surface Characteristics
Although plaque echogenicity may poten- tially be able to predict subsequent events, the surface characteristics of plaque may have a more immediate impact on a patient who presents with acute neurologic symptoms. This is because of the relationship between the extent of surface irregularity and the pres- ence of transient ischemic attack symptoms.7z In one angiographic report of symptomatic patients, ulcerated plaque was an important
Figure 11. The homogeneous hyperchoic plaque located on the near wall of the internal carotid artery has high- intensity signals.
Figure 12. The heterogeneous plaque located on the far wall of the internal carotid artery contains both high- intensity and low-intensity signals (heterogeneous). It is mostly hyperechoic. A separate heterogeneous lesion is seen on the near wall, which has mostly hypoechoic ele- ments.
prognostic indicator of cerebrovascular e~ents .2~
The most severe plaque contour abnormal- ity is associated with ulceration. By defini- tion, an ulcer consists of an intraplaque defect or excavation that is greater than 2x2 mm. Unfortunately, with respect to plaque detec- tion the literature indicates low sensitivity and specificity for both ultrasound65 and arte- riography.ss Color flow and power Doppler imaging may improve sonographic detection of ulcerated lesions by showing areas of flow reversal within the plaque matrix.86, 87 Con- trast-enhanced imaging (see later) may also be useful for detecting ulcerated plaque.
COMMON CAROTID INTIMAL-MEDIAL THICKNESS
Although carotid ultrasound imaging is used primarily to detect and to characterize focal lesions, it may also have an important role evaluating diffuse changes that involve the arterial wall. This is based on reports from the late 1980s that indicate diffuse thickening of the intima and medial layers of the aorta and carotid arteries are associated with ath- erosclerosis.70~ 74
Definition
The combined thickness of the intimal and medial layers of the common carotid artery
584 POLAK
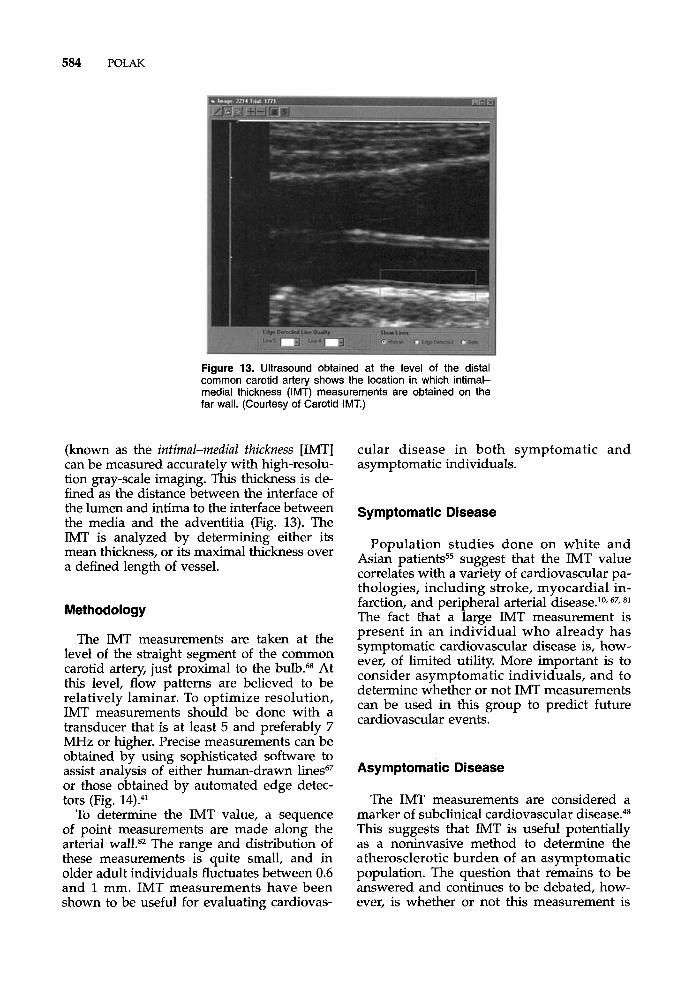
Figure 13. Ultrasound obtained at the level of the distal common carotid artery shows the location in which intimal- medial thickness (IMT) measurements are obtained on the far wall. (Courtesy of Carotid IMT.)
(known as the intimal-medial thickness [IMT] can be measured accurately with high-resolu- tion gray-scale imaging. This thickness is de- fined as the distance between the interface of the lumen and intima to the interface between the media and the adventitia (Fig. 13). The IMT is analyzed by determining either its mean thickness, or its maximal thickness over a defined length of vessel.
Methodology
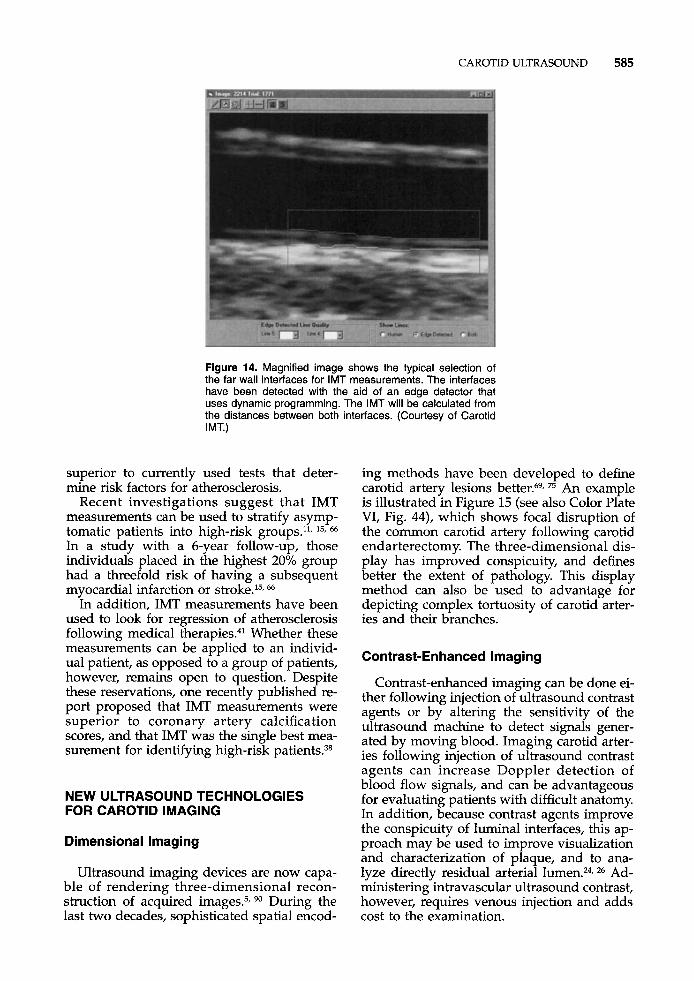
The IMT measurements are taken at the level of the straight segment of the common carotid artery, just proximal to the bulb.68 At this level, flow patterns are believed to be relatively laminar. To optimize resolution, IMT measurements should be done with a transducer that is at least 5 and preferably 7 MHz or higher. Precise measurements can be obtained by using sophisticated software to assist analysis of either human-drawn lines67 or those obtained by automated edge detec- tors (Fig. 14).41
To determine the IMT value, a sequence of point measurements are made along the arterial walLs2 The range and distribution of these measurements is quite small, and in older adult individuals fluctuates between 0.6 and 1 mm. IMT measurements have been shown to be useful for evaluating cardiovas-
cular disease in both symptomatic and asymptomatic individuals.
Symptomatic Disease
Population studies done on white and Asian patients55 suggest that the IMT value correlates with a variety of cardiovascular pa- thologies, including stroke, myocardial in- farction, and peripheral arterial disease.lo, 67,
The fact that a large IMT measurement is present in an individual who already has symptomatic cardiovascular disease is, how- ever, of limited utility. More important is to consider asymptomatic individuals, and to determine whether or not IMT measurements can be used in this group to predict future cardiovascular events.
Asymptomatic Disease
The IMT measurements are considered a marker of subclinical cardiovascular disease.48 This suggests that IMT is useful potentially as a noninvasive method to determine the atherosclerotic burden of an asymptomatic population. The question that remains to be answered and continues to be debated, how- ever, is whether or not this measurement is
CAROTID ULTRASOUND 585
Figure 14. Magnified image shows the typical selection of the far wall interfaces for IMT measurements. The interfaces have been detected with the aid of an edge detector that uses dynamic programming. The IMT will be calculated from the distances between both interfaces. (Courtesy of Carotid IMT.)
superior to currently used tests that deter- mine risk factors for atherosclerosis.
Recent investigations suggest that IMT measurements can be used to stratify asymp- tomatic patients into high-risk groups.ll, 15, 66
In a study with a 6-year follow-up, those individuals placed in the highest 20% group had a threefold risk of having a subsequent myocardial infarction or stroke.l5. 66
In addition, IMT measurements have been used to look for regression of atherosclerosis following medical t he ra~ ie s .~~ Whether these measurements can be applied to an individ- ual patient, as opposed to a group of patients, however, remains open to question. Despite these reservations, one recently published re- port proposed that IMT measurements were superior to coronary artery calcification scores, and that IMT was the single best mea- surement for identifying high-risk patients.38
NEW ULTRASOUND TECHNOLOGIES FOR CAROTID IMAGING
Dimensional Imaging
Ultrasound imaging devices are now capa- ble of rendering three-dimensional recon- struction of acquired images.5, During the last two decades, sophisticated spatial encod-
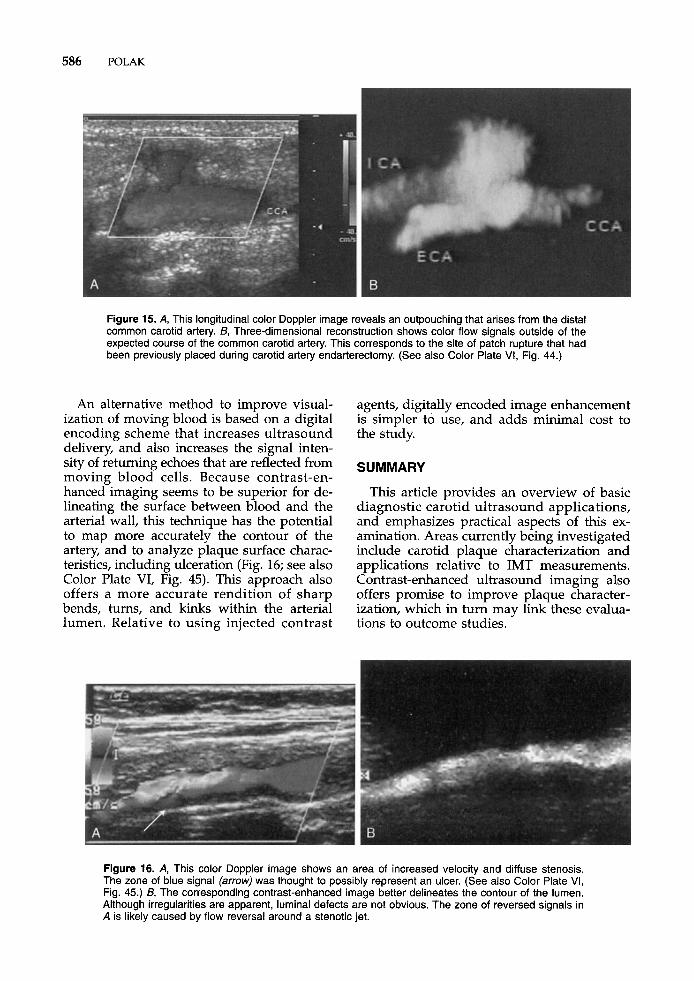
ing methods have been developed to define carotid artery lesions better.69, 75 An example is illustrated in Figure 15 (see also Color Plate VI, Fig. 44), which shows focal disruption of the common carotid artery following carotid endarterectomy. The three-dimensional dis- play has improved conspicuity, and defines better the extent of pathology. This display method can also be used to advantage for depicting complex tortuosity of carotid arter- ies and their branches.
Contrast-Enhanced Imaging
Contrast-enhanced imaging can be done ei- ther following injection of ultrasound contrast agents or by altering the sensitivity of the ultrasound machine to detect signals gener- ated by moving blood. Imaging carotid arter- ies following injection of ultrasound contrast agents can increase Doppler detection of blood flow signals, and can be advantageous for evaluating patients with difficult anatomy. In addition, because contrast agents improve the conspicuity of luminal interfaces, this ap- proach may be used to improve visualization and characterization of plaque, and to ana- lyze directly residual arterial lumen.24, 26 Ad- ministering intravascular ultrasound contrast, however, requires venous injection and adds cost to the examination.
586 POLAK
Figure 15. A, This longitudinal color Doppler image reveals an outpouching that arises from the distal common carotid artery. B, Three-dimensional reconstruction shows color flow signals outside of the expected course of the common carotid artery. This corresponds to the site of patch rupture that had been previously placed during carotid artery endarterectomy. (See also Color Plate VI, Fig. 44.)
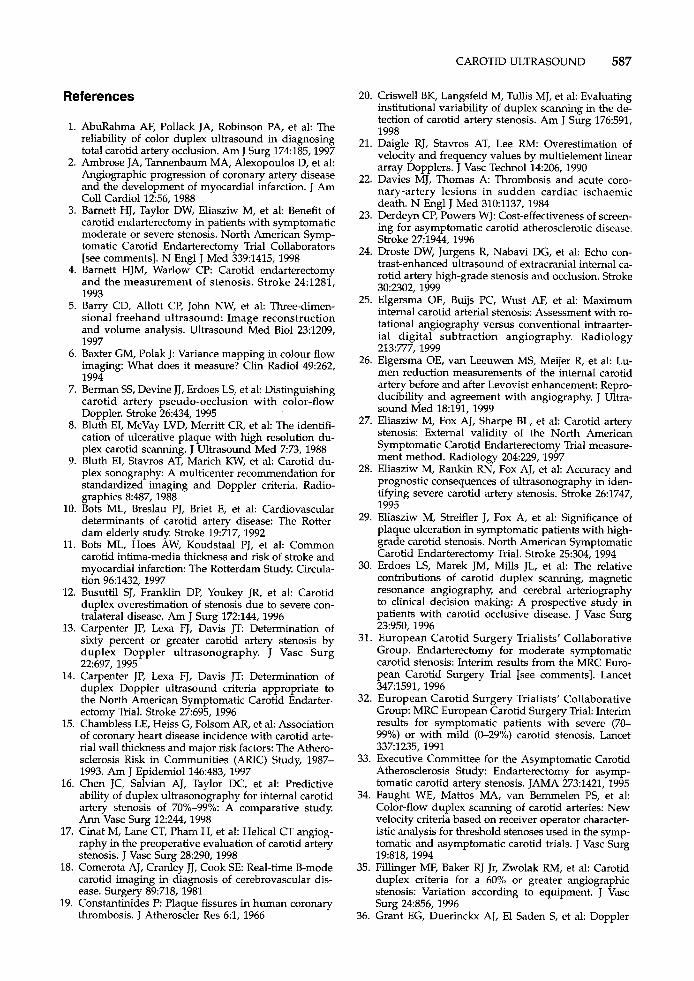
An alternative method to improve visual- ization of moving blood is based on a digital encoding scheme that increases ultrasound delivery, and also increases the signal inten- sity of returning echoes that are reflected from moving blood cells. Because contrast-en- hanced imaging seems to be superior for de- lineating the surface between blood and the arterial wall, this technique has the potential to map more accurately the contour of the artery, and to analyze plaque surface charac- teristics, including ulceration (Fig. 16; see also Color Plate VI, Fig. 45). This approach also offers a more accurate rendition of sharp bends, turns, and kinks within the arterial lumen. Relative to using injected contrast
agents, digitally encoded image enhancement is simpler to use, and adds minimal cost to the study.
SUMMARY
This article provides an overview of basic diagnostic carotid ultrasound applications, and emphasizes practical aspects of this ex- amination. Areas currently being investigated include carotid plaque characterization and applications relative to IMT measurements. Contrast-enhanced ultrasound imaging also offers promise to improve plaque character- ization, which in turn may link these evalua- tions to outcome studies.
Figure 16. A, This color Doppler image shows an area of increased velocity and diffuse stenosis. The zone of blue signal (arrow) was thought to possibly represent an ulcer. (See also Color Plate VI, Fig. 45.) B, The corresponding contrast-enhanced image better delineates the contour of the lumen. Although irregularities are apparent, luminal defects are not obvious. The zone of reversed signals in A is likely caused by flow reversal around a stenotic jet.
CAROTID ULTRASOUND 587
References 20. Criswell BK, Langsfeld M, Tullis MJ, et al: Evaluatina institutional variibility of duplex scanning in the d g tection of carotid artery stenosis. Am J Surg 176:591,
1. AbuRahma AF, Pollack JA, Robinson PA, et al: The 1 OOQ 117"
reliability of color duplex ultrasound in diagnosing total carotid artery occlusion. Am J Surg 174:185,1997
2. Ambrose JA, Tannenbaum MA, Alexopoulos D, et al:
and the development of myocardial infarction. J Am Coll Cardiol 12:56, 1988
carotid endarterectomy in patients with symptomatic moderate or severe stenosis. North American Symp- tomatic Carotid Endarterectomy Trial Collaborators [see comments]. N Engl J Med 339:1415, 1998
4. Barnett HJM, Warlow CP: Carotid endarterectomy and the measurement of stenosis. Stroke 24:1281,
21, ~ ~ i ~ l ~ RJ, Stavros AT, L~~ M: Overestimation of velocity and frequency values by multielement linear array Dopplers. J Vasc Techno1 14:206, 1990
nary-artery lesions in sudden cardiac ischaemic death. N Engl J Med 3101137,1984
ing for asymptomatic carotid atherosclerotic disease. Stroke 271944,1996
24. Droste Dw, Jurgens R, x, et al: Echo con- trast-enhanced ultrasound of extracranial internal ca- rotid artery high-grade stenosis and occlusion. Stroke 30:2302, 1999
hgiographic progression Of coronary artery disease 22. Davies MJ, Thomas A: Thrombosis and acute core-
3. Barnett HJ, Taylor Dw, E1iasziw M~ et al: Benefit of 23. Derdep Cp, Powers WJ: Cost-effectiveness of screen-
_I on" 1YY5 25. Elgersma OE, Buijs PC, Wust AF, et al: Maximum
internal carotid arterial stenosis: Assessment with ro- tational angiography versus conventional intraarter- ial digital subtraction angiography. Radiology 213:777, 1999
26. Elgersma OE, van Leeuwen MS, Meijer R, et al: Lu- men reduction measurements of the internal carotid
5. Barry CD, Allott CP, John NW, et al: Three-dimen- sional freehand ultrasound: Image reconstruction and volume analysis. Ultrasound Med Biol 23:1209, 1997
6. Baxter GM, Polak J: Variance mapping in colour flow imaging: What does it measure? clin Radial 49:262, ,on" 1774
7. Berman SS, Devine JJ, Erdoes LS, et al: Distinguishing carotid artery pseudo-occlusion with color-flow Doppler. Stroke 26:434,1995
8. Bluth EI, McVay LVD, Merritt CR, et al: The identifi- cation of ulcerative plaque with high resolution du- plex carotid scanning. J Ultrasound Med 773, 1988
9. Bluth EI, Stavros AT, Marich KW, et al: Carotid du- plex sonography: A multicenter recommendation for standardized imaging and Doppler criteria. Radio- graphics 8:487, 1988
10. Bots ML, Breslau PJ, Briet E, et al: Cardiovascular determinants of carotid artery disease: The Rotter- dam elderly study. Stroke 19:717, 1992
11. Bots ML, Hoes AW, Koudstaal PJ, et al: Common carotid intima-media thickness and risk of stroke and myocardial infarction: The Rotterdam Study. Circula- tion 96:1432,1997
12. Busuttil SJ, Franklin DP, Youkey JR, et al: Carotid duplex overestimation of stenosis due to severe con- tralateral disease. Am J Surg 172:144, 1996
13. Carpenter JP, Lexa FJ, Davis JT: Determination of sixty percent or greater carotid artery stenosis by duplex Doppler ultrasonography. J Vasc Surg 22:697, 1995
14. Carpenter TP, Lexa FT, Davis TT Determination of
15
16.
17.
18.
19.
du6lex Doppler ultrasound criteria appropriate to the North American Symptomatic Carotid Endarter- ectomy Trial. Stroke 27695, 1996 Chambless LE, Heiss G, Folsom AR, et a1 Association of coronary heart disease incidence with carotid arte- rial wall thickness and major risk factors: The Athero- sclerosis Risk in Communities (ARIC) Study, 1987- 1993. Am J Epidemiol 146:483, 1997 Chen JC, Salvian AJ, Taylor DC, et al: Predictive ability of duplex ultrasonography for internal carotid artery stenosis of 70%-99%: A comparative study, Ann Vasc Surg 12:244, 1998 Chat M, Lane CT, Pham H, et al: Helical CT angiog- raphy in the preoperative evaluation of carotid artery stenosis. J Vasc Surg 28:290, 1998 Comerota AJ, Cranley JJ, Cook SE: Real-time B-mode carotid imaging in diagnosis of cerebrovascular dis- ease. Surgery 89:718, 1981 Constantinides I? Plaque fissures in human coronary thrombosis. J Atheroscler Res 6:1, 1966
artery before and after Levovist enhancement Repro- ducibility and agreement with angiography. J Ultra- sound Med 18191,1999
27. Eliasziw M, Fox AJ, Sharpe BL, et al: Carotid artery stenosis: External validity of the North American Symptomatic Carotid Endarterectomy Trial measure- ment method. Radiology 204:229, 1997
28. Eliasziw M, Rankin RN, Fox AJ, et al: Accuracy and prognostic consequences of ultrasonography in iden- tifying severe carotid artery stenosis. Stroke 263747, 1995
29. Eliasziw M, Streifler J, Fox A, et al: Significance of plaque ulceration in symptomatic patients with high- grade carotid stenosis. North American Symptomatic Carotid Endarterectomy Trial. Stroke 25:304, 1994
30. Erdoes LS, Marek JM, Mills JL, et al: The relative contributions of carotid duplex scanning, magnetic resonance angiography, and cerebral arteriography to clinical decision making: A prospective study in patients with carotid occlusive disease. J Vasc Surg 23:950, 1996
31. European Carotid Surgery Trialists' Collaborative Group. Endarterectomy for moderate symptomatic carotid stenosis: Interim results from the MRC Euro- pean Carotid Surgery Trial [see comments]. Lancet 3471591, 1996
32. European Carotid Surgery Trialists' Collaborative Group: MRC European Carotid Surgery Trial Interim results for symptomatic patients with severe (70- 99%) or with mild (0-29%) carotid stenosis. Lancet 3371235, 1991
33. Executive Committee for the Asymptomatic Carotid Atherosclerosis Study: Endarterectomy for asymp- tomatic carotid artery stenosis. JAMA 273:1421, 1995
34. Faught WE, Mattos MA, van Bemmelen PS, et al: Color-flow duplex scanning of carotid arteries: New velocity criteria based on receiver operator character- istic analysis for threshold stenoses used in the symp- tomatic and asymptomatic carotid trials. J Vasc Surg 19:818, 1994
35. Fillinger MF, Baker RJ Jr, Zwolak RM, et al: Carotid duplex criteria for a 60% or greater angiographic stenosis: Variation according to equipment. J Vasc Surg 24:856, 1996
36. Grant EG, Duerinckx AJ, El Saden S, et a1 Doppler
588 POLAK
sonographic parameters for detection of carotid ste- nosis: Is there an optimum method for their selec- tion? AJR Am J Roentgenol 1721123, 1999
37. Gray-Weale AC, Graham JC, Bumett JR, et al: Carotid artery atheroma: Comparison of preoperative B- mode ultrasound appearance with carotid endarter- ectomy specimen-pathology. J Cardiovasc Surg 29:676, 1988
38. Greenland P, Abrams J, Aurigemma GP, et al: Preven- tion Conference V: Beyond secondary prevention: Identifying the high-risk patient for primary preven- tion: Noninvasive tests of atherosclerotic burden: Writing Group 111. Circulation 101:E16, 2000
39. Grubb RL Jr, Derdeyn CP, Fritsch SM, et a1 Impor- tance of hemodynamic factors in the prognosis of symptomatic carotid occlusion. JAMA 280:1055,1998
40. Hetzel A, Eckenweber B, Trummer B, et a1 Colour- coded duplex sonography of preocclusive carotid ste- noses. Eur J Ultrasound 8183, 1998
41. Hodis HN, Mack WJ, Barth J: Carotid intima-media thickness as a surrogate end point for coronary artery disease [letter; comment]. Circulation 942311, 1996
42. Hood DB, Mattos MA, Mansour A, et a1 Prospective evaluation of new duplex criteria to identify 70% internal carotid artery stenosis. J Vasc Surg 23:254, 1996
43. Howard G, Baker WH, Chambless LE, et al: An ap- proach for the use of Doppler ultrasound as a screen- ing tool for hemodynamically significant stenosis (de- spite heterogeneity of Doppler performance). A multicenter experience. Asymptomatic Carotid Ath- erosclerosis Study Investigators. Stroke 271951, 1996
44. Howard G, Chambless LE, Baker WH, et al: A multicenter study of Doppler ultrasound versus angi- ography. J Stroke Cerebrovasc Dis 1:166, 1991
45. Hunink MGM, Polak JF, Barlan MM, et al: Detection and quantification of carotid artery stenosis: Efficacy of various Doppler velocity parameters. AJR Am J Roentgenol 160:619, 1993
46. Jackson MR, Chang AS, Robles HA, et al: Determina- tion of 60% or greater carotid stenosis: A prospective comparison of magnetic resonance angiography and duplex ultrasound with conventional angiography. Ann Vasc Surg 12:236, 1998
47. Kent KC, Kuntz KM, Pate1 MR, et al: Perioperative strategies for carotid endarterectomy: An analysis of morbidity and cost-effectiveness in symptomatic pa- tients. JAMA 274:888, 1995
48. Kuller LH, Shemanski L, Psaty BM, et a1 Subclinical disease as an independent risk factor for cardiovascu- lar disease. Circulation 92720, 1995
49. Kuntz KM, Polak JF, Whittemore AD, et al: Duplex ultrasound criteria for the identification of carotid stenosis should be laboratory specific. Stroke 28:597, 1997
50. Kuntz KM, Skillman JJ, Whittemore AD, et a1 Ca- rotid endarterectomy in asymptomatic patients: Is contrast angiography necessary? A morbidity analy- sis. J Vasc Surg 22:706, 1995
51. Lee DH, Gao FQ, Rankin RN, et a1 Duplex and color Doppler flow sonography of occlusion and near occlusion of the carotid artery. AJNR Am J Neurora- diol 171267, 1996
52. Lee TT, Solomon NA, Heidenreich PA, et a1 Cost- effectiveness of screening for carotid stenosis in asymptomatic persons [see comments]. Ann Intem Med 126337, 1997
53. Lee VS. Hertzbere BS. Workman MI. et al: Variabilitv
rotid artery: Effects on estimates of internal carotid arterial stenosis in patients with angiographically proved disease. Radiology 214387, 2000
54. Lusby RJ, Ferrell LD, Ehrenfeld WK, et al: Carotid plaque hemorrhage: Its role in production of cerebral ischemia. Arch Surg 1171479, 1982
55. Mannami T, Konishi M, Baba S, et a1 Prevalence of asymptomatic carotid atherosclerotic lesions detected by high-resolution ultrasonography and its relation to cardiovascular risk factors in the general popula- tion of a Japanese city: The Suita Study. Stroke 28:518, 1997
56. Meyer JI, Khalil RM, Obuchowski NA, et a1 Com- mon carotid artery: Variability of Doppler US velocity measurements. Radiology 204:339, 1997
57. Moneta GL, Edwards JM, Chitwood RW, et a1 Corre- lation with North American Symptomatic Carotid Endarterectomy Trial (NASCET) angiographic defi- nition of 70% to 99% internal carotid artery stenosis with duplex scanning. J Vasc Surg 17152, 1993
58. Moneta GL, Edwards JM, Papanicolaou G, et al: Screening for asymptomatic internal carotid artery stenosis: Duplex criteria for discriminating 60% to 99% stenosis. J Vasc Surg 21:989, 1995
59. Morgenstern LB, Fox AJ, Sharpe BL, et al: The risks and benefits of carotid endarterectomy in patients with near occlusion of the carotid artery. North American Symptomatic Carotid Endarterectomy Trial (NASCET) Group. Neurology 48:911, 1997
60. Neale ML, Chambers JL, Kelly AT, et al: Reappraisal of duplex criteria to assess significant carotid stenosis with special reference to reports from the North American Symptomatic Carotid Endarterectomy Trial and the European Carotid Surgery Trial. Stroke 20642,1994
61. North American Symptomatic Carotid Endarterec- tomy Trial Collaborators: Beneficial effect of carotid endarterectomy in symptomatic patients with high- grade stenosis. N Engl J Med 325:445, 1991
62. North American Symptomatic Carotid Endarterec- tomy Trial (NASCET) Steering Committee. North American Symptomatic Carotid Endarterectomy Trial. Methods, patient characteristics, and progress. Stroke 22711, 1991
63. Obuchowski NA, Modic MT, Magdinec M, et a1 As- sessment of the efficacy of noninvasive screening for patients with asymptomatic neck bruits. Stroke 28:1330, 1997
64. ODonnell TF, Erdoes L, Mackey WC, et al: Correla- tion of B-mode ultrasound imaging and arteriogra- phy with pathologic findings at carotid endarterec- tomy. Arch Surg 120:443, 1985
65. OLeary DH, Holen J, Ricotta JJ, et al: Carotid bifurca- tion disease: Prediction of ulceration with B-mode US. Radiology 162:523, 1987
66. OLeary DH, Polak JF, Kronmal RA, et al: Carotid- artery intima and media thickness as a risk factor for myocardial infarction and stroke in older adults. Cardiovascular Health Study Collaborative Research Group. N Engl J Med 340:14, 1999
67. OLeary DH, Polak JF, Kronmal RA, et al: Distribu- tion and correlates of sonographically detected ca- rotid artery disease in the Cardiovascular Health Study. The CHS Collaborative Research Group. Stroke 23:1752,1992
68. 0 Leary DH, Polak JF, Wolfson SK Jr, et al: Use of sonography to evaluate carotid atherosclerosis in the
1
- 2 , elderly. -?'he Cardiovascular Health Study. CHS Col- laborative Research Group. Stroke 223155, 1991 of Doppler US measurements along the common ca-
CAROTID ULTRASOUND 589
69. Picot PA, Rickey DW, Mitchell R, et ak Three-dimen- sional colour Doppler imaging. Ultrasound Med Biol 19:95, 1993
70. Pignoli P, Tremoli E, Poli A, et al: Intimal plus medial thickness of the arterial wall A direct measurement with ultrasound imaging. Circulation 741399,1986
71. Polak JF, Dobkin GR, OLeary DH, et a1 Internal carotid artery stenosis: Accuracy and reproducibility of color-Doppler-assisted duplex imaging. Radiology 173:793, 1989
72. Polak JF, OLeary DH, Kronmal RA, et al: Sono- graphic evaluation of carotid artery atherosclerosis in the elderly: Relationship of disease severity to stroke and transient ischemic attack. Radiology 188:363, 1993
73. Polak JF, Shemanski L, OLeary DH, et al: Hypo- echoic plaque at US of the carotid artery: An inde- pendent risk factor for incident stroke in adults aged 65 years or older. Cardiovascular Health Study [pub- lished erratum appears in Radiology 209:288, 19981. Radiology 208649, 1998
74. Poli A, Tremoli E, Colombo A, et al: Ultrasonographic measurement of the common carotid artery wall thickness in hypercholesterolemic patients: A new model for the quantitation and follow-up of preclini- cal atherosclerosis in living human subjects. Athero- sclerosis 70253, 1988
75. Pretorius DH, Nelson TR, Jaffe JS: 3-dimensional so- nographic analysis based on color flow Doppler and gray scale image data: A preliminary report. J Ultra- sound Med 11:225, 1992
76. Ranke C, Creutzig A, Becker H, et al: Standardization of carotid ultrasound: A hemodynamic method to normalize for interindividual and interequipment variability. Stroke 30:402, 1999
77. Remonda L, Heid 0, Schroth G: Carotid artery steno- sis, occlusion, and pseudo-occlusion: First-pass, gad- olinium-enhanced, three-dimensional MR angiogra- phy-preliminary study [see comments]. Radiology 209:95,1998
78. Robbin ML, Lockhart ME, Weber TM, et al: Carotid artery stents: Early and intermediate follow-up with Doppler US [see comments]. Radiology 205:749, 1997
79. Rothwell PM, Gibson RJ, Slattery J, et al: Prognostic value and reproducibility of measurements of carotid stenosis. A comparison of three methods on 1001
angiograms. European Carotid Surgery Trialists' Col- laborative Group. Stroke 252440,1994
80. Rothwell PM, Gibson RJ, Villagra R, et a1 The effect of angiographic technique and image quality on the reproducibility of measurement of carotid stenosis and assessment of plaque surface morphology. Clin Radio1 53:439, 1998
81. Salonen R, Salonen J: Determinants of carotid intima- media thickness: A population-based ultrasonogra- phy study. J Intern Med 229:225, 1991
82. Salonen R, Seppanen K, Rauramaa R, et a1 Preva- lence of carotid atherosclerosis and serum cholesterol levels in eastern Finland. Arteriosclerosis 8:788, 1988
83. Schwartz SW, Chambless LE, Baker WH, et al: Con- sistency of Doppler parameters in predicting arterio- graphically confirmed carotid stenosis. Asymptom- atic Carotid Atherosclerosis Study Investigators. Stroke 28:343, 1997
84. Spadone DP, Barkmeier LD, Hodgson KJ, et al: Con- tralateral internal carotid artery stenosis or occlusion: Pitfall of correct ipsilateral classification-a study performed with color flow imaging. J Vasc Surg 11:642, 1990
85. Spencer MP, Reid JM Quantitation of carotid stenosis with continuous-wave (C-W) Doppler ultrasound. Stroke 10:326, 1979
86. Steinke W, Hennerici M, Rautenberg W, et al: Symp- tomatic and asymptomatic high-grade carotid steno- ses in Doppler color-flow imaging. Neurology 42131,1992
87. Steinke W, Kloetzsch C, Hennerici M Carotid artery disease assessed by color Doppler flow imaging: Cor- relation with standard Doppler sonography and an- giography. AJR Am J Roentgen01 1541061,1990
88. Streifler JY, Eliasziw M, Fox AJ, et a1 Angiographic detection of carotid plaque ulceration: Comparison with surgical observations in a multicenter study. North American Symptomatic Carotid Endarterec- tomy Trial. Stroke 25:1130, 1994
89. Widder B, Paulat K, Hackspacher J, et a1 Morpholog- ical characterization of carotid artery stenoses by ul- trasound duplex scanning. Ultrasound Med Biol 16549,1990
90. Yao J, van Sambeek MR, Dall'Agata A, et al: Three- dimensional ultrasound study of carotid arteries be- fore and after endarterectomy: Analysis of stenotic lesions and surgical impact on the vessel. Stroke 29:2026. 1998
Address reprint requests to Joseph F. Polak, MD, MPH
Department of Radiology Brigham and Women's Hospital
75 Francis Street Boston, MA 02115