Carolina Sunrock, LLC. – Prospect Hill Quarry and ...
30
Carolina Sunrock, LLC. – Prospect Hill Quarry and Distribution Center Draft Environmental Justice Report North Carolina Department of Environmental Quality August 9, 2021
Transcript of Carolina Sunrock, LLC. – Prospect Hill Quarry and ...

Carolina Sunrock, LLC. – Prospect Hill Quarry and Distribution Center
Draft Environmental Justice Report
North Carolina Department of Environmental Quality August 9, 2021

DRAFT Environmental Justice Report Carolina Sunrock, LLC. – Prospect Hill Quarry and Distribution Center
August 9, 2021
P a g e | 2
Contents 1 Introduction .......................................................................................................................................................4
2 Environmental Justice Evaluation .................................................................................................................4
3 Proposed Project .............................................................................................................................................5
4 Geographic Area ..............................................................................................................................................6
5 Regional and Local Settings ..........................................................................................................................8
5.1 Race and Ethnicity ........................................................................................................................................9
Regional Setting ...............................................................................................................................................9
Local Setting .....................................................................................................................................................9
5.2 Age and Sex ................................................................................................................................................ 11
Regional Setting ............................................................................................................................................ 11
Local Setting .................................................................................................................................................. 12
5.3 Disability ...................................................................................................................................................... 13
Regional Setting ............................................................................................................................................ 13
Local Setting .................................................................................................................................................. 16
5.4 Poverty ......................................................................................................................................................... 18
Regional Setting ............................................................................................................................................ 18
Local Setting .................................................................................................................................................. 21
5.5 Household Income ..................................................................................................................................... 23
Regional Setting ............................................................................................................................................ 23
Local Setting .................................................................................................................................................. 23
Per Capita Income ........................................................................................................................................ 25
6 Limited English Proficiency (LEP) .............................................................................................................. 25
7 County Health ................................................................................................................................................ 27
8 Local Sensitive Receptors ........................................................................................................................... 28
9 Local Industrial Sites .................................................................................................................................... 29
10 Conclusion ................................................................................................................................................. 30
Figure 1. Quarry and Distribution Center facility location with one-mile radius. ............................ 6 Figure 2. Census tracts surrounding the facility location. .................................................................. 7 Figure 3. County Health Rankings for Health Factors in North Carolina provided by University of Wisconsin Public Health Institute. ................................................................................................... 27 Figure 4. Sensitive receptors surrounding Quarry and Distribution Center .................................. 28

DRAFT Environmental Justice Report Carolina Sunrock, LLC. – Prospect Hill Quarry and Distribution Center
August 9, 2021
P a g e | 3
Figure 5. Permitted facilities and incidents with the one-mile radius surrounding the Quarry and Distribution Center. ................................................................................................................................ 29 Table 2. Prospect Hill Quarry and Distribution Center Facility Emissions Overview .................... 5 Table 2. Regional Setting - Race and Ethnicity ................................................................................... 9 Table 3. Local Setting: Quarry and Distribution Center – Race and Ethnicity .............................. 10 Table 4. Regional Setting- Age Groups and Sex .............................................................................. 11 Table 5. Local Setting- Age Groups and Sex .................................................................................... 12 Table 6. Project Radius- Age Groups and Sex ................................................................................. 13 Table 7. Regional Setting- Disability ................................................................................................... 14 Table 8. Regional Setting- Disability cont’d ....................................................................................... 15 Table 9. Local Setting- Disability ......................................................................................................... 17 Table 10. Regional Setting- Poverty ................................................................................................... 19 Table 11. Regional Setting- Poverty cont’d ........................................................................................ 20 Table 12. Local Setting- Poverty .......................................................................................................... 22 Table 13. Regional Setting- Household Income ................................................................................ 23 Table 14. Local Setting- Household Income ...................................................................................... 24 Table 19. Project Radius- Household Income ................................................................................... 24 Table 16. Per Capita Income ................................................................................................................ 25 Table 17. Limited English Proficiency ................................................................................................. 26 Table 18. Health Outcomes .................................................................................................................. 27

DRAFT Environmental Justice Report Carolina Sunrock, LLC. – Prospect Hill Quarry and Distribution Center
August 9, 2021
P a g e | 4
1 Introduction Environmental justice is the fair treatment and meaningful involvement of all people regardless of race, color, national origin, or income, with respect to the development, implementation, and enforcement of environmental laws, regulations, and policies (US EPA). This evaluation examines the demographic and environmental conditions in Caswell and Person Counties, census tracts 9306 and 9206.01, and the one-mile radius around the property boundary of the proposed Carolina Sunrock, LLC. – Quarry and Distribution Center facility. Finally, the demographics of the entire state of North Carolina are also considered as they compare to both the county and local census tract and radius settings.
An Environmental Justice (EJ) Snapshot was prepared in August 2020, at the beginning of the previous application process. The EJ Snapshot was distributed to interested community members (if known) and published on the DEQ website with the relevant permit application. The purpose of the EJ Snapshot was to encourage comments and suggestions from the surrounding community, industry, and environmental groups throughout the comment period at that time. The public hearing and accompanying comment period was extended three times in 2020 due to COVID-19, community concerns, and inclement weather. Carolina Sunrock LLC did not receive a permit from the Division of Air Quality in 2020, so has reapplied for a similar permit. Public comments will be considered throughout the remainder of the comment period to inform the final version of this EJ Report.
2 Environmental Justice Evaluation The Department has assessed the permit applications and the potential impact on communities surrounding the sites associated with the requested permit applications. Carolina Sunrock LLC. submitted two separate permit applications for two locations. This Draft EJ Report only includes information regarding the Quarry and Distribution Center Facility. Please review the accompanying Draft EJ Report for information on the Burlington North Facility. Accordingly, the Draft EJ Report will include:
• The permit application submitted by Carolina Sunrock, LLC for the Quarry and Distribution Center
• Facility emissions overview • Study of area demographics (determined by utilizing the US EPA Environmental Justice
tool (EJSCREEN) https://ejscreen.epa.gov/mapper/ and current, available census data. https://data.census.gov/cedsci/ )
• Comparison of local area demographics to both county and statewide census data • County health assessment for all counties • Sensitive receptors surrounding the facility • Local industrial sites surrounding the facility (using the NCDEQ Community Mapping
System https://ncdenr.maps.arcgis.com/apps/webappviewer/index.html?id=1eb0fbe2bcfb4cccb3cc212af8a0b8c8).
Demographics for Caswell and Person counties, as well as the state, will be compared to the local level data (census tracts and project radius) to identify any disparities surrounding the project area. Using standard environmental justice guidelines from the EPA and National

DRAFT Environmental Justice Report Carolina Sunrock, LLC. – Prospect Hill Quarry and Distribution Center
August 9, 2021
P a g e | 5
Environmental Policy Act (NEPA) documentation, the following conditions will be flagged as potentially underserved communities:
• 10% or more in comparison to the county or state average
• 50% or more minority
• 5% or more in comparison to the county or state average for poverty
3 Proposed Project Carolina Sunrock, LLC. has submitted permit applications for two proposed sites in Caswell County, North Carolina. One is a hot mix asphalt and concrete batch plant, while the other is a quarry, hot mix asphalt plant, concrete batch plant, and distribution center. They are located approximately nine miles apart from each other. This Draft EJ Report only includes information regarding the Quarry and Distribution Center Facility. Please review the accompanying Draft EJ Report for information on the Burlington North Facility.
The proposed site of Carolina Sunrock LLC-Prospect Hill Quarry and Distribution Center, will include a rock quarry with associated stone processing equipment, hot mix asphalt plant, and concrete batch plant. The site also includes diesel and propane/natural gas-fired reciprocating internal combustion engine (RICEs) to power site equipment. The proposed quarry will include crushing, conveying and screening equipment, to be controlled by wet suppression. The proposed asphalt plant will include a 250 tons per hour maximum capacity drum-type dryer/mixer with an 80 million BTU per hour maximum heat input capacity burner capable of combusting propane, natural gas, No. 2/4 fuel oils, and recycled No. 2 fuel oil. Particulate matter emissions from the mixer will be controlled by a bagfilter. The plant will include 5 hot mix asphalt storage silos, asphalt truck loadouts, and a Recycled Asphalt Pavement (RAP) crushing, screening and conveying system. Primary site power will be provided by three natural/gas propane-fired generators equipped with catalytic oxidation systems. Additional diesel engines will provide mechanical energy for quarry equipment. Potential emissions of criteria and hazardous air pollutants (after emissions controls and permit limits are taken into account) are shown in Table 2.1
Table 1. Prospect Hill Quarry and Distribution Center Facility Emissions Overview
Pollutant Potential Emissions (with controls and permit limits, tons/year)
PM 113.73 PM10 41.92 PM2.5 13.63 SO2 25.27 NOx 45.26 CO 99.38
VOC 43.93 HAPTotal 4.08
HAPHighest (Formaldehyde) 0.956
1 Accurate as of August 6, 2021. Values may change due to modifications to the permit throughout the permitting process.

DRAFT Environmental Justice Report Carolina Sunrock, LLC. – Prospect Hill Quarry and Distribution Center
August 9, 2021
P a g e | 6
4 Geographic Area The proposed facility, Carolina Sunrock LLC- Prospect Hill Quarry and Distribution Center, is located at 1238 Wrenn Road Prospect Hill, NC 27314 (Figure 1). The highest off-site ambient air impacts will occur at the plant fence line. A one-mile radius was used to evaluate the local demographics and socioeconomics of the surrounding community and help inform public outreach efforts.
Figure 1. Quarry and Distribution Center facility location with one-mile radius.
The proposed facility would be located in Caswell County. Caswell County is designated as a Tier 1 county by the NC Department of Commerce. The one-mile buffer surrounding the Quarry and Distribution Center includes land in Person County, which is designated as Tier 2 county. According to the Department of Commerce, Tier 1 counties encompass the 40 most distressed counties based on average unemployment rate, median household income, percentage growth in population, and adjusted property tax per capita. Tier 2 counties encompass the next 40 counties based on this ranking system.
The one-mile radius used in this analysis is encompassed by two census tracts. The facility site is located in Census Tract 9306 in Caswell County. The one-mile buffer for the Quarry and Distribution Center enters Census Tract 9206.01 in Person County (Figure 2). Census tracts are small, relatively permanent statistical subdivisions of a county with a unique numeric code (US Census Bureau). None of the census tracts analyzed fall within a state designated tribal statistical area for this location.

DRAFT Environmental Justice Report Carolina Sunrock, LLC. – Prospect Hill Quarry and Distribution Center
August 9, 2021
P a g e | 7
Figure 2. Census tracts surrounding the facility location.

DRAFT Environmental Justice Report Carolina Sunrock, LLC. – Prospect Hill Quarry and Distribution Center
August 9, 2021
P a g e | 8
5 Regional and Local Settings The following sections on race and ethnicity, age and sex, disability, poverty, household income, and Limited English Proficiency (LEP) populations are based on US Census Bureau data, first at a state and county level (regional setting), and then at a census tract and project radius level (local setting). The surrounding census tracts included are those that overlap into the one-mile radius. Demographics of the counties will be compared to the local level data to identify any disparities surrounding the project area. Using standard environmental justice guidelines from the EPA and NEPA documentation, the following conditions will be flagged as potentially underserved communities:
1. 10% or more in comparison to the county or state average 2. 50% or more minority 3. 5% or more in comparison to the county or state average for poverty
For example, if a census tract has 35% of the population classified as low income but the county consists of 30% low income, the census tract would exceed the county average by 16.7% and thus be flagged as a potential area of concern. For this report, census data from 2010 and census data estimates from 2011-2015 and 2013-2017 were used. 2010 Census Bureau data is real data gathered every ten years, whereas the estimates from the more recent years are modeled based on the real data. For the data gathered from the 2013-2017 and 2011-2015 estimates, the margin of error (MOE) has been included. This value is a measure of the possible variation of the estimate around the population value (US Census Bureau). The Census Bureau standard for the MOE is at the 90% confidence level and may be any number between 0 and the MOE value in either direction (indicated by +/-).

DRAFT Environmental Justice Report Carolina Sunrock, LLC. – Prospect Hill Quarry and Distribution Center
August 9, 2021
P a g e | 9
5.1 Race and Ethnicity Regional Setting According to the 2010 US Census Data Table 9: Hispanic or Latino, and Not Hispanic or Latino By Race, North Carolina’s population totaled 9,535,483 individuals (Table 2). The three most common racial groups across the state were White (68.5%), Black or African American (21.5%) and Hispanic or Latino (of any race) at 8.4%.
Caswell County had a total population of 23,719 individuals (Table 2). Person County had a total population of 39,464 individuals. The three most common racial or ethnic groups within both counties were White (62.5% and 68.3%), Black or African American (33.8% and 27.0), and Hispanic or Latino (3.1% and 4.0%). In Caswell County and Person County, the Black or African American Population (33.8% in Caswell, 27.0% in Person) were greater than 10% different when compared to the state (21.5%).
Table 2. Regional Setting - Race and Ethnicity
Race and Ethnicity North Carolina Caswell County Person County
Number Percent Number Percent Number Percent Total Population 9,535,483 100 23,719 100.0 39,464 100.0 White 6,528,950 68.5 14,819 62.5 26,968 68.3 Black or African American 2,048,628 21.5 8,020 33.8 10,646 27.0 American Indian or Alaska Native 122,110 1.3 85 0.4 266 0.7 Asian 208,962 2.2 60 0.3 116 0.3 Native Hawaiian and Other Pacific Islander 6,604 0.1 4 0.0 4 0.0 Some other Race 414,030 4.3 350 1.5 868 2.2 Two or More Races 206,199 2.2 381 1.6 596 1.5 HISPANIC OR LATINO (of any race) 800,120 8.4 744 3.1 1,593 4.0 Mexican 486,960 5.1 607 2.6 1,195 3.0 Puerto Rican 71,800 0.8 42 0.2 94 0.3 Cuban 18,079 2.3 17 0.1 33 0.1 Other Hispanic or Latino 223,281 2.3 78 0.3 271 0.7 Source: US Census Bureau, 2010 Census All bolded and orange cells indicate a difference that is greater than 10% when compared to the State
Local Setting According to the 2010 US Census Data Table 9: Hispanic or Latino, and Not Hispanic or Latino By race or ethnicity, the largest population within Census Tract 9306 in Caswell County was White at 70.3%, followed by Black or African American at 25.8%, and Hispanic or Latino at 3.2%. The Black or African American population (25.8%) was greater than 10% different compared to the state (21.5%). The largest population within Census Tract 9206.01 in Person County was White at 68.5%, followed by Black or African American at 24.2% and Hispanic or Latino at 8.0%. The population of Some other Race (5.3%) was greater than 10% different when compared to both the county (2.2%) and the state (4.3%).

DRAFT Environmental Justice Report Carolina Sunrock, LLC. – Prospect Hill Quarry and Distribution Center
August 9, 2021
P a g e | 10
The largest population in the one-mile radius surrounding the Quarry and Distribution Center was White at 81.0% (which is greater than 10% when compared to the state at 68.5%), followed by Black or African American (15.0%) and Hispanic (3.0%) (Table 3).
Table 3. Local Setting: Quarry and Distribution Center – Race and Ethnicity
Project Area-1 Mile
Census Tract 9306
Caswell County Census Tract 9206.01
Person County Race and Ethnicity Number Percent Number Percent Number Percent Total Population 183 100.0 4,790 100.0 5,133 100.0 White 149 81.0 3,367 70.3 3,518 68.5 Black or African American 27 15.0 1,238 25.8 1,243 24.2 American Indian or Alaska Native 0 0.0
20 0.2 25 0.5
Asian 0 0.0 8 0.2 6 0.1 Native Hawaiian and Other Pacific Islander 0 0.0
0 0.0 0 0.0
Some other Race 4 2.0 84 1.8 270 5.3 Two or More Races 2 1.0 73 1.5 71 1.4 HISPANIC OR LATINO (of any race) 6 3.0
151 3.2 413 8.0
Mexican 113 2.4 360 7.0 Puerto Rican 17 0.4 13 0.3 Cuban 0 0.0 2 0.0 Other Hispanic or Latino 21 0.4 38 0.7 Source: US Census Bureau, 2010 Census All bolded and orange cells indicate a difference that is greater than 10% when compared to the State All bolded and blue cells indicate a difference that is greater than 10% when compared to the county and the State

DRAFT Environmental Justice Report Carolina Sunrock, LLC. – Prospect Hill Quarry and Distribution Center
August 9, 2021
P a g e | 11
5.2 Age and Sex Regional Setting According to the 2010 US Census Data Table P 12: Sex by Age, North Carolina had a total population of 9,535,483 individuals (Table 4). The largest percentage of the total state population (63.1%) was between the ages of 18 and 64, followed by under 18 years (23.93%), and 65 years and older (12.94%).
Caswell County has a total population of 23,719 individuals. The largest percentage of the total population (63.56%) was between the ages of 18 and 64, followed by under 18 years (20.61%) and 65 years and older (15.83%). Person County has a total population of 39,464 individuals. The largest percentage of the total population (61.72%) was between the ages of 18 and 64, followed by under 18 years (23.09%) and 65 years and older (15.19%). In both counties, for both male and female subgroups, as well as the population overall, the populations of 65 years and older is greater than 10% different when compared to the state.
Table 4. Regional Setting- Age Groups and Sex
Subject North Carolina Caswell County Person County
Number Percent Number Percent Number Percent Total Population: 9,535,483 100 23,719 100 39,464 100 Under 5 years: 632,040 6.63 1,181 4.98 2,369 6
Under 18 years: 2,281,635 23.93 4,889 20.61 9,114 23.09 18 to 64 years: 6,019,769 63.13 15,075 63.56 24,357 61.72
65 years and older: 1,234,079 12.94 3,755 15.83 5,993 15.19 Male: 4,645,492 100 12,074 100 19,137 100
Under 5 years: 322,871 6.95 602 4.99 1,186 6.2 Under 18 years: 1,167,303 25.13 2,537 21.01 4,662 24.36 18 to 64 years: 2,954,233 63.59 7,935 65.72 11,946 62.42
65 years and older: 523,956 11.28 1,602 13.27 2,529 13.22 Female: 4,889,991 100 11,645 100 20,327 100
Under 5 years: 309,169 6.32 579 4.97 1,183 5.82 Under 18 years: 1,114,332 22.79 2,352 20.2 4,452 21.9 18 to 64 years: 3,065,536 62.69 7,140 61.31 12,411 61.06
65 years and older: 710,123 14.52 2,153 18.49 3,464 17.04 Source: US Census Bureau, 2010 Census All bolded and orange cells indicate a difference that is greater than 10% when compared to the State

DRAFT Environmental Justice Report Carolina Sunrock, LLC. – Prospect Hill Quarry and Distribution Center
August 9, 2021
P a g e | 12
Local Setting According to the 2010 US Census Data Table P 12: Sex by Age, Census Tract 9306 had a total population of 4,790 individuals (Table 5). The largest percentage of the total population (62.78%) was between the ages of 18 and 64, followed by under 18 years (20.63%), and 65 years and older (16.60%). The total population, as well as the female subgroup have a population of 65 years and older that is greater than 10% different than the state. The male subgroup has a population of 65 years and older that is greater 10% different than the county and the state.
Census Tract 9206.01 had a total population of 5,133 individuals. The largest percentage of the total population (60.84%) was between the ages of 18 and 64, followed by under 18 years (23.51%), and 65 years and older (15.64%). The total population, as well as the male and female subgroups have a population of 65 years and older that is greater than 10% different than the state.
Table 5. Local Setting- Age Groups and Sex
Subject Census Tract 9306,
Caswell County Census Tract 9206.01
Person County Number Percent Number Percent
Total Population: 4,790 100 5,133 100 Under 5 years: 246 5.14 365 7.11
Under 18 years: 988 20.63 1,207 23.51 18 to 64 years: 3,007 62.78 3,123 60.84
65 years and older: 795 16.6 803 15.64 Male: 2,407 100 2,431 100
Under 5 years: 132 5.48 181 7.45 Under 18 years: 535 22.23 582 23.94 18 to 64 years: 1,511 62.78 1,525 62.73
65 years and older: 361 15 324 13.33 Female: 2,383 100 2,702 100
Under 5 years: 114 4.78 184 6.81 Under 18 years: 453 19.01 625 23.13 18 to 64 years: 1,496 62.78 1,598 59.14
65 years and older: 434 18.21 479 17.73 Source: US Census Bureau, 2010 Census All bolded and orange cells indicate a difference that is greater than 10% when compared to the State All bolded and blue cells indicate a difference that is greater than 10% when compared to the county and the State
EJSCREEN identified an approximate population of 225 in the 1-mile radius surrounding the Quarry and Distribution Center facility. The largest population was 18+ years, followed by 0-17 years at 21% (Table 6).

DRAFT Environmental Justice Report Carolina Sunrock, LLC. – Prospect Hill Quarry and Distribution Center
August 9, 2021
P a g e | 13
Table 6. Project Radius- Age Groups and Sex
Subject 1-mile (Quarry and
Distribution Center) Number Percent
Total Population 225 100 0-4 years 9 5 0-17 years 38 21 18+ years 145 79 65+ years 33 18 Source: US Census Bureau, 2010 Census
5.3 Disability Regional Setting According to the 2013-2017 American Community Survey 5-Year Estimates, Table S1810 Disability Characteristics from the US Census Bureau, the state of North Carolina had an estimated total population of 9,845,238 noninstitutionalized citizens. Of those individuals, an estimated 13.7% (MOE +/- 0.1%) had a disability. The largest population of disabled civilians were 75 years and over (51.0%, MOE +/- 0.5%). The second largest population was the 65 years to 74 years at 27.2% (MOE +/- 0.3%). By race, American Indian and Alaskan Native had the highest estimated disability rate of 18.3% (MOE +/- 0.7%). Black or African American, White, and Native Hawaiian and Other Pacific Islander were the next three highest population estimates with disabilities in North Carolina, at 15.1% (MOE +/-0.2%, 14.0% (MOE +/- 0.1%), and 11.6% (MOE +/- 0.6%), respectively (Table 7).
Caswell County had an estimated total population of 21,970 noninstitutionalized citizens. Of those, an estimated 19.7% (MOE +/- 2%) had a disability. The largest population of disabled civilians were 75 years and over (60.9%, MOE +/- 7.2%) followed by 65 years to 74 years (32.4%, MOE +/-6%). By race, residents of Two or more races had the highest estimated disability rate (50.9%, MOE +/-31%). All populations, excluding American Indian and Alaska Native, Native Hawaiian and Other Pacific Islander, some other race, Hispanic or Latino, and 5 to 17 years displayed estimates that were greater than 10% different when compared to the state.
Person County had an estimated total population of 38,813 noninstitutionalized citizens. Of those, an estimated 19.1% (MOE +/-0 .7%) had a disability (Table 8). The largest population of disabled civilians were 75 years and over (66.3%, MOE +/- 5.7%) followed by 65 years to 74 years (25.3, MOE +/-5.6%). By race, Black or African American residents had the highest estimated disability rate (23.6%, MOE +/-3.3%). The following population groups displayed estimates that were greater than 10% different when compared to the state: total civilian noninstitutionalized, male, female, white alone, Black or African American alone, American Indian and Alaska Native alone, two or more races, 18-34 years, 35 to 64 years, and 75 years and older.

DRAFT Environmental Justice Report Carolina Sunrock, LLC. – Prospect Hill Quarry and Distribution Center
August 9, 2021
P a g e | 14
Table 7. Regional Setting- Disability
North Carolina Caswell County
Subject Total With a Disability Percent with a
Disability Total With a Disability Percent with a Disability
Estimate Margin of Error (+/-) Estimate Margin of
Error (+/-) Estimate Margin of Error (+/-) Estimate Margin of
Error (+/-) Estimate Margin of Error (+/-) Estimate Margin of
Error (+/-) Total civilian noninstitutionalized population
9,845,238 1,883 1,344,677 9,296 13.7% 0.1 21,970 136 4,339 445 19.7% 2.0
SEX Male 4,734,744 2,356 644,157 5,756 13.6% 0.1 10,738 191 2,216 264 20.6% 2.5 Female 5,110,494 1,611 700,520 5,791 13.7% 0.1 11,232 96 2,123 275 18.9% 2.4 RACE AND HISPANIC OR LATINO ORIGIN
White alone 6,805,260 7,679 950,044 7,928 14.0% 0.1 13,885 214 2,594 350 18.7% 2.5 Black or African American alone 2,101,735 5,025 316,325 4,035 15.1% 0.2 7,202 228 1,573 257 21.8% 3.7 American Indian and Alaska Native alone 114,961 1,802 20,994 862 18.3% 0.7 23 26 0 22 0.0% 61.8
Asian alone 266,672 1,954 13,149 763 4.9% 0.3 130 22 35 32 26.9% 24.5 Native Hawaiian and Other Pacific Islander alone
5,842 533 678 170 11.6% 3 32 38 0 22 0.0% 52.4
Some other race alone 306,809 7,341 15,461 1,136 5.0% 0.3 429 184 0 22 0.0% 7.3 Two or more races 243,959 5,401 28,026 1,407 11.5% 0.5 269 163 137 106 50.9% 31 Hispanic or Latino (of any race) 895,338 953 53,910 1,944 6.0% 0.2 806 27 10 15 1.2% 1.9 AGE Under 5 years 603,917 730 5,099 590 0.8% 0.1 1,080 35 22 33 2.0% 3.1 5 to 17 years 1,682,039 807 95,840 2,124 5.7% 0.1 3,253 38 169 71 5.2% 2.2 18 to 34 years 2,190,572 2,241 144,807 3,125 6.6% 0.1 4,018 103 300 110 7.5% 2.8 35 to 64 years 3,894,704 2,076 560,147 6,001 14.4% 0.2 9,350 140 2,003 321 21.4% 3.4 65 to 74 years 895,249 1,047 243,488 2,801 27.2% 0.3 2,651 47 859 155 32.4% 6 75 years and over 578,757 1,013 295,296 2,759 51.0% 0.5 1,618 56 986 122 60.9% 7.2

DRAFT Environmental Justice Report Carolina Sunrock, LLC. – Prospect Hill Quarry and Distribution Center
August 9, 2021
P a g e | 15
Table 8. Regional Setting- Disability cont’d
Person County
Subject Total With a Disability Percent with a
Disability
Estimate Margin of Error (+/-) Estimate Margin of
Error (+/-) Estimate Margin of Error (+/-)
Total civilian noninstitutionalized population
38,813 147 7,419 656 19.1% 0.7
SEX Male 18,759 134 3,824 445 20.4% 2.4 Female 20,054 145 3,595 436 17.9% 2.2 RACE AND HISPANIC OR LATINO ORIGIN
White alone 26,437 313 4,730 512 17.9% 1.9 Black or African American alone 10,488 293 2,471 363 23.6% 3.3 American Indian and Alaska Native alone 322 80 66 37 20.5% 13
Asian alone 60 51 2 4 3.3% 7.4 Native Hawaiian and Other Pacific Islander alone
18 32 0 25 0.0% 69.9
Some other race alone 722 317 19 28 2.6% 4.5 Two or more races 766 279 131 81 17.1% 10.8 Hispanic or Latino (of any race) 1,611 22 47 51 2.9% 3.2 AGE Under 5 years 2,147 106 17 27 0.0% 1.3 5 to 17 years 6,352 108 358 138 5.6% 2.2 18 to 34 years 7,049 115 685 191 9.7% 2.7 35 to 64 years 16,480 126 3,558 456 21.6% 2.8 65 to 74 years 4,140 64 1,048 235 25.3% 5.6 75 years and over 2,645 103 1,753 164 66.3% 5.7 Source: US Census Bureau, ACS 5-year Estimates (2013-2017) All bolded and orange highlighted cells indicate a difference that is greater than 10% when compared to the State

DRAFT Environmental Justice Report Carolina Sunrock, LLC. – Prospect Hill Quarry and Distribution Center
August 9, 2021
P a g e | 16
Local Setting According to the 2013-2017 American Community Survey 5-Year Estimates, Table S1810 Disability Characteristics from the US Census Bureau, Census Tract 9306 in Caswell County had an estimated total population of 5,005 noninstitutionalized citizens (Table 9). Of those individuals, an estimated 15.4% (MOE +/- 4.2%) had a disability. The largest population of disabled civilians were 75 years and over (69.2%, MOE +/- 20.8%). The second largest population was the 65 years to 74 years at 35.5% (MOE +/- 14%). By race, Black or African American residents had the highest estimated disability rate of 19.6% (MOE +/- 12%). The following population groups had estimates that were greater than 10% when compared to the state: total civilian noninstitutionalized population, male, Black or African American alone, 35-64 years, and 65-74 years. The population group 75 years and older had an estimate that was greater than 10% when compared to the county and to the state.
Census Tract 9206.01 in Person County had an estimated total population of 5,346 noninstitutionalized citizens. Of those individuals, an estimated 24% (MOE +/- 6.3%) had a disability. The largest population of disabled civilians were 75 years and over (78.5%, MOE +/- 12.2%). The second largest population was Black or African American at 33.9% (MOE +/- 13.8%). The population group 18-34 years had an estimate that was greater than 10% different when compared to the state. The following population groups had estimates that were greater than 10% when compared to the state and the county: total civilian noninstitutionalized population, male, female, White, Black or African American, 5-17 years, 35-64 years, and 75 years and over.

DRAFT Environmental Justice Report Carolina Sunrock, LLC. – Prospect Hill Quarry and Distribution Center
August 9, 2021
P a g e | 17
Table 9. Local Setting- Disability
Census Tract 9306, Caswell County Census Tract 9206.01, Person County
Subject Total With a Disability Percent with a
Disability Total With a Disability Percent with a Disability
Estimate Margin of Error (+/-) Estimate Margin of
Error (+/-) Estimate Margin of Error (+/-) Estimate Margin of
Error (+/-) Estimate Margin of Error (+/-) Estimate Margin of
Error (+/-) Total civilian noninstitutionalized population
5,005 493 769 227 15.4% 4.2 5,346 644 1,285 284 24.0% 6.3
SEX Male 2,556 270 436 142 17.1% 5.5 2,542 341 690 178 27.1% 7.5 Female 2,449 286 333 123 13.6% 4.5 2,804 392 595 190 21.2% 7.5 RACE AND HISPANIC OR LATINO ORIGIN
White alone 3,697 377 517 199 14.0% 5.3 3,525 580 832 208 23.6% 7.5 Black or African American alone 1,289 312 252 165 19.6% 12 1,275 301 432 200 33.9% 13.8 American Indian and Alaska Native alone 0 17 0 17 - ** 0 17 0 17 - ** Asian alone 8 16 0 17 0.0% 100 0 17 0 17 - ** Native Hawaiian and Other Pacific Islander alone
0 17 0 17 - ** 0 17 0 17 - **
Some other race alone 0 17 0 17 - ** 358 338 0 17 0.0% 8.7 Two or more races 11 22 0 17 0.0% 89.4 188 177 21 33 11.2% 23.5 Hispanic or Latino (of any race) 33 39 0 17 0.0% 51.6 557 311 0 17 0.0% 5.7 AGE Under 5 years 324 93 0 17 0.0% 9.5 343 162 0 17 0.0% 9 5 to 17 years 854 199 25 28 2.9% 3.4 824 307 68 74 8.3% 8 18 to 34 years 1,094 209 30 47 2.7% 4.3 1,027 212 78 69 7.6% 6.7 35 to 64 years 1,959 270 378 150 19.3% 7.2 2,062 267 620 228 30.1% 11 65 to 74 years 592 135 210 104 35.5% 14 495 146 52 66 10.5% 14 75 years and over 182 69 126 65 69.2% 20.8 595 143 467 145 78.5% 12.2 Source: US Census Bureau, American Community Survey (5-year estimates) All bolded and orange highlighted cells indicate a difference that is greater than 10% when compared to the State All bolded and blue highlighted cells indicate a difference that is greater than 10% when compared to the County and State

DRAFT Environmental Justice Report Carolina Sunrock, LLC. – Prospect Hill Quarry and Distribution Center
August 9, 2021
P a g e | 18
5.4 Poverty Regional Setting According to the Census Table S1701, Poverty Status in the Past 12 Months, 2013-2017 American Community Survey 5-Year Estimates, from the US Census Bureau, North Carolina had an estimated population of 9,783,738, with 16.1% (MOE +/- 0.2%) below the poverty level (Table 10). Across all subjects, Some other race had the highest percent living below the poverty level at 32.0% (MOE +/- 1.4%). The next three subjects with the highest poverty level were Hispanic or Latino at 30.1% (MOE +/- .8%), American Indian and Alaska Native at 26.2% (MOE +/- 1.5%), and Black or African American at 24.9% (MOE +/- .4%). The age group with the highest population below poverty was under 18 (22.9%, MOE +/- 0.4%), followed by 18 to 64 (15.3%, MOE +/- 0.2%).
Caswell County had an estimated population of 21,870 with 21.3% (MOE +/-2.9%) living below the poverty level. Across all subjects, two or more races had the highest percent living below the poverty level at 65.4% (MOE +/- 7.4%). The next subjects with the highest poverty level were Some other race at 59.2% (MOE +/- 32.2%) and Hispanic or Latino at 56.1% (MOE +/- 19.9%). All subject groups had a greater than 5% difference when compared to the state, excluding Native Hawaiian and Other Pacific Islander and American Indian and Alaska Native.
Person County had an estimated population of 38,697 with 18.1% (MOE +/-2.6%) living below the poverty level. Across all subjects, Some Other Race had the highest percent living below the poverty level at 68.7% (MOE +/- 26.2%). The next subjects with the highest poverty level were Hispanic or Latino at 37.8% (MOE +/- 19.8%) and under 18 at 29.1% (MOE +/- 5.6%). The following subject groups had a greater than 5% difference when compared to the state: overall population, under 18, 65 years and over, male, female, Black or African American, Some other Race, and Hispanic or Latino (Table 11).

DRAFT Environmental Justice Report Carolina Sunrock, LLC. – Prospect Hill Quarry and Distribution Center
August 9, 2021
P a g e | 19
Table 10. Regional Setting- Poverty
North Carolina Caswell County
Subject Total Below poverty level Percent below poverty
level Total Below poverty level Percent below poverty level
Estimate Margin of Error +/- Estimate Margin of
Error +/- Estimate Margin of Error +/- Estimate Margin of
Error +/- Estimate Margin of Error +/- Estimate Margin of
Error +/- Population for whom poverty status is determined 9,783,738 1,751 1,579,871 17,833 16.1 0.2 21,870 156 4,666 650 21.3 2.9 AGE Under 18 2,256,186 1,865 516,821 9,185 22.9 0.6 4,233 76 1,449 312 34.2 7.2 18 to 64 6,053,546 1,090 923,859 9,663 15.3 0.4 13,368 144 2,471 395 18.5 2.9 65 years and over 1,474,006 881 139,191 2,754 9.4 0.2 4,269 56 746 199 17.5 4.6 SEX Male 4,733,269 2,259 694,126 9,539 14.7 0.2 10,709 189 2,255 378 21.1 3.5 Female 5,050,469 2,443 885,745 10,217 17.5 0.2 11,161 115 2,411 368 21.6 3.3 RACE AND HISPANIC OR LATINO ORIGIN
White 6,776,691 7,591 845,573 13,639 12.5 0.2 13,814 220 2,263 503 16.4 3.7 Black or African American 2,077,559 4,736 517,071 8,162 24.9 0.4 7,188 227 1,950 365 27.1 5.1 American Indian and Alaska Native 114,751 1,804 30,017 1,757 26.2 1.5 23 26 4 7 17.4 36.9 Asian 262,596 1,970 33,282 2,248 12.7 0.9 130 22 29 41 22.3 31.8 Native Hawaiian and Other Pacific Islander 5,886 537 1,097 297 18.6 4.9 32 38 0 22 0.0 52.4 Some other race 305,431 7,334 97,609 5,276 32.0 1.4 429 184 254 204 59.2 32.2 Two or more races 240,824 5,455 55,222 2,570 22.9 1 254 162 166 165 65.4 43.5 Hispanic or Latino 894,810 1,312 268,985 7,035 30.1 0.8 806 27 452 160 56.1 19.9 All individuals below: 50 percent of poverty level 688,118 10,757 1,965 538 125 percent of poverty level 2,094,292 20,441 5,709 679 150 percent of poverty level 2,596,452 22,139 6,652 697 185 percent of poverty level 3,291,075 23,334 8,328 753 200 percent of poverty level 3,571,557 25,056 9,398 764

DRAFT Environmental Justice Report Carolina Sunrock, LLC. – Prospect Hill Quarry and Distribution Center
August 9, 2021
P a g e | 20
Table 11. Regional Setting- Poverty cont’d
Person County
Subject Total Below poverty level Percent below
poverty level
Estimate Margin of Error
+/- Estimate Margin of
Error +/- Estimate Margin of Error +/-
Population for whom poverty status is determined 38,697 190 6,998 992 18.1 2.6 AGE Under 18 8,342 118 2,429 466 29.1 5.6 18 to 64 23,570 99 3,793 620 16.1 2.6 65 years and over 6,785 132 776 200 11.4 2.9 SEX Male 18,680 138 3,045 548 16.3 2.9 Female 20,017 155 3,953 598 19.7 3.0 RACE AND HISPANIC OR LATINO ORIGIN
White 26,330 313 3,397 836 12.9 3.1 Black or African American 10,515 298 2,950 613 28.1 5.8 American Indian and Alaska Native 322 80 30 41 9.3 11.5 Asian 60 51 0 25 0.0 38.3 Native Hawaiian and Other Pacific Islander 0 25 0 25 - ** Some other race 722 317 496 330 68.7 26.2 Two or more races 748 282 125 96 16.7 13.0 Hispanic or Latino 1,605 31 607 319 37.8 19.8 All individuals below: 50 percent of poverty level 2,537 659 125 percent of poverty level 9,575 1,029 150 percent of poverty level 11,526 1,005 185 percent of poverty level 14,694 1,196 200 percent of poverty level 15,165 1,233 Source: American Community Survey 5-year Estimates, 2013-2017 All bolded and orange cells indicate a difference that is greater than 5% when compared to the State

DRAFT Environmental Justice Report Carolina Sunrock, LLC. – Prospect Hill Quarry and Distribution Center
August 9, 2021
P a g e | 21
Local Setting According to the Census Table S1701, Poverty Status in the Past 12 Months, 2013-2017 American Community Survey 5-Year Estimates, from the US Census Bureau, Census Tract 9306 in Caswell County had an estimated population of 4,956 with 22.3% (MOE +/-7.5%) living below the poverty level (Table 12). Across all subjects, Asian (100%, MOE +/- 100%) and two or more races (100% MOE +/- 89.4%) had the highest percent living under the poverty level. The next subjects with the highest poverty level were Hispanic or Latino at 69.7% (MOE +/- 50.5%), and under 18 at 39.8% (MOE +/- 17.2%). The following subject groups had a greater than 5% difference when compared to the county and the state: under 18, male, white, Black or African American, American Indian and Alaska Native, Asian, Two or more races, and Hispanic or Latino. The following groups had a greater than 5% difference when compared to the state: total population, 18 to 64 years, and female.
Census Tract 9206.01 in Person County had an estimated population of 5,264 with 24.4% (MOE +/-9.1%) living below the poverty level. Across all subjects, some other race had the highest percent living below the poverty level at 76.3% (MOE +/- 48%). The next subjects with the highest poverty level were under 18 at 59.4% (MOE +/- 19.5%), and Hispanic or Latino at 49% (MOE +/- 48.7%). The following subject groups had a greater than 5% difference when compared to the county and state: total population, under 18, 18 to 64, male, female, white, Some other race, and Hispanic or Latino. The population of Black or African American residents had a greater than 5% difference when compared to the state.

DRAFT Environmental Justice Report Carolina Sunrock, LLC. – Prospect Hill Quarry and Distribution Center
August 9, 2021
P a g e | 22
Table 12. Local Setting- Poverty
Census Tract 9306, Caswell County Census Tract 9206.01, Person County
Subject Total Below poverty level Percent below
poverty level Total Below poverty level Percent below poverty level
Estimate Margin of Error +/- Estimate Margin of
Error +/- Estimate Margin of Error +/- Estimate Margin of
Error +/- Estimate Margin of Error +/- Estimate Margin of
Error +/- Population for whom poverty status is determined 4,956 496 1,106 401 22.3 7.5 5,264 587 1,283 556 24.4 9.1 AGE Under 18 1,129 210 449 239 39.8 17.2 1,085 335 644 321 59.4 19.5 18 to 64 3,053 354 587 224 19.2 6.9 3,089 367 549 292 17.8 8.8 65 years and over 774 124 70 59 9.0 7.6 1,090 154 90 66 8.3 6.3 SEX Male 2,556 270 616 289 24.1 10.6 2,491 322 572 237 23.0 8.2 Female 2,400 293 490 191 20.4 7.4 2,773 365 711 353 25.6 11.1 RACE AND HISPANIC OR LATINO ORIGIN
White 3,648 380 705 303 19.3 8 3,443 526 643 401 18.7 10.4 Black or African American 1,289 312 382 261 29.6 17.5 1,275 301 367 233 28.8 14.2 American Indian and Alaska Native 0 17 0 17 - ** 0 17 0 17 - ** Asian 8 16 8 16 100.0 100 0 17 0 17 - ** Native Hawaiian and Other Pacific Islander 0 17 0 17 - ** 0 17 0 17 - ** Some other race 0 17 0 17 - ** 358 338 273 341 76.3 48 Two or more races 11 22 11 22 100.0 89.4 188 177 0 17 0.0 15.8 Hispanic or Latino 33 39 23 32 69.7 50.5 557 311 273 341 49.0 48.7 All individuals below: 50 percent of poverty level 414 250 549 380 125 percent of poverty level 1,148 402 1,675 550 150 percent of poverty level 1,238 413 1,784 554 185 percent of poverty level 1,418 430 2,285 540 200 percent of poverty level 1,862 515 2,348 536 Source: American Community Survey 5-year Estimates, 2013-2017 All bolded and orange cells indicate a difference that is greater than 5% when compared to the State All bolded and blue cells indicate a difference that is greater than 5% when compared to the county and the State

DRAFT Environmental Justice Report Carolina Sunrock, LLC. – Prospect Hill Quarry and Distribution Center
August 9, 2021
P a g e | 23
5.5 Household Income Regional Setting The following table was compiled using data from the Census Table S1901, Income in the Past 12 Months (in 2017 Inflation-Adjusted Dollars) 2013-2017 American Community Survey 5-Year Estimates for North Carolina. The North Carolina household income range with the highest percent was $50,000 to $74,999, at 18.1%. The median household income was $50,320 and the mean income was $70,523 (Table 13).
The household income range for Caswell County with the highest percent was $50,000 to $74,999 at 16.7% (MOE +/- 2.6%). The median income was $39,428 and the mean income was $52,548. All income ranges less than $50,000 had percentages that were more than 10% higher than the state ranges. The household income range for Person County with the highest percent was $50,000 to $74,999 at 18.0% (MOE +/- 2.3%). The median income was $44,921 and the mean income was $58,792. The income ranges from $15,000 to $34,999 had percentages that were more than 10% higher than the state ranges.
Table 13. Regional Setting- Household Income
Local Setting The household income range for Census Tract 9306 in Caswell County with the highest percent was $50,000 to $74,999 at 19.1% (MOE +/- 7.2%). The median income was $55,975 and the mean income was $62,498 (Table 14). The income range $10,000 to $14,999 had percentages that were more than 10% higher than the state ranges. The household income range for Census
Subject
North Carolina Caswell County Person County Households Households Households
Estimate Margin of Error (+/-) Estimate Margin of
Error (+/-) Estimate Margin of Error (+/-)
Total 3,874,346 8,789 9,160 276 15,772 340 Less than $10,000 7.3% 0.1 9.1% 2 7.6% 1.8 $10,000 to $14,999 5.8% 0.1 10.2% 2.5 5.9% 1.4 $15,000 to $24,999 11.1% 0.1 13.5% 2.3 15.2% 2.2 $25,000 to $34,999 11.0% 0.1 12.1% 2.2 12.2% 1.9 $35,000 to $49,999 14.5% 0.1 16.6% 2.7 14.3% 2.1 $50,000 to $74,999 18.1% 0.1 16.7% 2.6 18.0% 2.3 $75,000 to $99,999 11.8% 0.1 10.4% 2.1 12.7% 1.6 $100,000 to $149,999 11.7% 0.1 7.1% 1.7 10.1% 1.7 $150,000 to $199,999 4.4% 0.1 2.4% 1.2 2.5% 0.9 $200,000 or more 4.3% 0.1 1.9% 1.1 1.5% 0.8 Median income (dollars) 50,320 204 39,428 2,039 44,921 2,487 Mean income (dollars) 70,523 287 52,548 3,820 58,792 4,201 Source: US Census, ACS 5-year Estimates 2013-2017. All orange and bolded cells indicate a difference of greater than 10% increase when compared to the state.
DRAFT Environmental Justice Report Carolina Sunrock, LLC. – Prospect Hill Quarry and Distribution Center
August 9, 2021
P a g e | 24
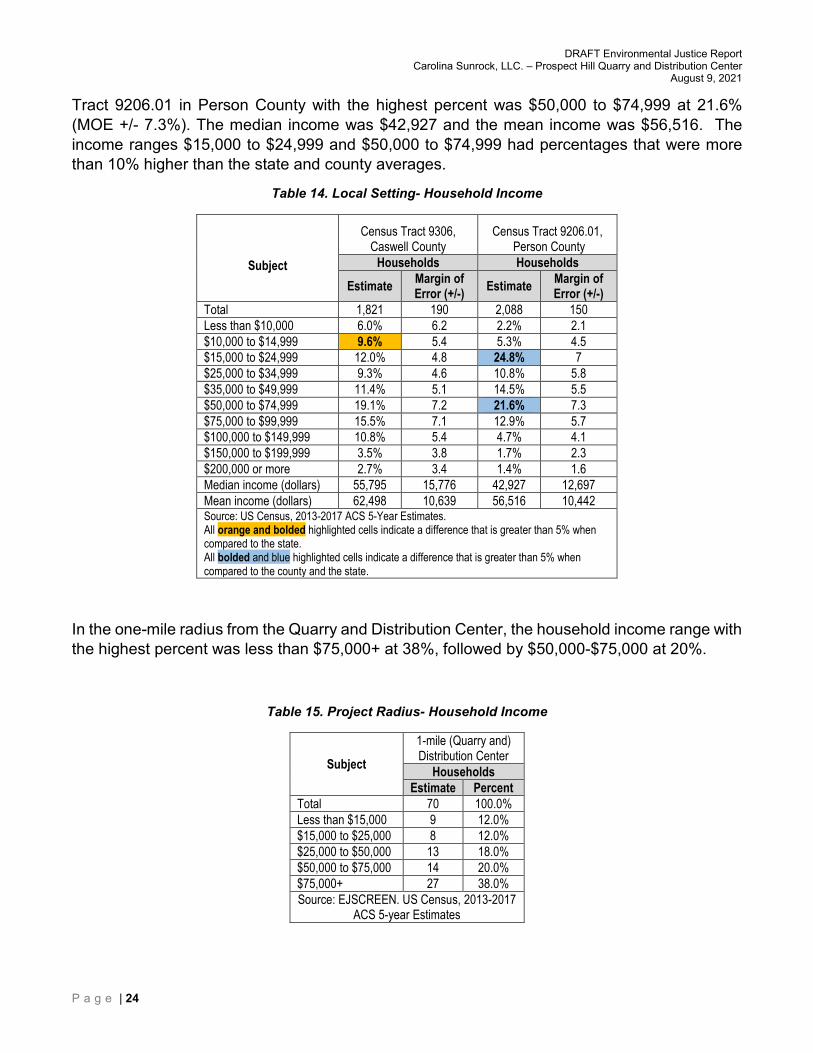
Tract 9206.01 in Person County with the highest percent was $50,000 to $74,999 at 21.6% (MOE +/- 7.3%). The median income was $42,927 and the mean income was $56,516. The income ranges $15,000 to $24,999 and $50,000 to $74,999 had percentages that were more than 10% higher than the state and county averages.
Table 14. Local Setting- Household Income
In the one-mile radius from the Quarry and Distribution Center, the household income range with the highest percent was less than $75,000+ at 38%, followed by $50,000-$75,000 at 20%.
Table 15. Project Radius- Household Income
Subject 1-mile (Quarry and) Distribution Center
Households Estimate Percent
Total 70 100.0% Less than $15,000 9 12.0% $15,000 to $25,000 8 12.0% $25,000 to $50,000 13 18.0% $50,000 to $75,000 14 20.0% $75,000+ 27 38.0% Source: EJSCREEN. US Census, 2013-2017
ACS 5-year Estimates
Subject
Census Tract 9306, Caswell County
Census Tract 9206.01, Person County
Households Households
Estimate Margin of Error (+/-) Estimate Margin of
Error (+/-) Total 1,821 190 2,088 150 Less than $10,000 6.0% 6.2 2.2% 2.1 $10,000 to $14,999 9.6% 5.4 5.3% 4.5 $15,000 to $24,999 12.0% 4.8 24.8% 7 $25,000 to $34,999 9.3% 4.6 10.8% 5.8 $35,000 to $49,999 11.4% 5.1 14.5% 5.5 $50,000 to $74,999 19.1% 7.2 21.6% 7.3 $75,000 to $99,999 15.5% 7.1 12.9% 5.7 $100,000 to $149,999 10.8% 5.4 4.7% 4.1 $150,000 to $199,999 3.5% 3.8 1.7% 2.3 $200,000 or more 2.7% 3.4 1.4% 1.6 Median income (dollars) 55,795 15,776 42,927 12,697 Mean income (dollars) 62,498 10,639 56,516 10,442 Source: US Census, 2013-2017 ACS 5-Year Estimates. All orange and bolded highlighted cells indicate a difference that is greater than 5% when compared to the state. All bolded and blue highlighted cells indicate a difference that is greater than 5% when compared to the county and the state.

DRAFT Environmental Justice Report Carolina Sunrock, LLC. – Prospect Hill Quarry and Distribution Center
August 9, 2021
P a g e | 25
Per Capita Income Per Capita Income data was obtained through the Census Table B19301, Per Capita Income in the Past 12 Months (In 2017 Inflation-Adjusted Dollars), 2013-2017 American Community Survey 5-Year Estimates. The North Carolina per capita income estimate was $28,123. The estimates for the counties are: $21,692 in Caswell County and $24,477 in Person County. The estimates for the census tracts are: $22,753 (9306) and $22,621 (9206.01). Both the county and the census tracts had a lower Per Capita Income compared to the state (Table 16).
The EJSCREEN analysis also provided per capita income estimates for the one-mile buffer surrounding facility sites. The buffer around the Quarry and Distribution Center has an estimated per capita income of $30,248.
Table 16. Per Capita Income
Location Subject Per Capita Income in Last 12 Months (Dollars)
North Carolina Per Capita Income Estimate $28,123 Margin of Error +/- 130
Caswell County Per Capita Income Estimate $21,692 Margin of Error +/- 1,521
Person County Per Capita Income Estimate $24,477 Margin of Error +/- 1,776
Census Tract 9306 Caswell County
Per Capita Income Estimate $22,753 Margin of Error +/- 3,182
Census Tract 9206.01 Person County
Per Capita Income Estimate $22,621 Margin of Error +/- 4,352
Project Area 1-mile Quarry and Distribution Center
Per Capita Income Estimate $30,148 Margin of Error +/- ***
Source: American Community Survey 5-year Estimates, 2013-2017
6 Limited English Proficiency (LEP) Per the Safe Harbor Guidelines, should an LEP Group be identified during the permit application process, written translations of vital documents for each eligible LEP language group that constitutes five percent or includes 1,000 members (whichever is less) of the population of persons eligible to be served or likely to be affected or encountered. If there are fewer than 50 persons in a language group that reaches the five percent trigger, then DEQ will not translate vital written materials, but instead will provide written notice in the primary language of the LEP language group of the right to receive competent oral interpretation of those written materials, free of cost. The safe harbor provisions apply to the translation of written documents only. Safe

DRAFT Environmental Justice Report Carolina Sunrock, LLC. – Prospect Hill Quarry and Distribution Center
August 9, 2021
P a g e | 26
harbor guidelines are per the EPA guidance for LEP persons and implemented by DEQ when deemed appropriate. Seven potential LEP language groups were identified during this initial screening of demographic data (Table 17). However, none of the language groups identified in this screening reached the 5% threshold. If larger LEP groups are identified during the site visit or specific translation requests are received, then DEQ will revisit the Safe Harbor Guidelines.
Table 17. Limited English Proficiency
Language Spoken at Home
Census Tract 9306, Caswell County Census Tract 9206.01, Person County
Estimate Margin of Error Estimate Margin of Error Total: 4,576 +/-420 4,682 +/-465
Speak only English 4,536 +/-407 4,306 +/-413 Spanish or Spanish Creole: 40 +/-59 321 +/-239
Speak English "very well" 14 +/-22 219 +/-158 Speak English less than
"very well" 26 +/-56 102 +/-110
German: 0 +/-12 0 +/-12 Speak English "very well" 0 +/-12 0 +/-12 Speak English less than
"very well" 0 +/-12 0 +/-12
Vietnamese: 0 +/-12 0 +/-12 Speak English "very well" 0 +/-12 0 +/-12 Speak English less than
"very well" 0 +/-12 0 +/-12
Tagalog: 0 +/-12 0 +/-12 Speak English "very well" 0 +/-12 0 +/-12 Speak English less than
"very well" 0 +/-12 0 +/-12
Source: American Community Survey 5-year Estimates, 2011-2015

DRAFT Environmental Justice Report Carolina Sunrock, LLC. – Prospect Hill Quarry and Distribution Center
August 9, 2021
P a g e | 27
7 County Health The University of Wisconsin Population Health Institute, in collaboration with the Robert Wood Johnson Foundation, calculated a County Health Rankings system for all the States in the United States (www.countyhealthrankings.org).This ranking is based on health outcomes (such as lifespan and self-reported health status) and health factors (such as environmental, social and economic conditions). According to this 2021 report, out of all 100 counties in North Carolina (with 1 indicating the healthiest), Caswell County ranks 73rd in health factors and 78th in health outcomes and Person County ranks 53rd in health factors and 73rd in health outcomes. (Figure 3).
Figure 3. County Health Rankings for Health Factors in North Carolina provided by University of Wisconsin Public Health Institute.
According to the NC DEQ Community Mapping System Environmental Justice Tool, Table 18 demonstrates the rates of death due to various causes in the counties surrounding the proposed facility, as compared to the state.
Table 18. Health Outcomes
Cause of Death Caswell Person North Carolina
Cancer 198.7 178.5 169.1 Heart Disease 169.6 155.6 163.7 Stroke 37.6 33.2 43.1 Cardiovascular Disease 218.8 200.9 221.9 Diabetes 27.9 29 22.8 Source: NCDEQ 2020 EJ Tool

DRAFT Environmental Justice Report Carolina Sunrock, LLC. – Prospect Hill Quarry and Distribution Center
August 9, 2021
P a g e | 28
8 Local Sensitive Receptors The Environmental Protection Agency suggests that sensitive receptors include, but are not limited to, hospitals, schools, daycare facilities, elderly housing, and convalescent facilities. These are areas where the occupants are more susceptible to the adverse effects of exposure to toxic chemicals, pesticides, and other pollutants. Extra care must be taken when dealing with contaminants and pollutants in close proximity to areas recognized as sensitive receptors. For instance, children and the elderly may have a higher risk of developing asthma from elevated levels of certain air pollutants than a healthy individual aged between 18 and 64.
Within the one-mile project radius from the Quarry and Distribution Center, the following potential sensitive receptors were identified (Figure 4)
• Bethel United Methodist Church • Lea Bethel Baptist Church
Additional sensitive receptors may be identified during the permit application process, such as during the field reconnaissance visit or through public comment.
Figure 4. Sensitive receptors surrounding Quarry and Distribution Center
DRAFT Environmental Justice Report Carolina Sunrock, LLC. – Prospect Hill Quarry and Distribution Center
August 9, 2021
P a g e | 29
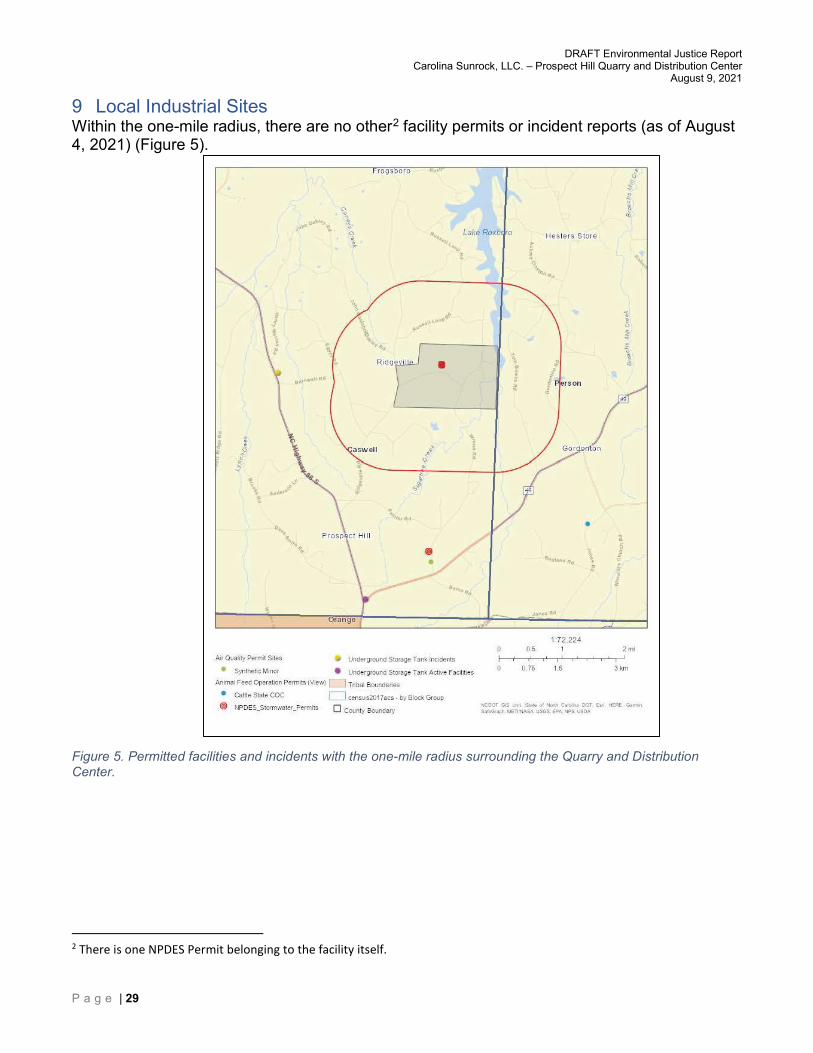
9 Local Industrial Sites Within the one-mile radius, there are no other2 facility permits or incident reports (as of August 4, 2021) (Figure 5).
Figure 5. Permitted facilities and incidents with the one-mile radius surrounding the Quarry and Distribution Center.
2 There is one NPDES Permit belonging to the facility itself.

DRAFT Environmental Justice Report Carolina Sunrock, LLC. – Prospect Hill Quarry and Distribution Center
August 9, 2021
P a g e | 30
10 Conclusion Environmental justice is the fair treatment and meaningful involvement of all people regardless of race, color, national origin, or income, with respect to the development, implementation, and enforcement of environmental laws, regulations, and policies (US EPA). This report examined the demographic and environmental conditions in the state of North Carolina, Caswell, and Person counties, census tracts 9306 and 9206.01, and the one-mile radius around the Carolina Sunrock LLC, proposed Quarry and Distribution Center Potential emissions rates outlined in the permit application and county level health data were also included, as well as data from the NCDEQ Community Mapping System.
It is important to keep in mind that based on the available data, the following limitations of this report: census data is from 2010 and may be outdated; the more recent census data through 2017 are estimates; EJSCREEN does not provide all of the data categories that were used in this analysis so the census tracts data and county data cannot be compared to the radius used surrounding the facility boundary for all criteria; census tracts can still be large areas and do not allow for exact locations of each population; some of the census tracts slightly overlap with the one-mile radius; and the Department cannot determine which populations may be located in that small amount of overlap around the facility.
The project area data from the census tracts and one-mile radius generally do not deviate from state estimates for race and ethnicity. The surrounding census tracts display a population of individuals over 65 years old that is higher than the state average.
Both of the census tracts display overall poverty estimates that are greater than 10% different than the state and the county. Both census tracts have the largest population within the $50,000 to $74,900 range for household income. The project radius estimate has the largest population falling in the $75,000+ income bracket. Both census tracts display a per capita income lower than the state, and slightly lower than the county. The one-mile radius surrounding the Quarry and Distribution Center displays a per capita income estimate higher than the state.
Caswell County ranks 71th in health factors and 64th in health outcomes. Person County ranks 51st in health factors and 51st in health outcomes.
There were no permitted facilities or incidents within one mile of the proposed facility.
Based on this Draft EJ Report, the following outreach will be conducted:
• Extra attention will be given to ensure language data is accurate and that translation or interpretation will be considered if more LEP populations are identified at any point throughout the process.
• The list of sensitive receptors will be consulted while considering additional outreach options that may best fit this community’s needs.
• Known community leaders will be consulted including community members, community groups who indicated significant interest during the 2020 permitting process.