Carnegie Investment Bank AB
28
Carnegie Investment Bank AB (Org nr 516406-0138) 2006 Annual Report
-
Upload
samanthafox -
Category
Documents
-
view
407 -
download
7
Transcript of Carnegie Investment Bank AB

Carnegie Investment Bank AB
(Org nr 516406-0138)
2006 Annual Report

CARNEGIE INVESTMENT BANK AB 1 (26) Org nr 516406-0138
Administration Report The Board of Directors and Managing Director of Carnegie Investment Bank AB, (Carnegie) submit herewith the annual accounts and consolidated financial statements for the operations during the 2006 financial year. Carnegie Investment Bank AB is a wholly-owned subsidiary of D. Carnegie & Co AB, the parent company in the Carnegie Group, listed on OMX, the Nordic stock exchange, with registered office in Stockholm. Operations during 2006 Carnegie is an independent Nordic investment bank operating in Securities, Investment Banking, Asset Management and Private Banking pursuant to licence from the Swedish Financial Supervisory Authority. In addition to the operations conducted in subsidiaries (see Note 16) Carnegie conducts operations in the form of branch offices in Finland, Norway and the UK . Market development The Nordic equity markets ended 2006 on a strong note, with the MSCI Nordic index up 20 per cent, outperforming both Europe and the US. In 2006, aggregate equity turnover on the Nordic stock exchange increased with 44 per cent, which is a record level of EUR 1,350 billion. The Norwegian market showed the highest turnover increase with 69 per cent mainly due to high activity in corporate transactions. In 2006, Nordic Merger & Acquisitions, M&A, activity continued to break records, achieving a volume of USD 128 billion, an increase of some 19 per cent over 2005, the previous record year. While the Nordic ECM market was unchanged in terms of volume, a total of 35 (26) initial public offerings were launched in the Nordic region during 2006, with an aggregate value of USD 6 billion. In the end of the first half year, the decrease in the stock markets, caused fairly large outflows from equity oriented mutual funds. In Sweden, subscriptions from PPM lead to net inflow of SEK 23 billion. Market position Carnegie’s share of the aggregate turnover on the Nordic Stock Exchanges was 6.6 per cent 2006, ranking Carnegie as the second largest market participant in the Nordic region. In the recent Prospera ranking of Nordic equity houses, Carnegie’s market share of the Nordic commission pool, in the targeted Tier 1 client segment, was around 11 per cent. In Investment Banking, Carnegie was ranked No 7 (No 10) in terms of volume of Nordic M&A transactions and No 1 (No 1) in the Nordic ECM market. In Asset Management, Carnegie’s fund performance was better than its benchmark indices for around 94 (90) per cent of assets under management in mutual equity funds. Results Total income for 2006 was SEK 4,488 million (3,514), an increase of 28% from last year, reflecting a strong equity market and good performance across all business areas. Total expenses increased by 18% to 3,026 million (2,566). The operating profit before taxes increased by 55% to SEK 1,463 million (943). Net profit increased by 57% from last year to SEK 1,053 (671) million. In the parent company, total income for 2006 was SEK 1,960 million (1,523), an increase of 29 % from last year, reflecting a strong equity market and good performance across all business areas. Total expenses increased by 12% to SEK 1,016 million (1,426). Net profit before taxes increased by 53% from last year to SEK 1,016 million (663). Net profit increased by 43% from last year to SEK 913 (638) million. Liquidity, financing and investments Carnegie’s principal need for liquidity is to support day-to-day operations, through secured and unsecured short-term funding. The majority of Carnegie’s assets are marketable securities inventories (marked-to-market daily), margin lending and short-time deposits. As a consequence of this, Carnegie’s working capital fluctuates significantly between the financial statement dates. In 2006, the change in working capital was SEK –1,805 million (SEK 5,728 million). A more relevant measure of the liquidity is the cash flow from operations before changes in working capital, which was SEK 1,095 million in 2006 (SEK 729 million). Capital expenditure in 2006 amounted to SEK 40 million (SEK 85 million).

CARNEGIE INVESTMENT BANK AB 2 (26) Org nr 516406-0138
Employees, salaries and work environment The average number of employees, salaries and compensation in the Group and Parent Company are set forth in Note 6. Carnegie’s constant challenge is to recruit and retain the most talented individuals through continuous work with active leadership, clear objectives and competitive incentives to create working environment that provides the best possible opportunities for personal and professional growth. Carnegie’s overall goal for the working environment is for the employees to be in good physical and mental health. The working environments policy is handled within the day-to day operations. All employees have access to preventive company health service. Carnegie supports meaningful spare time activities such as athletic sports, culture and social gatherings. Through active work with the quality of the working environment the job satisfaction increases, which lowers the sick leave and improves the availability for Carnegie’s clients. Environmental work Carnegie’s goal is to promote a sustainable environment that will create conditions for a better society for future generations. Carnegie pursues its environmental aims through the continuous adaptation of activities, improvement of the methods and constant updating of the way knowledge and information is managed with regards to environmental issues. Carnegie’s core activities themselves have little effect on the environment. For example, the staff requires office premises and IT equipment, and consumes various goods, resources and energy. Carnegie has adopted an environmental policy applicable to all Swedish operations of which relevant areas shall be recognised in all of Carnegie’s operations. The two main areas identified for further activities are assessment and reduction of Carnegie’s environmental impact, together with training and encouragement of staff. Carnegie conducts on an annual basis environmental reviews in order to follow up the policy. Measures that have been taken so far include office premises, waste management, energy consumption and procurement. Capital Base and dividend proposal The Board of Directors resolve to propose a dividend of SEK 600 million. As a result of the dividend proposal, the Tier 1 ratio would be 21,3%. Taking into consideration the current market conditions and the potential growth opportunities in the operations, the assessment, in line with the Swedish Companies Act, is that the proposed dividend does not limit the company to fulfil its obligations and to carry out the business plan.
Allocation of profit, (SEK) Parent Company
At the disposal of the Annual General Meeting (SEK): Unrestricted shareholders’ equity 2 489 006 566 The Board of Directors and the CEO propose that the profits be allocated as follows (SEK): A dividend of SEK 600 000 000 To be carried forward 1 889 006 566 Total 2 489 006 566 The financial position of the Company and the Group as of 31 December 2006 and 2005, and the profit from the operations for the 2006 and 2005 financial years are set forth below in the Statement of Income and Balance Sheet, and notes to the financial statements.

CARNEGIE INVESTMENT BANK AB 3 (26) Org nr 516406-0138
Key ratios and five-year summary for the Parent Company (SEK million)
2006 2005 2004 2003 2002Statement of Income Commission income, net 1 482 1 178 1 034 655 970Net interest income -58 18 49 32 63Other operating Income 536 328 139 81 65Total income 1 960 1 523 1 222 768 1 098
Administrative expenses -1 591 -1 404 -1 212 -822 -997Depreciation/amortisation -11 -22 -32 -39 -36Credit losses 0 -5 1 - -3Total expenses -1 602 -1 431 -1 244 -861 -1 036
Operating profit 1 358 93 -22 -94 62
Balance sheet Assets Shares and participations 13 599 6 092 6 173 3 201 678Loans to general public 7 176 2 862 4 261 1 838 1 273Unsettled trade receivables 5 729 2 594 3 369 329 1 143Other assets 7 781 9 932 4 792 4 831 2 916Total Assets 34 285 21 480 18 595 10 199 6 010 Liabilities and equity Borrowing from general public 4 593 3 809 2 531 2 782 2 188Unsettled trade liabilities 244 301 20 476 480Other liabilities 26 719 15 393 6 696 5 790 2 775Subordinated loans - - - - 92Equity 2 729 1 977 1 725 1 151 475Total Liabilities and Equity 34 285 21 480 18 595 10 199 6 010 Key Ratios Return on capital employed, % 2 9,5% 7,0% Negative Negative 16,1%Income/expense ratio 3 1,26 1,05 Negative Negative 1,04Capital adequacy ratio, % 4 21,3 34,8 39,1% 31,3% 18,2%Average number of employees 443 440 455 388 478Operating profit per employee, SEK Thousand
808 211 Negative Negative 129
1 Based on market-valued stock portfolio. 2 Operating profit as a percentage of the total opening book value of equity (minus dividends paid during the year). 3 Operating income excluding net interest income, divided by operating expenses. 4 The capital adequacy ratio is calculated in accordance with the directives of the Swedish Financial Supervisory Authority.

Carnegie Investment Bank AB Org nr 516406-0138
4(26)
S T A T U T O R Y I N C O M E S T A T E M E N T(SEK thousands)
Note 2006 2005 2006 2005
Commission income 3,897,867 3,121,246 1,504,380 1,193,758Commission expense -182,279 -162,774 -22,653 -16,159Net commission income 2 3,715,588 2,958,472 1,481,727 1,177,599
Interest income 665,382 363,224 346,447 187,224Interest expenses -611,086 -287,121 -404,489 -169,429Net interest income 3 54,296 76,103 -58,042 17,795
Dividend received 4 853 1,677 - -Net profit from financial transactions 5 717,832 478,079 536,090 328,069Total income 1 4,488,569 3,514,331 1,959,775 1,523,463
General administrative expenses 6, 23 -2,961,959 -2,510,203 -1,591,485 -1,403,974Depreciation of tangible and amortisation of intangible fixed assets 7 -64,521 -56,178 -11,248 -21,655Total expenses -3,026,480 -2,566,382 -1,602,734 -1,425,629
Operating profit before provisions for credit losses 1,462,089 947,950 357,041 97,834
Provisions for credit losses, net 8 491 -4,860 491 -4,860
Operating profit 1,462,580 943,090 357,533 92,974
Result from associated companies 15 - 68 - -Write-down of shares in subsidiaries 16 - - - -16,000Anticipated dividends 9 - - 658,715 586,186
Profit before taxes 1,462,580 943,159 1,016,248 663,160
Taxes 10 -409,756 -272,071 -103,090 -25,182
NET PROFIT 1,052,824 671,088 913,158 637,978
Earnings per share (SEK) 2,632.06 1,677.72 - -Dividend per share (SEK)1) 1,500.00 1,650.00 - -
1) 2006 is proposed dividend
Note that certain numerical information may not sum due to rounding.
ParentGroup

Carnegie Investment Bank AB Org nr 516406-0138
5(26)
S T A T U T O R Y B A L A N C E S H E E T(SEK thousands)
ASSETS 31 Dec 2006 31 Dec 2005 31 Dec 2006 31 Dec 2005Note
Cash and bank deposits in central banks 479,610 316,126 10,095 5,746Loans to credit institutions 13 7,710,518 8,935,007 4,373,496 5,997,124Loans to general public 13, 14 8,905,810 4,428,280 7,175,956 2,861,962Bonds and other interestbearing securities 11, 12 1,914,996 1,827,667 3,158 3,050Shares and participations 11 14,172,562 7,089,072 13,598,833 6,091,707Shares and participations in associated companies 15 - - - -Shares in Group companies 16 - - 1,048,001 1,038,501Intangible fixed assets 17 44,617 83,063 2,517 5,648Tangible fixed assets 18 75,184 65,853 30,216 29,173Other assets 11, 19 8,165,567 7,592,989 7,784,782 5,177,368Prepaid expenses and accrued income 21 556,976 446,632 257,845 269,384
TOTAL ASSETS 42,025,840 30,784,689 34,284,900 21,479,663
Collateral pledged for own liabilitiesSecurities 14,374,130 6,215,240 14,083,678 5,463,984Securities owned by customers 8,718,780 3,521,285 7,781,885 1,791,595Other assets 5,176,906 3,599,359 2,147,222 1,585,741
Standardised optionsBlocked assets in customer accounts 122,057 79,330 122,057 79,330
Securities loaned 14,102,936 1,720,334 14,102,936 1,720,334
ParentGroup
Carnegie Investment Bank AB Org nr 516406-0138
6(26)
S T A T U T O R Y B A L A N C E S H E E T(SEK thousands)
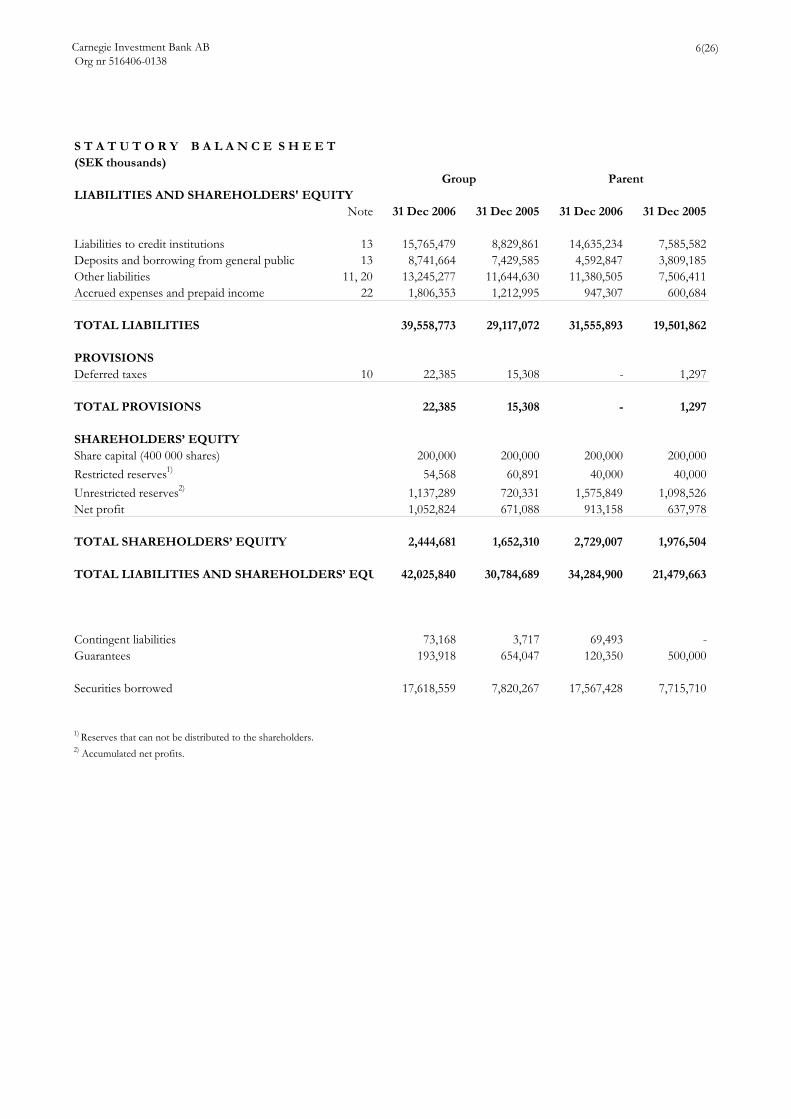
LIABILITIES AND SHAREHOLDERS' EQUITYNote 31 Dec 2006 31 Dec 2005 31 Dec 2006 31 Dec 2005
Liabilities to credit institutions 13 15,765,479 8,829,861 14,635,234 7,585,582Deposits and borrowing from general public 13 8,741,664 7,429,585 4,592,847 3,809,185Other liabilities 11, 20 13,245,277 11,644,630 11,380,505 7,506,411Accrued expenses and prepaid income 22 1,806,353 1,212,995 947,307 600,684
TOTAL LIABILITIES 39,558,773 29,117,072 31,555,893 19,501,862
PROVISIONSDeferred taxes 10 22,385 15,308 - 1,297
TOTAL PROVISIONS 22,385 15,308 - 1,297
SHAREHOLDERS’ EQUITYShare capital (400 000 shares) 200,000 200,000 200,000 200,000Restricted reserves1) 54,568 60,891 40,000 40,000Unrestricted reserves2) 1,137,289 720,331 1,575,849 1,098,526Net profit 1,052,824 671,088 913,158 637,978
TOTAL SHAREHOLDERS’ EQUITY 2,444,681 1,652,310 2,729,007 1,976,504
TOTAL LIABILITIES AND SHAREHOLDERS’ EQU 42,025,840 30,784,689 34,284,900 21,479,663
Contingent liabilities 73,168 3,717 69,493 -Guarantees 193,918 654,047 120,350 500,000
Securities borrowed 17,618,559 7,820,267 17,567,428 7,715,710
1) Reserves that can not be distributed to the shareholders.2) Accumulated net profits.
Group Parent
Carnegie Investment Bank AB Org nr 516406-0138
7(26)
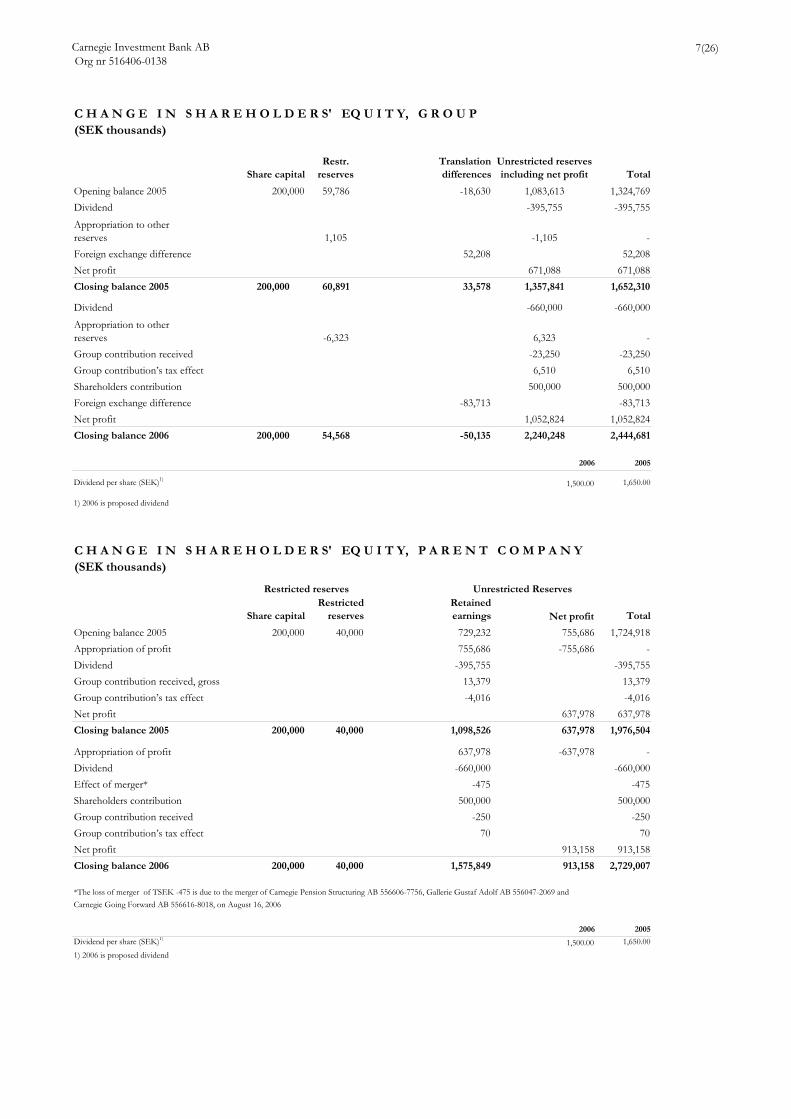
C H A N G E I N S H A R E H O L D E R S' EQ U I T Y, G R O U P(SEK thousands)
Share capitalRestr.
reservesTranslation differences
Unrestricted reserves including net profit Total
200,000 59,786 -18,630 1,083,613 1,324,769-395,755 -395,755
1,105 -1,105 -52,208 52,208
Net profit 671,088 671,088Closing balance 2005 200,000 60,891 33,578 1,357,841 1,652,310
-660,000 -660,000
-6,323 6,323 --23,250 -23,2506,510 6,510
500,000 500,000Foreign exchange difference -83,713 -83,713Net profit 1,052,824 1,052,824Closing balance 2006 200,000 54,568 -50,135 2,240,248 2,444,681
2006 2005
Dividend per share (SEK)1) 1,500.00 1,650.00
1) 2006 is proposed dividend
C H A N G E I N S H A R E H O L D E R S' EQ U I T Y, P A R E N T C O M P A N Y(SEK thousands)
Share capitalRestricted
reservesRetained earnings Net profit Total
200,000 40,000 729,232 755,686 1,724,918755,686 -755,686 -
-395,755 -395,75513,379 13,379-4,016 -4,016
Net profit 637,978 637,978Closing balance 2005 200,000 40,000 1,098,526 637,978 1,976,504
637,978 -637,978 --660,000 -660,000
-475 -475500,000 500,000
-250 -25070 70
913,158 913,158Closing balance 2006 200,000 40,000 1,575,849 913,158 2,729,007
*The loss of merger of TSEK -475 is due to the merger of Carnegie Pension Structuring AB 556606-7756, Gallerie Gustaf Adolf AB 556047-2069 and Carnegie Going Forward AB 556616-8018, on August 16, 2006
2006 2005
Dividend per share (SEK)1) 1,500.00 1,650.001) 2006 is proposed dividend
Group contribution received, gross
DividendAppropriation of profit
Effect of merger*Shareholders contribution
Group contribution’s tax effect
Appropriation of profitDividend
Opening balance 2005
Dividend
Net profit
Group contribution receivedGroup contribution’s tax effect
Group contribution’s tax effect
Shareholders contribution
Group contribution received
Unrestricted Reserves Restricted reserves
Opening balance 2005DividendAppropriation to other reserves
Appropriation to other reserves
Foreign exchange difference

Carnegie Investment Bank AB Org nr 516406-0138
8(26)
CASHFLOW STATEMENTS, GROUP AND PARENT COMPANY(SEK thousands)
Current operations 2006 2005 2006 2005
Operating profit1) 1,462,580 943,091 357,533 92,974Adjustment for items not included in cash flow Amortisation, depreciation and write-down 64,521 49,050 11,248 20,695 Other 0 0 0 0Current taxes -432,131 -262,795 -139,188 -21,256
-367,610 -213,745 -127,939 -561Cash flow from operationsbefore changes in working capital 1,094,969 729,345 229,593 92,414
Increase (-)/decrease (+) in operational assets Loans to general public -4,477,143 2,261,511 -4,312,404 1,393,422 Securities inventory -7,170,095 -1,059,089 -7,504,113 72,028 Current receivables -608,876 -2,991,069 -2,558,672 -895,988Increase (+)/decrease (-) in operational liabilities Borrowing from general public 1,312,548 1,886,130 784,993 1,273,557 Liabilities to credit institutions 6,936,329 1,411,120 7,053,173 489,868 Current liabilities 2,201,884 4,219,574 4,223,956 978,526
-1,805,353 5,728,178 -2,313,067 3,311,414
Cash flow from operations -710,383 6,457,524 -2,083,475 3,403,827
Investment activities Sale of fixed assets 2,815 6,250 1,031 1,830 Investment/acquisition of associated and other com - -1,771 - 5,950 Investment in group companies - - -9,500 2,242 Acquisition of fixed assets -39,772 -85,223 -10,386 -7,947Cash flow from investment activities -36,957 -80,744 -18,855 2,075
Financing activities Effect of merger - - -475 - Shareholders contribution 500,000 - 500,000 - Group contribution -23,250 - -250 13,379 Dividends from subsidiaries - - 658,715 586,186 Distributed dividend -660,000 -395,755 -660,000 -395,755Cash flow from financing activities -183,250 -395,755 497,990 203,810
Cash flow for the year -930,589 5,981,026 -1,604,339 3,609,712
Liquid funds at the beginning of the year 9,210,445 3,086,688 6,002,870 2,345,767
Exchange differences in liquid funds -89,727 142,731 -14,941 47,390
Liquid funds at the end of the year2) 8,190,128 9,210,445 4,383,591 6,002,870
1) Interest paid 537,363 282,261 332,887 164,068
Interest received 620,878 377,382 335,534 179,019
2) Liquid funds:
Cash and bank deposits in central banks 479,610 316,126 10,095 5,746
Loans to credit institutions 7,710,518 8,935,007 4,373,496 5,997,124
Liquid funds with maturities exceeding three months - -40,688 - -
Available liquidity at the end of the year 8,190,128 9,210,445 4,383,591 6,002,870
Parent Group

Carnegie Investment Bank AB 9(26) Org nr 516406-0138
Accounting Policies Applicable legislation and accounting standards The consolidated income statement and balance sheet and the disclosures relating to these have been prepared in accordance with the Annual Accounts Act for Credit Institutions and Securities Companies (1995:1559), the Swedish Financial Accounting Standards Council accounting standard RR 1-29 and its Emerging Issues Task Force pronouncements and the regulations of Swedish Financial Supervisory Authority (2005:33). The financial statements are presented in Swedish crowns (SEK), which is also the parent company’s functional currency. The Group Consolidation policies The consolidated financial statements include the parent and all companies in which the parent company has, directly or indirectly, a controlling influence. The parent company owns in all cases, directly or indirectly shares and participations in the companies comprised in the consolidated financial statement. The consolidated financial statements have been prepared in accordance with the purchase method of accounting and the subsidiaries’ financial reports are included in the Group consolidation as from the acquisition date and are included until the controlling influence ceases. The consolidated financial statements have been prepared in SEK. The current method is used when translating the financial statements of the subsidiaries into SEK from their functional currency. Foreign subsidiaries’ assets and liabilities have been translated at the closing exchange rates. The income statement has been translated at the average exchange rates for the accounting year. Translation differences are charged or credited directly to the shareholders’ equity of the Group. Accumulated translation differences are included in shareholders’ equity as a foreign currency translation reserve. Translation differences that arise in connection with translation of foreign net investments and the related effects of hedging the net investments are from 2005 recognised directly in the foreign currency translation reserve included in shareholders’ equity. Associated companies In the consolidated financial statements investments in associated companies, i.e. all companies in which the parent company, without owning a company as a subsidiary, direct or indirect has a controlling influence have been accounted for in accordance with the equity method. Thus, the investment is carried at an amount equal to the ownership interest in the associate’s equity adjusted for unamortised positive or negative differences between the cost of acquisition and the fair value of the net assets acquired. In the consolidated income statement, the Group’s share of the associate’s results of operations and net finance income/cost is accounted for as ‘‘Result from associated companies’’. The Group’s share of the associates’ tax expense is included in the tax expense accounted for in the consolidated income statement. The equity method is applicable until the controlling influence ceases. Untaxed reserves In the consolidated balance sheet, the untaxed reserves accounted for in the legal entities’ balance sheets, have been recognized as deferred tax liability and as part of other reserves including net profit. The deferred tax liability has been calculated using the tax rate applicable in the jurisdictions involved.

Carnegie Investment Bank AB 10(26) Org nr 516406-0138
Measurement Policies Applied Revenue recognition All purchases and sales are recognised using trade date accounting. Commissions include commission income, underwriting fees and advisory fees and are recognised on a continuous basis. Performance fees and fixed fees regarding the business areas Investment Banking, Asset Management and Private Banking business have been recognised in accordance with the terms of the client agreements. Net profit from financial transactions includes realised gains and losses and unrealised gains arising from changes in fair values of shares, bonds, derivatives and other securities. The dividends are recognised in accordance with the terms of payment. Amounts in foreign currencies have been translated on demand. Assets and liabilities in foreign currencies have been translated at the closing exchange rate. Translation differences are charged in the income statement to “Net result from financial transactions”. Expenses General administrative expenses, employee’s benefits, other personnel expenses and borrowing costs are expensed in the period in which they have occurred. Operating lease commitments are expensed continuous over the period of contract and relate mainly to rental of premises. The net present value of the agreements has not been estimated. There are no finance lease commitments within the group. Incentive programmes All outstanding employee incentive programmes are warrant programmes. All warrants were distributed free of charge, without any vesting conditions regarding the employee’s rights to the instrument. At grant date, the value of the warrants was calculated by using the Black Scholes formula for option valuation. These valuations were carried out by external advisors. The valuations are also the basis for the calculation of social security expenses. In Sweden and Luxembourg social security expenses are charged at grant date. In other countries where Carnegie has employees, social security expenses are charged when the warrants are sold or exercised by the employee. Carnegie has not granted any loans or guarantees with respect to the incentive programmes, nor entered into any hedging transactions for changes in the value of payments that may arise from these programmes. Allocation to profit-share system Allocation to profit-share system is expensed in the same period that it has occurred. Pension obligations All pension obligations within the Group are defined contribution plans. Special employer’s contribution is provided for in the same period as it has occurred. Certain individual pension obligations are covered by endowment insurances and have previously been recognized at fair value among “Other assets” and with the corresponding value as “Pension obligations”. These pension obligations are covered by insurance policies and Carnegie does not have any legal or constructive obligation to cover any losses on the policies or any obligations to pay additional benefits to the employees. The payment of fixed premiums under such contracts is the settlement of the employee benefit obligation, rather than an investment to meet the obligation. Consequently, according to RR 29, Carnegie has no longer an asset or a liability and therefore treats such payments as contributions to a defined contribution plan.

Carnegie Investment Bank AB 11(26) Org nr 516406-0138
Income taxes Income taxes include current tax and deferred tax recognised as income or expense. The tax effect from capitalised loss carry forwards and deductible temporary differences (between the tax base of an asset or a liability and its carrying amount in the balance sheet) are deferred to the extent they are related to deductions, approved by the tax authorities, and are deemed to be used. Deferred tax asset/-liability is recognised for all temporary differences. The measurement of deferred taxes is based on how the temporary differences can be utilised. Deferred tax calculations are based on standard tax rates and rules applicable in the jurisdictions involved and decided at reporting date. Cash and cash equivalents Cash and cash equivalents consist of cash, balances with central banks, loans to credit institutions payable on demand and short-term liquid investments with a maturity less than three months from the date of acquisition, and which are only exposed to an insignificant risk of changes in value. Loans to general public Loans to general public have been tested for impairment and uncollectability individually. Assets in this category are measured at accrued acquisition value. Provisions for uncollectability have been recognised when the pledges, undertaking or other guarantees are estimated not to cover the amounts due. The criteria’s for write-down of a confirmed credit loss is losses confirmed due to bankruptcy or arrangement of composition. Other financial instruments Financial instruments are measured and recognised in the Group’s accounts in accordance with the rules specified in IAS 39. Financial instruments that are recognised in the balance sheet include, on the assets side, liquid funds, accounts receivable, shares and other equity instruments, loan receivables, bond premiums and derivatives. Liabilities and shareholders’ equity include accounts payable, issued debt and equity instruments, borrowing and derivatives. Financial instruments are initially recognised at cost which corresponds to the instrument’s fair value plus transaction costs for all instruments except those classified as financial assets, which are recognised at fair value in Income Statement. Fair values are mainly determined by reference to published price quotations in an active market or are estimated using a valuation technique. The way in which they are recognised depends on how the financial instruments are classified, as described below. A financial asset or financial liability is entered in the balance sheet when the company becomes engaged by contract. Accounts receivable are entered in the balance sheet when an invoice has been issued. Liabilities are entered when the counterparty has performed and the agreed liability is due for payment, even if an invoice has not yet been received. Accounts payable are entered when an invoice is received. A financial asset is removed from the balance sheet when the rights in the agreement are realised, expire or ceases. The same applies for a portion of a financial asset. A financial liability is removed from the balance sheet when the undertakings in the agreement have been fulfilled or extinguished. The same applies to a portion of a financial liability. IAS 39 places financial instruments in different categories. The classification of financial instruments depends on the reason for their acquisition. The categories are as follows: Financial assets recognised at fair value in Income Statement This category consists of two sub-groups: financial assets held for trading and other financial assets that the company initially decided to invest in this category. Derivatives that are independent and embedded derivatives are classified as held for trading, except when they are used in hedge accounting. Assets in this category are measured at fair value and changes in fair value are recognised in Income Statement. Financial liabilities recognised at fair value in Income Statement This category consists of financial liabilities held for trading and derivatives that are not used for hedge accounting. Liabilities in this category are measured at fair value and changes in fair value are recognised in Income Statement.

Carnegie Investment Bank AB 12(26) Org nr 516406-0138
Loan receivables and accounts receivable This category consists of financial assets that are non-derivative with fixed payments, that are not quoted on an active market and that are not intended for trading. Assets in this category are measured at the accrued acquisition value. Other financial liabilities Financial liabilities not held for trading are measured at their accrued acquisition value. The accrued acquisition value is based on the effective rate of interest determined when the liability originated. Gains or losses, as well as direct issue costs are allocated over the life of the liability. Derivatives used in hedge accounting All derivatives are recognised at fair value in the balance sheet. Changes in fair value are recognised in Income Statement when the fair value is hedged. When net investments in foreign currencies are hedged, changes in the fair value are recognised in equity until the hedged item is recognised in Income Statement. Intangible fixed assets Intangible fixed assets consist of goodwill and capitalised expenses relating to software development recognised according to RR 15 and RR 17. Goodwill is measured at acquisition value less accumulated amortisations and impairment losses. The recognised amounts will be measured at every balance sheet date to determine whether there is an indication that the asset may be impaired. If there is such an indication, the asset’s recoverable value is assessed as the higher of its value in use and net selling price. The asset is written down if the recoverable amount is less than the carrying amount. Amortisation of goodwill and capitalised expenses is carried out according to plan based on the asset’s value at acquisition and assessed useful life. Capitalised software development costs are amortised at a rate of 20-33 per cent per year. Tangible fixed assets Tangible fixed assets are measured at acquisition value less accumulated depreciation and impairment losses. Tangible fixed assets consist of refurbishment costs, IT equipment and other office equipment. Depreciation and amortization charges are based on cost and allocated over the estimated useful life of the asset. Refurbishment costs are depreciated at 5–10 per cent per year. IT equipment and other office equipment are depreciated at 20–33 per cent per year. Investments in subsidiaries The holdings of the parent company in foreign subsidiaries are recognised at cost less accumulated write-downs. Anticipated dividend The anticipated dividend from subsidiaries is recognised in cases where formal decisions have been made by the Annual General Meetings or where the parent company, in some other way, has full control over the decision process before the parent company publishes its financial reports. Group contributions and shareholders’ contributions The accounting for Group and shareholders’ contributions is in accordance with the standards issued by the Swedish Financial Accounting Standards Council’s Emerging Issues Task Force pronouncements. Thus, capital contributions (including their tax effects) between Group entities are recognised in accordance with their economic substance, i.e. as changes in equity. Shareholders’ contributions are recognised as increases in carrying amount of the parent company’s investment. Segmental reporting The business areas of the Carnegie Group are reported in accordance with the current internal organizational and management structure and its system of internal financial reporting.

Carnegie Investment Bank AB 13(26) Org nr 516406-0138
Carnegie has defined the business areas as primary segments. The format for Note 1 in the annual report is the operational reporting. Information regarding assets, proportion of equity in associated companies, liabilities, investments and depreciations related to the primary segments is also included. In addition to this information about income, assets and liabilities are reported on the basis of geographical area, which is defined as secondary segments. Segment revenues, results, asset and liabilities include items directly attributable to a segment as well as common resources are allocated to each business area on a reasonable basis. Allocation to the profit-sharing system is accounted for in each business area on a fixed percentage basis, for the purpose of segmental analysis. Actual profit-share allocation is based on the full year results and distributed on a discretionary basis. Unallocated items comprise result from investment in associated companies and principal investments. Contingent liabilities A contingent liability is recognised when there is a possible obligation arising from past events and if its existence will be confirmed by one or more uncertain future events only, or when there is a commitment that is not recognised as a liability because it is not likely that an outflow of resources will be required.

Carnegie Investment Bank AB Org nr 516406-0138
14(26)
NOTES TO FINANCIAL STATEMENT - GROUP AND PARENT COMPANY(Note 1 in SEK millions, other notes in SEK thousands)
NOTE 1 – INCOME STATEMENT PER BUSINESS AREA AND BY GEOGRAPHICAL AREA
2006 2005 2006 2005 2006 2005 2006 2005 2006 2005
Total income 4,488 3,514 2,149 1,503 885 733 891 791 563 486Total operating expenses excluding profit-share -1,636 -1,662 -714 -718 -269 -267 -312 -327 -341 -350
Operating profit before profit-share 2,852 1,852 1,436 786 616 467 579 463 222 136
Profit-share -1,390 -909
-3,026 -2,571
Operating profit before taxes 1,463 943
Taxes -410 -272
NET PROFIT 1,053 671
No. of full-time equivalent employees, average 775 747 336 313 128 127 134 135 177 171
Total assets 42,026 30,785 31,823 19,462 1,125 2,686 987 1,673 8,091 6,965
Liabilities 39,581 29,132 30,915 19,472 1,189 2,227 524 1,091 6,953 6,342
Investments per business area 123 149 73 89 10 9 15 36 25 16Depreciations per business area 63 56 11 16 6 10 13 22 32 9
Total income by geographical areaNordic clients 3,106 2,409Non-Nordic clients 1,382 1,105Total income 4,488 3,514
Assets by geographical areaNordic 37,556 26,722Non- Nordic 4,470 4,063Total assets 42,026 30,785
Investments by geographical areaNordic 105 139Non- Nordic 18 10Total Investments 123 149
There are no income-generating transactions between the business areas of any significance and costs without corresponding payments are depreciation and credit provisions,these amounts are not significant.
Private Banking
Note that certain numerical information presented in millions may not sum due to rounding.
Total expenses
Asset ManagementSecuritiesTotalInvestment
Banking
Carnegie Investment Bank AB Org nr 516406-0138
15(26)
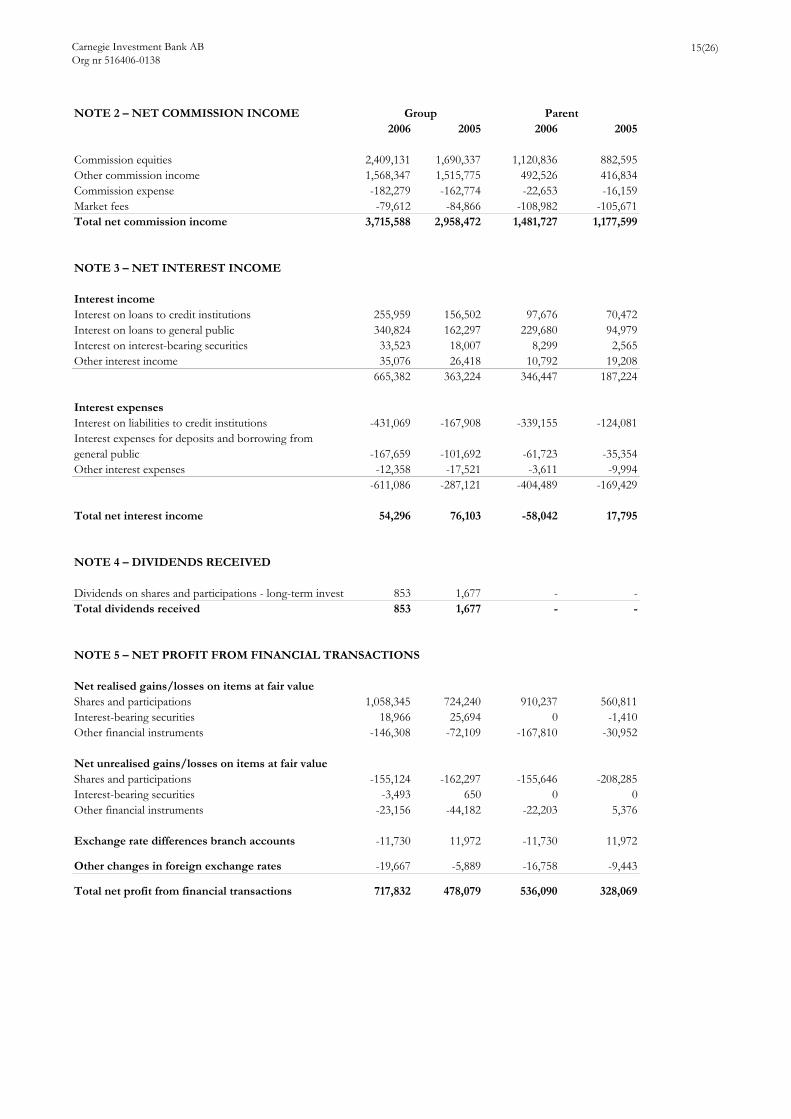
NOTE 2 – NET COMMISSION INCOME2006 2005 2006 2005
Commission equities 2,409,131 1,690,337 1,120,836 882,595Other commission income 1,568,347 1,515,775 492,526 416,834Commission expense -182,279 -162,774 -22,653 -16,159Market fees -79,612 -84,866 -108,982 -105,671Total net commission income 3,715,588 2,958,472 1,481,727 1,177,599
NOTE 3 – NET INTEREST INCOME
Interest incomeInterest on loans to credit institutions 255,959 156,502 97,676 70,472Interest on loans to general public 340,824 162,297 229,680 94,979Interest on interest-bearing securities 33,523 18,007 8,299 2,565Other interest income 35,076 26,418 10,792 19,208
665,382 363,224 346,447 187,224
Interest expensesInterest on liabilities to credit institutions -431,069 -167,908 -339,155 -124,081Interest expenses for deposits and borrowing fromgeneral public -167,659 -101,692 -61,723 -35,354Other interest expenses -12,358 -17,521 -3,611 -9,994
-611,086 -287,121 -404,489 -169,429
Total net interest income 54,296 76,103 -58,042 17,795
NOTE 4 – DIVIDENDS RECEIVED
Dividends on shares and participations - long-term investm 853 1,677 - -Total dividends received 853 1,677 - -
NOTE 5 – NET PROFIT FROM FINANCIAL TRANSACTIONS
Net realised gains/losses on items at fair valueShares and participations 1,058,345 724,240 910,237 560,811Interest-bearing securities 18,966 25,694 0 -1,410Other financial instruments -146,308 -72,109 -167,810 -30,952
Net unrealised gains/losses on items at fair valueShares and participations -155,124 -162,297 -155,646 -208,285Interest-bearing securities -3,493 650 0 0Other financial instruments -23,156 -44,182 -22,203 5,376
Exchange rate differences branch accounts -11,730 11,972 -11,730 11,972
Other changes in foreign exchange rates -19,667 -5,889 -16,758 -9,443
Total net profit from financial transactions 717,832 478,079 536,090 328,069
Group Parent

Carnegie Investment Bank AB Org nr 516406-0138
16(26)
NOTE 6 – GENERAL ADMINISTRATIVE EXPENSES Group2006 2005 2006 2005
Salaries and other remuneration paid to Boards ofDirectors and Managing Directors in;Denmark -8,313 -7,974 - -Finland -2,153 -1,429 - -Luxembourg -1,462 -1,477 - -Norway -3,315 -4,509 - -Sweden -12,712 -2,434 -8,781 -4,385Switzerland - - - -United Kingdom - - - -United States -1,106 -1,122 - -Salaries and other remuneration paid to other employees in;Denmark -146,174 -135,582 - -Finland -45,984 -46,651 -37,246 -35,083Luxembourg -26,364 -25,276 - -Norway -75,698 -66,762 -2,265 -1,810Sweden -265,361 -237,964 -255,678 -232,789Switzerland -4,591 -3,963 - -United Kingdom -44,634 -45,557 -44,634 -45,557United States -20,728 -20,586 - -Payroll overheads -132,768 -121,132 -96,504 -90,163Pension premium costs for Boards of Directors and Managing Directors -1,279 -1,706 -374 -330Pension premium costs for other employees -90,743 -82,635 -71,608 -69,919Allocation to profit-share system -1,389,509 -909,109 -667,489 -407,115Remuneration to KPMG for audit services -4,673 -4,679 -3,089 -3,125Remuneration to Grant Thornton for audit services -3,446 -2,574 - -Remuneration to Deloitte & Touche for audit services -2,620 -2,513 - -Remuneration to other audit firms for audit services -663 -1,466 -141 -814Other remuneration to KPMG -738 -986 -245 -860Other remuneration to Grant Thornton -367 -413 - -Other remuneration to Deloitte & Touche -327 -153 - -Other remuneration to other audit firms -2,195 -571 -1,778 -95Other administrative expenses -674,036 -780,980 -401,653 -511,929Total general administrative expenses -2,961,959 -2,510,203 -1,591,485 -1,403,974
Sick leave
Distribution by genderThe distribution of the board of Directors by gender is female 14% (22%) and male 86% (78%). The distribution of executive officer's by gender is female 0% (13%)and male 100% (87%).
Remuneration to the Board of Directors for 2006Board member elected to the Board of Carnegie Investmentment Bank AB as well as in other receive a total amount ofSEK 1, 4 milion (SEK 1,4 million). Board member elected to the Board of Carnegie Investmentment Bank AB as well as in other receive 100 (100) for each assignement, in total amounting to 650 (700). In addition to the compensation described above, Dag Sehlin has, through a wholly-owned company, received a total of SEK 0,5 million (SEK 0,4 million) for his assignments in Carnegie's credit and risk committee and the internal audit committee.
Remuneration to CEO and Executive officers
Parent
In 2006, sick leave among employees in Swedish companies constitutes 1,4% (1,1%) of total regular working hours, of which 0,8% (0,4%) exceeding 60 days. Sick leave distributed by gender is female 0,6% (0,5%) and male 0,9% (0,6%), and the distribution by age is 0,7% (0,1%) less than or 29 years, 1,3% (0,8%) between 30-49 years and 3,2% (0,2%) among employees 50 years or older.
Carnegie’s CEO Stig Vilhelmson received a salary of SEK 2.8 million for the nine-months period from his appointment as CEO in March 2006. The CEO’s profit-share allocation for 2006 was SEK 19.1 million, of which a payment of SEK 4.0 million was made to a pension insurance to the benefit of the CEO. The CEO received no other benefits in 2006. Carnegie´s former CEO Karin Forseke received SEK 0.9 million for her work as CEO Jan–March 2006, and SEK 3.6 million according to the terms for notice of termination and severance pay.
The 6 (7) executive officers, excluding the CEO, received a total remuneration of SEK 69.4 million in 2006 (SEK 65.3 million). The profit-share allocation was SEK 57.5 million (SEK 49.9 million), of which 10.1 million (SEK 19.3 million) concerned payments to pension insurances to the benefit of the Executive officers. The Executive officers received no other benefits (–).

Carnegie Investment Bank AB Org nr 516406-0138
17(26)
PensionsCarnegie makes salary-based premium payments for pension insurance (based on salaries excluding profit-share) on behalf of all employees in accordance with standards in each country. All of Carnegie’s pension obligations are based on defined contribution plans and are reinsured with external parties.
Carnegie has no pension obligations outstanding and makes no payments for pension insurance to the non-executive Board members. No pension premiums were paid to the chairman of the Board in 2006.
The CEO (or the company) has the right to activate the retirement at the CEO’s age of 60. Other members of Group Management are covered by customary terms in each country and have a retirement age of 65 to 67 years of age. The retirement does not trigger any additional expenses for the company.
Notice of termination and severance payNo agreement on severance pay has been made with any of the non-executive Board members. The CEO must give 12 months’ notice to terminate her employment; Carnegie must give 24 months’ notice. In the event of a termination with immediate effect by Carnegie, the CEO will receive a severance payamounting to 24 months' salary, as well as compensation for other benefits for a 24-months' period.
Carnegie’s executive officers must comply with notice periods for termination of employment that range from 3 to 12 months, while the company must provide a period of notice of between 3 and 24 months. Only the CEO has a period of notice provided by the company of 24 months.
Average number of employees (of which women)2006 2005 2006 2005
Denmark 139 ( 42) 137 ( 36) - -Finland 69 ( 28) 68 ( 29) 49 (20) 47 (20)Luxembourg 40 ( 11) 40 ( 11) - -Norway 95 ( 25) 87 ( 23) 3 (2) 2 (2)Sweden 376 ( 105) 355 ( 103) 353 (101) 352 (101)Switzerland 4 ( -) 4 - - -United Kingdom 38 ( 15) 39 ( 14) 38 (15) 39 (14)United States 14 ( 4) 16 ( 4) - -Total 775 (230) 746 (220) 443 (138) 440 (137)
NOTE 7 – DEPRECIATION OF TANGIBLE AND AMORTISATION OF INTANGIBLE FIXED ASSETS
2006 2005 2006 2005IT equipment and other machinery -24,054 -27,135 -6,732 -10,169Leasehold improvements -770 -5,036 -770 -5,036Goodwill -1,002 -11,254 - -Other intangible fixed assets -38,696 -12,753 -3,746 -6,450Total depreciation of tangible and amortisation of intangible fixed assets -64,521 -56,178 -11,248 -21,655
NOTE 8 – PROVISIONS FOR CREDIT LOSSES, NET
Net credit lossesWrite-down of confirmed credit losses - - - -Reversals of previous provisions for anticipated credit loss 629 -1,335 629 -1,335Provisions for anticipated credit losses -523 -3,525 -523 -3,525Funds recovered from earlier confirmed credit losses - - - -Reversals no longer required for anticipated credit losses 385 - 385 -Result of individually assessed credits 491 -4,860 491 -4,860
Write-downs of confirmed credit losses, provisions and reversals are attributable to loans to general public.
NOTE 9 – ANTICIPATED DIVIDENDS
2006 2005Dividends from subsidiaries 658,715 586,186Total appropriations 658,715 586,186
Group Parent
Group Parent
Goodwill assignable to asset management operations in Finland was fully written down during the last quarter 2005 when tested for impairment. The write-down was based on an assessment of significantly lower expected future cash flows as a consequence of decreased assets under management.
Parent

Carnegie Investment Bank AB Org nr 516406-0138
18(26)
NOTE 10 – TAXES2006 2005 2006 2005
Current taxesIncome tax expense for the period -460,519 -278,928 -161,137 -45,893Tax from previous years assessments 2,840 -597 2,841 -600
Deferred taxesTax on utilisation/recognition of loss carryforwards -798 -2,249 - -Tax effect on changes in standard tax rate - - - -Other deferred taxes 48,721 9,703 55,205 21,311Total effective tax expense -409,756 -272,071 -103,090 -25,182
Average tax rate 28% 29% 10% 4%
Reconciliation of effective tax Profit before taxes 1,462,580 943,159 1,016,248 663,160Tax expense according to applicable tax rates1) -422,920 -272,220 -286,989 -185,685Tax from previous years assessments 2,840 -597 2,841 -600Tax on anticipated dividends - - 184,440 164,132Tax on other temporary differences -37,598 -6,708 -58,588 -24,340Tax on utilisation/recognition of loss carryforwards2) -798 -2,249 - -Other deferred taxes 48,721 9,703 55,205 21,311Total effective tax expense -409,756 -272,071 -103,090 -25,182
1) The product of taxable accounting profit multiplied by the applicable tax rates in each subsidiary.2) Deferred tax assets on remaining tax losses carryforward amounts to 11 763 (12 560). The tax losses have a 10 year limit for utilising the losses.
Tax assets , included in Other assetsTax receivable 60,918 70,184 45,549 49,842Deferred tax assets 109,875 94,478 92,088 76,243
Tax liabilities, included in Other liabilitiesTax liabilities 190,159 92,406 36,364 -Tax liabilities, including in provisionsDeferred tax liabilities 22,385 15,308 - 1,297
Parent Group
Carnegie Investment Bank AB Org nr 516406-0138
19(26)
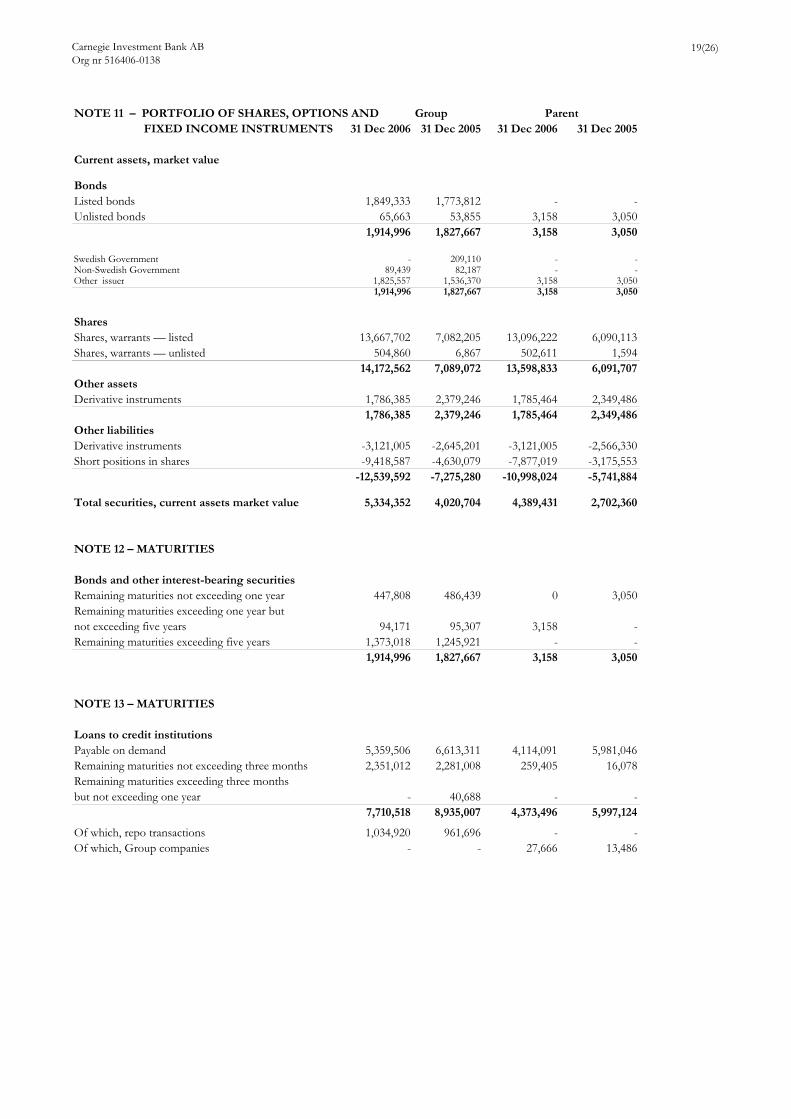
NOTE 11 – PORTFOLIO OF SHARES, OPTIONS AND Group FIXED INCOME INSTRUMENTS 31 Dec 2006 31 Dec 2005 31 Dec 2006 31 Dec 2005
Current assets, market value
BondsListed bonds 1,849,333 1,773,812 - -Unlisted bonds 65,663 53,855 3,158 3,050
1,914,996 1,827,667 3,158 3,050
Swedish Government - 209,110 - -Non-Swedish Government 89,439 82,187 - -Other issuer 1,825,557 1,536,370 3,158 3,050
1,914,996 1,827,667 3,158 3,050
SharesShares, warrants — listed 13,667,702 7,082,205 13,096,222 6,090,113Shares, warrants — unlisted 504,860 6,867 502,611 1,594
14,172,562 7,089,072 13,598,833 6,091,707Other assetsDerivative instruments 1,786,385 2,379,246 1,785,464 2,349,486
1,786,385 2,379,246 1,785,464 2,349,486Other liabilitiesDerivative instruments -3,121,005 -2,645,201 -3,121,005 -2,566,330Short positions in shares -9,418,587 -4,630,079 -7,877,019 -3,175,553
-12,539,592 -7,275,280 -10,998,024 -5,741,884
Total securities, current assets market value 5,334,352 4,020,704 4,389,431 2,702,360
NOTE 12 – MATURITIES
Bonds and other interest-bearing securitiesRemaining maturities not exceeding one year 447,808 486,439 0 3,050Remaining maturities exceeding one year butnot exceeding five years 94,171 95,307 3,158 -Remaining maturities exceeding five years 1,373,018 1,245,921 - -
1,914,996 1,827,667 3,158 3,050
NOTE 13 – MATURITIES
Loans to credit institutionsPayable on demand 5,359,506 6,613,311 4,114,091 5,981,046Remaining maturities not exceeding three months 2,351,012 2,281,008 259,405 16,078Remaining maturities exceeding three monthsbut not exceeding one year - 40,688 - -
7,710,518 8,935,007 4,373,496 5,997,124
Of which, repo transactions 1,034,920 961,696 - -Of which, Group companies - - 27,666 13,486
Parent

Carnegie Investment Bank AB Org nr 516406-0138
20(26)
cont´d note 1331 Dec 2006 31 Dec 2005 31 Dec 2006 31 Dec 2005
Loans to general publicPayable on demand 7,718,590 3,152,720 7,175,956 2,861,962Remaining maturities not exceeding three months 1,162,790 749,220 - -Remaining maturities exceeding three months but notexceeding one year 23,683 525,876 - -Remaining securities exceeding one year but notexceeding five years 747 464 - -
8,905,810 4,428,280 7,175,956 2,861,962
Of which, repo transactions - - - -Of which, Group companies - - 104,499 102,121
Liabilities to credit institutionsPayable on demand 14,495,740 6,889,071 14,470,498 6,864,014Remaining maturities not exceeding three months 1,269,739 1,912,291 164,736 721,568Remaining maturities exceeding one year but not exceeding five years - 28,500 - -
15,765,479 8,829,861 14,635,234 7,585,582
Of which, repo transactions 1,046,231 1,161,723 - -Of which, Group companies - - 24,908 9,517
Deposits and borrowing from general publicPayable on demand 7,227,894 5,957,480 4,592,847 3,809,185Remaining maturities not exceeding three months 1,504,150 1,441,309 - -Remaining maturities exceeding three monthsbut not exceeding one year 9,620 3,496 - -Remaining maturities exceeding one year but not exceeding five years - 27,300 - -
8,741,664 7,429,585 4,592,847 3,809,185
Of which, repo transactions - - - -Of which, Group companies - 536,091 753,643 597,007
NOTE 14 – UNSETTLED RECEIVABLE AND NON-PERFORMING CREDITS 31 Dec 2006 31 Dec 2005 31 Dec 2006 31 Dec 2005
Doubtful receivables for which interest is not credited prior to actual payment 30,868 33,768 30,868 33,719Provisions for anticipated creditlosses on doubtful receivables -30,868 -33,768 -30,868 -33,719Estimated value on non-performing creditsafter write-down from anticipated credit losses 0 0 0 0
Total provision by geographic area
Nordic -30,868 -33,719 -30,868 -33,719Non-Nordic - -49 - -Total -30,868 -33,768 -30,868 -33,719
Group Parent
Group Parent

Carnegie Investment Bank AB Org nr 516406-0138
21(26)
NOTE 15 – SHARES AND PARTICIPATIONS IN ASSOCIATED COMPANIES
Corporate identity number
/Reg. Office
Number of
shares
Proportion of
equity (share of votes), %
Share of profit 2006
Share of profit 2005
Share of equity 2006
Share of equity 2005
Book value in parent company
2006
556560-7677Capital C AB Stockholm 2,550 - - 68 - - -
Total book value - 68 - - -
NOTE 16 – SHARES IN GROUP COMPANIES31 Dec 2006 31 Dec 2005
Acquisition value January 1 1,038,501 1,040,743Acquisition within the Group, incl divestements through merger 9,500 -Acquisition Capital C AB and Carnegie Properties AB - 26,150Write-down of shares in Capital C AB - -16,000Sale of Carnegie Pension Consulting AB - -12,392Net book value, December 31 1,048,001 1,038,501
Corporate identity number/Reg. office No. of shares Book value 2006 Equity*Carnegie, Inc. Delaware 100 12,712 72,756
Carnegie ASA** Oslo 20,000 93,608 108,118
Carnegie Ltd London 1 - 354
Carnegie Fond AB 556527-9642 110,000 1,110 14,063
556636-7776 1,000 10,000 1,483
Capital C AB 556560-7677 5,100 10,050 10,508
Carnegie Properties AB 556680-5288 1,000 100 398
Carnegie Asset Management Finland Ab 623.606 Helsinki 4,800 73,951 24,334
Subsidiaries of Carnegie Asset Management Finland Ab Carnegie Fondbolag Ab Helsinki
Carnegie Asset Management Danmark Holding A/S 226.229 Copenhagen 25,000 66,678 97,378
Subsidiaries of Carnegie Asset Management Danmark Holding A/S Carnegie Asset Management Fondmaeglerselskab A/S Copenhagen Carnegie Asset Administration A/S CopenhagenCarnegie Asset Management Holding Norge AS Oslo 90,000 47,320 43,151
Subsidiaries of Carnegie Asset Management Holding Norge AS Carnegie Kapitalforvaltning AS OsloCarnegie Bank A/S** 109.861 Copenhagen 1 144,894 150,487
Banque Carnegie Luxembourg S.A.** 1993-2201863 Luxembourg 349,999 587,578 221,679
Subsidiaries of Banque Luxembourg S.A. Carnegie Fund Management Company S.A. Carnegie Asset Management S. A.
Total 1,048,001 744,709
* Equity in subsidiaries is reported excluding anticipated dividends to the Parent Company.All shares above are unlisted and owned 100% by the Parent Company.
** Classified as credit institutions
2,941,368
Karlstad
Stockholm
976,307,852
StockholmStockholm
Capital C AB is a software development company and supplier of after trade solutions for the securities industry including Carnegie. In December 2005 Carnegie acquired ABN Amro's 50 per cent holding in Capital C. Capital C is consolidated into the Carnegie Group from 31 December 2005.
13-3392829
Parent
Familjeföretagens Pensionsredovisning i Värmland AB
936,310,974
Carnegie Investment Bank AB Org nr 516406-0138
22(26)
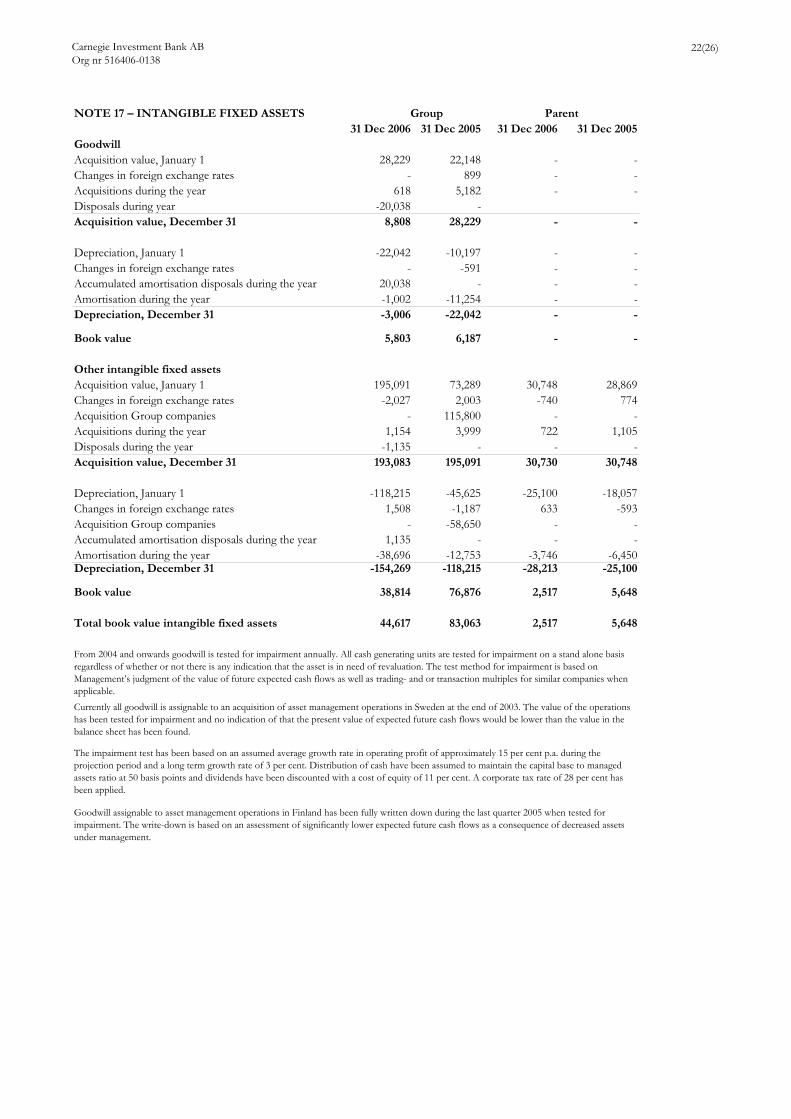
NOTE 17 – INTANGIBLE FIXED ASSETS31 Dec 2006 31 Dec 2005 31 Dec 2006 31 Dec 2005
GoodwillAcquisition value, January 1 28,229 22,148 - -Changes in foreign exchange rates - 899 - -Acquisitions during the year 618 5,182 - -Disposals during year -20,038 -Acquisition value, December 31 8,808 28,229 - -
Depreciation, January 1 -22,042 -10,197 - -Changes in foreign exchange rates - -591 - -Accumulated amortisation disposals during the year 20,038 - - -Amortisation during the year -1,002 -11,254 - -Depreciation, December 31 -3,006 -22,042 - -
Book value 5,803 6,187 - -
Other intangible fixed assetsAcquisition value, January 1 195,091 73,289 30,748 28,869Changes in foreign exchange rates -2,027 2,003 -740 774Acquisition Group companies - 115,800 - -Acquisitions during the year 1,154 3,999 722 1,105Disposals during the year -1,135 - - -Acquisition value, December 31 193,083 195,091 30,730 30,748
Depreciation, January 1 -118,215 -45,625 -25,100 -18,057Changes in foreign exchange rates 1,508 -1,187 633 -593Acquisition Group companies - -58,650 - -Accumulated amortisation disposals during the year 1,135 - - -Amortisation during the year -38,696 -12,753 -3,746 -6,450Depreciation, December 31 -154,269 -118,215 -28,213 -25,100
Book value 38,814 76,876 2,517 5,648
Total book value intangible fixed assets 44,617 83,063 2,517 5,648
Group Parent
From 2004 and onwards goodwill is tested for impairment annually. All cash generating units are tested for impairment on a stand alone basis regardless of whether or not there is any indication that the asset is in need of revaluation. The test method for impairment is based on Management’s judgment of the value of future expected cash flows as well as trading- and or transaction multiples for similar companies when applicable.Currently all goodwill is assignable to an acquisition of asset management operations in Sweden at the end of 2003. The value of the operations has been tested for impairment and no indication of that the present value of expected future cash flows would be lower than the value in the balance sheet has been found.
The impairment test has been based on an assumed average growth rate in operating profit of approximately 15 per cent p.a. during the projection period and a long term growth rate of 3 per cent. Distribution of cash have been assumed to maintain the capital base to managed assets ratio at 50 basis points and dividends have been discounted with a cost of equity of 11 per cent. A corporate tax rate of 28 per cent has been applied.
Goodwill assignable to asset management operations in Finland has been fully written down during the last quarter 2005 when tested for impairment. The write-down is based on an assessment of significantly lower expected future cash flows as a consequence of decreased assets under management.
Carnegie Investment Bank AB Org nr 516406-0138
23(26)
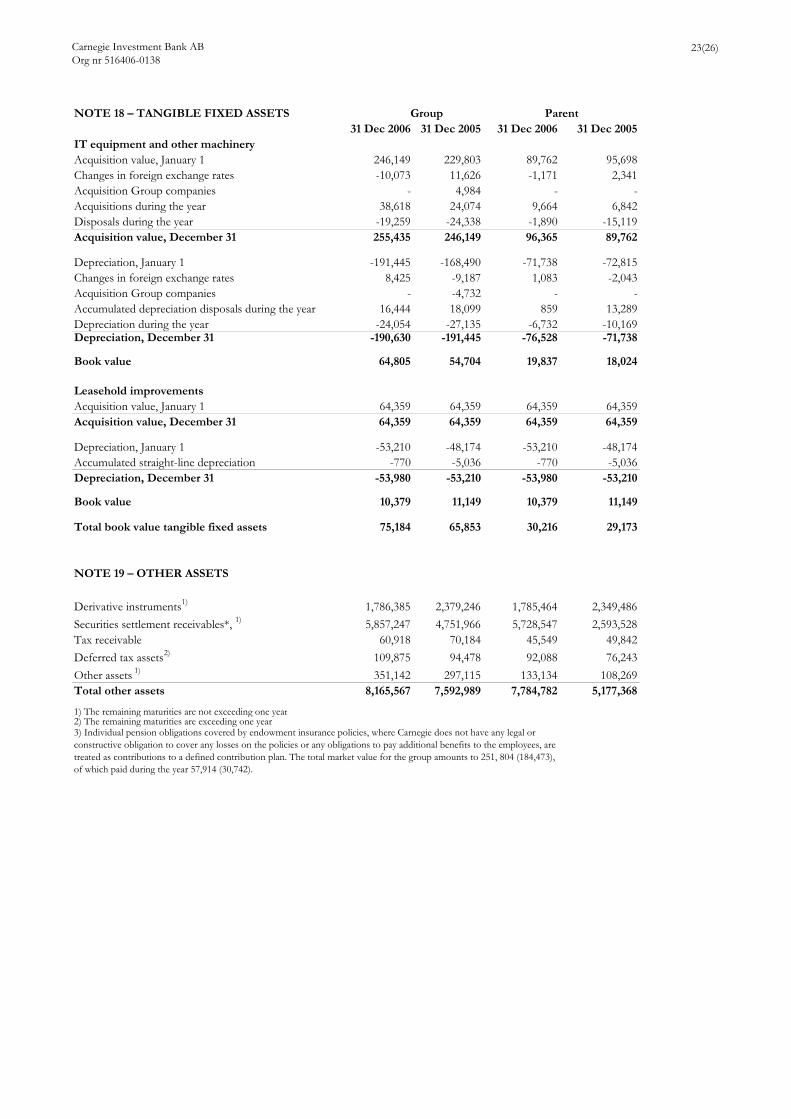
NOTE 18 – TANGIBLE FIXED ASSETS31 Dec 2006 31 Dec 2005 31 Dec 2006 31 Dec 2005
IT equipment and other machineryAcquisition value, January 1 246,149 229,803 89,762 95,698Changes in foreign exchange rates -10,073 11,626 -1,171 2,341Acquisition Group companies - 4,984 - -Acquisitions during the year 38,618 24,074 9,664 6,842Disposals during the year -19,259 -24,338 -1,890 -15,119Acquisition value, December 31 255,435 246,149 96,365 89,762
Depreciation, January 1 -191,445 -168,490 -71,738 -72,815Changes in foreign exchange rates 8,425 -9,187 1,083 -2,043Acquisition Group companies - -4,732 - -Accumulated depreciation disposals during the year 16,444 18,099 859 13,289Depreciation during the year -24,054 -27,135 -6,732 -10,169Depreciation, December 31 -190,630 -191,445 -76,528 -71,738
Book value 64,805 54,704 19,837 18,024
Leasehold improvementsAcquisition value, January 1 64,359 64,359 64,359 64,359Acquisition value, December 31 64,359 64,359 64,359 64,359
Depreciation, January 1 -53,210 -48,174 -53,210 -48,174Accumulated straight-line depreciation -770 -5,036 -770 -5,036Depreciation, December 31 -53,980 -53,210 -53,980 -53,210
Book value 10,379 11,149 10,379 11,149
Total book value tangible fixed assets 75,184 65,853 30,216 29,173
NOTE 19 – OTHER ASSETS
Derivative instruments1) 1,786,385 2,379,246 1,785,464 2,349,486Securities settlement receivables*, 1) 5,857,247 4,751,966 5,728,547 2,593,528Tax receivable 60,918 70,184 45,549 49,842Deferred tax assets2) 109,875 94,478 92,088 76,243Other assets 1) 351,142 297,115 133,134 108,269Total other assets 8,165,567 7,592,989 7,784,782 5,177,368
1) The remaining maturities are not exceeding one year2) The remaining maturities are exceeding one year
Group Parent
3) Individual pension obligations covered by endowment insurance policies, where Carnegie does not have any legal or constructive obligation to cover any losses on the policies or any obligations to pay additional benefits to the employees, are treated as contributions to a defined contribution plan. The total market value for the group amounts to 251, 804 (184,473), of which paid during the year 57,914 (30,742).
Carnegie Investment Bank AB Org nr 516406-0138
24(26)
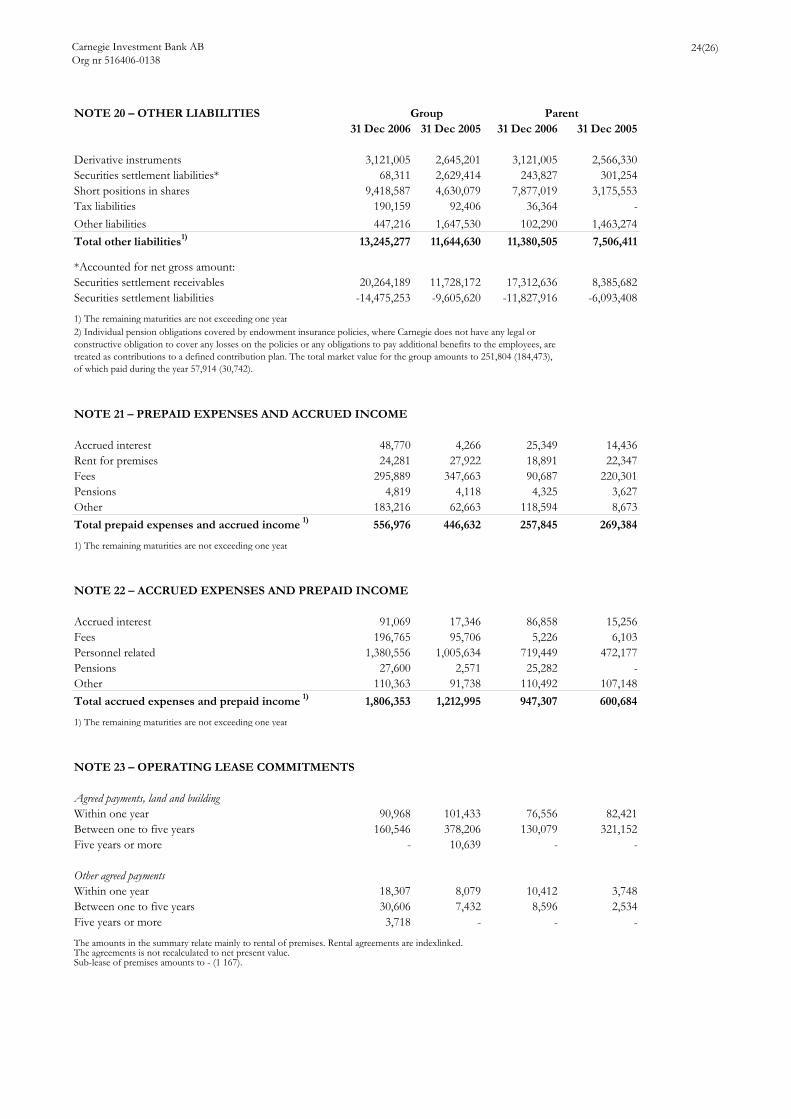
NOTE 20 – OTHER LIABILITIES31 Dec 2006 31 Dec 2005 31 Dec 2006 31 Dec 2005
Derivative instruments 3,121,005 2,645,201 3,121,005 2,566,330Securities settlement liabilities* 68,311 2,629,414 243,827 301,254Short positions in shares 9,418,587 4,630,079 7,877,019 3,175,553Tax liabilities 190,159 92,406 36,364 -Other liabilities 447,216 1,647,530 102,290 1,463,274Total other liabilities1) 13,245,277 11,644,630 11,380,505 7,506,411
*Accounted for net gross amount:Securities settlement receivables 20,264,189 11,728,172 17,312,636 8,385,682Securities settlement liabilities -14,475,253 -9,605,620 -11,827,916 -6,093,408
1) The remaining maturities are not exceeding one year
NOTE 21 – PREPAID EXPENSES AND ACCRUED INCOME
Accrued interest 48,770 4,266 25,349 14,436Rent for premises 24,281 27,922 18,891 22,347Fees 295,889 347,663 90,687 220,301Pensions 4,819 4,118 4,325 3,627Other 183,216 62,663 118,594 8,673Total prepaid expenses and accrued income 1) 556,976 446,632 257,845 269,384
1) The remaining maturities are not exceeding one year
NOTE 22 – ACCRUED EXPENSES AND PREPAID INCOME
Accrued interest 91,069 17,346 86,858 15,256Fees 196,765 95,706 5,226 6,103Personnel related 1,380,556 1,005,634 719,449 472,177Pensions 27,600 2,571 25,282 -Other 110,363 91,738 110,492 107,148Total accrued expenses and prepaid income 1) 1,806,353 1,212,995 947,307 600,684
1) The remaining maturities are not exceeding one year
NOTE 23 – OPERATING LEASE COMMITMENTS
Agreed payments, land and buildingWithin one year 90,968 101,433 76,556 82,421Between one to five years 160,546 378,206 130,079 321,152Five years or more - 10,639 - -
Other agreed paymentsWithin one year 18,307 8,079 10,412 3,748Between one to five years 30,606 7,432 8,596 2,534Five years or more 3,718 - - -
The amounts in the summary relate mainly to rental of premises. Rental agreements are indexlinked. The agreements is not recalculated to net present value.Sub-lease of premises amounts to - (1 167).
Group Parent
2) Individual pension obligations covered by endowment insurance policies, where Carnegie does not have any legal or constructive obligation to cover any losses on the policies or any obligations to pay additional benefits to the employees, are treated as contributions to a defined contribution plan. The total market value for the group amounts to 251,804 (184,473), of which paid during the year 57,914 (30,742).

Carnegie Investment Bank AB Org nr 516406-0138
25(26)
NOTE 24 – CAPITAL ADEQUACY RATIO
Risk Management
Carnegie's business activities by their nature expose Carnegie to market, credit, cashflow and operational risks. Market risk is defined as the risk of loss due to changes in market prices, e.g. changes in equity prices, interest rates, or currency exchange rates. Credit risk is defined asthe risk of loss due to counterparty default on loans or other counterparty exposure. Credit risk is also includes liquidity risk, e.g. Risks arisingwhen lending and funding are not matched. As Carnegie does not provide any long-term loan facilities, liquidity risks are not of significant size.The objective of the Carnegie risk management organisation is to assist in controlling risks that are inherent in the business. Comprehensiverisk management policies and procedures are established to identify, control and monitior each major risk area.
The risk managers are independent of the business areas and report directly to the senior management, group risk managers and respectiveBoard of Directors. The Board of Directors of the subsidiaries establish limits for market risks. The local treasury and finance functions and/or credit departments and local risk managers carry out the local credit risk management functions. The Group treasury and finance functions monitor Carnegie's cash flow situation and manage the cash flow risk. Operational risks are less direct than market and credit risk, but managing them is critical. particularly in a rapidly changing environment with high transaction volumes. In order to reduce or mitigate theserisks, an internal control environment has been established, which incorporates various control mechanisms at different levels throughoutthe organisation and within such departments as finance, accounting, operations, compliance, legal and internal audit.
Specification of risk-weighted amounts, interest rate risk by maturity
The Group use the maturity method. Interest-rate risk can be divided into general risk, 1 805 383 (332 294) and specific risk 467 432 (437 144).
Specification of risk-weighted amounts, interest rate risk by maturity 31 Dec 2006 31 Dec 2005
General risk 1,805,383 332,294
Specific risk
Remaining maturities not exceeding six months 612 4,412Remaining maturities exceeding six months but not exceeding two years 10,393 26,348Remaining maturities exceeding two years 456,427 406,384Total specific risk 467,432 437,144
Interest-rate risk 2,272,815 769,438
Large exposures
A large exposure is an exposure to one client or a closely related group of clients witch amounts to more than 10% of the regulative capital base,171 876 (86 592). One single large exposure should never exceed 25% of the capital base 429 691 (216 480) and accumulated large exposuresshould never exceed 800% of the capital base 13 750 112 (6 927 344).
31 Dec 2006 31 Dec 2005 31 Dec 2006 31 Dec 2005
Regulatory capital base 1,718,764 865,918 2,034,402 1,228,613
Risk-weighted amount for credit risks 7,634,101 4,723,443 6,464,110 2,730,191
Interest-rate risk 2,272,815 769,438 1,315,722 149,017Share-price risk 1,356,823 355,514 1,191,591 270,342Divestment-price risk 24,495 64,025 24,114 62,013Counterparty risk and other risk 816,988 234,661 242,384 160,671Foreign exchange risk 483,545 719,588 328,798 156,705
Total risk-weighted amount for market risks 4,954,666 2,143,226 3,102,609 798,748
Total risk-weighted amount for credit risks and market risks 12,588,767 6,866,669 9,566,719 3,528,939
CAPITAL ADEQUACY RATIO 13.65% 12.61% 21.27% 34.82%
Group Parent
Group

Carnegie Investment Bank AB Org nr 516406-0138
26(26)
Stockholm, 1 February 2007
Christer Zetterberg Hugo AndersenChairman
Niclas Gabrán Anders Ljungh
Dag Sehlin Fields Wicker-Miurin
Stig VilhelmsonChief Executive Officer
Our auditors' report was rendered on 16 February 2007
KPMG Bohlins AB
Anders Ivdal Per WardhammarAuthorised Public Accountant Authorised Public Accountant
Auditor appointed by the Swedish Financial Supervisory Authority

Auditors’ Report To the annual meeting of the Shareholders of Carnegie Investment Bank AB
Corporate identity number 5 16406-01 38
We have audited the annual accounts, the consolidated accounts, the accounting records and the administration of the Board of Directors and the Managing Director of Carnegie Investment Bank AB for the year 2006. These accounts and the administration of the Company and the application of the Annual Accounts Act for Credit Institutions and Securities Companies when preparing the annual accounts are the responsibility of the Board of Directors and the Managing Director. Our responsibility is to express an opinion on the annual accounts, the consolidated accounts and the administration based on our audit.
We conducted our audit in accordance with generally accepted auditing standards in Sweden. Those standards require that we plan and perform the audit to obtain high but not absolute assurance that the annual accounts and the consolidated accounts are free of material misstatement. An audit includes examining, on a test basis, evidence supporting the amounts and disclosures in the accounts. An audit also includes assessing the accounting principles used and their application by the Board of Directors and the Managing Director and significant estimates made by the Board of Directors and the Managing Director when preparing the annual accounts, as well as evaluating the overall presentation of information in the annual accounts and the consolidated accounts. As a basis for our opinion concerning discharge from liability, we examined significant decisions, actions taken and circumstances of the Company in order to be able to determine the liability, if any, to the Company of any Board member or the Managing Director. We also examined whether any Board member or the Managing Director has, in any other way, acted in contravention of the Companies Act, the Annual Accounts Act for Credit Institutions and Securities Companies, or the Articles of Association. We believe that our audit provides a reasonable basis for our opinion set out below.
The annual accounts and the consolidated accounts have been prepared in accordance with the Annual Accounts Act for Credit Institutions and Securities Companies and, thereby, give a true and fair view of the Company’s and Group’s financial position and results of operations in accordance with generally accepted accounting principles in Sweden. The Statutory Administration Report is consistent with the other parts of the annual accounts.
We recommend to the general meeting of shareholders that the income statements and balance sheets of the Parent Company and the Group be adopted, that the profit of the Parent Company be dealt with in accordance with the proposal in the Administration Report and that the members of the Board of Directors and the Managing Director be discharged from liability for the financial year.
Stockholm 16 February 2007
KPMG Bohlins AB f
Anders Ivdal Per Wardhammar Authorized Public Accountant Authorized Public Accountant
Appointed by the Swedish Financial Supervisory Authority