Cargotec Nordnet 28.3.2017
89
Matkalla älykkään lastinkäsittelyn markkinajohtajaksi Hanna-Maria Heikkinen, sijoittajasuhdejohtaja Sijoittajaesitys, maaliskuu 2017 Maaliskuu 2017 1 Sijoittajaesitys
-
Upload
nordnet-suomi -
Category
Economy & Finance
-
view
58 -
download
0
Transcript of Cargotec Nordnet 28.3.2017

Matkalla älykkään lastinkäsittelyn
markkinajohtajaksi Hanna-Maria Heikkinen, sijoittajasuhdejohtaja
Sijoittajaesitys, maaliskuu 2017
Maaliskuu 2017 1 Sijoittajaesitys

Sisällys 1. Cargotec lyhyesti
2. Miksi sijoittaa Cargoteciin?
3. Kalmar
4. Hiab
5. MacGregor
6. Vuoden 2016 tulos
7. Osinko ja näkymät
8. Liite
Maaliskuu 2017 Sijoittajaesitys 2

Cargotec lyhyesti
Maaliskuu 2017 Sijoittajaesitys 3

Johtava lastinkäsittelylaitteiden toimittaja Vahva globaali toimija, jonka maantieteellinen jakauma on hajautettu
Cargotec-konserni
Liikevaihto: 3 514 milj.
euroa
Liikevoitto: 7,1 %
Huoltoliiketoiminta: 25 %
Kalmar
Liikevaihto: 1 700 milj.
euroa
Liikevoitto: 8,0 %
Huoltoliiketoiminta: 26 %
Hiab
Liikevaihto: 1 036 milj.
euroa
Liikevoitto: 13,5 %
Huoltoliiketoiminta: 22 %
MacGregor
Liikevaihto: 778 milj.
euroa
Liikevoitto: 2,3 %
Huoltoliiketoiminta: 26 %
Liikevaihdon
maan-
tieteellinen
jakaantuminen
2016
Liikevaihdon
maan-
tieteellinen
jakaantuminen
2016
Liikevaihdon
maan-
tieteellinen
jakaantuminen
2016
AMER
36 %
EMEA
42 %
APAC
22 %
AMER
41 %
EMEA
48 %
APAC
11 %
AMER
7 %
EMEA
34 %
APAC
59 %
Luvut: 2016
Liikevoitto (%) ilman uudelleenjärjestelykuluja
Maaliskuu 2017 Sijoittajaesitys 4

Kilpailijat Cargotec on johtava toimija kaikilla liiketoiminta-alueillaan
Maaliskuu 2017 Sijoittajaesitys 5
Globaalit
pääkilpailijat
Muut
kilpailijat

Cargotecin liiketoimintaportfolio
Maaliskuu 2017 Sijoittajaesitys 6
Vuoden 2016 liikevaihto* MEUR
Tilaustrendi,
2016
Kannattavuus:
Liikevoittomarginaali, 2016
Kalmarin ohjelmisto (Navis)
ja automaatioratkaisut ja
projektit -divisioona
MacGregor
-34 %
Hiab
+5 %
Kalmarin laitteet ja huoltopalvelut
(poislukien automaatioratkaisut ja
projektit -divisioona ja Navis)
Alhainen pitkäaikaisten
investointien takia
2,3 %
13,5 %
Alhainen
kaksinumeroinen luku
*Luvut pyöristetty lähimpään 100 miljoonaan
~1 000
~1 300
3 514
Kalmarin
laitteistot
Hiab
MacGregor
Kalmar APD ja
ohjelmisto
~400
~800

Miksi sijoittaa Cargoteciin?
Maaliskuu 2017 Sijoittajaesitys 7

1. Teknologiajohtaja ja vahva markkina-asema,
johtavia brändejä markkinoilla, joilla on pitkän
tähtäimen kasvupotentiaalia
2. Transformaatio laitetoimittajasta älykkään
lastinkäsittelyn markkinajohtajaksi
3. Kasvava huoltoliiketoiminta ja kevyeen
taseeseen perustuva liiketoimintamalli
vähentävät suhdannevaihtelujen vaikutusta
4. Tulevaisuuden automaation ja ohjelmistoalan
kasvun kansainvälisten mahdollisuuksien
hyödyntäminen
5. Etenemässä kohti kannattavuuden
parantamista ja taloudellisten tavoitteiden
saavuttamista
Miksi sijoittaa Cargoteciin?

1. Teknologiajohtaja ja vahva markkina-asema
Kalmar Hiab MacGregor
Loppumarkkinat Satamat, terminaalit, jakelukeskukset Rakennus-, jakelu-, metsätalous-, puolustus- sekä jätteenkäsittely- ja kierrätysala
Merikuljetusala ja offshore-ala
Markkina-asema 1-2# 1-2# 1-2#
Keskeiset
menestystekijät
ja niitä tukevat
megatrendit
Globalisaation ja kasvavan keskiluokan ansiosta kasvava maailmankauppa
Konttiliikenteen kasvu, suuremmat laivat vaativat investointeja satamissa, satamien on tehostettava toimintaansa automatisoimalla, työturvallisuuden merkitys korostuu
Rakennusalan kasvu väestönkasvun ja kaupungistumisen myötä
Jakelutapojen ja -menetelmien muutos
Kasvava jalansija kehittyvissä maissa
Globalisaation ja kasvavan keskiluokan ansiosta kasvava maailmankauppa, öljyn hinta
Kilpailuetu Tunnettu premium-tuotemerkki
Ohjelmistoalan markkinajohtaja
Tarjoaa täydellistä automaatioratkaisua (laitteet, ohjelmistot ja automaatio, huolto)
Kevyeen taseeseen perustuva liiketoimintamalli
Hiab on toinen suuren luokan kansainvälisistä toimijoista
Monipuolinen tuotevalikoima
Kevyt taserakenne, tehokas kokoonpano
Kevyt taserakenne, teknologiajohtaja, globaalisti lähellä asiakkaita (telakat ja varustamot), alan osaaminen
Maaliskuu 2017 Sijoittajaesitys 9

2. Transformaatio laitetoimittajasta älykkään lastinkäsittelyn markkinajohtajaksi
Maaliskuu 2017 Sijoittajaesitys 10
2013
Tuotejohtajuus Hyvä laiteratkaisujen
toimittaja
Tuotekehitys edistää
tarjonnan kehittämistä ja
myyntikatteen nousua
2018
Huoltoalan johtajuus Korkeatasoinen ja kattava
huoltoliiketoiminta
Verkkoon liitetyt laitteet ja
data-analytiikka kasvattavat
arvoa
Merkittävä
ohjelmistoliiketoiminta
2020
Älykkään
lastinkäsittelyn
markkinajohtaja 40 % liikevaihdosta huolto- ja
ohjelmistoliiketoiminnasta
Tehokkaammat ja
optimoidut
lastinkäsittelyratkaisut
Huippuluokan
huoltoliiketoiminta
Johtava asema
digitalisaatiossa
Maailmanluokan
johtajuuden rakentaminen
Strategian toteutuksen painopistealueet

Huoltopalveluiden liikevaihto MEUR
0
100
200
300
400
500
600
700
800
900
1000
2013 2014 2015 2016
Maaliskuu 2017 Sijoittajaesitys 11
3. Kasvava huoltoliiketoiminta ja kevyt taserakenne vähentävät suhdannevaihtelujen vaikutusta
Kevyt taserakenne sekä joustava kulurakenne
Kalmar ja Hiab: tehokas kokoonpano
MacGregor: tehokas projektinhallinta- ja tekninen osasto: > 85 %
tuotannosta ja 30 % suunnittelusta ja teknisestä kapasiteetista on ulkoistettu
Ei omaa komponenttien valmistusta
Johtava tuotevalikoima luo kestävän perustan huoltopalveluiden
kehittämiselle
Huoltopalveluiden lisääminen tuo vakautta, parantaa kannattavuutta ja
vähentää kausivaihteluiden vaikutusta
Suuri asennuskanta – houkutteleva potentiaali
Toimenpiteet varaosien hyödyntämisasteen nostamiseksi:
Myyntiprosessin kehittäminen
Digitalisointiin panostaminen: online-palvelut ja verkkokaupparatkaisut
Jakelukeskukset parantamassa saatavuutta

Toimialan trendit tukevat kasvua
satamien automatisoituessa:
Laivat ovat yhä isompia ja
piikkikapasiteetit kasvaneet
Terminaalialueiden turvallisuus
kiinnostaa toimijoita yhä enemmän
Asiakkaat haluavat vähemmän
energiaa kuluttavia ja nollapäästöisiä
satamia
Optimihyötysuhde, tehokas tilankäyttö
ja kulujen pienentäminen ovat yhä
tärkeämpiä asioita
Koulutetun ja ammattitaitoisen
työvoiman puute ja korkea hinta
pakottavat terminaaleja
automatisoitumaan
Maaliskuu 2017 Sijoittajaesitys 12
4. Tulevaisuuden automaation ja ohjelmistoalan kasvun kansainvälisten mahdollisuuksien hyödyntäminen Digitalisoituminen tukee huoltopalveluita ja ohjelmistoalan kasvua ja päinvastoin
Merkittävät mahdollisuudet
satamaohjelmistoissa:
Konttien arvoketju on erittäin tehoton:
tehottomuuden kokonaisarvoksi
arvioidaan noin 17 mrd. euroa
Konttilaiva-alalla käytetään vuosittain
IT-ohjelmistoihin noin 1,7 mrd. euroa.
Markkinan arvioidaan kasvavan
2,8 miljardiin euroon vuoteen 2020
mennessä
Satamat tekevät yli 50 %
ohjelmistoistaan itse, ennen pitkää
sisäiset ratkaisut eivät ole
kilpailukykyisiä
Navis on satamien
toiminnanohjausjärjestelmien
markkinajohtaja
500 ohjelmistoinsinööriä
Automaatiolla huomattavia kustannussäästöjä*
Työvoimakustannukset 60 % pienemmät
työvoimakustannukset
Kokonaiskustannukset 24 % pienemmät
Liikevoiton kasvu 125%
* Vaikutukset, kun manuaalinen terminaali muutetaan automatisoiduksi

3 181 3 358
3 729 3 514
127 149
231 250
0
50
100
150
200
250
300
350
400
2013 2014 2015 2016
Liikevaihto
Liikevoitto*
5. Selkeä suunnitelma kannattavuuden parantamiseksi ja taloudellisten tavoitteiden saavuttamiseksi
Maaliskuu 2017 Sijoittajaesitys 13
Kasvu
Tavoitteena on kasvaa markkinoita
nopeammin
Megatrendit ja vahva markkina-asema
tukevat orgaanista kasvua
Yrityskauppojen
mahdollisuudet
Tase ja osinko
Nettovelkaantumisasteen tavoite
alle 50 % ja osinko 30–50 %
osakekohtaisesta tuloksesta
Vahva kassavirta
Nettovelkaantumisaste tavoitteen
alapuolella, mahdollistaa
vakaan osingonmaksun
Kannattavuus
10 %:n liikevoittotavoite kaikilla
liiketoiminta-alueilla ja 15 %
sijoitetun pääoman tuotto (ROCE)
konsernin tasolla syklin yli
Kustannussäästötoimet:
Vuonna 2017 25 MEUR (MacGregor)
Vuonna 2017 Interschalt 2 MEUR
Vuonna 2018 13 MEUR (Lidhultin
tuotannon siirto Kalmarissa)
Tuotteiden uudistaminen ja
projektinhallinnan kehittäminen
Suurempi liikevoitto tukee sijoitetun
pääoman tuottoa (ROCE)
Liikevaihdon ja liikevoiton
kehitys
*ilman uudelleenjärjestelykuluja
4,0 % 4,4 %
6,2 % 7,1 %
Liikevoitto-
marginaali*
4 500
4 000
3 500
3 000
2 500
2 000
1 500
1 000
500
0

Kalmar
Maaliskuu 2017 Sijoittajaesitys 14

359,2 374,8 398,3 404,0 408,7 418 435 450 464
168,7 173,0 182,2 174,0 183,3 186 186 192 198 94,1
95,2 98,3 107,0 100,1 102
115 118
121
622 642
675 682 692 707 729
752 775
0
100
200
300
400
500
600
700
800
900
2012 2013 2014 2015 2016 2017 2018 2019 2020
APAC EMEA AMER
Kontinkäsittelyvolyymien ennustetaan yhä kasvavan
MTEU
+3,3 % +5,1 % +1,0 % +1,3 %
+2,1 % +3,0 %
+3,2 % +3,0 %
Kasvu vuodesta 2012 vuoteen 2020 25 %
CAGR 2,8 %
Lähde: Drewry: Container forecaster -ennuste Q4 2016
(Drewry Container forecaster Q3 2016 -raportin arviot vuosille 2018–2020, viimeisin päivitetty versio saatavilla)
Maaliskuu 2017 Sijoittajaesitys 15

Joustava ja skaalautuva Navis-toiminnanohjausjärjestelmä
Maaliskuu 2017 Sijoittajaesitys 16
Terminaalilogistiikkajärjestelmä
Trukki- ja vaihtoalue
ASC-pinoamisalue
Automaattisen konttinosturin (ASC) pinoamisalue
Automaattinen horisontaalinen kuljetus
Laiturin nosturialue
Laitteet Laitteet
Terminaalin toiminnanohjausjärjestelmä (TOS)

Hiab
Maaliskuu 2017 Sijoittajaesitys 17

Rakennusalan tuotanto EMEA Vuosimuutos (%)
Rakennusalan tuotanto AMER Vuosimuutos (%)
Rakennusalan tuotanto edistää kasvumahdollisuuksia
Oxford Economics: Industry Output Forecast
10/2016
-14,0
-12,0
-10,0
-8,0
-6,0
-4,0
-2,0
0,0
2,0
4,0
6,0
2007 2009 2011 2013 2015 2017
60
65
70
75
80
85
90
95
100
105
Indeksi Muutos-%
-12,0
-10,0
-8,0
-6,0
-4,0
-2,0
0,0
2,0
4,0
6,0
2007 2009 2011 2013 2015 2017
60
65
70
75
80
85
90
95
100
105
110
Indeksi Muutos-%
Maaliskuu 2017 Sijoittajaesitys 18

MacGregor

Pitkäaikaiset sopimukset 2011–2025 Kauppalaivat > 2 000 brt (pl. offshore ja muut)
Pitkäaikaiset sopimukset 2013–2022 Liikkuvat offshore-yksiköt
Kauppalaiva- ja offshore-alusten tilausmäärät ovat mahdollisesti nyt pohjalla
Maaliskuu 2017 Sijoittajaesitys 20
Lähteet: UNCTAD
Clarkson research, tammikuu 2016
Clarkson research, syyskuu 2016 (2017–
2025)
0
100
200
300
400
500
600
700
800
900
1 000
Avg. 0
5-1
5
2013
2014
2015
2016
2017
2018
2019
2020
2021
2022
Yksiköt, kpl
0
500
1 000
1 500
2 000
2 500
3 000
Avg. 96-1
5
2011
2012
2013
2014
2015
2016
2017
2018
2019
2020
2021
2022
2023
2024
2025
Laivat, kpl
Historiallinen keskiarvo
Historiallinen keskiarvo

Vuoden 2016 tulos
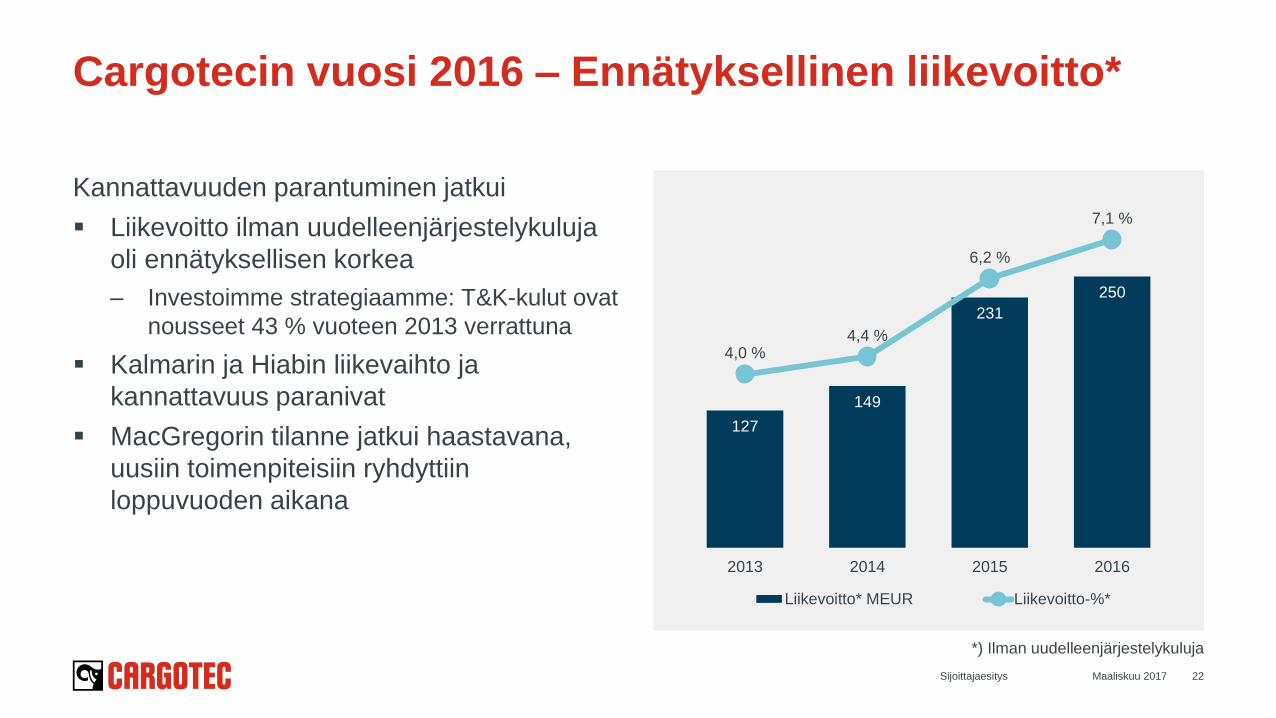
Kannattavuuden parantuminen jatkui
Liikevoitto ilman uudelleenjärjestelykuluja
oli ennätyksellisen korkea
– Investoimme strategiaamme: T&K-kulut ovat
nousseet 43 % vuoteen 2013 verrattuna
Kalmarin ja Hiabin liikevaihto ja
kannattavuus paranivat
MacGregorin tilanne jatkui haastavana,
uusiin toimenpiteisiin ryhdyttiin
loppuvuoden aikana
127
149
231
250
4,0 % 4,4 %
6,2 %
7,1 %
2013 2014 2015 2016
Liikevoitto* MEUR Liikevoitto-%*
Maaliskuu 2017 Sijoittajaesitys 22
Cargotecin vuosi 2016 – Ennätyksellinen liikevoitto*
*) Ilman uudelleenjärjestelykuluja

181 204
315
373
0
50
100
150
200
250
300
350
400
2013 2014 2015 2016
Maaliskuu 2017 Sijoittajaesitys 23
Liiketoiminnan rahavirta vahva
MEUR

578
719 622
503
46,7 %
59,2 %
46,4 %
36,0 %
0%
20%
40%
60%
80%
0
100
200
300
400
500
600
700
800
2013 2014 2015 2016
Nettovelka, MEUR Nettovelkaantumisaste-%
Maaliskuu 2017 Sijoittajaesitys 24
Vahva tase - nettovelkaantumisaste tavoitteessa (alle 50 %)
MEUR

Liikevaihto ja liikevoitto ilman uudelleenjärjestelykuluja
paranivat
– Tehostunut projektinhallinta tuki kannattavuutta
Satamissa käsiteltävien konttien määrä kasvoi 1,3 %
– Kalmarin kontinkäsittelylaitteiden kysyntä oli
vakaata
Asiakkaiden kiinnostus automaatioratkaisuja kohtaan
kasvoi, mutta uusia investointipäätöksiä tehtiin hitaasti
Huoltoliiketoiminnan liikevaihto kasvoi hieman,
mutta jäi odotuksistamme
– Kehitys parani loppuvuotta kohti
Kalmar – Strategian toimeenpano etenee
0
500
1 000
1 500
2 000
2013 2014 2015 2016
Liikevaihto Saadut tilaukset
0%
3%
5%
8%
10%
0
40
80
120
160
2013 2014 2015 2016
Liikevoitto* Liikevoitto-%*
MEUR
*) Ilman uudelleenjärjestelykuluja
Maaliskuu 2017 Sijoittajaesitys 25

Liikevaihto kasvoi 12 %
– Liikevaihto kasvoi kaikilla maantieteellisillä alueilla
– Markkinaosuus kasvoi
– Uudet tuotteet vauhdittivat tilauksia (54 uutta
tuotetta)
Liikevoitto ilman uudelleenjärjestelykuluja parani
merkittävästi
– Volyymin kasvu, tulosparannustoimenpiteet sekä
uudet tuotteet tukivat kannattavuutta
Huoltoliiketoiminnan liikevaihto kasvoi 7 %
Hiab – Ennätyksellinen vuosi
0
200
400
600
800
1 000
1 200
2013 2014 2015 2016
Liikevaihto Saadut tilaukset
0%
3%
5%
8%
10%
13%
15%
0
25
50
75
100
125
150
2013 2014 2015 2016
Liikevoitto* Liikevoitto-%*
MEUR
*) Ilman uudelleenjärjestelykuluja
Maaliskuu 2017 Sijoittajaesitys 26

Liikevaihto ja saadut tilaukset laskivat
– Uusia kauppalaivoja tilattiin merkittävästi
edellisvuotta vähemmän
– Offshore-sektorilla loppuvuodesta hieman
kohonnut öljyn hinta ei vielä tukenut
investointiaktiviteettia
Liikevoitto ilman uudelleenjärjestelykuluja laski,
mutta säilyi voitollisena
– Uusiin toimenpiteisiin kustannusten
sopeuttamiseksi ryhdyttiin loppuvuoden aikana
Huoltoliiketoiminnan liikevaihto laski 12 %
MacGregor – Vaikea markkinatilanne jatkui
0
200
400
600
800
1 000
1 200
2013 2014 2015 2016
Liikevaihto Saadut tilaukset
0%
3%
5%
8%
10%
0
25
50
75
100
2013 2014 2015 2016
Liikevoitto* Liikevoitto-%*
MEUR
*) Ilman uudelleenjärjestelykuluja
Maaliskuu 2017 Sijoittajaesitys 27

T&K investoinnit T&K investoinnit ovat nousseet
43 % vuodesta 2013
Digitalisaatio
Cargotec IoT Cloud -alusta
Panostukset
ohjelmistoliiketoimintaan
Uudet tuotelanseeraukset
Tuotteiden kilpailukyky,
kustannustehokkuus ja
ekotehokkuus
Maaliskuu 2017 Sijoittajaesitys 28
Investoinnit tutkimukseen ja tuotekehitykseen
63,5 67,3
82,8 90,8
2,0 % 2,0 %
2,2 %
2,6 %
0,0 %
0,6 %
1,2 %
1,8 %
2,4 %
3,0 %
0
20
40
60
80
100
2013 2014 2015 2016
Tutkimus- ja tuotekehitysmenot % liikevaihdosta
MEUR

583 634
787
840 18,3 % 18,9 %
21,1 %
23,9 %
0,0 %
2,5 %
5,0 %
7,5 %
10,0 %
12,5 %
15,0 %
17,5 %
20,0 %
22,5 %
25,0 %
0
100
200
300
400
500
600
700
800
900
1 000
2013 2014 2015 2016
Bruttokate, MEUR Bruttokate-%
Maaliskuu 2017 Sijoittajaesitys 29
Uudet tuotteet ovat tukeneet bruttokatteen kehitystä
MEUR

Osinko ja vuoden 2017 näkymät

0,95 euron osinko vuodelta 2016 (B-sarjan osake)
Maaliskuu 2017 Sijoittajaesitys 31
Osinko ja osakekohtainen tulos
0,89
1,11
2,21
1,95
0,42 0,55
0,80 0,95
0,00
0,50
1,00
1,50
2,00
2,50
2013 2014 2015 2016
Osinko Osakekohtainen tulos Osinko / osakekohtainen tulos
50%
36% 49%
47%

Liikevoiton ilman
uudelleenjärjestelykuluja arvioidaan
paranevan vuodesta 2016
(250,2 milj. euroa)
Vuoden 2017 näkymät

Appendix 1. Largest shareholders and financials
2. Sustainability
3. Kalmar
4. Hiab
5. MacGregor
Maaliskuu 2017 Sijoittajaesitys 33

14,1 %
12,3 %
10,5 %
3,0 %
60,1 %
Wipunen varainhallinta Oy Mariatorp Oy
Pivosto Oy KONE Foundation
Others
Maaliskuu 2017 Sijoittajaesitys 34
Largest shareholders 28 February 2017
% of shares % of votes
1. Wipunen varainhallinta Oy 14.1 23.7
2. Mariatorp Oy 12.3 22.9
3. Pivosto Oy 10.5 22.1
4. KONE Foundation 3.0 5.5
5. The State Pension Fund 1.6 0.7
6. Ilmarinen Mutual Pension Insurance
Company
1.5 0.7
7. Varma Mutual Pension Insurance
Company
0.8 0.3
8. Keva 0.7 0.3
9. Nordea Finland Fund 0.6 0.3
10. Herlin Heikki Juho Kustaa 0.6 0.3
Nominee registered and non-Finnish
holders
27.5
Total number of shareholders 21,404
Wipunen varainhallinta Oy is a company controlled by Ilkka Herlin, Mariatorp Oy
a company controlled by Niklas Herlin and Pivosto Oy a company controlled by Ilona Herlin.
% of shares

Income statement
Sijoittajaesitys 35 Maaliskuu 2017

Balance sheet
Sijoittajaesitys 36 Maaliskuu 2017
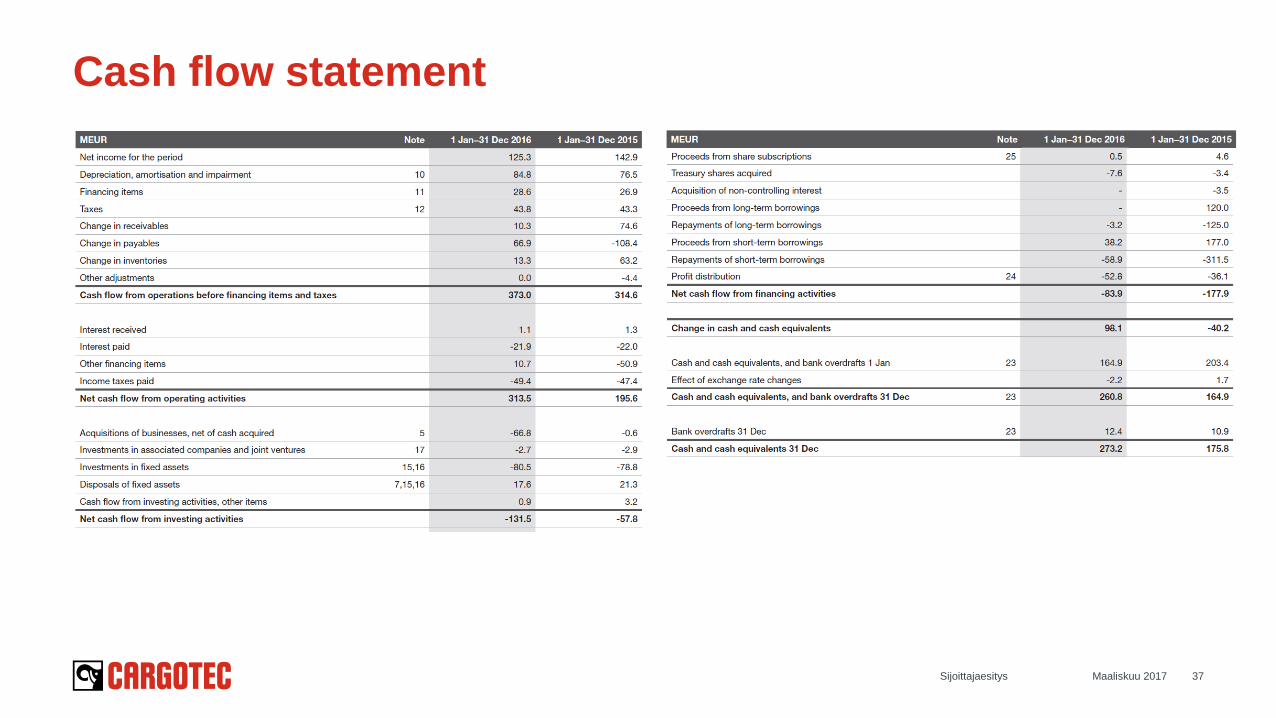
Cash flow statement
Sijoittajaesitys 37 Maaliskuu 2017

M&A strategy focusing on bolt on acquisitions
Kalmar
Focus on service footprint expansion
and software offering
Hiab
Focus on expanding geographical
presence and product offering
MacGregor
Focus on distressed assets and
software and intelligent technology
Maaliskuu 2017 Sijoittajaesitys 38

Maaliskuu 2017 Sijoittajaesitys 39
Number of containers handled
at ports grew
Growth continued in 2016,
but at slower pace
Strong interest for efficiency improving
automation solutions
Customer decision making is slower
Construction activity on good level
Strong development continued in the US
Activity levels increasing in Europe
Marine cargo handling equipment
market still weak
Market remained weak both in merchant
and offshore
Shipping and oil price environment
improved towards the end of the year
Market environment in 2016
Sources: Unctad, Clarkson Research
(number of ships and offshore units)
1466
394 0
500
1 000
1 500
2 000
2015 2016
256
81
0
200
400
600
800
2015 2016
568
590
500
525
550
575
600
2015 2016
667 677
600
625
650
675
700
2015 2016
682 692
500
550
600
650
700
2015 2016
Long term contracting – Key driver for MacGregor
Construction output – Key driver for Hiab
Global container throughput (MTEU) – Key driver for Kalmar
Merchant ships > 2,000 gt Mobile offshore units
North America Europe
Source: Oxford Economics (USD billion, 2010 prices)
Source: Drewry
+3.9% +1.5%
+1.3%
Historical average Historical average
-73% (y/y)
-68% (y/y)

0
200
400
600
800
1 000
Q1 2015 Q2 2015 Q3 2015 Q4 2015 Q1 2016 Q2 2016 Q3 2016 Q4 2016
Kalmar Hiab MacGregor
40
Orders received – Hiab’s and Kalmar’s orders received grew in Q4
MEUR
0
750
1 500
2 250
3 000
3 750
2015 2016
Kalmar Hiab MacGregor
+5%
-2%
-34%
939 887 907
824
903
825
733
822 3,283
3,557
+13% (y/y)
-44% (y/y)
+11% (y/y)
Maaliskuu 2017 Sijoittajaesitys
MEUR

Order book MEUR
Maaliskuu 2017 Sijoittajaesitys 41
Order book stable in Kalmar and Hiab
Order book by reporting
segments, Q4 2016
0
500
1 000
1 500
2 000
2 500
Q1 2015 Q2 2015 Q3 2015 Q4 2015 Q1 2016 Q2 2016 Q3 2016 Q4 2016
Kalmar Hiab MacGregor
50 %
16 %
34 %
Kalmar Hiab MacGregor

Sales MEUR
Operating profit* MEUR
42
Good development in Kalmar and Hiab operating profit
0
250
500
750
1 000
Q115 Q215 Q315 Q415 Q116 Q216 Q316 Q416
Kalmar Hiab MacGregor
52,3 58,0
68,3
52,1
58,5 64,8 65,9
61,0
-25
0
25
50
75
Q115 Q215 Q315 Q415 Q116 Q216 Q316 Q416
Kalmar Hiab MacGregor Cargotec total EBIT**
*) Excluding restructuring costs, **) Including Corporate admin and support
889 936 928
977
828 898
854
933
Maaliskuu 2017 Sijoittajaesitys
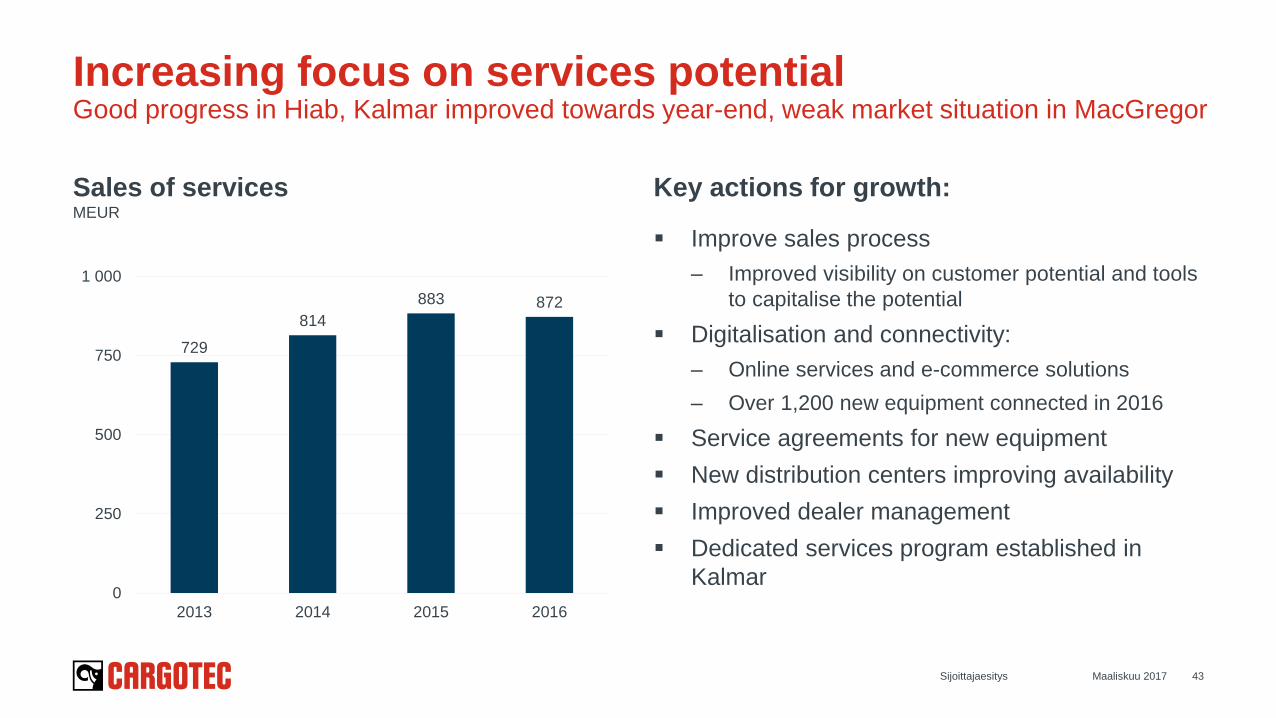
Sales of services MEUR
729
814
883 872
0
250
500
750
1 000
2013 2014 2015 2016
Key actions for growth:
Improve sales process
– Improved visibility on customer potential and tools
to capitalise the potential
Digitalisation and connectivity:
– Online services and e-commerce solutions
– Over 1,200 new equipment connected in 2016
Service agreements for new equipment
New distribution centers improving availability
Improved dealer management
Dedicated services program established in
Kalmar
43
Increasing focus on services potential Good progress in Hiab, Kalmar improved towards year-end, weak market situation in MacGregor
Maaliskuu 2017 Sijoittajaesitys

MEUR Q416 Q415 Change
Orders
received
440 395 +11%
Order book 900 877 +3%
Sales 477 468 +2%
Operating
profit*
41.5 35.9 +16%
Operating
profit margin*
8.7% 7.7 %
Orders received increased
in EMEA
– Growth in Automation
and Projects, software and
services orders received
Order book at last year’s level
Service sales increased 6%,
software sales growing
Profitability improved in
Automation and Projects,
software and services
Kalmar Q4 – Strong quarter
20 %
10 %
70 %
Sales mix
in 2016
Automation and Projects
Software
Equipment and Service
*) Excluding restructuring costs

MEUR Q416 Q415 Change
Orders
received
282 250 +13%
Order book 286 305 -6%
Sales 257 249 +3%
Operating
profit*
32.9 30.7 +7%
Operating
profit margin*
12.8% 12.3%
Good growth in EMEA and
APAC
– Orders driven by new
products: 54 new products
introduced in 2016
Sales grew in loader cranes
and demountables
Several additional costs
impacted profitability
– Around 1.5 percentage point
impact on operating profit
margin*
Hiab Q4 – New product launches driving orders
80 %
10 %
10 %
Sales mix
in 2016
Commercial
Large customers
Military
*) Excluding restructuring costs
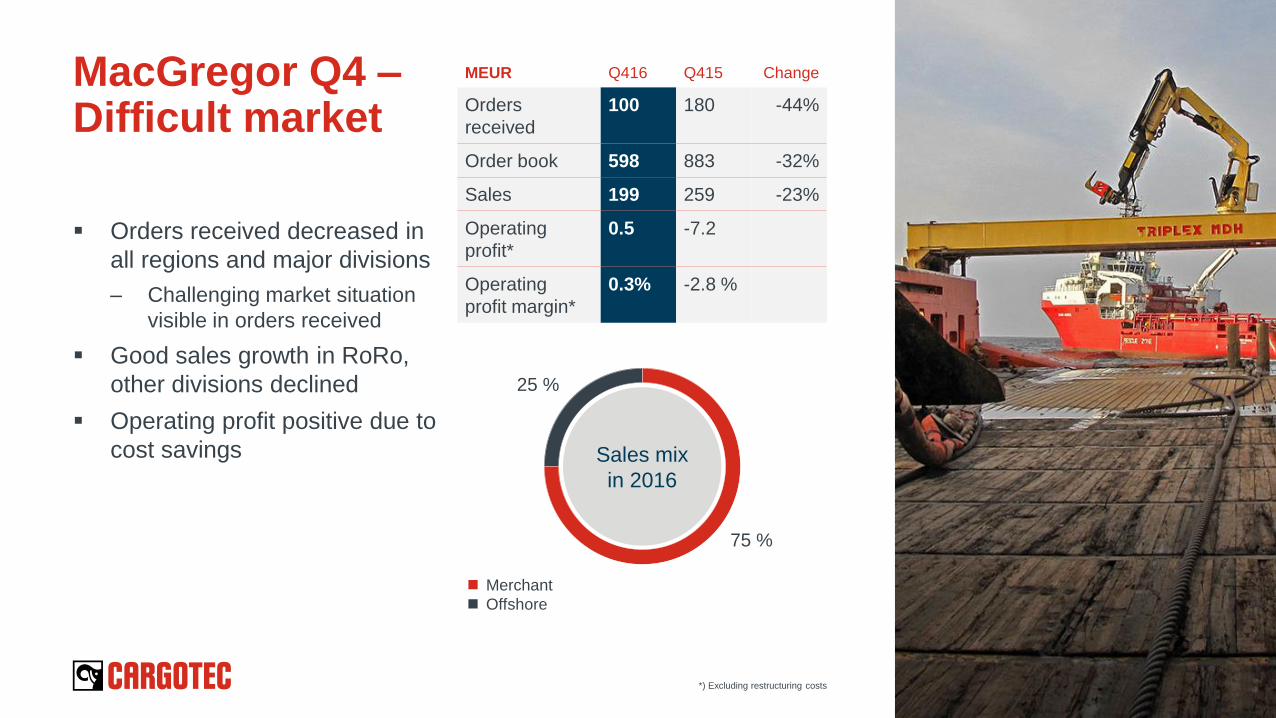
Sales mix
in 2016
MEUR Q416 Q415 Change
Orders
received
100 180 -44%
Order book 598 883 -32%
Sales 199 259 -23%
Operating
profit*
0.5 -7.2
Operating
profit margin*
0.3% -2.8 %
Orders received decreased in
all regions and major divisions
– Challenging market situation
visible in orders received
Good sales growth in RoRo,
other divisions declined
Operating profit positive due to
cost savings
MacGregor Q4 – Difficult market
75 %
25 %
Merchant
Offshore
*) Excluding restructuring costs

Maaliskuu 2017 Sijoittajaesitys 47
Net debt EUR 503 million (622)
Average interest rate 2.3%
Net debt/EBITDA 1.8
Total equity EUR 1,395 million
(1,339)
Equity/total assets 39.1% (39.8%)
Well diversified loan portfolio:
Bonds EUR 304 million
Bank loans EUR 425 million
Other EUR 41 million
Undrawn facilities EUR 300 million
Balanced maturity profile
EUR 129 million loans maturing
in 2017
Balance sheet strengthening
129
233
157
192
59
0
50
100
150
200
250
2017 2018 2019 2020 2021-
578
719 622
503
46,7 %
59,2 %
46,4 %
36,0 %
0%
20%
40%
60%
80%
400
500
600
700
800
2013 2014 2015 2016
Net debt (lhs) Gearing-% (rhs)
Maturity profile
Net debt and gearing
MEUR
MEUR

MacGregor has strong positions in both the marine and offshore market
Maaliskuu 2017 Sijoittajaesitys 48
Marine
~3/4 of sales
Offshore
~1/4 of sales
#1 #1-2 #1 #1
#1 #2 #1 #1
Container lashing Hatch covers Cranes and
selfunloaders
RoRo
Offshore advanced
load handling
Offshore winches Mooring systems Loading and
offloading systems

MacGregor’s asset-light business model gives flexibility
Maaliskuu 2017 Sijoittajaesitys 49
Sales &
marketing
Design &
engineering
Manufacturing Installation Lifecycle
support
MacGregor MacGregor MacGregor MacGregor MacGregor
Outsourced Outsourced
Outsourced
Cost-efficient scaling
85% of manufacturing outsourced
30% of design and engineering capacity outsourced

Digitalisation
IoT cloud platform
succesfully built
Good progress in equipment
connectivity
Navis offering
complemented by
INTERSCHALT acquisition
XVELA collaboration
platform in commercial pilot
Services
Spare parts: Focus on
branding, logistics, pricing
and launching new
products
Services operation
development
Good progress in Hiab
Maaliskuu 2017 Sijoittajaesitys 50
Strategy progressed well in 2016
Leadership
Aim to establish more
uniform performance-based
leadership culture
Over 200 key leaders
engaged to leadership
transformation
Good progress in employee
engagement

Capital expenditure
0
20
40
60
80
100
120
2013 2014 2015 2016
Capex Customer financing Depreciation*
Research and development
0,0 %
0,6 %
1,2 %
1,8 %
2,4 %
3,0 %
0
20
40
60
80
100
2013 2014 2015 2016
R&D expenditure % of sales
Maaliskuu 2017 Sijoittajaesitys 51
Capex and R&D
*) Including amortisations and impairments
Main capex investments:
Kalmar assembly unit in Stargard, Poland
Manufacturing plant expansion in Kansas, US for Kalmar
R&D investments focused on
Digitalisation
Competitiveness and cost efficiency of products

52
Operating profit* margin improved, ROCE impacted by restructuring costs
8,8
7,1
0
2
4
6
8
10
12
2013 2014 2015 2016
ROCE Operating profit margin %*
Maaliskuu 2017 Sijoittajaesitys
MEUR
ROCE, annualised *) Excluding restructuring costs

Maaliskuu 2017 Sijoittajaesitys 53
Hiab’s share increasing in sales mix
(33)
45 %
25 %
30 %
Kalmar Hiab MacGregor
48 %
30 %
22 %
Kalmar Hiab MacGregor
2015 2016

Maaliskuu 2017 Sijoittajaesitys 54
Well diversified geographical sales mix
(33)
40 %
32 %
28 %
EMEA APAC Americas
42 %
27 %
31 %
EMEA APAC Americas
2015 2016

Maaliskuu 2017 Sijoittajaesitys 55
Sales by geographical segment by business area 2016
42% (42)
22% (22)
36% (36)
EMEA APAC Americas
48% (48)
11% (10)
41% (42)
EMEA APAC Americas
34% (29)
59% (65)
7% (6)
EMEA APAC Americas

Turnaround is delivering results
in Hiab and Kalmar; MacGregor
has improvement plan in place
Transformation has started from equipment
business to world class services offering and
leadership in intelligent cargo handling
Investing to ensure a leading position
Shaping the portfolio to increase shareholder
value
From turnaround to leader in intelligent cargo handling with sector leading profitability
Target:
10% operating profit
margin (EBIT) in
each business
area over the cycle

Execution capabilities in place
and profitability improving
Building on tremendous strengths
Transforming from equipment company
to a company that will shape the cargo
handling industry
Investing to ensure a leading position
Shaping our portfolio to drive growth and
shareholder value
Well positioned to become the leader in intelligent cargo handling

Operating profit excl. restructuring costs development
Maaliskuu 2017 58
0,0 %
1,0 %
2,0 %
3,0 %
4,0 %
5,0 %
6,0 %
7,0 %
8,0 %
9,0 %
0
20
40
60
80
100
120
140
160
2013 2014 2015 2016
Kalmar
EBIT excl. restructuring costs EBIT-%
0,0 %
2,0 %
4,0 %
6,0 %
8,0 %
10,0 %
12,0 %
14,0 %
16,0 %
0
20
40
60
80
100
120
140
160
2013 2014 2015 2016
Hiab
EBIT excl. restructuring costs EBIT-%
0,0 %
1,0 %
2,0 %
3,0 %
4,0 %
5,0 %
6,0 %
7,0 %
8,0 %
9,0 %
0
10
20
30
40
50
60
70
2013 2014 2015 2016
MacGregor
EBIT excl. restructuring costs EBIT-%
Sijoittajaesitys

Sustainability
Maaliskuu 2017 Sijoittajaesitys 59

We serve an industry, which
produces the majority of emissions
as well as GDP in the world - Inefficient industry with potential to improve
Our vision to be the leader in
intelligent cargo handling also
drives sustainability - Increasing efficiency and life-time solutions
We are in a position to be the global
frontrunner, setting the sustainability
standards for the whole industry - We are ready to shape the industry to one that is more sustainable
Sustainability is a great business opportunity

Sea Freight Transport is by far the most sustainable transport mode in terms of emissions
by trains, sea freight emits
~2-3 times less emissions
Maaliskuu 2017 Sijoittajaesitys 61
by trucks, sea freight emits
~3-4 times less emissions
by air cargo, sea freight emits
~14 times less emissions
Compared to transportation of goods

Cargotec is a supporter of UN Global Compact and other
major international sustainability initiatives
We set the industrial standard in compliant and transparent
operations
We have a clear governance on sustainability issues with
Board overview on the subject
Safety is our key priority and we have clear improvement
program to further decrease our current IIFR rate of 5,76
Certification coverage of production sites:
– ISO14001 92%
– OHSAS18001 80%
– ISO9001 94%
Cargotec will set the standard for sustainability

Industry is directing to more-environmentally
sound solutions where Cargotec offering
provides a huge growth potential
– Automation and digitalized offering enable the
more efficient cargo handling chain, including fuel
inefficiency
Service growth potential supports the way
towards circular economy
– Case: most of the world´s terminals are equipped
with diesel-driven RTGs offering a huge potential
to Kalmar RTG electrification service
Leadership in eco-sound products is especially
evident in Kalmar, where the sales of hybrid and
electric products have increased very strongly
during the past 5 years
Maaliskuu 2017 Sijoittajaesitys 63
Our strategy drives sustainability

Kalmar appendix
Maaliskuu 2017 Sijoittajaesitys 64

Global container throughput and GDP Change % y/y
Maaliskuu 2017 65
Global container throughput development Growth stabilising in the short-mid term
Sources: Drewry Q4 2016
Drewry Q3 2016 (2018-2020)
IMF October 2016
Sijoittajaesitys
-10%
-8%
-6%
-4%
-2%
0%
2%
4%
6%
8%
10%
12%
14%
16%
18%
2002 2003 2004 2005 2006 2007 2008 2009 2010 2011 2012 2013 2014 2015 e2016 f2017 f2018 f2019 f2020
GDP change Container throughput change

24 Global Terminal Operators’ total forecasted
capacity increase 2015-2020 is 125 Mteu,
increasing 3,1% p.a to 892 Mteu by 2020
Terminal operators consolidating, recent M&A
activity:
COSCO and China Shipping merged
APMT bought Group TCB
CMA CGM bought APL
Yildrim bought Portugese Tertir group and
the company is also eyeing Ports America
Maaliskuu 2017 66
Consolidation leading to five dominant container terminal operators in 2020
APMT/ TCB
Merger
Capacity, MTEU
Source: Drewry
* Capacity counted once in all terminals where shareholding held by both sub operators
0 20 40 60 80 100 120 140
COSCOCS *APM Terminals / Grup TCB *
PSA InternationalHutchison Port Holdings
DP WorldTerminal Investment Limited (TIL)
CMA CGM / APL *China Merchants Port Holdings…
EurogateSSA Marine / Carrix
ICTSIHanjin
EvergreenNYK
BolloreOOCL
Yildirim/YilportMOL
Yang MingHyundai
K Line
2020 2018 2016
Sijoittajaesitys

Global container throughput and capacity development
Maaliskuu 2017 67
0%
10%
20%
30%
40%
50%
60%
70%
80%
90%
100%
0
200
400
600
800
1000
1200
1400
2002 2003 2004 2005 2006 2007 2008 2009 2010 2011 2012 2013 2014 2015 e2016 f2017 f2018 f2019 f2020
Throughput Capacity Utilisation rate
MTEU
Source: Drewry Container terminal operator annual review, 2002-2016
Sijoittajaesitys

Three alliances represent about 80% of global container fleet capacity
Maaliskuu 2017 68
*HMM’s membership in 2M alliance isn’t yet confirmed
The arrows indicate changes through M&A over the last 12 months. China Shipping and Cosco=Cosco container lines
Shipping line Alliance/ Vessel sharing agreement (VSA)
Maersk
P3 (denied) 2M 2M
MSC
CMA CGM
Ocean Three
Ocean Alliance
China Shipping China Shipping/ UASC
UASC
NYK
Grand Alliance
G6 Alliance
OOCL
Hapag-Lloyd
APL
New World Alliance MOL
Hyundai*
Cosco
CKYH Alliance CKYH Alliance
The Alliance
(in preparation)
K Line
Yang Ming
Hanjin
Evergreen Independent
Total: 16 6 4 3
2017
Sijoittajaesitys

According to DS Research, the project pipeline of all upcoming container terminal projects consists of 405 TEUm additional capacity
scheduled for completion until 2021. 298 TEUm new capacity is expected to be finally executed until 2021, assuming that further project
postponements are required to adjust to the weakening demand. This would trigger roughly US$bn 146 investment.
Depending on the type of project, different cost have been assumed for quay construction, container handling equipment, yard
construction, dredging & land reclamation and other cost. Overall, DS Research has estimated that investments for container terminal
projects 2016‐’21 include about US$bn 37 for container handling equipment.
Maaliskuu 2017 69
DS Research: 298 Mteu new capacity to be added 2016-2021 which could trigger US$bn 37 investments for container handling equipment
Sijoittajaesitys

• The largest containership in the fleet has nearly
tripled since 2000
• The average size of new builds doubles between
2009 and 2014
Maaliskuu 2017 70
Ship sizes increasing dramatically
Average newbuilding
delivered in year
Largest container ship
in world fleet
Source: Drewry November 2015
Sijoittajaesitys
TEU

Kalmar has strong position in attractive segments
Maaliskuu 2017 Sijoittajaesitys 71
Market position Trend Market size
Automation & Projects #1-2
EUR 7.5 billion
Mobile equipment #1
Bromma #1
Navis #1
Services #1 EUR 7.6 billion

Kalmarin liikevoiton parannuspotentiaali 2016–2018
Maaliskuu 2017 Sijoittajaesitys 72
2015 2016 2017 2018
Automaatio
Ohjelmisto
Mobiililaitteet
Huoltoliiketoimint
a
Projektien tuotantokapasiteetin kehitys
Rainbow Cargotec Industries (Kiina) -yhteisyrityksen valikoiman laajennus
Integroitujen satama-automaatioratkaisujen lisäkehitys
Ohjelmistoliiketoiminnan laajennus
Design-to-Cost-ajattelun ja hankinnan jatkuvaa parantamista
Jakeluverkoston vahvistaminen
Varaosissa menestyminen
Yhteensä
60–100
MEUR parannuspotenti
aalia
+20–30
MEUR
+10–20
MEUR
+20–30
MEUR
+10–20
MEUR

Kalmarin toimintaympäristö
Maaliskuu 2017 Sijoittajaesitys 73
Tarjoaa integroituja satama-
automaatioratkaisuja, kuten
ohjelmistoja, huoltoliiketoimintaa ja
laajan valikoiman
lastinkäsittelylaitteistoja
Terminaalin toiminnanohjausjärjestelmä
koordinoi ja optimoi
konttien ja laitteiden
liikuttamisen suunnittelun ja hallinnan
monimutkaisissa
liiketoimintaympäristöissä.
Navis tarjoaa myös merikuljetusalan
laivaliikenneratkaisuja:
Ahtaussuunnittelua
Alusten valvontaa
Lastaustietokoneita
Reitin suunnittelua
Laituri
Horisontaalinen
kuljetus
Piha
Vaihto
alue
Alan johtava konttitarttujien
valmistaja
Yhteistoiminta-alusta
valtamerirahtaajien,
terminaalien ja niiden
laivauskumppanien
välillä.

Solid foundation for further
improvement
• Win in automation
• Grow in software
• Sustain global leadership in
mobile equipment
• Digital services and spare parts
excellence
Kalmar’s focus on profitable growth
Target:
10% operating profit
margin (EBIT)
over the cycle

Hiab appendix
Maaliskuu 2017 Sijoittajaesitys 75

IHS predicts global truck volumes to increase in 2017 and 2018, driven by China and South Asia and a recovery in US
sales, but forecasting a lower growth in Europe during 2017
Truck registrations, GVW >15t
Maaliskuu 2017 76
Global truck volumes
YoY %-changes
2015 2016 2017 2018 2019 2020
Europe -3,7% 3,4% 1,8% 7,2% 8,9% 6,4%
North America 11,6% -15,8% 2,9% 5,0% 7,3% 4,1%
South America -41,4% -25,4% 11,5% 13,1% 11,4% 5,5%
South Asia 29,4% 17,6% 6,3% 6,0% 3,2% 2,2%
Japan/Korea 6,1% -0,6% -1,2% -3,7% 1,5% -2,8%
Middle East/Africa -3,7% -3,9% -0,2% 5,6% 3,1% 6,7%
Greater China -26,5% 11,4% 1,3% 7,3% -2,3% -1,0%
Total -10,2% 3,5% 3,0% 6,5% 2,5% 1,8%
Source: IHS Truck registration (December 2016)
Sijoittajaesitys
-1% -13%
51%
1% -13%
7% 2% -10%
3% 3% 6% 2%
-40%
-20%
0%
20%
40%
60%
0
500 000
1 000 000
1 500 000
2 000 000
2007 2008 2009 2010 2011 2012 2013 2014 2015 2016 2017 2018 2019
Europe North America South America South Asia Japan/Korea Middle East/Africa Greater China YoY Change YoY Change (excl CN)

Annual Construction Output
Maaliskuu 2017 77
Construction output forecast
YoY %-changes
2015 2016 2017 2018 2019 2020
NAM 3,2% 3,2% 4,8% 5,8% 5,2% 4,0%
SAM -1,9% -1,2% 1,9% 2,4% 2,9% 3,2%
NE -2,3% -2,3% -0,1% 1,5% 1,5% 1,6%
CE 1,3% 1,8% 2,0% 1,8% 1,7% 1,5%
WE 1,8% 1,5% 1,3% 1,9% 2,3% 3,0%
APAC 4,5% 5,0% 4,3% 4,1% 4,2% 4,2%
Total 2,6% 3,0% 3,4% 3,8% 3,8% 3,6%
Source: Oxford Economics construction output December 2016 (All Output series are measured in Billions, 2010 Prices)
Sijoittajaesitys
-1%
-4%
2%
3% 3%
3% 3% 3%
3% 4% 4% 4% 4%
-5%
-4%
-3%
-2%
-1%
0%
1%
2%
3%
4%
5%
0,0
500,0
1 000,0
1 500,0
2 000,0
2 500,0
3 000,0
3 500,0
2 007 2 008 2 009 2 010 2 011 2 012 2 013 2 014 2 015 2 016 2 017 2 018 2 019 2 020
NAM SAM NE CE WE APAC Total YoY change

Hiab has strong positions in attractive markets
Maaliskuu 2017 Sijoittajaesitys 78
Market size (€B) Growth Hiab position & trend
Loader cranes 1.3 GDP
Tail lifts 0.5 GDP+
Demountables 0.4 GDP
Truck-mounted forklifts 0.2 GDP+
Forestry cranes 0.2 GDP
#2
#1
#1
#1
#2

E2E value chain – optimise
our distribution network and supply
chain
Product innovation – strengthening
our market positions
Digitalisation – all new products
connected by 2018
Services – further expand our
offering
Hiab’s investments for profitable growth
Target:
10% operating profit
margin (EBIT)
over the cycle

MacGregor appendix
Maaliskuu 2017 Sijoittajaesitys 80

World fleet: supply-demand balance
Maaliskuu 2017 81
Source: Clarksons September 2016
Sijoittajaesitys

Vessel upsizing trend
continues:
Upsizing trends are expected
to continue, with the average
size of ships delivered in
2016-28 projected to reach
c.37,500 GT, compared to
the average size of units in
the current fleet of c. 23,000
GT.
Maaliskuu 2017 82
Merchant ships: Contracting forecast by shiptype (number of ships) Merchant ship types > 2000 gt, base case
Source: Clarksons September 2016
Sijoittajaesitys

Deliveries 2017 and onwards
decrease due to the
extremely low contracting
levels 2015-2016, and will
remain at historically lower
levels due to the continued
lower contracting in no of
ships.
Maaliskuu 2017 83
Merchant ships: Deliveries forecast by shiptype (number of ships) Merchant ship types > 2000 gt, base case
Source: Clarksons September 2016
Sijoittajaesitys

Historical offshore CAPEX
Maaliskuu 2017 84
Source: Clarksons September 2016
Sijoittajaesitys
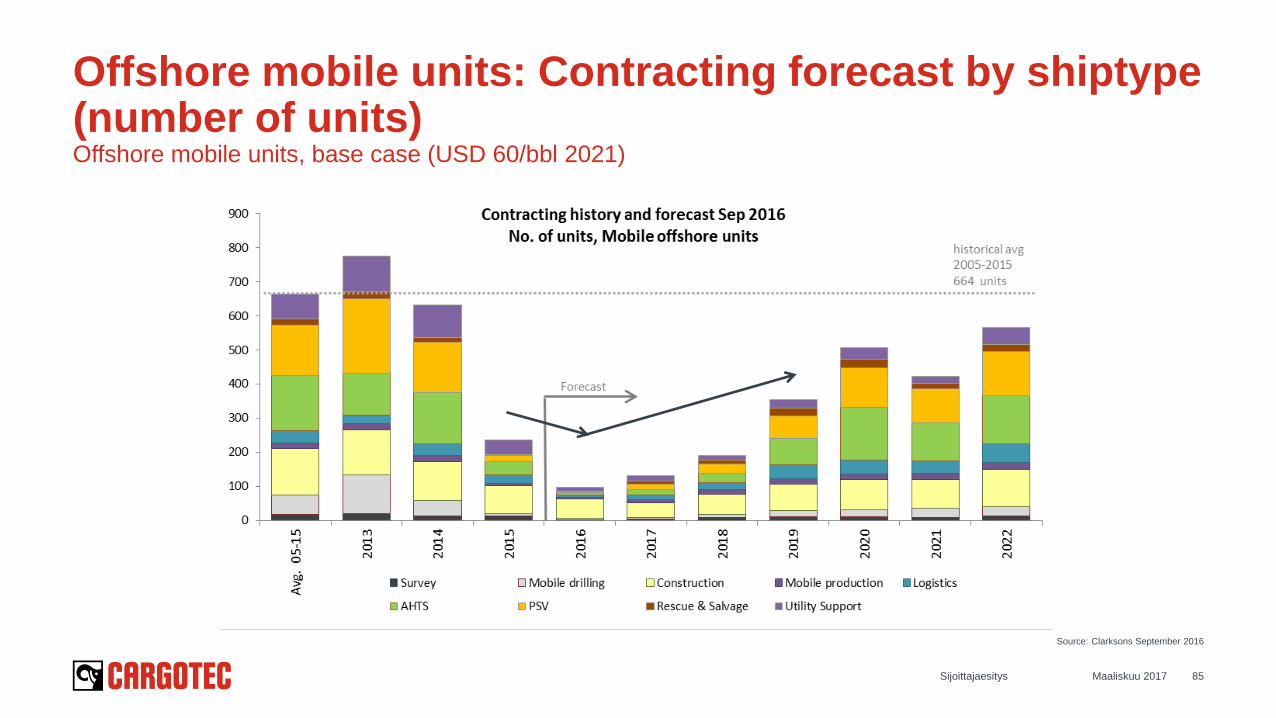
Offshore mobile units: Contracting forecast by shiptype (number of units) Offshore mobile units, base case (USD 60/bbl 2021)
Maaliskuu 2017 85
Source: Clarksons September 2016
Sijoittajaesitys

Offshore mobile units: Deliveries Forecast by Shiptype (number of units) Offshore mobile units, base case (USD 60/bbl 2021)
Maaliskuu 2017 86
Source: Clarksons September 2016
Sijoittajaesitys

Shipbuilding – Contracting (ships >2000 gt/dwt)
Maaliskuu 2017 87
Source: Clarksons March 2017
Sijoittajaesitys

Since peak shipyard output
in 2010 (in CGT terms), it is
estimated that the global
shipbuilding capacity has
declined 22%.
Significant downward revision
in the contracting forecast
suggests that there will be
further pressure on yards,
and the capacity is projected
to decline by another 20%
by end of 2020.
Maaliskuu 2017 88
Shipbuilding capacity and utilisation scenario
Source: Clarksons September 2016
Sijoittajaesitys