Cargills (Ceylon) PLC Annual Report 2015/16 Report 2015/16. Vision ... Cargills (Ceylon) PLC -...
160
Cargills (Ceylon) PLC Annual Report 2015/16
-
Upload
truongkhue -
Category
Documents
-
view
373 -
download
15
Transcript of Cargills (Ceylon) PLC Annual Report 2015/16 Report 2015/16. Vision ... Cargills (Ceylon) PLC -...

Cargills (Ceylon) PLCAnnual Report 2015/16

VisionTo be a global corporate role model in community – friendly national development.
MissionServe the rural community, our customers and all other stakeholders, through our core business – food with love – and other related businesses, based on the three main principles of
• reducing the cost of living
• enhancing youth skills
• bridging regional disparity
by enhancing local and global markets.
ContentsAbout this report 04
Our Progress 05
Financial Highlights 06
Our Businesses 08
Chairman’s Review 18
Profile of Directors 24
Management Discussion and Analysis 28
Corporate Governance 40
Audit Committee Report 47
Remuneration Committee Report 48
Related Party Transactions Review Committee Report 49
Risk Management 50
Sustainability Report 60
Financial Report
Annual Report of the Directors’ on the
Affairs of the Company 79
Statement of Directors’ Responsibilities 82
Independent Auditors’ Report 83
Statement of Profit or Loss and
Other Comprehensive Income 84
Statement of Financial Position 85
Statement of Changes in Equity 86
Statement of Cash Flow 88
Notes to the Financial Statements 90
Statement of Value Added 146
Five Year Financial Summary 147
Group Real Estate Portfolio 148
Investor Relations Supplement 149
Notice of Annual General Meeting 151
Notes 153
Proxy Form 155
Corporate Information Inner Back Cover
Cargills comprehends that every link matters in strengthening and solidifying its chain of operations from farming and production to ensuring distribution is more efficient and that its products and services are widely accessible across the island.
By aligning your Company's reporting methodology with the GRI system to achieve the 'In Accordance Core' standard, Cargills embodies a greater role of responsibility in terms of environmental, social and economic focus now more than ever.
With a steadfast team, a strong leadership and a vision that takes in to account our responsibility towards society, environment and the nation at large, we have taken progressive steps on the right path to achieving greater sustainability, success and solidarity.
Socially conscious...Environmentally entrenched... Culturally focused.

Pg. 02Cargills (Ceylon) PLC - Annual Report 2015/16
We build strong alliances with each farmer we work with to elevate the agriculture value chain pioneered by Cargills to the next level.

& 03Pg. 02

Pg. 04Cargills (Ceylon) PLC - Annual Report 2015/16
Scope and Boundaries
As the first comprehensive integrated report of Cargills (Ceylon) PLC this report covered the operations of Cargills (Ceylon) PLC and its subsidiaries as listed in the inner back cover of the compilation for the period from 1st April 2015 to 31st March 2016 which is the Group’s annual reporting cycle. The date of the previous report was 31st March 2015.
Reporting Standards
The financial statements have been prepared and presented in accordance with Sri Lanka Accounting Standards (SLFRS and LKAS) laid down by the Institute of Chartered Accountants of Sri Lanka in compliance with the requirements of the Companies Act No. 07 of 2007 and the Listing Rules of the Colombo Stock Exchange and have been audited by M/s KPMG.
The report also adheres with the requirements of the Code of Best Practice on Corporate Governance issued jointly by the Chartered Accountants of Sri Lanka and the Securities and Exchange Commission of Sri Lanka.
For sustainability reporting we have adopted the Global Reporting Initiative GRI (G4) and contains Standard Disclosures from the GRI Sustainability Reporting Guidelines exceeding the “In Accordance Core Criteria”.
Reporting Approach and Changes
We are of the view that the process of integrated reporting is a course of continuous improvement and hence is a journey that requires commitment from across tiers. This year Cargills has taken several steps in the right direction to encompass a more balanced insight into the Group’s performance and prospects in relation to all material aspects
About this report
covering financial, social, environmental and governance pillars of reporting as per the G4 standards.
There are no restatements of information provided in previous reports. The changes to the report include the following:
• Coverage of material aspects as prescribed by the G4 guidelines of the Global Reporting Initiative (G4) covering the following:
a) General Standard Disclosures required for Core In Accordance standard
b) Specific Standard Disclosures
i. Economic Performance (G4-EC1, G4-EC8, G4-EC9)
ii. Environmental Performance (G4-EN3, G4-EN8, G4-EN11, G4,EN15,G4-EN22)
iii. Social Performance (G4-LA1, G4-LA6, G4-LA9, G4-LA11, G4-LA14, G4-SO1, G4-SO2, G4-PR3)
• Concise and graphical presentation of integrating details of our key lines of business and materiality aspects wherever suitable
• Focus on the interconnectivity of information for easy grasp of information
Data Measurement Techniques and Bases of Calculations Including Assumptions
Data on Economic performance is prepared from Group audited accounts, Data on Environmental and Safety Issues have been compiled from actual operating data maintained by the various businesses, factories and units of the Group. Data on Social Responsibility was obtained on-site.
Materiality
Based on the high priority placed on ‘materiality’ as per the GRI-4 guidelines Cargills uses stakeholder mapping and materiality matrix systems to zero-in on the material aspects for each stakeholder group. Accordingly the process of stakeholder identification and management along with the materiality test is elaborated in this report. In this our first report Cargills endeavours to ensure that the business strategy and the needs of our stakeholders are tracked and the alignment is verified. We have also made a clear and quantifiable disclosure on all material aspects identified in the scope of this report in correspondence with exceeding the ‘In Accordance Core’ standard of G4.
Information, Comments and Feedback
We welcome your comments, suggestions and queries regarding this Report.
To provide feedback please contactGroup Chief Financial OfficerCargills (Ceylon) PLCNo. 40, York Street,Colombo 1.
Email: [email protected]

& 05Pg. 04
In 1844, William Miller and David Sime Cargill commenced a general warehouse, import and wholesale business in Colombo, Fort. The establishment was named the ‘House of Cargills’. A successful bid by Sir Chittampalam A. Gardiner saw the House of Cargills being incorporated as a Public Limited Liability Company on 1 March 1946.
In 1981 Ceylon Theatres acquired controlling interest of the Company and Mr. Albert A. Page was appointed the Managing Director. Mr. Albert Page went on to become the Chairman of Cargills on 26 November 1982.
Under the new management, Cargills explored the potential of innovating on its trading legacy. As a result, in 1983 Cargills established the first supermarket chain in Sri Lanka with the opening of its first outlet at Staple Street.
Cargills ventured into the production of processed meats in 1993 when the Company invested in its first manufacturing facility Cargills Quality Foods, in Mattakkuliya. In 1996 Cargills acquired the franchise license for KFC and innovated on its secret recipe to deliver products that suited the local palate.
Cargills began sourcing fruits and vegetables directly from farmers in 1999 when it established its first collection centre in Hanguranketha. In 2002 it invested in a dairy processing plant and thereby expanded its outgrower network to include dairy farmers. Cargills Magic ice cream was the outcome of this endeavor. In the same year Cargills diversified into agri-processing with Cargills Kist which created further market opportunities for farmers.
In 2008 Cargills acquired Millers Limited consolidating its marketing and distribution operation.
In 2010 Cargills undertook an aggressive expansion plan in the FMCG sector to ride the growth potential of a growing economy. During that year the Company expanded its interests in the dairy sector by acquiring Kotmale Holdings PLC and entered another growing category with the acquisition of Diana Biscuits now marketed under the Kist brand.
In 2011, the Company secured a provisional commercial banking license from the Central Bank of Sri Lanka.
In 2013, Cargills acquired the franchise license for TGIF and opened its first restaurant at Fort in October 2013.
Our Progress

Pg. 06Cargills (Ceylon) PLC - Annual Report 2015/16
Financial Highlights
Group Revenue
Rs.71,442Mn
Group Operating Profit
Rs.3,463Mn
Group Company
2016 2015 Change 2016 2015 Change
Rs.000 Rs.000 % Rs.000 Rs.000 %
Operations
Continuing Operations
Revenue 71,441,850 61,631,285 15.92 33,623 153,075 (78.03)
Profit from operations 3,463,013 1,571,788 120.32 1,011,476 538,171 87.95
Profit before taxation 2,886,008 804,653 258.66 879,017 144,274 509.27
Profit after taxation 1,690,581 247,217 583.84 779,182 72,343 977.07
Discontinuing Operations
Profit from discontinued operation, net of tax - 352,761 - - - -
Financial Position
Non-current assets 27,279,866 24,553,989 11.10 12,524,469 10,647,275 17.63
Current assets 14,931,269 12,864,433 16.07 2,199,256 3,653,914 (39.81)
Current liabilities 23,755,857 20,646,945 15.06 4,907,861 4,800,458 2.24
Non - current liabilities 3,950,460 3,892,330 1.49 411,094 367,282 11.93
Capital and reserves, Minority Interest
and other equity 14,504,818 12,879,147 12.62 9,404,770 9,133,449 2.97
Per share data (Rs.)
Earnings per share 7.25 2.57 181.85 3.48 0.32 977.07
Dividends per share 3.50 2.00 75.00 3.50 2.00 75.00
Net assets per share 63.04 55.99 12.59 41.99 40.77 2.97
Market assets per share 193.50 137.00 41.24 193.50 137.00 41.24
Cash Flow
Net cash generated from/ (used in)
- Operating activities 5,334,187 506,905 1,244,685 8,069,794
- Investing activities (3,418,140) 2,889,824 (892,307) 1,639,216
- Financing activities (694,501) (4,147,052) 674,288 (11,013,583)

& 07Pg. 06
Rs.1,691Mn
Group Profit After TaxGroup Profit Before Tax
Rs.2,886Mn
Revenue - Company
0
10
20
30
40
50
Rs. Bn
13 14 15 1612
Total assets - Company
0
10
20
30
40
50
Rs. Bn
13 14 15 1612
Profit after taxation - Company
0
500
1,000
1,500
2,000
2,500
Rs. Mn
13 14 15 1612
Profit before taxation - Company
0
500
1,000
1,500
2,000
2,500
Rs. Mn
13 14 15 1612
Total assets - Group
0
10
20
30
40
50
Rs. Bn
1513 14 1612
Profit after taxation - Group
0
500
1,000
1,500
2,000
Rs. Mn
1513 14 1612
Profit before taxation - Group
0
750
1,500
2,250
3,000
Rs. Mn
1513 14 1612
Revenue - Group
0
20
40
60
80
Rs. Bn
13 14 15 1612

Pg. 08Cargills (Ceylon) PLC - Annual Report 2015/16
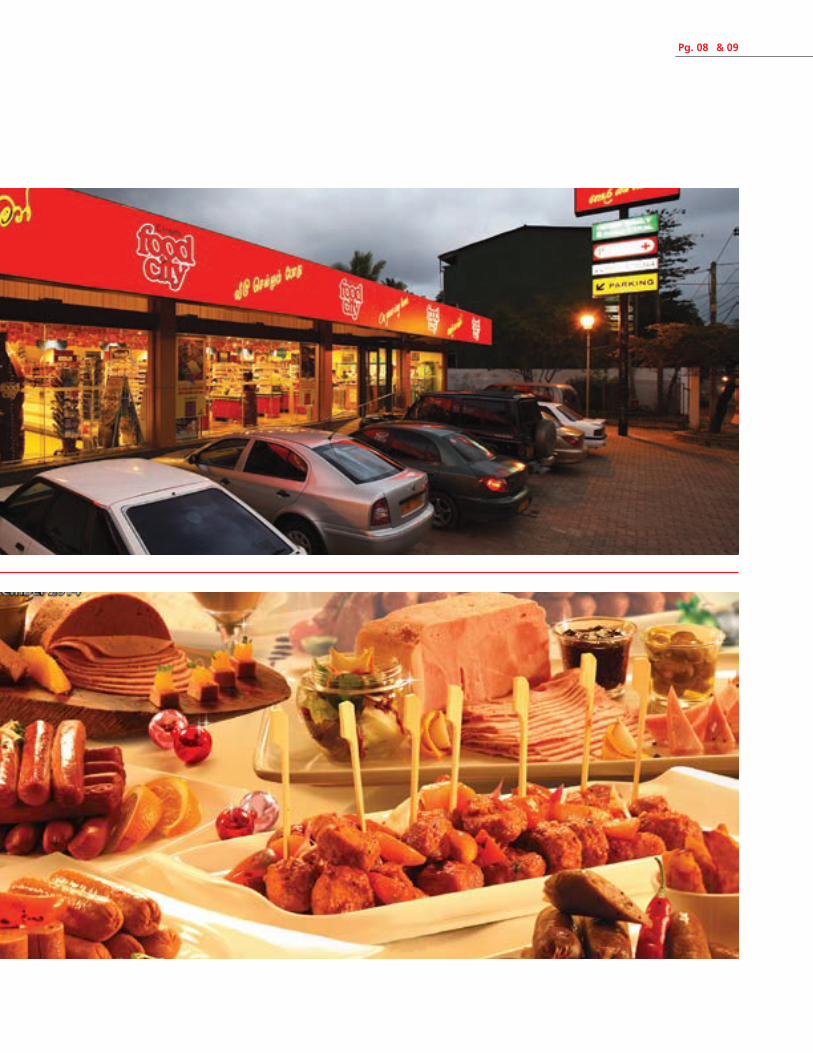
Our Businesses
RetailCargills Food City is Sri Lanka’s largest modern retailer. Its pioneer venture into modern trade in 1983 was an innovation of the company’s trading legacy.
Thereafter Cargills Food City continued to challenge the norm by taking to the masses what was traditionally an affluent focused business and offering ‘higher value for the lowest price’.
Today the Cargills retail operation is spread across the island in two formats as ‘Cargills Food City’ supermarkets and ‘Cargills Food City Express’ convenience stores. Cargills Food City has been rated the 10th most valuable brand in Sri Lanka as per the Brand Finance Index ratings of 2016 with a AA+ rating and is the only Retailer ranked in the top ten of national brands.
Cargills Foodcity footprint has reached 297 stores covering all 24 districts of Sri Lanka.
Processed MeatsCargill’s entered into food manufacturing through the acquisition of the ‘Goldi’ meats facility in 1993. Today the range consists of ‘Goldi’ and ‘Sams’ catering to mass market demand and the ‘Finest’ premium deli range. Cargills is rapidly gaining market share in this category through its product innovation, quality and unique taste. Cargills Quality Foods has secured the ISO 9001: 2000 Quality Management System certification, ISO 22000: 2005 Food Safety Management System certification and ISO 14001: 2004 Environment Management System certification. The company has also engaged international expertise to develop new and innovative products which offer a novel variety of taste whilst catering to the nutritional needs of the consumer. In 2014 ‘Goldi’ secured the certification for the SLS standard.
& 09Pg. 08

Pg. 10Cargills (Ceylon) PLC - Annual Report 2015/16
Kotmale is Sri Lanka’s most widely consumed dairy brand renowned for its quality and freshness. The Brand is synonymous with locally produced milk and cheese and has won mass appeal for its delicious range of dairy ice cream, UHT and pasteurized milk, yoghurt and yoghurt drinks. Established in 1967 as Lambretta (Ceylon) Ltd, its beginnings are traced back to the cool surroundings of Bogahawatte, Patana (Upper Kotmale). Kotmale Holdings PLC was acquired by the Cargills Group in 2010.
DairyMagic is the leading dairy ice cream in Sri Lanka having commenced operations in 2002 after the acquisition of an international ice cream facility. Cargills Quality Dairies which produces Magic ice cream and UHT and yoghurt products for its sister brand ‘Kotmale’ is the only dairy product manufacturing company in Sri Lanka to be accredited with all three ISO certifications; ISO 9001: 2000 Quality Management System certification, ISO 22000: 2005 Food Safety Management System certification and ISO 14001: 2004 Environment Management System certification. Cargills Magic was the first to introduce fresh fruits and local flavours to its portfolio of ice creams creating a new trend in the overall ice cream industry. Through its innovation driven focus Magic has expanded its market share exponentially and is now the fastest growing ice cream brand in Sri Lanka. The ‘Heavenly’ range is the premium segment of the Magic offering.
Our Businesses contd.

& 11Pg. 10

Pg. 12Cargills (Ceylon) PLC - Annual Report 2015/16
AgrifoodsKist is one of the most trusted brand names in Sri Lanka which entered into the Cargills fold in 2003 through the acquisition of an international processing facility. The brand is known by generations for its true Sri Lankan flavours and high standards of quality. Kist which is traditionally renowned for its delectable selection of jams, sauces and cordials has expanded its 100% fruit based product range introducing fruit based nectars and fresh juices to the market. Today the nutritious and delicious Kist nectar range has revolutionised the industry and is popular for its genuine fruity taste. The Brand has made further extensions.
ConfectioneryOriginally a regional biscuit facility, the company was acquired in 2010 and renamed Cargills Quality Confectionaries (Private) Limited. The Company is engaged in the manufacturing, distribution and marketing of biscuits and confectionaries under the Brand name ‘Kist’. The factory located at the Nalanda Industrial Estate in Matale presently manufactures soft & hard dough biscuits & wafers.
Our Businesses contd.

& 13Pg. 12

Pg. 14Cargills (Ceylon) PLC - Annual Report 2015/16
RestaurantsCargills secured the KFC franchise in 1996 and today KFC Sri Lanka is the largest and most popular international restaurant chain in the country with 27 outlets islanwide. The success of KFC was in the fusion of an international brand with well - loved Sri Lankan recipes. The locally inspired additions to the KFC menu have now been included into the regional product portfolio.
Cargills secured the ‘TGI Fridays’ franchise for Sri Lanka in 2012 and opened its flagship Restaurant in October 2013. TGI Fridays is a globally celebrated entertainment cum dining trend that has stormed the leisure circuit of 60 countries worldwide..
Located at one of the oldest buildings in Fort, the 191 seat Restaurant stylishly refurbished by Cargills, brims with old-world architectural charm with a very contemporary finish adding much energy and colour to the already transformed adjacent Dutch Hospital Precinct.
Marketing and DistributionThe Company’s marketing and distribution arm Millers is one of the oldest distribution and logistics operations in the country geared with a network spread across the 25 districts of Sri Lanka. Millers is the island wide distributor for international brands such as Kodak, Kraft, Cadbury, Bonlac, Nabisco, Tang, Toblerone, Meadowlea, Belle, Alpelle etc., and is also the mass market distributor for its own brands Classic Mackerel and Milca Cheese.
Our Businesses contd.

& 15Pg. 14

Pg. 16Cargills (Ceylon) PLC - Annual Report 2015/16
Cargills believes the role of women is critically important to developing the full potential of Sri Lanka’s agriculture and food security.

& 17Pg. 16

Pg. 18Cargills (Ceylon) PLC - Annual Report 2015/16
Chairman’s Review
“The strong focus on the ultimate potential of our Group and reinforcement of our ethos of reaching out to the needs of consumers and partners across Sri Lanka kept all businesses on course.“
Dear Shareholder, I am pleased to present to you on behalf of the Board of Directors of Cargills (Ceylon) PLC the Annual Report and Audited Financial Statements for the year ended 31st March 2016.
Reporting Standards
This year’s Report has been prepared in conformance with the Global Reporting Initiative G4 standard. G4 aligns with other reporting standards including the OECD Guidelines for Multinational Enterprises, the United Nations Global Compact Principles, and the UN Guiding Principles on Business and Human Rights. I am confident that this first step in the right direction would provide you with a greater insight into the many nuances of our diverse Group of Companies that are grounded on the principles of creating sustainable value for our many direct and indirect stakeholders spread across Sri Lanka and beyond.
Economic Overview
While the developments in the global economy present mixed opportunities to the island the overall pressure from the global economic situation is relatively of lesser concern to the economy which is grappling with low growth, high levels of debt, a yawning budget deficit and balance of payment deficit.
Against this back drop the Sri Lankan consumer environment took a turn for the positive in the year concluded buoyed by the changes evident in the policy environment. While consistency in policy was a cause for initial concern the overall thrust towards an enabling business environment that encourages and endorses private sector led growth is a boost to business. The long term development policy of the government is still being detailed out but the broad push towards a more organised, structured and sustainable economy augurs well for the future.
Management Focus
The resilience of Cargills was tested thoroughly in previous financial years to such an extent that the very fundamentals that drove our success were challenged. However the Management’s realignment with our core strengths; the entrepreneurship vision focused on regional community development as the conduit of growth and the constant quest to exceed consumer expectation through innovation of businesses, processes, products and services, saw the Group reinvigorated in 2015/16. The strong focus on the ultimate potential of our Group and reinforcement of our ethos of reaching out to the needs of consumers and partners across Sri Lanka kept all businesses on course. Our unique style of social-centric enterprise that is the true character of Cargills is now being embodied into new systems and processes.
Retail
Sri Lanka’s modern retail industry is still at a nascent stage compared to the developments in the Asia Pacific markets. However the industry is also at a juncture wherein consumers are waiting for the Industry to take the initiative in setting new standards. The clear upward movement of consumers in terms of income and lifestyle is evident in the push towards health and nutrition, and the role that can be played by modern retail integrated with local agriculture is tremendous.

& 19Pg. 18
“As the pioneer of market-oriented demand-driven agriculture value-chain in Sri Lanka, Cargills Food City would now be establishing stronger alliances with rural communities to take the stage of primary value-addition to the source. “
Cargills is already well positioned to drive this advantage and would be looking to enhance its fresh offering at an elevated standard wherein the offering resonates with the improvement in lifestyle for consumers. As the pioneer of market-oriented demand-driven agriculture value-chain in Sri Lanka, Cargills Food City would now be establishing stronger alliances with rural communities to take the stage of primary value-addition to the source. Already this has been initiated with the field-level collection and sorting coupled with the primary processing facility in Kilinochchi. The time is now right to take this thrust to the next-level and the Company is pleased to note that its vision is well-aligned with the orientation of the agriculture policy makers.
Our store expansion plan would look to pick up pace in the coming year with a focus on enhancing the retail experience while continuing to bring the advantages of price we afford to our customers through the volumes we source and move and the efficiency built into the supply chain. Our drive to offer the modern trade experience beyond metropolitan areas continues contributing substantially to the development of the regional landscape and economies.
FMCG
The FMCG sector is enjoying substantial volume growth justifying the considerable investments made towards capacity expansions and supply chain development that has resulted in a strong portfolio of national brands now contributing 18% towards Group turnover.
The successive increases in farm gate prices of fresh milk have made local dairy farmers uncompetitive against the cheaper imported milk powder. Milk powder is an essential nutrition component in the diet of a majority of Sri Lankans and the Company appreciates the necessity to maintain lower prices in view of health and nutrition-intake concerns. However the context is counterproductive to the effective expansion of local dairy production due to the prohibitive pricing that stems from the high raw material and processing costs. Your Company is focused on driving the value-added range while developing medium to long term strategies to make fresh milk consumption affordable for the masses.
Investments are ongoing to enhance our cheese and ice cream product portfolio while strengthening the smallholder dairy farmer value chain and storage capacities of the dairy sub-sector towards building a more sustainable supply chain. A project is underway in partnership with IFAD, NaDep and the Presidential Secretariat wherein over 2,700 farmers are being developed through a range of technical inputs and equipment as well as infrastructure support. The financial support provided is a mix of loans and grants targeting small and medium sized dairy farmers and this is being channeled through Cargills Bank.

Pg. 20Cargills (Ceylon) PLC - Annual Report 2015/16
Steps taken to stabilise raw material supply and price in the processed meats businesses has been achieved through a Group procurement system put in place for the FMCG sector. We are evolving our product range in line with the emerging health concerns in Sri Lanka and would be looking to place greater emphasis on this aspect in the year ahead. Meanwhile the operational restructure that was undertaken at the meats production facility has yielded the desired efficiency and studies are now underway to review opportunities for further productivity.
Our range of Kist nectars, cordials, jams, sauces and bottled water reported a solid growth with Kist nectar and Kist sauces in particular enhancing category leadership. During the year the brand continued to strengthen its leadership with strategic enhancements made to the product portfolio. Steps have been taken to re-formulate the Nectar recipe with reduced sugar contents while the rest of the Kist range is being re-engineered to meet the increasing demand for healthier yet delicious consumption choices.
The Group’s agency-lines business is now stabilising with the Company aggressively seeking out new agency lines with a view to grow its product portfolio and thereby penetration into the trade.
The confectionaries business is on a positive trend and investments are being made in automation and capacity expansion. The management is confident of turning around the business in the new financial year through a heavy emphasis on a select positioning.
Restaurants
The Restaurants sector is on a steady upward trajectory boosted by the turnaround achieved by KFC under the new and restructured leadership. The focus on remaining true to its core recipe while repositioning the restaurants’ service and quality standards in-line with a global experience has brought KFC back to the position of leadership in the QSR industry in Sri Lanka. Employee motivation has proven to be the secret recipe behind KFC Sri Lanka’s success having been recognised as the best performing franchise in the Indian Sub-Continent in 2015. TGI Fridays, the American Franchise, is yet to turn-around but is moving in the right direction in terms of transaction growth and ticket average. In the year ahead greater emphasis would be placed on bringing the restaurant to break-even status.
Banking
Your Company’s strategic investment into Banking and Finance is making steady progress with eleven full-fledged branches now operational. In the year ahead the Bank would focus on enhancing its deposit base and lending portfolio across corporate, SME and personal-banking customers with a detailed focus synergising the strengths of Cargills and driving an innovation led approach to engaging customers. In terms of the capital structure of the Bank a rights issue was made towards meeting the Tier 1 capital requirement. Shortfalls in taking up the rights issue are to be met through the intervention of promoters both Cargills and CT Holdings as authorised by the regulator.
“The Bank would focus on enhancing its deposit base and lending portfolio across corporate, SME and personal-banking customers with a detailed focus synergising the strengths of Cargills and driving an innovation led approach to engaging customers. “
Chairman’s Review contd.

& 21Pg. 20
Cargills Square Grand Opening and Investments in Northern Sri Lanka
Cargills Square-Jaffna the first luxury family entertainment mall in Northern Sri Lanka and Cargills Bank-Jaffna, Regional Headquarters- North was ceremonially declared open by H.E. the President, Hon. Maithripala Sirisena in December 2015. The complex undoubtedly transforms the Jaffna landscape and is an icon of a new era of peace and prosperity for its people. Since 2009 Cargills has invested over Rs. 1.3 Bn in the Northern Province including the establishment of Cargills Food City outlets in Manipay, Kannathidi Road- Jaffna, Vavuniya, Nelliyadi, Chunnakkam, Mulaitivu and Kilinochchi. Cargills has also set up collection centres in Jaffna and a primary processing unit in Kilinochchi to collect agricultural produce from farmers in the area and have so far brought over 2,000 dairy and vegetable farmers into the network across the North. The Cargills regional investment drive has a direct focus on engaging local communities and improving livelihoods in economically meaningful and socially responsible ways and our investments in the North demonstrates that commitment.
“The Cargills regional investment drive has a direct focus on engaging local communities and improving livelihoods in economically meaningful and socially responsible ways and our investments in the North demonstrates that commitment. “
Cargills Sarubima
In 1999 when Cargills began to reach out directly to our partners in the farmer communities the impact we would be able to create was never envisaged. Nevertheless we pursued on a course never taken to build a business model that transformed the local fruit and vegetable supply chain to a value chain.
In the year concluded Cargills expanded the scope of Cargills Sarubima to contribute back for every kilogram and litre of fresh produce sourced from our rural communities. Accordingly to date Rs. 47.3 Mn has been collected to create value and opportunity for rural farmer-communities island wide. This year the Cargills Sarubima awards envisage doubling the number of education scholarships granted to students from agriculture communities whilst continuing to drive a culture of sustainable agriculture practices among our farmer partners.
Cargills Square-Jaffna ceremonially declared open by H.E. the President, Hon. Maithripala Sirisena in December 2015.

Pg. 22Cargills (Ceylon) PLC - Annual Report 2015/16
Responding to disaster from our hearts
The flood disaster that shook Sri Lanka post the financial year under review was certainly a cause for deep heart ache. Many of our employees were badly impacted by the disaster and fortunate to suffer only material damages. While taking immediate steps to meet the needs of our own staff, emergency response teams from across disciplines were dispatched to all flood affected areas carrying dry food items for immediate consumption. Over a period of 48 hours assistance worth in excess of Rs. 12 Mn was dispatched with the support of volunteers from across the Group. I take this opportunity to admire the courage and commitment of our employees in overcoming environmental challenges to reach those victims who needed our support the most.
Performance
In fiscal 2015/16 Cargills delivered a turnover of Rs. 71.4 Bn which is a 16 percent growth over 2014/15. Operating profit for the year end was Rs. 3.4 Bn, a 120% growth versus Rs. 1.5 Bn recorded the previous financial year. Net Profit as at 31st March 2016 was Rs. 1.7 Bn, a strong performance compared to Rs. 600 Mn Net Profit reported in 2014/15.
I am pleased to note the quarter on quarter improvement in results across all businesses and attributes the trend to a focused and disciplined management driving process and systems efficiency across business units at every level of operation. Conducive policy environment and resulting buoyancy in consumption has also contributed to this growth.
The Retail business made a strong turnaround in the latter part of the financial year. The leadership of the business is driving stringent standards on front-end and back-end deliverables covering price, service, quality and availability which continue to move the operation in the right direction. The segment operating profit was Rs. 1.7 Bn for the year on a turnover of Rs. 56.1 Bn. The FMCG Sector has continued its robust momentum with gross turnover reaching Rs. 17.6 Bn delivering a segment profit for the period ended of Rs. 1.6 Bn. The double-digit growth of the dairy and agriculture processing sub-sectors is holding the manufacturing business in good stead. Investments have been made towards enhancing capacities of several key product lines to ensure the companies remain in line with the growing consumer demand for our popular national brands. The Restaurants business is maintaining a steady upwards trend with topline reaching Rs. 2.8 Bn for the year and segment profit at Rs. 124.8 Mn.
A dividend of Rs. 1.25 per share was paid on 13th January 2016 as interim dividend and a dividend of Rs. 2.25 per share will be proposed at the forthcoming annual general meeting. Your Company continues to maintain a consistent dividend policy and expects to enhance its ROE in the forthcoming year.
“Cargills would continue to invest in value chains across the Group focused on regional community development as the building block of growth while looking to exceeded consumer and shareholder expectation.“
Chairman’s Review contd.

& 23Pg. 22
Future
In a fast evolving environment Cargills is increasingly concerned about our approach to business. Our work to advance environmental sustainability in terms of minimising our environmental footprint and working towards a more sustainable use of natural resources, support for rural economic empowerment, and offering healthier food choices for our customers are further demonstrated by our commitment to report our actions and results. We continue to look for more ways to lead and have an even greater impact on the communities that we serve. The performance of the year concluded is indicative of the future course of the Cargills Group. On the strength of the positive business environment Cargills would continue to invest in value chains across the Group, focused on regional community development as the building block of growth while looking to exceeded consumer and shareholder expectation.
Acknowledgement
In conclusion I take this opportunity to commend our employees who have grown to 8,738 across 370 locations islandwide. Their abilities and skills are reflected in our continued resilience in challenging business environments. I extend my sincere thanks to the Board of Directors whose leadership continues to steer the Company to greater heights. I thank our business partners, our principals, suppliers and financial institutions for their continued support. I also wish to acknowledge our shareholders whose support holds us in good stead to remain on course in what is set to be an iconic journey of sustainable value creation.
(Signed.)Louis PageChairman
9th June 2016

Pg. 24Cargills (Ceylon) PLC - Annual Report 2015/16
Profile of Directors
Louis Page
**Chairman
Mr. Louis R Page is a Fellow Member of the Institute of Chartered Accountants of Sri Lanka and a Fellow Member of the Chartered Institute of Management Accountants (UK). He is the Chairman of the CT Holdings Group Of Companies. He has also held a number of Board and Senior Management positions at the highest level in overseas Public Companies and Public Institutions.
Ranjit Page
Deputy Chairman/CEO
Mr. V. Ranjit Page possesses over 30 years of management experience with expertise in food retailing, food service, and manufacturing, having introduced the concept of super marketing to the Sri Lankan masses. He also serves on the boards of several other companies, and is the Managing Director of the parent company, C T Holdings PLC.
Imtiaz Abdul Wahid
Managing Director/Deputy CEO
Mr. M. Imtiaz Abdul Wahid is an Associate Member of the Institute of Chartered Accountants of Sri Lanka and a Fellow Member of the Chartered Institute of Management Accountant (UK). He has been involved in the operations of the Company in an executive capacity at different intervals progressively at higher levels (appointed Director 1997 and Deputy Managing Director in 2001) spanning a period of 28 years, leaving the services of the Company for employment abroad on two occasions in between whereby he also gained valuable exposure holding
a number of senior management positions in overseas companies. He was appointed Managing Director/ Deputy CEO in May 2010.
Sidath Kodikara
Director
Mr. Sidath V. Kodikara is the Chief Executive Officer of Cargills Foods Company (Private) Limited, the retail arm of the Group. He is a Fellow of the Institute of Hospitality, United Kingdom. He counts over 30 years of managerial experience in the hospitality and retail sector.
Prabhu Mathavan
Director
Mr. Prabhu Mathavan is an Associate Member of the Chartered Institute of Management Accountants (UK) and the Institute of Chartered Accountants of Sri Lanka. He also holds a Bachelor’s Degree in Commerce. He possesses over 20 years of experience in the fields of Finance, Auditing, Accounting and Taxation. He is currently the Managing Director / Chief Financial Officer of Cargills Bank Ltd.
Priya Edirisinghe
*Director
Mr. A. T. Priya Edirisinghe is a Fellow Member of the Institute of Chartered Accountants of Sri Lanka, Fellow Member of the Chartered Institute of Management Accountants (UK), and holds a Diploma in Commercial Arbitration. He was the Senior Partner of HLB Edirisinghe & Co., Chartered Accountants and currently serves as Consultant/Advisor. He is the Managing
Director of PE Management Consultants (Pvt) Ltd. He counts over 45 years’ experience in both public practice and in the private sector. He serves on the boards of a number of other listed and non-listed companies where in some companies he also serves as Chairman/Member of the Audit Committee and Member of the Remuneration Committee. Mr. Edirisinghe is the Chairman of the company’s Audit Committee and a member of the company’s Remuneration Committee.
Sanjeev Gardiner
*Director
Mr. Sanjeev Gardiner who has been a Director of Cargills (Ceylon) PLC since 1994 is the Chairman and Chief Executive Officer of the Gardiner Group of Companies including the Galle Face Hotel Co Limited, Galle Face Hotel 1994 (Pvt) Ltd, Ceylon Hotels Holdings (Pvt) Ltd (holding Co of Ceylon Hotels Corporation PLC) Kandy Hotels Company (1938) PLC (which owns the Queen’s and Suisse Hotels in Kandy ) and, United Hotels Co (Pvt) Limited which owns the The Surf ( Bentota), The Safari (Tissa) and The Lake – (Polonnaruwa) and Co-Chairman of Suisse Hotels Kandy (Pvt) Ltd who owns OZO Hotel in Kandy. He is also a Director of several public and private companies and counts over 25 years of management experience in a diverse array of business. He holds a Bachelor of Business Degree from the Royal Melbourne Institute of Technology, Australia and, a Bachelor of Business Degree (Banking and Finance) from Monash University, Australia. He has been a Council Member of HelpAge Sri Lanka for several years.

& 25Pg. 24
Sunil Mendis
*Director
Desamanya Sunil Mendis was formerly the Chairman of Hayleys Group, and a former Governor of the Central Bank of Sri Lanka. He possesses around 50 years of wide and varied commercial experience, most of which has been in very senior positions. Mr. Mendis is the Chairman of the Company’s Remuneration Committee and a member of the Company’s Audit Committee.
Anthony A Page
**Director
Mr. Anthony Page counts over 45 years of management experience in a diverse array of businesses. He is a Fellow Member of the Institute of Chartered Accountants of Sri Lanka and a Fellow Member of the Institute of Certified Management Accountants of Sri Lanka. He served on the Boards of the Colombo Stock Exchange and several public listed and non-listed Companies. Mr. Page also served as a Council Member of the Employers Federation of Ceylon.
Joseph Page
**Director
Mr. Joseph C. Page is the Deputy Chairman/Managing Director of C T Land Development PLC. He is also a Director of C T Properties Limited and Managing Director of Ceylon Theatres (Pvt.) Ltd. Prior to joining C T Land Development PLC, he was Executive Director of Millers Limited. He has over 30 years of management experience in the private sector.
Errol Perera
*Director
Mr. Errol A. D. Perera has held senior management positions in varying types of businesses in England, Malaysia and Sri Lanka. On his return to Sri Lanka he focused on promoting joint venture projects with foreign investment and technology transfers. He was successful in obtaining Board of Investment approvals with Pioneer Status for directory publishing, pay phones and paging projects. He was also instrumental in promoting Venture Capital and Unit Trust ‘start-ups’ in Sri Lanka with foreign collaboration. Mr. Perera was the proud winner of the GTE (now Verizon USA) Presidents International Trophy in 1990. In 1995 under his stewardship, the Directory Publishing Team won the first-ever Sri Lanka National Quality Award. He is at present an Independent Director of several other listed and non-listed companies in Sri Lanka.
* Independent Non Executive** Non Independent Non Executive

Pg. 26Cargills (Ceylon) PLC - Annual Report 2015/16
We works directly with thousands of farmers providing them knowledge and resources to help them succeed.

& 27Pg. 26

Pg. 28Cargills (Ceylon) PLC - Annual Report 2015/16
RetailIndustry
The Central Bank Annual Report 2015 reported that the value added in Wholesale and Retail trade activities grew by 4.7% in 2015 compared to a 4.5% growth in 2014. According to the Bank domestic trade activities had been supported by increases in agriculture production and manufacturing output. Private consumption expenditure (PCE) on Food and Non Alcoholic Beverages was 26.8% of total PCE with a growth of 13.6% compared to a 6.2% growth the previous year. Food inflation moving from 3.8% to 4.9% is partly attributed for this jump.
Bumper harvest in paddy and a substantial growth in vegetable production saw the agriculture sector recording a 5.5% growth this year. The Livestock sector reports an increase of 8.1% according to the Agriculture production index tracked by the Central Bank while the fisheries segment sees a decline, dropping by 2.8% from 2014. Vegetable production reached 1.87 million metric tonnes during the year registering a 2.2% growth. Meanwhile production of fruit picked
up substantially during the year with a 15.6% increase. Sri Lanka exported 33 mn kg of fruit during the year while 45 mn kg of fresh fruits were imported for consumption. Post-harvest waste in the domestic industry continues to remain at 35-40% according to the Central Bank. The fisheries industry saw a decline during the year led by a drop in inland fishing due to high-water levels in reservoirs. However shrimp farming and aquaculture continues to enjoy a steady growth. Marine fish production declined by 1.4% at 452,890 MT and as a result retail prices remained at elevated levels throughout the year. In the meantime import of canned fish increased substantially in the year by 150% to over 49,000 MT due to the reduction of the Special Commodity Levy (SCL).
Meanwhile the Nielsen Company in its Annual Review 2015 Sri Lanka reported a boom in consumerism resulting in a substantial increase in household appliance ownership and vehicle purchases. Increasing refrigerator and vehicle purchases indicates greater opportunity for cold chain products and larger shopping baskets. Nielsen also
noted a volume driven growth in Fast Moving Consumer Goods (FMCG) with an 8% volume growth recorded in the 4th quarter of 2015. An 11% growth in the premium segment of the packaged FMCG sector was seen during the year while growth on mid-tier spends was 6%.
Retail Operation Overview
The Retail operations of the Group are executed through Cargills Foods Company (Pvt) Ltd (CFC) wherein IFC holds an equity stake of 8%. The Company has a focused management structure headed by its Chief Executive Officer. The business has a dedicated operation for the sourcing of fresh produce from small holder farmers which cover 13 collection points for sourcing fruit, vegetables and seafood. The system includes two central processing units and a 24 hour distribution operation maintaining cold-chain across the value-chain. The dry goods warehouse is a separate operation while direct store deliveries are also carried out by selected suppliers. As at March 31, 2016 297 Cargills Food City outlets are operational across all 25 districts of Sri Lanka.
Management Discussion and Analysis

& 29Pg. 28
“CFC has spearheaded the transformation of Modern Retail in Sri Lanka and has led the movement of consumers towards seeking out better shopping experiences focused on quality, price reliability and food safety.”
The past year has been a period of transition for CFC wherein we made strategic investments to position the company for sustainable growth. Management took bold steps focused on improving customer service by enhancing staff welfare through increased wages, training and benefits for our teams, investing in technology and expanding into e-commerce. The management also pushed teams to hasten the pace of change coupling young blood in leadership with the trusted experience of decades of pioneering modern retail.
Accessibility, Convenience and Beyond
Cargills Food City has taken steps to establish a store in Mannar which would stamp CFC’s footprint across all 25 districts of the Country. During the year the Company also partnered with ‘Kapruka’ to open up the online channel to its loyal consumer base through a limited range of dry grocery items with scope for expansion in due course. The channel has enjoyed a good response in particular from customers based overseas looking to provide the daily needs of their loved-ones at affordable prices. CFC has also tied-up with Cargills Bank to provide customers the convenience of accessing inward remittances from any branch while also enjoying attractive discounts on their shopping.
CFC remains focused on delivering value to customers across income levels in all markets. We have seen healthy same-store-sales during the year fuelled by investments in price leadership, private brands and fresh offering.
Closer to our Customers
CFC has spearheaded the transformation of Modern Retail in Sri Lanka and has led the movement of
Revenue - Retail Sector
Rs.55,875Mn
consumers towards seeking out better shopping experiences focused on quality, price reliability and food safety. In a day and age in which technology and information has changed customer expectations, our work starts and ends with customers. From being perceived as the domain of the affluent, customers today seek out CFC to make their lives simpler and more meaningful even as they enjoy savings on their daily essentials.
Our value-for-money promise is long established and provides instant reassurance to customers that be it on fresh food, own-label or branded products, they will save more at Cargills Food City. However adapting to a customer’s evolving wants and needs is an ever increasing challenge, and CFC is investing heavily on systems and processes that make on-shelf-availability the second-nature of the business. We are also doing more with data analytics to enhance our assortment according to consumer needs by region and market. The results would be self-evident in more compelling and relevant merchandise across stores.
Moving closer to our customers also means moving closer to our front-end teams. We are focused on creating winning moments with our colleagues at our stores and exceeding their expectations through personal engagement and a value proposition designed to save them their time and our customer’s money. Our investments in motivation and training provides platforms for growth across all tiers where the growth of career prospects for our team members can be as far as they wish to take it.

Pg. 30Cargills (Ceylon) PLC - Annual Report 2015/16
Supply Chain and Logistics
During the year CFC invested in enhancing its warehousing capacities and efficiencies, complementing the efforts to ensure on-time product availability. We are partnering a reputed logistics service provider to move goods faster and in a more viable manner. The strong emphasis on back-end efficiency by the management team has seen the desired results across our supply chain and would ensure greater savings for our customers in time to come.
Freshness and Quality endorsed by our Farmers
Increasingly we see our customers shifting their shopping focus towards health and wellness. In line with this we have enhanced our focus on fresh produce to provide greater access to a wider variety of fresh produce. As we continue to improve store operations, enhancing the quality of our fresh offering is a key focus. We’re emphasizing the basics – with better processes at every step of the supply chain – from the farm to table while also expanding our assortment including organic food.
Management Discussion and Analysis contd.
Our fresh produce range is championed by our strong base of small farmers that provide consumers the most reliable benchmark of quality and freshness. Sourcing and moving 100,000 kg of fruit and vegetables within a day, CFC needs no further endorsement of freshness than its deep-rooted relationship with Sri Lankan farmers spanning more than one and a half decades.
CFC’s seafood range has gained tremendous acceptance among consumers with the segment seeing double-digit growth over the last year. We are focused on providing consumers with quality, affordable nutrition options that also harness local industries wherein seafood can play a greater role across regions and markets.
Foundation for Growth
In the year concluded the foundation was set to restructure the Group’s systems and processes with a strong focus on driving efficiency and relieving pressure on front-end teams.
Accordingly partnerships have been formed to streamline the retail logistics and warehousing operation with
expertise infused into the setup to navigate this course.
The process of readying the IT system for the next phase of growth is already underway. International experience and expertise has also been brought in to strengthen our sourcing and category management strategies with view to ensure availability, price and choice to consumers.
Meanwhile front-end operations have been strengthened with a core leadership structure that has regional retailing experience as well as the local insight. Steps taken to enhance front-end team welfare with a comprehensive package that includes the provision of two meals, accommodation, living, uniform maintenance and grooming expenses have enhanced motivation levels.
As the leader in modern retail in Sri Lanka the standards we set move well-beyond the front-end look and feel towards ensuring the sustainability of our business and the livelihoods we directly and indirectly generate through it.

& 31Pg. 30
Financial Performance
The Retail business, previously challenged by inconsistency in fiscal policy that dampened the overall consumer environment, made a strong turnaround in the latter part of the financial year. Accordingly the sector registered a turnover growth of 13.2% over last year to reach Rs 55.9 Bn as at March 31st 2016. EBIT achieved a growth of 80% at Rs 1.7 Bn reflecting the strong measures taken to enhance productivity and efficiency in the overall retail operation. The leadership of the business is driving stringent standards on front-end and back-end deliverables covering price, service, quality and availability which continue to move the operation in the right direction. The segment profit after tax was Rs 770.6 Mn compared to Rs 46 Mn in 2014/15.
Retail
2015/16Rs. Mn
2014/15Rs. Mn
Growth%
Revenue 55,875 49,351 13.2
EBIT 1,681 934 80.0
Interest 401 703 43.0
PBT 1,296 290 346.9
PAT 771 46 1,576.1
CAPEX 1,725 1,319 30.8
Sourcing and moving 100,000 kg of fruit and vegetables within a day, CFC needs no further endorsement of freshness than its deep-rooted relationship with Sri Lankan farmers spanning more than one and a half decades.
2012 2013 2014 2015 2016
Retail Segment
EBIT & RevenueRs. Bn
15
30
45
60
0
REV
ENU
E
0
500
1,000
1,500
2,000
Rs. Mn
EBIT
Revenue EBIT
2016 2015Retail 78% 80%Fast Moving Consumer Goods 18% 16%Restaurant 4% 4%
Group Revenue Mix
2016
2015

Pg. 32Cargills (Ceylon) PLC - Annual Report 2015/16
FMCGIndustry
2015/16 was another breakthrough year for the FMCG industry with volume growth contributing towards the industry growth during the year. Nielsen retail audit data indicates an 8% volume growth in the industry in particular during the latter half of the calendar year compared to the same period in 2014 while inflationary growth in food remained in-check at 4.9% according to the Central Bank despite a growth over last year.
The Central Bank reports that the manufacturing sector of the economy grew in value added terms by 4.7% spurred by a 5.6% growth in the manufacture of food, beverages and tobacco products. The food products sub-sector the largest sub-sector in the Factory Industry Production Index (FIPI) compiled by the Central Bank demonstrated a positive performance for the most part of 2015. The annual growth reported was 4.9% compared to the 2.8% observed in 2014. The growth in the sector was mainly attributed to increased output in dairy products and prepared meals and dishes.
The increasing trend in total national milk production continued in 2015. Production increased by 12.1% to 374 million litres in 2015 compared to a growth of 1.4% the year before. The growth is attributed to the growing demand for raw milk from large producers with increased capacities of milk factories. The Central Bank reports that large producers increased demand by 1.5% in the year to 219 million litres. Meanwhile Import expenditure on dairy products declined by 26.1 per cent in 2015, mainly due to the decline recorded in the expenditure on milk powder imports, owing to the significant reduction in the average imported price of milk powder, despite the large increase in the import volume according to the Central Bank.
FMCG Operation
The FMCG segment of the Group led by dedicated Operational Heads holds 8 production units and 1 primary processing facility along with 22 collection centres for the sourcing of fresh milk. The Group’s FMCG Brands are largely distributed within Sri Lanka with limited exports to India, Maldives and the Middle East.
Management Discussion and Analysis contd.
Dairy
The Dairy sub-sector led by ‘Magic’ and ‘Kotmale’ brands are enjoying robust growth despite the successive increases in farm gate prices of fresh milk, a move that has made local dairy farmers uncompetitive against the cheaper imported milk powder. Nevertheless, the sub-sector is reaping the results of a focused drive to enhance operational efficiency which has boosted performance.
The Company is presently the second largest private-sector milk collector in the country with the average daily collection standing at over 100,000 litres. Magic and Kotmale combined source fresh milk from 15,000 small holders, majority organized into farmer societies in Central, North Western, Northern and Western regions of the Country. They are connected to an integrated supply chain through 22 chilling centres that reach 330 collection points islandwide. In the year concluded, our total collection reached 36.8 Mn litres with direct revenue generation to small holder farmers totalling Rs 2.6 Bn. Meanwhile the farm gate price of fresh milk was revised upwards in August 2015. The arbitrary

& 33Pg. 32
increases to the farm gate price of milk without addressing quality and productivity lapses among smallholder farmers, poses a substantial challenge to the local processing industry which must compete with cheaper imported milk powder. In response, the Company has initiated a partnership with IFAD and the Presidential Secretariat in line with the national policy of taking Sri Lanka towards self-sufficiency in milk. The integrated programme engages 2,700 small and medium dairy farmers towards doubling their production and enhancing quality by maximising animal health and hygiene, introducing systematic feeding process, machinery for milking, developing handling and cold storage etc. We are also investing towards enhancing the sector’s sourcing capacity with the installation of primary processing machinery towards milk storage during gluts.
In the year concluded steps were taken to invest in a milk processing operation in the Northern Province building on the Cargills outgrower model of bringing value-addition closer to sourcing locations towards enhancing quality and efficiency. Accordingly Kotmale pasteurised milk for the Northern Province would be manufactured in Kilinochchi utilising fresh milk from the region.
Magic ‘Heavenly’ range expanded its portfolio in 2015/16 to include 1 litre packs in response to the tremendous demand from consumers for larger portions of this exquisite collection. Investments are also in progress to expand the exciting impulse category under ‘Magic’ with an all-new collection of stick variants that are on par with global ice cream trends. In line with the above investments the infrastructure of the production plants have been strengthened by expanding the effluent
treatment plant at a zero-discharge standard.
The distinct quality and flavour associated with ‘Kotmale’ brands has resonated in its latest drinking yogurt range which is now available in 4 variants. The product has enjoyed tremendous success within a short span of time and steps are being taken to further enhance the Kotmale offering in the cultured milk segment. Meanwhile investments were made to enhance the capacity of the cheese plant in view of the ever increasing demand for the popular wedges range. Kotmale curd was also re-launched during the year and is seeing a growing consumer demand due to its unique taste and consistent quality.
Agrifoods
Our range of “Kist” nectars, cordials, jams, sauces and “Knuckles” bottled water reported a solid performance with Kist nectar and Kist Sauces in particular enhancing leadership in their respective categories. All key categories reported double-digit growth during the year resonating the brand’s strong equity among consumers across income tiers.
During the year capacity of the Nectar line was expanded and further automation of the Kist Knuckles plant was initiated while adding bottling capacity at the Katulooya Estate located on the Knuckles range in Thawalantenna.
Kist Sauces remains the superior product in the market and has now further enhanced market share with the convenient squeezy bottle that appeals to both on-premise and take-home consumption. The squeezy packaging saw a rehash in the year while the sub brand for spices was also introduced
The Dairy sub-sector is reaping the results of a focused drive to enhance operational efficiency which has boosted performance.
Revenue - FMCG
Rs.12,755Mn

Pg. 34Cargills (Ceylon) PLC - Annual Report 2015/16
to the market. Meanwhile the effluent treatment plant was expanded in line with capacity growth during the year. Steps were also taken to upgrade the finished goods stores with an advanced racking system.
The Kilinochchi primary processing plant is contributing tremendously to the Kist backward integration model. The sub-sector currently sources around 1800 MT of fruit from small farmers across Sri Lanka.
In the year concluded Kist in collaboration with USAID mobilised 250 farmers from Mahavilachchiya, Anuradhapura and Kilinochchi wherein each farmer is supported to cultivate ½ acre of land with passion fruit. Kist has entered into a buy-back agreement with the participating farmers with a minimum price pre-agreed yet offering higher prices as market fluctuates. We also provide extension services to the farmers to enhance product quality and productivity. SOLID under USAID facilitates technical training and assists with selected inputs such as micro irrigation systems and water pumps
to manage water as well as other equipment required for passion fruit cultivation.
Meats
The operational and management structure of the processed meats business was revised during the year towards focusing on higher efficiencies in the business. The challenges faced in sourcing quality raw material consistently have been addressed through the centralised procurement system that has been put in place for the FMCG business. Meanwhile a sustainable sourcing model engaging small farmers has been introduced along with a credit arrangement for them which would further stabilise the supply chain.
During the year the facility which has already secured ISO certification for Quality, Food Safety and Environment Management System also gained the SLS certification. This served as a further boost to the brand equity of ‘Goldi’ and ‘Sams’. The sub-sector experienced some setbacks due to adverse publicity and negative opinions regarding the
consumption of processed meats. Aware of its responsibilities towards public health and nutrition Cargills has always taken steps to voluntarily enhance the nutrition standards of its products while adhering to all approved food regulations applicable locally and globally.
Confectioneries
The Confectioneries business reached stable ground having further enhanced quality and taste through expertise on the production floor backed by management efficiency. The newly re-launched cream cracker is well accepted in the market while the steady demand for wafers meant that the line reached capacity during the year. Investments are planned to add capacity to the wafers line while utilisation of the biscuits line is now at optimum levels. With the business reaching capacity steps have been taken to further rationalise its range towards a select positioning. The Company is cognizant of the challenges faced by this business but is confident of carving a niche for itself in the industry.
Management Discussion and Analysis contd.

& 35Pg. 34
Millers
The Group’s trading and distribution operation that had been experiencing both internal and external challenges made a turnaround during the year concluded. The business underwent a restructure in order to optimise the available resources in the Group towards maximum efficiency. A Voluntary Retirement Scheme was offered to a selected segment of the team in order to streamline the logistics of the business towards a higher level of productivity. During the course of the year the Company also secured a range of new Brands while consolidating its longstanding relationships with global FMCG players thereby overcoming many of the supply constraints experienced in the previous year.
The exorbitant duties and cess charged on key categories such as confectioneries, biscuits, etc. is a deterrent to the growth of this business. These prohibitive duty structures influenced by an attitude of protectionism prevent healthy competition across growing categories. Cargills is of the view that policy of protectionism is no longer relevant in an open market economy and steps needs to be taken to empower consumers with choice, quality and price enabling local industries to truly enhance their standards and be competitive in the global market.
Financial Performance
The FMCG Sector has continued its growth momentum with turnover reaching Rs 12.7 Bn with a growth of 27.8% over 2014/15. The double-digit growth of the dairy and agriculture processing sub-sectors is holding the manufacturing business in good stead. Investments have been made towards enhancing capacities of several key product lines to ensure the companies remain in line with the growing consumer demand for our popular national brands and thereby continue the growth trajectory. Efficiencies garnered in the FMCG sector through process re-engineering, restructure of several businesses and reorganization of distribution is reflected at EBIT level with earnings before interest and tax reaching Rs 1.6 Bn compared to Rs 707.0 Mn in the previous year. Sector profitability reached a record high of Rs 857.7 Mn, a two and a half times growth compared to Rs 330.0 Mn recorded the year before.
FMCG
2015/16 Rs. Mn
2014/15Rs. Mn
Growth%
Revenue 12,755 9,979 27.8
EBIT 1,657 707 134.4
Interest 183 126 (45.2)
PBT 1,485 586 153.4
PAT 858 330 160.0
CAPEX 458 399 14.8
2012 2013 2014 2015 2016
FMCG Segment
EBIT & RevenueRs. Bn
3
6
12
9
15
0
REV
ENU
E
0
500
1,000
1,500
2,000
Rs. Mn
EBIT
Revenue EBIT
2016 2015Retail 71% 70%Fast Moving Consumer Goods 26% 26%Restaurant 3% 4%
Group Total Assets
2016
2015

Pg. 36Cargills (Ceylon) PLC - Annual Report 2015/16
RestaurantsIndustry
The Central Bank reports that the Accommodation, food and beverage services sub-sector under the Services sector contracted by 1.4% in 2015 compared to a 4% growth in the previous year. However the room occupancy rate in graded hotel establishments approved by the Sri Lankan Tourism Development Authority increased to 74.5% while tourist arrivals also increased by 17.8% in the year. The decline in the output from this sector can be attributed to an increasing trend of home-stay tourism which impacts the formal food services market. The Restaurants industry is highly competitive and is continuing to expand in numerical terms. Globally recognised online restaurants guides list over 500 restaurants in Colombo alone indicating the level of supply in this segment.
KFC
The year concluded saw a phenomenal turn around in the KFC restaurant chain. The steps taken to operate the sector independently under a focused management and an aggressive drive to enhance quality and service coupled
with the heavy emphasis on team building and motivation has made the restaurant chain one of the best turnaround stories of 2015 in the Yum! global franchise operation.
The winning culture is now restored in the entire KFC operation that spans 27 restaurants islandwide under a dedicated COO for the sub sector along with a strong operational team and quality assurance system. Standardization of systems and processes while keeping people development at heart has been the winning formula of KFC Sri Lanka which was awarded the best franchise for the Indian Subcontinent for the year 2015.
This chain continued to innovate on its menu during the year while retaining alignment with KFC’s core strength of freshly prepared chicken made to the secret recipe loved around the world. This has succeeded in attracting its genuine fans back into the restaurants more times a month resulting in a healthy growth in transaction and same store sales. The menu-mix is highly skewed towards hot and crispy chicken and the popular Zinger burger while the traditional rice favourites have
been revamped to meet the changing consumer tastes and demand.
Refurbishment of Nugegoda, Pelawatta, Kottawa and Hampden Lane during the year has given KFC a new store ambience attracting more dine-in tickets while the delivery push is also yielding the expected results. On average delivery sales now take up approximately 8% of store turnover with the ever increasing trend of eating out while at home.
TGI Fridays
TGI Friday’s, the American franchise into its third year of operation continued to experience challenges in attracting the necessary footfall despite substantial improvements in menu, client experience and service. The overall product is now well accepted in the market and is highly patronised by both local and foreign clientele for its authentic ‘Friday-Feel’ and delectable range of food and beverages coupled with a superior service and ambience. However the Restaurant continues to pose a challenge to the otherwise healthy bottom-line performance of the Restaurant sub-sector. Steps are
Management Discussion and Analysis contd.

& 37Pg. 36
being taken to reach a wider audience through further changes to the menu while enhancing the value proposition to our clientele.
Financial Performance
The Restaurants business is maintaining a steady upwards trend with topline reaching Rs. 2.8 Bn for the year which is a 22% growth over last year. The focused efforts of the management team to review the systems and processes, build team motivation and enhance service have resulted in a marked efficiency and productivity improvement in the operation. EBIT has reached Rs. 125 Mn compared to a Rs. 69.0 Mn loss in 2014/15. Segment profit reached Rs. 62.3 Mn compared to the losses recorded in 2014/15.
Restaurants
2015/16Rs. Mn
2014/15 Rs. Mn
Growth%
Revenue 2,812 2,301 22.2
EBIT 125 (69) 281.2
Interest 20 2 (900.0)
PBT 105 (72) 245.8
PAT 62 (128) 148.4
CAPEX 82 140 (41.4)
Revenue - Restaurants
Rs.2,812Mn
Standardization of systems and processes while keeping people development at heart has been the winning formula of KFC Sri Lanka which was awarded the best franchise for the Indian Subcontinent for the year 2015.
2012 2013 2014 2015 2016
Restaurant Segment
EBIT & RevenueRs. Bn
3
6
9
15
0
REV
ENU
E
(100)
(50)
0
50
100
150
200
Rs. Mn
EBIT
Revenue EBIT
2016 2015Retail 45% 9%Fast Moving Consumer Goods 51% 66%Restaurant 4% (25%)
Group Total Assets
2016
2015

Pg. 38Cargills (Ceylon) PLC - Annual Report 2015/16
Cargills emphasizes on the basics, with better processes and a closer engagement every step of the supply chain. A process of quality that is at the heart of everything we do.

& 39Pg. 38

Pg. 40Cargills (Ceylon) PLC - Annual Report 2015/16
Corporate Governance
The disclosures below demonstrate the extent to which the principles of good corporate governance are complied with within the Group. Further to the above, the Board of Directors to the best of knowledge and belief is also satisfied that all statutory payments due to the Government, other regulatory institutions, and related to the employees, have been made on time.
Company’s adherence to the Corporate Governance Rules as required by Section 7.10 of the Listing Rules of the Colombo Stock Exchange:
Corporate Governance Rule Compliance Status Details
7.10.1 Non-Executive Directors
a. The Board of Directors of a Listed Entity shall include at least,i. Two non-executive directors; orii. Such number of non-executive director’s equivalent to one
third of the total number of directors whichever is higher.
Complied with Company has seven non executive directors and four executive directors on its board
b. The total number of directors is to be calculated based on the number as at the conclusion of the immediately preceding Annual General Meeting.
Complied with
c. Any change occurring to this ratio shall be rectified within ninety (90) days from the date of the change.
Complied with
7.10.2 Independent Directors
a. Where the constitution of the Board of Directors includes only two non-executive directors as mentioned above, both such non-executive directors shall be ‘independent’.
In all other instances two or 1/3 of non-executive directors appointed to the Board of Directors, whichever is higher shall be ‘independent’
Complied with Four of sevenNon-executive directors are determined to be independent
b. The board shall require each non-executive director to submit a signed and dated declaration annually of his/her independence or non-independence against the specified criteria.
Complied with Each non executive director has provided a signed and dated declaration of his/ her independence or non independence against the criteria laid down in the listing rules.
7.10.3 Disclosures Relating to Directors
a. The board shall make a determination annually as to the independence or non-independence of each non-executive director based on such declaration and other information available to the board and shall set out in the annual report the names of directors determined to be ‘independent.’
Complied with
b. In the event a director does not qualify as ‘independent’ against any of the criteria set out below but if the board, taking account all the circumstances, is of the opinion that the director is nevertheless ‘independent’, The board shall specify the criteria not met and the basis for its determination in the annual report.
Complied with Four of seven non-executive directors are deemed independent by the Board and the criteria not met and the basis for such determination is set out in note 01 on page 46.

& 41Pg. 40
Corporate Governance Rule Compliance Status Details
c. In addition to the disclosures relating to the Independence of a director set out above, the board shall publish in its annual report a brief resume of each director on its board which Includes information on the nature of his/her expertise in relevant functional areas.
Complied with Please refer profile of directors on page 24 and 25.
d. Upon appointment of a new director to its board, the Entity shall forthwith provide to the exchange a brief resume of such director for dissemination to the public. Such resume shall include information on the matters itemized in paragraphs (a), (b) and (c) above.
N/A N/A
7.10.5 Remuneration Committee
A Listed Entity shall have a remuneration committee in conformity with the following:
a. Composition The remuneration committee shall comprise of;
i. a minimum of two independent non-executive directors (in instances where an Entity has only two directors of its board); or
ii. non-executive directors a majority of whom shall be independent, whichever shall be higher.
In a situation where both the parent company and the subsidiary are ‘Listed Entities’, the remuneration committee of the parent company may be permitted to function as the remuneration committee of the subsidiary.
However, if the parent company is not a Listed Entity, then the remuneration committee of the parent company is not permitted to act as the remuneration committee of the subsidiary. The subsidiary shall have a separate remuneration committee.
One non-executive director shall be appointed as Chairman of the committee by the Board of Directors.
Complied with
Complied with
N/A
Complied with
The remuneration committee comprise two independent non executive directors and the details are given on the inner back cover
Kotmale Holdings PLC is a subsidiary of the company and has its own remuneration committee.
N/A
Please refer inner back cover
b. FunctionsThe remuneration committee shall recommend the remuneration payable to the executive directors and Chief Executive Officer of the Listed Entity and/or equivalent position thereof, to the board of Listed Entity which will make the final determination upon consideration of such recommendations.
Complied with The Committee recommends to the Board the remuneration payable to the Executive Directors and the Chief Executive Officer. In recommending an appropriate remuneration package the primary objective of the Committee is to attract and retain the services of highly qualified and experienced personnel.

Pg. 42Cargills (Ceylon) PLC - Annual Report 2015/16
Corporate Governance Rule Compliance Status Details
c. DisclosuresThe annual report should set out the names of directors (or persons in the parent company’s committee in the case of a group company) comprising the remuneration committee, contain a statement of the remuneration policy and set out the aggregate remuneration paid to executive and non-executive directors.
The term “remuneration” shall make reference to cash and all non-cash benefits whatsoever received in consideration of employment with the Listed Entity (excluding statutory entitlements such as Employees Provident Fund and Employees Trust Fund).
Complied with Please refer inner back cover for the names of directors of the remuneration committee.
Please refer the remuneration committee report on page 48 for a statement of the remuneration policy.
Please refer note 35.1 to the financial statements for the aggregate remuneration paid to the directors.
7.10.6 Audit Committee
A Listed Entity shall have an audit committee in conformity with the following:
a. Composition The audit committee shall comprise of;
i. a minimum of two independent non-executive directors (in instances where a Entity has only two directors on its board); or
ii. non-executive directors a majority of whom shall be independent, whichever shall be higher.
In a situation where both the parent company and the subsidiary are ‘Listed Entities’, the audit committee of the parent company may function as the audit committee of the subsidiary.
However, if the parent company is not a Listed Entity, then the audit committee of the parent company is not permitted to act as the audit committee of the subsidiary. The subsidiary should have a separate audit committee.
One non-executive director shall be appointed as Chairman of the committee by the Board of Directors.
Unless otherwise determined by the audit committee, the Chief Executive Officer and the Chief Financial Officer of the Listed Entity shall attend audit committee meetings.
The Chairman or one member of the committee should be a member of a recognized professional accounting body.
Complied with
Complied with
N/A
Complied with
Complied with
Complied with
The audit committee comprises three independent non-executive directors.
Kotmale Holdings PLC is a subsidiary of the company and has its own audit committee.
N/A
Please refer inner back cover
Please refer Audit committee report on page 46.
The Chairman of the committee is a fellow of ICASL and CIMA (UK).
Corporate Governance contd.
& 43Pg. 42
Corporate Governance Rule Compliance Status Details
b. FunctionsShall include,i. Overseeing of the preparation, presentation and adequacy
of disclosures in the financial statements of a Listed Entity, in accordance with SLFRS/LKAS.
ii. Overseeing of the Entity’s compliance with financial reporting requirements, information requirements of the Companies Act and other relevant financial reporting related regulations and requirements.
iii. Overseeing the processes to ensure that the Entity’s internal controls and risk management are adequate, to meet the requirements of the Sri Lanka Auditing Standards.
iv. Assessment of the independence and performance of the Entity’s external auditors.
v. To make recommendation to the board pertaining to appointment, re-appointment and removal of external auditors and to approve the remuneration and terms of engagement of the external auditors.
Complied with
Complied with
Complied with
Complied with
Complied with
Please refer audit committee report on page 47.
c. DisclosuresThe names of the directors (or persons in the parent company’s committee in the Case of a group company) comprising the audit committee should be disclosed in the annual report.
The committee shall make a determination of the independence of the auditors and shall disclose the basis for such determination in the annual report.
The annual report shall contain a report by the audit committee, setting out the manner of compliance by the Entity in relation to the above, during the period to which the annual report relates.
Complied with
Complied with
Complied with
Please refer inner back cover.
Please refer audit committee report on page 47.
Please refer audit committee report on page 47.

Pg. 44Cargills (Ceylon) PLC - Annual Report 2015/16
Company’s adherence to the Provisions of Rule 7.6 as required by the Listing Rules of the Colombo Stock Exchange on disclosure in Annual Reports of Listed Entities:
Corporate Governance Rule Compliance Status Details
A Listed Entity must include in its annual reports and accounts, inter alia;
i. Names of persons who were Directors of the Entity during the financial year.
Complied with Please refer inner back cover for the names of directors of the company.
ii. Principal activities of the Entity and its subsidiaries during the year and any changes therein.
Complied with Please refer note 1.5 to the financial statements.
iii. The names and the number of shares held by the 20 largest holders of voting and non-voting shares and the percentage of such shares held.
Complied with Please refer Investor relations supplement on page 149 and 150.
iv. The public holding percentage. Complied with Please refer Investor relations supplement on page 149.
v. A statement of each director’s holding and Chief Executive Officer’s holding in shares of the Entity at the beginning and end of each financial year.
Complied with Please refer page 81.
vi. Information pertaining to material foreseeable risk factors of the Entity.
Complied with Please refer report on Risk management on page 50 to 57.
vii. Details of material issues pertaining to employees and industrial relations of the Entity.
N/A No material issues pertaining to employees and industrial relations
viii. Extents, locations, valuations and the number of buildings of the Entity’s land holding and investment properties.
Complied with Please refer page 148 for Group real estate portfolio
xi. Number of shares representing the Entity’s stated capital. Complied with Please refer page 149 for Investor relations supplement.
x. A distribution schedule of the number of holders in each class of equity securities and the percentage of their total holdings in the specified categories.
Complied with Please refer page 149 for Investor relations supplement
xi. The following ratios and market price information. EQUITY
1. Dividend per share2. Dividend pay out3. Net asset value per share4. Market value per share5. Highest and lowest value recorded6. Value as at the end of financial year.
Complied with
Complied with
Please refer page 147 for Five year summary
Please refer page 150 for Investor relations supplement.
Corporate Governance contd.

& 45Pg. 44
Corporate Governance Rule Compliance Status Details
DEBT (only if listed)1. Interest rate of comparable government security2. Debt/Equity ratio3. Interest cover4. Quick asset ratio5. The market prices & yield during the year (ex interest)
• Highest price • Lowest price • Last traded price
6. Any changes in credit rating (for the entity or any other instrument issued by the entity), if applicable
N/A N/A
xii. Significant changes in the Entity’s or its subsidiaries’ fixed asset and the market value of land, if the value differs substantially from the book value.
Complied with Investment Properties were revalued as at 31 March 2016. Please refer page 148 for Group real estate portfolio.
xiii. If during the year the Entity has raised funds either through a public issue, Right issue, and private placement;a. A statement as to the manner in which the proceeds of
such issue has been utilized.b. If any shares or debentures have been issued, the
number, class and consideration received and the reason for the issue; and,
c. Any material change in the use of funds raised through an issue of securities.
N/A N/A
xiv. a. EMPLOYEE SHARE OPTION SCHEMESThe following information shall be disclosed in the Annual Report of the Listed Entity in respect of each ESOS: • The number of options granted to each category of Employees during the financial year.
• Total number of options vested but not exercised by each category of Employees during the financial year.
• Total number of options exercised by each category of Employees and the total number of shares arising therefrom during the financial year.
• Options cancelled during the financial year and the reasons for such cancellation.
• The exercise price.
• A Declaration by the directors of the Entity confirming that the Entity or any of its subsidiaries has not, directly or indirectly, provided funds for the ESOS.
N/A N/A

Pg. 46Cargills (Ceylon) PLC - Annual Report 2015/16
Corporate Governance Rule Compliance Status Details
b. EMPLOYEE SHARE PURCHASE SCHEMESThe following information shall be disclosed in the Annual Report of the Listed Entity in respect of each ESPS: • The total number of shares issued under the ESPS during the financial year.
• The number of shares issued to each category of Employees during the financial year.
• The price at which the shares were issued to the Employees.
• A Declaration by the directors of the Entity confirming that the Entity or any of its subsidiaries has not, directly or indirectly, provided funds for the ESPS.
N/A N/A
xv. Disclosures pertaining to Corporate Governance practices in terms of Rules 7.10.3, 7.10.5 c. and 7.10.6 c. of section 7 of the Rules.
Complied with Please refer page 40 to 43 for the disclosures in terms of Section 7.10.
xvi. Related Party transactions exceeding 10% of the Equity or 5% of the total assets of the Entity as per Audited Financial Statements, whichever is lower.
Details of investments in a Related Party and/or amounts due from a Related Party to be set out separately.
The details shall include, as a minimum:a. The date of transaction;b. The name of the Related Party;c. The relationship between the Entity and the Related
Party;d. The amount of the transaction and terms of the
transaction;e. The rationale for entering into the transaction.
Complied with Please refer note 35.
Note 01:Based on the declarations provided by the non executive directors, the Board has decided the following directors as independent:
Messrs. A T P Edirisinghe and Sunil Mendis • who have served on the Company’s Board for a period in excess of nine years and
• are also Directors of C T Holdings PLC which has a significant shareholding in the Company, and
Messrs. S E C Gardiner and E A D Perera • who have served on the Company’s Board for a period in excess of nine years
who, in spite of their service on the Company’s Board for over nine years and / or being Director in another Company which has a significant shareholding in the Company, the Board has nevertheless determined to be independent considering their credentials and integrity.
Corporate Governance contd.

& 47Pg. 46
Audit Committee Report
The Audit Committee is appointed by the Board of Directors of the Company and reports directly to the Board. The Audit Committee comprise three members who are non-executive Directors who are deemed independent. The Chairman of the Audit Committee is a Fellow of the Institute of Chartered Accountants of Sri Lanka. The composition of the members of the Audit Committee satisfies the criteria as specified in the Standards on Corporate Governance for listed companies.
The Members of the Audit Committee:Name / Independence A. T. P. Edirisinghe FCMA, FCA - Chairman IndependentMr. Sunil Mendis - IndependentMr. E. A. D Perera - Independent
The procedure in place is for the Chief Financial Officer (CFO) and Chief Risk Officer (CRO) to attend all meetings when scheduled and for the Managing Director to attend audit committee meetings as and when requested so to do by the Audit Committee. The Company Secretary acts as the Secretary to the Committee.
Meetings
The Audit Committee met once during the year. The meeting was also attended by the Managing Director of the Company, with the participation of Chief Financial Officer (CFO) and Chief Risk Officer (CRO). Besides this, procedure are in place to circulate the various documents stated hereunder and for clarification of matters raised by the members of the Audit Committee. Where necessary, approvals are given by circular resolutions.
Scope
The oversight function of (a) the preparation, presentation and adequacy of disclosures in the quarterly and annual financial statements of the company, in accordance with Sri Lanka Accounting Standards including the adoption of new Sri Lanka Accounting Standards (SLFRS/LKAS) and (b) the Company’s compliance with financial reporting requirements, information requirements of the Companies Act and other relevant financial reporting related regulations and requirements, was duly performed and the Audit Committee reviewed the year-end and Quarterly financial statements and recommended their adoption to the Board. In all instances, the Audit Committee obtained a declaration from the CFO stating that the respective financial statements are in conformity with the applicable accounting standards, company law and other statues including corporate governance rules and that the presentation of such financial statements are consistent with those of the previous quarter or year as the case may be, and further states any departures from financial reporting, statutory requirements and Group policies, (if any). Quarterly Compliance Certificates are also obtained from the Finance, Legal, and Secretarial divisions of the Company on a standardized exception reporting format perfected by the Audit Committee, stating any instances (where applicable) of, and reasons for, non-compliance, along with a Risk Management & Internal Audit Report submitted by the CRO.
The oversight function over the processes to ensure that the Company’s internal controls and risk management are adequate to meet the requirements of the Sri Lanka Auditing Standards was reviewed covering (a) the business risk management
processes and procedures adopted by the Company, to manage and mitigate the effects of such risks and measures taken to minimize the impact of such risks, (b) the internal audit plan and monitoring the performance of the internal audit department and adherence to the internal audit plan and (c) the internal audit reports and monitoring follow up action by the management. The Audit Committee assessed the independence and performance of the Company’s external auditors and made recommendations to the Board pertaining to appointment/ re-appointment. The Audit Committee also reviewed the audit fees for the Company and approved the remuneration and terms of engagement of the external auditors and made recommendations to the Board. When doing so, the Audit Committee reviewed the type and quantum of non-audit services (if any) provided by the external auditors to the Company to ensure that their independence as Auditors has not been impaired. The Audit Committee obtains an ‘Auditor’s Statement’ from Messrs. KPMG confirming independence as required by Section 163 (3) of the Companies Act No.07 of 2007 on the audit of the statement of financial position and the related statements of profit or loss and other comprehensive income, changes in equity, and cash flows of the Company and the Cargills Group.
The Audit Committee has recommended to the Board that Messrs KPMG, Chartered Accountants, be continued as external auditors of the Company for the financial year ending 31 March 2017.
(Signed)A. T. P. Edirisinghe FCMA, FCA,
Chairman – Audit Committee
09th June 2016

Pg. 48Cargills (Ceylon) PLC - Annual Report 2015/16
The Remuneration Committee of Cargills (Ceylon) PLC consists of two Non – Executive Directors – Messrs. Sunil Mendis (Chairman), and A .T. P. Edirisinghe. The Chairman, Deputy Chairman & CEO, and the Managing Director may also be invited to join in the deliberations as required.
The Committee studies and recommends the remuneration and perquisites applicable to the Executive Directors of the Company and makes appropriate recommendations to the Board of Directors of the Company for approval.
The Committee also carries out periodic reviews to ensure that the remunerations are in line with market conditions.
(Signed)Sunil MendisChairman – Remuneration Committee
09th June 2016
Remuneration Committee Report

& 49Pg. 48
Related Party Transactions Review Committee Report
The Related Party Transactions Review Committee was appointed by the Board of Directors of the Company on 29 July 2015 and reports directly to the Board. The Committee comprise three members who are non-executive Directors who are deemed independent. The Chairman is a Fellow of the Institute of Chartered Accountants of Sri Lanka. The composition of the members of the Related Party Transactions Review Committee satisfies the criteria as specified in the Standards on Corporate Governance for listed companies.
The Members of the Related Party Transactions Review Committee:Name / Independence A. T. P. Edirisinghe FCMA, FCA - Chairman IndependentMr. Sunil Mendis - IndependentMr. E. A. D Perera - IndependentThe Company Secretary acts as the Secretary to the Committee.
Scope
The RPTRC was formed by the Board to assist the Board in reviewing all Related Party Transactions (RPT) carried out by the Company.
The mandate of the Committee includes inter-alia the assurance of the following:
• Developing and recommending for adoption by the Board of Directors of the Company and its listed subsidiaries, a RPT Policy consistent with that proposed by the CSE.
• Making immediate market disclosures on applicable RPT, as required by Section 9 of the Continuing Listing Requirements of the CSE.
• Making appropriate disclosures on RPT in the Annual Report, as required by Section 9 of the Continuing Listing Requirements of the CSE.
During 2015/16, a comprehensive RPT Policy was developed and disseminated among relevant stakeholders.
The Committee will schedule quarterly meetings to review and report to the Board, on matters involving RPT falling under its terms of Reference.
MeetingsThe Related Party Transactions Review Committee (RPTRC) met once during the year. The meeting was also attended by the Managing Director of the Company, with the participation of Chief Financial Officer (CFO) and Chief Risk Officer (CRO).
The Committee adopted policies and procedures for (a) reviewing the Related Party Transactions at each quarterly meeting, (b) identifying & reporting on recurrent & non-recurrent transactions to be in line with the applicable CSE Rules.
The Committee noted that there were no changes to practices followed over the years and general Terms and Conditions applicable to all trading transactions and Lease Agreements entered into with Related Parties are similar to those entered into with non-related parties taking to account, if any, due consideration of factors such as trading volumes, the long term nature of the Leases and the extent of the area occupied, etc.
The Committee agreed that all transactions with Related Parties will hereafter be reviewed by it and supporting documents and/or justification of such terms will be called for. Its comments/observations will thereafter be communicated to the Board of Directors.
(Signed)A.T. P. Edirisinghe FCMA, FCA,Chairman – Related Party Transactions Review Committee
09th June 2016

Pg. 50Cargills (Ceylon) PLC - Annual Report 2015/16
Risk Management
Risk Management Overview
The Group remains committed to the objective of increasing shareholder value by developing and growing business that is consistent with its risk appetite. Risk management is a strategic priority within the Group and considered essential for delivering value for the business. Risk taking, in an appropriate manner, is thus a fundamental part of the Group’s business activity and an essential component of its planning process.
The Group is seeking an appropriate balance in the business, and continue to build the risk management capabilities that will help the business to deliver the growth plans in a controlled environment. This is achieved by keeping risk management at the centre of the executive agenda and by building a culture in which risk management is embedded into the day to day management of the business.
The management acknowledges the fact that, the expansion drive of the Cargills Food City chain and investments in Restaurants and the FMCG sectors have increased the risk profile of the Group.
In this environment the management considers each risk in the context of the Group’s strategy by identifying the potential upside and downside to the Group business. Any identified downside is subject to mitigation and any upside is fully made use of to strengthen the competitive position of the Group.
Precautionary approach to Risk Management
The Group’s approach to environmental challenges and risks is founded on the precautionary principles.
Our aim is to create value and benefits to all stakeholders by adopting a precautionary approach to sustainability and risk management. The Group treats and manages the sustainability related risks in the same manner as any other risks impacting our business.
The Group’s precautionary risk management efforts focus on areas relating to plant design, product development, processes, material usage, waste disposal, energy usage, water consumption, etc. This integrated approach will ensure that regulations, best practices and appropriate risk mitigation strategies are in place to proactively protect the environment and human wellbeing rather than simply responding to problems as they occur.
Risk Management Framework
The Board has overall responsibility for risk management, the system of internal controls and for reviewing their effectiveness. Some of these responsibilities have been delegated to the Audit Committee.
The Group’s approach to risk management is based on risk governance structures, risk management policies, risk identification, risk measurement, reporting, monitoring and continuous assessment.
The Group has an integrated risk management framework, through which it manages enterprise-wide risks, with the objective of maximising risk adjusted returns while remaining within risk appetite.
The Board of Directors, Audit Committee, Risk Management team and the Internal Audit Department lead the Risk Management process by guiding and supporting the managers and the employees in the Group.
Centralised corporate reporting unit is tasked to ensure the financial reporting and compliance risk are managed properly. The audit committee reviews all financial and related information that are reported and disseminated. Similarly centralised legal department coordinates with all business sectors to ensure that the Group complies with applicable laws and regulations.

& 51Pg. 50
The roles and responsibilities of the key players of the Risk Management process are summarised below;
Roles and Responsibilities
Board of Directors Oversight role of monitoring entire Risk Management process with the support of the Audit Committee.
Audit Committee a) Oversight function in respect of • Development of Risk Management Policy and Framework.
• Establishing Governance and Risk Management Structure.
• Determining the nature of key risks faced by the organization, Risk appetite and Risk tolerance levels.
• Designing and Implementing effective Risk Management and Internal Control systems.
• Reviewing the effectiveness of the Risk Management and Internal Control mechanism.
• Compliance with regulations, policies, laws and with the organization’s procedures and code of conduct.
b) Reviewing the risk profile of major Investment proposals against the risk appetite and apprise the Board on the suitability of such business proposals.
c) Reviewing the control and systems weaknesses highlighted by the external Auditors and apprising the Board of any significant deficiencies noticed.
Risk Management & Compliance Team
a) Developing Risk Management Policies and Framework. b) Carrying out comprehensive risk assessment across the organization.c) Implementation of appropriate risk mitigation strategies.d) Reporting on key risk exposures and the impact of the mitigation strategies on the exposure. e) Reviewing the effectiveness of the mitigation strategies and improve them where ever
necessary.f) Monitoring and reporting on external compliance such as statutory, legal, employment and
health and safety regulations.
Internal Audit Team a) Developing and implementing effective systems of internal controls.b) Evaluating and providing assurance that risk management, control, and governance systems
are functioning as intended.c) Reporting risk management issues and internal controls weaknesses identified, to the Audit
Committee and Board of Directors.d) Monitoring and reporting on compliance related to company policies, procedures and code
of conduct.

Pg. 52Cargills (Ceylon) PLC - Annual Report 2015/16
Overview of key Risks Affecting the Business
Economic Risks Risk Mitigation Actions
Competition and Consolidation
Increased competition in the Retail, FMCG and Restaurant sectors compel us to be competitive always in terms of price, product range, quality and service to sustain the market share and leadership.
• Our products are priced competitively in the market to maintain the market leadership position while ensuring margins are maintained by controlling input cost.
• Higher service standards are maintained by recruiting, training and coaching employees with right caliber.
• To be ahead with our competitors, we focus continuously on innovation through research and development to cater to the changing customer preferences.
• Our performance in terms of customer satisfaction, perception and experience are bench marked and measured against key competitors.
• Clear strategies are implemented in terms of pricing, product range, quality and service according to the target market and the competitive environment.
Business Strategy
Selection of a wrong business strategy or failure to implement the strategies effectively could impact the business performance.
• High priority is given for the formulation of strategic plan for each business sector under the guidance of the corporate office.
• Strategies are scrutinized in detailed by the Board before being approved.
• Strategies are communicated clearly to the employees at all levels.
• Implementation of strategies is monitored regularly to ensure they are executed as planned.
• Outcome of each strategy is critically reviewed against its objectives in order to assess its effectiveness.
Funding and Liquidity Risk
Business could be impacted badly if we are unable to source adequate funds for ongoing business operations, the expansion projects and also for other investments.
• The Group finances its operations by a combination of retained earnings and via long term and short term borrowings.
• Borrowings are controlled within the authorised capital structure and Weighted Average Cost of Capital is maintained at lowest level as possible.
• The Group has established banking facilities with all major banks and financial institutions to obtain fund as and when required.
• The Group owns land and buildings which can be offered as collateral for future funding requirements if necessary.
Risk Management contd.Risk Management contd.

& 53Pg. 52
Economic Risks Risk Mitigation Actions
Interest Rate Risk
Steep upward movement in the interest rate could have severe impact to the financial performance of the Group.
• The Group operations are funded by mixture of fixed interest rate bearing long term loans and short term loans with floating interest rates.
• Centralised treasury function enables pooling of funds and negotiating better rates.
• Interest rates movements are monitored by the treasury and appropriate steps are taken to mitigate the financial impact due to the interest rate fluctuations.
Credit Risk
The Group’s FMCG sector in particular is exposed to high credit risk by the nature of the business. There would be adverse impacts on the liquidity position as a result of payment delays and non-payment by debtors.
• Stringent customer evaluation processes are in place in order to ensure credit worthiness of the customers before granting credit facilities.
• The credit given to all our distributors are covered by Bank Guarantees.
• We minimise the credit risk through the rigorous process of credit management.
• The Group has effective follow up and collection processes and strictly adheres to business specific credit policies.
• All export sales are covered by credit insurance.
Foreign Exchange Rate Risk
Steep upward movement in the foreign exchange rates would have adverse impact on raw material prices with respect to our FMCG sector , prices of the imported products sold by our retail chain and costs of capital equipment imported
• The Group’s consumption of imported raw materials is considerably low; hence the exposure to Forex risk is limited.
• Foreign exchange rates are monitored by our import division and necessary steps are taken to minimise the adverse impacts.
Commodity Price Risk
Upward movement and fluctuations in the commodity prices could affect the prices of raw material as well as the products sold through our retail chain
• Commodity prices are monitored by our procurement division and necessary steps are taken, including forward booking of the prices to mitigate the risk.

Pg. 54Cargills (Ceylon) PLC - Annual Report 2015/16
Economic Risks Risk Mitigation Actions
Inventory and Supply Chain Risk
• Failure to manage supply chains effectively would lead to adverse impacts in smooth and uninterrupted flows of goods and materials. Our manufacturing businesses especially dairy sector is highly dependent on uninterrupted supply of raw materials.
• Poor management of inventory would increase the risk of obsolete inventory, stock adjustments and increasing stock holding costs
• The Group’s procurement function is centralised to achieve economies of scale and efficiency.
• The Group has an effective vendor selection and evaluation process in place.
• Strong relationships are built and maintained with suppliers through long term contracts.
• Forward bookings are done for commodity procurement to avoid stock outs and to maintain stable buying prices.
• Effective category management is in place in the retail sector to ensure efficient replenishment of stocks.
• We secure bulk of our dairy and produce requirements thorough established farmer network.
• The Group has a network of suppliers and does not considerably depend on any single supplier or a small group of suppliers.
• Our round the clock central warehouse operation is geared to replenish the stocks for retail chain without any delay.
• Tight inventory control procedures are implemented in all business sectors to prevent losses.
• Our warehouses and retail locations are adequately protected to prevent any loss of inventory and any unforeseen losses are adequately covered by insurance.
IT systems and infrastructure
• The Group is reliant on its IT systems and operational infrastructure in order to conduct the business efficiently.
• Inappropriate systems or failure of key systems could have a significant impact on our business.
• We have adequate controls in place to maintain the integrity and efficiency of our IT infrastructure and to ensure consistency of delivery.
• Our staff are trained and effectively engaged to mitigate IT related risks.
• The Group has stringent policies and procedures to ensure higher level of data security.
• Development and implementation of new IT systems are reviewed and discussed at senior managers’ level to ensure proper implementation.
• Investment in IT and related infrastructure is given priority at the Board level.
• All third party supplied hardware and software are covered by maintenance agreements
Risk Management contd.Risk Management contd.

& 55Pg. 54
Social Risks Risk Mitigation Actions
People Retention and Capabilities
• Failure to attract, retain and develop people with right capabilities could seriously impact the long-term growth potential of the business.
• Through proper HR planning and recruitment processes we minimise staff shortages.
• We liaise with relevant authorities and institutions in the regions to recruit employees living close to the business locations.
• We have a fully-fledged training department with state of art training facilities to train our employees in various disciplines.
• Processes are also in place to identify talent and actively manage succession planning.
• We have a transparent mechanism in place to handle employees need and grievances.
• Our employment policies and rewards schemes are regularly reviewed in order to ensure that we are in par or better than the industry norms.
Health and Safety
• Provision of adequate safety for our staff and customers is utmost importance to us. The inability to provide such environment would result in injuries or loss of life that cannot be measured in financial terms.
• Manufacturing, retail and storage facilities are designed in such a way to prevent adverse impact to environment and to the work force.
• Stringent health and safety processes in line with best practices are in place in all our business premises, which are monitored and audited regularly.
• Regular review is conducted to ensure the compliance to the health and safety regulations and internal control procedures.

Pg. 56Cargills (Ceylon) PLC - Annual Report 2015/16
Social Risks Risk Mitigation Actions
Product Quality and Safety
• The safety and quality of our products are critical to maintain customer trust and confidence and to maintain our business performance.
• Due consideration is given at the time of product development to ensure products are environmental friendly and safe for consumption.
• Suppliers are evaluated for their sustainable practices at the time of supplier introduction.
• Recyclable and non-toxic input materials and packaging are used wherever possible by the company.
• We have detailed and established procedures to ensure product integrity and safety are maintained throughout our value chain.
• Quality and safety aspects are strictly monitored at the time of manufacturing and procuring products from vendors.
• Products produced in our manufacturing facilities go through stringent quality and safety checks before being released to the market.
• We closely work with the suppliers to ensure products sourced from them meet our quality and safety standards.
• Review of compliance of the quality and safety procedures are conducted regularly.
• Developments in the areas of health, safety and nutrition are monitored closely in order to respond appropriately to changing customer trends and new legislations.
Environmental Risks Risk Mitigation Actions
Reputational Risk
• Failure to protect the Group’s reputation and brands could lead to a loss of trust and confidence. This could result in an erosion of the customer base and affects the ability to recruit and retain high-caliber people.
• The Group is committed to adopt environmental friendly practices such as energy conservation, carbon emissions reduction, preservation of water, proper waste disposal methods, etc.
• Sustainability factors such as energy conservation, water consumption, greenhouse gas emission are given due consideration when investing in plants and equipment.
• We always strive to exceed customer expectation by offering better products and services to the customers.
• Continuous communication with customers and other stakeholders is maintained to obtain their views and feedback.
• We maintain continuous dialogue with state and other authorities to obtain their views and concerns.
• Cargills Values and code of conduct are embedded into our customers, suppliers and other stakeholders’ engagement processes.
Risk Management contd.Risk Management contd.

& 57Pg. 56
Environmental Risks Risk Mitigation Actions
Risk of Natural Disasters
• Natural disasters such as earthquakes, storms, and floods, as well as accidents, acts of terror, infection and other factors beyond the control of the Group could adversely affect the Group’s business operation.
• Insurance covers are obtained against all identified risks and natural disasters affecting the assets of the Group and operational matters.
• Employees are adequately trained in order to minimise any harmful effect of such events to human life as well as to the business
Regulatory and Political Environment
• Failure to comply with laws and regulations could lead to legal prosecution and fines or imprisonment.
• In addition, a breach could lead to reputational damage.
• Key areas subject to regulation include employment, tax laws, environmental issues, and regulations over the Group’s products and services.
• Changes in the regulatory and political environment are closely monitored and appropriate strategies are developed to mitigate any adverse impacts due to the changes.
• We engage with government and non-government institutions to ensure that the interest of our customers and employees are expressed and given due consideration when policies and regulations are enacted.

Pg. 58Cargills (Ceylon) PLC - Annual Report 2015/16

& 59Pg. 58
A joint project of the Presidential Secretariat and Cargills, supported by IFAD, engages 2,700 small dairy farmers to double their milk production and enhance quality through an intensive focus on animal health and hygiene, systematic feeding, improving handling and investing in cold storage.
Pg. 60Cargills (Ceylon) PLC - Annual Report 2015/16
Sustainability Report
Sustainability strategy and analysis G4-1
From our inception as a wholesale and retail business in 1844 and throughout our evolution to emerge as a strong player in Sri Lanka’s Food and Beverage industry we remain grounded in a culture of trust and respect, this remains the standard by which we do business. We operate with integrity and accountability. We are committed to serving consumers in a responsible way; reducing our environmental impact; and improving the communities where we live and work. We are passionate about our goal to be a leader in nourishing people and operating responsibly across the agricultural, food, industrial and financial markets we serve.
Nourishing peopleThe breadth and scope of our business gives us an unparalleled view – and with that broad perspective comes responsibility. We are committed to nourishing our growing population while protecting the environment. We continue to find new ways to help farmers produce more food more sustainably and to develop more efficient methods of moving food from times and places of surplus to times and places of deficit. We know that with the talents and conviction of our employees, we can help meet the challenge of ensuring all people have access to safe, nutritious and affordable food.
Operating responsiblyWe focus on meeting today’s needs without impairing the world’s capacity to serve future generations. Our responsibility extends beyond our own operations to the suppliers, partners and other stakeholders in our supply chains. A responsible supply chain respects people and human rights; produces safe and wholesome food;
treats animals humanely; promotes the best, most responsible agricultural practices; and reduces environmental impact, including protecting the land and conserving scarce resources. Achieving this will require collaboration with all stakeholders across developed and emerging markets. We strive to demonstrate measurable progress against the supply chain issues that we can control and those we can influence.
Following our Guiding PrinciplesAdhering to high standards of business conduct has been important to Cargills since our founding. We are governed by a Code of Conduct, which is grounded by a strong set of values and ethics that are passed down through more than a century and a half of business and community engagement.
We know our ability to grow as a company depends on the way we treat people, how we enrich our communities and how well we serve our customers. Through the efforts of our employees, Cargills will grow profitably and grow responsibly to meet the needs of a diverse, expanding and interconnected world.
Commitments to external initiatives & Memberships in Associations
G4-16
• Ceylon Chamber of Commerce
• Sri Lanka Institute of Directors
• Employers Federation of Ceylon
• Consumer Goods Forum (International)
• Food Marketing Institute (International)
• UN Global Compact
Our Stakeholders G4-EC1
• Team Members and prospective Team Members
• Shareholders and potential investors
• The Board of Directors
• Customers and consumers
• Local, state, and federal government agencies
• Non-governmental organizations
• Local community members and leaders
• The media
• Suppliers, independent producers, and other business partners
• Wholly-owned subsidiaries and joint ventures
• Multicultural organizations, academia, and industry associations
Stakeholder Engagement Approach G4-26
We recognize internal and external stakeholder engagement can help better define our business strategy; sharpen our decision-making; and enhance our company’s economic, environmental, and social performance. Accordingly, we (1) seek to understand the perspectives and needs of our stakeholders, (2) set expectations for areas of mutual concern, (3) act upon these expectations, and (4) ensure our stakeholders remain informed of our progress.
Every facet of our company and its operations has potential to affect, or be affected by, stakeholders. To better align our business practices with stakeholder expectations, we maintain open dialogue and foster collaborative relationships with those individuals and groups who have an interest in, or are affected by, our company and
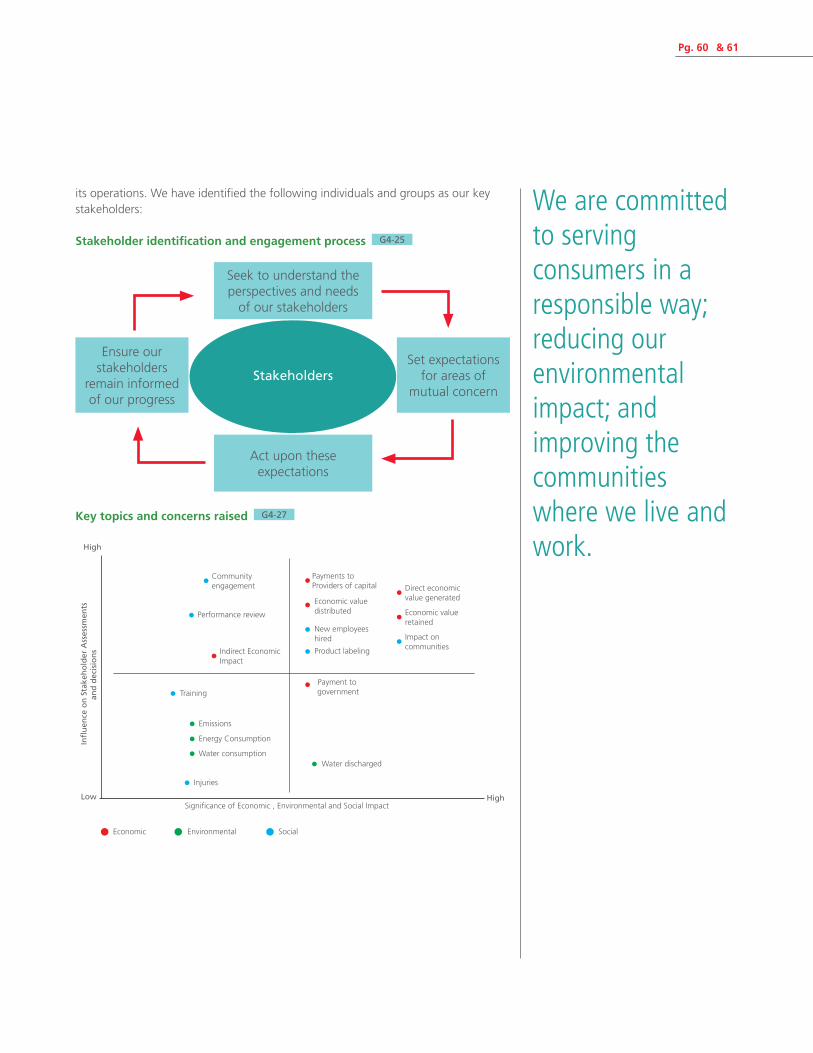
& 61Pg. 60
We are committed to serving consumers in a responsible way; reducing our environmental impact; and improving the communities where we live and work.
its operations. We have identified the following individuals and groups as our key stakeholders:
Stakeholder identification and engagement process G4-25
Stakeholders
Seek to understand the perspectives and needs
of our stakeholders
Act upon these expectations
Set expectations for areas of
mutual concern
Ensure our stakeholders
remain informed of our progress
Key topics and concerns raised G4-27
High
Low High
Communityengagement
Payments to Providers of capital Direct economic
value generated Economic valuedistributed Economic value
retainedNew employees hired Impact on
communitiesProduct labeling
Payment to government
Indirect Economic Impact
Energy Consumption
Emissions
Water consumption
Performance review
Injuries
Water discharged
Significance of Economic , Environmental and Social Impact
Social
Training
Infl
uen
ce o
n S
take
ho
lder
Ass
essm
ents
and
dec
isio
ns
Economic Environmental

Pg. 62Cargills (Ceylon) PLC - Annual Report 2015/16
The group has a widely spread supply chain network to access its established points of business in different parts of the country.
Sustainability Report contd.
Supply chain of the Group G4-12
Cargills group comprises a wide spread supply chain encompassing the retail business, the well-established manufacturing businesses and the restaurants sector. Given the wide array of goods that are handled within the group, Cargills has the capability to provide solutions to dry, temperature controlled and humidity controlled supply chain needs. The group has a widely spread supply chain network to access its established points of business in different parts of the country. The group’s storage capacity exceeds 400,000 square feet while the logistics staff working from different sites of the group surpasses 500 in number.
The Cargills Food City business has a dedicated operation for the sourcing of fresh produce from small holder farmers which cover 13 collection points for sourcing fruit, vegetables and seafood. The system includes two central processing units and a 24 hour distribution operation maintaining the cold-chain across the value-chain. The dry goods warehouse is a separate operation. The business directly connects with thousands of small, medium and large scale suppliers while is also engaged in direct importation of selected commodities on a limited basis.
The FMCG sector comprises 8 production units and 1 primary processing facility. The raw material for the dairy sector is sourced from 15,000 small holders, majority organized into farmer societies in Central, North Western, Northern and Western regions of the Country. They are connected to an integrated supply chain through 22 chilling centres that reach 330 collection points island-wide. The Cargills agriculture supply chain connected to a primary processing unit and a central processing unit also
provide raw material for the processing activities of the Agrifoods subsector. Raw material for the meats processing sector is sourced from medium to large scale suppliers engaged in the poultry and livestock industry some of whom have their own out-grower operations. Imported and other local raw material required by production plants are sourced through a centralized sourcing operation for the Group.
The logistics of the Cargills Food City business has been outsourced to an industry expert who manages the fleet and deliveries from the central dry warehouses to outlets. Meanwhile direct store deliveries are also carried out by selected suppliers for frozen and chilled products. The logistics of the fresh produce supply chain is managed internally.
Dedicated distribution operations are in place for the FMCG sector by individuals brands connecting to distributor centres island-wide. The supply chain is managed through a Sales Force Automation system.
The Millers operation that is an imports-driven business has its own import operation and dedicated warehousing and logistics channels.
The Restaurants sector has one central commissary that engages in selected food preparation activities. The delivery service of the restaurant sector is operated internally with own fleet.

& 63Pg. 62
EconomicEconomic Performance G4-EC1
Cargills is committed to delivering sustainable economic performance and growth to all its stakeholders. By conducting our businesses in a sustainable and socially responsible manner Cargills provides both financial and non-financial value to our shareholders, business partners, employees, customers and local communities.
The Economic Value statement depicts the generation of wealth and its distribution among the stakeholders by acting responsibly in all our business activities and social engagements across our value chain. It includes economic value generated and distributed, including revenues, operating costs, employee compensation, , retained earnings, and payments to capital providers and governments. It also indicates the re-investments for the replacement of assets and amounts retained for growth and development of the operation. The direct economic value generated by the Group is Rs. 16.6 Bn.
Identified positive and negative indirect economic impacts, significance of the impact G4-EC8
Proportion of spending on local suppliers - 94% G4-EC9
Our engagement with the agriculture community is a sustainable one where we nurture the future generation of that community even as we provide knowledge, markets and inputs to the farmers. As we provide a standard price and an assured market building their quality of life we are also saving for the children of farming communities so that they may be empowered towards an even better life through education. We are also working with them to preserve and conserve the soil resource so that the food security of future generations
and the farmer livelihoods of the future are both protected. Cargills is therefore literally and metaphorically nurturing our good earth, our future with a vision that will bear fruit well beyond the lifetime of the present generation. Cargills Sarubima is our good earth where we sow the seeds of our hopes and aspirations for our farmers and their children. The harvest of Sarubima will continue to reap into future and will have a multiplier impact across communities and people. Comparable to Cargills objectives, which are enhancing youth skills and bridging regional disparity Sarubima Community Scholarship project has been launched to broaden the access to education of the children and adolescence in particular areas. The project provides scholarships for School Children, University Students and for Students who are following Vocational Trainings also. The scholarship program has inspired the young generation in the villages, encouraging them on education inevitably ensure the community sustainability.
Sarubima Scholarships - 2015
Scholarship Type No.
University Scholarships (3 years) 31
Advanced Level (2 years) 65
Vocational Training (2 years) 4
Year 5 Scholarships 104
Total 204
Laptops for University Students 31
Number of Farmers Insured through Sarubima Fund
Year No.
2011/12 447
2012/13 337
2013/14 337
2014/15 100
2015/16 500
The Economic Value statement depicts the generation of wealth and its distribution among the stakeholders by acting responsibly in all our business activities and social engagements across our value chain.

Pg. 64Cargills (Ceylon) PLC - Annual Report 2015/16
EnvironmentFulfilling our purpose of nourishing people requires clean water, soil and air. As a food company, we are focused on a sustainable future that reduces demands on the environment as populations continue to grow.
Energy Management G4-EN3
The Group has focused on energy conservation initiatives practiced at business unit level which includes the monitoring of energy, use of energy efficient lighting and equipment and utilization of renewable energy sources.
The Group’s primary energy source is the National Grid while the Retail sector is the highest consumer of the same. The Group measures its consumption based on logs maintained at each business unit, bills received from utility providers and ledger entries.
Energy consumption
Electricity (Gj) 199,875
Diesel (Liters) 242,801
Furnace Oil (Liters) 1,851,066
LPG (Kg) 635,555
Water Management G4-EN8
Water is a key in our Beverage manufacturing process and water bottling business and critical in all food manufacturing processes in terms of maintaining the health and hygiene of our production facilities. Achieving efficiencies in our water consumption is an important environmental priority for the Group. Our water requirement is sourced through a mix of ground water and national supply based on the needs and requirements of our business units.
Water consumption (m3) 875.208
Biodiversity G4-EN11
The Group is committed to conserving bio diversity and wherever possible
enhancing it through adherence to local and Government laws while also adhering to best practices related to conservation and protection. The Group has identified one location as an area of high biodiversity and large scale development has not been planned for the site in view of its environmental sensitivity.
Emissions, Effluents and Waste G4-EN15, EN22
The Group’s production plants have comprehensive environment management systems that enable individual plants to monitor emissions, effluents and waste. Reporting systems are now being put in place to streamline data and analyse the overall environmental impact in terms of emissions effluents and waste.
GHG emission tons 4,396
Total Water Discharged 200,275 m3
Special ProjectSave our SoilIn the wake of the ever increasing concern regarding the excessive use of fertilizer and chemicals in agriculture and the direct implications on farmers as well as consumer health, Cargills in partnership with the Ministry of Agriculture and the Department of Agriculture launched the ‘Save Our Soil’ Project in 2014.
The project functions under the theme, “Correct use of Agriculture inputs towards a prosperous and healthy nation”. The ‘Save Our Soil’ project aims to contribute towards the protection of Sri Lanka’s soil and water resources and enhance agriculture productivity through the prudent use of agriculture inputs by educating the farming community. To date more than 1300 farmers have been trained and their land tested to determine optimum levels of input usage. In 2016 Cargills will take SOS to a further 1,000 farmers in its network.
Fulfilling our purpose of nourishing people requires clean water, soil and air. As a food company, we are focused on a sustainable future that reduces demands on the environment as populations continue to grow.
Sustainability Report contd.

& 65Pg. 64
SocialLabor
Treating our team with dignity and respect and striving to create a safe work environment.
Company policy on Recruitment, Selection & PlacementIt is the company policy to recruit candidates as per the man power requirements derived through a focused and organized Human Resources Plan. All candidates will be impartially assessed on objective criterion notwithstanding of the race, gender, ethnicity, religion, language, or civil status as an Equal Employment Opportunity provider. Canvassing would be a disqualification, where priority will be given for the talented, qualified applicants with a good track record.
Applicants under the age of 18 years are not deployed in any area of operation.
Cargills is committed to attracting, developing and retaining a group of talented Team Members and to creating a workplace that allows each Team Member to contribute to the collective success of our company. Our programs and initiatives related to employment practices, compensation and benefits, talent management, diversity and inclusion, and Team Member relations are important to fulfilling this commitment, especially in today’s challenging economic climate.
Employees G4-LA1
Cargills provides employment to 8,738 persons at March 31, 2016. We are committed to providing a good working environment and to retaining our Team Members through competitive wages, fair treatment, training, benefits, and safe working conditions. We recognize that the nature of our industry and the
changing external environment means that retention of our team is a foremost challenge. This is a challenge that we seek to address by providing inspiration and motivation to our Team Members about their work, their contributions, and their company’s role in partnering the development of Sri Lanka and its people.
Type of Injuries G4-LA6
All Cargills manufacturing facilities have implemented Environmental, Health, and Safety Management Systems in line with statutory and ISO requirements. The health and safety aspect of this system fulfills the requirements set forth in international occupational health and safety management system specifications. As such, each facility has developed and implemented procedures and controls regarding health and safety. In the year concluded training on Occupational Health & Safety modules was carried out as part of the regular and continuous Training curriculum and calendar.
Policy on Health & SafetyThe management recognizes that they have a responsibility to ensure that all reasonable precautions are taken to provide and maintain working conditions, which are safe, healthy and comply with all statutory requirements and codes of practice related to the company’s activities.
The company will, so far as it is reasonably practicable, pay particular attention to:i. The provision and maintenance of
machinery, equipment and work system to be safe and healthy.
ii. Arrangements for ensuring safety and eliminating risks to safety and health in connection with use, handling, storage and transport of articles and substances.
Cargills is committed to attracting, developing and retaining a group of talented Team Members and to creating a workplace that allows each Team Member to contribute to the collective success of our company.
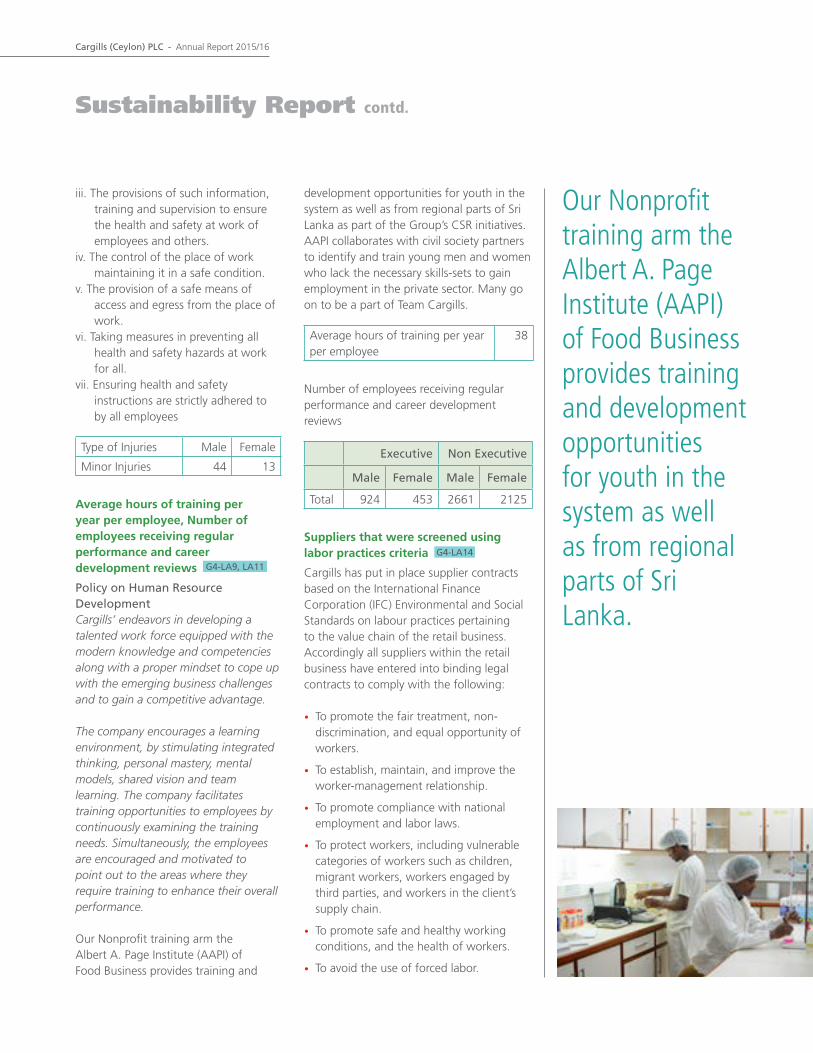
Pg. 66Cargills (Ceylon) PLC - Annual Report 2015/16
iii. The provisions of such information, training and supervision to ensure the health and safety at work of employees and others.
iv. The control of the place of work maintaining it in a safe condition.
v. The provision of a safe means of access and egress from the place of work.
vi. Taking measures in preventing all health and safety hazards at work for all.
vii. Ensuring health and safety instructions are strictly adhered to by all employees
Type of Injuries Male Female
Minor Injuries 44 13
Average hours of training per year per employee, Number of employees receiving regular performance and career development reviews G4-LA9, LA11
Policy on Human Resource DevelopmentCargills’ endeavors in developing a talented work force equipped with the modern knowledge and competencies along with a proper mindset to cope up with the emerging business challenges and to gain a competitive advantage.
The company encourages a learning environment, by stimulating integrated thinking, personal mastery, mental models, shared vision and team learning. The company facilitates training opportunities to employees by continuously examining the training needs. Simultaneously, the employees are encouraged and motivated to point out to the areas where they require training to enhance their overall performance.
Our Nonprofit training arm the Albert A. Page Institute (AAPI) of Food Business provides training and
development opportunities for youth in the system as well as from regional parts of Sri Lanka as part of the Group’s CSR initiatives. AAPI collaborates with civil society partners to identify and train young men and women who lack the necessary skills-sets to gain employment in the private sector. Many go on to be a part of Team Cargills.
Average hours of training per year per employee
38
Number of employees receiving regular performance and career development reviews
Executive Non Executive
Male Female Male Female
Total 924 453 2661 2125
Suppliers that were screened using labor practices criteria G4-LA14
Cargills has put in place supplier contracts based on the International Finance Corporation (IFC) Environmental and Social Standards on labour practices pertaining to the value chain of the retail business. Accordingly all suppliers within the retail business have entered into binding legal contracts to comply with the following:
• To promote the fair treatment, non-discrimination, and equal opportunity of workers.
• To establish, maintain, and improve the worker-management relationship.
• To promote compliance with national employment and labor laws.
• To protect workers, including vulnerable categories of workers such as children, migrant workers, workers engaged by third parties, and workers in the client’s supply chain.
• To promote safe and healthy working conditions, and the health of workers.
• To avoid the use of forced labor.
Our Nonprofit training arm the Albert A. Page Institute (AAPI) of Food Business provides training and development opportunities for youth in the system as well as from regional parts of Sri Lanka.
Sustainability Report contd.

& 67Pg. 66
Responsible to our society
Local CommunitiesOperations implemented local community engagement, impact assessments, and development programs G4-SO1
Operations with significant actual and potential negative impacts on local communities G4-SO2
Working directly with our partners to overcome challenges, providing knowledge and resources to help them succeed.
Our focus on rural development involves our direct investment in and engagement with the agriculture sector. Our investments have improved livelihoods for rural Sri Lankans in economically meaningful, environmentally sustainable and socially responsible ways. Today we are a global role model in corporate driven rural development. Each year, Cargills works directly with thousands of farmers and small scale entrepreneurs to help increase their productivity, thereby helping to raise their standard of living and increase our access to quality raw materials.
In 2015/16 Cargills enhanced its vegetable and fruit collection from farmer communities to 36.6Mn Kg returning Rs 2.8 Bn as revenue directly generated to small holder vegetables and fruit farmers connected to our collection centres in Nuwaraeliya, Bandarawela, Boralanda, Alaveddy- Jaffna, Thanamalwila, Thambuththegama, Ruwalwala, Norochcholai, Kilinochchi, Hanguranketha and Wattala.
In the year concluded the Group’s milk collection reached 36.8 Mn litres sourced from 22 chilling centres that connect to over 15,000 dairy farmers
who have achieved cumulative revenue of Rs 2.6 Bn during the year.
Cargills Saru BimaCargills through its direct sourcing of fresh produce from agriculture communities is well integrated with agriculture communities. Our team works directly with over 20,000 farmers to overcome challenges, providing knowledge and resources to help farmers succeed. Across Sri Lanka thousands of farmers have participated in Cargills productivity and product quality enhancing programs. Through this process we have introduced advanced post-harvest practices to farmers thereby reducing wastage from handling and transport.
In 2008 Cargills introduced a system wherein the company began to give back 50 cents for each kg of vegetables purchased from the Gangeyaya Thanamalwila area. In the first year no one believed that the 50 cents would have any significance and the collection was a mere Rs 900,000. From there on the concept was introduced to Boralanda, Ruwalwala, Jaffna and Kilinochchi collection centres and with time as Cargills market and volume grew the fund began to reach a substantial scale.
Today named the Cargills Sarubima fund, it provides scholarships for needy children from the community, to provide resources for learning and advancement, to provide farmer insurance and to meet community infrastructure needs. Our focus is to engage the communities that work with us to charter their own course of development. Therefore decisions on how collection would be disbursed are made jointly by Cargills and the Community.
Cargills through its direct sourcing of fresh produce from agriculture communities is well integrated with agriculture communities.

Pg. 68Cargills (Ceylon) PLC - Annual Report 2015/16
In the year concluded Cargills expanded the scope of Cargills Sarubima to contribute 50 cents back for every kilogram and litre of fresh produce sourced from our rural communities. Accordingly to date the fund has disbursed Rs 47.3 Mn to create value and opportunity for rural farmer communities islandwide.
Special ProjectsPartnership with SOLID, USAIDCargills together with SOLID a project by USAID initiated an 100 acre fruit cultivation project mobilizing 250 farmers from Mahavilachchiya, Anuradhapura and Kilinochchi wherein each farmer is supported to cultivate ½ acre of land with passion fruit.
Cargills has entered into a buy-back agreement with the participating farmers with a minimum price pre-agreed yet offering higher prices as market fluctuates. Cargills also provides extension services to the farmers to enhance product quality and productivity. SOLID under USAID facilitates technical training and assists with selected inputs such as micro irrigation systems and water pumps to manage water as well as other equipment required for passion fruit cultivation.
The project has brought about a total solution to needy farmers providing the market, technology and start up inputs which combined would have a sustainable impact on the livelihoods of the beneficiaries. With the project a commercial crop with tremendous potential is being popularized. Each farmer planning ½ acre of Passion Fruit will earn a minimum of Rs. 100,000 with a clear profit margin of Rs. 52,000 but because we offer the market rate farmers are enjoying even higher incomes. More importantly they would be using idle land during the dry season for productive use an additional income from intercropping.
Partnership with IFAD, NaDep and Presidential SecretariatIn line with the state policy of taking Sri Lankan towards self-sufficiency in milk Cargills collaborated with the Presidential Secretariat, National Agribusiness Development Programme (NADEP) funded by IFAD to launch an integrated effort to double milk production among 2700 dairy small and medium farmers.
Project Vision:More than 90% of Sri Lanka’s milk production is attributed to low-income earning small scale dairy farmers. The joint programme aims to enhance the dairy based livelihoods of 2700 small and medium farmers through an integrated approach of enhancing milk quality and animal productivity.
Project locations: • Kurunegala district • Jaffna district • Kandy district • Nuwara Eliya district • Mathale district • Puttlam district • Gampaha district
Strategic approach • Enhance milk production by 30-40% through night feeding
• Sustainable supply of water for animals during night time through well constructed cattle-sheds
• Maximize animal health and hygiene through scientifically designed cattle-sheds and thereby enhance production by 5-10%
• Introduce hybrid grass varieties towards increasing animal nutrition
• Introduce milking machines to enhance hygiene and take productivity up by 5-10%
• Provide refrigeration at affordable prices to encourage evening milk collection
Responsibility to our CustomersPercentage of product subject to labeling information requirements G4-PR3
Fostering a company wide culture that drives continuous improvement towards the safety and well-being of our Customers
As the leader in Retail and Consumer Goods in Sri Lanka our goal is to ensure that our customers enjoy the best possible products and services at the best possible price with minimum implications on the well being of all our stakeholders. Cargills uses its widespread retail and mass market distribution operation to provide essential commodities to consumers at a consistently affordable price. Cargills applies effort at every step in the process from where food is produced through where it is purchased to ensure we provide the safest and most high quality products and services to our customers. Our food processing plants are equipped with comprehensive ISO and SLS certification to ensure that our superior taste is complemented by superior safety and quality.
Managing Food Safety and QualityLabeling and consumer awarenessWe are fully committed to ensuring that consumers can make informed choices about health and nutrition. Full details about the ingredients and nutritional information for each of our products is shown on product packaging. We also ensure our products, ingredients, labeling and claims are safe, factual and always backed by scientific evidence and consistently comply with the Sri Lankan Regulations (Food Act).
Cargills approach to food safety and quality is comprehensive, preventive, and proactive. We implement controls and measures at every level to make
Sustainability Report contd.

& 69Pg. 68
sure our products are second-to-none in food safety and quality. We assess our products for improvement during product research and development, manufacturing and production, marketing and promotion, storage and distribution, and use. We believe this approach helps guarantee the safety and quality of our products from the farm all the way to the point of consumption.
Percentage of products covered by for compliance with product information and labelling
Safe use of the
product (%)
Disposal of the
product (%)
Complete list of ingredients in descending
order (%)
96 55 94
Systematic Management ApproachIn addition to governmental regulatory requirements, we have developed our own highly integrated policies, procedures, controls, and good manufacturing practices designed to ensure the safety and quality of our food products. Our system often extends beyond regulatory requirements to address such issues as facility sanitation, team member training, personal hygiene, product handling, food protection, foreign material prevention, product quality, storage, and transportation. All our manufacturing plants are accredited with ISO 9001:2000 for Quality Management, ISO 14001:2004 for Environment Management and ISO 22000: 2005 for Food Safety Management as well as SLS standards.
An audit of the Retail sector has been commenced with a view to comply with ISO14001 and OHSAS 18001 standards over a period of one year from the completion of the said audit.
Research, Development and InnovationCargills is dedicated to developing a best-in-class, value-added product portfolio that meets the needs of today’s changing market. By applying in-depth understanding of consumer and customer needs, analytical skills, and strategic thinking, we are positioned at the forefront of product innovation. We will continue to demonstrate our commitment to research and development by creating new and relevant food solutions for years to come.
Promoting National Nutrition and WellnessAs Sri Lanka’s foremost food retailing and fast moving consumer goods business, Cargills is conscious of its role in facilitating affordable nutrition for all Sri Lankans. While our research and development initiatives help us develop more nutritious products our sustainable supply chain ensures these products reach every part of Sri Lanka safely and at an affordable price. Our direct links with farming communities and entrepreneurs provide us the strength to bring essential commodities to consumers minus the intermediary costs. This is why our products at our retail outlets and from our manufacturing facilities are of better quality and more affordable.
Key initiativesThe Group is currently working towards setting specific nutrient criteria to guide our product development team. We work very closely with Sri Lankan Universities (Peradeniya University, Jayewardenepuraoura University, Uva Wellassa University) to secure expert knowledge and provide the healthiest products to consumers. Our focus is to utilize fresh Sri Lankan milk & natural fruits and vegetables rich in vitamins,
minerals & fiber in our product range as far as possible.
Consumer health and wellnessOur 2020 goal is to promote the health & wellbeing of Sri Lankans by promoting the reduced intake of • sugar • saturated fat • salt
Our research & development team is committed to delivering superior products containing recommended levels of sugar, salt and fat without compromising the unique taste attributes of our product range. They are constantly re-engineering our recipes to ensure our products are aligned with the nutrition expectations of our consumers while addressing the health challenges we face as a country.
Over the years our product development and quality assurance professionals have worked on our range of processed meats to maintain the most minimum possible levels of salt and additives that are cause for concern globally. We are evolving our product range in line with the emerging health concerns in Sri Lanka and would be looking to place greater emphasis on this aspect in the year ahead.
Management System ApproachThe Group’s management approach is to develop and market products and services that meet the highest quality standards which ensure the customer health and safety, relevant product and services labeling, ethical marketing and communication. Towards this end the Group adheres to the Food Act No 26 of 1980 and the regulations pertaining to Food (Labeling and Advertising) Regulations of 2005 and the Consumer Affairs Authority Act No 9 of 2003,

Pg. 70Cargills (Ceylon) PLC - Annual Report 2015/16
while our Food manufacturing facilities have obtained ISO 9001, 14001 and 22000 as well as SLS Standards certifications.
Responsible Business Practices G4-56
Our continued success depends on our strong foundation of Values and EthicsOur company founders believed a reputation for integrity was a key business differentiator. Cargills has earned and maintained a reputation for ethical business conduct ever since. Our business conduct is governed by a commitment to transparency and good governance. Cargills being a responsible corporate citizen complies with all governing laws and regulations and requires that every member of its team adheres to the law of the land and to internal rules and regulations.
Diversity and OpportunityAt the heart of the Cargills culture is the desire to embrace our differences and make connections across business units, at every location in every district across the island - so that each employee can reach their full potential. Our multi-cultural work environment is warm and equitable ensuring that each member of our team is valued for their capabilities and respected for who they are. We strive to create a happy and focused work atmosphere that celebrates the team and encourages innovation.
Our goal is to provide a workplace where all employees can thrive and grow - A workplace where employees feel included, safe and are given the opportunities to make valuable contributions to Cargills and thereby partner the progress of Sri Lanka.
In the year concluded Cargills provided employment to 02 physically challenged persons as well as hundreds of war-affected widows from the Northern region. The widows were recruited by making an exception to the standard recruitment policy of the Company in terms of the age limit. The move was made in view of our responsibility as a leading corporate to create livelihood opportunities where it is needed the most while not compromising on the commercial priorities of the businesses.
Employee VolunteerismCargills supports our employees to help build vibrant and stable communities where we live and work. We encourage employee volunteerism and leveraging of individual expertise to collaborate with the community towards its development and enhancement. All Business Units engage in localized philanthropic activities on a volunteer basis.
The flood disaster that shook Sri Lanka post the financial year under review was certainly a cause for deep heart ache. Many of our employees were badly impacted by the disaster and fortunate to suffer only material damages. While taking immediate steps to meet the needs of our own staff, emergency response teams from across disciplines were dispatched to all flood affected areas carrying dry food items for immediate consumption. Over a period of 48 hours assistance worth in excess of Rs 12 mn was dispatched with the support of volunteers from across the Group. Volunteers from across business sectors came together to overcome environmental challenges to reach those victims who needed our support the most.
Our multi-cultural work environment is warm and equitable ensuring that each member of our team is valued for their capabilities and respected for who they are.
Sustainability Report contd.

& 71Pg. 70
Non-discriminationThe Group does not tolerate any incidents of discrimination based on gender, age, ethnicity, religion or due to any other social or cultural differences. There have been no incidents of discrimination reported during the year.
Freedom of association and collective bargainingThe Company does not curtail the freedom of association of employees. Management is committed for discussions and negotiations with the employees who are unionized. Further open door policy is encouraged. There are two unions under which three companies have been unionized.
Human Rights and Child LaborAs part of this ongoing commitment the Group advocates and upholds decent work practices and human rights. Cargills does not engage child labour and does not employ any person under the age of 18 years at our workplaces. This is inbuilt into the policies and procedures of the Group.
Forced and compulsory labourThe Company does not deploy forced or compulsory labour. With regard to training where training costs are substantial, employees are made aware of the importance of serving the organization for a reasonable period in view of the valuable training received. Employees who work beyond their allotted hours are duly compensated by means of overtime and also supported with meals and transport in compliance with applicable laws and industry practices.
HarassmentIt is the Cargills policy to maintain a workplace free of sexual harassment, including unwelcome sexual advances, intimidation and other action
that create a hostile or offensive environment. Further no employees may condone or take any action which fosters or creates a hostile environment for colleagues.
Anti-CorruptionCargills upholds the distinction of being among the most respected Corporate Citizens in the country and therefore places the highest value on ethical business and has a zero-tolerance policy towards bribery and corruption.
Cargills is committed to not paying or receiving bribes and not participating in any other unethical, fraudulent or corrupt practice. The Group is dedicated to honoring all business obligations that we undertake with absolute integrity and maintain our business records in a manner that accurately reflects the true nature of our business transactions. All executives are bound by the signed code of conduct to not accept or offer any form of bribe or gift that may be construed as a bribe. Executives are also issued Official Memorandums in this regard during festive seasons to mitigate any risks and clarify any doubt pertaining to accepting gifts from suppliers.
Insider TradingTrading company’s shares or other securities by individuals who have access to information which are not publicly available is strictly prohibited as it can potentially affect the Cargills share price and future businesses. Non-compliance may not only entail disciplinary sanctions, but also result in criminal charges.
Governing LawsEmployees are individually and collectively obliged to ensure that Cargills business is conducted in full compliance with all applicable laws and regulations of the country.
Cargills supports our employees to help build vibrant and stable communities where we live and work.

Pg. 72Cargills (Ceylon) PLC - Annual Report 2015/16
G4 Content IndexGeneral Standard Disclosures
Indicator Disclosure Page Number
1. Strategy and Analysis
G4-1 Chairman's Statement 17 - 23
2. Organisaion Profile
G4-3 Name of the Organisaion 03
G4-4 Primary brands, products and services 07 - 15
G4-5 Location of the organisation's headquarters 03
G4-6 Countries where the organisaion operates 07
G4-7 Nature of ownership and legal form Inner Back Cover
G4-8 Markets served 27 - 37
G4-9 Scale of the reporting organisaion 07 - 15
G4-10 Employee Profile 65
G4-12 Supply chain of the organisaion 62
G4-13 Significant changes during the reporting period 03
G4-14 Precautionary approach or principle 49 -57
G4-15 Externally developed economic, enviromental, and social charters, principles, or other initiatives to which the organisaion subscribes or which it endorses
60
G4-16 Memberships of associations 60
3. Identified Material Aspects and Boundaries
G4-17 Organisation's entities covered and not covered by the report 03
G4-18 Defining the report content and the Aspect Boundaries 03, 61
G4-19 Material Aspects 61
G4-20 Aspect boundary for identified material aspects within the organisaion 61
G4-21 Aspect bounday for identified material aspects outside the organisaion 61
G4-22 Effect of any restatements of information provided in previous reports, and the reason for such restatements
03
G4-23 Significant changes from previous reporting periods in the Scope and Aspect Boundaries 03
Sustainability Report contd.
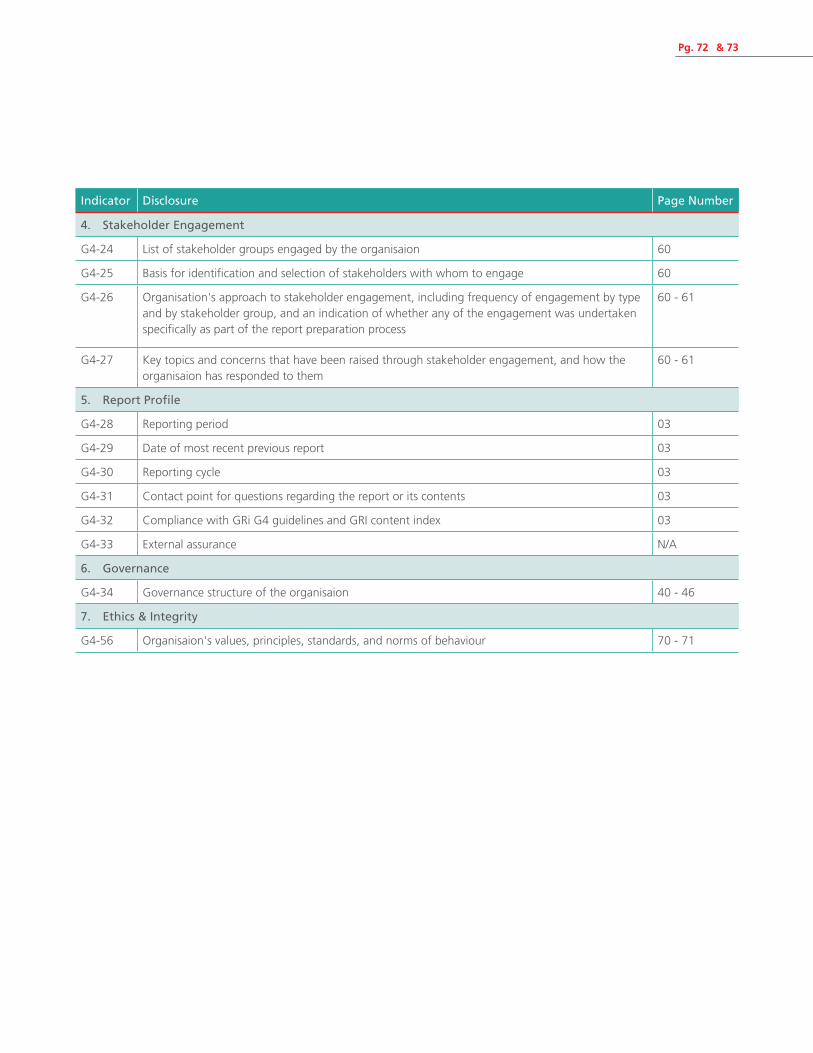
& 73Pg. 72
Indicator Disclosure Page Number
4. Stakeholder Engagement
G4-24 List of stakeholder groups engaged by the organisaion 60
G4-25 Basis for identification and selection of stakeholders with whom to engage 60
G4-26 Organisation's approach to stakeholder engagement, including frequency of engagement by type and by stakeholder group, and an indication of whether any of the engagement was undertaken specifically as part of the report preparation process
60 - 61
G4-27 Key topics and concerns that have been raised through stakeholder engagement, and how the organisaion has responded to them
60 - 61
5. Report Profile
G4-28 Reporting period 03
G4-29 Date of most recent previous report 03
G4-30 Reporting cycle 03
G4-31 Contact point for questions regarding the report or its contents 03
G4-32 Compliance with GRi G4 guidelines and GRI content index 03
G4-33 External assurance N/A
6. Governance
G4-34 Governance structure of the organisaion 40 - 46
7. Ethics & Integrity
G4-56 Organisaion's values, principles, standards, and norms of behaviour 70 - 71

Pg. 74Cargills (Ceylon) PLC - Annual Report 2015/16
Specific Standard Disclosures
Indicator Disclosure Page Number
1. Economic
Economic Performance
G4-EC1 Direct economic value generated 146
Economic value distributed 146
Payments to providers of capital 146
Payments to government 146
Economic value retained 146
Indirect Economic Impact
G4-EC8 Identified positive and negative indirect economic impacts, significance of the impact 63
Procurement Practices
G4-EC9 Proportion of spending on local suppliers at significant locations of operation 63
2. Environmental
Energy
G4-EN3 Energy consumption 64
Water
G4-EN8 Water consumption 64
Biodiversity
G4-EN11 Organisation's strategy for achieving its policy on biodiversity management 64
Information on operational sites owned, leased, managed in, or adjacent to, protected areas and areas of high biodiversity value outside protected areas
64
Emission
G4-EN15 Direct Green House Gas (GHG) emission (scope 1) 64
Water
G4-EN22 Total water discharge by quality and destination 64
Sustainability Report contd.

& 75Pg. 74
Indicator Disclosure Page Number
3. Social
Labour Practices and Decent Work
Employment
G4-LA1 Employee Profile 65
Occupational Health and Safety
G4-LA6 Total number of injuries 66
Training and Education
G4-LA9 Average hours of training per year per employee 66
G4-LA11 Number of employees receiving regular performance and career development reviews, 66
Supplier Assessment for Labor Practices
G4-L14 Suppliers that were screened using labor practices criteria 66
Society
Local Communities
G4-SO1 Operations implemented local community engagement, impact assessments, and development programs
67
G4-SO2 Operations with significant actual and potential negative impacts on local communities 67
Product Responsibility
Product and Service Labelling
G4-PR3 Percentage of product subject to product information and labelling information requirements 68

Pg. 76Cargills (Ceylon) PLC - Annual Report 2015/16
Our focus is to engage the communities that work with us to charter their own course of development.

& 77Pg. 77

Pg. 78Cargills (Ceylon) PLC - Annual Report 2015/16
Financial Report Annual Report of the Directors’ on the
Affairs of the Company 79
Statement of Directors’ Responsibilities 82
Independent Auditors’ Report 83
Statement of Profit or Loss and
Other Comprehensive Income 84
Statement of Financial Position 85
Statement of Changes in Equity 86
Statement of Cash Flow 88
Notes to the Financial Statements 90

& 79Pg. 78
Annual Report of the Directors’ on the Affairs of the Company
The Directors are pleased to submit the Annual Report together with the audited financial statements of Cargills (Ceylon) PLC and consolidated
audited financial statements of the Group for the year ended 31 March 2016 which were approved by the Board of Directors on 09th June 2016.
Review of the Year
The Chairman's statement describes in brief the Group's affairs and important events of the year.
Activities
Manufacturing of and Trading in Food and Beverage and Distribution are the principal activities of the Group of companies. During the year there
were no significant changes in the principal activities of the Group.
The Group:
a) Operates a chain of supermarkets and convenience stores
b) Distributes world renowned brands of beverages and other FMCG products.
c) Manufactures/produces/processes and markets processed meats, dairy ice cream, yoghurt, cheese, milk, jams, cordials, sauces, and biscuits.
d) Operates the 'Kentucky Fried Chicken' and 'TGIF' franchise restaurants in Sri Lanka
e) Operates a Hotel in the hill-country.
Financial Statements
The audited financial statements comprising the Statements of Profit or Loss and Other Comprehensive Income , Statements of Financial Position,
Statements of Changes in Equity, Statements of Cash Flow and Notes to the financial Statements of the Company and the Group for the financial
year ended 31 March 2016 given on pages 84 to 145 form an integral part of the Annual Report of the Board.
Auditors’ Report
The auditors’ report is set out on page 83.
Accounting Policies
The accounting policies adopted in the preparation of the financial statements are given on the pages 90 to 103.
Results and Dividends Group Company
2016 2015 2016 2015
For the year ended 31st March Rs. '000 Rs. '000 Rs. '000 Rs. '000
Profit for the year after taxation amounted to 1,690,581 599,978 779,182 72,343
After deducting the amount attributable to non controlling interest of (66,595) (23,799) - -
The profit attributable to shareholders was 1,623,986 576,179 779,182 72,343
To which profit brought forward from previous year is added 6,885,400 4,548,548 5,214,851 3,066,191
Super gain tax (55,898)
Adjustment resulted in increase of subsidiary share holdings - (63,129) - -
Other comprehensive income (17,507) (28,563) 4,212 (15,242)
Transfer to general reserve - - - -
Change in ownership interest that do 'not result in loss of control - 2,216,160 - -
Reversal of subsidiary dividend (170) - - -
Transfer from revaluation reserve of 'subsidiary disposed - 84,521 - -
Transfer from revaluation reserve - - - 2,539,559
Equity accounted investee share of Goodwill on change - (316) - -
Leaving an amount available to the Company for appropriation of 8,435,811 7,333,400 5,998,245 5,662,851

Pg. 80Cargills (Ceylon) PLC - Annual Report 2015/16
Results and Dividends Group Company
2016 2015 2016 2015
For the year ended 31st March Rs. ‘000 Rs. ‘000 Rs. ‘000 Rs. ‘000
From which your directors have made appropriation as follows:
Dividend paid for the year ended 31st March 2015
Final Rs.1.30 per share applicable to Financial Year 2013/14 - 291,200 - 291,200
Interim Rs. 0.70 Cents per share for Financial Year 2014/15 - 156,800 - 156,800
Dividend paid for the year ended 31st March 2016
Final Rs. 1.30 per share applicable to Financial Year 2014/15 291,200 - 291,200 -
Interim Rs. 1.25 Cents per share for Financial Year 2015/16 280,000 - 280,000 -
Leaving an unappropriated balance to be carried forward of 7,864,611 6,885,400 5,427,045 5,214,850
An interim dividend of 1.25 cents per share (Rs.280 Mn) was paid on 13th January 2016 for the year ended 31st March 2016. A final dividend of Rs. 2.25 per share (Rs. 504 Mn) is proposed for the year ended 31st March 2016. This will be reflected in the subsequent year's financial statements. (refer note 34 to the financial statements on page 137)
ReservesAfter the above mentioned appropriations, the total reserves of the Group stands at Rs 13,991 Mn (2015 – Rs. 12,412 Mn), while the total reserves of the Company stand at Rs. 9,274 Mn. (2015- Rs. 9,003 Mn ).
Stated CapitalStated Capital of the company as at 31st March 2016 was Rs.131 Mn. The detail of the stated capital is given in note 22 to the financial statements on page 123.
Capital ExpenditureThe Group's capital outlay on property, plant and equipment amounted to Rs. 2,265 Mn (2015 - Rs. 1,788 Mn) while the capital outlay of the Company on property, plant and equipment amounted to Rs. 37.4 (2015 - Rs. 33.3 Mn). Details are given in note 13 to the financial statements on pages 112 and 113.
The movement of property, plant and equipment during the year is given in note 13 to the financial statements on pages 112 and 113.
Investment PropertyThe carrying value of land and building classified as investment property of the Company and the Group as at 31st March 2016 amounted to Rs. 5,443 Mn and Rs. 3,543 Mn respectively. Details of investment property held by the Group and the company are disclosed in note 14 to the Financial Statements.
Market Value of PropertiesThe land and buildings of the group were revalued as at 31st March 2016. Details are given in note 13 to the financial statements on pages 112 and 113 The Directors are of the opinion that the revalued amounts are not in excess of the current market values of such properties.
The portfolio of the revalued land and buildings are given on page 148 in the financial statements.
ShareholdingsThe Company is a subsidiary of C T Holdings PLC and there were 1,877 registered shareholders as at 31st March 2016 (31st March 2015 - 1,901).
An analysis of shareholdings according to the size of holding and the names of the 20 largest shareholders is given on page 149 and 150.
DirectorateThe Directors listed on the inner back cover have been directors of the company throughout the year under review.
Messrs S. V. Kodikara and J. C. Page retire by rotation in terms of the Company’s Articles of Association and being eligible offer themselves for re-election.
Annual Report of the Directors’ on the Affairs of the Company contd.

& 81Pg. 80
Messrs. A. T. P. Edirisinghe, Sunil Mendis, and E. A. D. Perera too are due to retire in terms of Section 210 (2) (a) and (b) of the Companies Act No. 7 of 2007 having attained the age of seventy years, and offer themselves for re-election in terms of Section 211 (1) and (2) of the Companies Act No. 7 of 2007.
The re-election of the retiring Directors has the unanimous support of the other Directors.
Directors’ RemunerationThe remuneration of the directors is given in note 35.1 on page 137 to the consolidated financial statements.
Directors’ Interests in ContractsDirectors’ interests in transactions of the company are disclosed in note 35.2 to the financial statements on pages 137 to 138 and have been declared at meetings of the directors. The directors have had no direct or indirect interest in any other contracts in relation to the business of the company.
Interests RegisterThe company maintains an Interests Register conforming to the Provisions of the Companies Act No. 07 of 2007.
Directors’ shareholdingsThe Directors' shareholdings in the Company were as follows:
As at 31st March 2016 2015
Mr. L R Page 36,760 36,760
Mr. V R Page 14,961,900 14,443,900
Mr. M I Abdul Wahid 4,000 4,000
Mr. S V Kodikara 124,000 124,000
Mr. P S Mathavan 500 500
Mr. A T P Edirisinghe 50,000 50,000
Mr. S E C Gardiner 20,000 20,000
Mr. Sunil Mendis 20,000 20,000
Mr. Anthony A Page 276,157 276,157
Mr. J C Page 455,000 1,255,000
Mr. E A D Perera 10,000 10,000
DonationsDuring the year donations amounting to Rs. 3,450,000 were made by the Company.
AuditorsMessrs. KPMG are deemed re-appointed as Auditors at the Annual General Meeting of the company in terms of Section 158 of the Companies Act No. 07 of 2007. The directors have been authorized to determine the remuneration of the Auditors and the fee paid to the Auditors are disclosed in note 08 to the financial statements on page 105. As far as the directors are aware, the auditors do not have any relationship (other than that of an auditor) with the company or any of its subsidiaries other than those disclosed in the above note.
Events after the Reporting periodEvents after the Reporting period of the Company are given in note 34 to the financial statements on page 137.
Statutory PaymentsAll statutory payments due to the Government of Sri Lanka and on behalf of employees have been made or accrued for the reporting date.
Future DevelopmentsThe Chairman’s message describes the future developments of the Group.
Environmental ProtectionAfter making adequate enquiries from the management, the directors are satisfied that the company and its subsidiaries operate in a manner that minimizes the detrimental effect on the environment and provide products and services that have a beneficial effect on the customers and the communities within which the Group operates.
Going ConcernThe directors have adopted the Going Concern Basis in preparing these financial statements. After making enquiries from the management, the directors are satisfied that the Group has adequate resources to continue its operations in the foreseeable future.
For and on behalf of the Board
(Signed)M. I. Abdul WahidManaging Director/Deputy CEO
(Signed)Sidath KodikaraDirector
(Signed)Sarath DissanayakeCompany Secretary
09th June 2016

Pg. 82Cargills (Ceylon) PLC - Annual Report 2015/16
Statement of Directors’ Responsibilities
The Companies Act No. 7 of 2007 places the responsibility on the Directors to prepare and
present financial statements for each year comprising a Statement of Financial Position as at
year end date and Statements of Profit or Loss and Other Comprehensive income, Cash Flows
Statement and Statement of Changes in Equity for the year together with the accounting
policies and explanatory notes. The responsibility of the Auditors with regard to these financial
statements, which differ from that of the Directors, is set out in the Auditors’ Report on page 83.
Considering the present financial position of the Company and of the Group and the forecasts
for the next year, the Directors have adopted the going concern basis for the preparation of
these financial statements.
The Directors confirm that the financial statements have been prepared and presented
in accordance with the Sri Lanka Accounting Standards (SLFRSs/LKASs) which have been
supported by reasonable and prudent judgments and estimates.
The Directors are responsible for ensuring that the Company and the Group maintain adequate
accounting records to be able to disclose with reasonable accuracy, the financial position of
the Company and the Group and for ensuring that the financial statements are prepared and
presented in accordance with the Sri Lanka Accounting Standards and provide the information
required by the Companies Act and the Listing Rules of the Colombo Stock Exchange.
The Directors are responsible for the proper management of the resources of the Company
and of the Group. The internal control system has been designed and implemented to
obtain reasonable but not absolute assurance that the Company and the Group is protected
from undue risks, frauds and other irregularities. The Directors are satisfied that the control
procedures operated effectively during the year.
The Directors are required to provide the Auditors with every opportunity to carry out any
reviews and tests that they consider appropriate and necessary to carry out their responsibilities.
The responsibility of the Independent Auditors in relation to the financial statements is set out
in the Independent Auditors’ Report.
The Directors, to the best of their knowledge and belief, are satisfied that all statutory
payments have been made up to date or have been provided for in these financial statements.
By order of the Board
(Signed)
Sarath Dissanayake
Company Secretary
09th June 2016

& 83Pg. 82
Independent Auditors’ Report
TO THE SHAREHOLDERS OF CARGILLS (CEYLON) PLC
Report on the Financial Statements
We have audited the accompanying
financial statements of Cargills (Ceylon) PLC,
(“the Company”), and the consolidated
financial statements of the Company and its
Subsidiaries (“the Group”), which comprise
the statement of financial position as at
March 31, 2016, and the statements of
profit or loss and other comprehensive
income, changes in equity and, cash flows
for the year then ended, and a summary
of significant accounting policies and other
explanatory information set out on pages 84
to 145 of the annual report.
Board’s Responsibility for the Financial
Statements
The Board of Directors (“Board”) is
responsible for the preparation of these
financial statements that give a true and
fair view in accordance with Sri Lanka
Accounting Standards, and for such internal
control as Board determines is necessary
to enable the preparation of financial
statements that are free from material
misstatement, whether due to fraud or error.
Auditors’ Responsibility
Our responsibility is to express an opinion
on these financial statements based on our
audit. We conducted our audit in accordance
with Sri Lanka Auditing Standards. Those
standards require that we comply with
ethical requirements and plan and perform
the audit to obtain reasonable assurance
about whether the financial statements are
free from material misstatement.
An audit involves performing procedures to
obtain audit evidence about the amounts
and disclosures in the financial statements.
The procedures selected depend on the
auditors’ judgment, including the assessment
of the risks of material misstatement of the
financial statements, whether due to fraud
or error. In making those risk assessments,
the auditor considers internal control relevant
to the entity’s preparation of the financial
statements that give a true and fair view in
order to design audit procedures that are
appropriate in the circumstances, but not
for the purpose of expressing an opinion
on the effectiveness of the entity’s internal
control. An audit also includes evaluating
the appropriateness of accounting policies
used and the reasonableness of accounting
estimates made by Board, as well as
evaluating the overall presentation of the
financial statements.
We believe that the audit evidence we have
obtained is sufficient and appropriate to
provide a basis for our audit opinion.
Opinion
In our opinion, the consolidated financial
statements give a true and fair view of the
financial position of the Group as at March
31, 2016, and of its financial performance
and cash flows for the year then ended
in accordance with Sri Lanka Accounting
Standards.
Report on Other Legal and Regulatory
Requirements
As required by section 163 (2) of the
Companies Act No. 07 of 2007, we state the
following:
a) The basis of opinion and scope and
limitations of the audit are as stated
above.
b) In our opinion:
• we have obtained all the information
and explanations that were required
for the audit and, as far as appears
from our examination, proper
accounting records have been kept by
the Company,
• The financial statements of the
Company, give a true and fair view of
its financial position as at March 31,
2016, and of its financial performance
and cash flows for the year then
ended in accordance with Sri Lanka
Accounting Standards.
• The financial statements of the
Company, and the Group comply with
the requirements of sections 151 and
153 of the Companies Act No. 7 of
2007.
(Signed)
CHARTERED ACCOUNTANTS
Colombo
9th June 2016

Pg. 84Cargills (Ceylon) PLC - Annual Report 2015/16
Statement of Profit or Loss and Other Comprehensive Income
Group Company
For the year ended 31st March 2016 2015 2016 2015 Note Rs. '000 Rs. '000 Rs. '000 Rs. '000
Continuing operationsRevenue 4 71,441,850 61,631,285 33,623 153,075Cost of sales 5 (63,463,346) (55,983,822) (28,603) (145,038)Gross profit 7,978,504 5,647,463 5,020 8,037Other income 6 1,549,258 1,426,917 1,618,485 2,039,546Distribution expenses (2,305,334) (2,040,965) (14,376) (21,892)Administrative expenses (3,361,990) (2,895,856) (523,567) (612,228)Other expenses (397,425) (565,771) (74,086) (875,292)Results from operating activities 3,463,013 1,571,788 1,011,476 538,171Net finance costs 7 (604,144) (832,127) (194,518) (491,733)Changes in fair value of investment property 14 53,016 65,190 62,059 97,836Share of loss of equity accounted investees and gain on dilution of equity accounted investee 16.5 (25,877) (198) - -Profit before taxation 8 2,886,008 804,653 879,017 144,274Income tax expense 9 (1,195,427) (557,436) (99,835) (71,931)Profit for the year from continuing operations 1,690,581 247,217 779,182 72,343
Discontinued operations Profit from discontinued operations, net of tax 10.2.(a) - 352,761 - -Profit for the year 1,690,581 599,978 779,182 72,343
Other comprehensive income (OCI)Revaluation of property plant and equipment 13 921,100 - 65,849 -Net gain/(loss) on available-for-sale investments 16.3.1 (8,570) 903 (8,526) 811Actuarial gain/(loss) on employee benefits 28.4 (22,743) (39,517) 5,850 (21,169)Equity accounted investee - share of OCI and share of OCI of gain on dilution of equity accounted investee 16.5 (2,164) (1,189) - -Tax on other comprehensive income 18 (10,917) 10,931 166 5,927Other comprehensive income for the year, net of tax 876,706 (28,872) 63,339 (14,431)Total comprehensive income for the year 2,567,287 571,106 842,521 57,912
Profit attributable to:Equity shareholders of the parent 1,623,986 576,179 779,182 72,343Non-controlling interest 66,595 23,799 - -Profit for the year 1,690,581 599,978 779,182 72,343
Total comprehensive income attributable to: Equity shareholders of the parent 2,483,440 548,519 842,521 57,912Non-controlling interest 83,847 22,587 - -Total comprehensive income for the year 2,567,287 571,106 842,521 57,912
Earnings per shareBasic (Rs.) 11 7.25 2.57 3.48 0.32Diluted (Rs.) 11 7.25 2.57 3.48 0.32
Earnings per share - Continuing operations Basic (Rs.) 11 7.25 0.99 3.48 0.32Diluted (Rs.) 11 7.25 0.99 3.48 0.32
Figures in brackets indicate deductions The accounting policies and notes from pages 90 to 145 form an integral part of these financial statements.

& 85Pg. 84
Statement of Financial Position
Financial Reports
Group CompanyAs at 31st March 2016 2015 2016 2015 Note Rs. '000 Rs. '000 Rs. '000 Rs. '000
ASSETSNon-current assets Property, plant and equipment 13 20,266,084 18,833,894 2,981,795 2,929,927Investment property 14 3,543,564 3,490,548 5,443,351 4,855,900Intangible assets 15 1,077,423 1,035,732 - -Investments in subsidiaries 16.1 - - 1,773,945 1,773,945Investment in associates 16.2 2,305,653 1,093,699 2,325,378 1,087,503Prepayment on leasehold land and building 17 24,500 25,374 - -Deferred tax assets 18 62,642 74,742 - -Total non-current assets 27,279,866 24,553,989 12,524,469 10,647,275
Current assets Inventories 19 7,194,778 6,217,584 9,986 29,218Trade and other receivables 20 3,571,892 3,094,346 633,499 632,628Amount due from related companies 21 1,015,944 957,133 1,294,595 2,946,040Other financial assets 16.3.2 1,004,306 923,828 57,360 34,715Cash and cash equivalents 25 2,144,349 1,671,542 203,816 11,313Total current assets 14,931,269 12,864,433 2,199,256 3,653,914Total assets 42,211,135 37,418,422 14,723,725 14,301,189
EQUITYStated capital 22 130,723 130,723 130,723 130,723Other equity 23 (2,251,743) (1,974,311) - -Reserves 24 8,377,688 7,500,727 3,847,002 3,787,875Retained earnings 7,864,611 6,885,400 5,427,045 5,214,851Total equity attributable to equity holders of the parent 14,121,279 12,542,539 9,404,770 9,133,449Non-controlling interest 383,539 336,608 - -Total equity 14,504,818 12,879,147 9,404,770 9,133,449
LIABILITIESNon - current liabilities Borrowings 26 198,300 730,922 - -Deferred tax liability 18 777,550 569,951 155,370 141,711Deferred income 27 84,863 96,344 - -Employee benefits 28 638,004 520,802 255,724 225,571Put liability 23 2,251,743 1,974,311 - -Total non-current liabilities 3,950,460 3,892,330 411,094 367,282
Current liabilities Trade and other payables 29 10,937,305 8,085,105 382,882 433,849Current tax liability 1,472,988 915,676 109,872 273,150Amount due to related companies 21 3,622 - 38,892 128,569Dividends payable 30 32,715 27,773 32,192 27,404Borrowings 26 11,309,227 11,618,391 4,344,023 3,937,486Total current liabilities 23,755,857 20,646,945 4,907,861 4,800,458Total liabilities 27,706,317 24,539,275 5,318,955 5,167,740Total equity and liabilities 42,211,135 37,418,422 14,723,725 14,301,189
Figures in brackets indicate deductions.The accounting policies and notes from pages 90 to 145 form an integral part of these financial statements.
I certify that the financial statements have been prepared in accordance with the requirements of the Companies Act No. 7 of 2007.
(Signed)Dilantha JayawardhanaGroup Chief Financial Officer
The Board of Directors is responsible for the preparation and presentation of these financial statements. Signed for and on behalf of the Board.
(Signed) (Signed)M. I. Abdul Wahid Sidath KodikaraManaging Director/Deputy CEO Director
09th June 2016 Colombo

Pg. 86Cargills (Ceylon) PLC - Annual Report 2015/16
Attributable to equity holders of parent Non
Stated Capital Revaluation General Available for Other Retained Total controlling Total
capital reserve reserve reserve sale reserve equity earnings interest
Group Rs. ‘000 Rs. ‘000 Rs. ‘000 Rs. ‘000 Rs. ‘000 Rs. ‘000 Rs. ‘000 Rs. ‘000 Rs. ‘000 Rs. ‘000
Balance as at 1 April 2014 130,723 7,928 7,107,668 485,500 (16,751) - 4,548,548 12,263,616 45,946 12,309,562Total comprehensive income Profit for the year - - - - - - 576,179 576,179 23,799 599,978Other comprehensive income - - - - 903 - (28,563) (27,660) (1,212) (28,872)Total comprehensive income - - - - 903 - 547,616 548,519 22,587 571,106
Transactions with owners of the company, recognised directly in equityPut option over non controlling interest (note 23) - - - - - (1,974,311) - (1,974,311) - (1,974,311)Transfer of revaluation reserve of subsidiary disposed - - (84,521) - - - 84,521 - - -Change in ownership interest that do not result in loss of control (note 16.1.1) - - - - - - 2,216,160 2,216,160 321,090 2,537,250Equity accounted investee share of Goodwill on change in shareholding - - - - - - (316) (316) - (316)Adjustment resulted in increase of subsidiary shareholding (note 16) - - - - - - (63,129) (63,129) (53,015) (116,144)Dividends - - - - - - (448,000) (448,000) - (448,000)Balance as at 31 March 2015 130,723 7,928 7,023,147 485,500 (15,848) (1,974,311) 6,885,400 12,542,539 336,608 12,879,147
Balance as at 1 April 2015 130,723 7,928 7,023,147 485,500 (15,848) (1,974,311) 6,885,400 12,542,539 336,608 12,879,147Super Gain tax * - - - - - - (55,898) (55,898) (1,890) (57,788)Adjusted balance as at 1 April 2015 130,723 7,928 7,023,147 485,500 (15,848) (1,974,311) 6,829,502 12,486,641 334,718 12,821,359
Total comprehensive income Profit for the year - - - - - - 1,623,986 1,623,986 66,595 1,690,581Other comprehensive income - - 885,531 - (8,570) - (17,507) 859,454 17,252 876,706Total comprehensive income - - 885,531 - (8,570) - 1,606,479 2,483,440 83,847 2,567,287
Transactions with owners of the company, recognised directly in equity Put option over non controlling interest (note 23) - - - - - (277,432) - (277,432) - (277,432)Deferred tax on revaluation - - - - - Dividends - - - - - - (571,370) (571,370) (35,026) (606,396)Balance as at 31 March 2016 130,723 7,928 7,908,678 485,500 (24,418) (2,251,743) 7,864,611 14,121,279 383,539 14,504,818
* As per the provisions of Part III of the Finance Act, No. 10 of 2015, which was certified on 30th October 2015, the Group is liable for Super Gain Tax of Rs. 57.8 Mn. According to the Act, the Super Gain Tax was deemed to be expenditure in the Financial Statements relating to the year of assessment which commenced on 1st April 2013. The Act supersedes the requirements of the Sri Lanka Accounting Standards; hence the expense of Super Gain Tax is accounted in accordance with the requirements of the said Act as recommended by the Statement of Alternative Treatment (SoAT) on Accounting for Super Gain Tax issued by the Institute of Chartered Accountants of Sri Lanka, dated 24th November 2015.
The figures in brackets indicate deductions.
The accounting policies and notes from pages 90 to 145 form an integral part of these financial statements.
Statement of Changes in Equity

& 87Pg. 86
Stated Revaluation General Available for Retained Total
capital reserve reserve sale reserve earnings
Company Rs. ‘000 Rs. ‘000 Rs. ‘000 Rs. ‘000 Rs. ‘000 Rs. ‘000
Balance as at 1 April 2014 130,723 5,857,818 485,500 (16,695) 3,066,191 9,523,537
Total comprehensive income
Profit for the year - - - - 72,343 72,343
Other comprehensive income - - - 811 (15,242) (14,431)
Total comprehensive income - - - 811 57,101 57,912
Transactions with owners of the company,
recognised directly in equity
Transfer of revaluation reserve - (2,539,559) - - 2,539,559 -
Dividends - - - - (448,000) (448,000)
Balance as at 31 March 2015 130,723 3,318,259 485,500 (15,884) 5,214,851 9,133,449
Balance as at 1 April 2015 130,723 3,318,259 485,500 (15,884) 5,214,851 9,133,449
Total comprehensive income
Profit for the year - - - - 779,182 779,182
Other comprehensive income - 67,653 - (8,526) 4,212 63,339
Total comprehensive income - 67,653 - (8,526) 783,394 842,521
Transactions with owners of the company,
recognised directly in equity
Transfer of revaluation reserve - - -
Dividends - - - - (571,200) (571,200)
Balance as at 31 March 2016 130,723 3,385,912 485,500 (24,410) 5,427,045 9,404,770
The figures in brackets indicate deductions.
The accounting policies and notes from pages 90 to 145 form an integral part of these financial statements.

Pg. 88Cargills (Ceylon) PLC - Annual Report 2015/16
Group Company
For the year ended 31 March 2016 2015 2016 2015
Note Rs. '000 Rs. '000 Rs. '000 Rs. '000
Cash flows from operating activities
Profit before taxation
- Continuing operations 2,886,008 804,653 879,017 144,274
- Discontinuing operations - 352,761 - -
Adjustments for:
Depreciation 13 1,682,156 1,637,996 35,965 45,858
Employee benefits 28 118,748 102,813 45,643 43,706
Amortization of intangible assets 15 36,254 20,536 - -
Amortisation of prepayment on leasehold land and building 17 874 876 - -
Gain on disposal of trademark - (3,330,000) - -
Amortisation of deferred income 27 (11,481) (12,181) - -
Profit on sale of property, plant and equipment 6 (24,846) (16,143) (3,475) (625,181)
Change in fair value of investment property 14 (53,016) (65,190) (62,059) (97,836)
Impairment of property plant and equipment 13 922 42,929 - -
Change in assets held for sale - - - 136,158
Inventory write-off - 99,667 - -
Reversal of provision for inventories 19 (19,838) (25,087) - -
Provision for/(reversal) of provision for doubtful debtors 20 4,418 (17,722) (1,500) 5,573
Net finance costs 7 604,144 965,526 194,518 491,733
Dividend income 6 (720) (811) (827,104) (514,478)
Loss on disposal of investment 10.2.(f) - - - 655,977
Loss on disposal of Subsidiary - 2,113,126 - -
Impairment of investment in associate 16.5 36,005 180,909 38,125 37,310
Share of associate results and Gain on dilution
of investment in associate 16.5 25,877 198 - -
Operating profit before working capital changes 5,285,505 2,854,856 299,130 323,094
Changes in working capital
- (Increase) / decrease in inventories (957,356) (174,732) 19,232 (13,075)
- (Increase) / decrease in trade and other receivables (481,967) 239,495 629 (8,597)
- (Increase) / decrease in related company receivables (58,811) (799,684) 1,651,446 9,704,109
- Increase / (decrease) in trade and other payables 2,852,200 (6,358) (50,969) (281,131)
- Increase / (decrease) in related company payables 3,622 (20,429) (89,677) (850,886)
Cash generated from operations 6,643,193 2,105,864 1,829,791 8,873,514
Taxes paid (487,118) (381,829) (249,288) -
Interest paid 7 (797,599) (1,179,380) (326,178) (773,769)
Gratuity paid 28 (24,289) (37,750) (9,640) (29,951)
Net cash generated from operating activities 5,334,187 506,905 1,244,685 8,069,794
Statement of Cash Flow

& 89Pg. 88
Group Company
For the year ended 31 March 2016 2015 2016 2015
Note Rs. ‘000 Rs. ‘000 Rs. ‘000 Rs. ‘000
Cash flows from investing activities
Addition to property, plant and equipment 13 (2,200,773) (1,664,190) (21,983) (33,376)
Addition to investment property 14 - (75,263) (525,392) (124,814)
Addition to intangible assets 15 (77,945) (18,276) -
Investment in new share issue of subsidiary 16.1 - - - (105,392)
Finance income received 7.1 193,455 213,854 131,660 282,036
Receipt of grant 27 - 2,391 -
Acquisition of non controlling interest in subsidiary - (116,144) - -
Addition to Investment in Associate 16.2 (1,276,000) (248,738) (1,276,000) (248,738)
Dividend received 6 720 811 827,104 514,478
Proceeds from disposal of property, plant and equipment 31,451 49,452 3,475 1,000
Proceed from disposal of investments - 1,131,432 - -
Proceed from disposal of subsidiary - - - 1,354,022
Proceed from disposal of trade mark - 4,000,000 - -
Addition to other financial assets (89,048) (385,505) (31,171) -
Net cash generated from/(used in) investing activities (3,418,140) 2,889,824 (892,307) 1,639,216
Cash flows from financing activities
Share issued to minority shareholders - 2,550,000 - -
Share issue expenses - (12,750) - -
Net proceeds from/(repayment of) short term borrowings 439,575 (5,682,722) 1,240,700 (8,870,000)
Net proceeds from/(repayment of) long term borrowings (532,622) (558,397) - (1,700,400)
Dividend paid (601,454) (443,183) (566,412) (443,183)
Net cash generated from/(used in) financing activities (694,501) (4,147,052) 674,288 (11,013,583)
Increase / (decrease) in cash and cash equivalents 1,221,546 (750,323) 1,026,666 (1,304,573)
Movement in cash and cash equivalents
At the beginning of the year (2,338,452) (1,588,129) (2,526,173) (1,221,600)
Movement during the year 1,221,546 (750,323) 1,026,666 (1,304,573)
At the end of the period 25 (1,116,906) (2,338,452) (1,499,507) (2,526,173)
The figures in brackets indicate deductions.
The accounting policies and notes from pages 90 to 145 form an integral part of these financial statements.

Pg. 90Cargills (Ceylon) PLC - Annual Report 2015/16
1. Corporate Information
1.1 Reporting entity
Cargills (Ceylon) PLC is a Quoted Public
Limited Liability Company domiciled in Sri
Lanka and listed in Colombo Stock Exchange.
The Company’s registered office is located at
40, York Street, Colombo 1.
1.2 Consolidated Financial Statements
The Consolidated Financial Statements of
the Group for the year ended 31st March
2016 comprise Cargills (Ceylon) PLC (Parent
Company), its subsidiaries (together referred
to as the ‘Group’) and the Group’s interest in
its associate companies.
1.3 Parent Entity & Ultimate Parent
Entity
The Company’s holding entity is CT Holdings
PLC which is a Quoted Public Limited Liability
Company domiciled in Sri Lanka and listed in
Colombo Stock Exchange.
1.4 Number of Employees
The staff strength of the Company as at 31st
March 2016 is 1,870 (1,729 as at 31st March
2015).
The staff strength of the Group as at 31st
March 2016 is 8,738 (7,826 as at 31st March
2015).
1.5 Principal Activities and Nature of
Operations
The Group is primarily involved in Operating
a Chain of retail outlets.
The principal activities of the Group are,
1. Operating a chain of retail outlets under
the brand names of ‘Food City’ and
‘Food City Express’
2. Manufacturing and distributing
(a) Ice cream and other dairy products
under the brand names of ‘Cargills
Magic’, ‘Heavenly’ and ‘Kotmale’
(b) Fruit based products under ‘Kist’
brand
Notes to the Financial Statements
(c) Processed and fresh meat products under the brand names of ‘Supremo’, ‘ Finest’,
‘Goldi’ and ‘Sams’.
(d) Biscuits under the brand name of ‘Kist’
3. Operating a chain of ‘KFC’ and ‘TGIF’ restaurants under franchise agreements
4. Distribution of international brands such as ‘Kodak’, ‘Kraft’, ‘Cadbury’, ‘Bonlac’, ‘Oreo’,
‘Tang’ and ‘Toblerone’ etc.
There were no significant changes in the nature of the principal activities of the Company and
the Group during the financial year under review.
2. Basis of Preparation
2.1 Basis of Measurement
The Financial Statements of the Company and the Group have been prepared on the historical
cost basis except for the following items in the Statement of Financial Position:
Item Basis of measurement Note No.
Property Plant and Equipment Cost / Revaluation 13
Financial Investments Available-for-sale Fair Value 16.3.1
Employee Benefits Liability is recognised as the present
value of the defined benefit obligation.
28
Investment Properties Fair Value 14
Put liability Present value of exercise price 23
2.2 Statement of Compliance
The Consolidated Financial Statements of the Group and Separate Financial Statements of
the Company, as at 31st March 2016 and for the year then ended, have been prepared and
presented in accordance with Sri Lanka Accounting Standards (SLFRS and LKAS), laid down by
the Institute of Chartered Accountants of Sri Lanka and in compliance with the requirements of
the Companies Act No. 07 of 2007, and the Listing Rules of the Colombo Stock Exchange.
These financial statements include the following components:
• A Statement of Profit or Loss and other Comprehensive Income providing the information on
the financial performance of the Company and the Group for the year under review;
• A Statement of Financial Position providing the information on the financial position of the
Company and the Group as at the year-end;
• A Statement of Changes in Equity depicting all changes in shareholders‘ equity during the
year under review of the Company and the Group;
• A Statement of Cash Flows providing the information to the users, on the ability of the
Company and the Group to generate cash and cash equivalents and the needs of entity to
utilise those cash flows ;and
• Notes to the Financial Statements comprising Accounting Policies and other explanatory
information.

& 91Pg. 90
2.3 Responsibility for Financial
Statements
The Board of Directors is responsible for
preparation and presentation of these
Financial Statements of the Company
and the Group as per the provision of the
Companies Act No. 07 of 2007 and SLFRS
and LKAS.
The Board of Directors acknowledges their
responsibility as set out in the “Annual
Report of the Board of Directors on the
Affairs of the Company”, “Directors’
Responsibility for Financial Reporting” and
in the certification on the Statement of
Financial Position.
2.4 Approval of Financial Statements
by the Board of Directors
The Financial Statements of the Company
and the Group for the year ended 31st
March 2016 (including comparatives) were
approved and authorised for issue on 09th
June 2016.
2.5 Presentation of Financial
Statements
The assets and liabilities of the Company
and the Group in the Statement of Financial
Position are grouped by nature. No
adjustments have been made for inflationary
factors affecting the Financial Statements.
Financial assets and financial liabilities are
offset and the net amount reported in the
Consolidated Statement of Financial Position
only when there is a legally enforceable right
to offset the recognised amounts and there
is an intention to settle on a net basis, or
to realize the assets and settle the liability
simultaneously. Income and expenses are not
offset in the consolidated income statement
unless required or permitted by any
accounting standard or interpretation, and
as specifically disclosed in the accounting
policies of the Group.
2.6 Functional and Presentation
Currency
The Consolidated Financial Statements are
presented in Sri Lanka Rupees (Rs.), which
is the Group’s functional and presentation
currency.
2.7 Materiality & Aggregation
In compliance with the Sri Lanka Accounting
Standard - LKAS 01 on ‘Presentation of
Financial Statements’, each material class
of similar items is presented separately in
the Financial Statements. Items of dissimilar
nature or functions too are presented
separately, unless they are immaterial.
2.8 Rounding
The amounts in the Consolidated Financial
Statements have been rounded-off to the
nearest Rupees thousands, except where
otherwise indicated as permitted by the Sri
Lanka Accounting Standard- LKAS 01 on
‘Presentation of Financial Statements’.
2.9 Comparative Information
The accounting policies have been
consistently applied by the Company and
the Group with those of the previous
financial year in accordance with the Sri
Lanka Accounting Standard - LKAS 01
on ‘Presentation of Financial Statements’.
Comparative information is reclassified
wherever necessary to comply with the
current presentation.
2.10 Significant Accounting Judgments,
Estimates and Assumptions
The preparation of the Financial Statements
of the Company and the Group in
conformity with SLFRS and LKAS requires
management to make judgments, estimates
and assumptions that affect the application
of accounting policies and the reported
amounts of assets, liabilities, income and
expenses.
Further, management is also required to
consider key assumptions concerning the
future and other key sources of estimation
uncertainty at the reporting date that
have significant risk of causing a material
adjustment to the carrying amounts of
assets and liabilities within the next financial
year. Actual results may differ from these
estimates.
Accounting judgments, estimates and
underlying assumptions are reviewed on
an ongoing basis. Revisions to accounting
estimates are recognized in the period in
which the estimates are revised and in any
future periods affected.
The key significant accounting judgments,
estimates and assumptions involving
uncertainty of respective carrying amounts
of such assets and liabilities are as given in
related Notes.
Note 18 – Deferred taxation
Note 28 – Employee benefits
Note 23 – Put liability
2.11 Going Concern
The Group’s management has made an
assessment of its ability to continue as
a going concern and is satisfied that it
has the resources to continue in business
for a foreseeable future. Furthermore,
management is not aware of any material
uncertainties that may cast significant doubt
upon the Group’s ability to continue as a
going concern. Therefore, the Financial
Statements continue to be prepared on the
going concern basis.

Pg. 92Cargills (Ceylon) PLC - Annual Report 2015/16
3. Significant Accounting Policies
3.1 Basis of Consolidation
The Consolidated Financial Statements
comprise of financial statements of the
Company, its subsidiaries and its associate
companies for the year ended 31st March
2016 except for the company stated in the
note 16.6.(b). The financial statements of the
Company’s subsidiaries and associates are
prepared for the same reporting year using
consistent accounting policies.
3.1.1 Business combination and
goodwill
Business combinations are accounted
for using the Acquisition method as
per the requirements of Sri Lanka
Accounting Standard - SLFRS 03 (Business
Combinations).
The Group and the Company measure
goodwill as the fair value of the
consideration transferred including the
recognised amount of any non-controlling
interest in the acquiree, less the net
recognised amount of the identifiable assets
acquired and liabilities assumed, all measured
as of the acquisition date. When the excess
is negative, a bargain purchase gain is
recognised immediately in profit or loss.
Goodwill acquired in a business combination
is initially measured at cost, being the excess
of the cost of the business combination over
the Group’s interest in the net amount of the
identifiable assets, liabilities and contingent
liabilities acquired.
Following initial recognition, goodwill is
measured at cost less any accumulated
impairment losses. Goodwill is reviewed for
impairment annually, or more frequently, if
events or changes in circumstances indicate
that the carrying value may be impaired.
For the purpose of impairment testing,
goodwill acquired in a business combination
is, from the acquisition date, allocated
to each of the group’s cash–generating
units (CGUs) or group of CGUs, which are
expected to benefit from the synergies of
the combination, irrespective of whether
other assets or liabilities of the acquiree are
assigned to those units.
Where goodwill forms part of a CGU (or
group of CGUs) and part of the operation
within that unit is disposed of, the goodwill
associated with the operation disposed of
is included in the carrying amount of the
operation when determining the gain or
loss on disposal of the operation. Goodwill
disposed of in this circumstance is measured
based on the relative values of the operation
disposed of and the portion of the CGU
retained.
When subsidiaries are sold, the difference
between the selling price and the net assets
plus cumulative translation differences and
goodwill is recognised in the Statement of
Profit or Loss.
3.1.2 Subsidiaries
Subsidiaries are entities that are controlled
by the Group. Subsidiaries are fully
consolidated from the date on which control
is transferred to the Company and continue
to be consolidated until the date when such
control ceases. The Company is presumed to
control an investee when it is exposed, or has
right, to variable returns from its involvement
with the investee and has the ability to affect
those returns through its power over the
investee.
Investments in subsidiaries are stated at
cost, net of any impairment losses which
are charged to the Profit or Loss in the
Company’s Financial Statements and it is in
accordance with the Sri Lanka Accounting
Standard LKAS 27 on ‘Consolidated and
Separate Financial Statements’.
Intra-group balances and transactions,
income, expenses and any unrealised
gains arising from intra-group transactions
are eliminated in full in preparing the
Consolidated Financial Statements.
For each business combination, the Group
elects to measure any non-controlling
interests in the acquiree either: at fair value;
or at proportionate share of the acquiree’s
identifiable net assets, which are generally at
fair value.
Non controlling interest is measured at the
minorities’ share of the post acquisition fair
values of the identifiable assets and liabilities
of the acquired entity, Separate disclosure is
made of non controlling interest.
Acquisition of non-controlling interests are
accounted for as transactions with owners
in their capacity as owners and therefore
no goodwill is recognised as a result of
such transactions. The adjustments to
non- controlling interests are based on a
proportionate amount of the net assets of
the subsidiary.
3.1.3 Acquisition of entities under
common control
The purchase method of accounting is used
to account for the acquisition of subsidiary
by the Group. The cost of an acquisition
is measured as the fair value of the assets
given, equity instruments issued and
liabilities incurred or assumed at the date of
exchange, plus costs directly attributable to
the acquisition. Identifiable assets acquired
and liabilities and contingent liabilities
assumed in a business combination are
measured initially at their fair values at the
acquisition date, irrespective of the extent
of any non-controlling interest. The excess
of the Group’s share of the identifiable net
assets acquired is recorded as Goodwill. If
the cost of acquisition is less than the fair
value of the net assets of the subsidiary
acquired, the difference is recognised directly
in the Profit or Loss.
All subsidiaries of the Company have been
incorporated in Sri Lanka.
Notes to the Financial Statements contd.

& 93Pg. 92
3.1.4 Associates
Associate is an entity in which the Company
has significant influence, but no control
over the financial and operating policies.
Significant influence is presumed to exist
when the Company holds between 20 and
50 percent of the voting power of another
entity.
Investment in Associate is accounted
for using the Equity method and is
recognised initially at cost in terms of the
Sri Lanka Accounting Standard - LKAS 28
on ‘Investments in Associates and Joint
Ventures’. Goodwill relating to an associate
is included in the carrying amount of the
investment and is not amortised but is
subjected to impairment test. The Company’s
investments include goodwill recognized
on acquisition, net of any accumulated
impairment losses.
The Consolidated Financial Statements
include the Company’s share of the income
and expenses and equity movements of the
Associate, after adjustments being made
to align the accounting policies with those
of the Group from the date that significant
influence effectively commences until the
date that significant influence effectively
ceases.
When the Company’s share of losses
exceeds its interest in the Associate, the
carrying amount of that interest is reduced
to nil and the recognition of further losses
is discontinued except to the extent that
the Company has an obligation or made
payments on behalf of the Associate. If the
Associate subsequently reports profits, the
Company resumes recognising its share of
those profits only after its share of the profits
equals the share of losses not recognised.
Profit and losses resulting from transactions
between the Company and the Associate are
eliminated to the extent of the interest in the
Associate. The Company discontinues the
use of the Equity method from the date that
it ceases to have significant influence over an
Associate and accounts for the investment
cost in accordance with the Sri Lanka
Accounting Standard- LKAS 39 on ‘Financial
Instruments: Recognition and measurement’.
3.1.5 Loss of Control
Upon the loss of control, the Group
derecognises the assets and liabilities of the
subsidiary any non-controlling interest and
the other components of equity related to
the subsidiary. Any surplus or deficit arising
on the loss of control is recognised in profit
or loss. If the Group retains any interest in
the previous subsidiary, then such interest
is measured at fair value at the date that
control is lost. Subsequently it is accounted
for as an equity-accounted investee or as an
available for sale financial asset depending
on the level of influence retained.
3.1.6 Transactions Eliminated on
Consolidation
Intra-group balances and transactions and
any unrealised income and expenses arising
from intra-group transactions are eliminated
in preparing the Consolidated Financial
Statements. Unrealised gains arising from
transactions with equity accounted investees
are eliminated against the investment to
the extent of the Group’s interest in the
investee. Unrealised losses are eliminated in
the same way as unrealized gains, but only
to the extent that there is no evidence of
impairment.
3.2 Foreign Currency Transactions and
Balances
All foreign currency transactions are
translated into the functional currency
which is Sri Lankan Rupees (Rs.) at the spot
exchange rate at the date of the transactions
were affected.
Monetary assets and liabilities denominated
in foreign currencies at the reporting date
are retranslated to the functional currency at
the spot rate of exchange at the reporting
date. The foreign currency gain or loss on
monetary items is the difference between
amortised cost in the functional currency
at the beginning of the year adjusted for
effective interest and payments during
the year and the amortised cost in foreign
currency translated at the exchange rate at
the reporting date.
Non–monetary items that are measured in
terms of historical cost in a foreign currency
are translated using the spot exchange
rates as at the date of recognition. Non-
monetary items measured at fair value in a
foreign currency are translated using the spot
exchange rates at the date when the fair
value was determined.
3.3 Financial Instruments – Initial
Recognition and Subsequent
Measurement
3.3.1 Date of Recognition
All financial assets and liabilities are initially
recognised on the trade date, i.e., the date
that the Group and Company becomes a
party to the contractual provisions of the
instrument.
3.3.2 Classification and Initial
Measurement of Financial Instruments
The classification of financial instruments at
initial recognition depends on their purpose
and characteristics and the management’s
intention in acquiring them. All financial
instruments are measured initially at their
fair value plus transaction costs that are
directly attributable to acquisition or issue
of such financial instrument, except in
the case of financial assets and financial
liabilities recorded at fair value through
profit or loss as per the Sri Lanka Accounting
Standard- LKAS 39 on ‘Financial Instruments:
Recognition and Measurement’.

Pg. 94Cargills (Ceylon) PLC - Annual Report 2015/16
3.3.3 Classification and Subsequent
Measurement of Financial Assets
At inception a financial asset is classified
under one of the following categories:
i) Financial Assets at Fair value through
profit or loss (FVTPL);
• Financial Assets - Held for trading or
• Financial Assets - Designated at fair
value through profit or loss
ii) Loans and receivables (L&R);
iii) Financial Investments - Held to maturity
(HTM); or
iv) Available-for-sale (AFS) financial assets.
The subsequent measurement of Financial
Assets depends on their classification.
3.3.3.1 Financial Investments at Fair
Value through Profit or Loss (FVTPL)
Financial assets at fair value through profit or
loss include financial assets held for trading
and financial assets designated upon initial
recognition at fair value through profit or
loss.
Financial Assets - Held for Trading
Financial assets are classified as held for
trading if they are acquired principally for the
purpose of selling or repurchasing in the near
term or holds as a part of a portfolio that is
managed together for short-term profit or
position taking. Financial investments held
for trading are recorded in the Statement of
Financial Position at fair value. Changes in
fair value are recognised in ‘other income’.
Interest and dividend income is recorded in
‘other income’ according to the terms of the
contract, or when the right to receive the
payment has been established.
Financial Assets - Designated at Fair
Value through Profit or Loss
The Group and Company designates
financial assets at fair value through profit or
loss in the following circumstances;
• The assets are managed, evaluated and
reported internally at fair value;
• The designation eliminates or significantly
reduces an accounting mismatch, which
would otherwise have arisen; or
• The asset contains an embedded derivative
that significantly modifies the cash flows
that would otherwise have been required
under the contract.
Financial assets designated at fair value
through profit or loss is recorded in the
Statement of Financial Position at fair
value. Changes in fair value are recorded
in other income as net gain or loss on
financial assets and liabilities designated
at fair value through profit or loss. Interest
earned is accrued in ‘interest income’ using
EIR while dividend income is recorded in
‘other income’ when the right to receive the
payment has been established.
3.3.3.2 Available for Sale Financial
Assets
Available for sale financial investments
include equity securities. Equity investments
classified as available for sale are those which
are neither classified as held for trading nor
designated at fair value through profit or
loss.
After initial measurement, available for
sale financial investments are subsequently
measured at fair value.
Unrealised gains and losses are recognised
directly in equity (Other Comprehensive
Income) in the ‘Available for sale reserve’.
When the investment is disposed of, the
cumulative gain or loss previously recognized
in equity is recognised in the Statement of
Profit or Loss in ‘Other income’. Where the
Group holds more than one investment in
the same security, they are deemed to be
disposed of on a first–in first–out basis.
Interest earned whilst holding available for
sale financial assets are reported as interest
income using the effective interest rate (EIR).
Dividends earned whilst holding available
for sale financial investments are recognised
in the Statement of Profit or Loss as ‘Other
income’ when the right of the income
has been established. The losses arising
from impairment of such investments are
recognised in the Statement of Profit or Loss
and removed from the ‘Available for sale
reserve’.
3.3.3.3 Financial Assets Classified as
Loans and Receivables
Financial assets classified as loans and
receivables include non-derivative financial
assets with fixed or determinable payments
that are not quoted in an active market,
other than:
• Those that the Group and Company
intends to sell immediately or in the
near term and those that, upon initial
recognition, designates as at fair value
through profit or loss
• Those that the Group and Company, upon
initial recognition, designates as available
for sale
• Those for which the Group and Company
may not recover substantially all of its
initial investment, other than because of
credit deterioration
After initial measurement, ‘Loans and
receivables' are subsequently measured at
amortised cost using the EIR, less allowance
for impairment. Amortised cost is calculated
by taking into account any discount or
premium on acquisition and fees and costs
that are an integral part of the EIR. The
amortisation is included in ‘Interest income’
in the Profit or Loss. The losses arising from
impairment are recognised in the Profit or
Loss.
3.3.4 Classification and Subsequent
Measurement of Financial Liabilities
At the inception the Group and Company
determines the classification of its financial
liabilities. Accordingly financial liabilities are
classified as:
Notes to the Financial Statements contd.

& 95Pg. 94
i) Financial liabilities at fair value through
profit or loss (FVTPL)
• Financial liabilities held for trading
• Financial liabilities designated at fair
value through profit or loss
ii) Financial liabilities at amortised cost.
The subsequent measurement of financial
liabilities depends on their classification.
3.3.4.1 Financial Liabilities at Fair Value
through Profit or Loss
Financial liabilities at FVTPL include financial
liabilities held for trading and financial
liabilities designated upon initial recognition
at fair value through profit or loss.
Subsequent to initial recognition, financial
liabilities at FVTPL are measured at fair value,
and changes there in recognised in profit or
loss.
Financial liabilities are classified as held for
trading if they are acquired principally for the
purpose of selling or repurchasing in the near
term or holds as a part of a portfolio that
is managed together for short-term profit
or position taking. This category includes
derivative financial instruments entered into
by the Group and Company that are not
designated as hedging instruments in hedge
relationships as defined by the Sri Lanka
Accounting Standard - LKAS 39 on Financial
Instruments: Recognition and Measurement.
Separated embedded derivatives are also
classified as held for trading unless they are
designated as effective hedging instruments.
Gains or losses on liabilities held for trading
are recognised in the Statement of Profit or
Loss.
3.3.4.2 Financial Liabilities at Amortised
Cost
Financial Instruments where the substance
of the contractual arrangement results in the
Group having an obligation either to deliver
cash or another financial asset to the holder,
or to satisfy the obligation other than by
the exchange of a fixed amount of cash or
another financial asset for a fixed number of
own equity shares at amortised cost using
the EIR method.
After initial recognition, such financial
liabilities are substantially measured at
amortised cost using the EIR method.
Amortised cost is calculated by taking into
account any discount or premium on the
issue and costs that are an integral part of
the EIR. The EIR amortisation is included in
‘interest expenses’ in the Statement of Profit
or Loss. Gains and losses are recognised in
the Statement of Profit or Loss when the
liabilities are de-recognise as well as through
the EIR amortisation process.
3.3.5 Reclassification of Financial
Instruments
The Group does not reclassify any financial
instrument into the ‘fair value through profit
or loss’ category after initial recognition.
Also the Group does not reclassify any
financial instrument out of the ‘fair value
through profit or loss’ category if upon initial
recognition it was designated as at fair value
through profit or loss.
The Group reclassifies non-derivative
financial assets out of the ‘held for trading’
category and into the ‘available for sale’,
‘loans and receivables’, or ’held to maturity’
categories as permitted by the Sri Lanka
Accounting Standard - LKAS 39 on Financial
Instruments: Recognition and Measurement.
In certain circumstances the Group is also
permitted to reclassify financial assets out of
the ‘available for sale’ category and into the
’loans and receivables’, ‘held for trading’ or
‘held- to maturity’ category.
Reclassifications are recorded at fair value at
the date of reclassification, which becomes
the new amortised cost.
For a financial asset reclassified out of the
’available for sale’ category, any previous
gain or loss on that asset that has been
recognised in Equity is amortised to profit or
loss over the remaining life of the investment
using the effective interest rate (EIR). Any
difference between the new amortised
cost and the expected cash flows is also
amortised over the remaining life of the asset
using the EIR. If the asset is subsequently
determined to be impaired, then the
amount recorded in Equity is recycled to the
Statement of Profit or Loss.
The Group may reclassify a non-derivative
trading asset out of the ‘held for trading’
category and into the ‘loans and receivables’
category if it meets the definition of loans
and receivables and the Group has the
intention and ability to hold the financial
asset for the foreseeable future or until
maturity. If a financial asset is reclassified,
and if the Group subsequently increases
its estimates of future cash receipts as a
result of increased recoverability of those
cash receipts, the effect of that increase is
recognised as an adjustment to the EIR from
the date of the change in estimate.
Reclassification is at the election of
management, and is determined on an
instrument by instrument basis.
3.3.6 De-recognition of Financial Assets
and Financial Liabilities
Financial Assets
A financial asset (or, where applicable a
part of a financial asset or part of a group
of similar financial assets) is de-recognised
when;
• The rights to receive cash flows from the
asset which have expired;
• The Group and Company has transferred
its rights to receive cash flows from the
asset or has assumed an obligation to pay
the received cash flows in full without
material delay to a third party under a
‘pass–through’ arrangement; and either;

Pg. 96Cargills (Ceylon) PLC - Annual Report 2015/16
• The Group and Company has transferred
substantially all the risks and rewards of
the asset; or
• The Group and Company has neither
transferred nor retained substantially all
the risks and rewards of the asset, but has
transferred control of the asset.
On de-recognition of a financial asset, the
difference between the carrying amount of
the asset and consideration received and
any cumulative gain or loss that has been
recognised is recognised in profit or loss.
When the Group and Company has
transferred its rights to receive cash flows
from an asset or has entered into a pass-
through arrangement, and has neither
transferred nor retained substantially all
of the risks and rewards of the asset nor
transferred control of the asset, the asset
is recognized to the extent of the group’s
continuing involvement in the asset. In
that case, the Group also recognises an
associated liability. The transferred asset and
the associated liability are measured on a
basis that reflects the rights and obligations
that the Group has retained.
Continuing involvement that takes the form
of a guarantee over the transferred asset
is measured at the lower of the original
carrying amount of the asset and the
maximum amount of consideration that the
Group could be required to repay.
Financial Liabilities
A financial liability is de-recognised when the
obligation under the liability is discharged
or cancelled or expired. Where an existing
financial liability is replaced by another from
the same lender on substantially different
terms, or the terms of an existing liability are
substantially modified, such an exchange or
modification is treated as a derecognition of
the original liability and the recognition of
a new liability. The difference between the
carrying value of the original financial liability
and the consideration paid is recognised in
profit or loss.
3.3.7 Determination of Fair Value
The fair value for financial instruments traded
in active markets at the reporting date is
based on their quoted market price or dealer
price quotations (bid price for long positions
and ask price for short positions), without
any deduction for transaction costs.
3.3.8 Impairment of Financial Assets
The Group assesses at each reporting date,
whether there is any objective evidence that
a financial asset or a group of financial assets
are impaired. A financial asset or a group
of financial assets is deemed to be impaired
if, and only if, there is objective evidence
of impairment as a result of one or more
events that have occurred after the initial
recognition of the asset (an ‘incurred loss
event’) and that loss event (or events) has an
impact on the estimated future cash flows of
the financial asset or the group of financial
assets that can be reliably estimated.
3.3.9.1 Loans and Receivables
Losses for impaired loans are recognized
promptly when there is objective evidence
that impairment has occurred. Impairment
losses are recorded as charges to the Profit
or Loss. The carrying amount of impaired
loans and receivables on the Statement of
Financial Position is reduced through the use
of impairment allowance accounts.
Reversals of Impairment
If the amount of an impairment loss
decreases in a subsequent period, and the
decrease can be related objectively to an
event occurring after the impairment was
recognised, the excess is written back by
reducing the loan impairment allowance
account accordingly. The write-back is
recognised in the Statement of Profit or Loss.
3.3.9.2 Available for Sale Financial
Investments
For available for sale financial investments,
the Company and Group assesses at each
reporting date whether there is objective
evidence that an investment is impaired.
In the case of equity investments classified as
available for sale, objective evidence would
also include a significant’ or ‘prolonged’
decline in the fair value of the investment
below its cost. The determination of what
is ‘significant’ or ‘prolonged’ requires
judgment. The Group generally treats
‘significant’ as 20% or more and ‘prolonged’
as greater than six months. Where there is
evidence of impairment, the cumulative loss
measured as the difference between the
acquisition cost and the current fair value,
less any impairment loss on that investment
previously recognised in the Statement of
Profit or Loss is removed from equity and
recognised in the Statement of Profit or Loss.
Impairment losses on equity investments
are not reversed through the Statement
of Profit or Loss; increases in the fair value
after impairment are recognised in other
comprehensive income.
3.3.10 Offsetting Financial Instruments
Financial assets and financial liabilities are
offset and the net amount reported in the
Statement of Financial Position if, and only
if, there is a currently enforceable legal right
to offset the recognised amounts and there
is an intention to settle on a net basis, or
to realize the asset and settle the liability
simultaneously.
Income and expenses are presented on a
net basis only when permitted under LKAS /
SLFRS, or for gains and losses arising from a
group of similar transactions
3.4 Property, Plant and Equipment
3.4.1 Basis of Recognition
Property, Plant and Equipment is recognized
if it is probable that future economic benefits
associated with the asset will flow to the
Group and cost of the asset can be measured
reliably.
3.4.2 Basis of Measurement
An item of Property, Plant and Equipment
that qualifies for recognition as an asset is
initially measured at its cost. Cost includes
expenditure that is directly attributable to
Notes to the Financial Statements contd.

& 97Pg. 96
the acquisition of the asset and cost incurred
subsequently to add to or replace a part of it.
The cost of self-constructed assets includes
the cost of materials and direct labour, any
other costs directly attributable to bringing
the asset to a working condition for its
intended use and the costs of dismantling
and removing the items and restoring at the
site on which they are located and capitalised
borrowing costs. Purchased software
that is integral to the functionality of the
related equipment is capitalised as a part of
computer equipment.
When parts of an item of Property, Plant &
Equipment have different useful lives, they
are accounted for as separate items (major
components) of Property, Plant & Equipment.
Plant and equipment are stated at cost
less accumulated depreciation and any
accumulated impairment loss. Land and
buildings are measured at fair value less
accumulated depreciation on buildings and
impairment charged subsequent to the date
of the revaluation. Where land and buildings
are subsequently revalued, any increase in
the carrying amount is recognised in other
comprehensive income and accumulated
in equity in the asset revaluation reserve.
Decreases that offset previous increases
of the same asset are charged against the
revaluation reserves in the statement of
changes in equity, any excess and all other
decreases are charged to the statement of
profit or loss. Upon disposal of such revalued
assets the revaluation surplus relating to such
disposed assets will be directly transferred to
retained earnings. Revaluation of property,
plant and equipment are undertaken by
professionally qualified independent valuers.
3.4.3 Subsequent Costs
The cost of replacing a part of an item of
Property, Plant and Equipment is recognised
in the carrying amount of the item if it is
probable that the future economic benefits
embodied within the part will flow to the
Group and its cost can be measured reliably.
The cost of day today servicing of Property,
Plant and Equipment are charged to the
Statement of Profit or Loss as incurred.
3.4.4 Repairs & Maintenance
Repairs and maintenance are charged to
the Statement of Profit or Loss during the
financial period in which they are incurred.
The cost of major renovations is included in
the carrying amount of the assets when it
is probable that future economic benefits in
excess of the most recently assessed standard
of performance of the existing assets will
flow to the Company & Group and the
renovation replaces an identifiable part of
the asset. Major renovations are depreciated
during the remaining useful life of the
related asset.
3.4.5 Capital Work-in-Progress
These are expenses of a capital nature
directly incurred in the construction of
buildings, major plant and machinery and
system development, awaiting capitalisation.
These are stated in the Statement of
Financial Position at cost. Capital assets
which have been completed during the year
and put to use have been transferred to
Property, plant and equipment.
3.4.6 De-recognition
Property, plant and equipment are de-
recognised on disposal or when no future
economic benefits are expected from its use.
Any gain or loss arising on de recognition
of the asset (calculated as the difference
between the net disposal proceeds and the
carrying amount of the asset) is recognised in
‘Other income' in the Statement of Profit or
Loss in the year the asset is de-recognised.
3.4.7 Depreciation
Depreciation is recognised in Statement of
Profit or Loss on a straight–line basis over the
estimated useful lives of each part of an item
of property, plant and equipment since this
method most closely reflects the expected
pattern of consumption of the future
economic benefits embodied in the asset.
Land is not depreciated.
The estimated useful lives are as follows;
Class of asset % per annum
Period
Buildings 2 50 years
Improvement of leasehold properties
10 – 25 4 -10 years
Motor vehicles 25 4 years
IT equipment and software
20 – 33.3 3 -5 years
Office and other equipment
20 5 years
Air condition and refrigeration
10 – 20 5 -10 years
Plant & machinery 10 – 20 5 -10 years
Refundable containers
20 5 years
Furniture and fittings
20 5 years
The above rates are consistently used by
all the Group entities. The depreciation
rates are determined separately for each
significant part of an item of property, plant
and equipment and commence to depreciate
when it is available for use, i.e. when it is
in the location and condition necessary for
it to be capable of operating in the manner
intended by the management. Depreciation
of an asset ceases at the earlier of the date
that the asset is classified as held for sale
or the date that the asset is de-recognised.
Depreciation methods, useful lives and
residual values are reassessed at each
reporting date and adjusted if appropriate.
3.4.8 Returnable containers
Returnable containers are classified under
Property, plant and equipment. All purchases
of returnable containers will be recognised
at cost and depreciated over a period of 5
years. In the event a returnable container
breaks within the premises of the company,
the written down value on a first in first out
(FIFO) basis will be charged to the Statement
of Profit or Loss as breakages.

Pg. 98Cargills (Ceylon) PLC - Annual Report 2015/16
3.5 Investment Properties
Investment property is property held either to
earn rental income or for capital appreciation
or for both, but not for sale in the ordinary
course of business, use in the production
or supply of goods or services or for
administrative purposes.
Investment properties are initially recognised
at cost. Subsequent to initial recognition
the investment properties are stated at fair
values, which reflect market conditions at
the reporting date. Gains or losses arising
from changes in fair value are included in the
Profit or Loss in the year in which they arise.
Where Group companies occupy a significant
portion of the investment property of a
subsidiary, such portion of investment
properties are treated as property, plant and
equipment in the Consolidated Financial
Statements, and accounted for as per LKAS
16 - Property, Plant and Equipment.
3.5.1 De-recognition
Investment properties are de-recognised
when either they have been disposed of or
when the investment property is permanently
withdrawn from use and no future economic
benefit is expected from its disposal. Any
gains or losses on the retirement or disposal
of an investment property are recognised in
the Statement of Profit or Loss in the year of
retirement or disposal.
3.5.2 Subsequent Transfers to/from
Investment Property
Transfers are made to investment property
when, and only when, there is a change
in use, evidenced by the end of owner
occupation, commencement of an operating
lease to another party or completion of
construction or development.
Transfers are made from investment property
when, and only when, there is a change
in use, evidenced by commencement of
owner occupation or commencement of
development with a view to sale.
For a transfer from investment property to
owner occupied property or inventories, the
deemed cost of property for subsequent
accounting is its fair value at the date of
change in use. If the property occupied
by the Company as an owner occupied
property becomes an investment property,
the Company, accounts for such property
in accordance with the policy stated under
property, plant and equipment up to the
date of change in use.
When the Company completes the
construction or development of a self-
constructed investment property, any
difference between the fair value of the
property at that date and its previous
carrying amount is recognised in the
Statement of Profit or Loss.
3.5.3 Determining Fair Value
External and independent valuers, having
appropriate recognised professional
qualifications and recent experience in the
location and category of property being
valued, values the investment property
portfolio annually.
3.5.4 Investment Property Leased
within the Group
Any property leased out to parent or
subsidiary is considered as owner-occupied
from the perspective of the Group and
adjustments are made for consolidation
purposes.
3.6 Intangible Assets
The Group’s intangible assets include the
value of computer software, brand name,
franchise fee and goodwill.
3.6.1 Basis of Recognition
An intangible asset is recognised only when
its cost can be measured reliably and it is
probable that the expected future economic
benefits that are attributable to it will flow to
the Group in accordance with the Sri Lanka
Accounting Standard- LKAS 38 on ‘Intangible
Assets’.
Intangible assets acquired separately are
measured on initial recognition at cost.
The cost of intangible assets acquired in a
business combination is their fair value as
at the date of acquisition. Following initial
recognition, intangible assets are stated in
the Statement of Financial Position at cost
less any accumulated amortisation and any
accumulated impairment losses if any.
3.6.2 Subsequent Expenditure
Subsequent expenditure on intangible assets
is capitalized only when it increases the
future economic benefits embodied in the
specific asset to which it relates. All other
expenditure is expensed as incurred.
3.6.3 Useful Economic Lives,
Amortisation and Impairment
The useful economic lives of intangible assets
are assessed to be either finite or indefinite.
Intangible assets with finite lives are
amortised over the useful economic life. The
amortisation period and the amortisation
method for an intangible asset with a finite
useful life are reviewed at least at each
reporting date. Changes in the expected
useful life or the expected pattern of
consumption of future economic benefits
embodied in the asset are accounted for
by changing the amortisation period or
method, as appropriate, and they are
treated as changes in accounting estimates.
The amortisation expense on intangible
assets with finite lives is recognised in the
Statement of Profit or Loss in the expense
category consistent with the function of the
intangible asset.
Amortisation is calculated using the straight–
line method to write down the cost of
intangible assets to their residual values over
their estimated useful economic lives at the
rates as specified below;
Class of asset % per annum
Period
Computer software 25 4 years
Franchise fee 10 10 years
Notes to the Financial Statements contd.

& 99Pg. 98
The unamortised balances of intangible
assets with finite lives are reviewed for
impairment annually and whenever there is
an indication for impairment and recognised
in profit or loss to the extent that they are no
longer probable of being recovered from the
expected future benefits.
3.6.4 De-recognition
Intangible assets are de-recognised on
disposal or when no future economic
benefits are expected from its use. Any gain
or loss arising on de-recognition of the asset
(calculated as the difference between the net
disposal proceeds and the carrying amount
of the asset) is recognised in the profit or loss
in the year the asset is de-recognised.
3.7 Impairment of Non–financial
Assets
The carrying amounts of the Group’s non-
financial assets, other than deferred tax
assets are reviewed at each reporting date
whether there is an indication that an asset
may be impaired. If any indication exists, or
when annual impairment testing of an asset
is required, the Group estimates the asset’s
recoverable amount. An asset’s recoverable
amount is the higher of an asset’s or cash
generating unit’s fair value less costs to sell
and its value in use. Where the carrying
amount of an asset or cash – generating unit
exceeds its recoverable amount, the asset is
considered impaired and is written down to
its recoverable amount.
In assessing value in use, the estimated
future cash flows are discounted to their
present value using a pre-tax discount rate
that reflects current market assessments of
the time value of money and risks specific
to the asset. In determining fair value less
costs to sell, an appropriate valuation model
is used.
For assets excluding goodwill, an assessment
is made at each reporting date as to whether
there is any indication that previously
recognised impairment losses may have
decreased. If such indication exists the Group
estimates the asset’s or cash-generating
unit’s recoverable amount. A previously
recognised impairment loss is reversed only if
there has been a change in the assumptions
used to determine the asset’s recoverable
amount since the last impairment loss was
recognised, the reversal is limited so that
the carrying amount of the asset does
not exceed its recoverable amount, nor
exceeds the carrying amount that would
have been determined, net of depreciation/
amortisation, had no impairment loss been
recognized for the asset in prior years. Such
reversal is recognised in profit or loss.
3.8 Inventories
Inventories are valued at the lower of cost
and net realisable value. Net realisable value
is the estimated selling price in the normal
course of business less estimated cost of
realisation and / or cost of conversion from
their existing state to saleable condition.
The cost of each category of inventory of the
Group is determined on the following basis.
Raw & Packing
Materials
Actual cost on a First In
First Out - (FIFO) basis
Finished goods
and work-in-
progress
Directly attributable
manufacturing cost
Merchandising
goods
Actual cost on a First In
First Out - (FIFO) basis
Other
inventories
Actual cost
3.9 Cash and Cash Equivalents
Cash and cash equivalents include cash in
hand, and with banks at short notice that are
subject to an insignificant risk of changes in
their fair value.
Cash and cash equivalents are carried at
amortised cost in the statement of financial
position.
3.10. Assets Held for Sale and
Discontinued Operations
3.10.1 Assets Held for Sale
Non-current assets that are expected to be
recovered primarily through sale rather than
through continuing use are classified as held
for sale. Immediately before classification
as held for sale the assets are re measured
in accordance with the Group’s accounting
policies. Thereafter the assets are measured
at the lower of their carrying amount and fair
value less costs to sell. Impairment losses on
initial classification and subsequent gains and
losses on re measurement are recognized in
profit or loss. Gains are not recognized in
excess of any cumulative impairment loss.
3.10.2 Discontinued Operations
A discontinued operation is a component
of the Group’s business, the operations
and cash flows of which can be clearly
distinguished from the rest of the Group and
which:
• represents a separate major line of
business or geographical area of
operations;
• is part of a single co-ordinated plan
to dispose of a separate major line
of business or geographical area of
operations;
or
• is a subsidiary acquired exclusively with a
view to re-sale.
Classification as a discontinued operation
occurs on disposalor when the operation
meets the criteria to be classified as held-
for-sale, if earlier. When an operation is
classified as a discontinued operation, the
comparative statement of profit or loss and
other comprehensive income is re-presented
as if the operation had been discontinued
from the start of the comparative year.
3.11 Stated capital
Incremental costs directly attributable to the
issue of new shares are shown in equity as a
deduction, net of tax, from the proceeds.

Pg. 100Cargills (Ceylon) PLC - Annual Report 2015/16
3.12 Equity Reserves
The reserves recorded in equity (Other
comprehensive income) on the Group’s
Statement of Financial Position include;
• ‘Revaluation reserve’ consists of net
surplus resulting from the revaluation of
property plant and equipment.
• ‘Available for Sale’ reserve, which
comprises changes in fair value of available
for sale investments.
• ‘General Reserve’ represents the amounts
set aside by the Directors for general
application. The purpose of setting up the
General Reserve is to meet the potential
future unknown liabilities.
• ‘Capital reserve’ comprises share of capital
reserve resulting from consolidation.
3. 13 Written put options over NCI
3. 13.1 Recognition and measurement
When an entity writes a put option with the
non-controlling shareholders in an existing
subsidiary on their equity interests in that
subsidiary, and the put option granted to
non-controlling shareholders provides for
settlement in cash or in another financial
asset by the entity, the entity is required to
recognize a liability for the present value of
the exercise price of the option as per LKAS
32. Accordingly Group has recognized a put
liability as at reporting date.
The group has accounted for its written put
option over non-controlling shareholders
using the present access method and
determined such as its accounting policy to
be applied consistently.
The determination of present value of
the exercise price (i.e. fair value) for put
options related to non-controlling interests
has involved management judgments
and estimates of vital factors such as the
likelihood of exercise of the option and
the timing thereof, adherence to the
conditions of the shareholder agreement
by both parties, projected cash flows of the
underlying operations, the weighted average
cost of capital, etc. A change in any of these
factors may have a significant impact on
future results and cash flows.
3.13.2 Subsequent measurement
Subsequent changes in the carrying amount
of the put liability will be recognized within
equity.
3.14 Employee Benefits
3.14.1 Defined Benefit Plan - Gratuity
The Group measures the present value of
the retirement benefits for gratuity, with
the advice of an independent professional
actuary using the ‘Projected Unit Credit
method’ (PUC) as required by the Sri Lanka
Accounting Standard- LKAS 19 on ‘Employee
Benefits’.
The item is stated under Employee benefits
in the Statement of Financial Position.
The assumptions based on which the results
of the actuarial valuation was determined,
are included in note 28 to the financial
statements.
3.14.2 Recognition of Actuarial Gains
and Losses
The Company and Group recognises the
total actuarial gains and losses that arise
in calculating the Company’s obligation in
Other Comprehensive Income during the
period in which it occurs.
3.14.3 Funding Arrangements
The gratuity liability is not externally funded.
3.14.4 Defined contribution plans
-Employees’ Provident Fund
Defined Contribution Plan is a post-
employment benefit plan under which an
entity pays fixed contributions into a separate
entity and will have no legal or constructive
obligation to pay any further amounts.
Obligations for contributions to Employees
Provident Fund and Employees Trust Fund
covering all employees are recognised as an
expense in the Profit or Loss, as incurred.
3.15 Dividends Payable
Dividends on ordinary shares are recognized
as a liability and deducted from equity when
they are recommended by and declared by
the Board of Directors and approved by the
shareholders. Interim dividends are deducted
from equity when they are declared and no
longer at the discretion of the Group.
3.16 Borrowings
Borrowings are classified as current liabilities
unless the Company and Group has an
unconditional right to defer settlement of
the liability for at least 12 months after the
reporting date.
3.17 Leases
3.17.1 Finance leases
Assets are classified as acquired by finance
leases when by an agreement, the Group
substantially assumes the risk and rewards
incidental to the ownership of an asset.
Assets acquired by the way of finance lease
are measured at an amount equal to the
lower of their fair value and the present
value of minimum lease payments at the
inception less accumulated depreciation and
accumulated impairment losses.
3.17.2 Operating leases
When the lessor effectively retains
substantially all the risks and rewards of an
asset under the lease agreement, such leases
are classified as operating leases. Payments
under operating leases are recognised as an
expense in the Statement of Profit or Loss
over the period of lease on a straight line
basis.
3.18 Provisions
Provisions are recognised in the Statement
of Financial Position when the Group has a
present obligation (legal or constructive) as
a result of a past event, and it is probable
that an outflow of resources embodying
economic benefits will be required to settle
the obligation and a reliable estimate can
be made of the amount of the obligation in
accordance with the Sri Lanka Accounting
Notes to the Financial Statements contd.

& 101Pg. 100
Standard - LKAS 37 on ‘Provision,
Contingent Liabilities and Contingent
Assets’. The amount recognized is the best
estimate of the consideration required to
settle the present obligation at the reporting
date, taking into account the risks and
uncertainties surrounding the obligation at
that date.
3.19 Commitments and Contingencies
Contingent Liabilities are possible
obligations whose existence will be
confirmed only by uncertain future events
or present obligations where the transfer
of economic benefit is not probable or
cannot be readily measured as defined in
the Sri Lanka Accounting Standard- LKAS
37 on ‘Provisions, Contingent Liabilities and
Contingent Assets’. Contingent liabilities
are not recognised in the Statement of
Financial Position but are disclosed unless its
occurrence is remote.
Details of the commitments and
contingencies are given in note 32 and 33 to
the Financial Statements.
Statement of Profit or Loss and Other
Comprehensive Income
3.20 Revenue Recognition
Revenue is recognised to the extent that it is
probable that the economic benefits will flow
to the Group and the revenue can be reliably
measured. The following specific recognition
criteria must also be met before revenue is
recognised.
3.20.1 Sale of goods
Revenue from the sale of goods is recognised
when the significant risks and rewards of
ownership of the goods have been passed
to the buyer, usually on delivery of the
goods.
3.20.2 Other income
Revenue from dividends is recognised when
the Group’s right to receive the payment is
established.
Gains or losses of revenue nature arising
from the disposal of property, plant and
equipment and other non-current assets,
including investments, are accounted for
in the income statement, after deducting
from the net sales proceeds on disposal the
carrying amount of such assets.
Foreign currency gains and losses are
reported on a net basis.
Income from scrap sales are recognised
when the significant risks and rewards of
ownership of the goods have been passed
to the buyer, usually on delivery of the
goods.
Rental income is recognised on an accrual
basis.
3.20.3 Government grants
Government grants, including non-
monetary grants at fair value, are recognised
when there is reasonable assurance that
the conditions attached to them will be
complied by the company and the grants
will be received. Grants related to assets,
including non-monetary grants at fair value,
are presented in the Statement of Financial
Position as deferred income and recognised
in the income statement on a systematic
and rational basis over the useful life of the
asset. Grants related to income are presented
as a credit in the income statement, under
the heading ‘other income’ against the
incurrence of related expenditure.
Expenditure Recognition
3.21 Borrowing Costs
As per Sri Lanka Accounting Standard-
LKAS 23 on ‘Borrowing Costs’, the Group
capitalizes borrowing costs that are directly
attributable to the acquisition, construction or
production of qualifying asset as part of the
cost of the asset. A qualifying asset is an asset
which takes a substantial period of time to
get ready for its intended use or sale. Other
borrowing costs are recognised in the profit
or loss in the period in which they occur.
3. 22 Leases
3.22.1 Operating Lease
Payments made under operating leases are
recognised in profit or loss on a straight-
line basis over the term of the lease. Lease
incentives received may be recognised as an
integral part of the total lease expense, over
the lease term.
3.22.2 Finance Leases
Minimum lease payments made under
finance leases are apportioned between the
finance expense and the reduction of the
outstanding liability. The finance expense
is allocated to each period during the lease
term so as to produce a constant periodic
rate of interest on the remaining balance of
the liability.
3.23 Tax Expenses
3.23.1 Current Tax
Current tax assets and liabilities for the
current and prior years are measured at the
amount expected to be recovered from or
paid to the taxation authorities. The tax rates
and tax laws used to compute the amount
are those that are enacted or substantively
enacted by the reporting date.
Accordingly, provision for taxation is based
on the profit for the year adjusted for
taxation purposes in accordance with the
provisions of the Inland Revenue Act No. 10
of 2006 and the amendments thereto at the
rates specified below.
3.23.2 Deferred Tax
Deferred tax is provided on temporary
differences at the reporting date between
the tax bases of assets and liabilities
and their carrying amounts for financial
reporting purposes. Deferred tax liabilities
are recognised for all taxable temporary
differences, except:
• Where the deferred tax liability arises from
the initial recognition of goodwill or of
an asset or liability in a transaction that
is not a business combination and, at the

Pg. 102Cargills (Ceylon) PLC - Annual Report 2015/16
time of the transaction, affects neither
the accounting profit nor taxable profit or
loss; and
• In respect of taxable temporary
differences associated with investments
in subsidiaries, where the timing of the
reversal of the temporary differences can
be controlled and it is probable that the
temporary differences will not reverse in
the foreseeable future
Deferred tax assets are recognised for all
deductible temporary differences, carry
forward of unused tax credits and unused tax
losses, to the extent that it is probable that
taxable profit will be available against which
the deductible temporary differences, and
the carry forward of unused tax credits and
unused tax losses can be utilised except:
• Where the deferred tax asset relating
to the deductible temporary difference
arises from the initial recognition of an
asset or liability in a transaction that is
not a business combination and, at the
time of the transaction, affects neither
the accounting profit nor taxable profit or
loss; and
• In respect of deductible temporary
differences associated with investments
in subsidiaries, deferred tax assets are
recognised only to the extent that it is
probable that the temporary differences
will reverse in the foreseeable future and
taxable profit will be available against
which the temporary differences can be
utilized
The carrying amount of deferred tax assets is
reviewed at each reporting date and reduced
to the extent that it is no longer probable
that sufficient taxable profit will be available
to allow all or part of the deferred tax asset
to be utilised. Unrecognised deferred tax
assets are reassessed at each reporting date
and are recognised to the extent that it
has become probable that future taxable
profit will allow the deferred tax asset to be
recovered.
Deferred tax assets and liabilities are
measured at the tax rates that are expected
to apply in the year when the asset is realised
or the liability is settled, based on tax rates
(and tax laws) that have been enacted or
substantively enacted at the reporting date.
Current tax and deferred tax relating to
items recognised directly in equity are
also recognised in equity and not in the
Statement of Profit or Loss.
Deferred tax assets and deferred tax liabilities
are offset if a legally enforceable right exists
to set off current tax assets against current
tax liabilities and the deferred taxes relate
to the same taxable entity and the same
taxation authority.
3.23.3 Withholding Tax on Dividends,
Distributed by the Company and
Subsidiaries
Withholding tax on dividends distributed
by the Company
Withholding tax that arises from the
distribution of dividends by the Company is
recognised at the time the liability to pay the
related dividend is recognised.
Withholding tax on dividends distributed
by the Subsidiaries and Associates
Dividends received by the Company from its
Subsidiaries and Associates, have attracted a
10% deduction at source.
3.24 Earnings per Share (EPS)
Basic EPS is calculated by dividing the profit
or loss attributable to ordinary shareholders
of the Group by the weighted average
number of ordinary shares outstanding
during the period. Diluted EPS is determined
by adjusting the profit or loss attributable
to ordinary shareholders and the weighted
average number of ordinary shares
outstanding for the effects of all dilutive
potential ordinary shares.
3.25 Segment Reporting
The Group’s primary segments are retail,
fast moving consumer goods (FMCG) and
restaurant. There are no distinguishable
components to be identified as geographical
segments for the Group.
A segment is a distinguishable component
of the Group that is engaged in providing
products and services. (Business segment,
which is subject to risks and rewards that are
different from those of other segments).
Segment results, assets and liabilities include
items directly attributable to a segment as
well as those that can be allocated on a
reasonable basis.
The accounting policies adopted for
segment reporting are those accounting
policies adopted for preparing the Financial
Statements of the Group.
Inter-segment pricing is determined at prices
mutually agreed by the companies
3.26 Related Party ransaction
Disclosure has been made in respect of
the transactions in which one party has
the ability to control or exercise significant
influence over the financial and operating
policies/decisions of the other, irrespective of
whether a price is being charged or not.
The relevant details are disclosed in the
respective notes to the Financial Statements.
3.27 Statement of Cash Flows
The Statement of Cash Flows has been
prepared by using the ‘Indirect Method’ of
preparing cash flows in accordance with the
Sri Lanka Accounting Standard – LKAS 7 on
‘Statement of Cash Flow’, whereby operating
activities, investing activities and financing
activities are separately recognised. Cash and
Cash Equivalents comprise of short-term,
Notes to the Financial Statements contd.

& 103Pg. 102
highly liquid investments that are readily
convertible to known amounts of cash and
are subject to an insignificant risk of changes
in value. Cash and Cash Equivalents as
referred to in the Statement of Cash Flow
are comprised of those items as explained in
note 25.
3.28 Standards Issued but not yet
Effective
The following Sri Lanka Accounting
Standards have been issued by the Institute
of Chartered Accountants of Sri Lanka which
are not yet effective as at 31st March 2016.
SLFRS 9 - Financial Instruments:
Classification and Measurement
SLFRS 9, as issued, reflects the first phase
of work on replacement of LKAS 39 and
applies to classification and measurement of
financial assets and liabilities as defined in
LKAS 39.
SLFRS 9 was issued in 2012 and effective
date of this standard has been deferred until
1st January 2018 further notice.
SLFRS 15 - Revenue from contracts with
customers
The objective of this standard is to establish
the principles that an entity shall apply to
report useful information to users of financial
statements about the nature, amount, timing
and uncertainty of revenue and cash flows
arising from a contract with a customer.
SLFRS 15 will become effective on 1st
January 2018.
The impact on the implementation of the
above standard has not been quantified yet.

Pg. 104Cargills (Ceylon) PLC - Annual Report 2015/16
4. Revenue
Group Company
2016 2015 2016 2015
Rs. '000 Rs. '000 Rs. '000 Rs. '000
Gross revenue 77,249,542 67,422,455 34,982 168,071
Revenue related taxes (5,807,692) (5,791,170) (1,359) (14,996)
Net revenue 71,441,850 61,631,285 33,623 153,075
The Group primarily has three business segments namely, Retail, Fast Moving Consumer Goods (FMCG) and Restaurant, segmental information
are disclosed in note 31.
5. Cost of sales
Cost of sales of the Company and Group includes direct operating cost.
6. Other income
Group Company
2016 2015 2016 2015
Rs. '000 Rs. '000 Rs. '000 Rs. '000
Dividend income 720 811 827,104 514,478
Rental income 34,248 104,178 191,851 332,964
Profit on sale of property, plant and equipment 24,846 17,010 3,475 625,181
Management fee - - 594,090 564,725
Merchandising income 1,396,115 1,174,386 - 2,198
Foreign exchange gain 9,385 8,040 - -
Commission Income - 2,560 - -
Amortisation of deferred income
- Capital grant 11,481 10,471 - -
- Revenue grant - 1,709 - -
Sundry income 72,463 107,752 1,965 -
1,549,258 1,426,917 1,618,485 2,039,546
Notes to the Financial Statements contd.

& 105Pg. 104
7. Net finance cost
Group Company
2016 2015 2016 2015
Rs. '000 Rs. '000 Rs. '000 Rs. '000
7.1 Finance income
- Interest income 193,455 213,854 131,660 282,036
193,455 213,854 131,660 282,036
7.2 Finance cost on;
- Short term loans 463,535 755,364 203,484 575,073
- Bank overdrafts 189,268 145,656 116,159 121,072
- Other loans and bank charges 144,121 144,283 6,535 77,624
- Staff security deposits 675 678 - -
797,599 1,045,981 326,178 773,769
Net finance cost 604,144 832,127 194,518 491,733
Borrowing cost capitalized by the Group and the Company on qualifying assets during the financial year and year 2015 are nil.
8. Profit before taxation
Profit before taxation on continuing operations are stated after charging/(crediting) all expenses/(income) including the following:
Group Company
2016 2015 2016 2015
Rs. '000 Rs. '000 Rs. '000 Rs. '000
Staff costs (note 8.1) 4,870,513 3,841,161 214,029 241,103
Auditors' remuneration
- Audit 6,859 6,347 699 635
- Non audit services 1,719 366 609 366
Depreciation on property, plant and equipment (note 13) 1,682,156 1,567,531 35,965 45,858
Amortisation of intangible assets (note 15) 36,254 20,536 - -
Foreign exchange gain (note 06) (9,385) (8,040) - -
Reversal of provision for inventories (19,838) (25,087) - -
Directors' emoluments 232,032 206,525 36,311 103,322
8.1 Staff costs
Salaries, wages and other costs 4,371,863 3,411,260 151,421 172,220
Pension costs - Employee benefits (note 28.3) 118,748 101,921 45,643 43,706
Defined contribution plan cost - EPF and ETF 379,902 327,980 16,965 25,177
4,870,513 3,841,161 214,029 241,103
Number of employees as at 31 March 8,738 7,826 1,870 1,729

Pg. 106Cargills (Ceylon) PLC - Annual Report 2015/16
9. Income tax expense
Group Company
2016 2015 2016 2015
Rs. '000 Rs. '000 Rs. '000 Rs. '000
Current income tax
Current tax charge (note 9.1) 862,020 704,419 86,010 408,369
Dividend tax 124,622 57,645 - -
Under provision of current tax of previous years - 69,735 - 69,735
Deferred income tax (note 9.2) 208,785 (274,363) 13,825 (406,173)
1,195,427 557,436 99,835 71,931
(a) The tax liability of companies are computed at the standard rate of 28% or 40% except for the following companies which enjoy full or
partial exemptions and concessions.
Cargills Quality Confectioneries (Private) Limited is exempt from income tax till the year of assessment 2017/2018 in accordance with the
provisions of the Inland Revenue Act No. 10 of 2006 and subsequent amendments thereto.
Cargills Quality Dairies (Private) Limited, Cargills Quality Foods Limited, Cargills Agrifoods Limited and Kotmale Dairy Products (Private) Limited are
subject to a concessionary tax rate of 10% under the Inland Revenue Act No. 10 of 2006 and subsequent amendments thereto. However, as the
Department of Inland revenue is contesting the income tax exemptions claimed, provisions have been made for income tax at the normal rate for
the financial years ended 31 March 2012, 31 March 2013, 31 March 2014, 31 March 2015 and 31 March 2016 although tax returns continue to
be filed based on concessionary tax rate.
(b) During the year the company and the subsidiaries paid Economic Service Charge (ESC) amounting to nil (2015 - Rs. 1.04 Mn) and Rs. 130.9
Mn (2015 - Rs. 62.4 Mn) respectively.
Notes to the Financial Statements contd.

& 107Pg. 106
9.1 Reconciliation between current tax charge and profit before taxation is given below :
Group Company
2016 2015 2016 2015
Rs. '000 Rs. '000 Rs. '000 Rs. '000
Profit before taxation 2,886,008 804,653 879,017 144,274
Aggregate disallowed expenses 2,573,471 5,080,294 453,735 2,926,516
Aggregate allowable expenses (2,604,297) (3,424,523) (134,696) (160,736)
Aggregate other income (240,749) (121,748) (1,024,297) (1,237,495)
Adjusted business profit 2,614,433 2,338,676 173,759 1,672,559
Tax losses incurred 313,428 376,544 - -
Taxable income from other sources 199,775 51,996 131,660 -
Adjusted profit (a) 3,127,636 2,767,216 305,419 1,672,559
Tax losses brought forward 1,628,580 2,655,134 - 80,385
Tax losses added (note 9.1.1) 313,428 1,244,146 - -
Tax losses of disposed subsidiary - (2,191,652) - -
Tax losses utilised (b) (76,398) (334,762) - (279,861)
Adjustment on finalisation of liability (72,745) 255,714 - 199,476
Tax losses carried forward 1,792,865 1,628,580 - -
Taxable income (a+b) 3,051,238 2,432,454 305,419 1,392,698
Income tax @ 28% 833,139 626,646 84,367 346,990
Income tax @ 12% 607 - - -
Income tax @ 40% 28,274 77,773 1,643 61,379
Current tax charge 862,020 704,419 86,010 408,369
9.1.1 Tax losses added
Tax losses incurred by continuing operations 313,428 376,544 - -
Tax losses incurred by discontinued operations - 867,602 - -
313,428 1,244,146 - -
9.2 Deferred income tax
Deferred tax expense arising from;
Operating lease liability (13,409) (104,538) - -
Accelerated depreciation for tax purposes 337,743 (166,696) 23,905 (434,545)
Provisions (7,646) (13,015) - -
Employee benefits (26,314) (18,696) (10,080) 28,372
Benefit arising from tax losses (22,197) (36,766) - -
Deferred income 2,737 3,219 - -
Increase / (decrease) in future tax rate (62,129) 62,129 - -
Deferred tax charge / (release) 208,785 (274,363) 13,825 (406,173)
Deferred tax has been computed taking into consideration the tax rates effective from 1 April 2015 which is 28% or 40% for all standard rate
companies. The deferred tax effect on undistributed reserves of subsidiaries has not been recognised since the Parent can control the timing of
the reversal of these temporary differences.

Pg. 108Cargills (Ceylon) PLC - Annual Report 2015/16
9. Income tax expense (contd.)
9.3 Temporary differences associated with subsidiary companies, Cargills Food Services (Private) Limited, Kotmale Milk Products Limited, and
Kotmale Milk Foods Limited, for which deferred tax assets have not been recognized, are as follows.
2016 2015
Temporary Tax Temporary Tax
difference effect on difference effect on
temporary temporary
difference difference
Rs. '000 Rs. '000 Rs. '000 Rs. '000
Deductible temporary differences 1,914 536 1,914 536
Tax losses 209,664 31,206 147,983 23,729
209,664 31,206 149,897 24,265
No deferred tax is recognised with respect to the above temporary differences since it is probable that the companies mentioned will not
generate sufficient taxable profits in the near future, against which deferred taxation can be recognised in accordance with LKAS 12 - “Income
taxes”
10. Discontinued operations
10.1 Disposal of Millers Brewery Limited (MBL)
On 30th October 2014, the Company disposed of its entire stake in Millers Brewery Limited comprising 17,050,002 shares (100% stake) at a
consideration of Rs. 1,150 Mn (Rs.67.45 per share). Consequently, the interest of the Company in Millers Brewery Limited ceased on the date of
disposal.
Prior to disposal of entire stake in Millers Brewery Limited on, 30th September 2014, Millers Brewery Limited repurchased 2,950,000 it's own
shares at a consideration of Rs. 204 Mn(Rs. 69.16 per share)
10.2 Analysis of profit for the year from discontinued operations
The combined results of the discontinued operation included in the profit of 2015 are set out below (page 109).
Notes to the Financial Statements contd.

& 109Pg. 108
(a) Profit for the year from discontinued operations
2015
Rs. '000
Revenue 557,847
Cost of sales (515,348)
Gross profit 42,499
Other Income 3,340,793
Expenses (784,006)
Finance cost (133,399)
Profit before taxation 2,465,887
Income tax expense
Profit for the year 2,465,887
Other comprehensive income
Other comprehensive income for the year net of tax -
Total comprehensive income for the period 2,465,887
Loss on sale of discontinued operation (note 10.(e).) (2,113,126)
Profit attributable to
Equity shareholders of the company 352,761
352,761
Total comprehensive income attributable to
Equity shareholders of the company 352,761
352,761
(b) Cash flows from discontinued operations
Net cash used in operating activities (3,167,639)
Net cash generated from investing activities 3,977,527
Net cash used in financing activities (701,022)
Net cash increase 108,866

Pg. 110Cargills (Ceylon) PLC - Annual Report 2015/16
(c) Analysis of assets and liabilities over which control was lost
30/10/2014
Rs. '000
Non-current assets
Property, plant and equipment 3,236,853
Deferred tax asset 195,152
3,432,005
Current-assets
Trade and other receivables 32,497
Cash and cash equivalents 18,568
51,065
Non-current liabilities
Deferred tax liability 195,152
195,152
Current-liabilities
Trade and other payables 24,792
24,792
Net assets disposed off 3,263,126
(d) Earnings per share
Earnings per share from discontinued operations 123
(e) Loss on disposal of subsidiary
Consideration received in cash and cash equivalents 1,150,000
Net assets disposed off 3,263,126
Loss on disposal (2,113,126)
(f) Loss on disposal of investment
Consideration on share repurchase 204,023
Carrying value of shares repurchased (296,475)
(92,452)
Consideration received in cash and cash equivalents for disposal of investment 1,150,000
Carrying value of investment as at 31/10/2014 (1,713,525)
(563,525)
Loss on disposal of investment in Millers brewery Limited (655,977)
Notes to the Financial Statements contd.

& 111Pg. 110
11. Earnings per share
Group Company
Continuing Discontinued Total Continuing Discontinued Total operations operations operations operations 2016 2016 2016 2015 2015 2015 2016 2015
Profit attributable to equity
shareholders of the parent (Rs. '000) 1,623,986 - 1,623,986 223,418 352,761 576,179 779,182 72,343
Weighted average number of ordinary shares 224,000,000 - 224,000,000 224,000,000 - 224,000,000 224,000,000 224,000,000
Basic earnings per share (Rs.) 7.25 - 7.25 0.99 - 2.57 3.48 0.32
Basic earnings per share is calculated by dividing the profit attributable to equity shareholders of Cargills (Ceylon) PLC by the weighted average
number of ordinary shares in issue.
As there were no dilutive potential ordinary shares outstanding at the year end, dilutive earning per share is equal to basic earning per share for
the year.
12. Dividend per share
Group Company
2016 2015 2016 2015 Rs. Rs. '000 Rs. Rs. '000 Rs. Rs. ‘000 Rs. Rs. '000
Dividends for the year
Interim - paid 1.25 280,000 0.70 156,800 1.25 280,000 0.70 156,800
Final - proposed 2.25 504,000 1.30 291,200 2.25 504,000 1.30 291,200
3.50 784,000 2.00 448,000 3.50 784,000 2.00 448,000
An interim dividend of Rs. 1.25 per share (Rs. 280Mn) was paid on 13th January 2016 for the year ended 31st March 2016. A final dividend of
Rs. 2.25 Rupee per share is proposed for the year ended 31st March 2016. The final dividend proposed on 09th June 2016, has not been
recognised as at the reporting date in compliance with LKAS 10 - “Events After the Reporting Period”.

Pg. 112Cargills (Ceylon) PLC - Annual Report 2015/16
13. Property plant and equipment
Freehold Freehold Expenditure Plant, Motor
land building incurred on machinery vehicles
leasehold and others Total Total
building 2016 2015
Rs. '000 Rs. '000 Rs. '000 Rs. '000 Rs. '000 Rs. '000 Rs. '000
Group
Cost / revaluation
As at 1 April 8,079,940 2,026,296 4,845,391 11,920,789 870,387 27,742,803 27,667,502
Additions 525,392 131,689 405,048 1,053,859 148,923 2,264,911 1,788,079
Revaluation 758,976 162,124 - - - 921,100
Disposal of subsidiary - - - - - - (1,579,705)
Disposals - - - (13,133) (21,857) (34,990) (133,073)
Impairment - - - (15,430) (432) (15,862) -
As at 31 March 9,364,308 2,320,109 5,250,439 12,946,085 997,021 30,877,962 27,742,803
Depreciation / Impairment
As at 1 April - 488,158 2,356,861 6,405,970 626,370 9,877,359 8,624,196
Charge for the year - 74,583 470,781 1,011,088 125,704 1,682,156 1,637,996
Disposal of subsidiary - - - - - - (327,998)
Disposals - - - (7,688) (20,697) (28,385) (99,764)
Impairment - - - (14,543) (397) (14,940) 42,929
As at 31 March - 562,741 2,827,642 7,394,827 730,980 11,516,190 9,877,359
Carrying value 17,865,444
Capital work in progress - - - - - 904,312 2,953,596
Disposal of subsidiary - - - - - - (1,985,146)
Carrying value as at 31 March 9,364,308 1,757,368 2,422,797 5,551,258 266,041 20,266,084 18,833,894
Company
Cost / revaluation
As at 1 April 2,416,000 441,662 3,536 172,729 138,719 3,172,646 3,212,460
Additions - 15,515 - 21,847 - 37,362 33,376
Revaluation 72,292 (6,443) - - - 65,849 -
Disposals - - - - (2,563) (2,563) (73,190)
As at 31 March 2,488,292 450,734 3,536 194,576 136,156 3,273,294 3,172,646
Depreciation / Impairment
As at 1 April - 34,623 368 121,091 121,682 277,764 236,656
Charge for the year - 8,311 882 16,985 9,787 35,965 45,858
Disposals - - - - (2,563) (2,563) (4,750)
As at 31 March - 42,934 1,250 138,076 128,906 311,166 277,764
Carrying value - - - - - 2,962,128 2,894,882
Capital work in progress - - - - - 19,667 35,045
Carrying value as at 31 March 2,488,292 407,800 2,286 56,500 7,250 2,981,795 2,929,927
Notes to the Financial Statements contd.

& 113Pg. 112
Expenditure incurred on leasehold building represent the cost incurred in setting up new outlets.
Free hold lands and buildings owned by the Group are revalued once in three years by an independent professional valuer. The latest revaluation
was carried out and accounted for as at 31 March 2016.
Those revaluations had been carried out in conformity with the requirements of LKAS 16 - “Property, plant and equipment”. The surplus on
revaluation was credited to the revaluation reserve account.
The details of assets mortgaged for banking facilities obtained have been given in the note 26.2 to the financial statements.
13.1 If land and buildings were stated at the historical cost basis, the amounts would have been as follows:
Land Building
2016 2015 2016 2015
Rs. '000 Rs. '000 Rs. '000 Rs. '000
Group
Cost 2,036,153 1,510,761 1,368,429 1,236,740
Accumulated depreciation - - (377,889) (352,333)
Net book value 2,036,153 1,510,761 990,540 884,407
Company
Cost 85,081 85,081 39,961 24,446
Accumulated depreciation - - (9,197) (8,398)
Net book value 85,081 85,081 30,764 16,048
Depreciation to the value of Rs. 1,348.3 Mn (2015 - Rs. 1,245.36 Mn) and Rs. 333.8 Mn (2015 - Rs. 322.17 Mn) has been charged respectively
to the cost of goods sold and distribution, administration and other expenses of the Group and depreciation charge of Millers Brewery Limited
amounting to Rs. 70.47 Mn in 2015 has been charged in arriving at profit/(loss) of discontinued operation. Depreciation to the value of nil (2015
- nil) and Rs. 35.97 Mn (2015 - Rs. 45.86 Mn) have been charged respectively to the cost of goods sold and distribution and other expenses of the
Company.
Capital work in progress consists of expenditure incurred on projects which are not completed and commenced business operations as at the
reporting date.
Fully depreciated assets of the Group as at the year end is Rs. 2,354.35 Mn (2015 - 2,079.15 Mn) and that of the Company is Rs. 224.14 Mn
(2015 - Rs. 171.28 Mn).

Pg. 114Cargills (Ceylon) PLC - Annual Report 2015/16
14. Investment property
Group Company
2016 2015 2016 2015
Rs. '000 Rs. '000 Rs. '000 Rs. '000
As at 1st April 3,490,548 3,350,095 4,855,900 4,633,250
Additions - 75,263 525,392 124,814
Changes in fair value during the year 53,016 65,190 62,059 97,836
3,543,564 3,490,548 5,443,351 4,855,900
In accordance with LKAS 40, fair value of the above Investment Properties were ascertained as at 31 March 2016 by Mr. T Weeratne (FIV), an
independent professional valuer.
Rental income earned from investment properties by the Group and Company amounts to Rs. 28.39 Mn (2015 - Rs. 39.54 Mn) and Rs. 108.38
Mn (2015 - Rs. 109.25 Mn) respectively. Direct operating expenses incurred on investment property by Group and Company amounts to Rs. 19.46
Mn (2015 - Rs. 16.56 Mn) and Rs. 43.50 Mn (2015 - Rs. 38.5 Mn).
Location Method of valuation
Effective date of valuation
Property valuer
Land extent
No of buildings
Significant unobservable inputs
2016 Valuation
Rs. '000
2015 Valuation
Rs. '000
Canal Row, Colombo 01
Open market value
31/03/2016 Mr. Tissa Weeratne FIVSL
15 Perches 1 Market value per perch
325,000 310,000
Vauxhall street Open market value
31/03/2016 Mr. Tissa Weeratne FIVSL
1.5 Acres 2 Market value per perch
2,253,800 2,207,000
Braybrook place Open market value
31/03/2016 Mr. Tissa Weeratne FIVSL
78 Perches 2 Market value per perch
627,800 616,400
Cargills Square-Jaffna
Income approach
31/03/2016 Mr. Tissa Weeratne FIVSL
Leasehold 1 Rental per square feet
922,000 950,000
Staple Street - Colombo 02
Open market value
31/03/2016 Mr. Tissa Weeratne FIVSL
82 Perches 3 Market value per perch
776,750 772,500
Moratuwa Open market value
31/03/2016 Mr. Tissa Weeratne FIVSL
78.6 Perches
- Market value per perch
255,500 -
Dematagoda Open market value
31/03/2016 Mr. Tissa Weeratne FIVSL
84 Perches - Market value per perch
282,500 -
Notes to the Financial Statements contd.

& 115Pg. 114
15. Intangible assets Goodwill Franchisee free Software Brand name Total
2016 2015 2016 2015 2016 2015 2016 2015 2016 2015
Rs. '000 Rs. '000 Rs. '000 Rs. '000 Rs. '000 Rs. '000 Rs. '000 Rs. '000 Rs. '000 Rs. '000
Gross value As at 1 April 396,571 396,571 180,671 171,106 41,213 32,502 1,331,865 1,331,865 1,950,320 1,932,044Additions - - 3,503 9,565 74,442 8,711 - - 77,945 18,276As at 31 March 396,571 396,571 184,174 180,671 115,655 41,213 1,331,865 1,331,865 2,028,265 1,950,320
Amortisation/Impairment As at 1 April 138,978 138,978 81,022 65,323 24,588 19,751 670,000 - 914,588 224,052Amortisation for the year - - 13,999 15,699 22,255 4,837 - - 36,254 20,536Disposal - - - - - - - 670,000 - 670,000As at 31 March 138,978 138,978 95,021 81,022 46,843 24,588 670,000 670,000 950,842 914,588
Carrying value as at 31st March 257,593 257,593 89,153 99,649 68,812 16,625 661,865 661,865 1,077,423 1,035,732
Goodwill as at the reporting date has been tested for impairment and found no impairment in carrying value.
The Rs. 661.9 Mn represents the brand value recognised on the business combination of Kothmale Holdings PLC.
Brand has been tested for impairment and found no impairment as at reporting date. Management is in the view that the brand name has
an infinite useful life and accordingly no amortisation is charged . However, in accordance with LKAS 38 - 'Intangible Assets', any intangible
asset which has infinite useful life is subject to annual impairment test which is to be carried out in accordance with LKAS 36 - 'Impairment of
Assets'.
Amortisation of intangible assets of Rs. 15.31 Mn (2015 - 17.01 Mn) have been included in cost of goods sold and Rs. 20.94 Mn (2015 - 3.52
Mn) in administrative expenses and other expenses.
16. Investments
Group Company
No of Holding 2016 2015 2016 2015
Shares Rs. '000 Rs. '000 Rs. '000 Rs. '000
16.1 Investments in subsidiaries
Cargills Foods Company (Private) Limited 47,500,002 92% - - 475,000 475,000
Cargills Quality Foods Limited 4,860,291 100% - - 1,193,453 1,193,453
Dawson Office Complex (Private) Limited 1,001 100% - - 100 100
Kotmale Holdings PLC 1,667,401 5.31% - - 105,392 105,392
- - 1,773,945 1,773,945
Cargills Quality Foods Limited and Dawson Office Complex (Private) Limited are subsidiaries of Cargills (Ceylon) PLC (CCP). The financial
statements of said subsidiaries have been consolidated with that of Cargills (Ceylon) PLC as 100% subsidiaries. Cargills Foods Company (Private)
Limited is a subsidiary of Cargills (Ceylon) PLC, and in which CCP has 92% stake and the Financial Statements of the said subsidiary has been
consolidated with Cargills (Ceylon) PLC

Pg. 116Cargills (Ceylon) PLC - Annual Report 2015/16
Cargills Agrifoods Limited, CPC Lanka Limited, Cargills Quality Dairies (Private) Limited (CQD), Cargills Distributors (Private) Limited, Cargills Food
Processors (Private) Limited (CFP), Millers Limited and Cargills Quality Confectioneries (Private) Limited are subsidiaries of Cargills Quality Foods
Limited (CQF). The financial statements of the said subsidiaries of CQF have been consolidated as 100% subsidiaries in view of the minority
shareholders (subscriber shares) confirming that they hold the shares in trust for CQF.
Cargills Frozen Products (Private) Limited is a subsidiary of CQD. The financial statements of the said subsidiary of CQD have been consolidated as
100% subsidiary of CQF and CCP.
Cargills Food Services (Private) Limited is a subsidiary of CFP. The financial statements of the said subsidiary of CFP have been consolidated as a
100% subsidiary of CQF and CCP.
In months of June and July 2014 CQD acquired 193,501 shares at a total cost of Rs. 10.75 Mn and on 10th September 2014 in terms of rule
24 of the Company take-overs and merger code 1995 as amended in 2003 CCP made a voluntary offer to acquire all the remaining shares of
Kotmale Holding PLC (KHP) not already owned by CCP or any other person acting in concert with CCP and on months of September, October,
November and December 2014 CCP acquired 814,689 shares at a total cost of Rs. 51.25 Mn and on 14th January 2015 CCP made the
announcement to exercise its option in terms of sec.246 of Companies Act No.7 of 2007 to compulsorily acquire the balance shares of the KHP
held by shareholder who did not accept the voluntary offer at the price of Rs. 62.50 per share. Consequent to this offer, the remaining shares
amounting to 852,712 were acquired at a total cost of Rs. 54.14 Mn by CCP during the month of February under reference, in terms of sec. 246
of the Companies Act, and the applications for transfer of the said shares outside the trading system are pending with the SEC. At the conclusion
of this process, CCP will be the sole shareholder of KHP and will proceed to seek a de-listing of the shares from the Official List of the Colombo
Stock Exchange.
The financial statements of Kotmale Dairy Products (Private) Limited, Kotmale Marketing (Private) Limited Kotmale Milk Foods Limited, Kotmale
Milk Products Limited and Kotmale Products (Private) Limited have been consolidated with that of Kotmale Holdings PLC as 100% subsidiaries.
Kotmale Holdings PLC initiated measures to have its subsidiary Company Kotmale Kiri (Pvt) Ltd. (Which has been dormant since February 2007)
struck off the Company Register under the provisions of Section 394 (3) of the Companies Act No 07 of 2007. Accordingly Kotmale Kiri (Pvt) Ltd.
has been struck off the Company Register effective 10 October 2015.
During the year 2015, CCP and CQD a wholly owned subsidiary of the Company, acquired 1,860,902 ordinary shares of the subsidiary Kotmale
Holdings PLC at a total purchase consideration of Rs. 116.14 Mn and the value of net assets acquired was Rs. 53.015 Mn and resulting excess
payment of Rs. 63.129 Mn has been charged to the retained earnings in the statement of changes in equity. With these partial acquisitions, the
shareholding in Kotmale Holdings PLC increased to 100% from 94.07%.
Notes to the Financial Statements contd.

& 117Pg. 116
16.1.1 Changing ownership without change in control in subsidiary
Cargills Foods Company (Private) Limited (CFC) is a subsidiary of the Company, issued 4,130,424 ordinary shares by way of a private placement
on 25th February 2015, which resulted in an increase in net assets of CFC and decrease in ownership interest of the Company in CFC from 100%
to 92%. The Group recognised non-controlling interest amounting to Rs. 321.09 Mn as at 31st March 2015 and increase in retained earnings
amounting to Rs. 2,216.16 Mn.
Group Company
No of 2016 2015 2016 2015
Shares Holding Rs. '000 Rs. '000 Rs. '000 Rs. '000
16.2 Investment in associate
Unquoted :
C T Properties Limited 21,500,000 15.63% 140,640 177,689 140,640 178,765
Cargills Bank Limited 88,000,000 18.22% 889,013 916,010 908,738 908,738
1,029,653 1,093,699 1,049,378 1,087,503
Investment Advance
Cargills Bank Limited 1,276,000 - 1,276,000 -
1,276,000 - 1,276,000 -
2,305,653 1,093,699 2,325,378 1,087,503
16.2.a
An impairment amounting to Rs. 38.13 Mn (2015 - Rs. 37.31 Mn) and Rs. 36.01 Mn (2015 - Rs.180.91 Mn) has been recognised in relation to
investment in associate of C T Properties Limited in the Company and Group respectively.
Group Company
2016 2015 2016 2015
Rs. ‘000 Rs. ‘000 Rs. ‘000 Rs. ‘000
16.3 Other financial assets
16.3.1 Available for sale financial instruments
Other quoted equity investments
Lanka IOC PLC 8,061 7,700 8,060 7,700
Sierra Cables PLC 199 84 39 16
Aitken Spence PLC 26,616 26,188 26,616 26,188
34,876 33,972 34,715 33,904
Increase/(Decrease) in fair value of investments (8,570) 903 (8,526) 811
26,306 34,875 26,189 34,715
16.3.2 Other non equity investments
Call deposits / Fixed deposit 847,828 806,594 31,171 -
Re-purchase agreements 130,172 82,359 - -
978,000 888,953 31,171 -
1,004,306 923,828 57,360 34,715
The market value of quoted short term investments of Group as at 31 March 2016, as quoted by the Colombo Stock Exchange amounted to
Rs. 26.31 Mn (2015 - Rs.34.87Mn)

Pg. 118Cargills (Ceylon) PLC - Annual Report 2015/16
16.5 Investment in associates
Group
2016 2015
Rs. '000 Rs. '000
As at 1 April 1,093,699 367,573
Acquisition - 248,738
Transfer from other long term investments - 660,000
Gain on dilution of investment in associate 38,327 -
Share of loss incurred (64,204) (198)
Share of other comprehensive income (2,367) (1,189)
OCI share of gain of dilution of investment in associate 203 -
Share of Goodwill on change in shareholding - (316)
Impairment (36,005) (180,909)
As at 31 March 1,029,653 1,093,699
16.5.a Gain on dilution of investment in associate
Amount recognised in the profit /loss 38,327 -
Amount recognised in Other Comprehensive Income 203 -
38,530 -
16.6 Summarised financial information of associates
Group
C T Properties Limited Cargills Bank Limited
2016 2015 2016 2015
Rs. '000 Rs. '000 Rs. '000 Rs. '000
Revenue 55,164 252,001 770,443 139,443
Operating expenses (36,292) (251,303) (1,094,224) (209,794)
Finance expenses (25,577) (54,383) - -
Income tax expense 54 (3,859) 8,074 115,851
Share of non controlling interest - - (118) (1,523)
Profit/(Loss) for the year (6,651) (57,544) (315,825) 43,977
Other comprehensive income (28) 116 (11,813) (6,036)
Total comprehensive income (6,679) (57,428) (327,638) 37,941
Ownership interest 15.63% 15.63% 20.00% 20.00%
Group's share of profit / (loss) (1,039) (8,993) (63,165) 8,795
Group's share of other comprehensive income (4) 18 (2,363) (1,207)
Group's share of total comprehensive income (1,044) (8,975) (65,528) 7,588
Notes to the Financial Statements contd.

& 119Pg. 118
Group
C T Properties Limited Cargills Bank Limited
2016 2015 2016 2015
Rs. ‘000 Rs. ‘000 Rs. ‘000 Rs. ‘000
Total assets 2,808,274 2,070,207 14,253,284 7,503,029
Total liabilities (1,847,132) (1,102,386) (9,336,033) (2,881,778)
Minority interest - - (77,735) (77,597)
Net assets 961,142 967,821 4,839,516 4,543,654
Ownership interest 15.63% 15.63% 18.22% 20.00%
Group's share of net assets 150,211 151,255 881,734 908,731
Goodwill 26,434 207,343 7,279 7,279
Impairment (36,005) (180,909) - -
140,640 177,689 889,013 916,010
16.6.a The shareholding of the Company in C T Properties Limited (CTPL) was reduced from 25.00% to 15.63 (approx.)% as at 31st March
2014 and remained as it is as at 31st March 2016. Nevertheless, CTPL is accounted as an associate of the Company based on the nature of the
controlling interest of the Company in CTPL.
Although the shareholding of the Company in Cargills Bank Limited as at the reporting date is 18.22%, Cargills Bank Limited is accounted as an
associate of the Company based on the nature of the controlling interest of the Company in Bank. Furthermore, Company invested Rs. 1,276 Mn
in order to acquire 88,000,000 additional shares and such shares were allotted on 10th May 2016.
16.6.b The financial year end date of Cargills Bank Limited is 31st December and this is due to industry requirement for Cargills Bank Limited.
17. Prepayment on leasehold land and building
Group
2016 2015
Rs. '000 Rs. '000
Gross value
As at 31 March 35,000 35,000
Amortisation
As at 1 April 8,751 7,875
Amortisation for the year 874 876
As at 31 March 9,625 8,751
Balance as at 31 March 25,375 26,249
Current portion of the prepayment 875 875
Non- current portion of the prepayment 24,500 25,374
25,375 26,249

Pg. 120Cargills (Ceylon) PLC - Annual Report 2015/16
18. Deferred tax
Group Company Assets Liabilities Assets Liabilities 2016 2015 2016 2015 2016 2015 2016 2015 Rs. '000 Rs. '000 Rs. '000 Rs. '000 Rs. '000 Rs. '000 Rs. '000 Rs. '000
As at 1 April 74,742 349,202 569,951 1,129,706 - - 141,711 553,812On revaluation surplus of the building (13,872) - - - - - - -Transfer between deferred tax assets & liabilities (39,288) (10,620) (39,288) (10,620) - - - -Revaluation - - 10,432 - - - (1,804) -De recognition on disposal of subsidiaries - (195,152) - (195,152) - - - -Release / (charge) for the year 41,060 (68,688) 236,455 (353,983) - - 15,463 (412,101)As at 31 March 62,642 74,742 777,550 569,951 - - 155,370 141,711
Deferred tax assets as at the year end is made up as follows: Deferred tax assets arising from - Temporary difference of property, plant and equipment (44,313) (236,996) 1,000,036 637,697 - - 111,956 88,054- Temporary difference of revaluation surplus of building (23,314) (28,196) 144,444 149,486 - - 115,016 116,817- Temporary difference on provisions 7,282 23,418 (36,766) (8,982) - - - -- Temporary difference of employee benefits 3,356 76,276 (174,018) (68,558) - - (71,602) (63,160)- Temporary difference on deferred income - 26,498 (23,761) - - - - -- Temporary difference of carry forward tax losses 119,631 304,356 (18,438) (6,669) - - - -.- Temporary difference of operating lease liability - 104,538 (117,947) - - - - -- Temporary difference of increase in future tax rates - - - 62,129 - - - - 62,642 269,894 777,550 765,103 - - 155,370 141,711Derecognition on disposal of subsidiary - Temporary difference of carry forward tax losses - (195,152) - - - - - -Derecognition on disposal of subsidiary - Temporary difference of property plant and equipment - - - (168,083) - - - -Derecognition on disposal of subsidiary - Temporary difference of revaluation surplus of building - - - (27,069) - - - - 62,642 74,742 777,550 569,951 - - 155,370 141,711
Release / (charge) for the year Continuing operations 27,188 10,982 (246,887) (274,313) - - (13,659) (412,101)Discontinuing operations - (79,670) - (79,670) - - - - 27,188 (68,688) (246,887) (353,983) - - (13,659) (412,101)
Reversal/(origination) of deferred tax - Discontinuing operations Total expense released/(charged) to profit or loss - (79,670) - (79,670) - - - -Total expense Released/(charged) to OCI - - - - - - - - - (79,670) - (79,670) - - - -
Reversal/(origination) of deferred tax - continuing operationsTotal expense released/(charged) to profit or loss 32,337 6,217 (241,121) (268,147) - - (13,825) (406,173)Total expense Released/(charged) to OCI (5,149) 4,765 (5,766) (6,166) - - 166 (5,927) 27,188 10,982 (246,887) (274,313) - - (13,659) (412,101)
Reversal/(origination) of deferred tax Total expense released/(charged) to profit or loss 32,337 (73,453) (241,121) (347,817) - - (13,825) (406,173)Total expense Released/(charged) to OCI (5,149) 4,765 (5,766) (6,166) - - 166 (5,927) 27,188 (68,688) (246,887) (353,983) - - (13,659) (412,101)
Deferred tax assets of Rs. 48.25 Mn, Rs. 8.01 Mn and Rs. 6.38 Mn respectively arising from the subsidiaries Cargills Quality Foods Limited, Cargills Food Services (Private) Limited and Millers Limited have been recognized.
Notes to the Financial Statements contd.

& 121Pg. 120
19. Inventories
Group Company
2016 2015 2016 2015
Rs. '000 Rs. '000 Rs. '000 Rs. '000
Raw and packing materials 747,444 645,997 - -
Work in progress 57,362 34,039 - -
Finished goods 763,611 187,661 - -
Merchandising stock for sale 5,291,602 5,069,766 9,986 29,218
Food and beverages - restaurant operations 59,259 59,987 - -
Consumables 139,472 123,574 - -
7,058,750 6,121,024 9,986 29,218
Provision for obsolete inventories (8,918) (28,756) - -
7,049,832 6,092,268 9,986 29,218
Goods in transit 144,946 125,316 - -
7,194,778 6,217,584 9,986 29,218
The details of inventories mortgaged for banking facilities obtained have been given in the note 26.2 to the financial statements.
20. Trade and other receivables
Group Company
2016 2015 2016 2015
Rs. '000 Rs. '000 Rs. '000 Rs. '000
Trade receivables 1,893,377 1,565,959 10,510 10,302
Impairment of trade receivables (95,964) (91,546) (4,074) (5,573)
1,797,413 1,474,413 6,436 4,729
Prepayments and deposits 1,120,079 1,187,911 584,280 592,893
Other receivables 259,923 222,467 8,696 5,756
Loans and advances (note 20.1) 17,691 13,086 11,503 10,261
Tax recoverable (note 20.2) 376,786 196,469 22,584 18,989
3,571,892 3,094,346 633,499 632,628
The details of trade receivable mortgaged for banking facilities obtained have been given in the note 26.2 to the financial statements.
20.1 Loans and advances represents loans to employees and the movement during the year is as follows:
Group Company
2016 2015 2016 2015
Rs. ‘000 Rs. ‘000 Rs. ‘000 Rs. ‘000
As at 1 April 13,086 20,047 10,261 19,320
Loans granted 28,672 24,776 10,323 14,984
41,758 48,823 20,584 34,304
Repayments (24,067) (31,737) (9,081) (24,043)
As at 31 March 17,691 13,086 11,503 10,261
20.2 Tax recoverable
This includes Economic Service Charge, VAT recoverable, WHT recoverable and Income tax overpayments.

Pg. 122Cargills (Ceylon) PLC - Annual Report 2015/16
21. Amounts due from/due to related companies
Group Company
2016 2015 2016 2015
Rs. ‘000 Rs. ‘000 Rs. ‘000 Rs. ‘000
Amounts due from subsidiaries
Cargills Foods Company (Private) Limited - - 12,390 1,543,909
Cargills Agrifoods Limited - - - 7,628
Cargills Quality Foods Limited - - - 152,484
Cargills Quality Dairies (Private) Limited - - - 2,129
Cargills Distributors (Private) Limited - - - 71
Cargills Food Services (Private) Limited - - - 7,175
CPC (Lanka) Limited - - 184 64
Dawson Office Complex (Private) Limited - - 257,897 259,954
Cargills Quality Confectioneries (Private) Limited - - 1,902 -
Millers Limited - - 2,360 1,931
Kotmale Dairy Products Limited - - 2,795 16,739
Kotmale Holdings PLC - - 5,097 -
- - 282,625 1,992,084
Amounts due from holding company
C T Holdings PLC 836 18,056 - 17,454
836 18,056 - 17,454
Amounts due from other related companies
Cargills Bank Limited 19,411 19,350 18,955 18,823
Ceylon Hotels Corporation PLC 228 154 - -
Ceylon Theatres (Private) Limited 31,951 28,924 31,923 28,756
C T Land Development PLC 4,838 1,071 4,790 1,024
C T Properties Limited 956,302 887,899 956,302 887,899
Galle Face Hotel Company Limited 65 67 - -
Kandy Hotels Company (1938) PLC 1,074 1,029 - -
United Hotels Company Limited 1,239 583 - -
1,015,108 939,077 1,011,970 936,502
Total amount due from related companies 1,015,944 957,133 1,294,595 2,946,040
Amounts due to holding company
C T Holdings PLC 107 - - -
Notes to the Financial Statements contd.

& 123Pg. 122
Group Company
2016 2015 2016 2015
Rs. ‘000 Rs. ‘000 Rs. ‘000 Rs. ‘000
Amounts due to subsidiaries
Cargills Quality Foods Limited - - 7,635 -
Cargills Agrifoods Limited - - 12,285 -
Cargills Food Services (Private) Limited - - 714 -
Cargills Quality Daries (Private) Limited - - 9,650 -
Cargills Foods Company (Private) Limited - - - -
Cargills Food Processors (Private) Limited - - 8,608 128,495
Cargills Quality Confectioneries (Private) Limited - - - 74
- - 38,892 128,569
Amounts due to other related companies
Ceylon Printers PLC 391 - - -
CT Real Estate (Private) Limited 3,124 - - -
3,515 - - -
Total amount due to related companies 3,622 - 38,892 128,569
22. Stated capital
Group Company
2016 2015 2016 2015
Rs. ‘000 Rs. ‘000 Rs. ‘000 Rs. ‘000
Issued and fully paid :
224,000,000 Ordinary shares 130,723 130,723 130,723 130,723
130,723 130,723 130,723 130,723
23. Other equity/Put liability
Put option over Non Controlling Interest (NCI) 2,251,743 1,974,311 - -
The put option over NCI relates to Put Option agreement between Cargills Foods Company (Private) Limited (CFC), International Finance
Corporation (IFC), and Cargills Ceylon PLC (CCP) IFC has subscribed for 4,130,424 shares of CFC (representing 8% shares of the Company) for an
aggregate subscription price of Rs. 2,550 Mn on 25th February 2015. Therefore IFC is considered the investor of CFC and non-controlling interest
to CCP and CCP acts as the grantor / sponsor to the contract.
CCP has granted IFC an option (The Put Option) to sell their shares to CCP during the put period on up to three occasions at the Put Price.
As per the Put option agreement the Put Price means in relation to any given exercise of the put option, the price (calculated as of the date of
settlement of purchase of the relevant Put shares by the grantor) that provides IFC an IRR of 9% in local currency terms; provided that the put
price, shall be suitably adjusted to account for any dividends received by IFC on the Put shares and there shall not be any discount for liquidity or
minority stake.

Pg. 124Cargills (Ceylon) PLC - Annual Report 2015/16
The assumptions on which the above present value of the exercise price has been determined are as follows:
• Conditions of the Shareholder Agreement will not be breached by either party until the Put Period arrives
• In the event of non-listing of the company by CCP, IFC will wait until the end of the Put Period to exercise the Put Option
• Weighted average cost of capital of CCP is 14%
• Pricing date as 31 March 2016
• An year is assumed to have 365 days
The present value of the exercise price has been derived based on an exercise price of Rs. 4,263,498,814/- which has been computed after
adjusting for an IRR of 9% and a put period from 25th February 2015 (which is the share certificate date) to 10th February 2021 (which is
assumed as the exercise date).
24. Reserves
Group Company
2016 2015 2016 2015
Rs. ‘000 Rs. ‘000 Rs. ‘000 Rs. ‘000
Capital reserves
Revaluation reserve 7,908,678 7,023,147 3,385,912 3,318,259
Capital reserve 7,928 7,928 - -
7,916,606 7,031,075 3,385,912 3,318,259
Revenue reserve
General reserve 485,500 485,500 485,500 485,500
Available for sale reserves (24,418) (15,848) (24,410) (15,884)
461,082 469,652 461,090 469,616
8,377,688 7,500,727 3,847,002 3,787,875
Revaluation reserve consists of net surplus resulting from the revaluation of property, plant and equipment.
Capital reserve consists of share of capital reserve resulting from consolidation.
General reserve represents the amount set aside by the directors for general applications.
Available for sale reserve consists of net gain/(loss) on available for sale financial assets.
25. Cash and cash equivalents
Group Company
2016 2015 2016 2015
Rs. ‘000 Rs. ‘000 Rs. ‘000 Rs. ‘000
Cash at bank and in hand 2,144,349 1,671,542 203,816 11,313
For the purpose of the cash flow statement,
the year-end cash and cash equivalents comprise the following:
Cash and bank balances 2,144,349 1,671,542 203,816 11,313
Bank overdraft (3,261,255) (4,009,994) (1,703,323) (2,537,486)
(1,116,906) (2,338,452) (1,499,507) (2,526,173)
Notes to the Financial Statements contd.

& 125Pg. 124
26. Borrowings
Group Company
2016 2015 2016 2015
Rs. ‘000 Rs. ‘000 Rs. ‘000 Rs. ‘000
Current
Current portion of long term loan 537,529 558,397 - -
Short term loans 7,510,443 7,050,000 2,640,700 1,400,000
Bank overdraft 3,261,255 4,009,994 1,703,323 2,537,486
11,309,227 11,618,391 4,344,023 3,937,486
Non-current
Bank borrowings (note 26.1) 198,300 730,922 - -
198,300 730,922 - -
Total borrowings 11,507,527 12,349,313 4,344,023 3,937,486
26.1 Non current
As at 1 April 1,289,319 1,845,438 - 1,700,400
Loans received / (transferred) - - - (1,502,300)
Repayments (553,490) (556,119) - (198,100)
As at 31 March 735,829 1,289,319 - -
Falling due within one year (537,529) (558,397) - -
198,300 730,922 - -
Repayment during 1-2 years 198,300 532,622 - -
Repayment during 2-5 years - 198,300 - -
198,300 730,922 - -
26.2 Details of all loans outstanding together with the related securities offered as at the reporting date are set out below:
Institution and facility
Principal amount
Amount Outstanding
Repayment terms & interest rate Security offered
Rs. '000 Rs. '000
Cargills Ceylon PLC
Bank overdraft
Commercial Bank PLC 370,000 363,385 On demand, Based on monthly
AWPLR+0.5%, Average interest rate of
7.41%
Corporate guarantee for Rs.50 Mn.
dated 05/05/1998 executed by C T
Holdings PLC
Seylan Bank 100,000 - On demand, Based on weekly AWPLR+1%
p.a., Average interest rate of 8.47%
Clean Basis
Nations Trust Bank 575,000 572,233 On demand, Based on weekly AWPLR,
Average interest rate of 7.16%
Clean Basis
Deutsche Bank 45,000 7,767 On demand, Based on market rate, Average
interest rate of 6.80%
Clean Basis
Muslim Commercial
Bank Limited
675,000 673,335 Through own funds, Based on market rate,
Average interest rate of 6.98%
Clean Basis
Sampath Bank PLC 100,000 86,603 On demand, Based on monthly
AWPLR+0.5%, Average interest rate of
7.37%
Clean Basis
1,703,323

Pg. 126Cargills (Ceylon) PLC - Annual Report 2015/16
Institution and facility
Principal amount
Amount Outstanding
Repayment terms & interest rate Security offered
Rs. '000 Rs. '000
Short term loans
Commercial Bank 830,000 830,000 1 month, commencing from 11.03.16 to
11.04.16 (maximum 03 months), Based
on the prevailing market rates, Average
interest rate of 7.22%
Corporate guarantee for Rs.50 Mn.
dated 05/05/1998 executed by C T
Holdings PLC
Seylan Bank 1,000,000 - Based on market rate (re priced monthly),
(maximum 03 months), Average interest
rate of 6.65%
Clean Basis
HSBC 300,000 300,000 Overnight, commencing from 31.03.16 to
01.04.16 (maximum 06 months),Overnight
Cost of Funds+1.0% p.a.Average interest
rate of 6.97%
Clean Basis
Hatton National Bank 1,000,000 - Short Term Loan: weekly AWPLR+0.5%/
Money Market Loan: Based on weekly
Money Market Rates, (maximum 90 days),
Average interest rate of 7.48%
Clean Basis
Sampath Bank 1,800,000 300,000 4 months, commencing from 18.12.15 to
18.04.16 (maximum 06 months), Based on
prevailing money market rates, Average
interest rate of 7.58%
Clean Basis
Nations Trust Bank 100,000 100,000 1 month, commencing from 08.03.16 to
08.04.16 (maximum 03 months), to be
negotiated at the time of granting each
loan, Average interest rate of 7.29%
Clean Basis
Nations Trust Bank 75,000 75,000 1 month, commencing from 31.03.16 to
30.04.16 (maximum 03 months), to be
negotiated at the time of granting each
loan, Average interest rate of 7.29%
Clean Basis
Bank of Ceylon PLC 1,500,000 1,035,700 2 weeks, commencing from 28.03.16
to 12.04.16 (maximum 12 months), On
case by case basis decided by Treasury
department, Average interest rate of
8.17%
Clean Basis
2,640,700
4,344,023
Cargills Agrifoods Limited
Bank overdraft
Commercial Bank 100,000 417 Average interest rate of 7.41% Clean Basis
Cargills Bank - 23,451 Repayment on demand at prevailing market
interest rates
No Security. Balance consist of
unpresented cheques. Bank balance
is credit.
23,868
23,868
Notes to the Financial Statements contd.
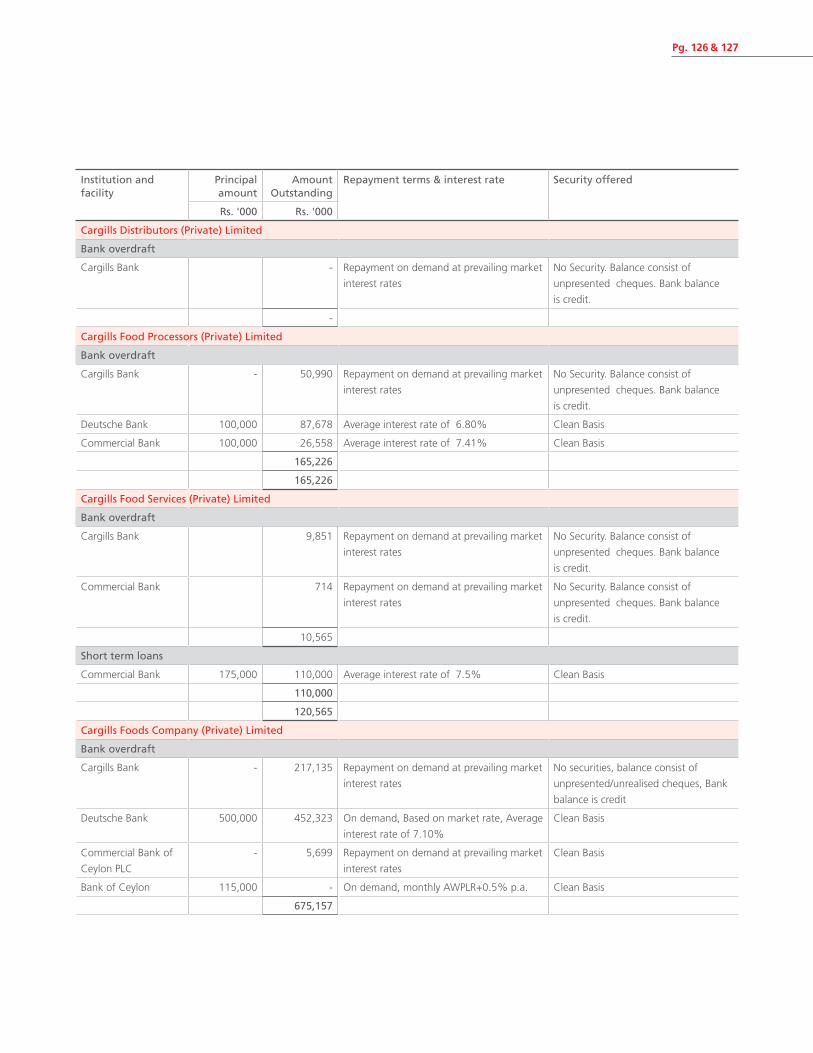
& 127Pg. 126
Institution and facility
Principal amount
Amount Outstanding
Repayment terms & interest rate Security offered
Rs. '000 Rs. '000
Cargills Distributors (Private) Limited
Bank overdraft
Cargills Bank - Repayment on demand at prevailing market
interest rates
No Security. Balance consist of
unpresented cheques. Bank balance
is credit.
-
Cargills Food Processors (Private) Limited
Bank overdraft
Cargills Bank - 50,990 Repayment on demand at prevailing market
interest rates
No Security. Balance consist of
unpresented cheques. Bank balance
is credit.
Deutsche Bank 100,000 87,678 Average interest rate of 6.80% Clean Basis
Commercial Bank 100,000 26,558 Average interest rate of 7.41% Clean Basis
165,226
165,226
Cargills Food Services (Private) Limited
Bank overdraft
Cargills Bank 9,851 Repayment on demand at prevailing market
interest rates
No Security. Balance consist of
unpresented cheques. Bank balance
is credit.
Commercial Bank 714 Repayment on demand at prevailing market
interest rates
No Security. Balance consist of
unpresented cheques. Bank balance
is credit.
10,565
Short term loans
Commercial Bank 175,000 110,000 Average interest rate of 7.5% Clean Basis
110,000
120,565
Cargills Foods Company (Private) Limited
Bank overdraft
Cargills Bank - 217,135 Repayment on demand at prevailing market
interest rates
No securities, balance consist of
unpresented/unrealised cheques, Bank
balance is credit
Deutsche Bank 500,000 452,323 On demand, Based on market rate, Average
interest rate of 7.10%
Clean Basis
Commercial Bank of
Ceylon PLC
- 5,699 Repayment on demand at prevailing market
interest rates
Clean Basis
Bank of Ceylon 115,000 - On demand, monthly AWPLR+0.5% p.a. Clean Basis
675,157

Pg. 128Cargills (Ceylon) PLC - Annual Report 2015/16
Institution and facility
Principal amount
Amount Outstanding
Repayment terms & interest rate Security offered
Rs. '000 Rs. '000
Short term loans
Standard Chartered
Bank
572,008 572,008 1 month commencing from 02.03.2016 to
02.04.2016 (maximum 06 months), Based
on money market rate, average interest rate
of 7.11%
Clean Basis
Standard Chartered
Bank
527,992 207,735 1 month commencing from 30.03.2016 to
30.04.2016 (maximum 06 months), Based
on money market rate, average interest rate
of 7.11%
Clean Basis
Standard Chartered
Bank
500,000 - (maximum 120 days), Based on the
prevailing market rates
Clean Basis
Bank of Ceylon 350,000 350,000 1 month commencing from 01.03.2016 to
01.04.2016 (maximum 12 months), Quoted
by Treasury Department on case by case
basis, average interest rate of 7.75%
Clean Basis
Bank of Ceylon 150,000 150,000 1 month commencing from 02.03.2016 to
02.04.2016 (maximum 12 months),Quoted
by Treasury Department on case by case
basis, average interest rate of 7.75%
Clean Basis
Hatton National Bank 1,250,000 - Short Term Loan: weekly AWPLR+0.5%
/ Money Market Loan: Based on weekly
Money Market Rates, (maximum 90 days),
Average interest rate of 7.02%
Clean Basis
1,279,743
Long term loans
Commercial Bank PLC 336,500 336,500 5 years, The Loan is repayable in 48
monthly installments commencing from
13th Month of disbursement to 60th
months. (as per term sheet). Based on
average of weekly AWPLR+0.8%, Average
interest rate of 8.01%
Deed of Assignment No. 496 dated
30.09.2014. Additional Mortgage
Bond No. 497 dated 30.09.2014 for
Rs. 1,502,300,000/- over credit and
debit card receivables and ESCROW
Account.
Habib Bank 181,600 181,600
State Bank of India 181,600 181,600
699,700
2,654,600
C PC (Lanka) Limited
Bank overdraft
Cargills Bank 11,743 Repayment on demand at prevailing market
interest rates
No Security. Balance consist of
unpresented cheques. Bank balance
is credit.
11,743
11,743
Notes to the Financial Statements contd.

& 129Pg. 128
Institution and facility
Principal amount
Amount Outstanding
Repayment terms & interest rate Security offered
Rs. '000 Rs. '000
Cargills Quality Confectioneries (Private) Limited
Bank Overdrafts
Bank of Ceylon 176,450 - Average interest rate of 9.5% Corporate guarantee from Cargills
(Ceylon) PLC for Rs.176.45 Mn
Bank of Ceylon 47,540 - Average interest rate of 9.5% Corporate guarantee from Cargills
(Ceylon) PLCMortgage over leasehold
rights of the land & buildings and Plant
& Machine. Fixed in the premises
Cargills Bank - 34,696 Repayment on demand at prevailing market
interest rates
No Security. Balance consist of
unpresented cheques. Bank balance
is credit.
Commercial Bank 25,000 13,347 Average interest rate of 7.41% Clean Basis
48,043
Short term loans
Hatton National Bank 200,000 115,000 Average interest rate of 7.48% Corporate guarantee from Cargills
(Ceylon) PLC for Rs. 200 Mn
115,000
Long Term Loans
Bank of Ceylon 11,115 1,039 54 monthly installments of Rs. 205,835
per month , commencing from July 2011,
at average interest rate of 6% for the year.
Grace period of 6 months available
Corporate guarantee from Cargills
(Ceylon) PLC for Rs. 11.12 Mn
Mortgage over leasehold rights of the
land & buildings and Plant & Machine.
Fixed in the premises
Bank of Ceylon 282,560 35,090 64 monthly installments of Rs. 4.42 Mn per
month , commencing from July 2011, at
average interest rate of 7.67% for the year.
Grace period of 6 months available
Corporate guarantee from Cargills
(Ceylon) PLC for Rs. 282.56 Mn
Bank of Ceylon 7,482 - 72 monthly installments of Rs. 103,920 per
month , commencing from January 2011, at
average interest rate of 6.5% for the year.
Corporate guarantee from Cargills
(Ceylon) PLC for Rs. 7.48 Mn
36,129
199,172
Cargills Quality Dairies (Private) Limited
Bank overdraft
Commercial Bank 50,000 - Average interest rate of 7.41% Clean Basis
Seylan Bank 200,000 - Average interest rate of 8.47% Clean Basis
Cargills Bank - 57,615 Repayment on demand at prevailing market
interest rates
No Security. Balance consist of
unpresented cheques. Bank balance
is credit.
Deutsche Bank 100,000 696 Average interest rate of 6.80% Clean Basis
58,311
Short term loans

Pg. 130Cargills (Ceylon) PLC - Annual Report 2015/16
Institution and facility
Principal amount
Amount Outstanding
Repayment terms & interest rate Security offered
Rs. '000 Rs. '000
1,200,000 - Average interest rate of 7.21% Clean Basis
Standared Chartered
Bank
750,000 - Average interest rate of 7.48% Clean Basis
58,311
Cargills Quality Foods Limited
Bank overdraft
Commercial Bank 75,000 76,819 Average interest rate of 7.41%
Cargills Bank - 38,678 Repayment on demand at prevailing market
interest rates
No Security. Balance consist of
unpresented cheques. Bank balance
is credit.
Deutsche Bank 100,000 97,951 Average interest rate of 6.80% Clean Basis
213,448
Short term loans
Standared Chartered
Bank
600,000 400,000 Average interest rate of 7.34% Clean Basis
Hatton National Bank 750,000 1,937,000 Average interest rate of 7.48%
(AWPLR +0.5%)
Clean Basis
Commercial Bank 575,000 575,000 Average interest rate of 7.5% Clean Basis
2,912,000
3,125,448
Kotmale Dairy Products (Private) Limited
Bank overdraft
Seylan Bank - 51 Repayment on demand at prevailing market
interest rates
No Security. Balance consist of
unpresented cheques. Bank balance
is credit.
Bank of Ceylon 10,000 - Average interest rate of 10.92% p.a. Corporate Guarantee from Kotmale
Holdings PLC. Mortgage over stocks
and book debtors.
51
Import Loan Facility
Bank of Ceylon 40,000 - Average interest rate of 10.92% p.a. Corporate Guarantee from Kotmale
Holdings PLC. Mortgage over stocks
and book debtors.
-
Series of Loan on Import
Bank of Ceylon 40,000 - Average interest rate of 10.92% p.a. Corporate Guarantee from Kotmale
Holdings PLC. Mortgage over stocks
and book debtors.
-
Notes to the Financial Statements contd.

& 131Pg. 130
Institution and facility
Principal amount
Amount Outstanding
Repayment terms & interest rate Security offered
Rs. '000 Rs. '000
Kotmale Milk Products Limited
Bank overdraft
Pan Asia Bank
Corporation Ltd
5,000 - Average interest rate of 11.04% p.a. Corporate Guarantee from Kotmale
Holdings PLC.
-
Import Loan Facility
Pan Asia Bank
Corporation Ltd
20,000 - Average interest rate of 11.04% p.a. Corporate Guarantee from Kotmale
Holdings PLC.
-
51
Millers Limited
Bank overdraft
Cargills Bank - 4,657 Repayment on demand at prevailing market
interest rates
No Security. Balance consist of
unpresented cheques. Bank balance
is credit.
Deutsche Bank 100,000 95,163 Average interest rate of 6.80% Clean Basis
Hatton National Bank - 97,597 Average interest rate of 7.48%
197,417
Short term loans
Standared Chartered
Bank
250,000 100,000 Average interest rate of 7.39% Corporate Guarantee from Cargills
(Ceylon) PLC for Rs 250 Mn
Commercial Bank 165,000 144,103 Average interest rate of 7.43% Corporate Guarantee from Cargills
(Ceylon) PLC for Rs 215 Mn
Hatton National Bank 175,000 363,000 Average interest rate of 7.48% Corporate Guarantee from Cargills
(Ceylon) PLC for Rs 335 Mn
607,103
804,520
11,507,527

Pg. 132Cargills (Ceylon) PLC - Annual Report 2015/16
27. Deferred income
Group
2016 2015
Rs. '000 Rs. '000
Capital grant
As at 1 April 96,344 106,134
Receipt during the year - 682
Amortisation (11,481) (10,472)
As at 31 March 84,863 96,344
Revenue grant
Receipt during the year - 1,709
Amortisation - (1,709)
As at 31 March - -
Cargills Agrifoods Limited received Rs. 0.682 Mn mn as a capital grant in respect of a project undertaken at Kilinochchi during financial year
ended 31 March 2015.
The grants received have been accounted as per the LKAS 20 - "Accounting for government grants and disclosure of government assistance.
28. Employee Benefits
Group Company
2016 2015 2016 2015
Rs. ‘000 Rs. ‘000 Rs. ‘000 Rs. ‘000
28.1 Movement in present value of defined benefit obligations
As at 1 April 520,802 416,222 225,571 305,732
Transferred to subsidiary - - - (115,085)
Interest cost 52,590 43,476 22,557 20,019
Current service cost 66,158 59,337 23,086 23,687
Actuarial (gain) / loss 22,743 39,517 (5,850) 21,169
Benefits paid (24,289) (37,750) (9,640) (29,951)
As at 31 March 638,004 520,802 255,724 225,571
28.2 Liability recognised in the Statement of Financial Position
Present value of defined benefit obligation 638,004 520,802 255,724 225,571
Fair value of plan asset - - - -
Net liability of defined benefit obligation 638,004 520,802 255,724 225,571
28.3 Amount recognised in the Profit /loss
Continuing operations
Current service cost 66,158 58,445 23,086 23,687
Interest cost 52,590 43,476 22,557 20,019
118,748 101,921 45,643 43,706
Discontinued operations
Current service cost - 892 -
- 892
118,748 102,813 45,643 43,706
Notes to the Financial Statements contd.
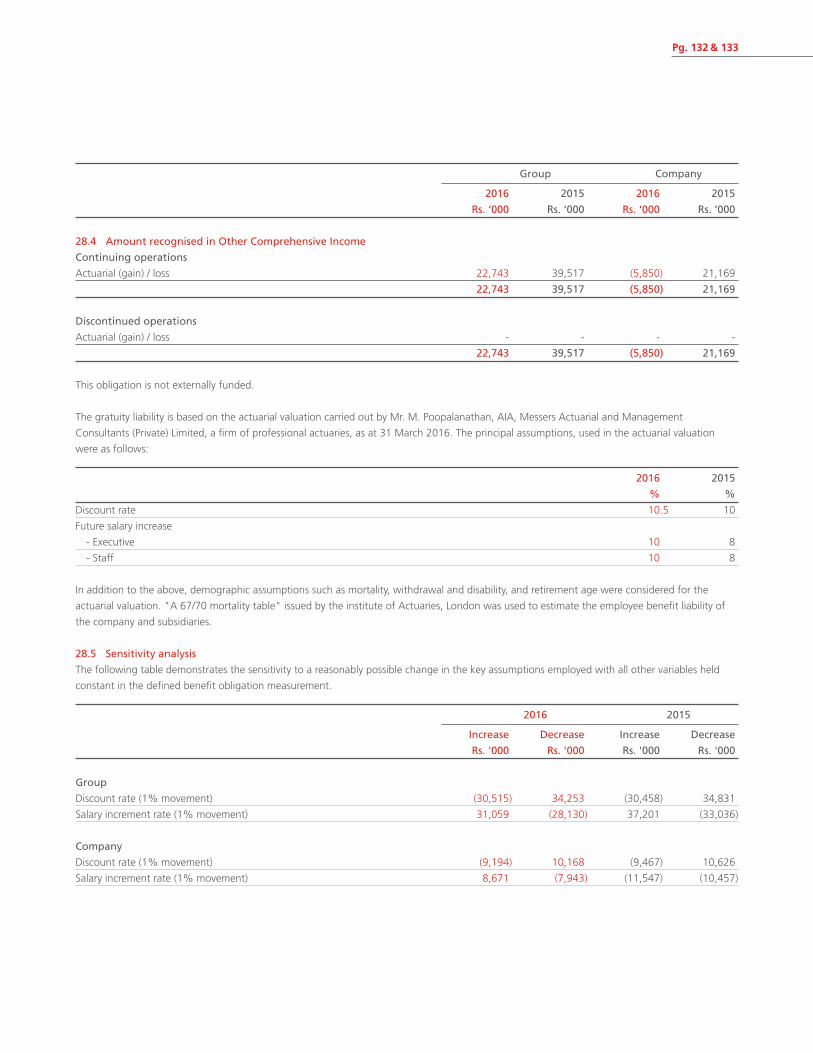
& 133Pg. 132
Group Company
2016 2015 2016 2015
Rs. ‘000 Rs. ‘000 Rs. ‘000 Rs. ‘000
28.4 Amount recognised in Other Comprehensive Income
Continuing operations
Actuarial (gain) / loss 22,743 39,517 (5,850) 21,169
22,743 39,517 (5,850) 21,169
Discontinued operations
Actuarial (gain) / loss - - - -
22,743 39,517 (5,850) 21,169
This obligation is not externally funded.
The gratuity liability is based on the actuarial valuation carried out by Mr. M. Poopalanathan, AIA, Messers Actuarial and Management
Consultants (Private) Limited, a firm of professional actuaries, as at 31 March 2016. The principal assumptions, used in the actuarial valuation
were as follows:
2016 2015
% %
Discount rate 10.5 10
Future salary increase
- Executive 10 8
- Staff 10 8
In addition to the above, demographic assumptions such as mortality, withdrawal and disability, and retirement age were considered for the
actuarial valuation. "A 67/70 mortality table" issued by the institute of Actuaries, London was used to estimate the employee benefit liability of
the company and subsidiaries.
28.5 Sensitivity analysis
The following table demonstrates the sensitivity to a reasonably possible change in the key assumptions employed with all other variables held
constant in the defined benefit obligation measurement.
. 2016 2015
Increase Decrease Increase Decrease
Rs. '000 Rs. '000 Rs. '000 Rs. '000
Group
Discount rate (1% movement) (30,515) 34,253 (30,458) 34,831
Salary increment rate (1% movement) 31,059 (28,130) 37,201 (33,036)
Company
Discount rate (1% movement) (9,194) 10,168 (9,467) 10,626
Salary increment rate (1% movement) 8,671 (7,943) (11,547) (10,457)
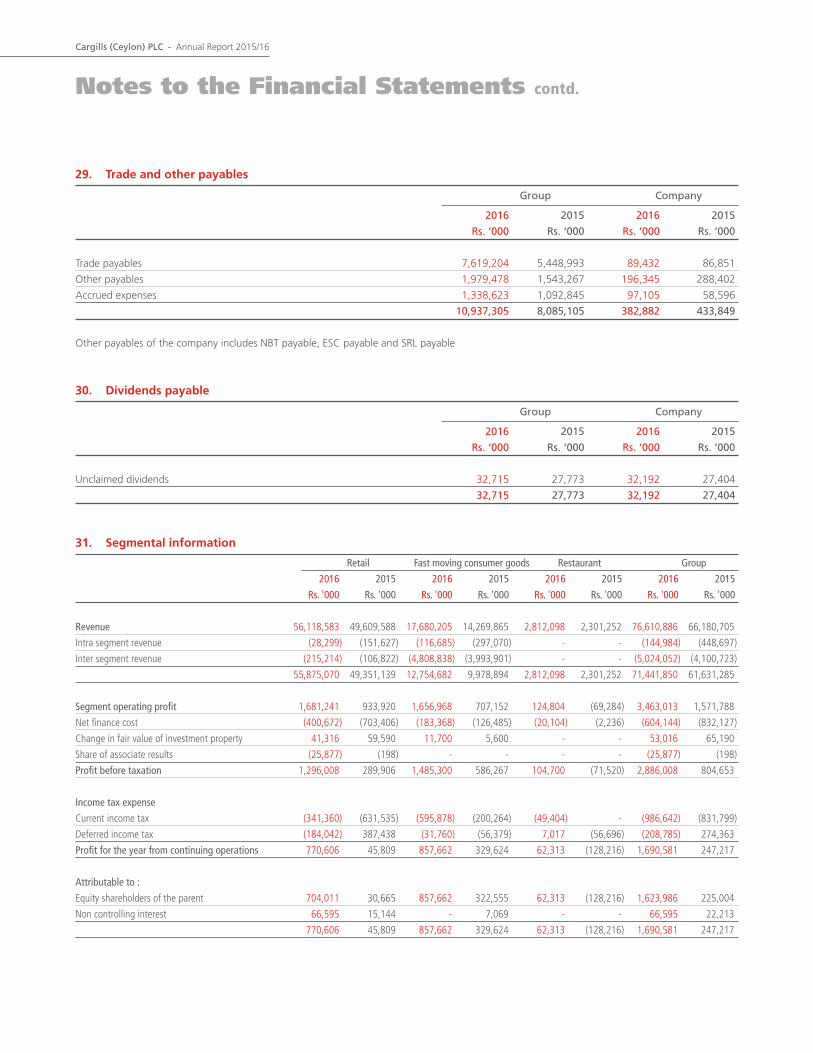
Pg. 134Cargills (Ceylon) PLC - Annual Report 2015/16
29. Trade and other payables
Group Company
2016 2015 2016 2015
Rs. ‘000 Rs. ‘000 Rs. ‘000 Rs. ‘000
Trade payables 7,619,204 5,448,993 89,432 86,851
Other payables 1,979,478 1,543,267 196,345 288,402
Accrued expenses 1,338,623 1,092,845 97,105 58,596
10,937,305 8,085,105 382,882 433,849
Other payables of the company includes NBT payable, ESC payable and SRL payable
30. Dividends payable
Group Company
2016 2015 2016 2015
Rs. ‘000 Rs. ‘000 Rs. ‘000 Rs. ‘000
Unclaimed dividends 32,715 27,773 32,192 27,404
32,715 27,773 32,192 27,404
31. Segmental information
Retail Fast moving consumer goods Restaurant Group
2016 2015 2016 2015 2016 2015 2016 2015
Rs. '000 Rs. '000 Rs. '000 Rs. '000 Rs. '000 Rs. '000 Rs. '000 Rs. '000
Revenue 56,118,583 49,609,588 17,680,205 14,269,865 2,812,098 2,301,252 76,610,886 66,180,705
Intra segment revenue (28,299) (151,627) (116,685) (297,070) - - (144,984) (448,697)
Inter segment revenue (215,214) (106,822) (4,808,838) (3,993,901) - - (5,024,052) (4,100,723)
55,875,070 49,351,139 12,754,682 9,978,894 2,812,098 2,301,252 71,441,850 61,631,285
Segment operating profit 1,681,241 933,920 1,656,968 707,152 124,804 (69,284) 3,463,013 1,571,788
Net finance cost (400,672) (703,406) (183,368) (126,485) (20,104) (2,236) (604,144) (832,127)
Change in fair value of investment property 41,316 59,590 11,700 5,600 - - 53,016 65,190
Share of associate results (25,877) (198) - - - - (25,877) (198)
Profit before taxation 1,296,008 289,906 1,485,300 586,267 104,700 (71,520) 2,886,008 804,653
Income tax expense
Current income tax (341,360) (631,535) (595,878) (200,264) (49,404) - (986,642) (831,799)
Deferred income tax (184,042) 387,438 (31,760) (56,379) 7,017 (56,696) (208,785) 274,363
Profit for the year from continuing operations 770,606 45,809 857,662 329,624 62,313 (128,216) 1,690,581 247,217
Attributable to :
Equity shareholders of the parent 704,011 30,665 857,662 322,555 62,313 (128,216) 1,623,986 225,004
Non controlling interest 66,595 15,144 - 7,069 - - 66,595 22,213
770,606 45,809 857,662 329,624 62,313 (128,216) 1,690,581 247,217
Notes to the Financial Statements contd.

& 135Pg. 134
Retail Fast moving consumer goods Restaurant Group
2016 2015 2016 2015 2016 2015 2016 2015
Rs. ‘000 Rs. ‘000 Rs. ‘000 Rs. ‘000 Rs. ‘000 Rs. ‘000 Rs. ‘000 Rs. ‘000
Segment assets
Non current assets
Property plant and equipment 14,488,210 13,310,610 4,894,624 4,553,084 883,249 970,200 20,266,083 18,833,894
Investment property 3,437,564 3,396,248 106,000 94,300 - - 3,543,564 3,490,548
Intangible assets 257,593 257,593 723,927 670,426 95,903 107,713 1,077,423 1,035,732
Prepayments of leasehold land and buildings - - 24,500 25,374 - - 24,500 25,374
Investment in associates 2,305,653 1,093,699 - - - - 2,305,653 1,093,699
Deferred tax assets - 5,374 54,630 63,372 8,012 5,996 62,642 74,742
20,489,020 18,063,524 5,803,681 5,406,556 987,164 1,083,909 27,279,865 24,553,989
Current assets
Inventories 5,399,972 4,876,288 1,731,195 1,283,347 63,611 57,949 7,194,778 6,217,584
Trade and other receivables 1,873,192 1,582,442 1,581,244 1,384,506 117,456 127,398 3,571,892 3,094,346
Amount due from related companies 1,012,004 953,956 3,940 3,177 - - 1,015,944 957,133
Short term investments 110,916 198,007 893,332 725,741 58 80 1,004,306 923,828
Cash and cash equivalents 1,071,204 613,265 1,053,010 1,034,030 20,135 24,247 2,144,349 1,671,542
9,467,288 8,223,958 5,262,721 4,430,801 201,260 209,674 14,931,269 12,864,433
Total segmental assets 29,956,308 26,287,482 11,066,402 9,837,357 1,188,424 1,293,583 42,211,134 37,418,422
Segment liabilities
Non current liabilities
Borrowings 198,300 699,700 - 31,222 - - 198,300 730,922
Deferred tax liability 333,564 141,711 340,935 320,188 103,051 108,052 777,550 569,951
Deferred income - - 84,863 96,344 - - 84,863 96,344
Employee benefits 574,145 471,729 63,859 49,073 - - 638,004 520,802
Put liability 2,251,743 1,974,311 - - - - 2,251,743 1,974,311
3,357,752 3,287,451 489,657 496,827 103,051 108,052 3,950,460 3,892,330
Current liabilities
Trade and other payables 8,742,747 6,450,821 1,764,542 1,230,718 430,016 403,566 10,937,305 8,085,105
Current tax liability 488,845 479,950 913,387 414,377 70,756 21,349 1,472,988 915,676
Amount due to related companies 3,124 - 498 - - - 3,622 -
Dividends payable 32,192 27,404 523 369 - - 32,715 27,773
Borrowings 6,800,323 6,469,717 4,223,113 4,563,903 285,791 584,771 11,309,227 11,618,391
16,067,231 13,427,892 6,902,063 6,209,367 786,563 1,009,686 23,755,857 20,646,945
Total segmental liabilities 19,424,983 16,715,343 7,391,720 6,706,194 889,614 1,117,738 27,706,317 24,539,275
Other information
Capital expenditure 1,724,785 1,318,797 458,047 399,256 82,079 139,708 2,264,911 1,857,761
Depreciation 956,082 876,091 558,871 529,320 167,203 162,120 1,682,156 1,567,531
Segmental information - the secondary segments (geographical segments)
The Group does not distinguish its turnover into significant geographic segments.

Pg. 136Cargills (Ceylon) PLC - Annual Report 2015/16
32. Commitments
Group Company
2016 2015 2016 2015
Rs. ‘000 Rs. ‘000 Rs. ‘000 Rs. ‘000
Capital commitment
Approved and contracted 912,495 641,668 - -
Financial commitments
(a) Future payments of operating lease rentals
- within 1 year. 829,489 735,664 1,750 45,870
- between 1 -5 years 4,008,943 3,636,978 8,610 246,990
- more than 5 years 6,824,167 4,131,670 153,160 366,700
11,662,599 8,504,312 163,520 659,560
(b) Settlement of letter of credits and import bills 333,371 205,898 - -
33. Contingent liabilities
Income tax
The income tax exemption claimed under the Inland Revenue Act No. 10 of 2006 is being contested by the Department of Inland Revenue. The
contingent liability on potential income tax payments is as follows:
Cargills Agrifoods Limited - Rs. 119.45 Mn, Cargills Quality Dairies (Private) Limited - Rs. 249.81 Mn, Cargills Quality Foods Limited - Rs.173.65
Mn and Kotmale Dairy Products (Private) Limited Rs. 61.39 Mn.
Having sought professional advice, the Management is confident that the tax exemptions are applicable and as such no liabilities would arise.
Accordingly, no provision has been made in the financial statements. Where necessary, interim stay orders have been obtained on any recovery
actions.
Letter of guarantee to Commercial Banks
The Company has given letter of guarantee to Commercial Banks on behalf of the subsidiary companies amounting to Rs. 1.4 Bn. Kotmale
Holdings PLC a subsidiary of the company has given letters of guarantee to Commercial Banks on behalf of its subsidiary companies Kotmale
Dairy Products (Private) Limited (50.0 Mn) and Kotmale Milk Products Limited 25.0 Mn) amounting to Rs. 75.0 Mn. The Directors do not expect
any claim on these guarantees. Accordingly, no provision has been made in the financial statements.
Litigation against the Group
Kotmale Dairy Products (Private) Limited.
DC Hatton case no. 1805/2013/M
Plaintiff filed action claiming damages of Rs. 50 Mn for loss of revenue as dispute over the equipment take off.
The management is of the view that any pending litigation will not have a material impact on the financial statements.
The Company has provided Bank Guarantees to Lion Brewery (Ceylon) PLC and its subsidiary Pearl Springs (Private) Limited to the value of Rs. 695
Mn in 2015 to cover contingent tax liabilities in connection with the disposal of the investment in Millers Brewery Limited stated under note 10
to the Financial Statements. The Directors do not expect any claim on these guarantees. Accordingly, no provision has been made in the financial
statements.
There are no other material contingent liabilities as at the reporting date.
Notes to the Financial Statements contd.

& 137Pg. 136
34. Events after the reporting date
The Board of Directors have proposed a final dividend of 2.25 Rupee per share on 9th June 2016 (on the 224,000,000 shares now in issue ) for
the year ended 31 March 2016 which is to be approved by the shareholders at the Annual General Meeting.
As required by the Section 56 (2) of the Companies Act No. 07 of 2007, the Board of Directors has confirmed the Company satisfy the ' Solvency
Test', and has obtained a certificate from auditors.
In accordance with LKAS 10 - "Events after the reporting period", the proposed dividends has not been recognised as a liability in the financial
statements.
No events other than the above, have occurred since the reporting date which would require any adjustment to, or disclosure in, the financial
statements.
35. Transactions with group companies
The Company has provided corporate guarantees for the term loans and banking facilities obtained by its subsidiary companies, the details of
which has been disclosed under note 26 to the financial statements.
Companies within the Group engage in trading and business transactions under normal commercial terms which give rise to related company
balances. The balances have been disclosed under note 21 to the Financial Statements.
35.1 Transactions with key management personnel (KMP)
According to LKAS 24 - "Related Party Disclosures", KMP are those having authority and responsibility for planning, directing, controlling the
activities of the entity. Accordingly, the directors of the company and its parent (including executive and non - executive directors) have been
classified as KMP of the group.
The Group and the Company has paid Rs. 232.03 Mn (2015- Rs. 206.53 Mn) and Rs. 36.31 Mn (2015 - 103.32 Mn) respectively to the directors
as emoluments and no post employment benefits during the year (2015 - nil). There are no other payments made to key management personnel
apart from the disclosed amount.

Pg. 138Cargills (Ceylon) PLC - Annual Report 2015/16
35.2 Transactions with related companies
Group Company
2016 2015 2016 2015
Rs. ‘000 Rs. ‘000 Rs. ‘000 Rs. ‘000
Transaction with related parties
Subsidiaries
Sale / (Purchase) - - 28,624 151,627
Other Income / (Expense) - - 1,697,085 943,731
Fund Transfer / (Settlement) - - (3,345,492) (3,621,516)
Holding company
Sale / (Purchase) 3,219 - - -
Other Income / (Expense) (446) (21,243) - -
Fund Transfer / (Settlement) (20,268) 21,101 (17,454) -
Other related companies
Sale / (Purchase) 2,961 9,964 - -
Other Income / (Expense) 87,563 64,690 84,962 97,361
Fund Transfer / (Settlement) (17,841) 745,601 (9,495) 700,659
The other expense relating to Company includes employee benefit cost transfer to subsidiaries amounting to Rs. 17.55 Mn (2015 - 30.3) for the
year ended 31st March 2016.
Net dividends received from subsidiary companies
2016 2015
Rs. '000 Rs. '000
Cargills Quality Foods Limited 463,720 21,191
Cargills Foods Company (Private) Limited 362,520 270,180
Millers Brewery Limited - 222,300
Kotmale Holdings PLC 147 -
Double Yummm (Private) Limited
During the year Panadaria (Private) Limited name has been changed as Double Yummm (Pvt) Ltd.
Mrs. R Page, wife of the Deputy Chairman is a Director of the above company with which the Company had the following transaction during the
year and the amount outstanding as at 31 March 2016 was Rs. 4.89 Mn (2015 - Rs. 4.51 Mn).
Purchases for re-sale in the ordinary course of business of Rs. 55.49 Mn (2015 - Rs. 45.81 Mn) Rental income of Rs. 1.08 Mn (2015 - Rs. 1.08 Mn).
Directors have no direct or indirect interest in any other contracts with the Company.
There are no material related party transactions other than those disclosed above
35.4 Amounts due from / due to related companies
Amounts due from and due to related companies as at the year end have been disclosed under note 21 to these financial statements.
Notes to the Financial Statements contd.

& 139Pg. 138
36. Comparative information
Comparative Information is re-classified wherever necessary to confirm with the current year’s presentation in order to provide a better
presentation.
37. Financial Instruments
37.1 Financial Assets and Liabilities by Categories
Financial assets and liabilities in the tables below are split into categories in accordance with LKAS 39.
Financial Assets by Categories Loans and Available- for- sale receivables (L&R) Held to maturity (HTM) Financial Assets (AFS)
As at 31st March 2016 2015 2016 2015 2016 2015
Rs. '000 Rs. '000 Rs. '000 Rs. '000 Rs. '000 Rs. '000
Group
Financial assets measured at fair value
Other financial instruments - - - - 26,306 34,875
Financial assets not measured at fair value
Trade and other receivables 3,571,892 3,094,346 - - - -
Amounts due from related companies 1,015,944 957,133 - - - -
Other financial assets 978,000 888,953 - - - -
Cash at bank and in hand 2,144,349 1,671,542 - - - -
Total 7,710,185 6,611,974 - - 26,306 34,875
Financial Liabilities by categories financial liabilities measured at Amortised cost.
Other financial Liabilities (37.1.(a))
As at 31st March 2016 2015
Financial liabilities not re-measured at fair value Rs. '000 Rs. '000
Borrowings 11,507,527 12,349,313
Trade and other payables 10,937,305 8,085,105
Amounts due to related companies 3,622 -
Total 22,448,454 20,434,418

Pg. 140Cargills (Ceylon) PLC - Annual Report 2015/16
Financial Assets by Categories Loans and Available- for- sale receivables (L&R) Held to maturity (HTM) Financial Assets (AFS)
As at 31st March 2016 2015 2016 2015 2016 2015
Rs. ‘000 Rs. ‘000 Rs. ‘000 Rs. ‘000 Rs. ‘000 Rs. ‘000
Company
Financial assets measured at fair value
Other financial instruments - - - - 26,189 34,715
Financial assets not measured at fair value
Trade and other receivables 633,499 632,628 - - - -
Amounts due from related companies 1,294,595 2,946,040 - - - -
Other financial assets 31,171 - - - - -
Cash at bank and in hand 203,816 11,313 - - - -
Total 2,163,081 3,589,981 - - 26,189 34,715
Financial Liabilities by Categories Financial liabilities measured at amortised cost
Other financial Liabilities (37.1.(a))
As at 31st March 2016 2015
Financial liabilities not re-measured at fair value Rs. ‘000 Rs. ‘000
Borrowings 4,344,023 3,937,486
Trade and other payables 382,882 433,849
Amounts due to related companies 38,892 128,569
Total 4,765,797 4,499,904
37.1.a The above table does not include fair value information for financial assets and liabilities not measured at fair value if the carrying
amount is a reasonable approximation of fair value. The Group has not disclosed the fair values for financial instruments such as short term trade
receivables and payables, because their carrying amounts are a reasonable approximation of fair value.
37.2 Fair Value Hierarchy
The table below analyses financial instruments carried at fair value, by valuation method.
The different levels have been defined as follows:
Level 1: Quoted prices (unadjusted) in active markets for identical assets ot liabilities
Level 2: Input other than quoted prices included within Level 1 that are observable for the asset or liability, either directly (i.e. as prices) or
indirectly (i.e. derived from prices)
Level 3: Inputs for the assets or liability that are not based on observable market data (unobservable inputs)
Notes to the Financial Statements contd.

& 141Pg. 140
Level 1 Level 2 Level 3 Total
As at 31st March 2016 2015 2016 2015 2016 2015 2016 2015
Rs. '000 Rs. '000 Rs. '000 Rs. '000 Rs. '000 Rs. '000 Rs. '000 Rs. '000
Group
AFS 26,306 34,875 - - - - 26,306 34,875
Held for trading - - - - - - - -
FVTPL - - - - - - - -
Company
AFS 26,189 34,715 - - - - 26,189 34,715
Held for trading - - - - - - - -
FVTPL - - - - - - - -
38. Financial risk management
Overview
The Group has exposure to the following risks from its use of financial instruments:
• Credit risk
• Liquidity risk
• Market risk
This note presents information about the Group’s exposure to each of the above risks, the Group’s objectives, policies and processes for measuring
and managing risk, and the Group’s management of capital. Further quantitative disclosures are included throughout these consolidated financial
statements.
Risk Management Framework
The Board of Directors has overall responsibility for the establishment and oversight of the Group’s risk management framework.
The Group’s risk management processes are established to identify and analyse the risks faced by the Group, to set appropriate risk limits and
controls and to monitor risks and adherence to limits. Risk management systems are reviewed regularly to reflect changes in market conditions
and the Group’s activities.
The Audit Committees oversee how management monitors compliance with the Group’s risk management processes/ guidelines and procedures
and reviews the adequacy of the risk management framework in relation to the risks. The Audit Committees are assisted in its oversight role by
Risk Management team and Internal Audit, who undertakes both regular and ad hoc reviews of risk management controls and procedures, the
results of which are reported to the Audit Committee.

Pg. 142Cargills (Ceylon) PLC - Annual Report 2015/16
38.1 Credit risk
Credit risk is the risk of financial loss to the Group if a customer or counter party to a financial instrument fails to meet its contractual obligation,
and arise principally from the Group’s receivables from customers.
Carrying amount of financial assets represents the maximum credit exposure
The maximum exposure to credit risk at the reporting date was as follows;
Group Company
2016 2015 2016 2015
Rs. '000 Rs. '000 Rs. '000 Rs. '000
Trade receivables 1,797,413 1,474,413 6,436 4,729
Loans and advances 17,691 13,086 11,503 10,261
Amount due from related companies 1,015,944 957,133 1,294,595 2,946,040
Cash and cash equivalents 2,144,349 1,671,542 203,816 11,313
Total credit risk exposure 4,975,397 4,116,174 1,516,350 2,972,343
Available for sale investments 26,306 34,875 26,189 34,715
Total equity risk exposure 26,306 34,875 26,189 34,715
38.1.1 Trade receivables
Group Company
2016 2015 2016 2015
Rs. '000 Rs. '000 Rs. '000 Rs. '000
Past due 1 - 30 days 1,365,859 975,480 3,156 3,027
Past due 31 - 60 days 275,969 302,183 2,684 1,198
Past due 61 - 90 days 96,009 98,739 596 504
> 91 days 59,576 98,011 - -
1,797,413 1,474,413 6,436 4,729
The Company has obtained bank guarantees from major customers by reviewing their past performance and credit worthiness.
38.1.2 Loans and advances
The loans and advances represents loans given to permanent employees.
38.1.3 Amount due from related companies
The Group’s amounts due from related companies mainly consist of receivables from other related companies and parent company. The
Company's amount due from related companies consist of receivables from affiliate companies.
38.1.4 Cash and cash equivalents
The Group and the Company held cash and cash equivalents of Rs. 2.144.3 Mn and Rs. 203.8 Mn as at 31st March 2016 (2015 - Rs. 1,671.54
Mn and Rs. 11.31 Mn), which represents its maximum credit exposure on these assets. The cash and cash equivalents are held with banks, which
are rated AAA(lka) to A(lka), based on Fitch Ratings.
38.1.5 Guarantees
The Group’s policy is to provide financial guarantees only to wholly owned subsidiaries.
Notes to the Financial Statements contd.

& 143Pg. 142
38.2 Liquidity risk
Liquidity risk is the risk that the Group will encounter difficulty in meeting the obligations associated with its financial liabilities that are settled
by delivering cash or another financial asset. The Group’s approach to managing liquidity is to ensure, as far as possible, that it will always have
sufficient liquidity to meet its liabilities when due, under both normal and stressed conditions, without incurring unacceptable losses or risking
damage to the Group’s reputation. The Group holds cash and undrawn committed facilities to enable the Group to manage its liquidity risk.
The Group monitors its risk to shortage of funds by considering maturity of both the Group’s financial investment and financial assets and other
projected cash flow from operations
The following are the contractual maturities of financial liabilities as at 31 March 2016
Within Between Between Between Between More than Total
1 year 1-2 years 2-3 years 3-4 years 4-5 years 5 years
Group Rs. '000 Rs. '000 Rs. '000 Rs. '000 Rs. '000 Rs. '000 Rs. '000
Financial instruments in non-current liabilities
Borrowings - 198,300 - - - - 198,300
Financial instruments in current liabilities
Trade & other payables 10,937,305 - - - - - 10,937,305
Amounts due to related companies 3,622 - - - - - 3,622
Current portion of long term loan 537,529 - - - - - 537,529
Short term loan 7,510,443 - - - - - 7,510,443
Bank overdraft 3,261,255 - - - - - 3,261,255
22,250,154 198,300 - - - - 22,448,454
The following are the contractual maturities of financial liabilities as at 31 March 2015
Within Between Between Between Between More than Total
1 year 1-2 years 2-3 years 3-4 years 4-5 years 5 years
Group Rs. ‘000 Rs. ‘000 Rs. ‘000 Rs. ‘000 Rs. ‘000 Rs. ‘000 Rs. ‘000
Financial instruments in non-current liabilities
Borrowings - 532,622 198,300 - - - 730,922
Financial instruments in current liabilities
Trade & other payables 8,085,105 - - - - - 8,085,105
Amounts due to related companies - - - - - - -
Current portion of long term loan 558,397 - - - - - 558,397
Short term loan 7,050,000 - - - - - 7,050,000
Bank overdraft 4,009,994 - - - - - 4,009,994
19,703,496 532,622 198,300 - - - 20,434,118

Pg. 144Cargills (Ceylon) PLC - Annual Report 2015/16
The following are the contractual maturities of financial liabilities as at 31 March 2016
Within Between Between Between Between More than Total
1 year 1-2 years 2-3 years 3-4 years 4-5 years 5 years
Company Rs. ‘000 Rs. ‘000 Rs. ‘000 Rs. ‘000 Rs. ‘000 Rs. ‘000 Rs. ‘000
Financial instruments in non-current liabilities
Borrowings - - - - - - -
Financial instruments in current liabilities
Trade & other payables 382,882 - - - - - 382,882
Amounts due to related companies 38,892 - - - - - 38,892
Short term loan 2,640,700 - - - - - 2,640,700
Bank overdraft 1,703,323 - - - - - 1,703,323
4,765,797 - - - - - 4,765,797
The following are the contractual maturities of financial liabilities as at 31 March 2015
Within Between Between Between Between More than Total
1 year 1-2 years 2-3 years 3-4 years 4-5 years 5 years
Company Rs. ‘000 Rs. ‘000 Rs. ‘000 Rs. ‘000 Rs. ‘000 Rs. ‘000 Rs. ‘000
Financial instruments in non-current liabilities
Borrowings - - - - - - -
Financial instruments in current liabilities
Trade & other payables 433,849 - - - - - 433,849
Amounts due to related companies 128,569 - - - - - 128,569
Short term loan 1,400,000 - - - - - 1,400,000
Bank overdraft 2,537,486 - - - - - 2,537,486
4,499,904 - - - - - 4,499,904
38.3 Market risk
Market risk is the risk that changes in market prices, such as foreign exchange rates, interest rates and equity prices will affect the Group’s income
or the value of its holdings of financial instruments. The objective of market risk management is to manage and control market risk exposures
within acceptable parameters, while optimising the return.
38.3.1 Currency risk
The Group is exposed to currency risk on sales and purchases that are denominated in a currency other than the Sri Lankan rupees (LKR).The
Group also has limited exposure in respect of recognised foreign currency assets and liabilities.
38.3.2 Interest rate risk
The Group is exposed to interest rate risk on borrowings and deposits. The Group’s interest rate policy seeks to minimise the cost and volatility of
the Group’s interest expense by maintaining a diversified portfolio of fixed rate, floating rate and inflation-linked liabilities.
The Group adopt policy of ensuring borrowings are maintained at manageable level while optimizing return. Interest rates are negotiated
leveraging on the strength of the Cargills group and thereby ensuring the availability of cost -effective funds at all time, while minimizing the
negative effect of market fluctuations. Further, the company has considerable banking facilities with several reputed banks which has enabled the
company to negotiate competitive rates.
Notes to the Financial Statements contd.

& 145Pg. 144
38.4 Capital management
The Board’s policy is to maintain a strong capital base so as to maintain share holder, creditor and market confidence and to sustain future
development of the business. The Board of Directors monitors the return on capital and level of dividends to ordinary shareholders.
Group Company
2016 2015 2016 2015
Rs. ‘000 Rs. ‘000 Rs. ‘000 Rs. ‘000
Total Liabilities 27,706,317 24,539,275 5,318,955 5,167,740
Less: Cash and Cash Equivalents 2,144,349 1,671,542 203,816 11,313
Net Debt 25,561,968 22,867,733 5,115,139 5,156,427
Total Equity 14,504,818 12,879,147 9,404,770 9,133,449
Net Debt to Equity Ratio 1.76 1.78 0.54 0.56
There were no changes in the Group’s approach to capital management during the year.

Pg. 146Cargills (Ceylon) PLC - Annual Report 2015/16
2016 2015
% Rs.’000 % Rs.’000
Creation of Value added
Gross revenue 77,249,542 67,422,455
Cost of good and service (62,522,800) (55,169,125)
Value added from operation 14,726,742 12,253,330
Dividend received 720 811
Other income 1,548,538 1,426,106
Total value added 16,276,000 13,680,247
Distribution of value added
To Associates
Salaries, wages and other related costs 29.92 4,870,513 28.08 3,841,161
Directors’ fees and remuneration 1.43 232,032 1.51 206,525
31.35 5,102,545 29.59 4,047,686
To government
Government levies 35.68 5,807,692 42.33 5,791,170
Corporate taxes 7.34 1,195,427 4.08 557,436
43.02 7,003,119 46.41 6,348,606
To lenders of capital
Interest 4.90 797,599 7.65 1,045,981
Non controlling interest 0.41 66,595 0.17 23,799
5.31 864,194 7.82 1,069,780
To shareholders
Dividends 3.51 571,370 3.27 448,000
Retained for growth
Depreciation 10.34 1,682,156 11.97 1,637,996
Retained earnings 6.47 1,052,616 0.94 128,179
16.81 2,734,772 12.91 1,766,175
100.00 16,276,000 100.00 13,680,247
Statement of Value Added
2016
To Associates 31.35%To government 43.02%To lenders of capital 5.31%To shareholders 3.51%Retained for growth 16.81%
To Associates 29.59%To government 46.41%To lenders of capital 7.82%To shareholders 3.27%Retained for growth 12.91%
2015

& 147Pg. 146
Five Year Financial Summary
Group 2012 2013 2014 2015 2016 Rs.’000 Rs.’000 Rs.’000 Rs.’000 Rs.’000
Financial resultsContinuing OperationsRevenue 48,256,413 55,378,917 58,322,854 61,631,285 71,441,850Profit from operation 2,241,084 2,261,880 2,210,842 1,571,788 3,463,013Profit before taxation 1,558,317 2,142,834 1,130,210 804,653 2,886,008Profit after taxation 1,063,610 1,629,756 649,560 247,217 1,690,581Discontinued OperationsProfit/loss from discontinued operation, net of tax - - - 352,761 -Profit for the year 1,063,610 1,629,756 649,560 599,978 1,690,581
Attributable toOwners of the company 1,049,347 1,612,518 642,593 576,179 1,623,986Non controlling interest 14,263 17,238 6,967 23,799 66,595 1,063,610 1,629,756 649,560 599,978 1,690,581
Financial positionStated capital 130,723 130,723 130,723 130,723 130,723Reserves 7,251,680 11,801,239 12,132,893 12,411,816 13,990,556Non controlling interest 85,914 107,247 45,946 336,608 383,539Capital and reserves 7,468,317 12,039,209 12,309,562 12,879,147 14,504,818
Current assets 8,675,827 9,590,178 10,762,976 12,609,562 14,931,269Current liabilities (16,451,143) (20,460,399) (24,093,936) (20,392,074) (23,755,857)Working capital (7,775,316) (10,870,221) (13,330,960) (7,782,512) (8,824,588)Non current assets 16,261,058 25,980,682 28,581,903 24,553,989 27,279,866Non current liabilities (1,017,425) (3,071,252) (2,941,381) (3,892,330) (3,950,460)Non controlling interest (85,914) (107,247) (45,946) (336,608) (383,539)Net assets 7,382,403 11,931,962 12,263,616 12,542,539 14,121,279
Key IndicatorsGrowth in turnover (%) 29.97 14.76 5.32 5.67 15.92Growth in earnings (%) (3.60) 53.67 (46.39) (7.63) 181.77Operating profit to turnover (%) 4.64 4.08 3.79 2.55 4.85Earnings to turnover (%) 2.17 2.91 1.48 0.97 2.37Return on total assets (%) 4.27 4.58 1.65 1.61 4.01Growth in total assets (%) 29.14 42.64 10.61 (5.54) 13.58Growth in capital and reserves (%) 9.15 61.20 2.25 4.63 12.62Return on capital and reserves (%) 14.24 13.54 5.28 4.66 11.66Return on investment (%) 14.86 16.71 5.34 4.76 12.35Earnings per share (Rs.) 4.68 7.20 2.87 2.57 7.25Dividends per share (Rs.) 2.00 2.00 2.00 2.00 3.50Net assets per share (Rs.) 32.96 53.27 54.75 55.99 63.04Dividends paid per share (Rs.) 1.70 2.00 2.00 2.00 2.55Dividend pay out (%) 36.29 27.78 69.72 77.75 48.28Dividends paid 380,800 448,000 448,000 448,000 571,370Debt equity ratio (times) 2.34 1.95 2.20 1.89 1.91Interest cover (times) 3.59 1.84 1.64 1.89 5.73Current ratio (times) 0.53 0.47 0.45 0.62 0.63Quick assets ratio (times) 0.23 0.23 0.19 0.31 0.33Capital additions 2,510,633 3,540,035 3,335,299 1,788,079 2,264,908Market capitalisation 38,976,000 34,003,200 30,576,000 30,688,000 42,448,000Comparative figures have not been restated
(a) Return on investment is computed by dividing the profit for the year by total average assets employed.(b) Debt equity ratio is computed by dividing the total liabilities by the shareholders’ funds.
(c) Above ratios have been computed based on 224,000,000 shares in issue as at 31 March 2016.

Pg. 148Cargills (Ceylon) PLC - Annual Report 2015/16
Location Land Building Valuation/ Year of extent area cost valuation
(Sq ft) Rs ‘000
Cargills (Ceylon) PLC
Colombo 01 141 Perches 124,215 2,559,800 2016
Boralasgamuwa 2.5 Acres 23,168 296,292 2016
Staple Street - Colombo 02 82 Perches 20,970 776,750 2016
Vauxhall street 1.5 Acres 21,070 2,253,800 2016
Braybrook place 78 Perches 5,146 627,800 2016
Canal Raw, Colombo 01 15 Perches 12,300 325,000 2016
Cargills Square - Jaffna Leasehold 98,525 922,000 2016
Moratuwa 79 Perches - 255,500 2016
Dematgoda 84 Perches - 282,500 2016
Cargills Foods Company (Private) Limited
Kandy 94 Perches 25,174 1,325,376 2016
Maharagama 145 Perches 15,827 566,300 2016
Nuwara Eliya 57 Perches 9,617 209,000 2016
Mattakuliya (111) 330 Perches 80,967 818,400 2016
Park Road - 4,610 48,600 2016
Kohuwala 29 Perches 6,225 110,500 2016
Mattakkuliya (141) 1.8 Acres 44,469 501,700 2016
Gampaha 82.6 Perches - 72,175 2016
Cargills Quality Foods Limited
Mattakuliya 1.3 Acres 16,409 368,500 2016
Ja - Ela 5.1 Acres 38,381 366,470 2016
Ja - Ela 4 Acres 29,246 91,500 2016
Cargills Agrifoods Limited
Katana 11.3 Acres 66,184 456,500 2016
Millers Limited
Bandarawela 85 Perches 6,345 346,250 2016
Kelaniya 1.5 Acres 55,770 335,750 2016
Nittambuwa 112 Perches - 102,250 2016
CPC Lanka Limited
Katoolaya estate, Thawalantenne 4 Acres 695 49,100 2016
Cargills Quality Dairies (Private) Limited
Mirigama, Baduragoda 100 Perches - 6,000 2016
Dawson Office Complex (Private) Limited
Colombo 02 94 Perches - 772,200 2016
Kotmale Dairy Products (Private) Limited
Mulleriyawa 1.8 Acres 29,615 116,000 2016
Bogahawatta 1 Acres 17,442 26,500 2016
Group Real Estate Portfolio

& 149Pg. 148
Investor Relations Supplement
1. General
Stated capital Rs. 130,723,000
Issued shares 224,000,000
Class of shares Ordinary shares
Voting rights One vote per ordinary share
2. Stock exchange listing
The issued ordinary shares of Cargills (Ceylon) PLC are listed in the Colombo Stock Exchange.
3. Distribution of shareholders
Size of 31 Mach 2016 31 Mach 2015
Shareholders Holding Shareholders Holding
Number % Number % Number % Number %
1 - 1,000 1,144 60.95 275,831 0.12 1,147 60.34 293,174 0.13
1,001 - 10,000 487 25.94 1,760,722 0.79 501 26.35 1,801,367 0.80
10,001 - 100,000 185 9.86 5,407,777 2.41 192 10.10 5,453,415 2.44
100,001 - 1,000,000 47 2.50 13,705,506 6.12 46 2.42 13,533,826 6.04
1,000,001 and over 14 0.75 202,850,164 90.56 15 0.79 202,918,218 90.59
1,877 100.00 224,000,000 100.00 1,901 100.00 224,000,000 100.00
4. Analysis of shareholders
31 Mach 2016 31 Mach 2015
Shareholders Holding Shareholders Holding
Number % Number % Number % Number %
Group of
Institutions 129 6.87 194,496,951 86.83 120 6.31 194,152,243 86.68
Individuals 1,748 93.13 29,503,049 13.17 1,781 93.69 29,847,757 13.32
Total 1,877 100.00 224,000,000 100.00 1,901 100.00 224,000,000 100.00
Residents 1,783 94.99 208,171,633 92.93 1,805 94.95 207,291,150 92.54
Non residents 94 5.01 15,828,367 7.07 96 5.05 16,708,850 7.46
Total 1,877 100.00 224,000,000 100.00 1,901 100.00 224,000,000 100.00

Pg. 150Cargills (Ceylon) PLC - Annual Report 2015/16
Investor Relations Supplement Contd.
5. Share valuation
The market price per share recorded during the year ended 31 March 2,016 2,015
Rs. Rs.
Highest 193.50 168.50
Lowest 134.10 136.00
Last traded price 150.00 137.00
6. Top 20 shareholders
The holdings of the top 20 shareholders
31 Mach 2016 31 Mach 2015
Number of Number of
Shares % Shares %
C T Holdings PLC 157,249,240 70.20 156,799,240 70.00
Mr. V R Page 14,961,900 6.68 14,443,900 6.45
Employees Provident Fund 7,356,416 3.28 7,566,966 3.38
Odeon Holdings (Ceylon) Limited 4,822,920 2.15 4,622,920 2.06
Ceylon Guardian Investment Trust - A/C No.1 4,175,700 1.86 4,275,700 1.91
Ms. M M Page 3,948,011 1.76 3,597,920 1.61
HSBC Intl Nom Ltd - SSBT-National Westminister Bank PLC as Depositary of First
State Indian Subcontinen
3,927,600 1.75 3,927,600 1.75
BNY-CF Ruffer Investment Fund : CF Ruffer Pacific Fund 3,208,024 1.43 2,912,056 1.30
Bank of Ceylon No.1 Account 1,303,613 0.58 1,095,930 0.49
Mellon Bank N.A. - Florida Retirement System 1,301,800 0.58 1,301,800 0.58
HINL - JPMCB Butterfield Trust (Bermuda) Lmited 1,297,500 0.58 1,297,500 0.58
HSBC Intl Nom Ltd - SSBT-Wasatch Frontier Emreging Small Countries Fund 987,600 0.44 1,500,000 0.67
GF Capital Global Limited 864,000 0.39 864,000 0.39
The Associated Newspapers of Ceylon Limited 799,840 0.36 799,840 0.36
HSBC Intl Nom Ltd - SSBT-Russell Institutional Funds Public Limited Company 791,300 0.35 791,300 0.35
Deutsche Bank AG as Trustee for JB Vantage Value Equity Fund 752,770 0.34 - -
National Savings Bank 598,040 0.27 783,568 0.35
Sir Chittampalam A Gardiner Trust 563,040 0.25 563,040 0.25
HSBC Intl Nom Ltd-State Street Munich C/o SSBT-Universal- Investment 531,200 0.24 531,200 0.24
Mr. J C Page 455,000 0.20 1,255,000 0.56
Total 209,895,514 93.69 208,929,480 93.28
7. Public holding
The percentage of shares held by the public and number of public shareholders as at 31 March 2016 is 20.49% (2015 - 20.98%) and 1,857
(2015 - 1,882) respectively.

& 151Pg. 150
Notice is hereby given that the seventieth Annual General Meeting of the Company will be held on Friday, 01 July 2016, at 9.30 a.m. at the Auditorium of the Sri Lanka Foundation Institute, No.100, Independence Square, Colombo 07, and the business to be brought before the meeting will be:
1 To consider and adopt the Annual Report of the Board and the Statements of Accounts for the year ended 31 March 2016, with the Report of the Auditors thereon
2. To declare a dividend as recommended by the Directors
3. To re-elect Directors, Messrs
a) S. V. Kodikara, and b) J. C. Page, who retire by rotation and offer themselves for re-election, and c) A. T. P. Edirisinghe, d) Sunil Mendis, and e) E. A. D. Perera, who retire in terms of Section 210 (2) (a) and (b) of the Companies Act No. 07 of 2007 having attained the age of seventy,
seventy one, and seventy years respectively and offer themselves for re-election in terms of Section 211 (1) and (2) of the Companies Act No. 07 of 2007, and
Ordinary Resolution (i)“Resolved that Mr. A T P Edirisinghe, a retiring Director, who has attained the age of seventy years be and is hereby reappointed a Director of the Company and it is hereby declared that the age limit of seventy years referred to in Section 210 of the Companies Act No. 07 of 2007 shall not apply to the appointment of the said Director”, and
Ordinary Resolution (ii)“Resolved that Mr. Sunil Mendis, a retiring Director, who has attained the age of seventy one years be and is hereby reappointed a Director of the Company and it is hereby declared that the age limit of seventy years referred to in Section 210 of the Companies Act No. 07 of 2007 shall not apply to the appointment of the said Director”
Ordinary Resolution (iii)“Resolved that Mr. E A D Perera, a retiring Director, who has attained the age of seventy years be and is hereby reappointed a Director of the Company and it is hereby declared that the age limit of seventy years referred to in Section 210 of the Companies Act No. 07 of 2007 shall not apply to the appointment of the said Director”
4. To appoint Mr. Deva Rodrigo (please see profile on page no 152) as a Director of the Company, as has been approved by the Board subject to Shareholder approval in terms of Section 211 (1) and (2) of the Companies Act No. 07 of 2007, and pass the following Ordinary Resolution: “Resolved that Mr. Deva Rodrigo, who has attained the age of seventy years be and is hereby appointed a Director of the Company and it is hereby declared that the age limit of seventy years referred to in Section 210 of the Companies Act No. 07 of 2007 shall not apply to the appointment of the said Director”
5. To authorise the Directors to determine contributions to charities for the financial year 2016/17.
6. To authorise the Directors to determine the remuneration of the Auditors, Messrs. KPMG, who are deemed reappointed as Auditors at the Annual General Meeting of the Company in terms of Section 158 of the Companies Act No.07 of 2007
By Order of the BoardCargills (Ceylon) PLC
(Signed)S L W DissanayakeCompany Secretary
09th June 2016
Notes:i. A member is entitled to appoint a proxy to attend and vote at the meeting in his or her stead and the proxy need not be a member of the Company.ii. A form of proxy is enclosed for this purpose.iii. The instrument appointing a proxy must be completed and deposited at the registered office of the Company not less than 48 hours before
the time fixed for the meeting.
Notice of Annual General Meeting

Pg. 152Cargills (Ceylon) PLC - Annual Report 2015/16
Profile of Deva Rodrigo – proposed to be appointed a Director of Cargills (Ceylon) PLC at the AGM
Deva Rodrigo, a chartered accountant, had a career with the international accounting and consulting firm PricewaterhouseCoopers, joining the
firm in east Africa in 1974 and serving in its London offices in 1980. He was a Founder Partner when PricewaterhouseCoopers established its Sri
Lankan firm in 1981, and held the position of senior partner from 1992 to 30 June 2006, when he retired from the firm. He was the Chairman
of the Ceylon Chamber of Commerce from 2004 to 2006. He has previously held public office as a director of People’s Bank from 1999 to early
2003 and as a member of the Telecommunication Regulatory Commission from May 1997 to January 2002. Deva was also a member of the
Monetary Board of the Central Bank of Sri Lanka from 2003 to 2006 and a member of the National Council for Administration from 2004 to
2006. He is a director of Chevron Lubricants Lanka PLC and Cargills Bank Ltd.

& 153Pg. 152
Notes

Pg. 154Cargills (Ceylon) PLC - Annual Report 2015/16
Notes

& 155Pg. 154
For use at the seventieth Annual General Meeting
*I/We …………………………………………………………………………………………………………………..…………………………………………
of .…...............................................................……………………………........ being a *member/members of Cargills (Ceylon) PLC hereby appoint
……………………………………………………………….of……………………………………………………………...………………… whom failing
……………………………………………………...………........... of …………………………………………………………………………………………
or failing him/her, the Chairman of the Meeting as *my/our Proxy to represent *me/us and to vote for on *my/our behalf at the seventieth Annual
General Meeting of the Company to be held on Friday, 01 July 2016 and at any adjournment thereof and at every Poll which may be taken in
consequent thereof in the manner indicated below:
Ordinary Resolutions
Resolution number 1 2 3 (a) 3 (b) 3 (c) 3 (d) 3 (e) 4 5 6
For
Against
……………………….. ......................................
Date Signature of member (s)
Notes:
(a) *Strike out whichever is not desired
(b) Instructions as to completion of the Form of Proxy are set out in the reverse hereof
(c) A Proxy holder need not be a Member of the Company
(d) Please indicate with an “X” in the cage provided how your Proxy holder should vote. If no indication is given, or if there is, in the view of the
Proxy holder, any doubt (by reason of the manner in which the instructions contained in the Proxy have been completed) as to the way in
which the Proxy holder should vote, the Proxy holder in his/her discretion may vote as he/she thinks fit
Proxy Form

Cargills (Ceylon) PLC - Annual Report 2015/16 Pg. 156
Instructions for Completion of the Proxy Form
1. To be valid, the completed Form of Proxy should be deposited at the Registered Office of the
Company at No: 40, York Street, Colombo 1, not less than 48 hours before the time appointed for
the holding of the Meeting.
2. In perfecting the form, please ensure that all details are legible. If you wish to appoint a person other
than the Chairman as your proxy, please fill in your full name and address, the name and address of
the proxy holder and sign in the space provided and fill in the date of signature.
3. The instrument appointing a Proxy shall, in the case of an individual, be signed by the appointer or
by his Attorney and in the case of a Corporation must be executed under its Common Seal or in
such other manner prescribed by its Articles of Association or other constitutional documents.
4. If the Proxy Form is signed by an Attorney, the relevant Power of Attorney or a notarially certified
copy thereof, should also accompany the completed Form of Proxy, if it has not already been
registered with the Company.
5. In the case of joint holders, only one need sign. The votes of the senior holder who tenders a vote
will alone be counted.
6. In the case of non-resident Shareholders, the stamping will be attended to upon return of the
completed form of proxy to Sri Lanka.
Proxy Form Contd.

Corporate Information
Name of Company
Cargills (Ceylon) PLC
Company Registration No.
PQ 130
Legal Form
Quoted public company with limited liability, incorporated
in Sri Lanka on 1 March 1946.
Board of Directors
Louis Page (Chairman)
Ranjit Page (Deputy Chairman/CEO)
Imtiaz Abdul Wahid (Managing Director/Deputy CEO)
Sidath Kodikara
Prabhu Mathavan
Priya Edirisinghe
Sanjeev Gardiner
Sunil Mendis
Anthony A Page
Joseph Page
Errol Perera
Company Secretary
Sarath Dissanayake
Remuneration Committee
Sunil Mendis (Chairman)
Priya Edirisinghe
Audit Committee
Priya Edirisinghe (Chairman)
Sunil Mendis
Errol Perera
Related Party Transactions Review Committee
Priya Edirisinghe (Chairman)
Sunil Mendis
Errol Perera
Stock Exchange Listing
Colombo Stock Exchange
Registered Office
40, York Street, Colombo 1, Sri Lanka
Telephone : +94 (0) 11 242 7777
Facsimile : +94 (0) 11 233 8704
E-mail : [email protected]
Postal Address
P.O. Box 23, Colombo 1
Auditors
KPMG
Chartered Accountants
Legal Consultants
Dissanayake Amaratunga Associates
Bankers
Bank of Ceylon
Cargills Bank
Commercial Bank of Ceylon
Deutsche Bank
DFCC Bank
Habib Bank
HNB Bank
HSBC Bank
MCB Bank
NDB Bank
Nations Trust Bank
Pan Asia Bank
People’s Bank
Sampath Bank
Seylan Bank
Standard Chartered Bank
State Bank of India
Subsidiary Companies
Cargills Agrifoods Limited
Cargills Distributors (Private) Limited
Cargills Food Processors (Private) Limited
Cargills Food Services (Private) Limited
Cargills Foods Company (Private) Limited
Cargills Frozen Products (Private) Limited
Cargills Quality Confectioneries (Private) Limited
Cargills Quality Dairies (Private) Limited
Cargills Quality Foods Limited
C P C Lanka Limited
Dawson Office Complex (Private) Ltd
Kotmale Dairy Products (Private) Limited
Kotmale Holdings PLC
Kotmale Marketing (Private) Limited
Kotmale Milk Foods Limited
Kotmale Milk Products Limited
Kotmale Products Limited
Millers Limited
Associate Company
C T Properties Limited
Cargills Bank Limited
Produced by Copyline (Pvt) Ltd Printed by Gunaratne Offset Ltd

www.cargillsceylon.com