Caregiver Perceptions and their Influence on Child ...
104
WORLD VISION LEBANON Caregiver Perceptions and their Influence on Child Education and Labour across Different Areas in Lebanon A CROSS-SECTIONAL SURVEY
Transcript of Caregiver Perceptions and their Influence on Child ...

WORLD VISION LEBANON
Caregiver Perceptions and their Influence on
Child Education and Labour across Different
Areas in Lebanon
A CROSS-SECTIONAL SURVEY

1
Table of Contents
Table of Contents ..................................................................................................................................................................................... 1
List of Figures ............................................................................................................................................................................................. 3
List of Tables .............................................................................................................................................................................................. 4
Acronyms.................................................................................................................................................................................................... 5
Acknowledgments .................................................................................................................................................................................... 6
Executive Summary .................................................................................................................................................................................. 7
Background and Literature Review ...................................................................................................................................................... 9
The Lebanese Context ..................................................................................................................................................................... 11
Research Aim and Objectives ......................................................................................................................................................... 12
Methodology ............................................................................................................................................................................................ 14
Study Design ........................................................................................................................................................................................ 14
Study Population and Setting ........................................................................................................................................................... 14
Sample Size .......................................................................................................................................................................................... 14
Sampling Strategy ............................................................................................................................................................................... 15
Study Instrument ................................................................................................................................................................................ 15
Data Collection and Quality Assurance ....................................................................................................................................... 16
Data Analysis ....................................................................................................................................................................................... 16
Ethical Considerations ...................................................................................................................................................................... 17
Findings ...................................................................................................................................................................................................... 18
Descriptive Figures ............................................................................................................................................................................ 18
Study Sample and Socio-Demographic Characteristics ................................................................................................................. 18
Negative Coping Mechanisms ..................................................................................................................................................... 22
Parental Perceptions ..................................................................................................................................................................... 23
Differences by Nationalities: In Terms of Socio-Economics, Outcomes and Perceptions ............................................... 26
Outcomes of Interest: School Enrolment, Child Labour and Household Chores ............................................................. 30
School Enrolment .......................................................................................................................................................................... 30
Child Labour ................................................................................................................................................................................... 42
Household Chores ........................................................................................................................................................................ 55
Associations between outcomes: (Education & Child labour) and (Education and Household Chores) ..................... 67
Discussion ................................................................................................................................................................................................. 69
Main Findings ....................................................................................................................................................................................... 69
Strengths and Limitations of the Study ......................................................................................................................................... 71
Strengths .......................................................................................................................................................................................... 71
Limitations ....................................................................................................................................................................................... 71
Recommendations .................................................................................................................................................................................. 73
Conclusions .............................................................................................................................................................................................. 76

2
References ................................................................................................................................................................................................ 78
Appendices ............................................................................................................................................................................................... 80
Appendix 1- Detailed Socio-demographic Information ............................................................................................................ 80
Appendix 2- Types of Paid Labour................................................................................................................................................. 84
Appendix 3- Socio-demographic Descriptives by Nationality ................................................................................................. 85
Appendix 4- Perceptions by Nationality ....................................................................................................................................... 89
Appendix 6- Perceptions by Outcomes ....................................................................................................................................... 91
Education Outcomes .................................................................................................................................................................... 91
Child Labour Outcomes .............................................................................................................................................................. 94
Household Chores Outcomes ................................................................................................................................................... 98

3
List of Figures
Figure 1- Residence Area ............................................................................................................................................ 18
Figure 2- Respondent Sex .......................................................................................................................................... 18
Figure 3- Respondent and Partner's Education Level ...................................................................................... 19
Figure 4- Top Income Contributor ......................................................................................................................... 20
Figure 5- Total Monthly Income ............................................................................................................................. 20
Figure 6- Perceived Financial Situation ................................................................................................................. 21
Figure 7- Negative Coping Mechanisms ............................................................................................................. 22
Figure 8- Types of Labour ......................................................................................................................................... 44

4
List of Tables
Table 1- Family Structure and Outcomes of Interest ........................................................................................ 21
Table 2- Reasons for Withdrawal from School .................................................................................................. 23
Table 3- Parental Perceptions around Education ............................................................................................. 24
Table 4- Parental Perceptions around Child Labour ....................................................................................... 25
Table 5- Education enrolment by nationality ..................................................................................................... 32
Table 6- Education enrollment and Socio-demographics: Age group 3 to 11....................................... 33
Table 7- Education enrollment and Socio-demographics: Age group 12 to 18 .................................... 34
Table 8- Predicting proportion of children enrolled in formal/nonformal education for the age group 3 to 11
..............................................................................................................................................................................................37
Table 9- Predicting proportion of children enrolled in formal/nonformal education for the age group 12 to 18
............................................................................................................................................................................................. 39
Table 10- Child labour involvement by nationality ........................................................................................... 43
Table 11- Child Labour and Socio-demographics: Age group 12 to 18 .................................................... 45
Table 12- Predicting proportion of children involved in child labour for the age group 3 to 11 ..... 49
Table 13- Predicting proportion of children involved in child labour for the age group 12 to 18 .. 52
Table 14- Involvement in household chores by nationality .......................................................................... 56
Table 15- Household Chores and Socio-demographics: Age group 3 to 11............................................57
Table 16- Household Chores and Socio-demographics: Age group 12 to 18 ........................................ 58
Table 17- Predicting proportion of children involved in household chores for the age group 3 to 11 62
Table 18- Predicting proportion of children involved in household chores for the age group 12 to 18 65
Table 19- Education Enrolment and Child Labour.............................................................................................67
Table 20- Education Enrolment and Household Chores ............................................................................... 68
5
Acronyms
MEAL Monitoring, Evaluation, Accountability and Learning
HOH Head of Household
UNICEF United Nations International Children's Emergency Fund
WVL World Vision in Lebanon
UNHCR
United Nations High Commissioner for Refugees
ODK Open Data Kit
ANOVA Analysis of variance
LPC Lebanon Protection Consortium
IRC International Rescue Committee
ILO International Labour Organization
ECE Early Childhood Education
CB ECE Community Based Early Childhood Education
NGO Non-Governmental Organization
ALP Accelerated Learning Programme
PSS Psycho-Social Support
SEL Social and Emotional Learning
PwD Person with Disability
MEHE Ministry of Education and Higher Education
MoSA Ministry of Social Affairs
MOIM Ministry of Interior and Municipalities
MOJ Ministry of Justice
CSO Civil Society Organizations

6
Acknowledgments
This report is based on a research study conducted by World Vision in Lebanon (WVL)’s – Monitoring, Evaluation,
Accountability and Learning (MEAL) department.
The lead author is Ms. Sarah Ghazarian (WVL/Research and Data Analyst).
The author would like to acknowledge the key contributions and valuable technical support from:
Ms. Joelle Semaan (WVL/PDQ Director)
Mr. Charbel Chidiac (WVL/Education Technical Specialist)
Mr. Mike Kirakossian (WVL/Child Protection in Humanitarian Action Technical Specialist)
Mr. Georges Abi Rizk (WVL/ Resilience & Livelihood Technical Specialist)
Ms. Grace El Asmar (WVL/ MEAL Manager)
Ms. Joumana Soueid (WVL/GAM Lead)
Ms. Marleine Harb (WVL/Information Management Coordinator).
The author would also like to thank all WVL staff who contributed to the data collection specifically to Mr. Georges
El Khoury (WVL/MEL Coordinator). Profound gratitude is extended to Ms. Marleine Harb (WVL/ Information
Management Coordinator) for technical support in the tool development and data quality control. A special thanks to
the staff who contributed to the launching event, specifically to Ms. Josephine Haddad (Communications and Public
Affairs Manager).
Finally, WVL offers gratitude to the casual workers for completing the interviews with caregivers, and for their
continuous effort to maintain high quality data for this research and appreciation to all those who made this endeavour
possible.
Copyright © World Vision Lebanon 2021 All rights reserved First published 2021 For rights of reproduction or
translation, applications should be made to World Vision Lebanon, Villa Sinyora, Mountazah, Beit Meri, El Maten,
Lebanon or by email to [email protected]

7
Executive Summary
Children are the cornerstone of any society and as such, they need to be trained and provided with adequate
opportunities to ensure their development, survival and rights on the path to their future as adults. Yet most of these
children are at early age exposed to dangerous and risky jobs that affect every aspect of their development. This study
contributes to a small but growing body of literature that explains the determinants of child activity decisions (including
schooling, child labour and household chores) and aims to explore their prevalence in the Lebanese society along with
associations with different socio-demographic factors as well as parental beliefs and perceptions around child labour
and education.
The study was based on a cross-sectional observational survey of parents (both Syrian and Lebanese) of school -aged
children in Lebanon. Data collection was done using an interviewer-administered instrument through phone surveys
from a sample of 776 parents belonging to the less privileged layers of the society and residing in three different areas
across Lebanon.
The findings have shown that over three quarters of the household with children aged 3 to 18 years old had at least
one child enrolled in some sort of education (formal/nonformal) while almost a quarter did not have any. The school
enrolment was lower in the 3 to 11 years old age group compared to the 12 to 18 years old with no remarkable
differences between boys and girls and significant differences between Syrians and Lebanese. Concerning involvement
of children in child labour, 10.8% of the households reported having at least one child aged 3 to 18 years old engaged
in child labour with the percentage being twice as high for the 12 to 18 years old age group compared to that of the
3 to 11 years old age group. Involvement in child labour was significantly higher for boys compared to girls and among
the Syrian households compared to the Lebanese households. As for engagement in household chores, 24.6% of the
households had at least one child aged 3 to 18 years old engaged in household chores and this percentage was four
times higher in the 12 to 18 years old age group compared to that of the 3 to 11 years old age group. Engagement in
household chores varied between boys and girls, where girls were significantly more involved compared to boys, and
involvement was higher in the Syrian households compared to the Lebanese.
Results also have shown that 17.5% of parents reported agreement with perception statements around de-
prioritization of and sex-stereotypes in education and 32.6% agreed with perception statements around the acceptance
and benefits of child labour noting that these statements were negatively phrased reflecting false and fallacious ideas.
The findings highlighted significance differences between the Syrian and Lebanese households in terms of socio-
demographics and for the three of the research outcomes: school enrolment, child labour and engagement in
household chores. The prevalence of the outcomes were significantly higher in the Lebanese household compared to
the Syrian households and the agreement to the perception statements, especially around the acceptance of child
labour, were significantly higher in the Syrian households compared to the Lebanese households. The analyses also
revealed a pattern of association of the outcomes with the economic/financial factors more stoutly in the Lebanese
households compared to the Syrian households where the outcomes were more strongly associated with perceptions
reflecting beliefs.

8
In conclusion, the results challenge the traditional view of child activity decision having mutually exclusive binary
outcomes of either schooling or work. In addition to the alarming need highlighted by the prevalence rates of the
outcomes, the role of beliefs and behavioural determinants is accentuated and is to be taken into consideration for
further exploration and hence inclusion in policy and program design.
9
Background and Literature Review
Child labour is a widespread and growing phenomenon in many developing countries. Nearly 1 in every 10 children –
an estimated 152 million – are in child labour, almost half of them working under hazardous circumstances that refute
them the right of a playful childhood and imperil their health (UNICEF, 2020). An exacerbation in these figures is
expected especially with the economic repercussions of the pandemic, which highlighted poverties. The
aforementioned is concerning as a 1 percentage point rise in poverty leads to at least a 0.7 percentage point increase
in child labour (ILO & UNICEF, 2020).
When defining child labour, no universally agreed-upon definition exists. The International Labour Organization (ILO)
defines child labour as “work which deprives children of their childhood, their potential and their dignity, and is harmful to their
physical and mental development”. The worst forms of child labour involve “children being enslaved separated from their families,
exposed to serious hazards and illnesses and/or left to fend for themselves on the streets of large cities – often at a very early
age”(United Nations International Labour Organization, 1999). In fact, the concepts and definitions of this
phenomenon, even between key organizations addressing it, are diverse and sometimes haphazard (Chaubey et al.,
2007). Weston, views child labour as a social concept which varies by actors, history, context and purpose (Chaubey
et al., 2007; Francis, 2020; Weston & Weston, 2005). Hence, limiting such a complex phenomenon to a single definition
is misleading given the fact that the exercise of defining it is rooted in multi-faceted disciplines including, but not limited
to, cultural, political, scientific and economic (Chaubey et al., 2007).
As such, engagement of children in economic activities is a multifarious issue due to the intricate interaction of social,
cultural and economic factors involved in its prophecy (Omokhodion & Uchendu, 2010). Besides its perplexing causal
pathway, child labour has been linked to adverse health outcomes both on physical and mental levels. A recent meta-
analysis exploring the evidence on the impacts of child labour on health highlighted associations with several health
hazards including, but not limited to; malnutrition, poor growth, higher incidence of infectious diseases, behavioural
and emotional disorders, stress and decreased coping efficacy (Ibrahim et al., 2019).
In the recent decades, there has been a growing interest in child labour among academics, professionals and the media
to understand the determinants of such a phenomenon and hence inform policy-makers to ensure child welfare
(Okpukpara, 2006; Ranjan, 2000; Ray, 2001). The interest in understanding the determinants of child labour has fuelled
a wealth of studies attempting to design models explaining the phenomenon.
Throughout history, child activity has been viewed as a binary decision with two mutually exclusive options, meaning
either engagement in economic activity (work) or school enrolment. Much of the literature on determinants of child
labour does not distinguish between non-work alternatives, often treating school attendance as the only alternative to
work (Jensen & Nielsen, 1997; Ranjan, 2000; Ravallion & Wodon, 2000). In some contexts, data shows, that a
substantial fraction of children neither attend school nor participate in work outside the home. In some cases, these
children may be engaged in substantial household chores, including taking care of younger children and/or younger
adults. Ignoring these differences and options may lead active policy to have unintended consequences. For example,
if school is incorrectly thought of as the only alternative to work, a policy that diminishes child work may simply

10
increase the pool of idle children rather than increasing school attendance, especially if schooling costs are high or
perceived returns from schooling are low (Deb & Rosati, 2005). This has led the empirical literature on child labour
to shift from mere quantification to econometric analysis of the determinants of child labour coinciding with a
widespread realization that simply banning child labour is unlikely to eradicate the problem or may even make a
household worse off (Deb & Rosati, 2005).
Understanding the process pathway of child activity decisions requires coming to grips with the relationship between
child activity options. Decision making structures in regards to child activity options; child schooling versus child labour,
are typically guided by parents (Deb & Rosati, 2005). Different perspectives have been used to explain the decision
making process and among the most popular is the household-production framework which highlights that long-term
family welfare is at the core of child activity decisions (Becker & Tomes, 1976; Buchmann, 2000). Investing in educating
a child is usually taken as the first best option because of the high long run returns on this investment. However, this
investment is a long-term commitment that might be interrupted by economic barriers (Aslam Chaudhary & Naheed
Khan, 2002) or beliefs (cultural or personal). Additionally, since family welfare maximization is at the core of such an
investment, differences in returns to schooling (sometimes rooted in social norms, guidelines or beliefs) (Chaubey et
al., 2007) might guide the decision making: For example, investing in children with greater academic potential, investing
in boys in a community with higher employment opportunities or pay for men (Buchmann, 2000).
There is diversified literature on the subject of child activity decision making. Most theoretical studies focusing on the
economic predictors and emphasizing on the role of poverty/income/livelihoods (Aslam Chaudhary & Naheed Khan,
2002; Basu, 1999; Omokhodion & Uchendu, 2010) as one of the main predictors of household decision on child’s
activity options while most empirical studies are not so explicit (Deb & Rosati, 2005). The determinants of child activity
options extend well beyond the aforementioned economic/financial factor to include deeper economic and social
factors (Aslam Chaudhary & Naheed Khan, 2002). While economic determinants are the cornerstone of a prolific
body of literature on of child labour, with poverty conventionally assumed as the primary driving factor (Goswami &
Jain, 2006) research has shown the significance of non-poverty related factors in depicting child activity decisions. Very
few studies focus on pointing out the social and traditional aspects of the issue (Goswami & Jain, 2006). In fact, the
dynamics of child activity decisions in the community involve not only children’s characteristics but also parents’ as
well in addition to household and community’s characteristics (Goswami & Jain, 2006). A wealth of studies on child
labour concentrate on children but a few focus on parents’ characteristics and views (Omokhodion & Uchendu, 2010)
and understanding child activity decision and its outcomes requires an examination of all the layers of the socio-
ecological model.
Aside from economic considerations, cultural arguments highlight traditional norms and values in shaping educational
decisions. Religious values in some contexts play a significant role. Patriarchal norms promote the preferential
treatment of sons and are cited as a reason for girls' limited school participation in many countries. Sex stereotypes,
such as beliefs that boys or girls have greater academic abilities or girls must get married before reaching a certain age
may also lead to preferential treatments, etc... These cultural determinants affect parental perceptions and beliefs
around the value of schooling and child labour and hence may shape child activity decisions.

11
The Lebanese Context
Understanding parents’ decision making regarding child activity requires recognizing the relationship between child
activity options and the underlying enabling factors, which can vary from one context to another. Hence, it is important
to understand the backcloth and enabling settings behind each of the options.
The Lebanese educational system is divided into private and public (government) sectors. Throughout the years,
schools have been highly privatized across the country in an attempt to accommodate the ever-growing demand for
learning. Private schools, which are in their overwhelming majority dependent on various religious communities, have
a long and deeply rooted history in Lebanon. On the other hand, public schools were weak and further enervated by
the influx of refugees from Syria into the country and particularly after 2019, when the government adopted an open
policy of admitting all refugee children regardless of whether they have the required documentation for school
enrolment (The US Department of Labour, 2020). A recent report by Save the Children highlights the educational
situation in Lebanon indicating that school systems- predominantly public, across Lebanon were already weak prior to
the COVID-19 pandemic. The out-of-school rate for primary education was at 11% as per the 2019 Global Education
Monitoring Report (WORKING CHILDREN IN CRISIS-HIT LEBANON : EXPLORING THE LINKAGES BETWEEN FOOD
INSECURITY AND CHILD LABOUR, 2021).
A survey, conducted by the International Labour Organization and Central Administration of Statistics of Lebanon
jointly, in 2015, indicated that 90% of children aged 5-17 years in Lebanon are enrolled in schools and that attendance
is lowest in the 15-17 years and highest among the 5-11 years group (Child Labour Survey in Lebanon, 2015). Additionally,
the survey indicated that 3.6% of children 5 to 17 years old in Lebanon are working with about two-thirds of them in
the 15-17 years age group. It was highlighted that children help in household activities, quite often in addition to their
studies with almost 50% of the children surveyed being involved in household chores and a much higher percentage of
girls compared to boys. The education figures for the refugee populations in Lebanon are more concerning, as more
than 50 percent of Syrian refugee children and 35 percent of Palestinian refugee children were reported as not enrolled
in formal education (The US Department of Labour, 2020). Hurdles to accessing education particularly for the Syrian
refugee population, include the cost of transportation and supplies, discrimination, bullying, corporal punishment,
different curriculum in Lebanon than in their country of origin and many others (The US Department of Labour, 2020).
Moreover, the proportion of working children as reported by household heads was recorded at 5% in 2018 (World
Vision International, 2019). Numbers for both host and refugee populations show an inclining trend in the number of
children reported to be involved in waged labour. UNICEF reported that the number of Lebanese children involved
in child labour has tripled between 2009 and 2016 (World Vision International, 2019). More recent data available for
the refugee population highlighted that the number of children between aged 5 to 17 years who are engaged in child
labour almost doubled since 2019, reaching 4.4% in 2020(UNICEF et al., 2020). Recent evidence indicates that,
particularly after the economic and political crisis that began in 2019, the number of children on the streets has surged
in addition to the number of children involved in other types of hazardous work including the forced forms, which
exposes them to the range of perils (The US Department of Labour, 2020).
Ten years into the Syrian conflict, Lebanon, being a host country, has been afflicted and overwhelmed on all levels with
repercussions on both populations, host and refugee. Vulnerable Lebanese households facing a tremendous decrease

12
in revenue are left increasingly unable to meet basic needs, including food and healthcare. Displaced Syrian households
are further sinking into debt as they struggle to meet their families’ needs(World Vision International, 2019). With the
chain of deteriorating events in the country since the last quarter of 2019 and the economic collapse, both populations
are reported to be increasingly resorting to negative coping mechanisms to make ends meet. These conditions fuel
serious concerns afflicting all spheres of child wellbeing including protection and education especially with estimates
suggesting an increase in the proportion of population trapped in poverty from a third in 2019 to more than a half in
2020. The increase was estimated due to the rising unemployment, currency fluctuations and the resulting inflationary
effects, disproportionally affecting particularly the poor and middle class(ESCWA, 2010).
How applicable are the divergent theoretical perspectives on child activity decisions in Lebanon? Especially with the
array of crises that have sparked since 2019 pushing the country to the brink on a multitude of levels and peculiarly
the socio-economic one which is assumed, by many theories, to be a primary driving factor behind these decisions.
Additionally, with national evidence confirming the increased resort to child labour as a negative coping mechanism to
cope with the inability to provide food (WORKING CHILDREN IN CRISIS-HIT LEBANON : EXPLORING THE LINKAGES
BETWEEN FOOD INSECURITY AND CHILD LABOUR, 2021).
Research Aim and Objectives
The present study contributes to a small but growing literature that explains the determinants of child activity
decisions, including schooling, child labour and household chores. As discussed previously, a good understanding of
the key determinants to child activity decisions is essential for formulating appropriate policies and programming for
better child wellbeing outcomes.
The aim of this study is to explore figures around child activity options (school enrolment, child labour and household
chores) and their determinants for children aged 3 to 18 years old in Lebanon, with a focus on less privileged layers
of the society. Additionally, the study sought to determine the perceptions of child education and labour among parents
of school-aged children.
Throughout the course of this study, the three child activity outcomes are defined as follows:
a- School enrolment: The enrolment status, at the time of data collection, of children in formal or non-formal
education.
b- Involvement in child labour: The involvement, at the time of data collection, of children in any form of waged
labour. Acknowledging the intricate definition of child labour and for the purpose of pragmatism, this simplified
definition was adopted. It is important to highlight that the adopted definition might not capture children who
are forced to work without pay in return.
c- Involvement in household chores: The involvement, at the time of data collection, of children in any form of
household/domestic chores.
Additionally, the study aimed to focus on the less privileged layer of the society to better capture child labour
figures. The vast body of literature stipulates that child labour is more common in these pockets of the society.
To achieve this target and since the study focuses on parents of school aged children, a proxy measure combining
13
both approaches (being a parent of a school aged child and belonging to a less privileged pocket of the society)
was used. Consequently, the selection was narrowed down to parents having at least one child attending a public
or semi-private school or covered-private or not attending any school at all.
The research questions and hypotheses are the following:
1. What is the prevalence of school enrolment for school-aged children among the less privileged layers of the
society in Lebanon?
2. What is the prevalence of child labour for school-aged children among the less privileged1 layers of the society
in Lebanon?
3. What is the prevalence of involvement in household chores for school-aged children among the less privileged
layers of the society in Lebanon?
4. What are the perceptions of parents of school-aged children in Lebanon around school enrolment and child
labour?
5. What are the socio-demographic characteristics associated with each of school enrolment, child labour and
household chores outcomes for school-aged children among the less privileged layers of the society in
Lebanon?
6. What are the parental perceptions associated with each of school enrolment, child labour and household
chores outcomes for school-aged children among the less privileged layers of the society in Lebanon?
7. What are the predictors of each of school enrolment, child labour and household chores outcomes for school-
aged children among the less privileged layers of the society in Lebanon?
1 The selection was narrowed down to parents having at least one child attending a public or semi-private school or covered-private or not attending any school at all. These groups are considered to be less privileged compared to caregivers of children attending private schools

14
Methodology
Study Design
The study was a cross-sectional observational survey of parents (both Syrian and Lebanese) of school-aged children in
Lebanon using an interviewer-administered instrument. This design was adopted for its adequacy in terms of addressing
the research questions and in terms of time- and cost-efficiency. In addition, this method allows the exploration of
multiple determinants and the testing of many hypotheses. Data collection modality was reverted to remote data
collection, through phone surveys, given the COVID-19 circumstances and the pertinent countrywide lockdown
regulations.
Study Population and Setting
The target population for the study included caregivers of school-aged children among the less privileged layers of the
society residing in different areas in Lebanon. The definition adopted for school-aged children was according to the
official educational protocols dictating the enrolment of children 3 to 18 years old in education. Targeting the less
privileged layer of the society was achieved through adopting the proxy measure of interviewing caregivers with at
least one child attending a public or semi-private school or covered-private or not attending any school at all. Public
schools are generally low cost compared to private schools; this makes public schools a choice for financially less well-
off families.
The inclusion criteria included:
- Being a caregiver aged between 19 to 64 years old.
- Residing in World Vision Lebanon’s (WVL) areas of intervention: BML, Bekaa and Akkar.
- Having at least one child attending a public or semi-private school or covered-private or not attending any
school at all. By this criterion, the less privileged layers of the society were targeted excluding those who can
afford enrolling their children in private schools and hence are better off.
- Not working in any of the following areas: Social work, Non-profit organizations with a focus on child
protection or Psychology (As working in any of the aforementioned fields might bias the assessed constructs
which comprise perceptions and beliefs on education and labour which are related to child well-being and
rights).
Sample Size
The sample size for the study was calculated with absolute conservativeness accounting for the presence of three
outcomes of interest.
Major differences were hypothesized in terms of socio-demographics, outcomes and associations between the two
nationalities (Lebanese and Syrian) making up the majority of the Lebanese society. These differences were tested and
verified, but to account for these differences and be able to draw inferences at each nationality level, the sample size
was calculated for each nationality separately.

15
Since the primary goal of this study was to estimate prevalence of child activity outcomes, the sample size was
calculated according to the formula based on desired precision for binary outcomes:
Where,
n = the required sample size
Zα/2= 1.96 using 95% confidence interval
p= 0.5 (most conservative)
E= 0.05 (to estimate the true proportion within ± 5 percentage points)
Solving the formula, the obtained sample size is 384 for Syrians and 385 for Lebanese yielding a total required sample
size of 769.
Sampling Strategy
To ensure representativeness of Lebanese and Syrian caregivers, the sample size was calculated using secondary data
from the MoPH statistical bulletin for the Lebanese population in 20192 and secondary data from UNHCR for the
Syrian population in 20203. The sampling covered three geographical areas; BML, Bekaa and Akkar. South was excluded
due to the unavailability of sampling lists for the data collection. A stratified probability proportional to size sampling
technique was adopted at the geographical area level, yielding representative samples that reflect the spread and size
of the population in each area for each nationality. The target sample is described below:
Area Total Sample per Area Lebanese Syrians
Akkar 164 48 167
Bekaa 260 93 116
BML 354 244 101
Total 769 385 384
Study Instrument
The Monitoring, Evaluation, Accountability and Learning (MEAL) team in collaboration with World Vision in Lebanon
(WVL) child protection and resilience, education and livelihood experts developed the research instrument. Remote
data collection was adopted given the COVID-19 regulations across the country during the time of the study. The
remote data collection modality was accounted for, in terms of time consumption and interviewee burden, in
2 https://www.moph.gov.lb/en/Pages/8/327/statistical-bulletins 3 https://data2.unhcr.org/en/situations/syria/location/71

16
developing the tool. The interviewer-administered tool was translated into Arabic, and was pilot tested prior to data
collection.
The final general tool included a screening section to check the participant's eligibility for the study followed by the
structured section that included the following segments:
Segment 1: Socio-demographics
Segment 2: Family Structure, Education, Child Labour and Negative Coping Mechanisms
Segment 3: Parental perceptions about Education
Segment 4: Parental perceptions about Child Labour
Segments 3 and 4 comprised several perception statements around education and child labour. The tool sought to
explore the degree of participants’ agreement to these statements, some of which reflect attitudes and others have
different normative, cultural and traditional grounds. The development and the design of the statements was based on
a thorough literature review of existing parental perceptions around child labour and education which were
contextually verified by the research and experts’ team and further fortified with additional context-specific statements.
A three point Likert-type scale (agree, neutral and disagree) was used to rate the degree of agreement to these
statements.
Data Collection and Quality Assurance
Parental data was collected through phone interviews with the selected parents by a team of four enumerators. The
data collection team was trained by WVL prior to data collection to ensure their understanding of the research
objective, the survey content and ethical considerations.
Phone calls were conducted during the months of January and February 2021 during two shifts, morning time (9:00
am to 2:00 pm) and afternoon time (2:00 pm to 8:00 pm) to ensure the representativeness of working and non-working
parents in the sample.
The quality control process started at the coding stage. The tool was coded on ODK collect, which has several features
that can help validate and control the data entered by the enumerators by establishing a logical relationship among
variables and provide messages on the spot when an enumerator/data collector inputs data. It also controls skip
patterns, missing data, redundant entry, & a defined set of outliers. The research and data analyst and the Information
Management (IM) Coordinator supervised the data collection process. Daily follow up calls with the enumerators were
performed to follow up on the progress and the number of surveys completed and to discuss challenges, if any. Further,
the Information Management unit at WVL adopted editing, cleaning and back-checking of the completed questionnaires
as an additional layer of quality assurance.
Data Analysis
Statistical Package for the Social Sciences (SPSS) was the software used for data analysis. Demographic data were
analysed using basic descriptive statistics. Central tendency measurements (means and standard deviations for
continuous variables and frequencies for categorical variables) were used to summarize the variables and their

17
variability. Bivariate analyses were performed to determine the association between various independent factors and
the main outcomes of interest: enrolment in education, engagement in child labour and engagement in household
chores. The outcome variables were measured as dichotomous variables as well as continuous variables (proportions)
that further quantified each of the outcomes. Pearson’s chi-square (or Fisher's exact) tests were performed to test for
associations between categorical variables and the binary versions of the outcome variables. Independent T-tests,
ANOVA and Welch’s ANOVA tests were used to test for associations between the categorical variables and the
continuous versions of the outcome variables. Finally, Pearson’s correlations were used to investigate the associations
between the continuous independent variables and the continuous versions of the outcome variables.
To determine the predictors of the main outcomes of interest: enrolment in education, engagement in child labour
and engagement in household chores, stepwise hierarchical multiple linear regression analyses were conducted
separately for each type of outcome using a backward selection procedure, with significance level for removal from
the model set at 0.1. All these regressions were fit using cluster-correlated robust variance estimates and demographic
variables. For categorical variables, dummy variables were created to conduct multivariate analysis. A p-value of 0.05
was used as the cut-off for significance for all statistical tests conducted.
Ethical Considerations
Ethical considerations of privacy, confidentiality and informed consent were taken into account while conducting the
study; the respondents’ anonymity and confidentiality of shared information were ensured. The purpose of the
research was explained to every participant. In addition, confidentiality was assured and each participant was informed
that s/he was able to choose freely whether to participate or not in the study. Participants also understood that they
had the right to able to skip any of the questions and withdraw from the study at any time. All participants were
included in the study only if they voluntarily agreed to participate.

18
Findings
Descriptive Figures
Study Sample and Socio-Demographic Characteristics Overall, the final study sample included 776 participants meeting the screening/selection criteria compared to a target
sample of 769. Appendix 2 illustrates the demographic and socio-economic characteristics of the study sample.
The final sample was equally distributed between Lebanese (389, 50.1%) and Syrian (387, 49.9%) respondents as
targeted, to secure enough power for comparisons between the populations (as considerable differences between
these two populations were hypothesized and validated later during the course of analysis). Further, the overall sample
was characterized with almost equal male (391, 50.4%) and female (385, 49.6%) respondent proportions, due to the
equal sex-proportion targeting and sampling strategy adopted at each population (nationality) level (Figure 2). The
geographic distribution can be summarized with 162 participants (20.9%) from Akkar, 259 (33.4%) from Bekaa and 355
(45.7%) from BML. The aforementioned geographic disaggregation complies with the natural distribution of the two
populations at the governorate levels yielding two representative sub-samples of each nationality in terms of natural
geographic spread. Appendix 2 further narrows down the geographic distribution to Qadaa level.
Sixty four percent (497 out of 776) of those interviewed were the heads of the household while the majority of the
remaining 279 (36.0%) in terms of their relationship to the head of the household were the spouses (Wife/Husband,
87.5%). Male-headed household were 83% (644 out of 776) of the entire sample while female-headed households were
only 17.0% (132 out of 776).
Respondents had equal sex-proportions (Figure 2), as mentioned previously, and the average respondent age was 41.5
years old (in a range extending from 18.2 to 64.2 years old) .
In terms of social status, a lion’s share of the respondents were married (653, 84.1%) and 3.6% were single, 5.3%
widowed, 4.0% separated and 2.7% divorced.
20.9%
33.4%
45.7%
Residence Area
Akkar Bekaa BML
Figure 1- Residence Area
391, 50%
385, 50%
Respondent Sex
Male
Female
Figure 2- Respondent Sex

19
From a socio-economic lens, 80.6% of the respondents had intermediate level of education and below (11.0% no
education, 37.6% primary education and 32.0% intermediate), 16.0% had secondary/university level and only 3.5% had
vocational/technical education. For those married (653, 84.1%), the partners had a similar pattern of educational levels
with 82.3% having intermediate level of education and below (15.0% no education, 38.1% primary education and 29.2%
intermediate education), 15.3% secondary/university level and only 2.3% had vocational/technical education (Figure 3).
Figure 3- Respondent and Partner's Education Level
In terms of respondent occupation, a bit more than one third of the sample (32.7%) were daily workers, 28.3% were
not working; out of the non-working respondents, 23.5% stated that the reason due was lack of opportunities while
4.8% were not working by choice. Of the remaining respondents, 21.6% mentioned household care as an occupation,
7.2% were full-time employees, 2.7% were part-time employees, 4.1% were freelancers, 1% were business owners,
0.4% were retired and 1.9% mentioned other occupation types of which seasonal agriculture was the most common.
Regarding income contribution dynamics, 50.8% of the respondents mentioned being income contributors
themselves (out of which, 90.4% are heads of the households) , 29.5% mentioned spouse/parent, 9.8% adult children,
4.1% children below 18, 3.2% extended family and 13.8% mentioned others, of which the overwhelming majority
specified assistance and debt. The respondent was mentioned to be the top income contributor in 48.8% of the

20
households interviewed, spouse/parent by 26.5%, adult children by 7.9%, Children under 18 by 1.9%, extended family
by 1.9% (Figure 4).
The majority of the respondents (80.7%) earn an income below one million LBP (Figure 5), 10.1% earn an income
between one million to one million and three hundred thousand LBP and only 9.3% earn above the aforementioned.
It is noteworthy to mention that given the aforementioned figures, 96.6% of the sample earn an income below
1,600,000 LBP.
Figure 5- Total Monthly Income
Concerning perceived financial situation (Figure 6), respondents were asked to rate their perception of their financial
situation through picking one of the four options describing the degree to which the household needs were met in the
past year. More than half of the respondents (56.8%) mentioned that most of their needs are not met. Over quarter
of the households (26.7%) mentioned that some of their needs met, 15.2% mentioned that most needs are met but
cannot save money for the future plans and only 1.3% mentioned that their needs are met and they managed to save
money for the future plans.
10.3%
35.1%
35.3%
10.1%
5.9% 3.4%
Total Monthly Income
0 to 300,000 LBP 301,000 to 650,000 LBP
651,000 LBP to 1,000,000 LBP 1,001,000 to 1,300,000 LBP
1,301,000 to 1,600,000 LBP 1,601,000 LBP and more
48.8%
26.5%
7.9%1.9% 1.9%
12.9%
Resp
ondent
Spouse
/pare
nt
Adult ch
ildre
n
Child
ren u
nder
18
Exte
nded fam
ily
Oth
er
Top Income Contributor
Figure 4- Top Income Contributor

21
Figure 6- Perceived Financial Situation
Descriptives on family structure are elaborated in Table 1 below. The mean number of total members is 5.75
and the mean number of children 3 to 18 years old is 2.58. Breaking down the children by age groups, the
proportion of households with children 3 to11 years old is 76.9%, in which the average number was 2.0 children in
this age-group and 50.8% are boys compared to 49.2% girls reflecting an almost equal sex-ratio. The proportion of
households with children 12 to 18 years old is 60.1%, in which the average number was almost 2 (mean:1.7) children
in this age-group and 51.3% are boys compared to 48.7% girls, again reflecting an almost equal sex-ratio for children
in this age group.
N Minimum Maximum Mean Std. Deviation
Total number of members 776 2.0 23.0 5.753 2.423
Total number of children (3-18) 776 1.000 10.000 2.582 1.577
Proportion of households with children
3to11 years old
597 Percentage (out of 776) 76.9
Proportion of boys 3-11 years old in the
household
597 0.000 1.000 0.508 0.406
Proportion of girls 3-11 years old in the
household
597 0.000 1.000 0.492 0.406
Total number of children 3-11 years old in
the household
597 1.000 9.000 2.015 1.159
Proportion of households with children 12
to18 years old
466 Percentage (out of 776) 60.1
Proportion of boys 12to18 years old in
the household
466 0.000 1.000 0.513 0.428
Proportion of girls 12to18 years old in the
household
466 0.000 1.000 0.487 0.428
Total number of children 12to18 years old
in the household
466 1.000 5.000 1.719 0.809
Table 1- Family Structure and Outcomes of Interest
Household Care (Housewife)
Full-time employee
Not working by choice
Freelancer
21.6%
7.2%
4.8%
4.1%
Perceived Financial Situation

22
NEGATIVE COPING MECHANISMS
To fortify the economic/financial lens of the study, engagement in negative coping mechanisms was explored. This
supports in understanding the income and perceived financial situation figures. When unable to make ends meet with
the income, household adopt a variety of strategies to cope with the deficiencies in their needs. To explore the extent
of adoption of negative coping strategies, respondents were provided with a list of these negative strategies and asked
to identify the ones they have engaged in during the past year. More than three-quarters (77.4%) of the respondents
reported opting to purchase food on credit as one of the coping mechanisms while more than two-thirds (66.9%)
borrowed money. Selling household assets and/or goods, spending savings and selling productive assets or means of
transport were reported by 44.2%, 11.6% and 6.2% of the respondents respectively. Withdrawing children from school
was reported by 7.7% of the respondents while 1.4% moved children from private to public schools. Only 6.4% of the
respondents reported not opting for any coping mechanism. (Figure 7)
Figure 7- Negative Coping Mechanisms
Among those who have withdrawn their children from school (7.7%, 60 households), the sex-proportions of the
withdrawn children were the same (70% for both males and females). The most prevalent reason for withdrawal was
inability of pay school fees which was mentioned by 75.0% (n=45) of the respondents while fear of COVID-19 was a
reason reported by 18.1% of the respondents. Logistical obstacles to online learning (absence of hardware, limited
access to internet, limited access to electricity) was mentioned by 15.0% of the respondents who withdrew their
children from school. It is noteworthy to highlight that 5 respondents (8.5%) mentioned the need to engage the child
in income earning activities as a reason for withdrawing the children from school. Table 2 reflects a more detailed
presentation of the reasons for withdrawal from school.
Reasons for withdrawal from school N (%)
Inability to pay school fees and expenses (Tuition fees, transportation, stationary… ) 45 (75.0%)
Unwillingness to pay school fees 0 (0.0%)
Poor educational performance of withdrawn child 3 (5.0%)
Fear of COVID-19 11 (18.3%)
Ineffectiveness of the current educational year due to COVID-19 measures (irregular attendance of
classes within school premises and in-school measures…)
4 (6.7%)

23
Ineffectiveness of distant learning (online learning) 2 (3.3%)
Logistical obstacles to online learning (absence of hardware, limited access to internet, limited
access to electricity)
9 (15.0%)
Inability of caregivers to support children with online learning (unfamiliarity with online platforms,
education level of caregivers…)
3 (5.0%)
The need to engage the child in income earning activities 5 (8.3%)
Health issues of withdrawn child 2 (3.3%)
Educational level achieved is enough 0 (0.0%)
Violence and/or bullying 0 (0.0%)
Other 9 (15.0%)
Total 60
Table 2- Reasons for Withdrawal from School
PARENTAL PERCEPTIONS
To explore parental perceptions around education and child labour, respondents were requested to identify their
degree of agreement, on a three point Likert-type scale (agree, neutral and disagree) to a set of statements reflecting
different perceptions in the society. Parental perceptions around education (in terms of perceived value and sex-
stereotypes) and perceptions around child labour practices are abridged in tables 3 and 4 respectively.
Perception Agreement
Level
N (%)
Education
Perceptions
Educating children is a way to secure financial support and economic
welfare in the future.
disagree 16 (2.1%)
neutral 6 (0.8%)
agree 754 (97.2%)
Education is not worth the money it costs. disagree 734 (94.6%)
neutral 5 (0.6%)
agree 37 (4.8%)
Schooling/education investments for girls (daughters) are not worth
because women have lower paying jobs.
disagree 745 (96.0%)
neutral 14 (1.8%)
agree 17 (2.2%)
Schooling/education investments for girls (daughters) are not worth
because eventually they will get married and stay home to take care
of children
disagree 745 (96.0%)
neutral 12 (1.5%)
agree 19 (2.4%)
Schooling/education investments for girls (daughters) are not worth
for securing family’s welfare because girls get married and leave to
support husbands’ household.
disagree 745 (96.0%)
neutral 14 (1.8%)
agree 17 (2.2%)
Schooling/education investments for boys (sons) are worth because
they have greater academic abilities than girls.
disagree 712 (91.8%)
neutral 18 (2.3%)
agree 46 (5.9%)
Schooling/education investments for girls (daughters) are worth
because they have greater academic abilities than boys.
disagree 668 (86.1%)
neutral 23 (3.0%)
agree 85 (11.05%)

24
Schooling/education investments for boys (sons) are NOT worth
because it is better for them to be engaged in workforce instead.
disagree 757 (97.6%)
neutral 5 (0.6%)
agree 14 (1.8%)
Table 3- Parental Perceptions around Education
The vast majority (97.2%) of the respondents agreed that educating children is a way to secure financial support and
economic welfare in the future. Only 37 respondents (4.8%) agreed to the statement that education is not worth the
money it costs. In terms of sex-stereotypes around education, a trivial proportion of respondents (2.2%) agreed that
schooling/education investments for girls (daughters) are not worth because women have lower paying jobs. Similarly,
only 2.4% agreed to the statement that schooling/education investments for girls (daughters) are not worth because
eventually they will get married and stay home taking care of children and 2.2% agreed to schooling/education
investments for girls (daughters) not being worth for securing family’s welfare because girls get married and leave to
support husbands’ household. Further, in terms of sex-stereotypes around academic abilities, a higher proportion of
respondents (11.05%) agreed with education investments for girls (daughters) being worth because they have greater
academic abilities compared to those who agreed to education investments for boys (sons) being worth because they
have greater academic abilities (5.9%). Regarding the value of education for boys compared to that of child labour, only
14 respondents (1.8%) agreed to the statement that education investments for boys (sons) are not worth because it
is better for them to be engaged in workforce instead. Overall, 17.5% agreed or somehow agreed (neutral) to all the
perception statements around education, noting that these perceptions are negatively phrased reflecting false and
fallacious ideas.
Perception Agreement
Level
N (%)
Child
Labour
Perceptions
Child labour is an accepted and common form of
practice.
disagree 664 (85.6%)
neutral 16 (2.1%)
agree 96 (12.4%)
Child labour is an accepted and common form of
practice if the child is above 14 years old.
disagree 504 (64.9%)
neutral 20 (2.6%)
agree 252 (32.5%)
Child labour is a means of preparing children to the
future.
disagree 576 (74.2%)
neutral 27 (3.5%)
agree 173 (22.3%)
Parent derives much benefits (including financial) by
engaging their children in child labour
disagree 501 (64.6%)
neutral 21 (2.7%)
agree 254 (32.7%)
The economic situation encourages child labour
practices.
disagree 420 (54.1%)
neutral 16 (2.1%)
agree 340 (43.8%)
Peer pressure increases the numbers of children
involved in child labour
disagree 419 (54.0%)
neutral 29 (3.7%)

25
agree 328 (42.3%)
Cultural beliefs increase the numbers of children
involved in child labour.
disagree 489 (63.0%)
neutral 18 (2.3%)
agree 269 (34.7%)
A working child makes a responsible adult.
disagree 506 (65.2%)
neutral 24 (3.1%)
agree 246 (31.7%)
Child labour practices help the child to be smart.
disagree 550 (70.9%)
neutral 31 (4.0%)
agree 195 (25.1%)
Involving children in paid job enhances their life
skills
disagree 434 (55.9%)
neutral 15 (1.9%)
agree 327 (42.1%)
Children gain a vocation thought child labour
disagree 436 (56.2%)
neutral 38 (4.9%)
agree 302 (38.9%)
Not everyone gains many opportunities by studying.
It’s better to work at young age and gain income
disagree 598 (77.1%)
neutral 14 (1.8%)
agree 164 (21.1%)
Engaging children in paid work keeps them out of
trouble
disagree 539 (69.5%)
neutral 57 (7.3%)
agree 180 (23.2%)
Child labour is an accepted and common form of
practice for boys.
disagree 579 (74.6%)
neutral 18 (2.3%)
agree 179 (23.1%)
Table 4- Parental Perceptions around Child Labour
Around one eighth (12.4%) of the respondents agreed that child labour is an accepted and common form of practice
and this percentage increases when the statement is narrowed down to boys, where 23.1% agreed that child labour is
an accepted and common form of practice for boys. Moreover, a larger share (32.7%) of the participants agreed to
child labour being an accepted and common form of practice when the statement is narrowed down to the age group
of children above 14 years old. Regarding the perceived benefits of child labour, 22.3% agreed to child labour being a
means of preparing children to the future, 32.7% believed that parent derives much benefits (including financial) by
engaging their children in child labour, 31.7% believed that a working child makes a responsible adult, 25.1% believed
that child labour practices help the child to be smart. Additionally, 42.1% believed that paid jobs enhance children’s life
skills, 38.9% believed that children gain a vocation by child labour and 23.2% believed that engaging children in paid
work keeps them out of trouble. Concerning external and enabling factors, 43.8% believed that the economic situation
encourages child labour practices and 42.3% perceived that peer pressure increases the numbers of children involved
in child labour while 34.7% perceived that cultural beliefs increase the numbers of children involved in child labour.
Finally, 21.1% believed that not everyone gains many opportunities by studying and it is better to work at young age

26
and gain income. Overall, 32.6% agreed or somehow agreed (neutral) to all the perception statements around child
labour practices, noting that these perceptions are negatively phrased reflecting false and fallacious ideas.
Differences by Nationalities: In Terms of Socio-Economics, Outcomes and Perceptions One of the hypotheses of the study design was the significant difference in characterises between the Lebanese and
Syrian subsets in terms of socio-demographics, the perceptions and outcomes of interest. The hypothesis was validated
with different tests and the differences between both sub-sets were proven to be significant and hence the correlational
and predictive analyses were split by nationality to better explain the trends within each distinct group. The detailed
descriptive figures split by nationality are available in Appendix 4.
The majority of the respondents in both nationality groups were married with the percentage being higher in the
Syrian population (88.3%) compared to the Lebanese (80.5%) and the differences in the social status percentages being
statistically significant (P-value=0.006).
In the Lebanese population, respondents with intermediate/vocational educational represented the highest (41.9%)
followed by respondents with no education or primary level (31.9%) and respondents with secondary/technical or
university education level (26.2%). This pattern was different in the Syrian population where more than two thirds of
the respondents (65.4%) had no or primary education followed by those having intermediate/vocational education
(22.7%) and those having secondary/technical or university education level (11.9%). The difference between the two
populations was statistically significant. A pattern similar to the respondent’s education level is applicable to that of the
partner’s education level for both Syrian and Lebanese population with the difference being similarly statistically
significant.

27
In terms of occupation, more than three-quarters of the Syrian respondents were either daily workers (41.8%) or
were retired/not working (35.5%) while this pattern was statistically significantly different than the Lebanese population
which was almost equally split between four occupation groups; daily worker, household care, retired/not working
and a combination of full-time/part-time employee and business owner/freelancer.
The mean age of the Lebanese respondents was 46.0 years old while it was 36.9 years old for Syrian respondents and
this difference was statistically significant.

28
The difference in top income contributors’ distribution between both populations was statistically significant and can
be attributed to the higher percentage of Syrians relying on assistance as a source of income.
Similarly, the difference in the total monthly income was significant between both populations, where the majority of
Lebanese respondents (86.2%) earned a total monthly income ranging up to 1,300,000 LBP while the majority of Syrian
respondents (86.9%) earned a total income ranging up to 1,000,000 LBP.
Finally, Syrians reported worse perceived financial situation compared to Lebanese and the difference between the
two populations was statistically significant. (Appendix 4)

29
The perceptions around education and child labour varied between both nationalities and the difference was statistically
significant for almost all the perceptions except for the following education perceptions: educating children is a way to
secure financial support and economic welfare in the future, education is not worth the money it costs,
schooling/education investments for girls (daughters) are not worth because eventually they will get married and stay
home to take care of children and schooling/education investments for girls (daughters) are not worth for securing
family’s welfare because girls get married and leave to support husbands’ household. The details on the perceptions
and their mean scores by nationality are depicted in Appendix 5.
As for the three main outcomes of interest, the differences by nationalities are tackled in the following sections.

30
Outcomes of Interest: School Enrolment, Child Labour and Household Chores
The descriptive figures followed by the correlational analyses and predictive analyses for the three outcomes of interest
will be illustrated in the following sections. Firstly, figures for the whole target age group of children (3 to 18) are
presented and then the figures are broken down by age groups into two sets; 3 to 11 years old group and 12 to 18
years old group. The aforementioned age-group breakdown was guided by the breakdown adopted throughout the
data collection instrument used because the specific outcomes of interest were hypothesized to be different between
those two age groups, a fact that can be noticed throughout the rest of the report when comparing the figures for
both age groups.
Additionally, the correlational and predictive analyses will be split by both nationality and age groups throughout the
rest of the report. The split by nationality is due to the significant differences in the exploratory (independent) variables
(discussed in the previous section) and the differences in the outcomes of interest between the two nationalities that
necessitates studying the relationships between the variables at each nationality level alone.
SCHOOL ENROLMENT
The following section summarizes the descriptive figures followed by the correlational analyses and predictive analyses
for the school enrolment outcome; proportion of children enrolled in formal/nonformal education. Firstly, figures for
the whole target age group of children (3 to 18) are presented and then the figures are broken down by nationality
and age groups.
DESCRIPTIVE FIGURES
Throughout the sample, 76.2% (591 households) had at least one child aged 3 to 18 years old enrolled in some sort
of education (formal/nonformal). Within the households, on average, 67.9% of the children 3 to 18 years old are
enrolled in some form of education and 32.1% of the children (3 to 18) within the household are not enrolled in any
form of education. To elaborate with an example; if total number of children in a household is 10 for example, on
average 7 (67.9%) of them are enrolled in some form of education while 3 (32.1%) are not enrolled in any form.
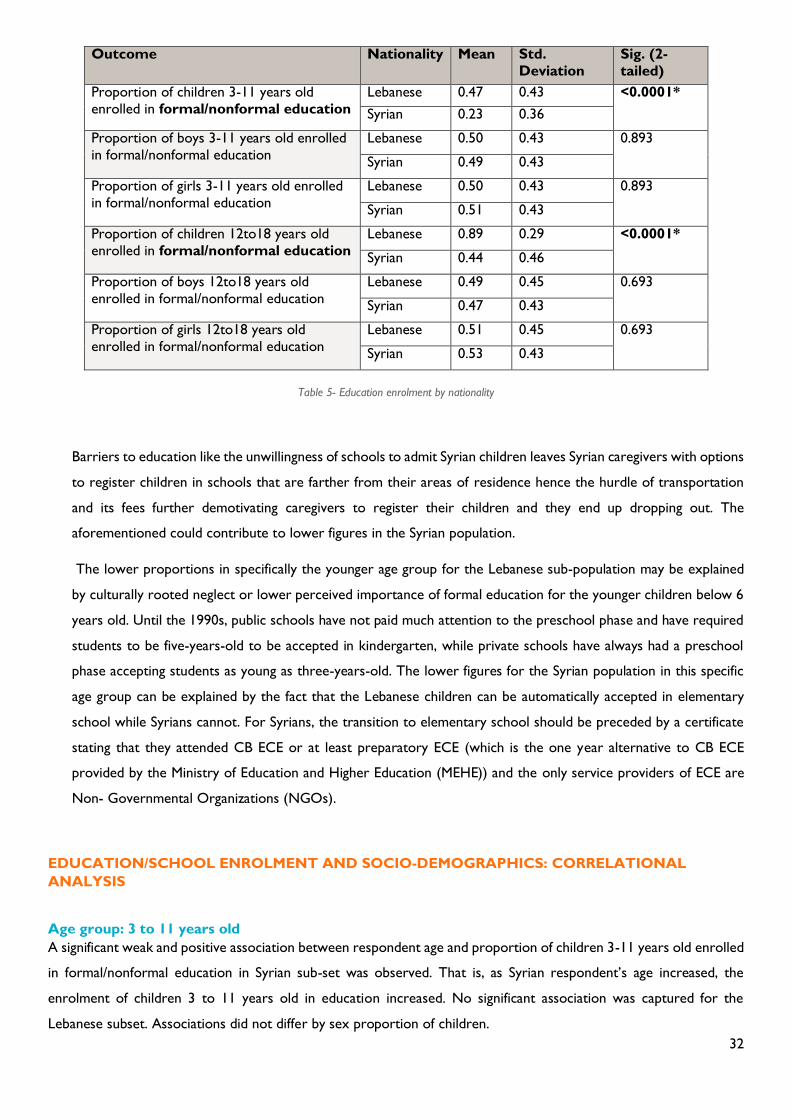
The education enrolment outcome for the entire age range of children (3 to 18 years old) varied significantly between
the two nationalities, where 95.1% of the Lebanese respondents had at least one child 3 to 18 years old enrolled in
any form of education while this percentage was 57.1% for Syrians (P-value= <0.0001). Additionally, looking at another
education outcome from another angle, 12.3% of the Lebanese respondents had at least one child 3 to 18 years old

31
not enrolled in any form of education while this percentage was significantly (P-value=<0.0001) higher in the Syrian
sub-group at 71.6%.
Breaking down the figures by age groups:
a- Of the households with children 3 to 11 years old, 71.2% had at least one child enrolled in some sort of
education (formal/nonformal) indicating that 28.8% do not have any children enrolled in any type of education.
Within the household with children 3 to 11 years old, on average, 32.5% of the children (3 to 11 years old)
are enrolled in some form of education. School enrolment for the 3 to 11 years old was characterized with
almost equal sex proportions (49.7% boys and 51.3% girls).
b- Of the households with children 12 to 18 years old, 74.9% had at least one child enrolled in some sort of
education (formal/nonformal). Within the households with children 12 to 18 years, on average, 71.0% of the
children (12 to 18 years old) are enrolled in some form of education. School enrolment for the 12 to 18 years
old was characterized with almost equal sex proportions (48.4% boys and 51.6% girls).
Breaking down the figures further by nationality, differences in school enrolment were observed when comparing
the proportions between the Syrian and Lebanese populations for both age groups. Within the household with
children 3 to 11 years old, on average, 47% of the children (3 to 11 years old) are enrolled in some form of
education in the Lebanese population compared to 23% in the Syrian population (P-value <0.001). Similarly, Within
the household with children 12 to 18 years old, on average, 89% of the children (12 to 18 years old) are enrolled
in some form of education in the Lebanese population compared to 44% in the Syrian population (P-value <0.001).
The sex-split enrolment figures did not significantly very between the two populations, meaning that the proportion
of boys enrolled in education did not vary by nationality and similarly the proportion of girls. (Table 5)
49.7% 51.3%
49.4% 51.6%
32
Outcome Nationality Mean Std.
Deviation
Sig. (2-
tailed)
Proportion of children 3-11 years old
enrolled in formal/nonformal education
Lebanese 0.47 0.43 <0.0001*
Syrian 0.23 0.36
Proportion of boys 3-11 years old enrolled
in formal/nonformal education
Lebanese 0.50 0.43 0.893
Syrian 0.49 0.43
Proportion of girls 3-11 years old enrolled
in formal/nonformal education
Lebanese 0.50 0.43 0.893
Syrian 0.51 0.43
Proportion of children 12to18 years old
enrolled in formal/nonformal education
Lebanese 0.89 0.29 <0.0001*
Syrian 0.44 0.46
Proportion of boys 12to18 years old
enrolled in formal/nonformal education
Lebanese 0.49 0.45 0.693
Syrian 0.47 0.43
Proportion of girls 12to18 years old
enrolled in formal/nonformal education
Lebanese 0.51 0.45 0.693
Syrian 0.53 0.43
Table 5- Education enrolment by nationality
Barriers to education like the unwillingness of schools to admit Syrian children leaves Syrian caregivers with options
to register children in schools that are farther from their areas of residence hence the hurdle of transportation
and its fees further demotivating caregivers to register their children and they end up dropping out. The
aforementioned could contribute to lower figures in the Syrian population.
The lower proportions in specifically the younger age group for the Lebanese sub-population may be explained
by culturally rooted neglect or lower perceived importance of formal education for the younger children below 6
years old. Until the 1990s, public schools have not paid much attention to the preschool phase and have required
students to be five-years-old to be accepted in kindergarten, while private schools have always had a preschool
phase accepting students as young as three-years-old. The lower figures for the Syrian population in this specific
age group can be explained by the fact that the Lebanese children can be automatically accepted in elementary
school while Syrians cannot. For Syrians, the transition to elementary school should be preceded by a certificate
stating that they attended CB ECE or at least preparatory ECE (which is the one year alternative to CB ECE
provided by the Ministry of Education and Higher Education (MEHE)) and the only service providers of ECE are
Non- Governmental Organizations (NGOs).
EDUCATION/SCHOOL ENROLMENT AND SOCIO-DEMOGRAPHICS: CORRELATIONAL
ANALYSIS
Age group: 3 to 11 years old
A significant weak and positive association between respondent age and proportion of children 3-11 years old enrolled
in formal/nonformal education in Syrian sub-set was observed. That is, as Syrian respondent’s age increased, the
enrolment of children 3 to 11 years old in education increased. No significant association was captured for the
Lebanese subset. Associations did not differ by sex proportion of children.

33
A Significant association between residence area and proportion of children 3-11 years old enrolled in
formal/nonformal education was observed in Syrian sub-set, where the highest proportion was in BML, followed by
Bekaa and Akkar (Table 6). No significant association in the Lebanese sub-set and associations did not differ by sex
proportion of children.
Proportion of children enrolled in formal/nonformal education
Age group Nationality/Area N Mean Std. Deviation Sig.
3 to 11 Syrian Akkar 109 0.15 0.30 0.001*
Bekaa 157 0.24 0.35 Welch
BML 97 0.30 0.40
Total 363 0.23 0.36
Table 6- Education enrollment and Socio-demographics: Age group 3 to 11
*. Correlation is significant at the 0.05 level (2-tailed).
No significant associations between education outcomes for both nationalities were captured with each of respondent
sex. Social status, respondent’s educational level, respondent’s occupation, partner’s educational level, top income
contributor, perceived financial situation and total monthly income.
Age group: 12 to 18 years old
Proportion of children enrolled in formal/nonformal education
Age group Nationality/Area N Mean Std.
Deviation
Sig.
Area Syrian
Akkar 40 0.25 0.43
<0.0001* Bekaa 94 0.41 0.45
BML 54 0.62 0.46
Total 188 0.44 0.46
Partner’s
education
Level
Lebanese
None/primary 85 0.84 0.36 0.002*
Intermediate/vocational 91 0.93 0.24
Secondary, Technical
or university 51 1.00 0.00
Total 227 0.91 0.27
Syrian
None/primary 113 0.38 0.46 0.024*
Intermediate/vocational 36 0.50 0.47
Secondary, Technical
or university 5 0.90 0.22
Total 154 0.43 0.46
Top
income
contributor
Syrian
Respondent 84 0.49 0.49 0.002*
Spouse/parents 31 0.51 0.48
Children 33 0.22 0.30
Extended family or
other 40 0.44 0.49
Total 188 0.44 0.46
Syrian
Most needs not met 104 0.43 0.46 0.034*
Some needs met 71 0.39 0.46

34
Perceived
financial
situation
Most needs met but
cannot save money for
the future plans
13 0.75 0.41
Total 188 0.44 0.46
Table 7- Education enrollment and Socio-demographics: Age group 12 to 18
*. Correlation is significant at the 0.05 level (2-tailed).
A significant association between residence area and proportion of children 12-18 years old enrolled in
formal/nonformal education in the Syrian sub-set, where the highest proportion was in BML, followed by Bekaa and
Akkar. No significant association in Lebanese sub-set was captured and associations did not differ by sex proportion
of children.
Partner’s education level and proportion of children 12-18 years old enrolled in formal/nonformal education were
significantly associated in bot Syrian and Lebanese sub-sets, where enrolment increased with the increase in partner’s
education level for both nationalities (Table 7). These associations did not differ by sex proportion of children. No
significant association between partner’s education level and proportion of children 3-11 years old enrolled in
formal/nonformal education in both nationalities.
A significant association between top income contributor and proportion of children 12-18 years old enrolled in
formal/nonformal education in Syrian sub-set was captured, where the lowest mean for the proportion of children 12
to 18 years old enrolled in education is captured when the top income contributors are reported to be children (Table
7). The aforementioned provides a ground basis for the hypothesized relationship between school enrolment and child
labour. The association did not differ by sex proportion of children and no significant association was captured in the
Lebanese subset. Moreover, no significant association between top income contributor and proportion of children 3-
11 years old enrolled in formal/nonformal education in both nationalities.
Perceived financial situation was significantly associated with the proportion of children 12-18 years old enrolled in
formal/nonformal education in the Syrian sub-set, where the highest enrolment mean was reported by those disclosing
that most of their needs are met compared to those whose some needs are met or most needs are not met (Table
7). The association did not differ by sex proportion of children and no significant association was observed in the
Lebanese subset. In addition, no Significant association between perceived financial situation and proportion of children
3-11 years old enrolled in formal/nonformal education was observed in both nationalities.
No significant associations between education outcomes for both nationalities were captured with each of respondent
sex, social status, respondent’s educational level, respondent’s occupation and total monthly income.
EDUCATION/SCHOOL ENROLMENT AND PERCEPTIONS
Age group 3 to 11
Perceptions were weakly to very weakly associated (Pearson coefficient <0.2) with school enrolment in this age group.

35
Age group 12 to 18:
Associations that are more prominent were observed in the older age group (12 to 18 years old). These associations
were negative, implying that the stronger the belief in a perception, the lower the school enrolment.
In the Lebanese subset:
“Education is not worth the money it costs” and “child labour
is a means of preparing children to the future” were notably
negatively correlated with the proportion of school enrolment
in the Lebanese sub-group (that is, the stronger the belief in
the perception, the lower the school enrolment).
In the Syrian subset:
School enrolment was notable negatively correlated with the following perceptions: “child labour is an accepted and
common form of practice if the child is above 14 years old”, “parent derives much benefits (including financial) by
engaging their children in child labour”, “the economic situation encourages child labour practices” and “peer pressure
increases the numbers of children involved in child labour”, “cultural beliefs increase the numbers of children involved
in child labour” and “involving children in paid job enhances their life skills”.
The detailed associations are depicted in Appendix 6.
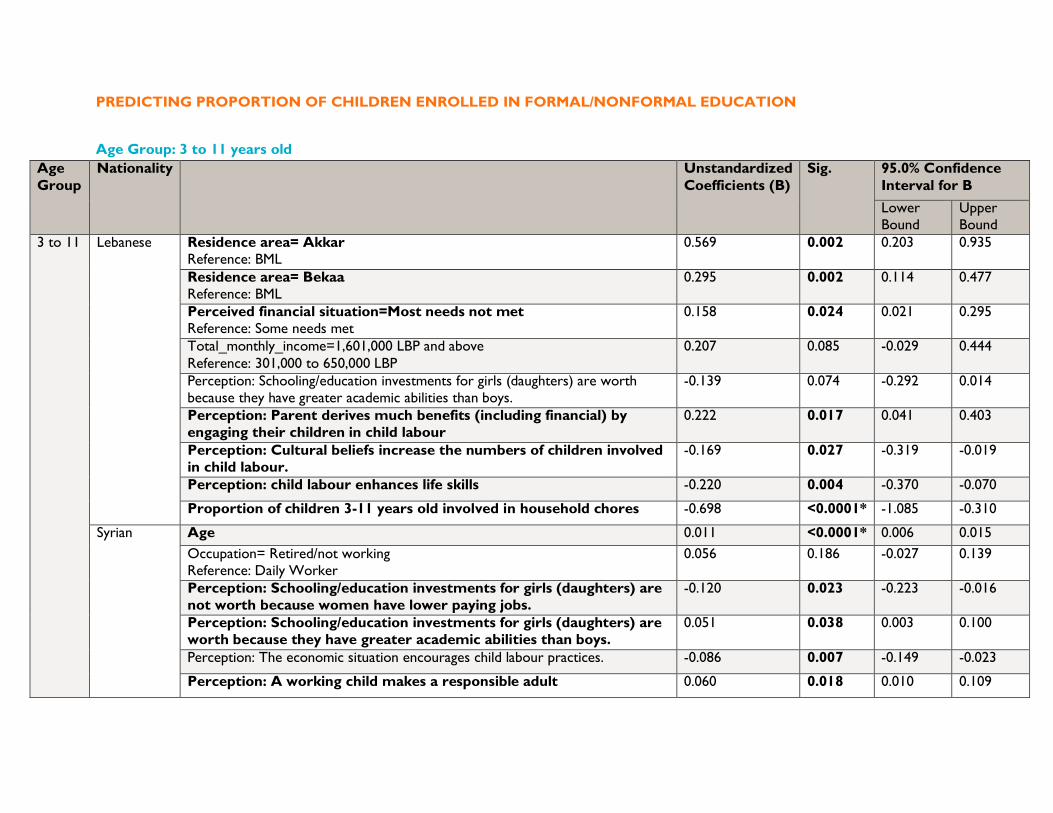
PREDICTING PROPORTION OF CHILDREN ENROLLED IN FORMAL/NONFORMAL EDUCATION
Age Group: 3 to 11 years old
Age
Group
Nationality Unstandardized
Coefficients (B)
Sig. 95.0% Confidence
Interval for B
Lower
Bound
Upper
Bound
3 to 11 Lebanese Residence area= Akkar
Reference: BML
0.569 0.002 0.203 0.935
Residence area= Bekaa
Reference: BML
0.295 0.002 0.114 0.477
Perceived financial situation=Most needs not met
Reference: Some needs met
0.158 0.024 0.021 0.295
Total_monthly_income=1,601,000 LBP and above
Reference: 301,000 to 650,000 LBP
0.207 0.085 -0.029 0.444
Perception: Schooling/education investments for girls (daughters) are worth
because they have greater academic abilities than boys.
-0.139 0.074 -0.292 0.014
Perception: Parent derives much benefits (including financial) by
engaging their children in child labour
0.222 0.017 0.041 0.403
Perception: Cultural beliefs increase the numbers of children involved
in child labour.
-0.169 0.027 -0.319 -0.019
Perception: child labour enhances life skills -0.220 0.004 -0.370 -0.070
Proportion of children 3-11 years old involved in household chores -0.698 <0.0001* -1.085 -0.310
Syrian Age 0.011 <0.0001* 0.006 0.015
Occupation= Retired/not working
Reference: Daily Worker
0.056 0.186 -0.027 0.139
Perception: Schooling/education investments for girls (daughters) are
not worth because women have lower paying jobs.
-0.120 0.023 -0.223 -0.016
Perception: Schooling/education investments for girls (daughters) are
worth because they have greater academic abilities than boys.
0.051 0.038 0.003 0.100
Perception: The economic situation encourages child labour practices. -0.086 0.007 -0.149 -0.023
Perception: A working child makes a responsible adult 0.060 0.018 0.010 0.109

37
Perception: Children gain a vocation by child labour -0.048 0.096 -0.104 0.009
Proportion of children 3-11 years old involved in household chores
-0.098 0.224 -0.257 0.060
Proportion of children 3-11 years old involved in child labour -0.129 0.244 -0.347 0.088
Model characteristics: Lebanese: R square: 0.149
Sig: <0.0001*
Syrian: R-square: 0.145
Sig: <0. 0001*
Table 8- Predicting proportion of children enrolled in formal/nonformal education for the age group 3 to 11
Lebanese children 3 to 11:
The linear regression model for predicting education enrolment in Lebanese children 3 to 11 years old, depicted in Table 8, indicated that almost
15% of the variance (R2=0.149) in the proportion of Lebanese children 3-11 years old enrolled in education is explained by the independent
variables in the table.
Positive predictors of school enrolment:
- The proportion of Lebanese children 3-11 years old enrolled in education is higher by 56.9% for caregivers residing in Akkar and 29.5%
for caregivers residing in Bekaa compared to those residing in BML when controlling for all other variables.
- The proportion of Lebanese children 3-11 years old enrolled in education is higher by 15.8% higher for caregivers who perceive that most
of their needs are met compared to those who perceive that some of their needs are met when controlling for all other variables.
- While holding all other variables constant, the proportion of Lebanese children 3-11 years old enrolled in education increases by 22.2%
with the increase in agreement to the perception that parent derive much benefits (including financial) by engaging their children in child
labour.
Negative predictors of school enrolment:
- While holding all other variables constant, the proportion of Lebanese children 3-11 years old enrolled in education decreases by 16.9%
with the increase in agreement level to the perception that Cultural beliefs increase the numbers of children involved in child labour.
- While holding all other variables constant, the proportion of Lebanese children 3-11 years old enrolled in education decreases by 22.0%
with the increase in agreement level to the perception that child labour enhances life skills.

38
- While holding all other variables constant, the proportion of Lebanese children 3-11 years old enrolled in education decreases by 69.8%
when comparing households with no children involved in household chores to those with all children involved in household chores.
Syrian children 3 to 11:
The linear regression model for predicting education enrolment in Syrian children 3 to 11 years old, depicted in Table 8, indicated that almost 15%
of the variance (R2=0.145) in the proportion of Syrian children 3-11 years old enrolled in education is explained by the independent variables in
the table.
Positive predictors of school enrolment:
- The proportion of Syrian children 3-11 years old enrolled in education increases by 1% as caregiver’s age increases by 1 year when
controlling for all other variables.
- While holding all other variables constant, the proportion of Syrian children 3-11 years old enrolled in education increases by 5.1% with
the increase in agreement to the perception that it’s worth educating girls because they have greater academic abilities.
- While holding all other variables constant, the proportion of Syrian children 3-11 years old enrolled in education increases by 6.0% with
the increase in agreement to the perception that child labour makes a responsible adult.
Negative predictors of school enrolment:
- While holding all other variables constant, the proportion of Syrian children 3-11 years old enrolled in education decreases by 12.0% with
the increase in agreement level to the perception that educating girls is not worth because women have lower paying jobs.

39
Age Group: 12 to 18 years old
Age
Group
Nationality Unstandardized
Coefficients (B)
Sig. 95.0% Confidence
Interval for B
Lower
Bound
Upper
Bound
12 to
18
Lebanese Occupation=Retired/not working
Reference: Daily Worker
-0.381 0.008 -0.663 -0.099
Top income contributor =Extended family or other
Reference: Respondent
-0.630 0.007 -1.084 -0.176
Perceptions: Schooling/education investments for boys (sons) are worth
because they have greater academic abilities than girls.
-0.271 0.053 -0.546 0.003
Perceptions: Peer pressure increases the numbers of children involved
in child labour
0.317 0.003 0.109 0.525
Perceptions: Engaging children in paid work keeps them out of trouble -0.260 0.029 -0.493 -0.027
Perceptions: Child labour is an accepted and common form of practice for boys. 0.586 0.083 -0.078 1.250
Proportion of children 12to18 years old involved in child labour -1.010 0.015 -1.825 -0.195
Proportion of children 12to18 years old involved in household chores 0.001 0.995 -0.262 0.264
Syrian Perceptions: Cultural beliefs increase the numbers of children involved
in child labour.
-0.288 0.001 -0.453 -0.122
Perceptions: Child labour practices help the child to be smart. 0.153 0.048 0.002 0.305
Proportion of children 12to18 years old involved in child labour -0.368 0.071 -0.768 0.032
Proportion of children 12to18 years old involved in household chores 0.011 0.951 -0.341 0.363
Model characteristics: Lebanese: R square: 0.151
Sig: <0.0001*
Syrian: R-square: 0.120
Sig: 0.001*
Table 9- Predicting proportion of children enrolled in formal/nonformal education for the age group 12 to 18

40
Lebanese Children 12 to 18:
The linear regression model for predicting education enrolment in Lebanese children 12 to 18 years old, depicted in Table 9, indicated that almost
15% of the variance (R2=0.151) in the proportion of Lebanese children 12 to 18 years old enrolled in education is explained by the independent
variables in the table.
Positive predictors of school enrolment:
- While holding all other variables constant, the proportion of Lebanese children 12 to 18 years old enrolled in education increases by 31.7%
with the increase in agreement to the perception that peer pressure increases the numbers of children involved in child labour.
Negative predictors of school enrolment:
- The proportion of Lebanese children 12 to 18 years old enrolled in education is lower by 38.1% for caregivers who are retired or not
working compared to daily workers when controlling for all other variables.
- The proportion of Lebanese children 12 to 18 years old enrolled in education is 63.0% lower for households where the top income
contributor is the extended family or other compared to those where the top income contributor is the respondent when controlling for
all other variables.
- While holding all other variables constant, the proportion of Lebanese children 12 to 18 years old enrolled in education decreases by
27.1% with the increase in agreement to the perception that it’s worth educating boys because they have greater academic abilities.
- While holding all other variables constant, the proportion of Lebanese children 12 to 18 years old enrolled in education decreases by
26.0% with the increase in agreement to the perception that child labour keeps children out of trouble.
- While holding all other variables constant, the proportion of Lebanese children 12 to 18 years old enrolled in education decreases by
101% when comparing households with no children involved in child labour to those with all children involved in child labour.

41
Syrian Children 12 to 18:
The linear regression model for predicting education enrolment in Syrian children 12 to 18 years old, depicted in Table 9, indicated that almost
12% of the variance (R2=0.120) in the proportion of Syrian children 12 to 18 years old enrolled in education is explained by the independent
variables in the table.
Positive predictors of school enrolment:
- While holding all other variables constant, the proportion of Syrian children 12 to 18 years old enrolled in education increases by 15.3%
with the increase in agreement to the perception that Child labour practices help the child to be smart.
Negative predictors of school enrolment:
- While holding all other variables constant, the proportion of Syrian children 12 to 18 years old enrolled in education decreases by 28.8%
with the increase in agreement to the perception that cultural beliefs increase the numbers of children involved in child labour

CHILD LABOUR
DESCRIPTIVE FIGURES
When asked about involvement of children in child labour, 10.8% (84 households) had at least one child
aged 3 to 18 years old engaged in child labour. Within the assessed households, on average, 4.8% of the
children 3 to 18 years old are engaged in child labour.
The child labour outcome for the entire age range of children (3 to 18 years old) varied significantly
between the two nationalities, where 1.5% of Lebanese respondents had at least one child 3 to 18 years
old engaged in child labour while this percentage is significantly (p-value=<0.0001) higher in Syrian
respondents at 20.2%.
Breaking down the figures by age groups:
a- Of the households with children 3 to 11 years old, 5.4% had at least one child involved in child
labour. Within the households with children 3 to 11 years old, on average, 3.1% of the children
(3 to 11 years old) are involved in child labour. The sex proportion for children 3 to 11 involved
in child labour was 79.4% boys and 20.6% girls.
b- Of the households with children 12 to 18 years old, 12.7% had at least one child involved in child
labour. Within the households with children 12 to 18 years, on average, 8.7% of the children (12
to 18 years old) are involved in child labour. The sex proportion for children 12 to 18 involved in
child labour was 77.4% boys and 22.6% girls.
79.4% 20.6%

43
Breaking down the figures further by nationality, differences in involvement in child labour were
observed when comparing the proportions between the Syrian and Lebanese populations for both
age groups. Within the household with children 3 to 11 years old, on average, none of the children (3
to 11 years old) are involved in child labour in the Lebanese population compared to 5% in the Syrian
population (P-value <0.001). Similarly, Within the household with children 12 to 18 years old, on
average, 2% of the children (12 to 18 years old) are involved in child labour in the Lebanese population
compared to 19% in the Syrian population (P-value <0.001). The sex-split figures did not significantly
vary between the two populations, meaning that the proportion of boys involved in child labour did
not vary by nationality and similarly the proportion of girls. (Table 10)
Outcome Nationality Mean Std.
Deviation
Sig. (2-
tailed)
Proportion of children 3-11 years old
involved in child labour
Lebanese 0.00 0.00 <0.0001*
Syrian 0.05 0.19
Proportion of boys 3-11 years old involved
in child labour
Lebanese N/A N/A N/A
Syrian 0.79 0.36
Proportion of girls 3-11 years old involved
in child labour
Lebanese N/A N/A N/A
Syrian 0.21 0.36
Proportion of children 12to18 years old
involved in child labour
Lebanese 0.02 0.12 <0.0001*
Syrian 0.19 0.34
Proportion of boys 12to18 years old
involved in child labour
Lebanese 0.83 0.41 0.694
Syrian 0.77 0.39
Proportion of girls 12to18 years old
involved in child labour
Lebanese 0.17 0.41 0.694
Syrian 0.23 0.39
Table 10- Child labour involvement by nationality
77.4% 22.6%

44
In terms of the type of labour the children 3 to 11 are engaged in, more than third (37.5%) sell items
(vending), 28.1% are scrappers and 12.5% are involved in farming. For the older age group, 12 to 18,
engaged in child labour, 28.1% are skilled labour, 23.4% work in the farming field, 9.4% are daily workers
and 7.8% are scrappers. The labour types mentioned are summarized in Appendix 3.
Figure 8- Types of Labour
CHILD LABOUR AND SOCIO-DEMOGRAPHICS: CORRELATIONAL ANALYSIS
Age group: 3 to 11 years old
Very weak to no significant associations were captured between socio-demographics and child labour
outcome for this age-group for both nationalities.
Age group: 12 to 18 years old
A significant association between respondent’s education level and proportion of children 12 to 18 years
old involved in child labour was observed in the Syrian sub-set. The mean of the proportion was the
highest among those with no/primary education compared to those with intermediate or secondary
education (Table 11). The association did not differ by sex proportion of children and no significant
association were observed in the Lebanese subset.
13%9%
38%
3% 3%
28%
3% 3%
Type of Labour for
Children 3 to 11 years old
23%
28%
6%
2%
5%
3%
2%
2%
9%
2%
2%
8%
2%
2%
2%
2%
3%
Farming
Skilled Labor
Selling items (vending)
Domestic work
Construction Work
Bakery
Cleaning restaurant
Hairdresser
daily worker
Housekeeping services
Online work (vegeterian food)
scrapper
Work in market
Works in a factory
Works in furniture shop
Works in shisha shop
Works in supermarket
Type of Labour for Children 12 to
18 years old

45
Proportion of children involved in child labour
Age group Nationality Respondent
education level
N Mean Std.
Deviation
Sig.
Respondent
education
level
Syrian None/primary 128 0.24 0.38 0.007*
Intermediate/vocational 47 0.09 0.23 (Welch)
Secondary, Technical
or university
13 0.10 0.20
Total 188 0.19 0.34
Occupation Syrian
Full-time/Part-time
employee
8 0.04 0.12 0.038*
Business
owner/freelancer
5 0.40 0.55
daily worker 73 0.15 0.30
houeshold care 35 0.14 0.27
Retired/not working 65 0.27 0.41
Total 186 0.19 0.34
Top
income
contributor
Syrian
Respondent 84 0.14 0.29 0.001*
Spouse/parents 31 0.16 0.33
Children 33 0.46 0.42
Extended family or
other
40 0.10 0.28
Total 188 0.19 0.34
Total
monthly
income
Syrian
0 to 300,000 LBP 18 0.03 0.12 0.011*
301,000 to 650,000
LBP
63 0.21 0.36 (Welch)
651,000 LBP to
1,000,000 LBP
65 0.21 0.37
1,001,000 to 1,600,000
LBP
39 0.21 0.34
1,601,000 LBP and
above
3 0.17 0.29
Total 188 0.19 0.34
Perceived
financial
situation
Syrian
Most needs not met 104 0.18 0.34 0.042*
Some needs met 71 0.23 0.38
Most needs met but
cannot save money for
the future plans
13 0.07 0.15
Total 188 0.19 0.34
Table 11- Child Labour and Socio-demographics: Age group 12 to 18
*. Correlation is significant at the 0.05 level (2-tailed).

46
Respondent occupation and the proportion of children 12-18 years old involved in child labour in Syrian
sub-set were significantly associated, where the highest mean was reported by business
owners/freelancers (Table 11), a possible reason could be the business owners’ desire to teach their child
their own business. The association did not differ by sex proportion of children and no significant
association in was detected in the Lebanese subset.
Top income contributor and proportion of children 12-18 years old involved in child labour in Syrian sub-
set were significantly associated where the highest mean was observed for respondents reporting children
to be the top income contributors (Table 11). The aforementioned is expected, as involvement in child
labour is a prerequisite for a child below 18 to be the top income contributors and this also aligns with
the observed relationship between the top income contributor and education outcome previously
discussed further supporting the hypothesized negative relationship between child labour and education.
The association do not differ by sex proportion of children and no significant association was observed in
the Lebanese subset.
The proportion of children 12-18 years old involved in child labour was significantly associated with the
total monthly income in the Syrian sub-set, where the lowest mean was observed among those earning
less than 300,000 LBP compared to others (Table 11). The aforementioned raises question marks around
household with working children being better off, specially that an association test does not capture the
direction of the association. These associations did not differ by sex proportion of children and no
significant association in Lebanese subset was detected.
A significant association between perceived financial situation and proportion of children 12-18 years old
involved in child labour was observed in the Syrian sub-set, where the lowest mean was observed in those
reporting that most of their needs are met compared to those whose most needs are not met and some
needs met (Table 11). This association, similarly to the association with total monthly income discussed
previously, raises question marks around household with working children being better off, specially that
an association test does not capture the direction of the association. The associations did not differ by
sex proportion of children and no significant association in the Lebanese subset was observed.
No significant associations between child labour outcomes for both age groups and nationalities were
captured with each of respondent age, respondent sex, social status and partner’s educational level.
CHILD LABOUR AND PERCEPTIONS

47
Age group: 3 to 11
Regarding the child labour outcome, there were no child labour cases for children 3 to 11 years old in the
Lebanese sub-group.
In the Syrian subset, “child labour is an accepted
and common form of practice” was notably positively
correlated with the proportion of children 3 to 11
years old involved in child labour. That is, the stronger
the belief in the perception, the higher the
involvement in child labour.
Age group: 12 to 18
In the Lebanese subset:
“Schooling/education investments for
girls (daughters) are not worth because
women have lower paying jobs” and
“schooling/education investments for
boys (sons) are not worth because it is
better for them to be engaged in
workforce instead” were notably
positively correlated with the child
labour outcome for the Lebanese sub-
group but not significant with the sex-
split proportion.
For the Syrian subset:
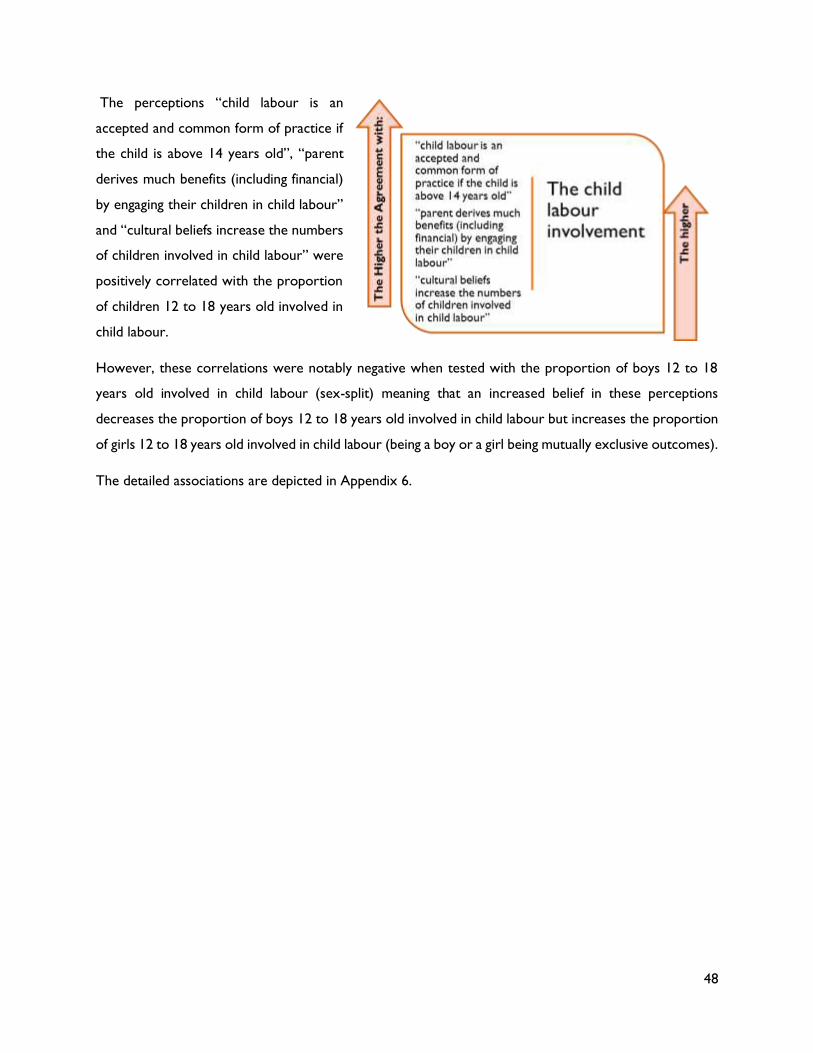
48
The perceptions “child labour is an
accepted and common form of practice if
the child is above 14 years old”, “parent
derives much benefits (including financial)
by engaging their children in child labour”
and “cultural beliefs increase the numbers
of children involved in child labour” were
positively correlated with the proportion
of children 12 to 18 years old involved in
child labour.
However, these correlations were notably negative when tested with the proportion of boys 12 to 18
years old involved in child labour (sex-split) meaning that an increased belief in these perceptions
decreases the proportion of boys 12 to 18 years old involved in child labour but increases the proportion
of girls 12 to 18 years old involved in child labour (being a boy or a girl being mutually exclusive outcomes).
The detailed associations are depicted in Appendix 6.

PREDICTING PROPORTION OF CHILDREN INVOLVED IN CHILD LABOUR
Age group: 3 to 11 years old
Regression analysis could not be conducted for the Lebanese sub-group for children aged 3 to 11 years old since there were no cases of child
labour for Lebanese in this age group.
Age
Group
Nationality Unstandardized
Coefficients (B)
Sig. 95.0% Confidence
Interval for B
Lower
Bound
Upper
Bound
3 to 11 Syrian Perceptions: Education is not worth the money it costs. 0.049 0.016 0.009 0.088
Perceptions: Schooling/education investments for girls (daughters) are
not worth because women have lower paying jobs.
-0.101 0.014 -0.181 -0.020
Perceptions: Schooling/education investments for girls (daughters) are
not worth because eventually they will get married and stay home to
take care of children.
0.085 0.027 0.010 0.160
Perceptions: Schooling/education investments for boys (sons) are NOT
worth because it is better for them to be engaged in workforce instead.
0.082 0.018 0.014 0.151
Perceptions: Child labour is an accepted and common form of practice. 0.025 0.031 0.002 0.049
Perceptions: The economic situation encourages child labour practices. 0.051 0.000 0.023 0.080
Perceptions: Children gain a vocation by child labour -0.055 0.000 -0.080 -0.031
Proportion of children 3-11 years old involved in household chores -0.095 0.021 -0.175 -0.015
Proportion of children 3-11 years old enrolled in formal/nonformal education -0.028 0.299 -0.080 0.025
Model characteristics: Syrian: R-square: 0.154
Sig: <0.0001*
Table 12- Predicting proportion of children involved in child labour for the age group 3 to 11
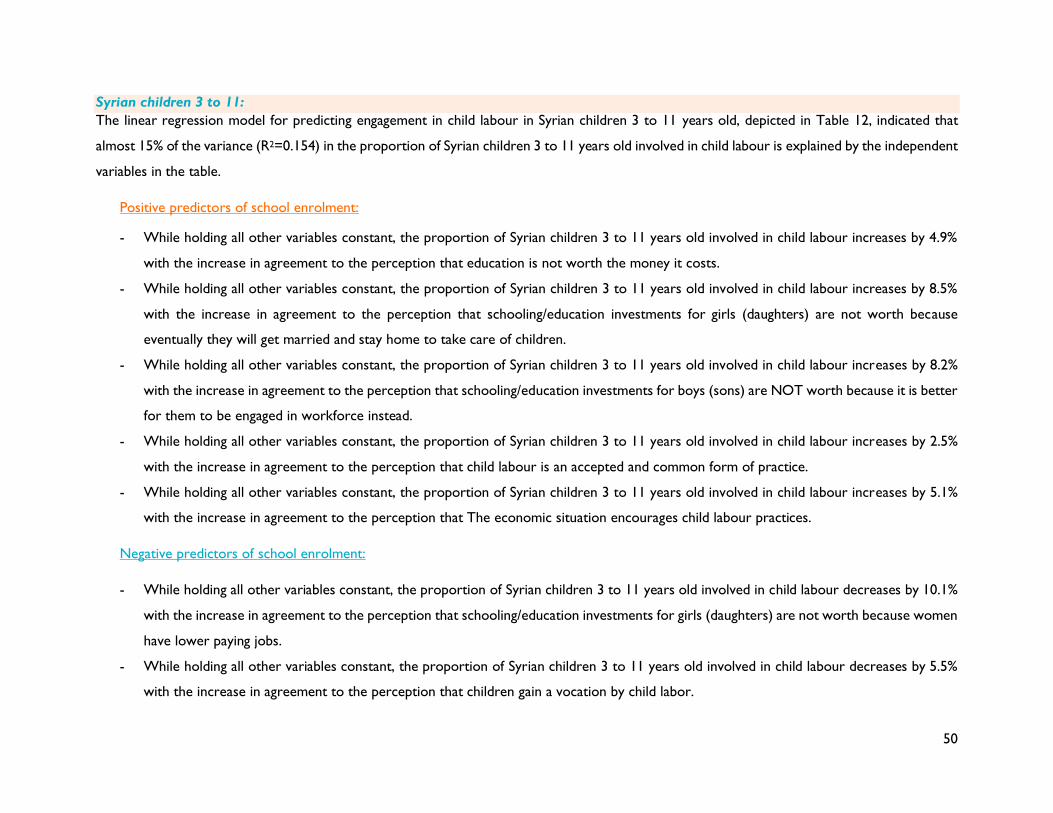
50
Syrian children 3 to 11:
The linear regression model for predicting engagement in child labour in Syrian children 3 to 11 years old, depicted in Table 12, indicated that
almost 15% of the variance (R2=0.154) in the proportion of Syrian children 3 to 11 years old involved in child labour is explained by the independent
variables in the table.
Positive predictors of school enrolment:
- While holding all other variables constant, the proportion of Syrian children 3 to 11 years old involved in child labour increases by 4.9%
with the increase in agreement to the perception that education is not worth the money it costs.
- While holding all other variables constant, the proportion of Syrian children 3 to 11 years old involved in child labour increases by 8.5%
with the increase in agreement to the perception that schooling/education investments for girls (daughters) are not worth because
eventually they will get married and stay home to take care of children.
- While holding all other variables constant, the proportion of Syrian children 3 to 11 years old involved in child labour increases by 8.2%
with the increase in agreement to the perception that schooling/education investments for boys (sons) are NOT worth because it is better
for them to be engaged in workforce instead.
- While holding all other variables constant, the proportion of Syrian children 3 to 11 years old involved in child labour increases by 2.5%
with the increase in agreement to the perception that child labour is an accepted and common form of practice.
- While holding all other variables constant, the proportion of Syrian children 3 to 11 years old involved in child labour increases by 5.1%
with the increase in agreement to the perception that The economic situation encourages child labour practices.
Negative predictors of school enrolment:
- While holding all other variables constant, the proportion of Syrian children 3 to 11 years old involved in child labour decreases by 10.1%
with the increase in agreement to the perception that schooling/education investments for girls (daughters) are not worth because women
have lower paying jobs.
- While holding all other variables constant, the proportion of Syrian children 3 to 11 years old involved in child labour decreases by 5.5%
with the increase in agreement to the perception that children gain a vocation by child labor.

51
- While holding all other variables constant, the proportion of Syrian children 3-11 years old involved in child labour decreases by 9.5%
when comparing households in which all children are involved in household chores to households where none are involved.
Age group: 12 to 18 years old
Age
Group
Nationality Unstandardized
Coefficients (B)
Sig. 95.0% Confidence
Interval for B
Lower
Bound
Upper
Bound
12 to
18
Lebanese Respondent sex
Reference: Male
0.057 0.008 0.015 0.099
Occupation =Full-time/Part-time employee
Reference: Daily worker
-0.044 0.064 -0.090 0.003
Occupation =household care
Reference: Daily worker
-0.075 0.006 -0.129 -0.021
Occupation =Retired/not working
Reference :Daily worker
-0.071 0.002 -0.116 -0.026
Top income contributor=Children
Reference: Respondent
0.067 0.032 0.006 0.129
Total monthly income rec=1,001,000 to 1,600,000 LBP
Reference: 301,000 to 650,000 LBP
0.033 0.072 -0.003 0.070
Perceptions: Schooling/education investments for boys (sons) are NOT worth
because it is better for them to be engaged in workforce instead.
0.241 0.000 0.162 0.319
Total number of children 12 to18 years old enrolled in formal/nonformal
education
-0.026 0.009 -0.045 -0.007
Proportion of children 12to18 years old involved in household chores -0.019 0.345 -0.058 0.021
Syrian Age 0.011 0.000 0.006 0.015
Occupation= Retired/not working
Reference: Daily worker
0.056 0.186 -0.027 0.139

52
Perception: Schooling/education investments for girls (daughters) are
not worth because women have lower paying jobs.
-0.120 0.023 -0.223 -0.016
Perception: Schooling/education investments for girls (daughters) are
worth because they have greater academic abilities than boys.
0.051 0.038 0.003 0.100
Perception: The economic situation encourages child labour practices. -0.086 0.007 -0.149 -0.023
Perception: A working child makes a responsible adult. 0.060 0.018 0.010 0.109
Perception: child labour gain vocation -0.048 0.096 -0.104 0.009
Proportion of children 3-11 years old involved in household chores -0.098 0.224 -0.257 0.060
Proportion of children 3-11 years old involved in child labour -0.129 0.244 -0.347 0.088
Model characteristics: Lebanese: R square: 0.235
Sig: <0.0001*
Syrian: R-square: 0.300
Sig: <0.0001*
Table 13- Predicting proportion of children involved in child labour for the age group 12 to 18
Lebanese children 12 to 18:
The linear regression model for predicting engagement in child labour in Lebanese children 12 to 18 years old, depicted in Table 13, indicated that
almost 23.5% of the variance (R2=0.235) in the proportion of Lebanese children 12 to 18 years old involved in child labour is explained by the
independent variables in the table.
Positive predictors of child labour involvement:
- The proportion of Lebanese children 12 to 18 years old involved in child labour is higher by 5.7% for female caregivers compared to male
caregivers when controlling for all other variables.
- The proportion of Lebanese children 12 to 18 years old involved in child labour is 6.7% lower for households where the top income
contributor are children compared to those where the top income contributor is the respondent when controlling for all other variables.

53
Negative predictors of child labour involvement:
- The proportion of Lebanese children 12 to 18 years old involved in child labour is lower by 4.4%, 7.5% and 7.1% respectively for caregivers
who are full-time/part-time , involved in household care and retired or not working compared to daily workers when controlling for all
other variables.
- While holding all other variables constant, the proportion of Lebanese children 12-18 years old involved in child labour decreases by 2.6%
when comparing households with all children enrolled in education compared to those households with none enrolled.
Syrian children 12 to 18:
The linear regression model for predicting engagement in child labour in Syrian children 12 to 18 years old, depicted in Table 13, indicated that
almost 30.0% of the variance (R2=0.300) in the proportion of Syrian children 12 to 18 years old involved in child labour is explained by the
independent variables in the table.
Positive predictors of child labour involvement:
- The proportion of Syrian children 12 to 18 years old involved in child labour increases by 1.1% as caregiver’s age increases by 1 year when
controlling for all other variables.
- While holding all other variables constant, the proportion of Syrian children 12 to 18 years old involved in child labour increases by 5.1%
with the increase in agreement to the perception that Schooling/education investments for girls (daughters) are worth because they have
greater academic abilities than boys.
- While holding all other variables constant, the proportion of Syrian children 12 to 18 years old involved in child labour increases by 6.0%
with the increase in agreement to the perception that child labour makes a responsible adult.
Negative predictors of child labour involvement:
- While holding all other variables constant, the proportion of Syrian children 12 to 18 years old involved in child labour decreases by 12.0%
with the increase in agreement to the perception that Schooling/education investments for girls (daughters) are not worth because women
have lower paying jobs.

54
- While holding all other variables constant, the proportion of Syrian children 12 to 18 years old involved in child labour decreases by 12.0%
with the increase in agreement to the perception that the economic situation encourages child labour practices.

HOUSEHOLD CHORES
DESCRIPTIVE FIGURES
Regarding engagement of children in household chores, 24.6% (191 households) had at least one child aged 3 to 18
years old engaged in household chores. Within the assessed households, on average, 13.5% of the children 3 to 18
years old are engaged in household chores.
Breaking down the figures by age groups:
a- Of the households with children 3 to 11 years old, 8.7% had at least one child involved in household chores.
Within the households with children 3 to 11 years old, on average, 6.2% of the children (3 to 11 years old)
are involved in household chores. The sex proportion for children 3 to 11 involved in household chores was
19.6% boys and 80.4% girls.
b- Of the households with children 12 to 18 years old, 35.0% had at least one child involved in household chores.
Within the households with children 12 to 18 years, on average, 26.5% of the children (12 to 18 years old)
are involved in household chores. The sex proportion for children 12 to 18 involved in household chores was
4.7% boys and 95.3% girls.
19.6% 80.4%

56
Breaking down the figures further by nationality, differences in involvement in household chores were observed
when comparing the proportions between the Syrian and Lebanese populations for both age groups. Within the
household with children 3 to 11 years old, on average, 3% of the children (3 to 11 years old) are involved in
household chores in the Lebanese population compared to 8% in the Syrian population (P-value <0.001). Similarly,
Within the household with children 12 to 18 years old, on average, 22% of the children (12 to 18 years old) are
involved in household chores in the Lebanese population compared to 33% in the Syrian population (P-value
<0.001). The sex-split figures significantly varied between the two populations. For both age groups, the proportion
of boys involved in child labour was higher in the Syrian population compared to the Lebanese and the proportion
of girls involved in household chores was higher in the Lebanese population compared to the Syrian (all children
involved in household chores are girls in the Lebanese households). (Table 14)
Outcome Nationality Mean Std.
Deviation
Sig. (2-
tailed)
Proportion of children 3-11 years old
involved in household chores
Lebanese 0.03 0.15 <0.0001*
Syrian 0.08 0.25
Proportion of boys 3-11 years old involved
in household chores
Lebanese 0.00 0.00 <0.0001*
Syrian 0.23 0.40
Proportion of girls 3-11 years old involved
in household chores
Lebanese 1.00 0.00 <0.0001*
Syrian 0.77 0.40
Proportion of children 12to18 years old
involved in household chores
Lebanese 0.22 0.39 <0.0001*
Syrian 0.33 0.39
Proportion of boys 12to18 years old
involved in household chores
Lebanese 0.00 0.00 0.003*
Syrian 0.09 0.27
Proportion of girls 12to18 years old
involved in household chores
Lebanese 1.00 0.00 0.003*
Syrian 0.91 0.27
Table 14- Involvement in household chores by nationality
HOUSEHOLD CHORES AND SOCIO-DEMOGRAPHICS: CORRELATIONAL ANALYSIS
Age group: 3 to 11 years old
Proportion of children involved in household chores
Age
Groups
Nationality Area N Mean Std.
Deviation
Sig.
4.7% 95.3%
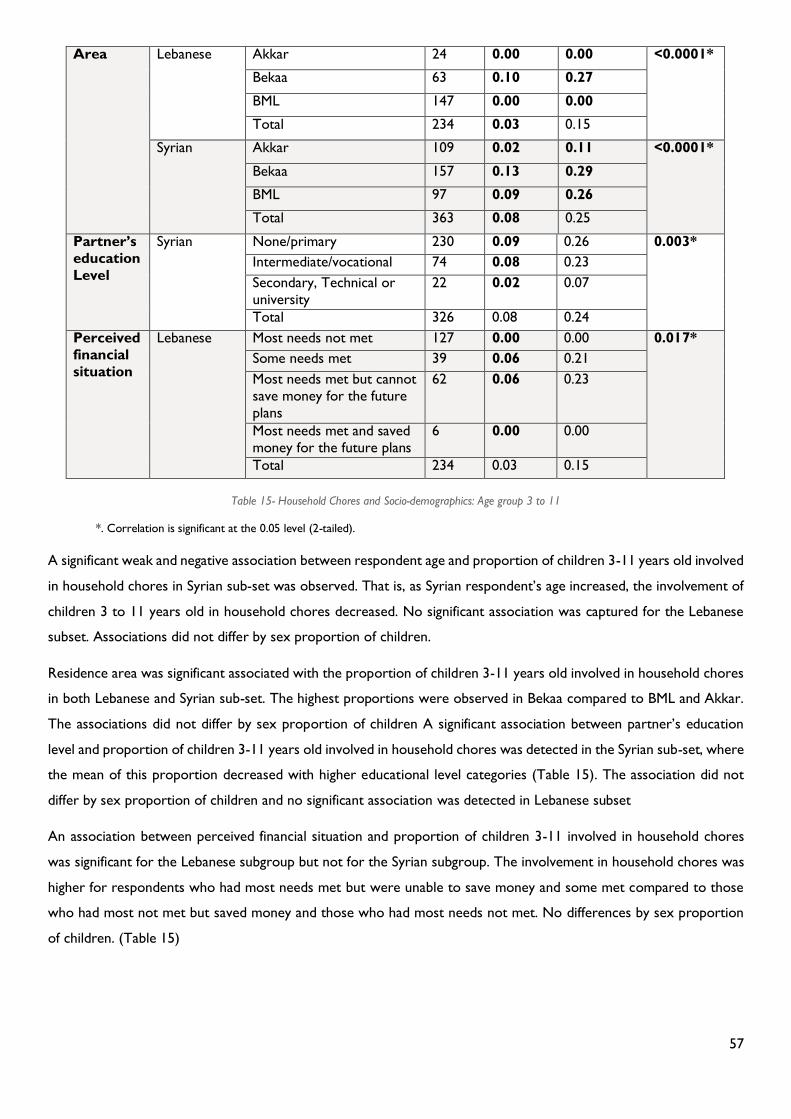
57
Area Lebanese Akkar 24 0.00 0.00 <0.0001*
Bekaa 63 0.10 0.27
BML 147 0.00 0.00
Total 234 0.03 0.15
Syrian Akkar 109 0.02 0.11 <0.0001*
Bekaa 157 0.13 0.29
BML 97 0.09 0.26
Total 363 0.08 0.25
Partner’s
education
Level
Syrian
None/primary 230 0.09 0.26 0.003*
Intermediate/vocational 74 0.08 0.23
Secondary, Technical or
university
22 0.02 0.07
Total 326 0.08 0.24
Perceived
financial
situation
Lebanese
Most needs not met 127 0.00 0.00 0.017*
Some needs met 39 0.06 0.21
Most needs met but cannot
save money for the future
plans
62 0.06 0.23
Most needs met and saved
money for the future plans
6 0.00 0.00
Total 234 0.03 0.15
Table 15- Household Chores and Socio-demographics: Age group 3 to 11
*. Correlation is significant at the 0.05 level (2-tailed).
A significant weak and negative association between respondent age and proportion of children 3-11 years old involved
in household chores in Syrian sub-set was observed. That is, as Syrian respondent’s age increased, the involvement of
children 3 to 11 years old in household chores decreased. No significant association was captured for the Lebanese
subset. Associations did not differ by sex proportion of children.
Residence area was significant associated with the proportion of children 3-11 years old involved in household chores
in both Lebanese and Syrian sub-set. The highest proportions were observed in Bekaa compared to BML and Akkar.
The associations did not differ by sex proportion of children A significant association between partner’s education
level and proportion of children 3-11 years old involved in household chores was detected in the Syrian sub-set, where
the mean of this proportion decreased with higher educational level categories (Table 15). The association did not
differ by sex proportion of children and no significant association was detected in Lebanese subset
An association between perceived financial situation and proportion of children 3-11 involved in household chores
was significant for the Lebanese subgroup but not for the Syrian subgroup. The involvement in household chores was
higher for respondents who had most needs met but were unable to save money and some met compared to those
who had most not met but saved money and those who had most needs not met. No differences by sex proportion
of children. (Table 15)

58
Age group: 12 to 18 years old
Proportion of children involved in household chores
Age
Groups
Nationality Area N Mean Std.
Deviation
Sig.
12 to 18 Lebanese Akkar 40 0.18 0.37 0.020*
Bekaa 67 0.34 0.43
BML 171 0.19 0.37
Total 278 0.22 0.39
Syrian Akkar 40 0.27 0.34 0.006*
Bekaa 94 0.42 0.41
BML 54 0.21 0.36
Total 188 0.33 0.39
Respondent
education
level
Syrian None/primary 128 0.24 0.38 0.007*
Intermediate/vocational 47 0.09 0.23 Welch
Secondary, Technical
or university
13 0.10 0.20
Total 188 0.19 0.34
Occupation Lebanese
Full-time/Part-time
employee
41 0.12 0.31 0.036*
Business
owner/freelancer
22 0.31 0.39
daily worker 72 0.30 0.43
household care 69 0.25 0.41
Retired/not working 67 0.15 0.35
Total 271 0.23 0.39
Perceived
financial
situation
Lebanese
Most needs not met 149 0.11 0.30 <0.0001*
Some needs met 55 0.23 0.40
Most needs met but
cannot save money for
the future plans
67 0.40 0.44
Most needs met and
saved money for the
future plans
7 0.86 0.24
Total 278 0.22 0.39
Table 16- Household Chores and Socio-demographics: Age group 12 to 18
*. Correlation is significant at the 0.05 level (2-tailed).
Residence area was significant associated with the proportion of children 12 to 18 years old involved in household
chores in both Lebanese and Syrian sub-set. The highest proportions were observed in Bekaa compared to BML and
Akkar. The associations did not differ by sex proportion of children.
Respondent education level and proportion of children 12 to 18 years old involved in household chores were
significantly associated in the Syrian sub-set, where the highest mean was observed in respondents with none/primary

59
education compared to higher levels (Table 16). The association did not differ by sex proportion of children and no
significant association was detected in Lebanese subset.
Respondent occupation and proportion of children 12-18 years old involved in household chores were significantly
associated in the Lebanese sub-set, where fulltime/part-time employees and those retired/not working had the lowest
mean compared to other occupation types (Table 16). The association did not differ by sex proportion of children and
was not significant in the Syrian subset. No Significant association between occupation and proportion of children 3-
11 years old involved in household chores in both Lebanese and Syrian sub-sets.
A significant association between perceived financial situation and proportion of children 12-18 years old involved in
household chores in the Lebanese sub-set was detected, where the involvement in household chores was higher for
respondents who had most needs met compared to those who had some met or most not met. The association did
not differ by sex proportion of children.

HOUSEHOLD CHORES AND PERCEPTIONS
Prominent associations were not detected between the perceptions and the proportion of children
involved in household chores for both age groups in the Lebanese sub-population. It is noteworthy to
mention that in the Lebanese sub-population all the children involved in household chores were females
(in both age groups).
Age group 3 to 11
In the Syrian sub-group, the perceptions
“Schooling/education investments for boys (sons) are
NOT worth because it is better for them to be engaged
in workforce instead” and “child labour is an accepted
and common form of practice for boys” were notably
positively correlated with the proportion of children 3
to 11 years old involved in household chores.
Age group 12 to 18:
For the older age group, the perceptions “the economic situation encourages child labour practices”, “a
working child makes a responsible adult” and “child labour is an accepted and common form of practice
for boys” were positively correlated with the proportion of children 12 to 18 years old involved in
household chores.
The detailed associations are depicted in Appendix 6.

PREDICTING PROPORTION OF CHILDREN INVOLVED IN HOUSEHOLD CHORES
Age group: 3 to 11 years old
Age
Group
Nationality Unstandardized
Coefficients (B)
Sig. 95.0% Confidence
Interval for B
Lower
Bound
Upper
Bound
3 to 11 Lebanese Age 0.002 0.124 -0.001 0.005
Residence area=Akkar
Reference: BML
0.133 0.022 0.020 0.247
Residence area=Bekaa
Reference: BML
0.157 0.000 0.105 0.209
Total monthly income =651,000 LBP to 1,000,000 LBP
Reference: 301,000 to 650,000 LBP
-0.064 0.008 -0.111 -0.017
Total monthly income =1,001,000 to 1,600,000 LBP
Reference: 301,000 to 650,000 LBP
-0.047 0.113 -0.104 0.011
Perceptions: Children gain a vocation by child labour -0.080 0.000 -0.120 -0.041
Proportion of children 3-11 years old enrolled in formal/nonformal
education
-0.081 0.001 -0.130 -0.032
Syrian Residence area=Akkar
Reference: BML
-0.090 0.034 -0.172 -0.007
Occupation =Business owner/freelancer
Reference: Daily worker
0.148 0.054 -0.003 0.300
Occupation =Retired/not working
Reference: Daily worker
0.082 0.005 0.025 0.139
Perceptions: Schooling/education investments for girls (daughters) are
not worth because women have lower paying jobs.
-0.163 0.001 -0.262 -0.064
Perceptions: Schooling/education investments for girls (daughters) are not worth
for securing family’s welfare because girls get married and leave to support
husbands’ household.
0.099 0.080 -0.012 0.211
Perceptions: Schooling/education investments for boys (sons) are NOT
worth because it is better for them to be engaged in workforce instead.
0.255 0.000 0.170 0.341
Perceptions: Child labour is a means of preparing children to the future. -0.033 0.049 -0.066 0.000

62
Perceptions: Child labour practices help the child to be smart. 0.037 0.033 0.003 0.070
Perceptions: Involving children in paid job enhances their life skills 0.039 0.066 -0.003 0.081
Perceptions: Children gain a vocation by child labour -0.046 0.013 -0.083 -0.010
Perceptions: Child labour is an accepted and common form of practice
for boys.
0.044 0.026 0.005 0.082
Proportion of children 3-11 years old enrolled in formal/nonformal education -0.025 0.483 -0.093 0.044
Proportion of children 3-11 years old involved in child labour -0.157 0.028 -0.297 -0.017
Model characteristics: Lebanese: R square: 0.234
Sig: <0.0001*
Syrian: R-square: 0.237
Sig: <0.0001* Table 17- Predicting proportion of children involved in household chores for the age group 3 to 11
Lebanese children 3 to 11:
The linear regression model for predicting engagement in household chores in Lebanese children 3 to 11 years old, depicted in Table 17, indicated
that almost 23.4% of the variance (R2=0.234) in the proportion of Lebanese children 3 to 11 years old involved in household chores is explained
by the independent variables in the table.
Positive predictors of involvement in household chores:
- The proportion of Lebanese children 3 to 11 years old involved in household chores is higher by 13.3% and 15.7% when comparing
households from Akkar and Bekaa respectively to households from BML while controlling for all other variables.
Negative predictors of involvement in household chores:
- The proportion of Lebanese children 3 to 11 years old involved in household chores is lower by 6.4% when comparing households with a
total monthly income of 651,000 LBP - 1,000,000 LBT to those with total monthly income of 301,000 LBP – 650,000 LBP while controlling
for all other variables.
- While holding all other variables constant, the proportion of Lebanese children 3 to 11 years old involved in household chores decreases
by 8.0% with the increase in agreement to the perception that children gain a vocation by child labor.

63
- While holding other variables constant, the proportion of Lebanese children 3 to 11 years old involved in household chores is decreases
by 8.1% when comparing households where all children are enrolled in education to households with none enrolled in education.
Syrian children 3 to 11:
The linear regression model for predicting engagement in household chores in Syrian children 3 to 11 years old, depicted in Table 17, indicated
that almost 23.7% of the variance (R2=0.237) in the proportion of Syrian children 3 to 11 years old involved in household chores is explained by
the independent variables in the table.
Positive predictors of involvement in household chores:
- The proportion of Lebanese children 3 to 11 years old involved in household chores is higher by 8.2% when comparing households with
retired/not working caregiver to households where the caregiver is a daily worker (when holding all other variables as constants).
- While holding all other variables constant, the proportion of Syrian children 3 to 11 years old involved in household chores increases by
25.5% with the increase in agreement to the perception that Schooling/education investments for boys are not worth and they better
engage in labour.
- While holding all other variables constant, the proportion of Syrian children 3 to 11 years old involved in household chores increases by
3.7% with the increase in agreement to the perception that child labour makes children smart.
- While holding all other variables constant, the proportion of Syrian children 3 to 11 years old involved in household chores increases by
4.4% with the increase in agreement to the perception that child labour is common for boys.
Negative predictors of involvement in household chores:
- The proportion of Syrian children 3 to 11 years old involved in household chores is lower by 9.0 when comparing households from Akkar
to households from BML while controlling for all other variables.
- While holding all other variables constant, the proportion of Syrian children 3 to 11 years old involved in household chores decreases by
16.3% with the decrease in agreement to the perception that Schooling/education investments for girls (daughters) are not worth because
women have lower paying jobs.

64
- While holding all other variables constant, the proportion of Syrian children 3 to 11 years old involved in household chores decreases by
3.3% with the increase in agreement to the perception that child labour prepares children for the future.
- While holding all other variables constant, the proportion of Syrian children 3 to 11 years old involved in household chores decreases by
4.6% with the increase in agreement to the perception that children gain a vocation by child labor.
- While holding other variables constant, the proportion of Syrian children 3 to 11 years old involved in household chores decreases by
15.7% when comparing households where all children are involved in child labour to those where none are involved.
Age group: 12 to 18 years old
Age
Group
Nationality Unstandardized
Coefficients (B)
Sig. 95.0% Confidence
Interval for B
Lower
Bound
Upper
Bound
12 to
18
Lebanese Residence area=Bekaa
Reference: BML
0.093 0.095 -0.016 0.203
Perceived financial situation=Most needs not met
Reference: Some of the needs met
-0.249 0.000 -0.349 -0.149
Perceived financial situation=Most needs met and saved money for the
future plans
Reference: Some of the needs met
0.527 0.000 0.247 0.807
Education level of partner=None/primary
0.099 0.043 0.003 0.196
Perceptions: Schooling/education investments for girls (daughters) are
not worth because eventually they will get married and stay home to
take care of children
-0.194 0.044 -0.384 -0.005
Perceptions: Schooling/education investments for boys (sons) are worth
because they have greater academic abilities than girls.
0.207 0.007 0.056 0.358
Perceptions: Cultural beliefs increase the numbers of children involved in child
labour.
-0.082 0.064 -0.169 0.005
Total number of children 12to18 years old enrolled in formal/nonformal education 0.012 0.683 -0.046 0.070
Proportion of children 12to18 years old involved in child labour -0.163 0.392 -0.536 0.211

65
Syrian Residence area=Bekaa
Reference: BML
0.220 0.004 0.073 0.366
Perceptions: Child labour is an accepted and common form of practice if
the child is above 14 years old.
0.103 0.008 0.028 0.178
Perceptions: Child labour is a means of preparing children to the future. -0.095 0.014 -0.171 -0.019
Total number of children 12to18 years old enrolled in formal/nonformal education 0.008 0.811 -0.060 0.077
Proportion of children 12to18 years old involved in child labour -0.026 0.768 -0.202 0.149
Model characteristics: Lebanese: R square: 0.263
Sig: <0.0001*
Syrian: R-square: 0.138
Sig: 0.001*
Table 18- Predicting proportion of children involved in household chores for the age group 12 to 18
Lebanese children 12 to 18:
The linear regression model for predicting engagement in household chores in Lebanese children 12 to 18 years old, depicted in Table 18, indicated
that almost 26.3% of the variance (R2=0.263) in the proportion of Lebanese children 12 to 18 years old involved in household chores is explained
by the independent variables in the table.
Positive predictors of involvement in household chores:
- The proportion of Lebanese children 12 to 18 years old involved in household chores is higher by 52.7% when comparing caregivers who
perceive that most of their needs are met and they saved money to those who perceive that some of their needs are met (when holding
all other variables as constants).
- The proportion of Lebanese children 12 to 18 years old involved in household chores is higher by 9.9% when comparing caregivers who
have partners with no or primary education to those who have partners with intermediate education. (when holding all other variables as
constants).
- While holding all other variables constant, the proportion of Lebanese children 12 to 18 years old involved in household chores increases
by 20.7% with the increase in agreement to the perception that schooling/education investments for boys (sons) are worth because they
have greater academic abilities than girls.

66
Negative predictors of involvement in household chores:
- The proportion of Lebanese children 12 to 18 years old involved in household chores is lower by 24.9% when comparing caregivers who
perceive that most of their needs are met to those who perceive that some of their needs are met (when holding all other variables as
constants).
- While holding all other variables constant, the proportion of Lebanese children 12 to 18 years old involved in household chores decreases
by 19.4% with the increase in agreement to the perception that Schooling/education investments for girls are not worth because eventually
they will get married and stay home to take care of children.
Syrian children 12 to 18:
The linear regression model for predicting engagement in household chores in Syrian children 12 to 18 years old, depicted in Table 18, indicated
that almost 13.8% of the variance (R2=0.138) in the proportion of Syrian children 12 to 18 years old involved in household chores is explained by
the independent variables in the table.
Positive predictors of involvement in household chores:
- The proportion of Syrian children 12 to 18 years old involved in household chores is higher by 22.0% when comparing households from
Bekaa to households from BML while controlling for all other variables.
- While holding all other variables constant, the proportion of Syrian children 12 to 18 years old involved in household increases by 10.3%
with the increase in agreement to the perception that child labour is an accepted and common form of practice if the child is above 14
years old.
Negative predictors of involvement in household chores:
While holding all other variables constant, the proportion of Syrian children 12 to 18 years old involved in household chores decreases by 9.5%
with the increase in agreement to the perception that child labour is a means of preparing children to the future
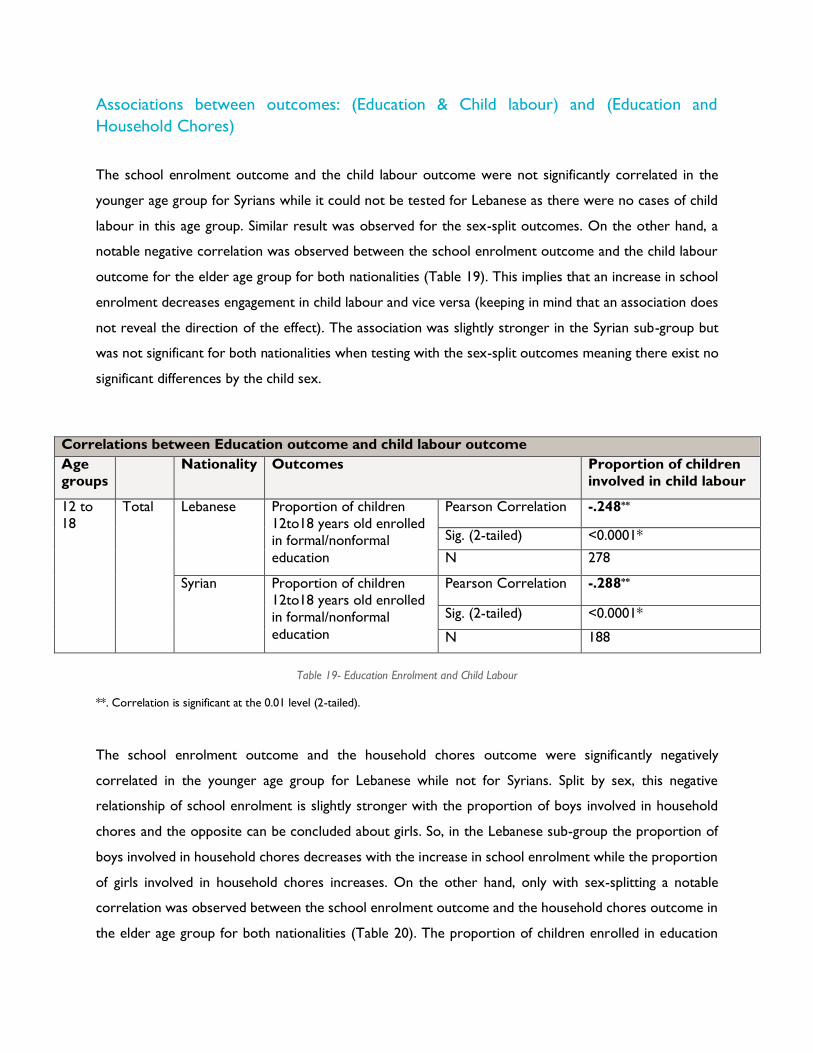
Associations between outcomes: (Education & Child labour) and (Education and
Household Chores)
The school enrolment outcome and the child labour outcome were not significantly correlated in the
younger age group for Syrians while it could not be tested for Lebanese as there were no cases of child
labour in this age group. Similar result was observed for the sex-split outcomes. On the other hand, a
notable negative correlation was observed between the school enrolment outcome and the child labour
outcome for the elder age group for both nationalities (Table 19). This implies that an increase in school
enrolment decreases engagement in child labour and vice versa (keeping in mind that an association does
not reveal the direction of the effect). The association was slightly stronger in the Syrian sub-group but
was not significant for both nationalities when testing with the sex-split outcomes meaning there exist no
significant differences by the child sex.
Correlations between Education outcome and child labour outcome
Age
groups
Nationality Outcomes Proportion of children
involved in child labour
12 to
18
Total Lebanese Proportion of children
12to18 years old enrolled
in formal/nonformal
education
Pearson Correlation -.248**
Sig. (2-tailed) <0.0001*
N 278
Syrian Proportion of children
12to18 years old enrolled
in formal/nonformal
education
Pearson Correlation -.288**
Sig. (2-tailed) <0.0001*
N 188
Table 19- Education Enrolment and Child Labour
**. Correlation is significant at the 0.01 level (2-tailed).
The school enrolment outcome and the household chores outcome were significantly negatively
correlated in the younger age group for Lebanese while not for Syrians. Split by sex, this negative
relationship of school enrolment is slightly stronger with the proportion of boys involved in household
chores and the opposite can be concluded about girls. So, in the Lebanese sub-group the proportion of
boys involved in household chores decreases with the increase in school enrolment while the proportion
of girls involved in household chores increases. On the other hand, only with sex-splitting a notable
correlation was observed between the school enrolment outcome and the household chores outcome in
the elder age group for both nationalities (Table 20). The proportion of children enrolled in education

68
was negatively correlated with the proportion of boys involved in household chores for both nationalities.
This implies that, for both nationalities in the 12 to 18 years old age group, the proportion of boys involved
in household chores decreases with the increase in school enrolment while the proportion of girls involved
in household chores increases.
Correlations between Education outcome and Household Chores outcome
Age
groups
Nationality Outcomes Proportion of involved
in household chores
3 to 11 Total Lebanese Proportion of children 3-
11 years old enrolled in
formal/nonformal
education
Pearson Correlation -.163*
Sig. (2-tailed) 0.012
N 234
Sex-
split
Lebanese Proportion of boys 3-11
years old enrolled in
formal/nonformal
education
Pearson Correlation -.180**
Sig. (2-tailed) 0.007
N 223
12 to
18
Sex-
split
Lebanese Proportion of boys 12to18
years old enrolled in
formal/nonformal
education
Pearson Correlation -.507**
Sig. (2-tailed) <0.0001*
N 254
Syrian Proportion of boys 12to18
years old enrolled in
formal/nonformal
education
Pearson Correlation -.363**
Sig. (2-tailed) <0. 0001*
N 95
Table 20- Education Enrolment and Household Chores
*. Correlation is significant at the 0.05 level (2-tailed).
**. Correlation is significant at the 0.01 level (2-tailed).
Discussion
Main Findings The present study explored figures around three child activity outcomes; school enrolment, engagement
in child labour and engagement in household chores in addition to parental perceptions around schooling
and child labour. The study sought to explore characteristics of the outcomes and their associations with
several hypothesized factors including socio-economic and parental perceptions.
The results reveal that, 76.2% had at least one child aged 3 to 18 years old enrolled in some sort of
education (formal/nonformal). On average, within a household, 67.9% of the children 3 to 18 years old
are enrolled in some form of education while 32.1% are not. The within household enrolment figure was
lower for the younger age group compared to the older. The aforementioned figures are of concern taking
into consideration the socio-economic figures revealed in the study, where more than majority of the
respondents (80.7%) earn an income below one million LBP, which in turn raises red flags regarding the
affordability of education and its related expenses. In addition to the diminished income, the inflation adds
up to the financial burdens which might in turn lead to higher engagement in negative coping mechanisms.
One of those mechanisms is withdrawal of children from schools and was highlighted by 7.7% of the
respondents of which a lion’s share (75%) stated the inability to pay school fees and expenses (Tuition
fees, transportation, stationary…) to be the primary cause. The education enrolment outcome for the
entire age range of children (3 to 18 years old) and when splitting to age groups varied significantly between
the two nationalities, with higher enrolment proportions for the Lebanese respondents compared to the
Syrians which is in line with existing figures (Save Our Education: Protect Every Child’s Right to Learn in the
COVID-19 Response and Recovery | Resource Centre, n.d.).
The proportion of Syrian children enrolled in education was significantly higher for both age groups in
BML compared to Bekaa and Akkar respectively however residing in Bekaa or Akkar were positive
predictors of enrolment for the Lebanese younger age group (3 to 11 years old). Involvement in household
chores was a significant negative predictor of school enrolment in the younger Lebanese age group while
involvement in child labour was significant for the older Lebanese age group (12 to 18 years old).
Comparing Syrian versus Lebanese populations, perceptions predominantly more than socio-
demographics predicted school enrolment in the Syrian population compared to the Lebanese, and this
was noted with the stronger associations of the outcome with perceptions in the Syrian population. This
could be a cue that education enrolment decision within Syrian households is more likely to be affected
by perceptions and beliefs than by demographic and economic factors of the household.

70
Involvement of at least one child 3 to 18 years old in labour was reported by 10.8% of the households.
Engagement of at least one child in child labour was higher for the older age group (12.7%) compared to
3 to 11 years old (5.4%), with no cases for the Lebanese younger age group and a significant greater
engagement of boys compared to girls. Child labour figures were higher in the Syrian population compared
to the Lebanese which is in line with evidence from other studies(Child Labour Survey in Lebanon, 2015;
Save Our Education: Protect Every Child’s Right to Learn in the COVID-19 Response and Recovery | Resource
Centre, n.d.). A recent study conducted by IRC and LPC highlighted the association between food insecurity
and child labour; one leading to the other bi-directionally which makes the child labour figures from this
study more alarming given the eminently reported food-related negative coping mechanism where 77.4%
of the households outlined resorting to purchasing food on credit. Perceptions and household chores
were predictors of child labour involvement in the younger Syrian age group while the predictors for the
older age group were socio-demographics and school enrolment in the Lebanese population and
predominantly perceptions in the Syrian population. Although strong correlations between the proportion
of children involved in child labour were detected for the older Syrian group, perceptions were more
dominant in predicting the outcome suggesting, similarly to education enrolment, that the child activity
decision for the Syrian population is more strongly guided by perceptions compared to socio-
demographics. Further, the associations of child labour involvement with total monthly income and
perceived financial situation in the Syrian population, raise red flags as higher involvement was observed
in the middle income categories compared to the lower one and for those reporting some needs met
compared to those with most needs not met.
Children help other family members with household activities, quite often along with their studies, which
is in line with findings from the 2015 Child Labour Survey in Lebanon (Child Labour Survey in Lebanon, 2015).
Almost quarter of the surveyed households had at least one child 3 to 18 years old involved in household
chores, and this percentage was significantly higher for the older age group (12 to 18) at 35% compared
to the younger age group at only 8.7%. Household chores figures were higher in the Syrian population
compared to the Lebanese and notably higher for girls compared to boys for both nationalities which is
in line with existing evidence(Child Labour Survey in Lebanon, 2015). In the Lebanese population,
financial/economic variables were predictors of involvement in household chores, where those reporting
middle income categories compared to the lower one and those reporting some needs met compared to
those with most needs not met had higher involvement in household chores suggesting a possible
social/cultural acceptance cause rooted in beliefs.
Bivariate analyses validated hypothesized one-on-one relationships between the outcomes and socio-
demographic factors. Multivariate analyses of the outcomes of interest revealed a strong negative

71
predictive relationship between education enrolment and child labour in the Lebanese older age group.
The proportion of Lebanese children 12 to 18 years old enrolled in education decreases by 101% when
comparing households with no children involved in child labour to those with all children involved in child
labour. Household chores had a strong negative predictive power on education enrolment in the younger
Lebanese age group, where the proportion of Lebanese children 3-11 years old enrolled in education
decreased with the increase in the proportion of children (Lebanese, 3 to 11) involved in household
chores. Child labour had a strong negative predictive power on engagement in household chores in the
younger Syrian age group, where the proportion of Syrian children 3-11 years old engaged in household
chores decreased with the increase in the proportion of children (Syrian, 3 to 11) involved in child labour.
Parental perceptions echoing individual beliefs at times and cultural norms at others had predictive power
over the outcomes of interest, which highlights the role of beliefs and norms in the child activity decision-
making process.
The acceptance rate of perceptions around the de-prioritization of school enrolment and the higher
preference for accepting child labour practices speaks to the complexity and enormity of needs in both
populations. This puts children at risk of becoming in the "best case scenario", "idle" meaning not included
in any form of meaningful activity that provides them with skills and knowledge needed to acquire future
livelihood opportunities. In the worst-case scenarios, children in the light of this research are prone to
higher risks that affects their survival, development and rights. On a longer term and if the situation keeps
evolving in this direction, depending on the context children might be further prone to exploitation and
grave violations and some of them might be recruited into armed groups.
Strengths and Limitations of the Study
STRENGTHS
This study adds to a body of knowledge aiming to understand child activity decisions, their outcomes and
determinants and specifically in Lebanon by relying and building on existing theoretical models. The
representative sampling provided enough power to draw inferences at each nationality level and a
representation over three geographical areas within Lebanon. Finally, the anonymity of the questionnaires
reduced some potential effect of social desirability.
LIMITATIONS
The adoption of a cross-sectional design, which is known to be a weak design for the apprehension of
complex relationships and intricate causal pathways, was one of the limitations of this study in addition to

72
the reliance on remote data collection modality for such a sensitive topic. Moreover, perceptions can be
informed by several biases for multiple purposes including social desirability and ripping off help, which
can be more of a limitation in interviewer-administered cross-sectional designs. The generalizability of
this study was, most likely, restricted to BML, Bekaa and Akkar excluding the South. Finally, the probability
of under-reporting for a sensitive behaviour such as child labour should be kept in mind and school
enrolment figures might have been affected by the status of education in the country given the pandemic
and the weak preparedness plan to shift to remote education with its unprecedented considerations and
burdens.

73
Recommendations
- The results of the study provide a sound indication in the direction of behavioral predictors playing
a notable role in child activity decision making. This paves the way and identifies the need for
more in-depth studies exploring the behavioral determinants of child activity decision making.
Future efforts studying the determinants should rely on existing behavioral theories and
frameworks to be comparable with existing body of literature adopting these frameworks.
Additionally, qualitative studies and elicitations should be considered as well to augment
understanding these behavioral determinants looking at the intricate nature of the child activity
decision-making process. This will help in addressing these behavioral predictors and including
them in future programming efforts especially under behavior change agendas.
- The figures around school enrolment highlighted evidence on disruption of education, particularly
in the refugee community, where the absence of a solid and sound system for the shift from
traditional face-to-face schooling to remote learning was the main contributing factor given the
weak preparedness of the educational system for such a shift during the past year. As such, efforts
should be focused on:
enhancing the remote learning alternative in several aspects, access-wise and in its
technical (content) nature. This support’s WVL’s advocacy asks and efforts which focus
on promoting having a sounds preparedness plan for the switch from face-to-face to the
remote modality of learning, this could be embodied in a ready and set platform for
remote learning to be utilized in cases dictating school closures (For example, the covid-
19 pandemic…)
Building teachers’ capacity to engage better with children remotely through a combination
of in-service and pre-service capacity building plan and daily coaching and mentoring
sessions to be able to cater for the specific needs of children, especially children with
disabilities (PwDs) and learning difficulties.
- The research revealed negative association between school enrollment and both child labour and
household chores. This calls to advocate with the concerned ministries (Ministry of Education and
Higher Education(MEHE), The Ministry of Social Affairs (MoSA), the Ministry of Interior and
Municipalities (MOIM) and the Ministry of Justice (MOJ)), Civil Society Organizations (CSOs),
NGOs, and the concerned sectors to develop plans to ensure the education of children through

74
the implementation and monitoring of "Free and Compulsory education for all" inscribed in article
49 of Legislative Decree No. 134 of 1959, as amended in 2011. Additionally, advocate to widen
the current compulsory education age range for children from 6 to 14 to 3 to 15 to ensure
children are delayed from being involved in child labour as a prevention measure through policy
change.
- The study highlighted that 23.8% of the households had none of their children 3 to 18 years old
enrolled in any form of education. This highlights the need to focus (support the sector efforts)
on outreach efforts (through phone calls, door-to-door, community assessments, referrals…) to
identify those children and put them in the suitable learning schemes pertinent to their profiles
(formal or non-formal education opportunities).
- Catch-up initiatives based on learning assessments should be adopted combined with outreach
activities (mentioned above) and retention support to ensure better retention of the children
when enrolled in formal education.
- Given the high out of school figures and the fact that the ALP scheme has been halted, efforts
advocating and promoting the revival of ALP should be focused on to ensure a smoother passage
from non-formal education to formal education.
- The study highlighted that 7.7% of the interviewed household opted for withdrawing their children
from schools as a coping strategy to deficiencies in basic needs. Three quarters of these household
mentioned the inability to pay school fees and expenses (Tuition fees, transportation,
stationary…) to be the primary cause. This in combination with the results from the Learning and
Readiness Assessment by the Inter-Agency Coordination in Lebanon (Learning Readiness
Assessment Analysis Report APRIL, 2020)foreground the need to advocate for:
Support in covering transportation and stationary fees which are reverted to data bundle
fees in the case of remote learning.
Combining remote learning modalities with physical distribution of worksheet: Out of
WVL experience in remote learning during the pandemic, combining distribution of
education and CP worksheets/ Textbooks with the remote engagement with children was
proven more efficient. This ensures that children will have the worksheets in their hands
to work on while they are guided and instructed during the daily engagement with the
teachers.

75
- Integrate Child protection programming more into education programming, through Psycho-
Social Support (PSS) and Social and Emotional Learning (SEL) for children. Additionally, provide
Psycho-Social Support (PSS) for caregivers who are playing the main role in educating their
children and assisting them to achieve the needed learning outcomes as they are considered the
“at-home teachers”.
- The study highlighted that the overall percentage of children involved in child labour and HH
Chores to be at 27% for Lebanese and 65% for Syrian children. This evident increase is of a grave
concern for children's health, protection and development and hence engage with donors to
prioritize multi-sectoral (CP, MHPSS, Edu, Livelihood...) and multi-year funding to respond to the
current needs and prevent the anticipated further increase.
- Almost one quarter (24.6%) of the households had at least 1 child between the ages (3-18)
involved in HH Chores, greater for 12-18 vs. 3-11 (35% vs. 8.7%). This is concerning as girls are
more involved in HH Chores than boys. This highlights the need to tailor programming through
a gender sensitive lens, to accommodate and adjust for the needs of girls while focusing on all
associated risks especially those within the (3-11) age bracket.
- Think carefully and assess the risks (push and pull factors) whenever planning to include a cash
component in a Child labour project as this research has shown that even though when caregivers
reported most of their needs were met they had higher rates of children involved in both child
labour and/or household chores than caregivers who reported some of their needs were met.

76
Conclusions
In summary, this research explored figures around child activity options (school enrolment, child labour
and household chores) and their determinants for children aged 3 to 18 years old in Lebanon, with a focus
on less privileged layers of the society. Additionally, the study sought to determine the perceptions of
child education and labour among parents of school-aged children.
The study highlighted alarming socio-economic figures of the participant households where a lion’s share
earn an income below one million LBP which raises red flags given the intense economic crisis the country
is witnessing coupled with the inflation in addition to evidence on reliance on negative coping mechanisms
to make ends meet. That being said and while some negative coping mechanisms directly influence child
activity decisions, the study revealed concerning figures around out-of-school children and children
involved in child labour which could be worsened by any further aggravation of the economic situation.
However, aside from the economic predisposition, the results hinted to behavioural determinants
underlying child activity decisions and these determinants in many instances predicted school enrolment
and/or child labour involvement more stoutly than economic or financial factors. The school enrolment
figures were lower for the younger age group and for the refugee population, which highlighted the need
for outreach activities and retention support to put children back on the educational track and enable
them to catch up with the educational scheme. These efforts should be coupled enhancing the remote
learning alternative in several aspects given the shift to the reliance on remote learning and the unveiled
weak preparedness of the educational system for this shift. Similarly, figures around child labour and
household chores were concerning and were higher in the refugee population compared to the host and
for the older age group with sex differences between boys and girls (boys involved more in child labour
compared to girls and vice versa for household chores) which sheds a light on the integration of a gender
sensitive lens in program tailoring.
Interactions between child activity options (school enrolment/child labour/household chores) were
observed with variations by age group and nationality, where child labour and household chores separately
were negative predictors of school enrolment. This underlines for the need for multi-sector interventions
targeting the different gears in the relationship between child activity options further highlighting the
relevance and importance of the advocacy ask of widened compulsory education age range for children as
a preventive measure to delay them from being involved in child labour.
Caregivers’ agreement rates to false perceptions around child labour and school enrolment were
remarkable reflecting strong personal and/or cultural beliefs underlying their decisions. Interestingly

77
behavioural perceptions predicted child activity outcomes sometimes more firmly than socio-economic
factors and more prominently in the Syrian population compared to the Lebanese. This calls attention to
the importance of targeting behavioural determinants of decision making in future programming efforts
and this further highlights a need for additional deeper research in this field to be able to identify these
determinants and hence target them through programming. Further, the lower child labour and household
chores involvement in middle financial status groups compared to the lower ones calls for caution when
planning to include a cash component in a Child labour projects. This is in line with previous research
done by WVL highlighting that multi-purpose cash assistance in the context of Syrian Refugees did not
help in reducing child labour and household chores nor contributed to an increase in school enrolment.
Finally, the results from this study and the variation in the relationship between the child activity outcomes
by age groups and nationality serve in supporting a vast body of literature calling for rejecting the notion
that child activity is a binary decision with two mutually exclusive options; either engagement in work
(household chores or child labour) or school enrolment. This was further supported by the high tolerance
to perceptions around accepting child labour practices and the high household chores involvement rates
regardless of the school enrolment status. This fact accentuates the importance of tailoring future efforts
on child activity outcomes on the basis of not strictly viewing child work (paid or household) and education
as mutually exclusive options and additionally taking into consideration other activity alternatives like being
“idle”.

78
References Aslam Chaudhary, M., & Naheed Khan, F. (2002). Economic and Social Determinants of Child Labour: A
Case Study of Dera Ismail Khan, Pakistan. The Lahore Journal of Economics, 7(2), 15–40.
https://doi.org/10.35536/lje.2002.v7.i2.a2
Basu, K. (1999). Child labor: Cause, consequence, and cure, with remarks on international labor standards.
Journal of Economic Literature, 37(3), 1083–1119. https://doi.org/10.1257/jel.37.3.1083
Becker, G. S., & Tomes, N. (1976). Child Endowments and the Quantity and Quality of Children Gary S . Becker
and Nigel Tomes. Journal of Political Economy. http://www.jstor.org/stable/1831106
Buchmann, C. (2000). Family structure, parental perceptions, and child labor in Kenya: What factors
determine who is enrolled in school? Social Forces, 78(4), 1349–1378.
https://doi.org/10.1093/sf/78.4.1349
Chaubey, J., Perisic, M., Perrault, N., Laryea-Adjei, G., & Khan, N. (2007). Child Labour, Education and
Policy Options. Unicef Working Paper, March.
Child Labour Survey in Lebanon. (2015). Central Administration of Statistics of Lebanon. www.ifrro.org
Deb, P., & Rosati, F. C. (2005). Determinants of Child Labour and School Attendance: The Role of
Household Unobservables. SSRN Electronic Journal. https://doi.org/10.2139/ssrn.473502
ESCWA. (2010). Poverty in Lebanon: Solidarity is Vital to Adress the Impact of Multiple Overlapping Shocks.
35(4), 18.
Francis, A. S. (2020). Determinants of Parents’ Perception of Child Labour Practices in Southwest, Nigeria. April,
70–80. https://doi.org/10.5281/zenodo.3786576
Goswami, S., & Jain, V. (2006). Determinants of Child Labour Participation: Review of Issues and
Implications for Policy. Management and Labour Studies, 31(4), 388–398.
https://doi.org/10.1177/0258042x0603100406
Ibrahim, A., Abdalla, S. M., Jafer, M., Abdelgadir, J., & De Vries, N. (2019). Child labor and health: A
systematic literature review of the impacts of child labor on child’s health in low- and middle-income
countries. Journal of Public Health (United Kingdom), 41(1), 18–26.
https://doi.org/10.1093/pubmed/fdy018
ILO, & UNICEF. (2020). Covid-19 and child labour: a time of crisis, a time to act. 38.
Jensen, P., & Nielsen, H. S. (1997). Child labour or school attendance? Evidence from Zambia. Journal of
Population Economics, 10(4), 407–424. https://doi.org/10.1007/s001480050051
Learning Readiness Assessment Analysis Report APRIL (Issue April). (2020).
Okpukpara, B. C. (2006). Incidents and determinants of child labor in Nigeria (Issue June).
Omokhodion, F. O., & Uchendu, O. C. (2010). Perception and practice of child labour among parents of
school-aged children in Ibadan, southwest Nigeria. Child: Care, Health and Development, 36(3), 304–
308. https://doi.org/10.1111/j.1365-2214.2009.00988.x
Ranjan, R. (2000). Analysis of child labour in Peru and Pakistan: A comparative study. Journal of Population
Economics, 13(1), 3–19. https://doi.org/10.1007/s001480050119
Ravallion, M., & Wodon, Q. (2000). Does child labour displace schooling? Evidence on behavioural
responses to an enrollment subsidy. Economic Journal, 110(462), 158–175.

79
https://doi.org/10.1111/1468-0297.00527
Ray, R. (2001). Child Labour and Child Schooling in South Asia : A Cross Country Study of their Determinants.
Save Our Education: Protect every child’s right to learn in the COVID-19 response and recovery | Resource Centre.
(n.d.). Retrieved April 3, 2021, from
https://resourcecentre.savethechildren.net/node/17871/pdf/save_our_education_0.pdf
The US Department of Labour. (2020). Findings on the Worst Forms of Child Labor.
UNICEF. (2020). Child labour. https://www.unicef.org/protection/child-labour
UNICEF, UNHCR, & WFP. (2020). Vulnerability Assessment of Syrian Refugees in Lebanon (Vol. 2020, Issue
September).
United Nations International Labour Organization. (1999). Convention C182 - Worst Forms of Child Labour
Convention, 1999 (No. 182). NORMLEX - Information System on International Labour Standards.
https://www.ilo.org/dyn/normlex/en/f?p=NORMLEXPUB:12100:0::NO::P12100_ILO_CODE:C182
Weston, B. H., & Weston, B. H. (2005). Child Labor and Human Rights :
WORKING CHILDREN IN CRISIS-HIT LEBANON : EXPLORING THE LINKAGES BETWEEN FOOD
INSECURITY AND CHILD LABOUR. (2021). February.
World Vision International. (2019). CPiE ADAPT – NATIONAL ANALYSIS (Issue September).

80
Appendices
Appendix 1- Detailed Socio-demographic Information
Variables N (%)
Residence Area Akkar 162 (20.9%)
Bekaa 259 (33.4%)
BML 355 (45.7%)
Total 776 (100.0%)
Qadaa Akkar 162 (100.0%)
Bekaa
Rashaya 15 (5.8%) (Out of 259)
West_bekaa 80 (30.9%) (Out of 259)
Zahle 107 (41.3%) (Out of 259)
Baalbeck 57 (22.0%) (Out of 259)
Total 259 (100.0%)
BML Aley 14 (3.9%) (Out of 355)
Baabda 16 (4.5%) (Out of 355)
Keserwan 5 (1.4%) (Out of 355)
Matn 148 (41.7%) (Out of 355)
Beirut 172 (48.5%) (Out of 355)
Total 355 (100.0 %)
Head of
Household
No 279 (36.0%)
Yes 497 (64.0%)
Total 776 (100.0%)
Relation to
HoH (if not
HoH)
Wife/Husband 244 (87.5%)
Mother/Father 7 (2.5%)
Daughter/Son 21 (7.5%)
Brother/Sister 4 (1.4%)
Brotherinlaw/Sisterinlaw 1 (0.4%)
Grandfather/Grandmother 1 (0.4%)
Other 1 (0.4%)
Total 279 (100.0%)
Sex of HoH Male 644 (83.0%)
Female 132 (17.0%)
Total 776 (100.0%)
Respondent
Sex
Male 391 (50.4%)
Female 385 (49.6%)

81
Age N Minimum Maximum Mean Std. Deviation
776 18.2 64.2 41.5 10.6
Social Status Single 28 (3.6%)
Married 653 (84.1%)
Widowed 41 (5.3%)
Separated 31 (4.0%)
Divorced 21 (2.7%)
Other 2 (0.3%)
Total 776 (100.0%)
Respondent
Education
Level
None 85 (11.0%)
Primary 292 (37.6%)
Intermediate 248 (32.0%)
Secondary 70 (9.0%)
Vocational 3 (0.4%)
Technical 24 (3.1%)
University 54 (7.0%)
Total 776 (100.0%)
Partner
Education
Level (when
married, out of
653)
None 98 (15.0%)
Primary 249 (38.1%)
Intermediate 191 (29.2%)
Secondary 51 (7.8%)
Vocational 6 (0.9%)
Technical 9 (1.4%)
University 49 (7.5%)
Total 653 (100.0%)
Respondent
Occupation
Full-time employee 56 (7.2%)
Part-time employee 21 (2.7%)
Business owner 8 (1.0%)
Freelancer 32 (4.1%)
Daily Worker 254 (32.7%)
Household Care (Housewife) 168 (21.6%)
Retired 3 (0.4%)
Not working by choice 37 (4.8%)
Not working due to lack of opportunities 182 (23.5%)
Other 15 (1.9%)
Total 776 (100.0%)
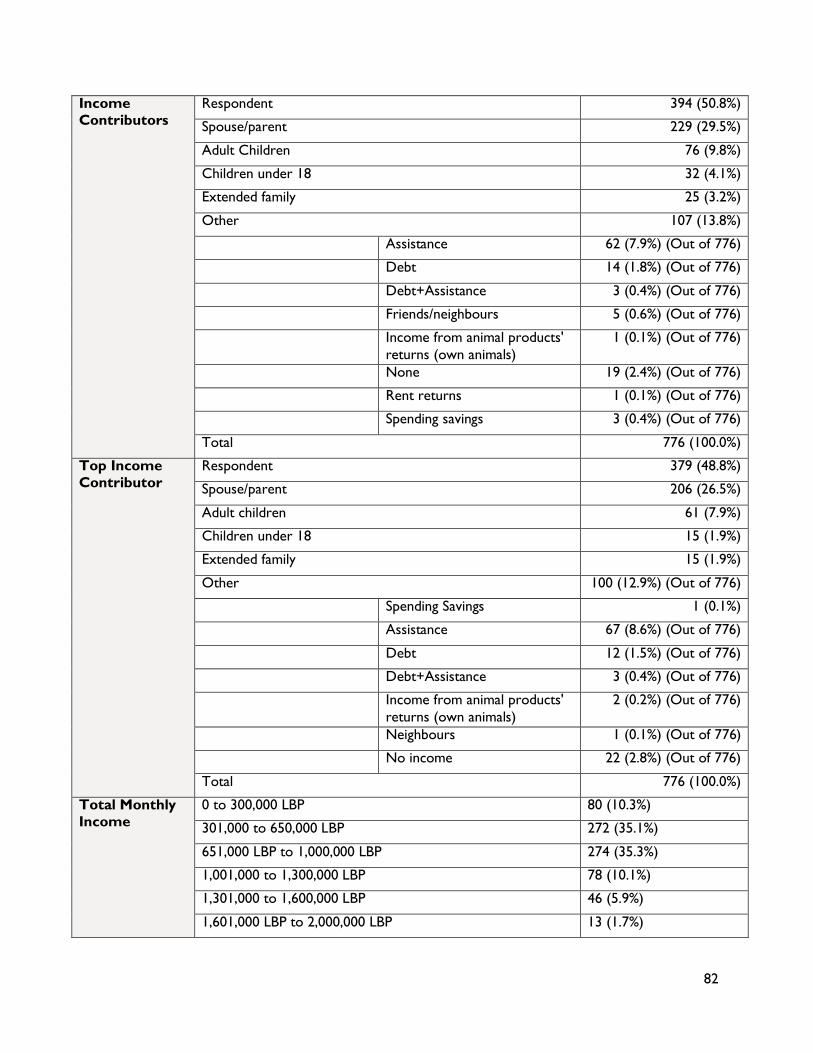
82
Income
Contributors
Respondent 394 (50.8%)
Spouse/parent 229 (29.5%)
Adult Children 76 (9.8%)
Children under 18 32 (4.1%)
Extended family 25 (3.2%)
Other 107 (13.8%)
Assistance 62 (7.9%) (Out of 776)
Debt 14 (1.8%) (Out of 776)
Debt+Assistance 3 (0.4%) (Out of 776)
Friends/neighbours 5 (0.6%) (Out of 776)
Income from animal products'
returns (own animals)
1 (0.1%) (Out of 776)
None 19 (2.4%) (Out of 776)
Rent returns 1 (0.1%) (Out of 776)
Spending savings 3 (0.4%) (Out of 776)
Total 776 (100.0%)
Top Income
Contributor
Respondent 379 (48.8%)
Spouse/parent 206 (26.5%)
Adult children 61 (7.9%)
Children under 18 15 (1.9%)
Extended family 15 (1.9%)
Other 100 (12.9%) (Out of 776)
Spending Savings 1 (0.1%)
Assistance 67 (8.6%) (Out of 776)
Debt 12 (1.5%) (Out of 776)
Debt+Assistance 3 (0.4%) (Out of 776)
Income from animal products'
returns (own animals)
2 (0.2%) (Out of 776)
Neighbours 1 (0.1%) (Out of 776)
No income 22 (2.8%) (Out of 776)
Total 776 (100.0%)
Total Monthly
Income
0 to 300,000 LBP 80 (10.3%)
301,000 to 650,000 LBP 272 (35.1%)
651,000 LBP to 1,000,000 LBP 274 (35.3%)
1,001,000 to 1,300,000 LBP 78 (10.1%)
1,301,000 to 1,600,000 LBP 46 (5.9%)
1,601,000 LBP to 2,000,000 LBP 13 (1.7%)

83
2,001,000 LBP to 2,500,000 LBP 9 (1.2%)
2,501,000 LBP to 3,000,000 LBP 3 (0.4%)
3,500,000 LBP to 4,000,000 LBP 1 (0.1%)
Total 776 (100.0%)
Perceived
Financial
Situation
Most needs not met 441 (56.8%)
Some needs met 207 (26.7%)
Most needs met but cannot save money for the future plans 118 (15.2%)
Most needs met and saved money for the future plans 10 (1.3%)
Total 776 (100.0%)
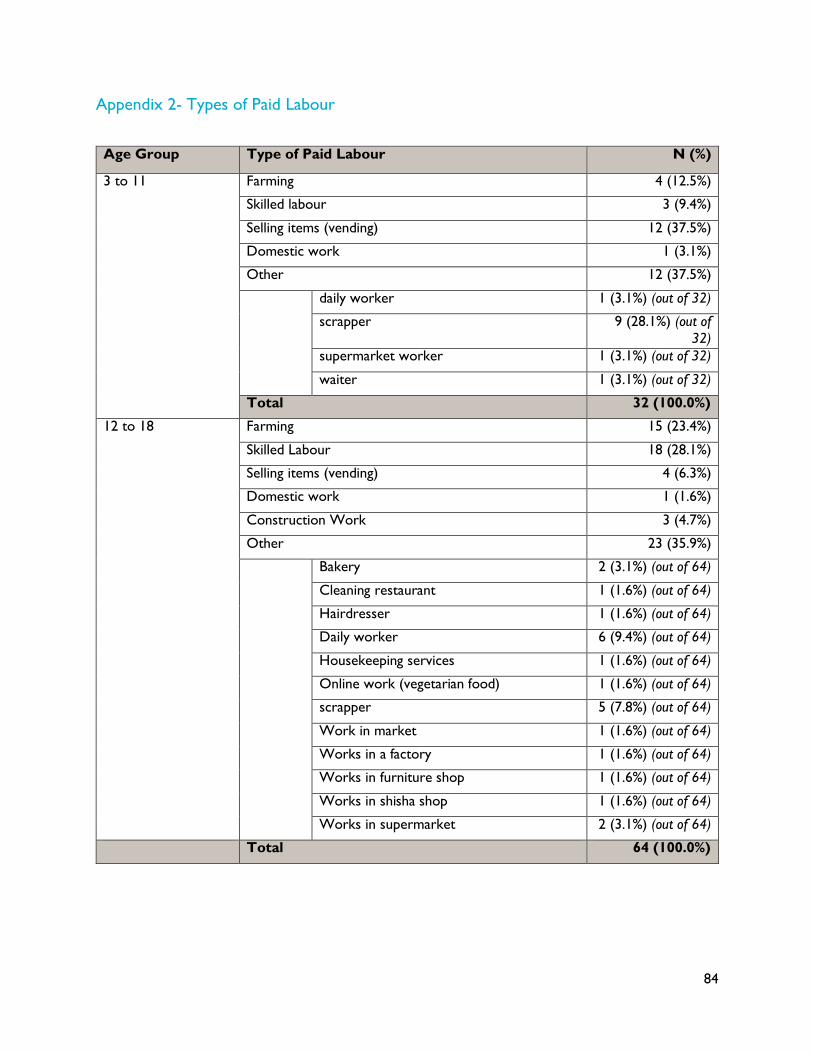
84
Appendix 2- Types of Paid Labour
Age Group Type of Paid Labour N (%)
3 to 11 Farming 4 (12.5%)
Skilled labour 3 (9.4%)
Selling items (vending) 12 (37.5%)
Domestic work 1 (3.1%)
Other 12 (37.5%)
daily worker 1 (3.1%) (out of 32)
scrapper 9 (28.1%) (out of
32)
supermarket worker 1 (3.1%) (out of 32)
waiter 1 (3.1%) (out of 32)
Total 32 (100.0%)
12 to 18 Farming 15 (23.4%)
Skilled Labour 18 (28.1%)
Selling items (vending) 4 (6.3%)
Domestic work 1 (1.6%)
Construction Work 3 (4.7%)
Other 23 (35.9%)
Bakery 2 (3.1%) (out of 64)
Cleaning restaurant 1 (1.6%) (out of 64)
Hairdresser 1 (1.6%) (out of 64)
Daily worker 6 (9.4%) (out of 64)
Housekeeping services 1 (1.6%) (out of 64)
Online work (vegetarian food) 1 (1.6%) (out of 64)
scrapper 5 (7.8%) (out of 64)
Work in market 1 (1.6%) (out of 64)
Works in a factory 1 (1.6%) (out of 64)
Works in furniture shop 1 (1.6%) (out of 64)
Works in shisha shop 1 (1.6%) (out of 64)
Works in supermarket 2 (3.1%) (out of 64)
Total 64 (100.0%)

Appendix 3- Socio-demographic Descriptives by Nationality
Nationality Variables N (%) Significance (P-
value)
Social Status Lebanese Single 20(5.1%) 0.006*
Married 313 (80.5%)
Widowed 56 (14.4%)
Total 389 (100.0%)
Syrian Single 8 (2.1%)
Married 340 (88.3%)
Widowed 37 (9.6%)
Total 385 (100.0%)
Respondent’s
Education
Level
Lebanese None/Primary 124 (31.9%) <0. 0001*
Intermediate/vocational 163 (41.9%)
Secondary, Technical or university 102 (26.2%)
Total 389 (100.0%)
Syrian None/Primary 253 (65.4%)
Intermediate/vocational 88 (22.7%)
Secondary, Technical or university 46 (11.9%)
Total 387 (100.0%)
Partner’s
Education
Level
Lebanese None/Primary 109 (34.8%) <0. 0001*
Intermediate/vocational 118 (37.7%)
Secondary, Technical or university 86 (27.5%)
Total 313 (100.0%)
Syrian None/Primary 238 (70.0%)
Intermediate/vocational 79 (23.2%)

86
Secondary, Technical or university 23 (6.8%)
Total 340 (100.0%)
Respondent’s
occupation
Lebanese Full-time/Part-time employee 66 (17.3%) <0.0001*
Business owner/freelancer 31 (8.1%)
Daily worker 95 (24.9%)
Household care 102 (26.8%)
Retired/not working 87 (22.8%)
Total 381 (100.0%)
Syrian Full-time/Part-time employee 11 (2.9%)
Business owner/freelancer 9 (2.4%)
Daily worker 159 (41.8%)
Household care 66 (17.4%)
Retired/not working 135 (35.5%)
Total 380 (100.0%)
Age Lebanese N Minimum Maximum Mean Std. Deviation <0.0001*
389 19.2 64.2 46.0 10.1
Syrian N Minimum Maximum Mean Std. Deviation
387 18.2 64.2 36.9 9.1
Top Income
Contributor
Lebanese Respondent 200 (51.4%) <0. 0001*
Spouse/parent 122 (31.4%)
Adult children 40 (10.3%)
Children under 18 0 (0.0%)
Extended family 12 (3.1%)
Other 15 (3.9%) (Out of 389)
Spending Savings 1 (0.3%) (Out of 389)
Assistance 7 (1.8%) (Out of 389)

87
Debt 5 (1.3%) (Out of 389)
Divorce support+Assistance 1 (0.3%) (Out of 389)
Income from animal
products' returns (own
animals)
1 (0.3%) (Out of 389)
No income 22 (5.7%) (Out of 389)
Total 389 (100.0%)
Syrian Respondent 179 (46.3%)
Spouse/parent 84 (21.7%)
Adult children 21 (5.4%)
Children under 18 15 (3.9%)
Extended family 3 (0.8%)
Other 85 (22.0%) (Out of 387)
Assistance 59 (15.2%) (Out of 387)
Debt 7 (1.8%) (Out of 387)
Debt+Assistance 3 (0.8%) (Out of 387)
Income from animal
products' returns (own
animals)
1 (0.3%) (Out of 387)
Neighbours 1 (0.3%) (Out of 387)
No income 20 (5.2%) (Out of 387)
Total 387 (100.0%)
Total Monthly
Income
Lebanese 0 to 300,000 LBP 38 (9.8%) <0. 0001*
301,000 to 650,000 LBP 105 (27.0%)
651,000 LBP to 1,000,000 LBP 147 (37.8%)
1,001,000 to 1,300,000 LBP 45 (11.6%)
1,301,000 to 1,600,000 LBP 32 (8.2%)
1,601,000 LBP to 2,000,000 LBP 10 (2.6%)

88
2,001,000 LBP to 2,500,000 LBP 8 (2.1%)
2,501,000 LBP to 3,000,000 LBP 3 (0.8%)
3,500,000 LBP to 4,000,000 LBP 1 (0.3%)
Total 389 (100.0%)
Syrian 0 to 300,000 LBP 42 (10.9%)
301,000 to 650,000 LBP 167 (43.2%)
651,000 LBP to 1,000,000 LBP 127 (32.8%)
1,001,000 to 1,300,000 LBP 33 (8.5%)
1,301,000 to 1,600,000 LBP 14 (3.6%)
1,601,000 LBP to 2,000,000 LBP 3 (0.8%)
2,001,000 LBP to 2,500,000 LBP 1 (0.3%)
2,501,000 LBP to 3,000,000 LBP 0 (0.0%)
3,500,000 LBP to 4,000,000 LBP 0 (0.0%)
Total 387 (100.0%)
Perceived
Financial
Situation
Lebanese Most needs not met 218 (56.0%) <0. 0001*
Some needs met 68 (17.5%)
Most needs met but cannot save money for the future
plans
93 (23.9%)
Most needs met and saved money for the future plans 10 (2.6%)
Total 389 (100.0%)
Syrian Most needs not met 223 (57.6%)
Some needs met 139 (35.9%)
Most needs met but cannot save money for the future
plans
25 (6.5%)
Most needs met and saved money for the future plans 0 (0.0%)
Total 387 (100.0%)
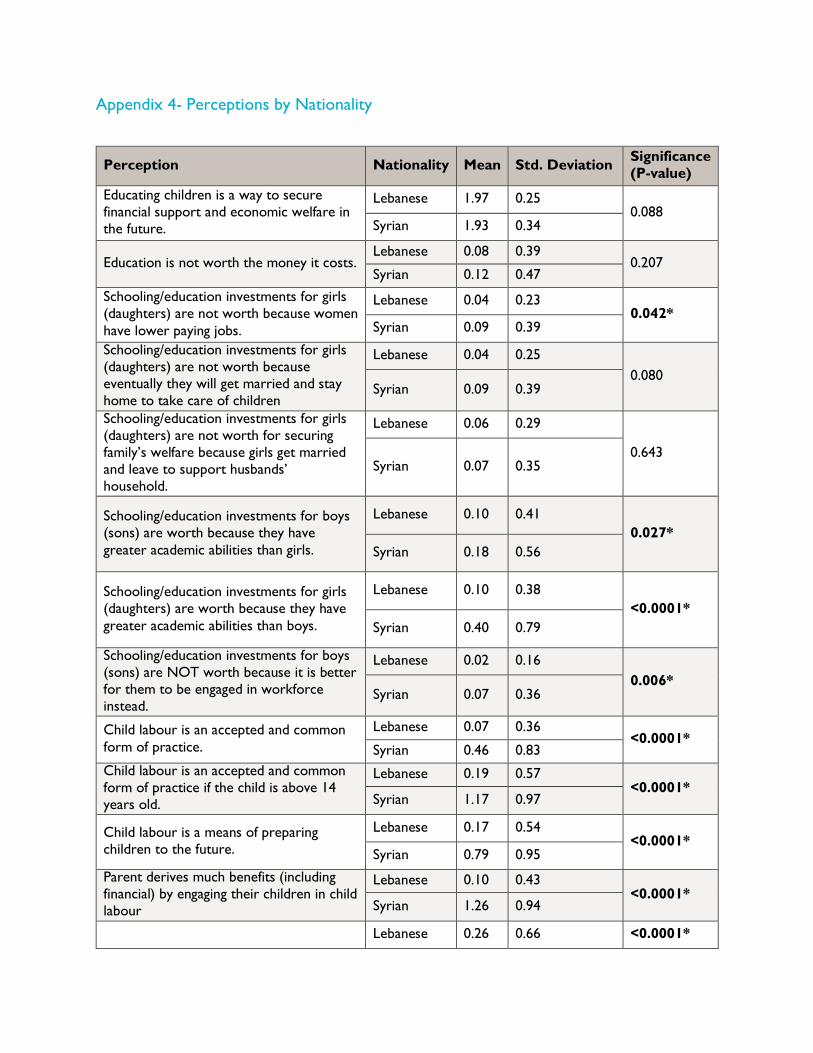
Appendix 4- Perceptions by Nationality
Perception Nationality Mean Std. Deviation Significance
(P-value)
Educating children is a way to secure
financial support and economic welfare in
the future.
Lebanese 1.97 0.25 0.088
Syrian 1.93 0.34
Education is not worth the money it costs. Lebanese 0.08 0.39
0.207 Syrian 0.12 0.47
Schooling/education investments for girls
(daughters) are not worth because women
have lower paying jobs.
Lebanese 0.04 0.23 0.042*
Syrian 0.09 0.39
Schooling/education investments for girls
(daughters) are not worth because
eventually they will get married and stay
home to take care of children
Lebanese 0.04 0.25
0.080 Syrian 0.09 0.39
Schooling/education investments for girls
(daughters) are not worth for securing
family’s welfare because girls get married
and leave to support husbands’
household.
Lebanese 0.06 0.29
0.643 Syrian 0.07 0.35
Schooling/education investments for boys
(sons) are worth because they have
greater academic abilities than girls.
Lebanese 0.10 0.41
0.027*
Syrian 0.18 0.56
Schooling/education investments for girls
(daughters) are worth because they have
greater academic abilities than boys.
Lebanese 0.10 0.38
<0.0001*
Syrian 0.40 0.79
Schooling/education investments for boys
(sons) are NOT worth because it is better
for them to be engaged in workforce
instead.
Lebanese 0.02 0.16
0.006* Syrian 0.07 0.36
Child labour is an accepted and common
form of practice.
Lebanese 0.07 0.36 <0.0001*
Syrian 0.46 0.83
Child labour is an accepted and common
form of practice if the child is above 14
years old.
Lebanese 0.19 0.57 <0.0001*
Syrian 1.17 0.97
Child labour is a means of preparing
children to the future.
Lebanese 0.17 0.54 <0.0001*
Syrian 0.79 0.95
Parent derives much benefits (including
financial) by engaging their children in child
labour
Lebanese 0.10 0.43 <0.0001*
Syrian 1.26 0.94
Lebanese 0.26 0.66 <0.0001*
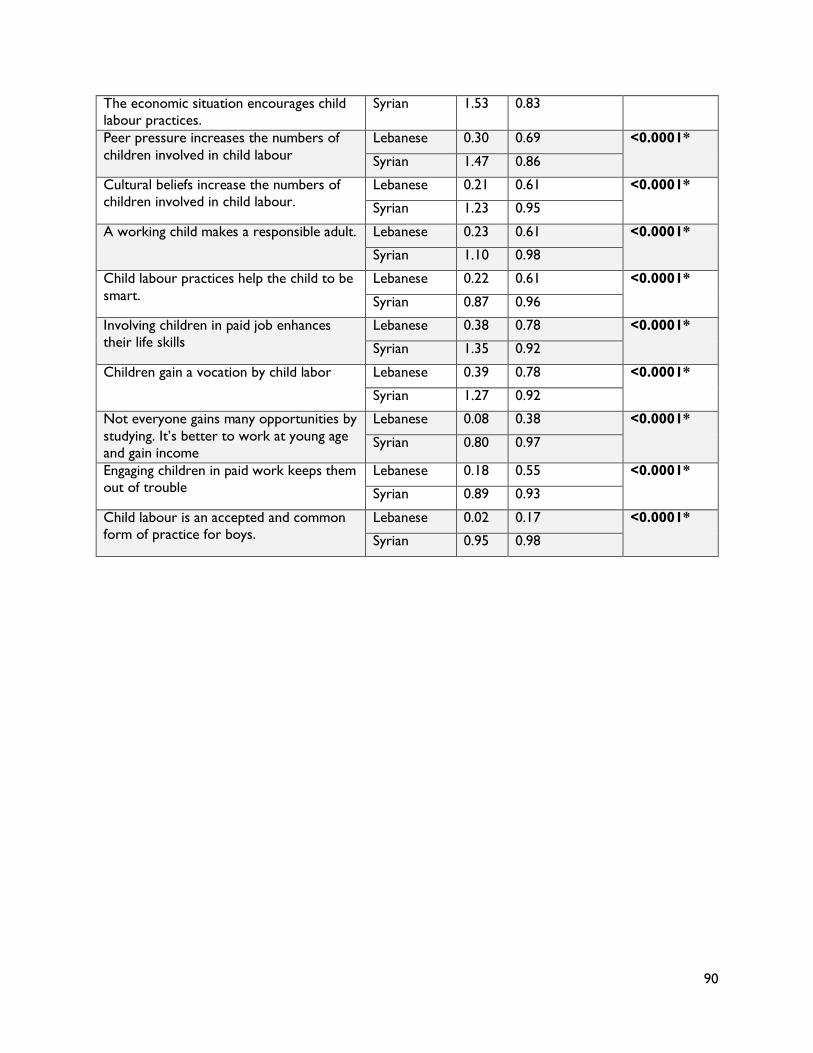
90
The economic situation encourages child
labour practices.
Syrian 1.53 0.83
Peer pressure increases the numbers of
children involved in child labour
Lebanese 0.30 0.69 <0.0001*
Syrian 1.47 0.86
Cultural beliefs increase the numbers of
children involved in child labour.
Lebanese 0.21 0.61 <0.0001*
Syrian 1.23 0.95
A working child makes a responsible adult. Lebanese 0.23 0.61 <0.0001*
Syrian 1.10 0.98
Child labour practices help the child to be
smart.
Lebanese 0.22 0.61 <0.0001*
Syrian 0.87 0.96
Involving children in paid job enhances
their life skills
Lebanese 0.38 0.78 <0.0001*
Syrian 1.35 0.92
Children gain a vocation by child labor Lebanese 0.39 0.78 <0.0001*
Syrian 1.27 0.92
Not everyone gains many opportunities by
studying. It’s better to work at young age
and gain income
Lebanese 0.08 0.38 <0.0001*
Syrian 0.80 0.97
Engaging children in paid work keeps them
out of trouble
Lebanese 0.18 0.55 <0.0001*
Syrian 0.89 0.93
Child labour is an accepted and common
form of practice for boys.
Lebanese 0.02 0.17 <0.0001*
Syrian 0.95 0.98

Appendix 6- Perceptions by Outcomes
EDUCATION OUTCOMES
Nationa
lity
Perceptions Proportion of
children 3-11 years
old enrolled in
formal/nonformal
education
Proportion of
boys 3-11 years
old enrolled in
formal/nonforma
l education
Proportion of
children 12to18
years old
enrolled in
formal/nonforma
l education
Proportion of
boys 12to18
years old
enrolled in
formal/nonform
al education
Lebanese Educating children is a way to secure
financial support and economic welfare in
the future.
Pearson
Correlation
-0.008 0.000 0.075 0.021
Education is not worth the money it costs. Pearson
Correlation
-.135* -0.123 -.372** 0.061
Schooling/education investments for girls
(daughters) are not worth because women
have lower paying jobs.
Pearson
Correlation
0.019 0.030 -0.093 .126*
Schooling/education investments for girls
(daughters) are not worth because
eventually they will get married and stay
home to take care of children
Pearson
Correlation
0.011 0.018 -.165** .126*
Schooling/education investments for girls
(daughters) are not worth for securing
family’s welfare because girls get married
and leave to support husbands’ household.
Pearson
Correlation
-0.021 -0.019 -.195** 0.073
Schooling/education investments for boys
(sons) are worth because they have greater
academic abilities than girls.
Pearson
Correlation
0.033 0.027 -0.103 -0.093
Schooling/education investments for girls
(daughters) are worth because they have
greater academic abilities than boys.
Pearson
Correlation
-0.085 -0.092 -0.012 0.010
Schooling/education investments for boys
(sons) are NOT worth because it is better
for them to be engaged in workforce
instead.
Pearson
Correlation
-0.035 -0.043 -0.101 0.002

92
Child labour is an accepted and common
form of practice.
Pearson
Correlation
0.043 0.070 -.137* 0.011
Child labour is an accepted and common
form of practice if the child is above 14
years old.
Pearson
Correlation
0.001 0.020 -0.107 0.086
Child labour is a means of preparing
children to the future.
Pearson
Correlation
0.011 0.030 -.232** 0.019
Parent derives much benefits (including
financial) by engaging their children in child
labour
Pearson
Correlation
0.054 0.064 -0.113 0.059
The economic situation encourages child
labour practices.
Pearson
Correlation
0.047 0.060 -0.075 -0.082
Peer pressure increases the numbers of
children involved in child labour
Pearson
Correlation
-0.013 -0.016 -0.040 -0.068
Cultural beliefs increase the numbers of
children involved in child labour.
Pearson
Correlation
-0.062 -0.057 -0.003 -0.062
A working child makes a responsible adult. Pearson
Correlation
-0.043 -0.046 -0.079 -0.015
Child labour practices help the child to be
smart.
Pearson
Correlation
-0.007 0.010 -0.106 0.028
Involving children in paid job enhances their
life skills
Pearson
Correlation
-0.033 -0.018 -0.098 -0.026
Children gain a vocation by child labor Pearson
Correlation
-0.032 -0.018 -.147* -0.031
Not everyone gains many opportunities by
studying. It’s better to work at young age
and gain income
Pearson
Correlation
0.038 0.059 -.131* 0.020
Engaging children in paid work keeps them
out of trouble
Pearson
Correlation
0.049 0.066 -.128* -0.097
Child labour is an accepted and common
form of practice for boys.
Pearson
Correlation
0.100 0.095 -0.035 0.012
Syrian Educating children is a way to secure
financial support and economic welfare in
the future.
Pearson
Correlation
-0.012 0.027 0.056 -0.134
Education is not worth the money it costs. Pearson
Correlation
0.004 0.016 -0.099 -0.074

93
Schooling/education investments for girls
(daughters) are not worth because women
have lower paying jobs.
Pearson
Correlation
-.124* -.140* -.201** -0.046
Schooling/education investments for girls
(daughters) are not worth because
eventually they will get married and stay
home to take care of children
Pearson
Correlation
-0.096 -0.082 -.188** 0.039
Schooling/education investments for girls
(daughters) are not worth for securing
family’s welfare because girls get married
and leave to support husbands’ household.
Pearson
Correlation
-0.074 -0.082 -0.140 0.039
Schooling/education investments for boys
(sons) are worth because they have greater
academic abilities than girls.
Pearson
Correlation
-0.045 0.044 -0.089 0.061
Schooling/education investments for girls
(daughters) are worth because they have
greater academic abilities than boys.
Pearson
Correlation
0.095 0.083 0.009 0.058
Schooling/education investments for boys
(sons) are NOT worth because it is better
for them to be engaged in workforce
instead.
Pearson
Correlation
-.122* -.160* -0.111 -0.028
Child labour is an accepted and common
form of practice.
Pearson
Correlation
-.116* 0.007 -.191** -0.004
Child labour is an accepted and common
form of practice if the child is above 14
years old.
Pearson
Correlation
-.106* 0.056 -.256** -0.011
Child labour is a means of preparing
children to the future.
Pearson
Correlation
-0.063 0.041 -0.081 0.011
Parent derives much benefits (including
financial) by engaging their children in child
labour
Pearson
Correlation
-.160** 0.030 -.285** -0.178
The economic situation encourages child
labour practices.
Pearson
Correlation
-.175** -0.015 -.308** -0.131
Peer pressure increases the numbers of
children involved in child labour
Pearson
Correlation
-.136** 0.019 -.219** -0.088

94
Cultural beliefs increase the numbers of
children involved in child labour.
Pearson
Correlation
-.165** 0.064 -.398** -0.038
A working child makes a responsible adult. Pearson
Correlation
-0.010 0.065 -0.133 -0.040
Child labour practices help the child to be
smart.
Pearson
Correlation
-0.048 0.035 -0.067 -0.035
Involving children in paid job enhances their
life skills
Pearson
Correlation
-.105* 0.013 -.281** 0.007
Children gain a vocation by child labor Pearson
Correlation
-0.095 -0.043 -.161* 0.032
Not everyone gains many opportunities by
studying. It’s better to work at young age
and gain income
Pearson
Correlation
0.023 0.006 -0.080 -0.007
Engaging children in paid work keeps them
out of trouble
Pearson
Correlation
-0.029 0.062 -.144* 0.009
Child labour is an accepted and common
form of practice for boys.
Pearson
Correlation
0.018 -0.009 -0.098 -0.011
*. Correlation is significant at the 0.05 level (2-tailed).
**. Correlation is significant at the 0.01 level (2-tailed).
Negative numbers indicate negative correlations. Blue values indicate stronger correlations.
CHILD LABOUR OUTCOMES
Nationality Proportion of
children 3-11 years
old involved in
child labour
Proportion of
children 12to18
years old
involved in child
labour
Proportion of
boys 12to18
years old
involved in child
labour
Lebanese Educating children is a way to secure
financial support and economic welfare in
the future.
Pearson
Correlation
N/A (No child
Labour cases for
Lebanese 3-11
years old)
0.019 .a
Education is not worth the money it costs. Pearson
Correlation
.131* 0.293

95
Schooling/education investments for girls
(daughters) are not worth because women
have lower paying jobs.
Pearson
Correlation
.232** 0.200
Schooling/education investments for girls
(daughters) are not worth because
eventually they will get married and stay
home to take care of children
Pearson
Correlation
.205** 0.200
Schooling/education investments for girls
(daughters) are not worth for securing
family’s welfare because girls get married
and leave to support husbands’ household.
Pearson
Correlation
.165** 0.200
Schooling/education investments for boys
(sons) are worth because they have greater
academic abilities than girls.
Pearson
Correlation
0.112 0.200
Schooling/education investments for girls
(daughters) are worth because they have
greater academic abilities than boys.
Pearson
Correlation
0.110 0.200
Schooling/education investments for boys
(sons) are NOT worth because it is better
for them to be engaged in workforce
instead.
Pearson
Correlation
.333** 0.200
Child labour is an accepted and common
form of practice.
Pearson
Correlation
0.021 0.200
Child labour is an accepted and common
form of practice if the child is above 14
years old.
Pearson
Correlation
-0.014 0.200
Child labour is a means of preparing
children to the future.
Pearson
Correlation
0.048 0.293
Parent derives much benefits (including
financial) by engaging their children in child
labour
Pearson
Correlation
0.017 0.200
The economic situation encourages child
labour practices.
Pearson
Correlation
0.002 0.293
Peer pressure increases the numbers of
children involved in child labour
Pearson
Correlation
-0.063 .a

96
Cultural beliefs increase the numbers of
children involved in child labour.
Pearson
Correlation
-0.019 0.200
A working child makes a responsible adult. Pearson
Correlation
-0.022 0.200
Child labour practices help the child to be
smart.
Pearson
Correlation
-0.021 0.200
Involving children in paid job enhances their
life skills
Pearson
Correlation
-0.008 0.293
Children gain a vocation by child labor Pearson
Correlation
0.030 0.316
Not everyone gains many opportunities by
studying. It’s better to work at young age
and gain income
Pearson
Correlation
-0.030 .a
Engaging children in paid work keeps them
out of trouble
Pearson
Correlation
-0.015 0.200
Child labour is an accepted and common
form of practice for boys.
Pearson
Correlation
0.057 0.200
Syrian Educating children is a way to secure
financial support and economic welfare in
the future.
Pearson
Correlation
-0.028 0.044 0.049
Education is not worth the money it costs. Pearson
Correlation
.110* 0.009 -0.103
Schooling/education investments for girls
(daughters) are not worth because women
have lower paying jobs.
Pearson
Correlation
0.086 0.068 0.100
Schooling/education investments for girls
(daughters) are not worth because
eventually they will get married and stay
home to take care of children
Pearson
Correlation
.168** 0.037 0.191
Schooling/education investments for girls
(daughters) are not worth for securing
family’s welfare because girls get married
and leave to support husbands’ household.
Pearson
Correlation
.168** 0.021 0.164
Schooling/education investments for boys
(sons) are worth because they have greater
academic abilities than girls.
Pearson
Correlation
.116* 0.084 -0.075

97
Schooling/education investments for girls
(daughters) are worth because they have
greater academic abilities than boys.
Pearson
Correlation
-0.040 -0.018 0.127
Schooling/education investments for boys
(sons) are NOT worth because it is better
for them to be engaged in workforce
instead.
Pearson
Correlation
.116* -0.017 0.164
Child labour is an accepted and common
form of practice.
Pearson
Correlation
.226** .156* -0.166
Child labour is an accepted and common
form of practice if the child is above 14
years old.
Pearson
Correlation
.119* .192** -.317*
Child labour is a means of preparing
children to the future.
Pearson
Correlation
-0.018 0.049 0.136
Parent derives much benefits (including
financial) by engaging their children in child
labour
Pearson
Correlation
0.078 .216** -.300*
The economic situation encourages child
labour practices.
Pearson
Correlation
.122* .204** -0.233
Peer pressure increases the numbers of
children involved in child labour
Pearson
Correlation
0.040 .166* -0.196
Cultural beliefs increase the numbers of
children involved in child labour.
Pearson
Correlation
.145** .245** -.286*
A working child makes a responsible adult. Pearson
Correlation
-0.008 0.136 0.041
Child labour practices help the child to be
smart.
Pearson
Correlation
-0.037 0.066 -0.038
Involving children in paid job enhances their
life skills
Pearson
Correlation
0.035 .155* -0.187
Children gain a vocation by child labor Pearson
Correlation
-0.100 0.139 -0.148
Not everyone gains many opportunities by
studying. It’s better to work at young age
and gain income
Pearson
Correlation
-0.048 0.095 0.149
Engaging children in paid work keeps them
out of trouble
Pearson
Correlation
0.060 .143* -0.080

98
Child labour is an accepted and common
form of practice for boys.
Pearson
Correlation
-0.097 0.001 0.019
*. Correlation is significant at the 0.05 level (2-tailed).
**. Correlation is significant at the 0.01 level (2-tailed).
Negative numbers indicate negative correlations. Blue values indicate stronger correlations.
HOUSEHOLD CHORES OUTCOMES
Nationality
Proportion of
children 3-11
years old involved
in household
chores
Proportion of boys
3-11 years old
involved in
household chores
Proportion of
children 12to18
years old
involved in
household
chores
Proportion of boys
12to18 years old
involved in
household chores
Lebanese
Educating children is a way to secure
financial support and economic
welfare in the future.
Pearson
Correlation 0.021
N/A (No
Lebanese boys 3
to 11 years old
involved in
household chores)
0.031
N/A (No Lebanese
boys 12 to 18 years
old involved in
household chores)
Education is not worth the money it
costs.
Pearson
Correlation -0.031 -0.010
Schooling/education investments for
girls (daughters) are not worth
because women have lower paying
jobs.
Pearson
Correlation -0.030 -0.055
Schooling/education investments for
girls (daughters) are not worth
because eventually they will get
married and stay home to take care of
children
Pearson
Correlation -0.032 -0.065
Schooling/education investments for
girls (daughters) are not worth for
Pearson
Correlation -0.034 -0.072

99
securing family’s welfare because girls
get married and leave to support
husbands’ household.
Schooling/education investments for
boys (sons) are worth because they
have greater academic abilities than
girls.
Pearson
Correlation -0.047 0.051
Schooling/education investments for
girls (daughters) are worth because
they have greater academic abilities
than boys.
Pearson
Correlation -0.046 -0.002
Schooling/education investments for
boys (sons) are NOT worth because
it is better for them to be engaged in
workforce instead.
Pearson
Correlation -0.020 -0.006
Child labour is an accepted and
common form of practice.
Pearson
Correlation -0.029 0.018
Child labour is an accepted and
common form of practice if the child
is above 14 years old.
Pearson
Correlation -0.058 -0.074
Child labour is a means of preparing
children to the future.
Pearson
Correlation -0.059 -0.053
Parent derives much benefits
(including financial) by engaging their
children in child labour
Pearson
Correlation -0.046 -0.067
The economic situation encourages
child labour practices.
Pearson
Correlation -0.069 -0.052
Peer pressure increases the numbers
of children involved in child labour
Pearson
Correlation -0.080 -0.092
Cultural beliefs increase the numbers
of children involved in child labour.
Pearson
Correlation -0.063 -0.095
A working child makes a responsible
adult.
Pearson
Correlation -0.064 -0.086
Child labour practices help the child
to be smart.
Pearson
Correlation -0.066 -.133*

100
Involving children in paid job enhances
their life skills
Pearson
Correlation -0.089 -.129*
Children gain a vocation by child labor Pearson
Correlation -0.087 -.137*
Not everyone gains many
opportunities by studying. It’s better
to work at young age and gain income
Pearson
Correlation -0.039 -.124*
Engaging children in paid work keeps
them out of trouble
Pearson
Correlation -0.061 -0.050
Child labour is an accepted and
common form of practice for boys.
Pearson
Correlation -0.019 -0.057
Syrian
Educating children is a way to secure
financial support and economic
welfare in the future.
Pearson
Correlation -0.026 -0.010 -0.033 -0.157
Education is not worth the money it
costs.
Pearson
Correlation 0.087 0.060 -0.018 -0.069
Schooling/education investments for
girls (daughters) are not worth
because women have lower paying
jobs.
Pearson
Correlation 0.074 -0.185 -0.022 -0.103
Schooling/education investments for
girls (daughters) are not worth
because eventually they will get
married and stay home to take care of
children
Pearson
Correlation 0.060 -0.158 -0.011 -0.110
Schooling/education investments for
girls (daughters) are not worth for
securing family’s welfare because girls
get married and leave to support
husbands’ household.
Pearson
Correlation 0.090 -0.158 0.035 -0.103
Schooling/education investments for
boys (sons) are worth because they
have greater academic abilities than
girls.
Pearson
Correlation -0.069 -0.128 0.071 -0.059
Schooling/education investments for
girls (daughters) are worth because
Pearson
Correlation .155** 0.147 0.038 0.078

101
they have greater academic abilities
than boys.
Schooling/education investments for
boys (sons) are NOT worth because
it is better for them to be engaged in
workforce instead.
Pearson
Correlation .266** -0.119 0.124 -0.024
Child labour is an accepted and
common form of practice.
Pearson
Correlation -0.003 0.164 0.025 -0.033
Child labour is an accepted and
common form of practice if the child
is above 14 years old.
Pearson
Correlation 0.078 0.127 .201** 0.053
Child labour is a means of preparing
children to the future.
Pearson
Correlation 0.085 -0.214 0.033 0.030
Parent derives much benefits
(including financial) by engaging their
children in child labour
Pearson
Correlation 0.036 -0.143 .184* 0.038
The economic situation encourages
child labour practices.
Pearson
Correlation 0.053 -0.083 .226** -0.167
Peer pressure increases the numbers
of children involved in child labour
Pearson
Correlation 0.099 0.250 .186* 0.056
Cultural beliefs increase the numbers
of children involved in child labour.
Pearson
Correlation 0.000 -0.203 0.055 -0.205
A working child makes a responsible
adult.
Pearson
Correlation .163** 0.028 .227** 0.106
Child labour practices help the child
to be smart.
Pearson
Correlation .190** 0.065 0.138 0.108
Involving children in paid job enhances
their life skills
Pearson
Correlation .117* 0.176 .152* -0.010
Children gain a vocation by child labor Pearson
Correlation 0.074 -0.079 .184* 0.067
Not everyone gains many
opportunities by studying. It’s better
to work at young age and gain income
Pearson
Correlation .194** -0.006 0.136 0.150
Engaging children in paid work keeps
them out of trouble
Pearson
Correlation 0.100 -0.063 0.060 0.067
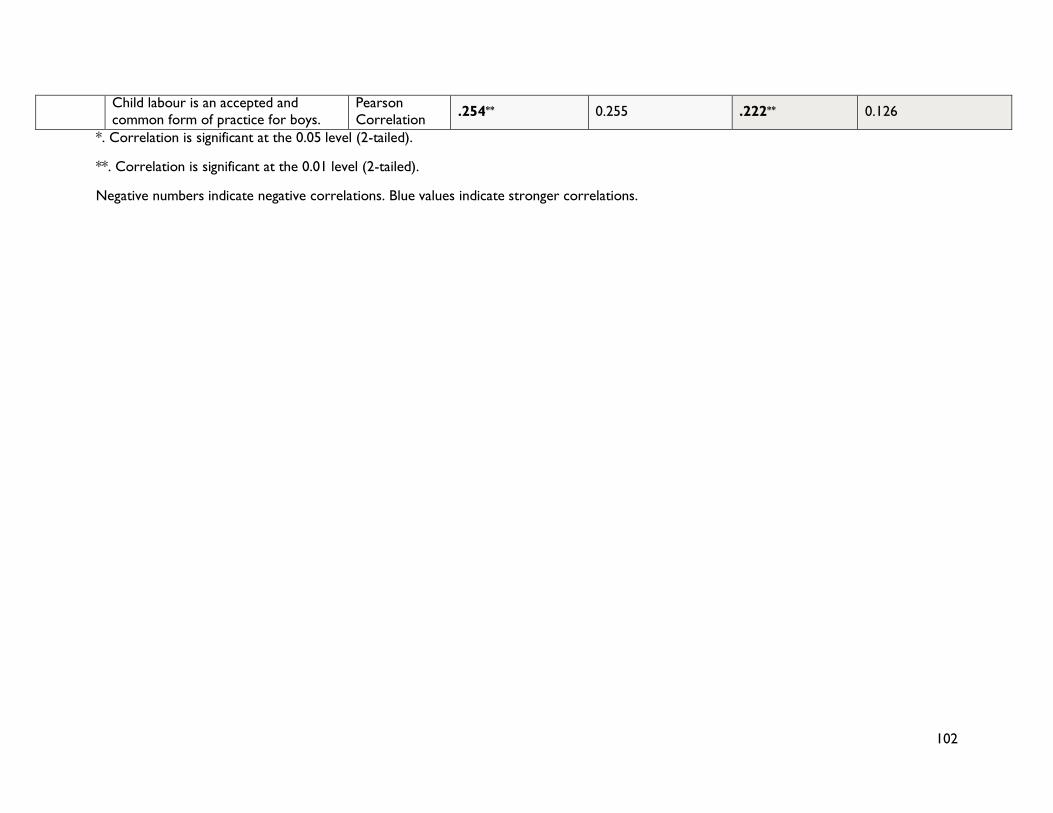
102
Child labour is an accepted and
common form of practice for boys.
Pearson
Correlation .254** 0.255 .222** 0.126
*. Correlation is significant at the 0.05 level (2-tailed).
**. Correlation is significant at the 0.01 level (2-tailed).
Negative numbers indicate negative correlations. Blue values indicate stronger correlations.