PREPARATORY ACTIVITIES Training Unit 6.1 Preparatory activities before the placement.

3-Year Average
School Grade Report Card2016
District:Grade Range: 67025Code:
Central Consolidated Schools
A
B
C
D
F
TotalPoints
Career Preparatory Alternative
Final Grade
D
Final School Grade
43.60
This SchoolStatewide C Benchmark
45.2
D
9 12-
0
25
50
75
100
Ove
rall
Po
ints
2014 2015 2016
75.0
65.0 75.0
50.0 65.0
35.0 50.0
35.0
to <
to <
to <
to <
to <0.0
100.0
1 . 6
1 2 . 5
3 . 6
6 . 0
Student Growth of Lowest Performing Students
Current Standing
Student Growth of Highest Performing Students
8
10
10
30
PossiblePointsGrade
D
F
B
B
SchoolPoints
9.65
3.75
4.54
6.97
7 . 7
Bonus Points5
College and Career ReadinessWhat percent of students are participating in college preparation or career pathway programs while in high school? What percent are meeting expectations when presented with those opportunities?
1 2 . 8
9 . 0F
F
3.21
7.67 17
15
4.00
5 . 8
School Growth
10D 3.81
Are students graduating in four years? What percent of students are graduating in 4, 5, or 6 years? And is the school improving its graduation rate over time?
Opportunity to Learn
Graduation
How did students perform in the most recent school year? What percent of students are on grade level? Did students improve more or less than expected?
Did the school as a whole improve student performance more or less than expected?
Are the highest performing students in math and reading improving more or less than expected? The highest performing students are in the top three quarters (75%) of past performance of their school.
Are the lowest performing students in math and reading improving more or less than expected? The lowest performing students are in the bottom quarter (25%) of past performance in their school.
Do parents and students believe their school is a good place to learn? Is student attendance high?
Does the school earn additional credit for reducing truancy, promoting extracurricular activities, and engaging parents and students?
New Mexico School Grading 2016

Reading (%)
95 9887
5 213
2014 2015 2016
Math (%)
94 98 99
5.6 2 1
0%
25%
50%
75%
100%
2014 2015 2016
Performance is considered on grade level when students score either Proficient or Advanced.
Reading
Math
These next pages show the school's results divided into smaller groups to show how specific classes of students are doing. The information explains how a school compares to other schools and identifies groups within the school that are performing well or that need additional instructional support based on achievement. Points that the school earned on each of the indicators are provided in more detail and when summed will equal the totals on the first page summary.
Proficient and Advanced (%)
Current Standing
Knowing how many students are proficient in a given year is a measure of the school’s overall success. Single-year performance will vary with differing classes of students. Therefore, Current Standing uses up to 3 years of data to provide a more accurate picture of the school's achievement. Current Standing is augmented with Value-Added Modeling (VAM) by capturing the school's size, student mobility, and prior student performance. Details of VAM can be found in the PED's School Grading Technical Guide at http://webapp2.ped.state.nm.us/SchoolData/SchoolGrading.aspx.
Proficient and Advanced (Pts)
Proficient and Advanced (%)
Proficient and Advanced (Pts)
13.0 17.0 8.9 - - - - 13.0 - <2.0 13.2
0.98
<2.0 <2.0 <2.0 - - - - <2.0 - <2.0<2.0
0.00
AllStudents
AfrAmerWhite Hisp
AmIndian
EnglishLanguageLearners
Studentswith
DisabilitiesEconomically
DisadvantagedAsianMF
Gender Race / Ethnicity
Value-Added Model (Pts) 4.84
Value-Added Model (Pts) 3.83
Details of Each Grade Indicator
3-Year Summary
Proficient
Not Proficient
Page 2 of 6 Career Preparatory AlternativeNew Mexico School Grading 2016

ReadingValue-Added Score
School Growth
Points Earned
Math
-0.370
1.77
-0.260
1.99
School growth is expressed as a score that can be both negative and positive. When it is positive, the school performed better than was expected relative to its peers with the same size, mobility, and prior student performance.
School growth compares the students enrolled in the current year to the same students from prior years. Unlike Current Standing, School Growth accounts for improvement of all students, not just those reaching proficiency.
Growth in proficiency is calculated with Value-Added Modeling (VAM), which accounts for the school's size, student mobility, and prior student performance. Details of VAM can be found in the PED's School Grading Technical Guide at http://webapp2.ped.state.nm.us/SchoolData/SchoolGrading.aspx.
Reading Growth
Math Growth
Highest 75% (VAS)
Lowest 25% (VAS)
Highest 75% (Pts)
Lowest 25% (Pts)
Highest 75% (VAS)
Lowest 25% (VAS)
Highest 75% (Pts)
Lowest 25% (Pts)
AfricanAmericanWhite Hispanic
AmIndian
EnglishLanguageLearners
Studentswith
DisabilitiesEcon
DisadvAsianMaleFemale
-0.26 - - 1.09 - -0.28 -0.26 -0.64 -.8-0.26
-0.46 - - - - -0.37 -0.37 -0.09 -0.22-0.33
-.2 - - -.5 - -.1 -.2 .3 -.7 -.1
.3 - - - - .0 .0 -.2 .3 -.2
-.5
-.1
-0.10
-.1
School Overall
1.48
2.27
2.29
2.25
Student Growth
Just like schools, individual student achievement is expected to improve over time. Student growth is shown as a value-added score (VAS) that accounts for all students in each group for up to 3 years. Student groups are further divided into highest and lowest performing subgroups. Every student's prior test scores are used to estimate how they should perform today. • Above 0 means that the group, in general, scored higher than expected. This is an exciting finding when students are below the proficiency line, because they are closing the achievement gap and catching up to their higher-performing classmates. • Near 0 means that the group scored about as expected compared to their academic peers. While some students may have performed better than anticipated (positive growth), they were balanced by students that did poorer (negative growth). • Below 0 means that the group performed below expectations and students are losing ground when compared to their peers.Details of student growth and value added scores are explained in PED's School Grading Technical Guide athttp://webapp2.ped.state.nm.us/SchoolData/SchoolGrading.aspx. Note that separate analytic techniques are used for the school overall and for the subgroups.
Subgroup Analysis
Page 3 of 6 Career Preparatory AlternativeNew Mexico School Grading 2016
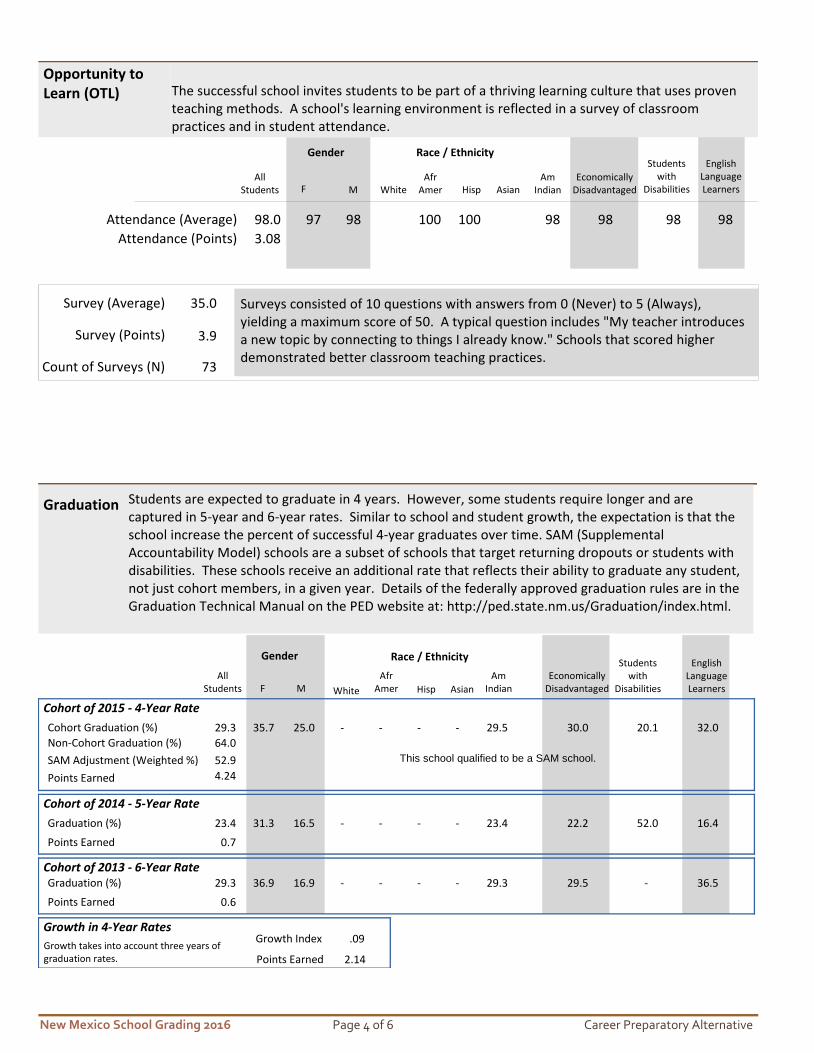
Opportunity to Learn (OTL) The successful school invites students to be part of a thriving learning culture that uses proven
teaching methods. A school's learning environment is reflected in a survey of classroom practices and in student attendance.
Survey (Average)
Survey (Points)
AllStudents
AfrAmerWhite Hisp
AmIndian
EnglishLanguageLearners
Studentswith
DisabilitiesEconomically
DisadvantagedAsianMF
Gender Race / Ethnicity
35.0
3.9
Attendance (Average)
Attendance (Points)
98.0 97 98 100 100 98 98 98 98
3.08
Surveys consisted of 10 questions with answers from 0 (Never) to 5 (Always), yielding a maximum score of 50. A typical question includes "My teacher introduces a new topic by connecting to things I already know." Schools that scored higher demonstrated better classroom teaching practices.
Count of Surveys (N) 73
Cohort of 2014 - 5-Year Rate
Cohort of 2013 - 6-Year Rate
Cohort of 2015 - 4-Year Rate
Growth in 4-Year Rates
Graduation Students are expected to graduate in 4 years. However, some students require longer and are captured in 5-year and 6-year rates. Similar to school and student growth, the expectation is that the school increase the percent of successful 4-year graduates over time. SAM (Supplemental Accountability Model) schools are a subset of schools that target returning dropouts or students with disabilities. These schools receive an additional rate that reflects their ability to graduate any student, not just cohort members, in a given year. Details of the federally approved graduation rules are in the Graduation Technical Manual on the PED website at: http://ped.state.nm.us/Graduation/index.html.
Cohort Graduation (%)
Growth Index
Points Earned
Points Earned
29.3 35.7 25.0 - - - - 30.0 20.1 32.0 29.5
64.0
23.4 31.3 16.5 - - - - 22.2 52.0 16.4 23.4
0.7
29.3 36.9 16.9 - - - - 29.5 - 36.5 29.3
0.6
.09
2.14
AllStudents
AfrAmerWhite Hisp
AmIndian
EnglishLanguageLearners
Studentswith
DisabilitiesEconomically
DisadvantagedAsianMF
Gender Race / Ethnicity
Graduation (%)
Points Earned
Graduation (%)
Points Earned
Growth takes into account three years of graduation rates.
Non-Cohort Graduation (%)
4.24
SAM Adjustment (Weighted %) 52.9 This school qualified to be a SAM school.
Page 4 of 6 Career Preparatory AlternativeNew Mexico School Grading 2016

Bonus Points
While most schools provide a sampling of athletics, club participation opportunities, and parent meetings, a few schools stand out among the rest. These schools are recognized for their extraordinary dedication to keeping students invested in school and their efforts in empowering parents to engage actively in their child's education.
Student and Parent Engagement Truancy Improvement
Extracurricular Activities Other
Schools must include all of their enrolled students in the annual statewide assessment. If the percentage of students is less than 95%, the school's letter grade is reduced by one grade. Supplemental Accountability Model (SAM) schools and small schools with fewer than 100 students receive special consideration.
87Reading (%)
71Math (%)
Participation
School exempted from penalty
because of SAM status.
Participation (% of Cohort)
Success (% of Participants)
Participation (Pts)
Success (Pts)
39.3 53.4 30.0 <2.0 - - - 40.2 10.1 47.4 39.6
1.96
12.5 15.7 8.7 - - - - 12.5 <2.0 14.7 12.5
1.25
ACT
AccuPlacer
Advanced Placement
SAT
PLAN
PSAT
5.4 9.4 2.8 <2.0 - - - 5.6 10.1 7.7 5.5
12.1
<2.0 <2.0 <2.0 <2.0 - - - <2.0 <2.0 <2.0<2.0
17.5
18.4 16.3 19.8 <2.0 - - - 18.9 10.1 19.3 18.6
<2.0 <2.0 <2.0 <2.0 - - - <2.0 <2.0 <2.0<2.0
Dual Credit
Career Technical Education
International Baccalaureate
5.0 8.4 2.8 <2.0 - - - 5.1 10.1 7.1 5.1
<2.0
<2.0 <2.0 <2.0 <2.0 - - - <2.0 <2.0 <2.0<2.0
21.9 5.6 <2.0 - - - 12.4 <2.0 14.7 12.2
25.2 12.3 <2.0 - - - 17.9 <2.0 19.1 17.6
<2.0 <2.0 <2.0 - - - <2.0 <2.0 <2.0<2.0
College and Career Readiness (CCR)
High school students are expected to participate in at least one college or career readiness program. These activities include one of the following: 1) College entrance assessments (SAT, SAT Subject Test, PSAT, ACT, PLAN, Compass, ACT Aspire, or Accuplacer) 2) Evidence that the student can pass a college-level course (Advanced Placement, Dual Credit, or IB) 3) Eligibility for an industry recognized certification (Career Technical Education, SAM School Supplemental)Points are given separately for students' participation and for their success. To be considered successful, students must meet established benchmarks. Details are in the School Grading Technical Guide on the PED website at http://webapp2.ped.state.nm.us/SchoolData/SchoolGrading.aspx.
CCR follows the Shared Accountability model used for cohort graduation rates. Cohorts are fully described in the Graduation Technical Manual on the PED website at http://ped.state.nm.us/Graduation/index.html.
AllStudents
AfrAmerWhite Hisp
AmIndian
EnglishLanguageLearners
Studentswith
DisabilitiesEconomically
DisadvantagedAsianMF
Gender Race / Ethnicity
Compass <2.0 <2.0 <2.0 <2.0 - - - <2.0 <2.0 <2.0<2.0
SAM School Supplemental <2.0 <2.0 <2.0 <2.0 - - - <2.0 <2.0 <2.0<2.0
SAT Subject Test <2.0 <2.0 <2.0 <2.0 - - - <2.0 <2.0 <2.0<2.0
50% or Higher
20% -50%
Below 20%
Percent of School's Cohort of 2015 Participating in Each CCR Opportunity ASPIRE <2.0 <2.0 <2.0 <2.0 - - - <2.0 <2.0 <2.0<2.0
Page 5 of 6 Career Preparatory AlternativeNew Mexico School Grading 2016

5
4
3
2
1
End Notes
The Statewide C grade was established in the first year of A-F School Grading as the midpoint of all schools. It was fixed in 2011 as the framework for all future letter grades and is not recalculated each year.For high schools that do not have members of 4-year, 5-year, or 6-year graduation cohorts, the scale is abbreviated, and letter grades are adjusted to account for the school's remaining non-cohort indicators or non-cohort years.A dash is substituted where a school has too few students (N<10) to meet confidentiality requirements for reporting.Feeder schools are schools that do not have students in tested grades 3-11. Schools that administered tests on computers received bonus credit based on the number of students participating.
Note for Families: If your child is enrolled in a school that has earned two "F" grades in the last four years, New Mexico state law allows you to transfer your child to a school with a higher school grade. Please call (505) 827-6909 to learn more. For information about other schools in your community and their grading history, please see the school grading web page at http://aae.ped.state.nm.us/.
Ranks High Ranks Mid Ranks Low
Current Standing 17 17 1717 17
Similar Schools
While statewide comparisons are helpful, schools may want to see how they rank next to their peers that have similar students and settings. The figures below show how this school contrasts with other schools in the state that are most like it in student characteristics.
School Growth 16 16 1616 16
Student Growth, Lowest 25% 22 22 2222 22
Opportunity to Learn 21 21 2121 21
ELL SWD Ethnicity ED Mobility
Student Growth, Highest 75% 15 15 1515 15
Schools are grouped into categories that have similar proportions of English language learners (ELL), students with disabilities (SWD), ethnicities, economically disadvantaged (ED), and mobile students. Different schools are in each category set. A composite score incorporates all categories into a general measure of at-risk students.
17
16
22
21
Composite
15
School Rank
36
36
36
36
36
36
36
36
36
36
36
36
36
36
36
36
36
36
36
36
36
36
36
36
36
36
36
36
36
36
Supplemental Information
( )
( )
( )
( )
( )
Students (% Tested) 23.7 100.0 53.17.7 100.0
Graduation 14 14 1414 14 1436 36 36363636
College and Career Readiness 32 32 3232 32 3236 36 36363636
( )
( )
( )
( )
( )
( )
( )
( )
( )
( )
( )
( )
( )
( )
( )
( )
( )
( )
( )
( )
( )
( )
( )
( )
( )
( )
( )
( )
( )
( )
( )
( )
( )
( )
( )
( )
( )
Rank Total Rank Total Rank Total Rank Total Rank Total Rank Total
13.0 - - - 13.2 13.0 - <2.0 17.0 8.9
School History
Student performance over time can demonstrate the success of interventions and school reform. Students who score proficient or higher are considered to be performing at grade level. For a more detailed history, see the PED website: http://www.ped.state.nm.us/AssessmentAccountability/AcademicGrowth/NMSBA.html.
<2.0
Reading Proficiency
Math Proficiency
<2.0 <2.0 <2.0 2.9 <2.0
5.6 - 5.9 - 6.3 5.9 5.3
<2.0
-
- - - 5.6
AllStudents
AfrAmerWhite Hisp
AmIndian
EnglishLanguageLearners
Studentswith
DisabilitiesEconomically
DisadvantagedAsianMF
Gender Race / Ethnicity
5.6 5.3 - - - 5.3 - <2.0<2.0 10.0 -
<2.0 <2.0 <2.0 <2.0<2.0 <2.0 <2.0
<2.0 - <2.0 - <2.0<2.0 <2.0 - - - <2.02016 (%)
2015 (%)
2014 (%)
2016 (%)
2015 (%)
2014 (%)
Page 6 of 6 Career Preparatory AlternativeNew Mexico School Grading 2016