Cardno Limited Half Year Results December 2009 Library/MediaCentre/ASXAnnouncements2010/3… ·...
19
Cardno Limited Half Year Results December 2009 Presented by: Andrew Buckley – Managing Director Jeff Forbes – Chief Financial Officer
Transcript of Cardno Limited Half Year Results December 2009 Library/MediaCentre/ASXAnnouncements2010/3… ·...

Cardno Limited Half Year Results December 2009
Presented by:
Andrew Buckley – Managing Director
Jeff Forbes – Chief Financial Officer

2
Financial Half Year Highlights December 2009
Profit
Gross Revenue for the December 2009 half year was $228.6m
EBITDA for the half year was $25.0m
Net Profit after tax was $16.05m – which was down on the PCP but up on
the June 2009 half year.
Strong operating cash flow of $17.02 m was an increase on the PCP.
Cash on hand at 31 December was $64.03m
Net debt was $13.2m – net debt to equity 5.0%
Earnings per share (basic) was 18.97 cents
Half year dividend of 14 cents payable 26 March, record date 12 March.
Number of people around 2900
Cardno acquired the ITC Group in January (building services consulting
engineering firm) adding further diversification and cross selling
opportunities with strong growth potential.

6 Year Performance History
3
0
50
100
150
200
250
300
350
400
450
500
550
2004 2005 2006 2007 2008 2009 HY 2010
GROUP REVENUE
A$
mil
lio
ns
0
5
10
15
20
25
30
35
2004 2005 2006 2007 2008 2009 HY 2010
NET PROFIT AFTER TAX
A$
Mil
lio
ns

6 Year Performance History
4
0
10
20
30
40
50
2004 2005 2006 2007 2008 2009 HY 2010
EARNINGS PER SHARE (Diluted)
A$
Cen
ts p
er
sh
are
0
5
10
15
20
25
30
35
40
2004 2005 2006 2007 2008 2009 HY 2010
OPERATING CASH FLOW
A$
Mil
lio
ns

Inte
rnat
ion
al D
eve
lop
me
nt
Ass
ista
nce • SOCIAL INFRASTRUCTURE
• Law & Justice
• Health
• Governance
• Education
• Rural Development
• Natural Resource Management
• Institutional Strengthening
• HIV/AIDS
• Post Conflict
• Finance & Economics
• Public Sector Services
• PHYSICAL INFRASTRUCTURE
• Roads & Bridges
• Water & Wastewater
• Environmental
Pu
blic
Se
cto
r In
fras
tru
ctu
re • Roads & Bridges
• Building & Property
• Building Services Engineering
• Coastal, Ocean & Marine
• Environmental & Water Quality
• Management Services
• Traffic & Transport
• Water & Wastewater
• Geotechnical
• Planning, G.I.S.
• Landscape Architecture
• Construction Materials Testing
• Water Engineering Software
• Survey
• Subsurface Utility Engineering
Pri
vate
Se
cto
r In
fras
tru
ctu
re
• Building & Property
• Building Services Engineering
• Coastal, Ocean & Marine
• Environmental & Water Quality
• Urban Development
• Traffic & Transport
• Water & Wastewater
• Geotechnical
• Planning, G.I.S.
• Landscape Architecture
• Resources Structures
• Construction Materials Testing
• Water Engineering Software
• Survey
• Subsurface Utility Engineering
Core Business
5

6
Global Presence6

Projects
Interstate I-4 Connector Project, Florida
7
Logan Water Alliance, Queensland
Desalination Plants, QLD, NSW, & VIC
School Reconstruction Project, West Java and West
Sumatra
University of New South Wales

8
Merger & Acquisition Strategy
Growth and Diversification Objective
• Complementary businesses with new geographical and/or skills coverage and good cultural fit
• Minimal overlap with existing businesses
• Focus on retention of staff
• Effective acquisition process with robust due diligence
• Focus on adding value through cross selling or organic growth
Continuous Integration of New Partners
• Brand Integration
• Accounting and job cost integration
• Focus on knowledge sharing and cross sell
• Successful track record
Cardno’s Merger and Acquisition Strategy works

Merger/Acquisition HistoryRecord of successful mergers and acquisitions
9
Merger/Acquisition HistoryRecord of successful mergers and acquisitions

10
Cardno acquired Australia based ITC Group on 1 January 2010.
Cardno ITC is a 100 person electrical, mechanical and specialist engineering group providing services for the building sector.
Cardno ITC capability includes expertise in electrical; mechanical; fire; hydraulics; sustainability; facilitysolutions; audio/visual; asset auditing; security; vertical transportation; lighting; acoustic; telecommunications and environmental auditing.
Revenue is primarily generated from the government, residential and corporateinfrastructure market.
Cardno ITC provides professional engineering, sustainability and facility services to deliver complete and innovative solutions including all Building, Tenancy, Infrastructure and Technology Environments.
The group has offices in Sydney, Brisbane, Melbourne, Canberra and Perth.
Cardno ITC is a dynamic growing company and with significant cross selling opportunities we expect it to grow substantially over the next few years.
Cardno ITC
Acquisitions

Merger & Acquisition Strategy
11
• Pipeline is strong, prices are stable
• Cardno ITC acquisition shows Cardno is back in the market and following the stated strategy.
• Further Australian discipline capability remains a focus.
• Resources and mechanical/electrical exposure still sought.
• North American infrastructure and environment markets are also important to Cardno.
• Development Assistance opportunities are also sought, especially physical infrastructure.
Future Merger & Acquisition Outlook

12
Capital Management
• Strong Balance Sheet
- Net debt is low at $13.2m
- Net Debt to Equity is 5.0%
- Cash at 31 December 2009 $64.03m
- Acquisition of Cardno ITC still leaves cash for further opportunities.
• Strong Cash Flow
- Cash flow up to $17.02m (c.t. $16.7 m for pcp)
- Strong cash flow management during difficult economic conditions.
Capital Management

13
Half Year 2009/10 Results - ComparisonHalf Year Dec 09
A$’000Half Year June 09
A$’000% Growth
Dec 09 vs Jun 09Half Year Dec
08 A$’000
Total Revenue 228,621 250,285 (8.7%) 265,557
Less Recoverables & Other 57,677 55,452 (4.0%) 70,929
Fee Revenue 170,944 194,833 (12.3%) 194,628
EBITDA 25,038 24,676 1.5% 33,056
EBIT 20,618 18,949 8.9% 27,726
Net profit before tax 19,183 18,271 5.0% 23,821
Net profit after tax 16,051 15,897 1.0% 18,256
Earnings per Share – basic 18.97 cents 20.13 cents (5.8%) 24.17 cents
Earnings per Share – diluted 18.86 cents 19.93 cents (5.4%) 24.16 cents
Dividend per Share (cents) 14.00 cents 14.00 cents 14.00 cents

14
December 2009 Balance Sheet
Note 1: The Current Ratio is Current Assets ÷ Current Liabilities
Note 2: The Gearing Ratio is Long Term Liabilities ÷ (Shareholders Equity + Long Term Liabilities)
Note 3: The Debt to Equity Ratio is Total Debt ($85m) ÷ Shareholders Equity
Total Current Assets
Total Non-Current Assets
TOTAL ASSETS
Total Current Liabilities
Total Non-Current Liabilities
TOTAL LIABILITIES
NET ASSETS
December 2009A$’000
207,826
242,659
450,485
109,601
74,945
184,546
265,939
FINANCIAL RATIOS
Current Ratio1
Gearing Ratio2
Debt to Equity Ratio3
1.90
0.22
29.0%
June 2009A$’000
219,093
253,631
472,724
123,109
83,694
206,803
265,921
1.78
0.26
32.0%
15
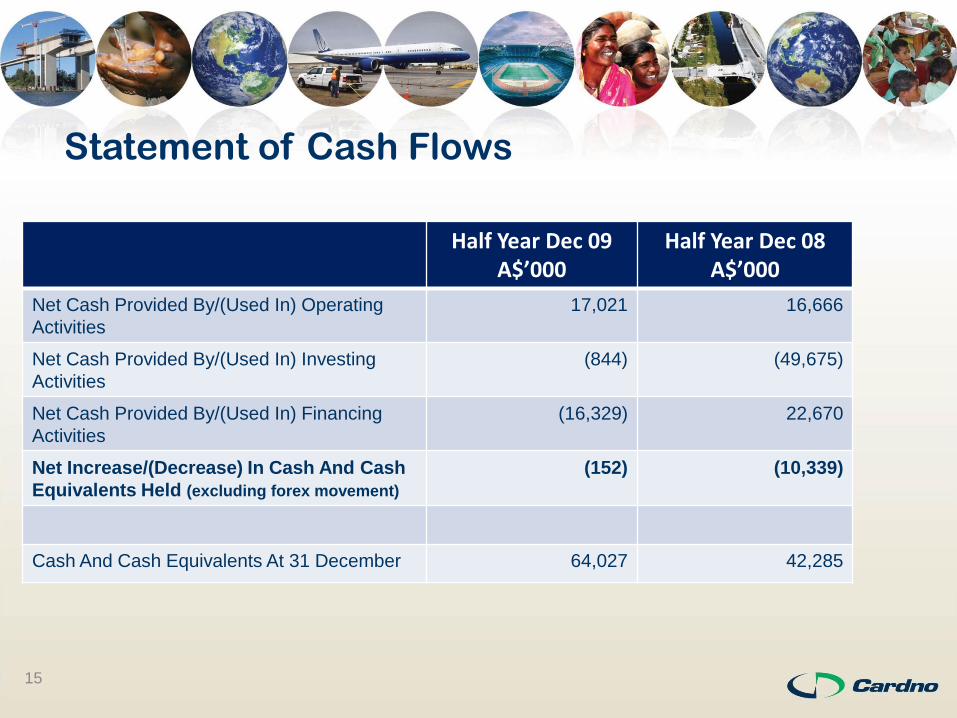
Statement of Cash Flows
Half Year Dec 09A$’000
Half Year Dec 08A$’000
Net Cash Provided By/(Used In) Operating
Activities
17,021 16,666
Net Cash Provided By/(Used In) Investing
Activities
(844) (49,675)
Net Cash Provided By/(Used In) Financing
Activities
(16,329) 22,670
Net Increase/(Decrease) In Cash And Cash
Equivalents Held (excluding forex movement)
(152) (10,339)
Cash And Cash Equivalents At 31 December 64,027 42,285

16
Operating Segments
December 2009 Half Year
Australia
& NZ
A$’000
North
America A$’000
International
Development
Assistance
A$’000
Revenue
Fee Revenue
Recoverables & Other
100,530
5,478
31,026
17,189
39,679
33,945
Total Revenue 106,008 48,215 73,624
Segment Result 15,917 2,223 2,140
Segment Margins(% Fee Revenue)
15.8% 7.2% 5.4%

17
• Public Infrastructure spending remains healthy
• International Development Assistance markets are strong but
project timing has affected half year
• Private sector expenditure shows growth in most regions
• Opportunities to grow both by acquisition and organically
• Merger & Acquisition opportunities in Australia, N.Z. and U.S. are under active consideration
• Cardno is well placed with cash and low gearing
Future Outlook
18
• A leading Australian and International infrastructure services company operating over 60 years
• Strong track record of delivering growth and shareholder value, 25% CAGR on EPS growth
• Diversification both geographically and by disciplines has allowed Cardno to “weather” downturn well
• Well positioned to reap benefits of strengthening world economy
• Global infrastructure markets and International Development Assistance opportunities are strong
• Strong balance sheet and cash will enable Cardno to continue to pursue acquisition strategy globally
Conclusion
18

“Cardno’s vision is to be a world leader in
the provision of professional services to
improve the physical and social
environment.”
19