Cardno 2014 Sediment Modelling Report - Tidal Energy Australia C_Cardno 2014 Sediment... ·...
40
AECOM Derby Tidal Power Project Environmental Impact Statement – Derby Tidal Power Station - 2010/5544 C Appendix C Cardno 2014 Sediment Modelling Report
Transcript of Cardno 2014 Sediment Modelling Report - Tidal Energy Australia C_Cardno 2014 Sediment... ·...

AECOM Derby Tidal Power Project Environmental Impact Statement – Derby Tidal Power Station - 2010/5544
\\auper1fp001\environment\60212828 - Derby Tidal Env Serv\6 Draft Docs\6.1 Reports\EIS\60212828-Rep-Environmental Impact Statement-Rev1_20140401.docx Revision 1 – 01-Apr-2014 Prepared for – Tidal Energy Australia – ABN: 76067829145
C
Appendix C
Cardno 2014 Sediment Modelling Report

AECOM Derby Tidal Power Project Environmental Impact Statement – Derby Tidal Power Station - 2010/5544
\\auper1fp001\environment\60212828 - Derby Tidal Env Serv\6 Draft Docs\6.1 Reports\EIS\60212828-Rep-Environmental Impact Statement-Rev1_20140401.docx Revision 1 – 01-Apr-2014 Prepared for – Tidal Energy Australia – ABN: 76067829145
D
This page has been left blank intentionally.

Proposed Derby Tidal Power Station -
Preliminary Hydrodynamic and Sediment
Transport Modelling
Version 3 - Final Report
Prepared for Tidal Energy Australia
March 2014
Project Number: LJ15013/Rep1021pv3

Derby Tidal Power Station – Preliminary Hydrodynamic and Sediment Transport Modelling Prepared for Tidal Energy Australia
7 March 2014 Cardno (WA) Pty Ltd i
Rep1021v3-DerbyTidalPowerStation-Hydrodynamic and Sedimenttransport modelling FINAL.docx
Cardno (WA) Pty Ltd ABN 95 001 145 035
11 Harvest Terrace
West Perth WA 6005
Telephone: 08 9273 3888
Facsimile: 08 9486 8664
International: +61 8 9273 3888
www.cardno.com.au
Document Control Version Date Author Reviewers
1 - Draft 21 December 2010
David Taylor DT David van Senden
Jo Buckee
DvS
JB
2 – Client Review
7 March 2014 Paul Branson PMB Joanna Garcia-Webb
Doug Treloar
JGW
PDT
3 – FINAL 10 March Paul Branson PMB Joanna Garcia-Webb JGW
Filename Z:\Jobs\LJ15013-DerbyTidalPower\Final Report
Printed on 100% Australian Recycled Paper
›
"© 2014 Cardno (WA) Pty Ltd All Rights Reserved. Copyright in the whole and every part of this document belongs to Cardno (WA) Pty Ltd and may not be used, sold, transferred, copied or reproduced in whole or in part in any manner or form or in or on any media to any person without the prior written consent of Cardno (WA) Pty Ltd.”

Derby Tidal Power Station – Preliminary Hydrodynamic and Sediment Transport Modelling Prepared for Tidal Energy Australia
7 March 2014 Cardno (WA) Pty Ltd iii
Rep1021v3-DerbyTidalPowerStation-Hydrodynamic and Sedimenttransport modelling FINAL.docx
Table of Contents 1 Introduction ................................................................................................................................... 1
1.1 Datums and Conventions ........................................................................................................ 1
2 Scope of Works ............................................................................................................................. 2
3 Data ................................................................................................................................................. 3
3.1 Design Layouts........................................................................................................................ 3
3.2 Water Level ............................................................................................................................. 3
3.3 Power Station Outputs ............................................................................................................ 3
3.4 Bathymetric Data ..................................................................................................................... 3
3.5 Sediment Data......................................................................................................................... 3
4 Model System ................................................................................................................................ 4
4.1 Hydrodynamic Model .............................................................................................................. 4
4.1.1 Hydrodynamic Numerical Scheme .................................................................................. 4
4.1.2 Wetting and Drying of Intertidal Flats .............................................................................. 5
4.1.3 Conservation of Mass ..................................................................................................... 5
4.2 Sediment Transport Model ...................................................................................................... 5
5 Model Set-up .................................................................................................................................. 7
6 Model Simulations ........................................................................................................................ 9
6.1 Hydrodynamics........................................................................................................................ 9
6.2 Morphological Simulations .................................................................................................... 10
6.3 Siltation Investigations .......................................................................................................... 10
7 Extended Morphological Simulations ....................................................................................... 12
7.1 Model Set-up ......................................................................................................................... 12
7.2 Results .................................................................................................................................. 12
7.2.1 Scenario 1 - Depth to Bedrock 5 m ............................................................................... 12
7.2.2 Scenario 2 – Depth to Bedrock 50 m ............................................................................ 13
8 Conclusions ................................................................................................................................. 14
9 References ................................................................................................................................... 16

Derby Tidal Power Station – Preliminary Hydrodynamic and Sediment Transport Modelling Prepared for Tidal Energy Australia
7 March 2014 Cardno (WA) Pty Ltd iv
Rep1021v3-DerbyTidalPowerStation-Hydrodynamic and Sedimenttransport modelling FINAL.docx
List of Tables Table 6.1: Modelled Sediment Fall Velocity Cases for the Siltation Modelling Cases.......................... 11
List of Figures Figure 1.1: Locality Plan
Figure 5.1: Model Bathymetry and Model Set-up
Figure 5.2: Sequence of Inflow and Outlet Gate Operation- Model Simulation Period
Figure 6.1: Modelled Water Levels Existing and Developed Layout Cases
Figure 6.2: Modelled Water Level Gradient in High Water Lake
Figure 6.3: Modelled Water Level, Current and Discharge
Figure 6.4: Simulated Morphological Change over 1st Year
Figure 6.5: Simulated Post 1-Year Entrance Channel Profile
Figure 6.6: Simulated Annual Sedimentation
Figure 7.1: Cumulative Erosion and Sedimentation – Scenario 1
Figure 7.2: Final Bed Level – Scenario 1
Figure 7.3: Cumulative Erosion and Sedimentation – Scenario 2
Figure 7.4: Final Bed Level – Scenario 2
Appendices Appendix A Design Layouts of the Power Station Structures

Derby Tidal Power Station – Preliminary Hydrodynamic and Sediment Transport Modelling Prepared for Tidal Energy Australia
7 March 2014 Cardno (WA) Pty Ltd 1
Rep1021v3-DerbyTidalPowerStation-Hydrodynamic and Sedimenttransport modelling FINAL.docx
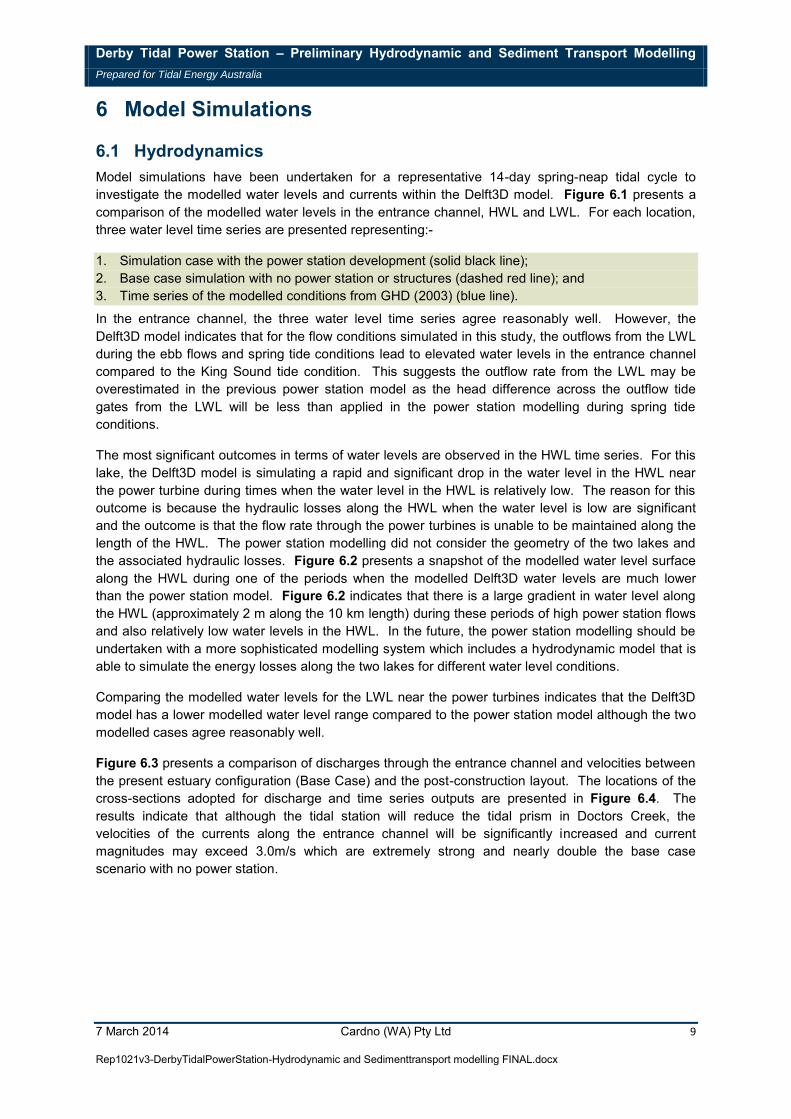
1 Introduction Cardno has been engaged by Tidal Energy Australia to develop a preliminary hydrodynamic and sediment transport model of the proposed Derby tidal power station development in King Sound in Western Australia. Tidal Energy Australia is proposing to construct a tidal power station facility at Doctors Creek north of Derby that would supply power to north-west Western Australia. The concept design features the construction of bunds surrounding the Doctors Creek estuary and the installation of tidal gates and power turbines which will connect two lakes with King Sound. The operating regime will result in a High Water Lake (HWL) and a Low Water Lake (LWL) which will assist to provide a more uniform power output from the facility. Appendix A presents a plan view of the concept which has been investigated in this study. Figure 1.1 presents a locality plan of the study area.
The purpose of this study was to develop a hydrodynamic and sediment transport model to undertake preliminary investigations into impacts of the tidal power station on the hydrodynamic processes in the surrounding environment, the potential impacts on the surrounding seabed morphology due to changes in flow conditions near the entrance to Doctors Creek, and to consider the potential for sedimentation in the lakes created by the development.
1.1 Datums and Conventions The following section summarises datums and conventions that have been adopted in this study.
Time information is normally presented as Western Standard Time (WST, +8 hours UTC). Vertical datum in this report is normally reported as Australian Height Datum (AHD).
Normal direction conventions have been adopted, that is:-
Winds and waves – coming from; and Currents – flowing towards.

Derby Tidal Power Station – Preliminary Hydrodynamic and Sediment Transport Modelling Prepared for Tidal Energy Australia
7 March 2014 Cardno (WA) Pty Ltd 2
Rep1021v3-DerbyTidalPowerStation-Hydrodynamic and Sedimenttransport modelling FINAL.docx
2 Scope of Works Cardno prepared a scope of work in conjunction with Tidal Energy Australia. The scope is summarised below.
Develop a Delft3D hydrodynamic model which extends perhaps up to 10km into King Sound. The model would be forced with a water level times series based on the tidal conditions applied in the power station modelling which has already been completed (GHD,2003). Model bathymetry would be developed from available navigation charts (AUS45), and digitised survey data of the seabed near the proposed power station site.
Undertake hydrodynamic modelling to investigate changes in currents and water flows due to the development. This would be based on a simulation of currents over a large spring-neap tidal cycle.
Utilise available sediment data (Coffey, 2002) and also relevant literature to develop a description of the seabed for the sediment transport model and also potential suspended sediment concentrations particularly during the wet season.
Undertake sediment transport and morphological simulations using the Delft3D model. Simulations would be undertaken for representative seasonal conditions and estimates of morphological changes over the course of a 1-year period will be interpreted from the model results.
Report outcomes in a report including details of the model set-up, assumptions, results and discussion that will include an assessment of recommended future investigations.
In February 2014, Cardno was commissioned to further investigate the morphological changes along the entrance channel and adjacent area of King Sound. The requirement of this additional scope was to investigate the equilibrium structure of the entrance channel morphological changes. The model configuration, results and conclusions for this additional scope are presented as in Section 7.

Derby Tidal Power Station – Preliminary Hydrodynamic and Sediment Transport Modelling Prepared for Tidal Energy Australia
7 March 2014 Cardno (WA) Pty Ltd 3
Rep1021v3-DerbyTidalPowerStation-Hydrodynamic and Sedimenttransport modelling FINAL.docx
3 Data A summary of the key study data sets applied in this study are presented in the following sections.
3.1 Design Layouts
Tidal Energy Australia supplied Cardno with plan view drawings of the proposed development including the extent of the bund and also details on the tidal gates and power turbines. Appendix A presents plan drawings of the development proposal.
3.2 Water Level
Predicted water level data for King Sound was obtained from the previous modelling report (GHD, 2003). The predicted water level corresponded with the simulated period of operation of the power station.
3.3 Power Station Outputs Tidal Energy Australia provided Cardno with output and a report from a study undertaken by GHD (GHD, 2003) to model the power output and flows for the power station development. For this particular study, the client specified that Cardno undertake simulations using water level and flow outputs from power station Scenario 327 (GHD, 2003).
3.4 Bathymetric Data The model bathymetry was developed from a number of data sets including:-
1. Bathymetric survey of Doctors Creek as presented in Coffey (2002). The hydrographic survey was prepared by Whelan’s Pty Ltd (Plan: FP-44946-D04, 18/6/1998).
2. Hydrographic Chart AUS 45 of King Sound prepared by the Australian Hydrographic office. 3. Design seabed levels presented on design plans for the tidal power station – see Appendix A.
3.5 Sediment Data Information on seabed sediments at the study site was obtained from a geotechnical investigation of the entrance region for Doctors Creek presented in Coffey (2002).

Derby Tidal Power Station – Preliminary Hydrodynamic and Sediment Transport Modelling Prepared for Tidal Energy Australia
7 March 2014 Cardno (WA) Pty Ltd 4
Rep1021v3-DerbyTidalPowerStation-Hydrodynamic and Sedimenttransport modelling FINAL.docx
4 Model System
4.1 Hydrodynamic Model For the purposes of this study, Cardno have utilised the Delft3D model system. Delft3D is developed by Deltares in The Netherlands and is recognised as a leading hydrodynamic, sediment transport and water quality modelling system worldwide.
Delft3D has been applied in major coastal and ocean investigations and engineering studies worldwide. Cardno are at the forefront of its application in coastal processes and engineering studies. It has been applied to current, wave and/or sediment transport investigations sites around Australia and overseas by Cardno (formerly Cardno Lawson Treloar) including Port Hedland, Exmouth Gulf, Cockburn Sound (Fremantle Ports Authority), Geographe Bay, Port Botany (Sydney), Port Philip Bay (Port of Melbourne), Murray River Mouth (South Australia), Cairns Navy Base (Queensland), Gulf of Papua and New Caledonia (nickel ore export jetty).
The Delft3D modelling system includes wind, pressure, tide and wave forcing, three-dimensional currents, stratification, sediment transport and water quality descriptions and is capable of using irregular, rectilinear or curvilinear coordinates.
Delft3D comprises several modules that provide the facility to undertake a range of studies. All studies generally begin with the Delft3D-FLOW module. From Delft3D-FLOW, details such as velocities, water levels, density, salinity, vertical eddy viscosity and vertical eddy diffusivity can be provided as inputs to the other modules. The wave and sediment transport modules work interactively with the FLOW module through a common communications file.
4.1.1 Hydrodynamic Numerical Scheme
The Delft3D FLOW module is based on the robust numerical finite-difference scheme developed by G. S. Stelling (1984) at the Delft Technical University in The Netherlands. Since its inception the Stelling Scheme has had considerable development and review by Stelling and others.
The Delft3D Stelling Scheme arranges modelled variables on a horizontal staggered Arakawa C-grid. The water level points (pressure points) are designated in the centre of a continuity cell and the velocity components are perpendicular to the grid cell faces. Finite difference staggered grids have several advantages including: -
Boundary conditions can be implemented in the scheme easily It is possible to use a smaller number of discrete state variables in comparison with
discretisations on non-staggered grids to obtain the same accuracy Staggered grids minimise spatial oscillations in the water levels.
Delft3D can be operated in 2D (vertically averaged) or 3D mode. In 3D mode, the model uses the sigma-coordinate system first introduced by N Phillips in 1957 for atmospheric models. The sigma-coordinate system is a variable layer-thickness modelling system, meaning that over the entire computational area, irrespective of the local water depth, the number of layers is constant. As a result, a smooth representation of the bathymetry is obtained. Also, as opposed to fixed vertical grid size 3D models, the full definition of the 3D layering system is maintained into shallow water and until the computational point is dried.
The model system would generally be operated in 2D mode for this study because sand transport algorithms are formulated in terms of depth averaged processes. However, some 3D investigations may be required near the port facilities.

Derby Tidal Power Station – Preliminary Hydrodynamic and Sediment Transport Modelling Prepared for Tidal Energy Australia
7 March 2014 Cardno (WA) Pty Ltd 5
Rep1021v3-DerbyTidalPowerStation-Hydrodynamic and Sedimenttransport modelling FINAL.docx
Horizontal solution is undertaken using the Alternating Direction Implicit (ADI) method of Leendertse for shallow water equations. In the vertical direction (in 3D mode) a fully implicit time integration method is also applied.
Vertical turbulence closure in Delft3D is based on the eddy viscosity concept.
4.1.2 Wetting and Drying of Intertidal Flats
In the King Sound region, intertidal areas have a significant influence on hydrodynamic processes. Delft3D includes a robust and efficient wetting and drying algorithm developed to simulate this process. Hence the model is able to describe sediment transport in the breaking wave zone that shifts horizontally with the tide.
4.1.3 Conservation of Mass
Problems with conservation of mass, such as a ‘leaking mesh’ that may occur with other hydrodynamic modelling systems, do not occur within the Delft3D system.
However, whilst the Delft3D scheme is unconditionally stable, inexperienced use of Delft3D, as with most modelling packages, can result in potential mass imbalances. Potential causes of mass imbalance and other inaccuracies include:
Inappropriately large setting of the wet/dry algorithm and unrefined inter-tidal grid definition Inappropriate bathymetric and boundary definition causing steep gradients Inappropriate time step selection (i.e. lack of observation of the scheme’s allowable Courant
Number condition) for simulation
4.2 Sediment Transport Model The Delft3D Online Sediment model has been applied to the morphological modelling components. For the seabed morphology simulations, the non-cohesive TRANMOR 2004 (TR2004) transport model has been applied. For siltation investigations from fine sediments, the widely recognised sediment flux expressions of Partheniades and Krone are used (van Rijn, 1993). Up to five sediment fractions can be specified within Delft3D.
The TR2004 sediment transport model for non-cohesive sediments has been applied in this study. This sand transport model has been documented recently in van Rijn (2007) and van Rijn et al (2007). The TR2004 model represents over 10-years of research into a range of factors influencing sediment transport. The key changes in the TR2004 model, compared to earlier transport models such as the van Rijn 1993 model, are associated with:-
Bed roughness; Bed forms; Wave-induced transport; and Reference concentration above the seabed.
In 2007, as part of a study into potential maintenance dredging of the navigation channel at the entrance to Brisbane Water, NSW, Cardno Lawson Treloar compared the simulated bed change within the Delft3D model system using both the van Rijn 1993 and the TR2004 models, with measured survey data. That study concluded that the TR2004 model significantly improved the agreement between modelled and measured bed changes in this dynamic coastal entrance (Cardno Lawson Treloar, 2004). Also, recently, at Lake Illawarra, revalidation of the Deflt3D entrance morphological model using the TR2004 sediment transport model demonstrated substantially

Derby Tidal Power Station – Preliminary Hydrodynamic and Sediment Transport Modelling Prepared for Tidal Energy Australia
7 March 2014 Cardno (WA) Pty Ltd 6
Rep1021v3-DerbyTidalPowerStation-Hydrodynamic and Sedimenttransport modelling FINAL.docx
improved agreement between modelled and measured entrance morphological changes (Taylor et al, 2008).
In this study, bed roughness due to bed forms was included in the sediment transport and hydrodynamic model processes. The bed form roughness model is based on the formulation described in van Rijn (1993).

Derby Tidal Power Station – Preliminary Hydrodynamic and Sediment Transport Modelling Prepared for Tidal Energy Australia
7 March 2014 Cardno (WA) Pty Ltd 7
Rep1021v3-DerbyTidalPowerStation-Hydrodynamic and Sedimenttransport modelling FINAL.docx
5 Model Set-up The Delft3D model was developed to cover the whole of the storage area which would be developed by the tidal power station. The model was also extended sufficiently far into King Sound so as the hydrodynamic conditions near the tidal boundary were not affected by the operation of the tidal power station. Figure 5.1 presents a plan view of the model including the location of the King Sound tidal boundary, the bund between the HWL and LWL and the locations of the tidal gates and power turbines.
For the power station modelling scenarios, initially flow data was obtained from a power station modelling study (GHD, 2003). Data were provided in a database format which included numerical power station model outputs. Water level and flow data were obtained from modelling scenario 342 which was identified as an appropriate scenario as it was one of the larger power supply cases and hence had relatively large flows through the various structures. Within the model database, 5 separate flow rate variables were identified:-
1. Hout_Lin – Flows through the power turbines between the HWL and LWL; 2. Hin – Flow into the HWL through the tidal gates; 3. Lout – Flow out of the LWL through the tidal gates; 4. HBT_out – Assumed as flow through a turbine which connects the HWL to King Sound; and 5. LBT_out – Assumed as flow through a turbine which connects the LWL to King Sound.
Initial modelling was undertaken with these flows within the Delft3D model to determine if the Delft3D model could replicate the water levels inside the HWL and LWL for these flow conditions. The initial comparison between the HWL and LWL water levels from the Delft3D model and the previous (GHD, 2003) power station model indicated there were significant differences between the two models. Further investigation of the flows which were being applied to the Delft3D model indicated that there was an 8.9% difference in the net inflows and outflows of the HWL, and a 10% difference in the net inflows and outflows from the LWL. Adjustments were made to the flow rates to increase the inflow into the HWL by 8.9% and increase the outflows from the LWL by 10% which resulted in improved agreement between the HWL and LWL water levels between the Delft3D and previous power station models.
Further discussions with Tidal Energy Australia indicated that the revised concept design (Appendix A) had not been investigated with the power station model. The revised design features only power turbines between the LWL and HWL, with water only flowing into the HWL through the tidal gates when the King Sound tidal level is above the HWL water level and water flowing out of the LWL through the LWL tidal gates when the King Sound tidal level is below the LWL. As a result, a Delft3D model was configured to model the HWL and LWL separately with the only connection between the two being the flows through the power turbines. The modelled water level for the HWL and LWL from the GHD (2003) power station modelling study was applied as boundary conditions across the tidal gates of each lake and the flows though the entrance for the prescribed water level conditions were extracted from the Delft3D model. The output time series of flows were then applied to the Delft3D model domain presented in Figure 5.1 which included discharge structures to represent the flows between the lakes and King Sound. The three Inlet/Outlet discharges within the model were:-
1. Inflows into the HWL; 2. Flows from the HWL to LWL through the power turbines; and 3. Outflows from the LWL into King Sound.
Model simulations have been undertaken in 2D depth-averaged grid configuration.

Derby Tidal Power Station – Preliminary Hydrodynamic and Sediment Transport Modelling Prepared for Tidal Energy Australia
7 March 2014 Cardno (WA) Pty Ltd 8
Rep1021v3-DerbyTidalPowerStation-Hydrodynamic and Sedimenttransport modelling FINAL.docx
Figure 5.2 presents a time series of the water level together with the sequence of opening and closing for the inlet and outlet gates during the period of simulation for this study. At all times during the simulation, some flow is passing through the power turbines into the LWL.
Derby Tidal Power Station – Preliminary Hydrodynamic and Sediment Transport Modelling Prepared for Tidal Energy Australia
7 March 2014 Cardno (WA) Pty Ltd 9
Rep1021v3-DerbyTidalPowerStation-Hydrodynamic and Sedimenttransport modelling FINAL.docx
6 Model Simulations
6.1 Hydrodynamics Model simulations have been undertaken for a representative 14-day spring-neap tidal cycle to investigate the modelled water levels and currents within the Delft3D model. Figure 6.1 presents a comparison of the modelled water levels in the entrance channel, HWL and LWL. For each location, three water level time series are presented representing:-
1. Simulation case with the power station development (solid black line); 2. Base case simulation with no power station or structures (dashed red line); and 3. Time series of the modelled conditions from GHD (2003) (blue line).
In the entrance channel, the three water level time series agree reasonably well. However, the Delft3D model indicates that for the flow conditions simulated in this study, the outflows from the LWL during the ebb flows and spring tide conditions lead to elevated water levels in the entrance channel compared to the King Sound tide condition. This suggests the outflow rate from the LWL may be overestimated in the previous power station model as the head difference across the outflow tide gates from the LWL will be less than applied in the power station modelling during spring tide conditions.
The most significant outcomes in terms of water levels are observed in the HWL time series. For this lake, the Delft3D model is simulating a rapid and significant drop in the water level in the HWL near the power turbine during times when the water level in the HWL is relatively low. The reason for this outcome is because the hydraulic losses along the HWL when the water level is low are significant and the outcome is that the flow rate through the power turbines is unable to be maintained along the length of the HWL. The power station modelling did not consider the geometry of the two lakes and the associated hydraulic losses. Figure 6.2 presents a snapshot of the modelled water level surface along the HWL during one of the periods when the modelled Delft3D water levels are much lower than the power station model. Figure 6.2 indicates that there is a large gradient in water level along the HWL (approximately 2 m along the 10 km length) during these periods of high power station flows and also relatively low water levels in the HWL. In the future, the power station modelling should be undertaken with a more sophisticated modelling system which includes a hydrodynamic model that is able to simulate the energy losses along the two lakes for different water level conditions.
Comparing the modelled water levels for the LWL near the power turbines indicates that the Delft3D model has a lower modelled water level range compared to the power station model although the two modelled cases agree reasonably well.
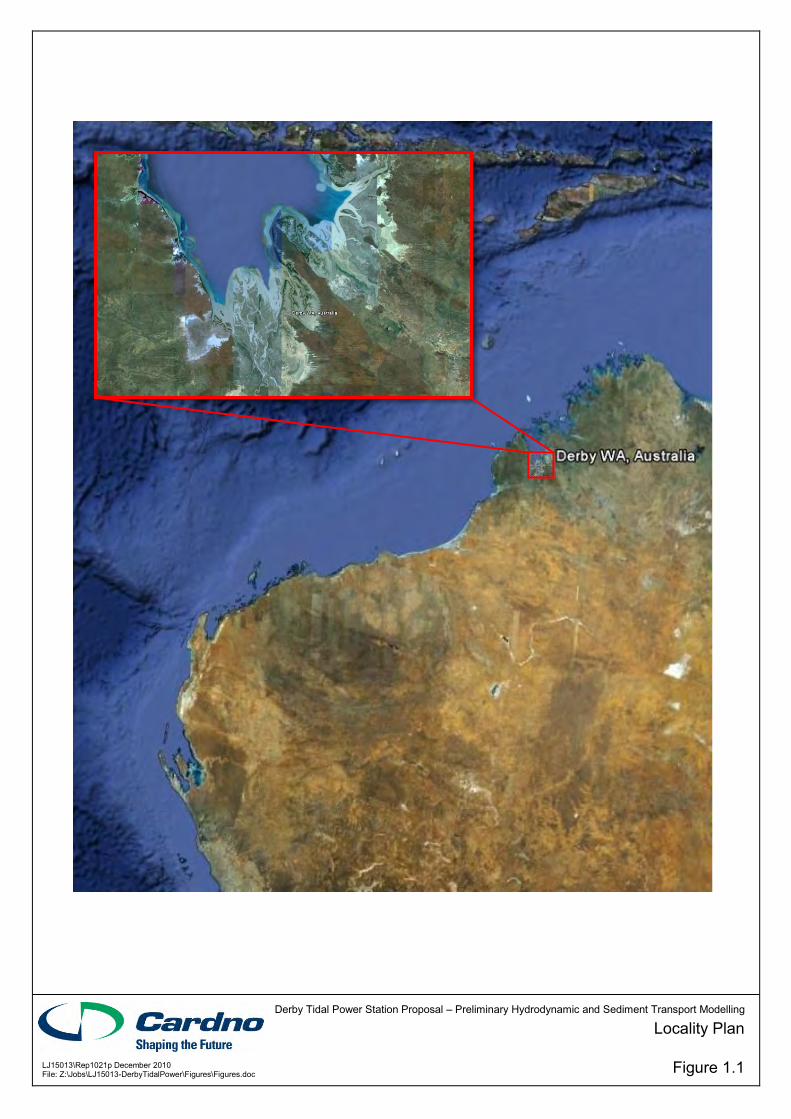
Figure 6.3 presents a comparison of discharges through the entrance channel and velocities between the present estuary configuration (Base Case) and the post-construction layout. The locations of the cross-sections adopted for discharge and time series outputs are presented in Figure 6.4. The results indicate that although the tidal station will reduce the tidal prism in Doctors Creek, the velocities of the currents along the entrance channel will be significantly increased and current magnitudes may exceed 3.0m/s which are extremely strong and nearly double the base case scenario with no power station.

Derby Tidal Power Station – Preliminary Hydrodynamic and Sediment Transport Modelling Prepared for Tidal Energy Australia
7 March 2014 Cardno (WA) Pty Ltd 10
Rep1021v3-DerbyTidalPowerStation-Hydrodynamic and Sedimenttransport modelling FINAL.docx
6.2 Morphological Simulations Morphological simulations have been undertaken with the Delft3D model to investigate potential morphological changes within the HWL and LWL, and also in the entrance channel and surrounding areas of King Sound. The Delft3D model was applied to simulate sediment transport and morphological changes over a 14-day period (corresponding to the hydrodynamic investigations in Section 6.1) for a seabed composed of sandy sediment with a median particle diameter of 350m (Coffey, 2002). A morphological scale factor of 26 was applied so a total of 1-year morphological change was simulated with the Delft3D model.
Figure 6.4 presents a plan view of the simulated bed level changes over a 1-year period post-construction of the tidal power station. The simulated bed level changes are most significant in the entrance channel region where the modelled currents of over 3.0m/s for the existing bed level cause significant scouring of up to 10m (vertically) over the first year post-construction. Figure 6.5 presents a comparison cross-section of the entrance channel post construction and following the 1-year morphological simulations at the location indicated in Figure 6.4. The modelling indicates that scouring is most significant at the centre of the channel with some accretion along the LWL bund wall. Whilst the Delft3D model is not simulating scour along the bund wall, the design of the bund wall will have to address the potential for significant scour along the bund structures. Figure 6.2 also indicates that within the HWL significant scour may also occur near the tidal gates and power turbines and would have be considered in detailed design stages.
A sensitivity simulation was undertaken with a model bathymetry which featured a 760m wide entrance channel below 0m AHD compared to the 550m wide entrance in the natural seabed condition. Whilst this simulation reduced the magnitude of the currents in the entrance channel considerably, the modelled currents were still greater than the base case scenario currents. Over the 1-year morphological simulation period, scouring in the centre of the channel of up to 10m occurred with this revised bathymetry layout. The long-term morphology of the entrance channel will be a key design and environmental consideration for the Derby tidal power station.
6.3 Siltation Investigations The Delft3D model has also been applied to investigate the potential for siltation of the HWL and LWL from suspended sediments which originate outside the lakes. The largest suspended sediment load in King Sound occurs from the Fitzroy River on the eastern side of King Sound during the wet season. The Delft3D model has been applied with a suspended sediment concentration also prescribed on the King Sound Boundary of the model – see Figure 5.1. There is little data on the potential suspended sediment concentrations in King Sound and for these preliminary investigations data from Halpern, Glick Maunsell (1997) was applied at the model boundary. A conservatively high suspended sediment concentration of 300mg/L was prescribed along the boundary of the Delft3D model for a period of time which represented a typical wet season duration of 5-months (December to April) by applying a morphological scale factor of 11 to a 14-day simulation case. This scenario is likely to be very conservative as it is unlikely that high suspended sediment concentrations would persist in King Sound for 5 continuous months.
Whilst any suspended sediments from wet season flows into King Sound would likely be dominated by fine sediments less than 64m diameter, the composition of the suspended sediments into silt, fine silt and clay fractions is uncertain. Siltation simulations were undertaken for three representative fall velocity conditions presented in Table 6.1.

Derby Tidal Power Station – Preliminary Hydrodynamic and Sediment Transport Modelling Prepared for Tidal Energy Australia
7 March 2014 Cardno (WA) Pty Ltd 11
Rep1021v3-DerbyTidalPowerStation-Hydrodynamic and Sedimenttransport modelling FINAL.docx
Table 6.1: Modelled Sediment Fall Velocity Cases for the Siltation Modelling Cases
Sediment Type
Representative Particle Diameter
(m)
Fall Velocity (mm/s) Based on Stokes’
Law Silt 43 1.7
Fine Silt 8 0.06 Clay 2 0.004
Of the three sediment cases investigated, only the simulation with silt particles produced a significant siltation impact within the HWL and LWL. For the fine silt and clay simulations the hydrodynamic model currents even within the lakes were sufficiently high such that the fines remained in suspension within the lakes before flowing out of the LWL during the outflow condition. In the modelling, the Inlet/Outlet discharge structures were able to transfer sediment mass through the structure. For the silt sediment scenario, the modelled siltation rate in the LWL was up to 0.5m per year however the scenario investigated in this study is likely to be very conservative. Figure 6.6 presents a plan view of the simulated annual siltation rate for this condition.

Derby Tidal Power Station – Preliminary Hydrodynamic and Sediment Transport Modelling Prepared for Tidal Energy Australia
7 March 2014 Cardno (WA) Pty Ltd 12
Rep1021v3-DerbyTidalPowerStation-Hydrodynamic and Sedimenttransport modelling FINAL.docx
7 Extended Morphological Simulations
7.1 Model Set-up Cardno undertook several additional simulations of the proposed Derby tidal power station for Tidal Energy Australia to further investigate the likely morphological changes along the entrance channel and adjacent area of King Sound for a 10 year period following construction of the power station. The Delft3D morphological model was extended to run for nine additional 14 day spring-neap cycles in succession of the first cycle. The morphological scale factor of 26 allowed the generation of estimated results for up to 10 years.
Apart from the extension of the simulation duration, the Delft3D hydrodynamic and morphological models were left mostly unchanged. Given the original model scour to 10 m (maximum allowable) in 1 year, two variations of the sediment map were investigated:
Scenario 1 – Depth to bedrock 5m: o Nearby geotechnical information (Coffey, 1997) and anecdotal evidence from Derby
Jetty suggested that the depth to bedrock in the area may be approximately 5 m, so the bedrock level was fixed at 5 m below the present surface level for all areas where erosion was permitted.
Scenario 2 – Depth to bedrock 50m: o The depth of erodible sediment was extended significantly until scour did not reach
the bedrock over the 10 year simulation period. A final depth to bedrock of 50 m was utilized.
For both these scenarios the sediment thickness map was smoothed at the edges to improve the model stability. The south western bank of the entrance channel from the power station into King Sound, including the southern headland, was set to allow lateral scour in the additional model runs.
It was noted during the original morphological runs that the majority of the flow, and hence scour, occurs along the northern side of the entrance channel along the LWL bund. The power station design intends to achieve a more westerly directed flow returning to King Sound; however, this does not occur. This is likely due to model limitations on the representation of the sluice gate and its orientation, and potentially, preferential flow paths set-up by offshore bathymetry. Five new discharge intake-outlet configurations were simulated to attempt to represent this westerly flow, but a computationally stable layout was unable to be achieved. The final configuration was only very slightly altered from the original model and still directs a significant proportion of the flow down the northern side of the entrance channel.
7.2 Results
7.2.1 Scenario 1 - Depth to Bedrock 5 m Figure 7.1 presents predicted cumulative sedimentation and erosion plots for Scenario 1 at 1, 4, 7 and 10 years respectively. Scour and erosion immediately north of the King Sound discharges is rapid and extensive; reaching the bedrock and extending approximately 2 km downstream of the power station, through the entrance channel, and into King Sound within the first year. The full 650 m width of the entrance channel is predicted to erode down to the assumed bedrock level (5 m below seabed) along the section of the entrance channel that is constrained by the southern bank and the LWL bund. This includes erosion of the south western bank adjacent to the entrance to increase the overall channel cross section.
As the flow reaches King Sound the velocity decreases and sediment deposition forms a delta at the HWL creek entrance. After 1 year the main flow into King Sound is still through the existing channel on

Derby Tidal Power Station – Preliminary Hydrodynamic and Sediment Transport Modelling Prepared for Tidal Energy Australia
7 March 2014 Cardno (WA) Pty Ltd 13
Rep1021v3-DerbyTidalPowerStation-Hydrodynamic and Sedimenttransport modelling FINAL.docx
the southern side of the creek. Some scour of the south-western bank and headland does occur; however, this is limited most likely due to the model schematisation discussed previously. Instead, a second channel begins to form on the northern side of the entrance channel. After 4 years, erosion in these northern and southern channels appears to be similar, and by 10 years the northern channel has become the main flow path.
The deposition at the mouth of the creek continues over the 10-years model timeframe, slowly changing configuration as the entrance channels’ flow paths evolve. Maximum settlement in this area is around 6 to 7 m above the initial bed level. It is important to note that the predicted deposition does not significantly affect the creeks’ connectivity with the larger King Sound, as deposition generally occurs in deeper areas of the sound rather than the creek. Also, the high flow rate maintains both the north and south channels around the delta and into King Sound. Figure 7.2 presents the predicted final bed level after 10 years for Scenario 1. The model results are considered reasonable in this respect, as the large tidal range and power station outlet flows would help maintain a connecting channel with King Sound; and the likelihood that bedrock does occur at about 5m depth below the existing seabed.
7.2.2 Scenario 2 – Depth to Bedrock 50 m Figure 7.3 presents predicted cumulative erosion and sedimentation plots at 1, 4, 7 and 10 years for Scenario 2. Here the erodible sediment depth is effectively unlimited and a maximum erosion depth begins to reach equilibrium at around 7 years, with the majority occurring in the first 4 years. Erosion is very deep immediately downstream of the King Sound and HWL interchanges; in both areas reaching over 40m below the original bed level, with a peak of 43.7m erosion depth after 10 years.
In Scenario 2, severe erosion in the entrance channel to King Sound is predicted to be limited to a smaller area than in Scenario 1. The majority of the flows’ energy is dissipated in the deep hole stretching 200 – 500 m north of the discharges. As with Scenario 1, the flow direction into the entrance channel is not idealised, and, over time, the flow is redirected down the northern side of the channel. After 4 years, the northern and southern flows in the entrance channel begin to equalize and deposition is predicted in the southern channel. Figure 7.4 portrays a clearer picture of the final bed level in Scenario 2. In this scenario the size of the delta at the mouth of the creek is somewhat smaller than Scenario 1, and the entrance channels’ connectivity to King Sound is not only maintained, but increased.

Derby Tidal Power Station – Preliminary Hydrodynamic and Sediment Transport Modelling Prepared for Tidal Energy Australia
7 March 2014 Cardno (WA) Pty Ltd 14
Rep1021v3-DerbyTidalPowerStation-Hydrodynamic and Sedimenttransport modelling FINAL.docx
8 Conclusions Cardno has been engaged by Tidal Energy Australia to develop a preliminary hydrodynamic and sediment transport model of the proposed Derby tidal power station development in King Sound in Western Australia. A 2D Delft3D coupled hydrodynamic and morphological model has been developed that extends into King Sound and can simulate hydrodynamic conditions in King Sound and the two lakes formed from the development of the power station. No model calibration has been undertaken at this stage.
The Delft3D model has been applied to hydrodynamic and morphological (erosion and siltation) investigations. The hydrodynamic simulations have indicated that the hydraulic losses along the HWL during relatively high power station flow rates and low lake levels is significant and would likely impact on the generation capacity of the power station – that is, the assumed power station flow could not be delivered because of conveyance limitations. In the future, further power station modelling would need to adopt a model system which included a full process 2D (depth-averaged) hydrodynamic model system to determine actual deliverable flow rates for power generation.
Initial morphological simulations indicate the entrance channel flows following the construction of the power station can exceed 3m/s over the existing seabed. These would generate significant scouring of the entrance channel and preliminary simulations (with a depth to bedrock of 10m) suggested that it may lower the bed levels in the channel by more than 10m in the first year. The model also indicated that scouring may be an issue on the lower reaches of the HWL near the inlet structure and power turbines.
Additional morphological simulations were undertaken for an extended period to identify the equilibrium structure of the observed scour. Simulations the equivalent of 10 years of morphological change, with the depth to bedrock fixed at 5m and 50m were undertaken. The 5m depth to bedrock configuration is based on nearby geotechnical investigations, and results in scour down to bed rock across the 650m wide channel, for a distance of approximately 2km. The 50m depth to bedrock case results in a deep scour hole (down to 44m) up to 200m from the power station discharge, with a shallower channel (bed level approximately 15m below AHD) connecting the scour hole to King Sound. In both scenarios connectivity between King Sound and the region of scour in the entrance channel is maintained for all tidal levels.
Whilst the actual depth to bedrock in the channel is not known directly, it is unlikely that scour down to 50m will occur. In the proximity of the discharges it is likely that scour will occur down to the bedrock level, at which point scour will extend laterally and downstream until the cross section of the channel increases sufficiently to reduce the current magnitude. As such, the scour results obtained for the 5m depth to bedrock case are considered as the most likely based on currently available information.
It is important to note that the severity of this erosion in both cases is potentially exacerbated by the schematisation limitations in describing the power station’s structural elements, the lack of representation of scour protection and control systems, and the short and high flow rates between King Sound and the HWL. These aspects of the model can be improved through higher detail modelling.
A conservative initial simulation of potential siltation rates inside the two lakes has been undertaken, which indicates that during severe wet season conditions, when suspended sediment concentrations in King Sound are elevated between December and April, up to 0.5m of siltation may occur in some portions of the LWL.
The investigations presented in this report are preliminary in nature, and in particular, the morphological and siltation outcomes are more qualitative in nature. In the future, specific hydrodynamic (water level time-series and transect currents) and suspended sediment concentration

Derby Tidal Power Station – Preliminary Hydrodynamic and Sediment Transport Modelling Prepared for Tidal Energy Australia
7 March 2014 Cardno (WA) Pty Ltd 15
Rep1021v3-DerbyTidalPowerStation-Hydrodynamic and Sedimenttransport modelling FINAL.docx
data would be required from the site in order to calibrate the hydrodynamic model, and provide realistic input data for sedimentation investigations. It is also recommended that a sophisticated hydrodynamic model which can include user specified structures, such as the Deltares Sobek system, should be applied in conjunction with the power station modelling to realistically simulate the influence of energy losses along the two lakes on the power station generation capacity.

Derby Tidal Power Station – Preliminary Hydrodynamic and Sediment Transport Modelling Prepared for Tidal Energy Australia
7 March 2014 Cardno (WA) Pty Ltd 16
Rep1021v3-DerbyTidalPowerStation-Hydrodynamic and Sedimenttransport modelling FINAL.docx
9 References Coffey (1997). “Derby Hydro Power PTY LTD Geotechnical Studies”. Prepared for Tidal Energy Australia. Report P1036/1-AM, October 1997.
Coffey (2002). “Derby Tidal Project: Geotechnical Investigation – Sand Bar”. Interim Report prepared for Tidal Energy Australia. Reference: P2041/3-AD, September 2002.
GHD (2003). “Computer Modelling of Gates and Power Station Operation”. Prepared for Tidal Energy Australia by GHD. Ref: 61/13003/36364-Rev1. February 2003.
Halpern Glick Maunsell (1997). “Derby Tidal Power Project, Doctors Creek, Kimberly: Consultative Environmental Review.” Prepared by Halpern Glick Maunsell Pty Ltd for Derby Hydro Power Pty Ltd.
Taylor D.R., Treloar P.D., and Collier L.C.. (2008). “Lake Illawarra Entrance Studies – Flooding and Potential Climate Change Issues.” Proceedings of the 2008 NSW Coastal Conference. Wollongong, November 2008.
van Rijn, L. C. (1993): Principles of Sediment Transport in Rivers, Estuaries and Coastal Seas. Aqua Publications.
van Rijn, L.C. and Walstra, D.J.R. (2003): Modelling of Sand Transport in Delft3D, WL| Delft Hydraulics report Z3624.
van Rijn, L.C. (2001). Longshore sediment transport. Report Z3054.20, Delft Hydraulics, Delft, The Netherlands.
van Rijn L. C. (2007). “Unified View of Sediment Transport by Currents and Waves – III- Graded Bed”. Journal of Hydraulic Research. American Society of Civil Engineers. July 2007 Vol 133 No. 7. pp761-775
van Rijn L. C., Walstra D. R. and van Ormondt M. (2007). “Unified View of Sediment Transport by Currents and Waves – IV- Application of Morphological Model”. Journal of Hydraulic Research. American Society of Civil Engineers. July 2007 Vol 133 No. 7. pp776-793.

Figure 1.1: Locality Plan
Figure 5.1: Model Bathymetry and Model Set-up
Figure 5.2: Sequence of Inflow and Outlet Gate Operation- Model Simulation Period
Figure 6.1: Modelled Water Levels Existing and Developed Layout Cases
Figure 6.2: Modelled Water Level Gradient in High Water Lake
Figure 6.3: Modelled Water Level, Current and Discharge
Figure 6.4: Simulated Morphological Change over 1st Year
Figure 6.5: Simulated Post 1-Year Entrance Channel Profile
Figure 6.6: Simulated Annual Sedimentation
Figure 7.1: Cumulative Erosion and Sedimentation – Scenario 1
Figure 7.2: Final Bed Level – Scenario 1
Figure 7.3: Cumulative Erosion and Sedimentation – Scenario 2
Figure 7.4: Final Bed Level – Scenario 2
Figures
Derby Tidal Power Station Proposal – Preliminary Hydrodynamic and Sediment Transport Modelling
Locality Plan
Figure 1.1 LJ15013\Rep1021p December 2010 File: Z:\Jobs\LJ15013-DerbyTidalPower\Figures\Figures.doc

Derby Tidal Power Station Proposal – Preliminary Hydrodynamic and Sediment Transport Modelling
Model Bathymetry (mAHD) and Model Setup
Figure 5.1 LJ15013\Rep1021p December 2010 File: Z:\Jobs\LJ15013-DerbyTidalPower\Figures\Figures.doc

Derby Tidal Power Station Proposal – Preliminary Hydrodynamic and Sediment Transport Modelling
Sequence of Inflow and Outlet Gate Operation Model Simulation Period
Figure 5.2 LJ15013\Rep1021p December 2010 File: Z:\Jobs\LJ15013-DerbyTidalPower\Figures\Figures.doc

Derby Tidal Power Station Proposal – Preliminary Hydrodynamic and Sediment Transport Modelling Modelled Water Levels
Existing and Developed Layout Cases Figure 6.1 LJ15013\Rep1021p December 2010
File: Z:\Jobs\LJ15013-DerbyTidalPower\Figures\Figures.doc

Derby Tidal Power Station Proposal – Preliminary Hydrodynamic and Sediment Transport Modelling Modelled Water Level Gradient in High Water Lake
04:15 18/1/2024 Figure 6.2 LJ15013\Rep1021p December 2010
File: Z:\Jobs\LJ15013-DerbyTidalPower\Figures\Figures.doc
Derby Tidal Power Station Proposal – Preliminary Hydrodynamic and Sediment Transport Modelling Modelled Water Level, Current and Discharge
Conditions – Entrance Channel Figure 6.3 LJ15013\Rep1021p December 2010
File: Z:\Jobs\LJ15013-DerbyTidalPower\Figures\Figures.doc
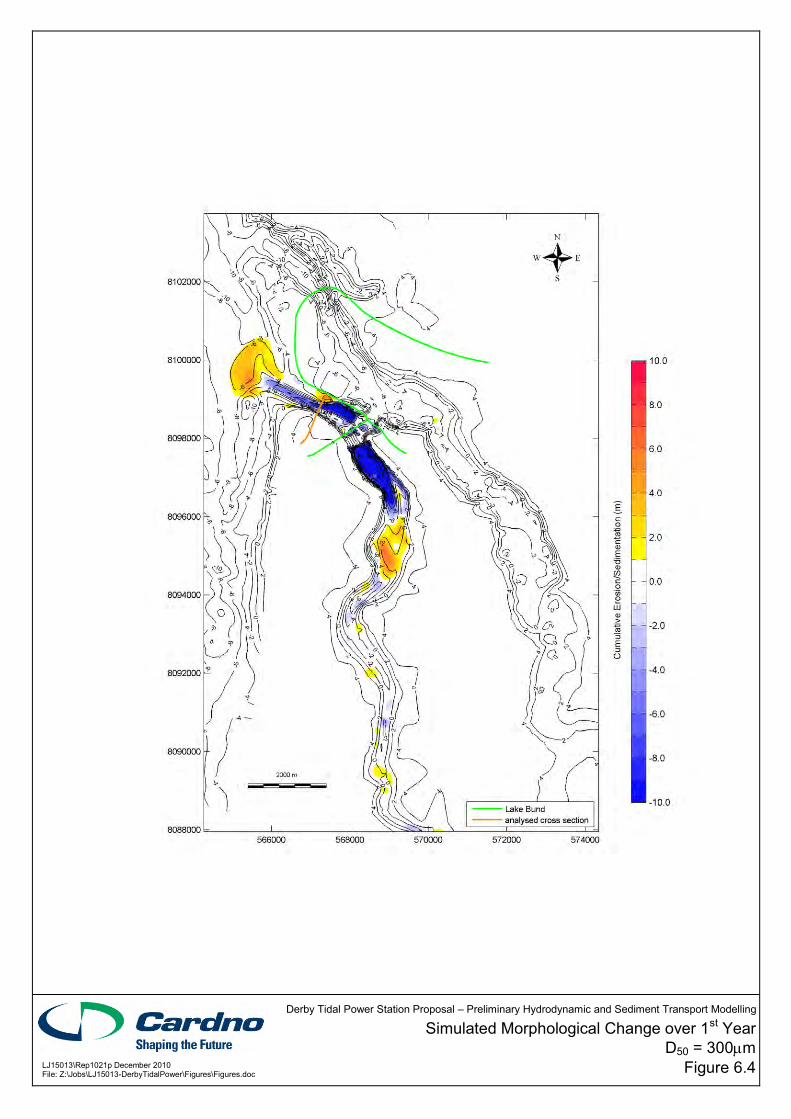
Derby Tidal Power Station Proposal – Preliminary Hydrodynamic and Sediment Transport Modelling Simulated Morphological Change over 1st Year
D50 = 300m Figure 6.4 LJ15013\Rep1021p December 2010
File: Z:\Jobs\LJ15013-DerbyTidalPower\Figures\Figures.doc

Derby Tidal Power Station Proposal – Preliminary Hydrodynamic and Sediment Transport Modelling Simulated Post 1-Year Entrance Channel Profile
D50 = 300m Figure 6.5 LJ15013\Rep1021p December 2010
File: Z:\Jobs\LJ15013-DerbyTidalPower\Figures\Figures.doc

Simulated Annual Sedimentation 300mg/L Wet Season TSS, Silt Fraction
Figure 6.6 LJ15013\Rep1021p December 2010 File: Z:\Jobs\LJ15013-DerbyTidalPower\Figures\Figures.doc
Derby Tidal Power Station Proposal – Preliminary Hydrodynamic and Sediment Transport Modelling

Cumulative Erosion and Sedimentation Depth to Bedrock = 5 m, D50 = 350m n
Figure 7.1 LJ15013\Rep1021p December 2010 File: Z:\Jobs\LJ15013-DerbyTidalPower\Figures\Figures.doc
Derby Tidal Power Station Proposal – Preliminary Hydrodynamic and Sediment Transport Modelling

Final Bed Level Depth to Bedrock = 5 m, D50 = 350m n
Figure 7.2 LJ15013\Rep1021p December 2010 File: Z:\Jobs\LJ15013-DerbyTidalPower\Figures\Figures.doc
Derby Tidal Power Station Proposal – Preliminary Hydrodynamic and Sediment Transport Modelling

Cumulative Erosion and Sedimentation Depth to Bedrock = 50 m, D50 = 350m n
Figure 7.3 LJ15013\Rep1021p December 2010 File: Z:\Jobs\LJ15013-DerbyTidalPower\Figures\Figures.doc
Derby Tidal Power Station Proposal – Preliminary Hydrodynamic and Sediment Transport Modelling

Final Bed Level Depth to Bedrock = 50 m, D50 = 350m n
Figure 7.4 LJ15013\Rep1021p December 2010 File: Z:\Jobs\LJ15013-DerbyTidalPower\Figures\Figures.doc
Derby Tidal Power Station Proposal – Preliminary Hydrodynamic and Sediment Transport Modelling

Appendix A
Design Layouts of the Power Station
Structures
Appendix E
Burgess Point – 100-Year and 500-Year ARI
Cyclone Current Maps and Time Series
Appendix B
Hunt Point – Ambient Tidal Current Maps
and Time Series
Appendix C
Hunt Point – 100-Year and 500-Year ARI
Cyclone Current Maps and Time Series
Appendix A
Design Layouts of Proposed Derby Tidal
Power Station


This page has been left blank intentionally.