Cardiac output and Venous Return - JU Medicine...HYPOEFFECTIVE CARDIAC OUTPUT CURVES. 25 20 15 10 5...
46
1 Cardiac output and Venous Return Faisal I. Mohammed, MD, PhD
Transcript of Cardiac output and Venous Return - JU Medicine...HYPOEFFECTIVE CARDIAC OUTPUT CURVES. 25 20 15 10 5...

1
Cardiac output and Venous Return
Faisal I. Mohammed, MD, PhD

2
Objectives
⚫ Define cardiac output and venous return
⚫ Describe the methods of measurement of CO
⚫ Outline the factors that regulate cardiac output
⚫ Follow up the cardiac output curves at different physiological states
⚫ Define venous return and describe venous return curve
⚫ Outline the factors that regulate venous return curve at different physiological states
⚫ Inter-relate Cardiac output and venous return curves

3
• Cardiac Output is the sum of all tissue flows
and is affected by their regulation (CO =
5L/min, cardiac index = 3L/min/m2).
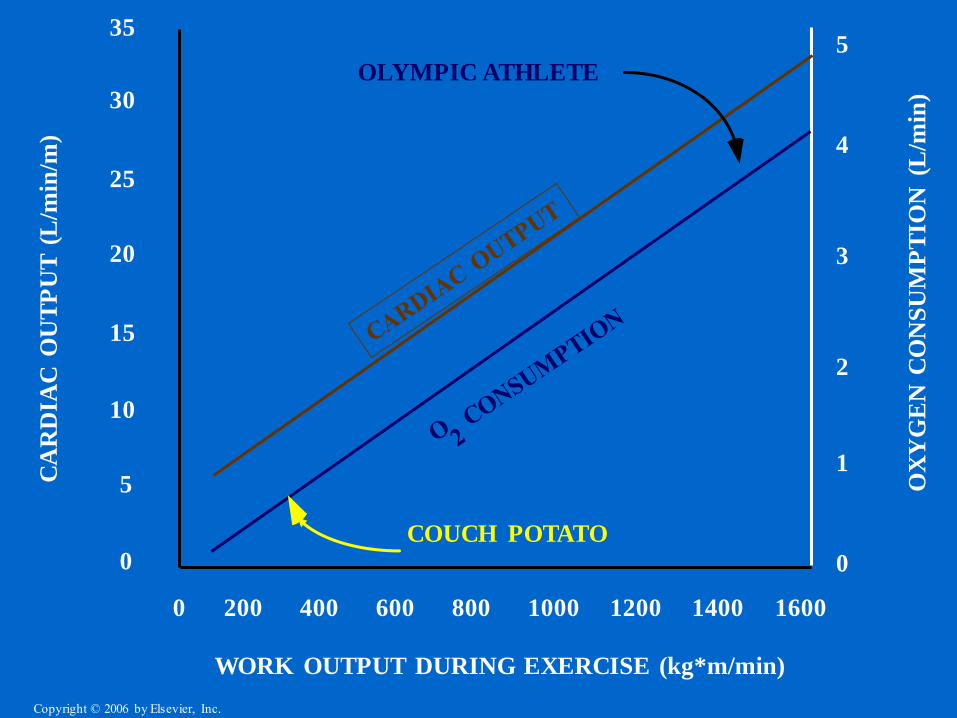
• CO is proportional to tissue O2. use.
• CO is proportional to 1/TPR when AP is
constant.
• F=P/R (Ohm’s law)
• CO = (MAP - RAP) / TPR, (RAP=0) then
• CO=MAP/TPR ; MAP=CO*TPR
Important Concepts About Cardiac
Output (CO) Control
0 200 400 600 800 1000 1200 1400 1600
35
30
25
20
15
10
5
0
5
4
3
2
1
0
CA
RD
IAC
OU
TP
UT
(L
/min
/m)
OX
YG
EN
CO
NS
UM
PT
ION
(L
/min
)
WORK OUTPUT DURING EXERCISE (kg*m/min)
OLYMPIC ATHLETE
COUCH POTATO
Copyright © 2006 by Elsevier, Inc.
5
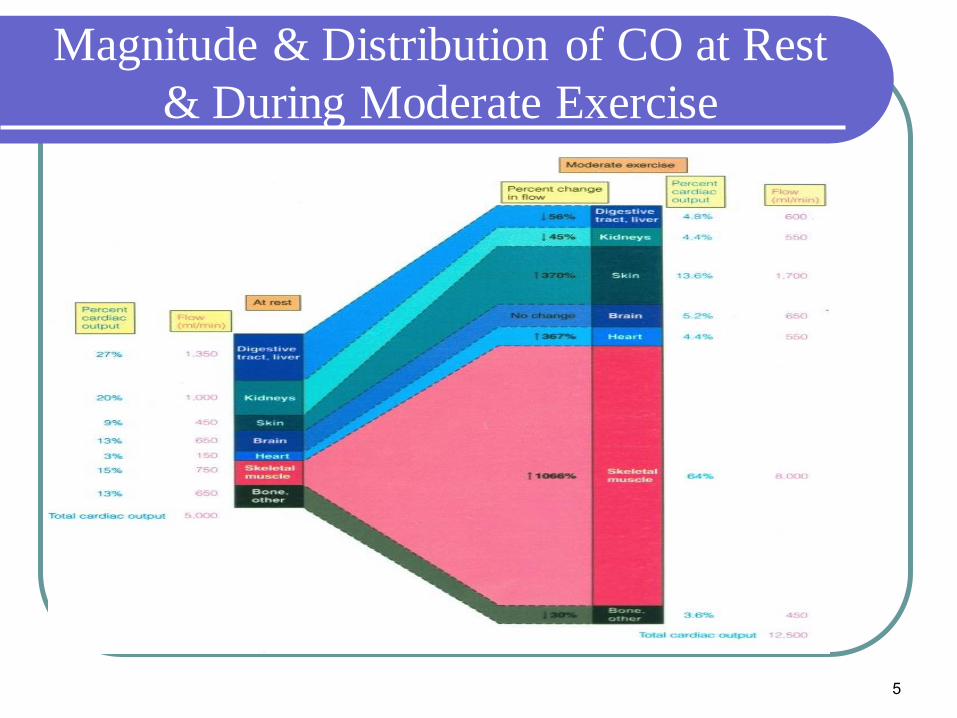
Magnitude & Distribution of CO at Rest
& During Moderate Exercise
6
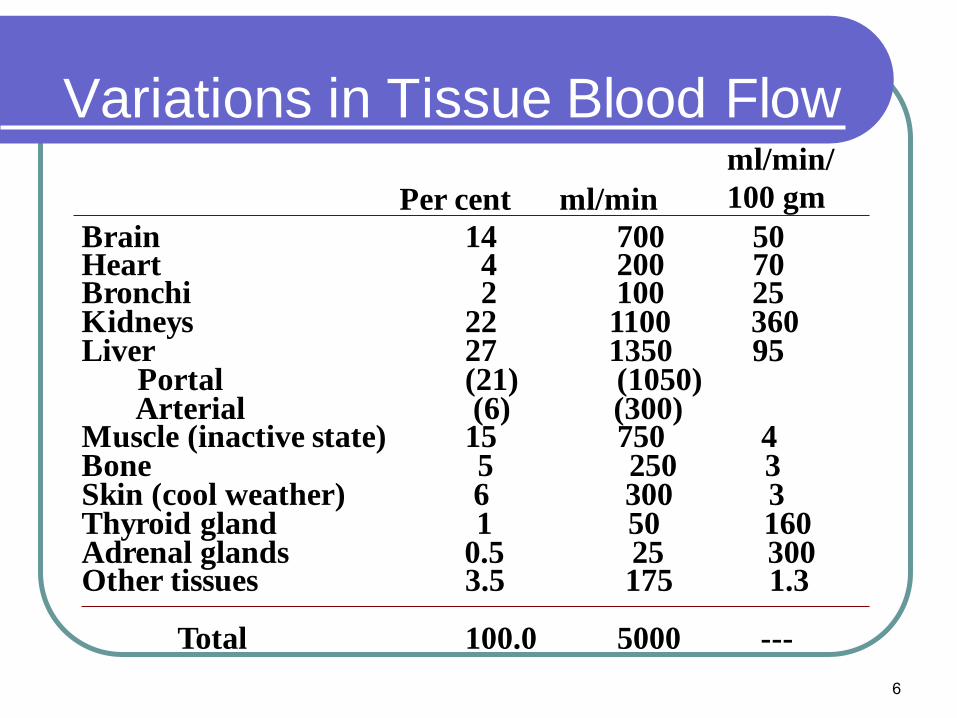
Variations in Tissue Blood Flow
Brain 14 700 50Heart 4 200 70Bronchi 2 100 25Kidneys 22 1100 360Liver 27 1350 95
Portal (21) (1050)Arterial (6) (300)
Muscle (inactive state) 15 750 4Bone 5 250 3Skin (cool weather) 6 300 3 Thyroid gland 1 50 160 Adrenal glands 0.5 25 300 Other tissues 3.5 175 1.3
Total 100.0 5000 ---
Per cent ml/min
ml/min/
100 gm

7
Control of Cardiac Output
8
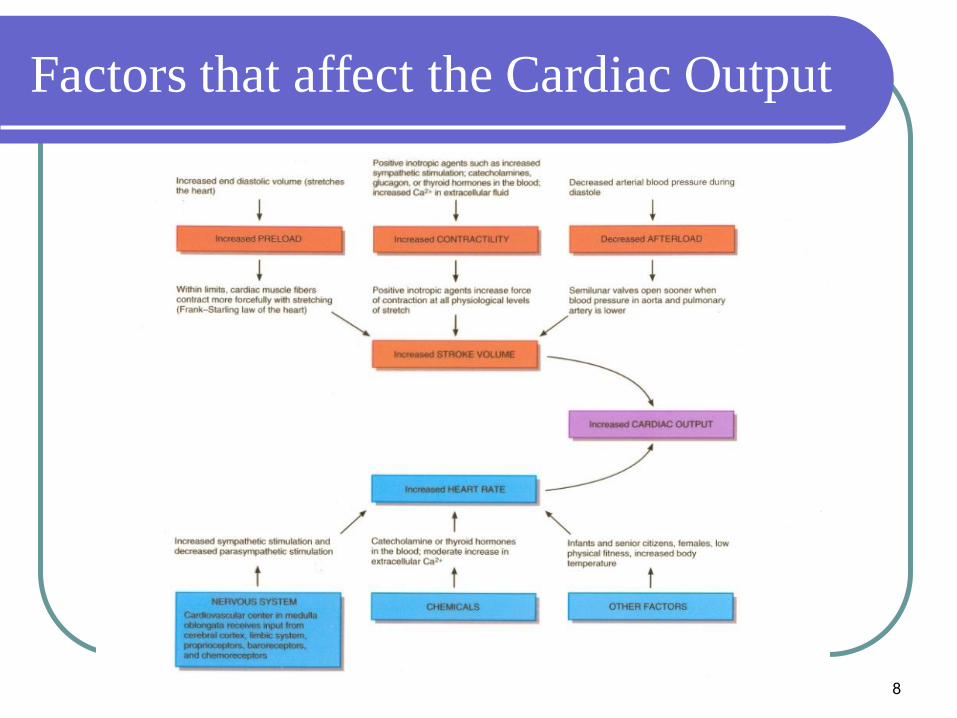
Factors that affect the Cardiac Output

0
10
20
30
40
10 20
Left Atrial Mean Pressure
(mm Hg)
L.V.
stroke
work
(gram
meters)
0
1
2
3
4
10 20
Right Atrial Mean Pressure
(mm Hg)
R.V.
stroke
work
(gram
meters)
Ventricular Stroke Work Output

NORMAL
HYPEREFFECTIVE
-4 0 +4 +8
25
20
15
10
5
0
CA
RD
IAC
OU
TP
UT
(L/m
in)
RIGHT ATRIAL PRESSURE (mmHg)
HYPOEFFECTIVE
CARDIAC OUTPUT
CURVES

25
20
15
10
5
0
-4 0 +4 +8
Car
dia
c O
utp
ut (
L/m
in)
Right Atrial Pressure (mmHg)
(Parasympathetic
stimulation)
Zero
sympathetic stimulation
Normal
sympathetic stimulation
Maximum
sympathetic stimulation
Effect of Sympathetic and Parasympathetic
Stimulation on Cardiac Output

10
5
0
CA
RD
IAC
OU
TP
UT
(L
/min
)
RIGHT ATRIAL PRESSURE (mmHg)
-4 0 4 8 12
15
IPP = INTRAPLEURAL PRESSURE

13
• Plateau of CO curve determined by
heart strength (contractility + HR)
• Sympathetics plateau
• Parasympathetics (HR) ( plateau)
• Plateau
• Heart hypertrophy’s plateau
• Myocardial infarction ( plateau)
• Plateau
The Cardiac Output Curve
14
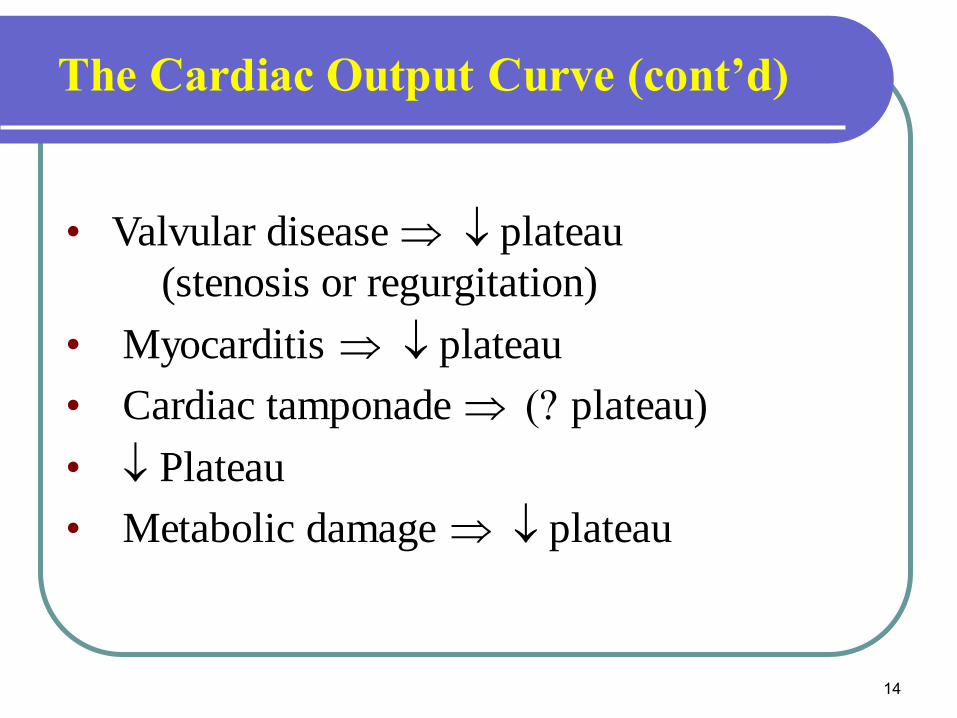
• Valvular disease plateau
(stenosis or regurgitation)
• Myocarditis plateau
• Cardiac tamponade ( plateau)
• Plateau
• Metabolic damage plateau
The Cardiac Output Curve (cont’d)
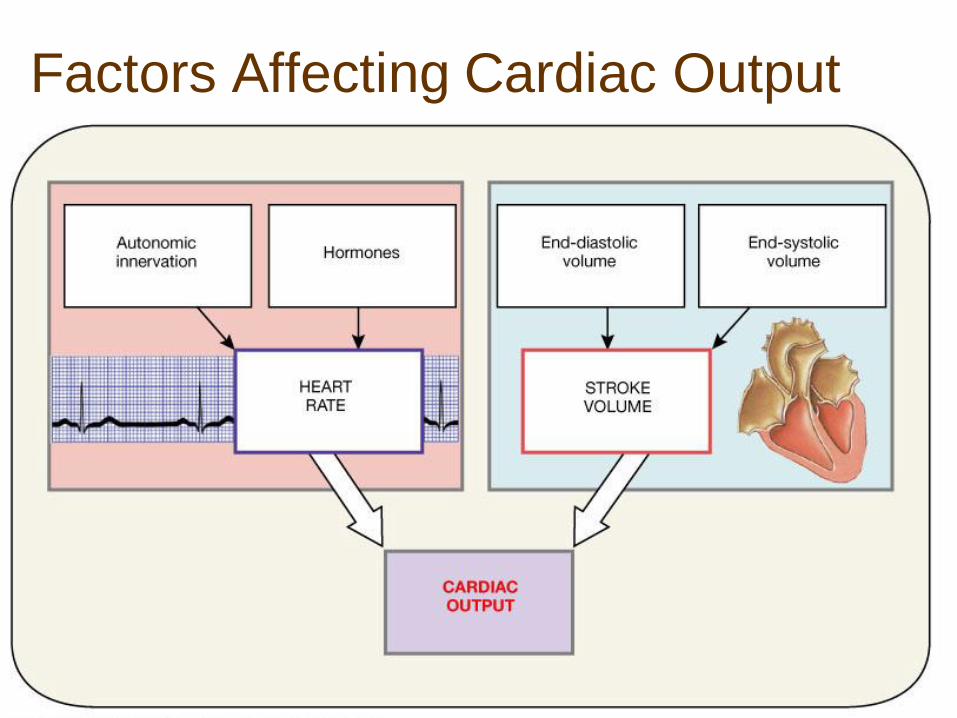
Factors Affecting Cardiac Output

Factors Affecting Stroke Volume
Contractility of
Muscle cells
Cont = ESV
Cont = ESV

A Summary of the Factors Affecting
Cardiac Output

18
REGULATION OF STROKE VOLUME: PRELOAD
decreased heart rate
increased length of diastole
increased ventricular filling
increased venous pressure
increased venous return
increased ventricular filling increased preload
increased ventricular stretch
Frank-Starling mechanism
increased force of contraction
increased stroke volume
increased cardiac output

19
REGULATION OF STROKE VOLUME:
CONTRACTILITY
increased sympathetic activity
increased epinephrine
other factors
increased contractility
increased force of contraction
increased stroke volume
increased cardiac output

Cardiac Contractility
⚫ Best is to measure the C.O. curve, but this is
nearly impossible in humans.
⚫ dP/dt is not an accurate measure because this
increases with increasing preload and afterload.
⚫ (dP/dt)/P ventricle is better. P ventricle is
instantaneous ventricular pressure.
⚫ Excess K+ decreases contractility.
⚫ Excess Ca++ causes spastic contraction, and low
Ca++ causes cardiac dilation.
21
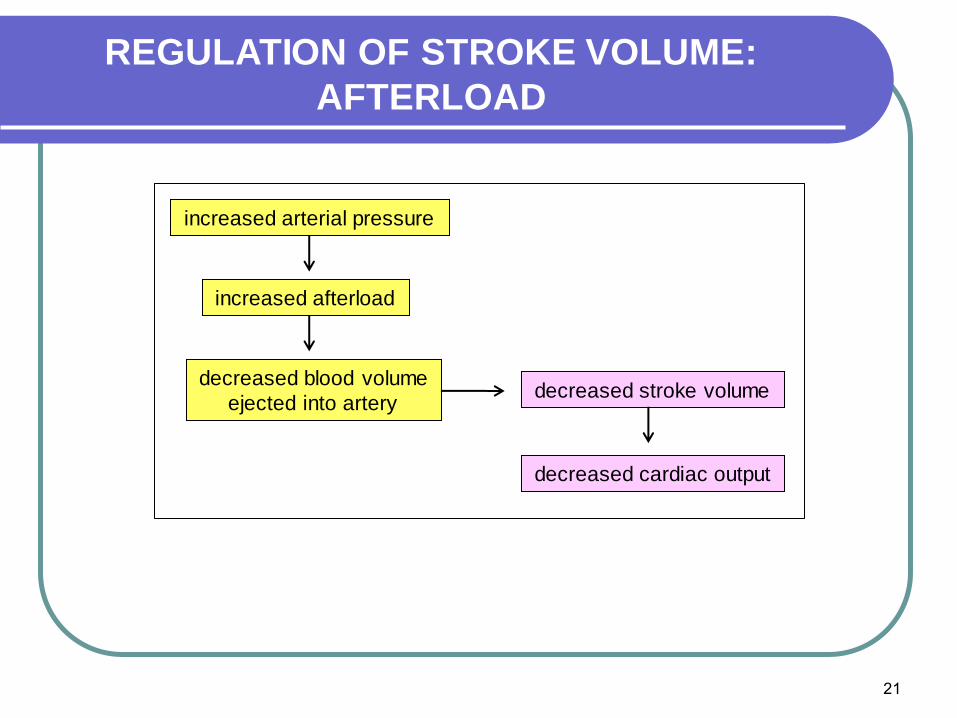
REGULATION OF STROKE VOLUME:
AFTERLOAD
increased arterial pressure
increased afterload
decreased blood volume
ejected into arterydecreased stroke volume
decreased cardiac output

22
⚫ Electromagnetic flowmeter
⚫ Indicator dilution (dye such as cardiogreen)
⚫ Thermal dilution
⚫ Oxygen Fick Method
⚫ CO = (O2 consumption / (A-V O2 difference)
Measurement of Cardiac Output

23
Electromagnetic flowmeter
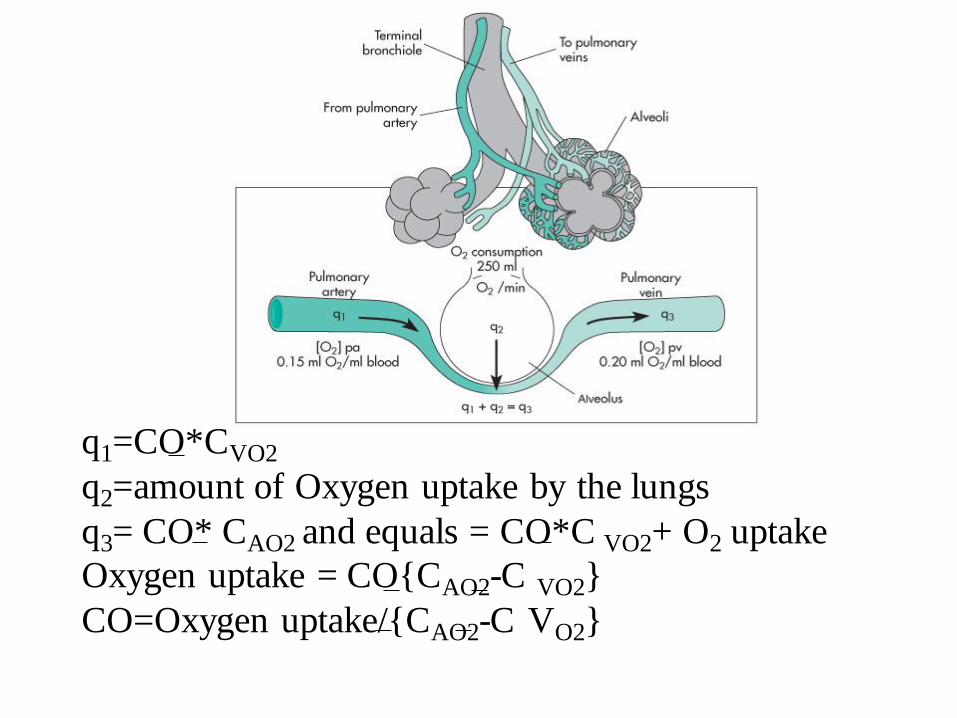
q1=CO*CVO2
q2=amount of Oxygen uptake by the lungs
q3= CO* CAO2 and equals = CO*C VO2+ O2 uptake
Oxygen uptake = CO{CAO2-C VO2}
CO=Oxygen uptake/{CAO2-C VO2}

25
Spirometer
26
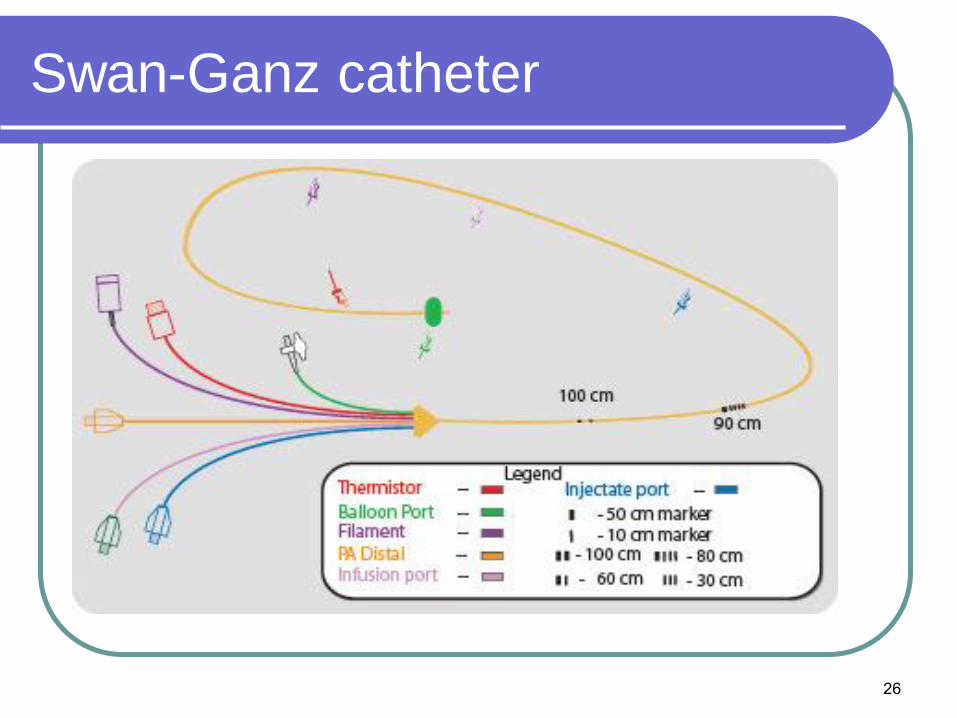
Swan-Ganz catheter

27
O2 Fick Problem
⚫ If pulmonary vein O2 content = 200 ml O2/L blood
⚫ Pulmonary artery O2 content = 160 ml O2 /L blood
⚫ Lungs add 400 ml O2 /min
⚫ What is cardiac output?
⚫ Answer: 400/(200-160) =10 L/min
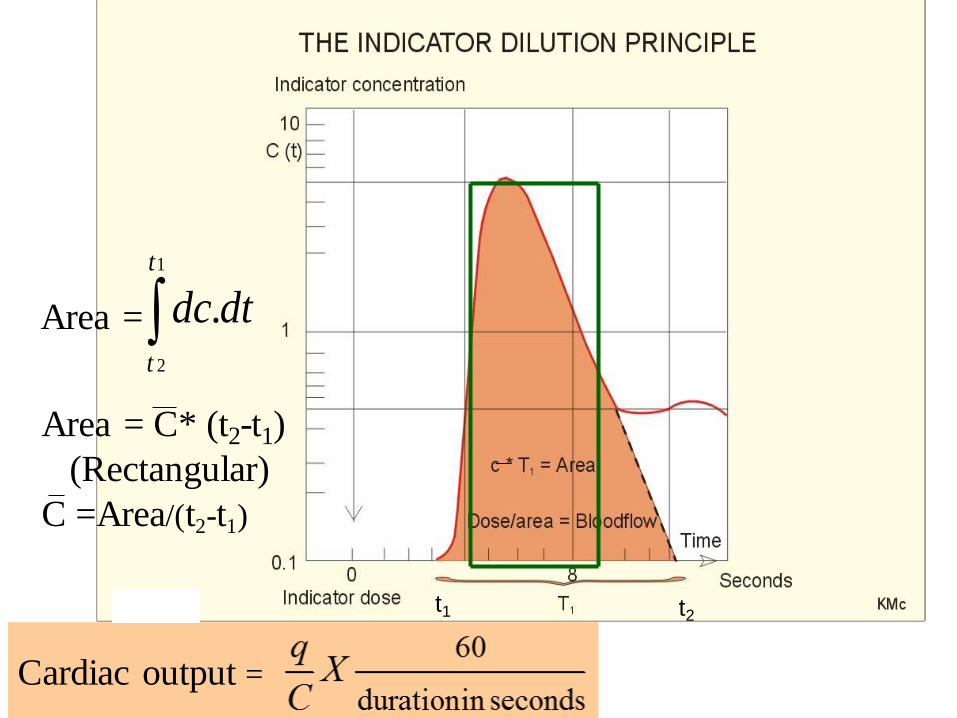
Area = 1
2
.
t
t
dtdc
t2t1
Area = C* (t2-t1)
(Rectangular)
C =Area/(t2-t1)
Cardiac output =

Thermodilution Method Curve
AREA = 2
1
.
t
t
dtdT
t1 t2

VENOUS RETURN
⚫ Definition: Volume of blood returns to
either the left side or right side of the
heart per minute
⚫ VR = CO = P/R
⚫ VR = (Venous pressure –Rt. Atrial
pressure)/ resistance to venous return
30

31
Effect of Venous Valves

32
Effect of Venous Valves

33
Venous Valves
Valve
Deep vein
Perforating vein
Superficial
vein

34
Effect Of Gravity on Venous Pressure

Vessel Structure and Function

36
Venous Pressure in the Body
• Compressional factors tend to
cause resistance to flow in large
peripheral veins.
• Increases in right atrial pressure
causes blood to back up into the
venous system thereby increasing
venous pressures.
•Abdominal pressures tend to
increase venous pressures in the
legs.

37
Central Venous Pressure
❖ Pressure in the right atrium is called central venous pressure.
❖ Right atrial pressure is determined by the balance of the heart pumping blood out of the right atrium and flow of blood from the large veins into the right atrium.
❖ Central venous pressure is normally 0 mmHg, but can be as high as 20-30 mmHg.
38
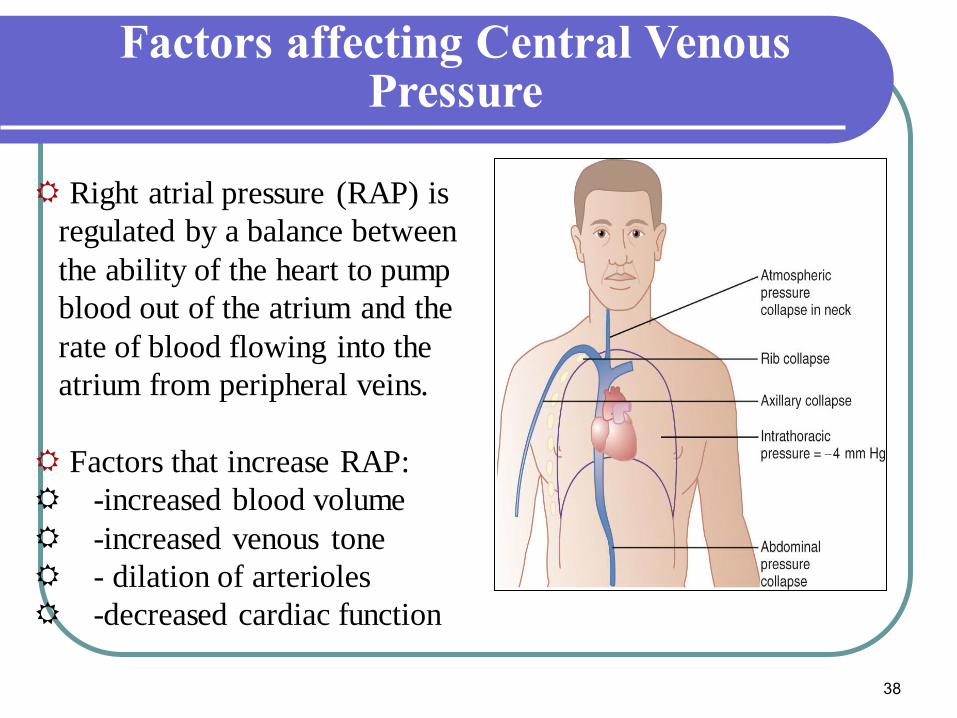
Factors affecting Central Venous Pressure
Right atrial pressure (RAP) is
regulated by a balance between
the ability of the heart to pump
blood out of the atrium and the
rate of blood flowing into the
atrium from peripheral veins.
Factors that increase RAP:
-increased blood volume
-increased venous tone
- dilation of arterioles
-decreased cardiac function
39
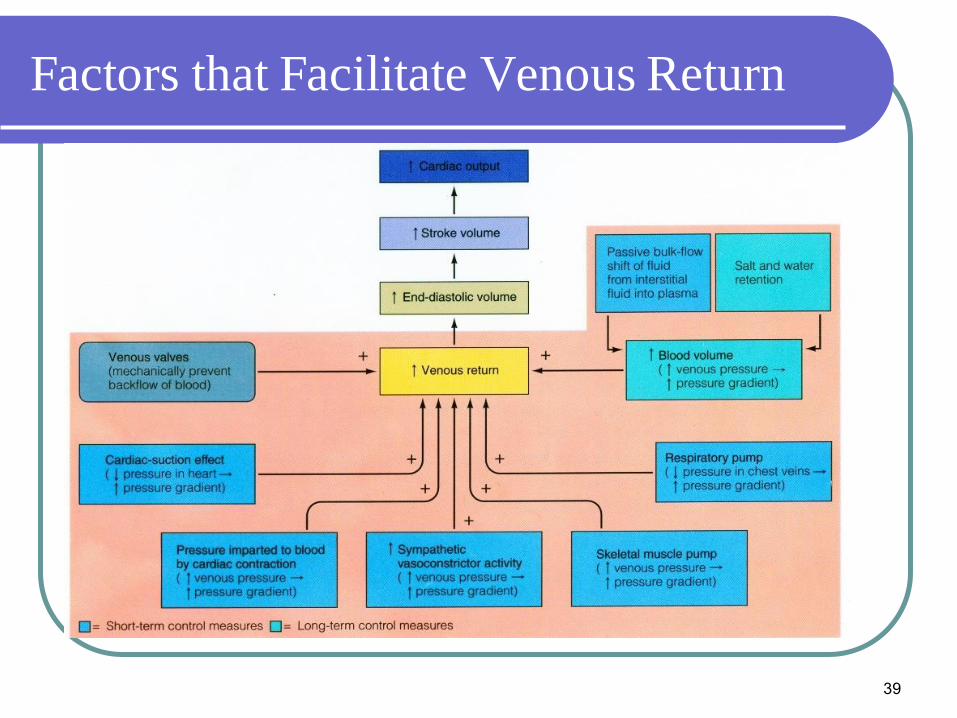
Factors that Facilitate Venous Return

RIGHT ATRIAL PRESSURE (mmHg)
-4 0 4 8 12
VE
NO
US
RE
TU
RN
(L
/MIN
)
0
5
10
MSFP= 7
MSFP= 14
MSFP= 4.2
MSFP = Mean Systemic Filling Pressure
The Venous Return Curve
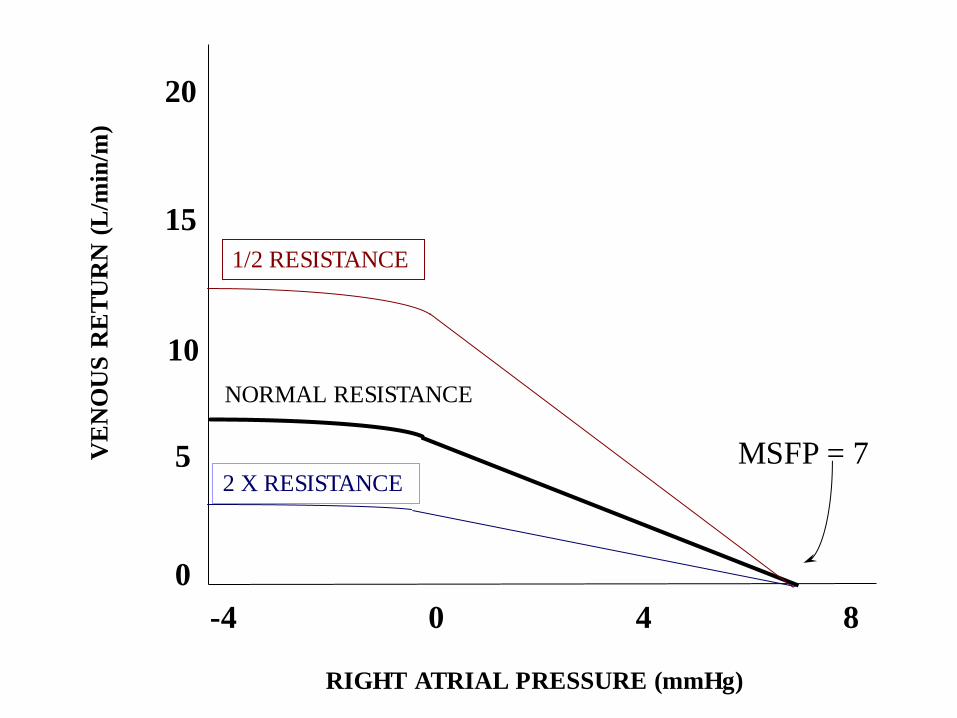
20
15
10
5
0
VE
NO
US
RE
TU
RN
(L
/min
/m)
RIGHT ATRIAL PRESSURE (mmHg)
-4 0 4 8
MSFP = 7
NORMAL RESISTANCE
1/2 RESISTANCE
2 X RESISTANCE
42
• Beriberi - thiamine deficiency
arteriolar dilatation RVR
• (RVR= resistance to venous return)
because VR = (MSFP - RAP) /RVR
(good for positive RAP’s)
• A-V fistula (? RVR)
• RVR
• C. Hyperthyroidism (? RVR)
• RVR
Venous Return (VR)

43
• Anemia RVR (why?)
• Sympathetics MSFP
• Blood volume MSFP + small
in RVR
• Venous compliance (muscle
contraction or venous constriction)
( SFP)
• MSFP
Venous Return (VR) (cont’d)

44
• Blood volume MSFP
• Sympathetics (? v. comp. and
MSFP)
• Venous compliance and MSFP
• Obstruction of veins (? RVR)
• RVR
Factors Causing Venous Return

25
20
15
10
5
0
CA
RD
IAC
OU
TP
UT
AN
D V
EN
OU
S R
ET
UR
N (
L/m
in/m
)
RIGHT ATRIAL PRESSURE (mmHg)
-4 0 4 8 12 16
NORMAL CARDIAC
SPINAL ANESTHESIA
SPINAL
MAXIMAL SYMPATHETIC
STIMULATION
MAX

Thank You