Carcass Trends in Beef Cattle Shown at the Clarksville Better Beef Sho Res… · ·...
35
Carcass Trends in Beef Cattle Shown at the Clarksville Better Beef Show J. Brad Greenfield Submitted to the University of Tennessee at Martin In partial fulfillment of requirements For the degree of Master of Science Agriculture and Natural Resources Systems Management December 2009
Transcript of Carcass Trends in Beef Cattle Shown at the Clarksville Better Beef Sho Res… · ·...
Carcass Trends in Beef Cattle Shown at the
Clarksville Better Beef Show
J. Brad Greenfield
Submitted to the University of Tennessee at Martin In partial fulfillment of requirements
For the degree of
Master of Science
Agriculture and Natural Resources Systems Management
December 2009


i
Acknowledgments
If someone would have told me that I would be conducting a master’s project on beef cattle 10
years ago I would have told them that they were crazy. When I began my college career in 1999 I had
never stepped foot on a farm and didn’t know the difference between a bull and a steer. Once I made
the decision to travel the agriculture path I met many benevolent folks along the way willing to teach
me.
I must first start of by thanking the Silvey family. Gary, Molly, Matt and the late Gary Jr gave me
my first experience on a farm. I ended up working with their herd of Gelvieh cattle for roughly 5 years
through college and 2 years full time after college. I owe so much to this family that there would be no
way to pay it back in one lifetime.
While attending agriculture classes at Austin Peay State University I knew that I needed all of the
help that I could get to keep up with my experienced classmates. Two individuals, Dr. Jack Caldwell,
professor of Animal Science, and Chad Pugh, director of APSU Farm, shared a world of knowledge and a
forever extended helping hand.
While working for the Silvey Family Farm I met a man that would greatly aid in my life direction
by the name of John Bartee. Mr. Bartee has been a leader, a follower when I needed one, an inspiration
and a role model to me and many like me. Staying in the University of Tennessee Extension mind set, I
must also thank my County Director Janet Cluck. Mrs. Cluck was tolerant during my struggles through
this program. She was understanding and supportive in every way possible.
The professors at University of Tennessee at Martin have been cooperative during this online
education process. This has not been a traditional way of educating and I am sure required great
understanding at times. I would like to thank Dr. Burcham and Dr. Mehlhorn for their education and
guidance during this degree. I would especially like to thank Dr. Darroch for carrying me through this
process and putting up with my lame jokes.

ii
Of course I must also mention my beautiful and loving wife, Angela Greenfield. She has been my
sounding board, my audience, my support and my biggest fan.
There have been many more important people in my life over the past years that I do not have
room to mention. My hope is that someday I will have an opportunity to provide the chance for a young
person to become involved in agriculture the same way that all of these people did for me.

iii
Table of Contents
Acknowledgements .................................................................................................. i
Tables and Figures Index .................................................................................... iv
Abstract ...................................................................................... v
Introduction ............................................................................................................. 1
Objectives ...................................................................................................... 3
Literature Review ....................................................................... 4
What is Carcass Merit ................................................................. 4
Determining Carcass Merit ......................................................... 6
Materials and Methods ............................................................ 10
Results and Discussion ............................................................. 14
Conclusion ................................................................................ 18
Tables and Figures .................................................................... 19

iv
List of Tables
Table 1 Quality Grade of Beef based on Marbling Scores ...................................... 19
Table 2 Mean and Standard Error of variables ...................................................... 21
Table 3 Summary of regression analyses .............................................................. 22
Table 4 Correlation Table ....................................................................................... 23
List of Figures
Figure 1 Relationship between Marbling, Maturity and Carcass Grade ................ 20
Figure 2 Mean ribeye size by year ......................................................................... 22
Figure 3 Mean hot carcass weight by year ............................................................. 23
Figure 4 Mean dressing percentage by year .......................................................... 24
Figure 5 Mean rib fat by year ................................................................................. 24
Figure 6 Mean yield grade by year ......................................................................... 25
Figure 7 Quality grade by year ............................................................................... 25
Figure 8 Percent of Choice and Select quality grades by year ............................... 26

v
Abstract
When most beef producers in Tennessee think about making improvements to their operations,
many will think of weaning weights, yearling weights, and lighter birth weights. While all of these
aspects are very important, perhaps the most valuable improvements would be made to beef carcass
merit. The problem is that carcass merit information is not made available to the cow/calf producer
from the meat packers in conventional marketing methods.
The data from the Clarksville Better Beef Show, held annually in Clarksville, TN, were used in this
study. Carcass merit data from 724 animals were collected from 2003‐2008 and analyzed to examine
trends over those six years. The characteristics studied were ribeye area, dressing percentage, hot
carcass weight (HCW), rib fat, quality grade, and yield grade. The majority of this data was collected
from the Tyson meat packing facility in Joslin IL. The remainder of the data was collected at local
processing plants.
Over the six years the data shows that carcass merit components trended towards less desirable
carcasses. There were significant (P<0.05) regression results for ribeye, HCW, and yield grade over time,
however the R2 values were very low. While the data showed a high amount of variability they did
reflect industry trends.
To gain information on carcass merit of their cattle, producers should consider consigning cattle
to programs that will allow them to receive this data in order to make better management decisions for
their operations.

vi

1
Introduction
As more beef carcass information becomes available to the industry, many cow/calf producers
seem to become further removed from this facet of the industry. Many cow/calf producers in
Tennessee have never seen a beef carcass and most don’t understand the concept of neither carcass
merit or the impact it may have on the beef industry. Each year, decisions are made regarding selection
of breeding stock to potentially improve carcass merit. In dealing with Master Beef Producer (MBP)
programs in several Tennessee counties, it is obvious that many producers have no concept of the
importance of carcass merit. Although the MBP group represents a small sample, it is still alarming.
Therefore producers are somewhat ‘reaching for straws’ when it comes to breeding stock selection to
improve carcass characteristics. Over the last six years, overall carcass quality may have declined in
relation to industry standards (National Beef Grid Definitions 2009). For cow/calf producers to maximize
potential profits they must know what they have, know how it fits into the market place, and
understand how to make improvements. Producers must also keep in mind that the market place has
changed over the past several years in favor of niche marketing, which will place value on beef carcasses
otherwise considered undesirable.
Beef carcass merit or carcass data is perhaps the most important information for making solid
improvements in beef carcass with regard to consumer satisfaction. Beef producers rarely make
improvements to their operations by reviewing carcass data. Improving beef operations is one of the
most difficult tasks producers face. This task is especially difficult when we consider that producers
rarely know how their product performs at the consumer level. In the past, improvement decisions
were made mostly through visual observations rather than using any real management tool. More
recently, a tool called EPD (Estimated Progeny Difference) has aided producers in management
decisions. EPD’s can be described as the potential of an animal to pass certain characteristics on to their
offspring (Hansen et al. 2006). For example, a producer may wish to increase rib eye size or percent

2
retail product in their calf crop for a given year. Selecting a bull with a rib eye area (REA) EPD that is
higher than the current bull being used should increase rib eye area, or percent retail product, in
offspring.
While EPD’s have made management decisions such as improving carcass characteristics more
efficient, nothing can replace actual carcass data. Carcass data involves collecting information about the
animal at the time of harvest. Information such as rib eye size, fat thickness, marbling score, quality
grade, yield grade, and kidney, pelvic and heart fat is collected and used to determine carcass merit.
Large scale meat packing houses base the value of beef on this information. The problem with this
system is that many producers never discover how their calves perform based on carcass merit. Perhaps
it is the independent nature of the beef industry or maybe the lack of a clear communication pathway
from the packer to the producer that makes sharing carcass data difficult. Whatever the reason, carcass
data would provide producers with another tool to make improvements in their herds and subsequently
improve profitability. There is a large difference in dollar value between top end carcasses and bottom
end carcasses (Smith 2007).
The process of gaining carcass data is not an easy task and is virtually impossible unless one
engages in a program like the Tennessee Beef Evaluation or contracts a firm like The Beef Connection.
Both entities will provide feed lot performance information and carcass data on each calf entered. The
downside to these programs is various fees as well as some market risk. Some producers have also
found that local steer shows provide adequate carcass information for their operation.
Over the course of the past several years carcass merit of many cattle coming from middle
Tennessee has declined. This could be due to many factors, but issues such as lack of hybrid vigor (from
cross breeding) and consistently choosing bulls with low birth weight EPDs could be factors.

3
Niche marketing of beef has become popular in recent years. Some of this has been done via
specialty marketing programs, while others rely on direct sales from the farm. The intriguing aspect of
this trend is that a carcass that doesn’t meet the standard quality and yield (Choice, Yield Grade 3) can
still be sold for a premium based on the niche marketing. This trend magnifies the importance of
carcass merit for animals a producer is marketing. Consumer’s desire consistency and a lack thereof
may result in lost sales and reduced customer base.
No matter how producers market calves, they must have some understanding of what carcass
characteristics they are producing to maximize profit potential (Haag 2009).
Objectives
The objective of this study is to examine carcass data from the Clarksville Better Beef Show
(2003 to 2008) to determine if carcass merit is declining.

4
Literature Review
What is Carcass Merit?
Carcass Merit includes all of the factors taken into consideration when placing a grade or value
on a carcass. Carcass merit is determined by the yield grade and quality grade of a carcass.
Yield Grade
Yield Grade refers to the amount of beef product that will come from a carcass. Yield Grade is
defined as the combined yield of closely trimmed (1/2 inch fat or less), boneless retail cuts from major
wholesale cuts that include: sirloin, round, short loin, ribs and chuck (USDA 1997).
Four characteristics are considered in determining yield grade (USDA 1997):
1. External fat thickness over the 12th and 13th rib (Back Fat) measured in 1/10 inch.
2. Percent kidney, pelvic and heart fat (KPH) given as a percent of body weight.
3. Ribeye size is determined as the area in square inches of the ribeye muscle at the 12th rib.
4. Hot carcass weight (HCW) which is the weight of the carcass after all the head, feet, tail and
intestines are removed. This is also referred to as the rail weight or hanging weight as well because
the carcass will be hanging on a rail (Wagner and Osborne 1997).
Quality Grade
Quality Grade is a term used to describe the potential eating experience of a piece of beef.
More specifically, quality grade refers to the tenderness, juiciness and flavor of the cooked product
(Tatum 1996). There are two factors that affect quality grade determination, maturity and marbling.

5
Maturity
Maturity class represents the physiological age of the aniaml with letters (A through E) assigned to each
class:
A maturity <30 months B maturity 30‐42 months C maturity 42‐72 months D maturity 72‐96 months E maturity 96 < months Maturity class is determined by using the following indicators: ossification of cartilage, color and texture of ribeye muscle on the beef carcass (Hale et al. no date)
Marbling
Marbling is determined by estimating the amount of intramuscular fat in the muscle
Marbling scores range from “abundant to “practically devoid” (Table 1, Hale et al. no date). Generally,
the greater the marbling score, the better the quality grade. Together marbling and maturity are used
to determine the quality grade of a beef carcass. USDA (1997) illustrates the relationship between
marbling and maturity in determining the quality grade (Figure 1). As degrees of marbling increase the
quality grade increases as well. As the maturity class moves past class A, the carcass value usually
decreases.
Determining Carcass Merit
Ultrasound
Carcass data can also be obtained by using ultrasound technology to scan and predict carcass
traits in live animals, either breeding or finished cattle (Drake 2004). This process must be done by a
trained individual and is especially useful on breeding stock that will not go to slaughter. Rincker (2006)

6
used methods to evaluate carcass traits and found that ultrasound was the most effective at visual
assessment of carcass traits as compared to genetic markers and Estimated Progeny Differences (EPDs).
Genetic Tests
Genetic tests are possibly the newest option available to beef producers to determine
information on their animals, including carcass merit. These genetic tests locate the potential for
change on the gene pairings of the animal.
“While not actually carcass data, new technology using the principles of DNA analysis is
identifying the genes that may be important in controlling carcass traits. For example,
this technology will not measure the degree of marbling or the corresponding quality
grade, but instead it might determine the presence or absence of genes that control
marbling” (Drake 2004).
While genetic tests are useful in combination with tools such as EPDs, they are not 100%
dependable for carcass characteristic prediction. It is important to note that carcass merit is a complex
trait and is affected by many genes; therefore it is difficult to find specific DNA markers for all of the
genes involved (Eenennaam 2007). As more research is done on genetic testing, this tool will become
more important and more common in predicting beef carcass merit.
Estimated Progeny Differences
For several years now EPDs have been utilized in the beef industry. Though this tool has many
flaws, it has proven to be very useful. Recently, EPDs have expanded to include carcass traits to aid
producers with selection for carcass quality. EPDs associated with carcass quality include carcass weight
EPD, ribeye area EPD, marbling EPD, fat thickness over the 12th and 13th rib EPD, and percent retail
product EPDs (Crouch 1997). Carcass EPDs are expressed at a constant slaughter age endpoint, usually
around 480 days of age. The data for these EPDs come from slaughter of steer and heifer progeny,
ultrasound scan data from yearling bulls, and heifer progeny (Greiner 2002). It is important to note that

7
EPDs are compared to breed average when no other animals are being compared. In other words when
looking at Carcass Weight EPDs of Bull A by himself one would compare it to the breed average. When
looking at Bull A vs. Bull B one would compare the EPD’s of the two.
Carcass Weight
Carcass weight EPD measures the difference in HCW (hot carcass weight) of the offspring of
sires at 480 days old compared to breed average (Crouch 1997). For example, if Bull A has a carcass
weight EPD of +10 and Bull B has a Carcass Weight EPD of 0, then you would expect Bull B to sire calves
having a 10 lb lighter HCW than calves from Bull A.
Ribeye Area EPD
Ribeye area is expressed in square inches and refers to the rib eye area between the 12th and
13th rib location. Ribeye area is an objective assessment of muscling and an indicator of total muscle in
the carcass or live animal (Greiner 2002). For example, Bull A has a ribeye area EPD of +0.50in2 and Bull
B has a ribeye area EPD of +0.75in2 you would expect for the offspring of Bull B to have a ribeye area
that is 0.25in2 larger than that of the offspring of Bull A.
Marbling/Intramuscular Fat
Marbling EPDs are expressed as an increase or decrease in potential marbling scores. Marbling
is the intramuscular fat that flavors the meat. The marbling EPD describes the potential for the marbling
trait to be passed from sire to his offspring. EPDs that are generated from ultrasound data actually
reflect the intramuscular fat content in the muscle. Marbling score and percent intramuscular fat are
directly related to one another; therefore selection for high intramuscular fat would result in higher
marbling scores.
Fat Thickness
The measurement of fat thickness, like the ribeye measurement, is taken between the 12th and
13th rib. This fat is located between the muscles and the hide and is often called external fat, rib fat or

8
back fat. Fat thickness is used in calculating the yield grade. As fat thickness increases, yield grade
increases making the carcass less desirable. While external fat is considered to be a waste of product,
some external fat protects the meat from chilling too quickly in the cooler and improves flavor (Drake
2004).
Percent Retail Product
Percent retail product EPDs predict differences among animals in the yield of closely trimmed
retail cuts from the carcass and are expressed on a percentage basis. The same characteristics used in
calculating the USDA yield grade equation (carcass weight, ribeye area, fat thickness and %KPH) are used
in determining percent retail product. Sires that have higher percent retail product EPDs are expected
to produce progeny with higher cutabililty and more desirable yield grades (Greiner 2002).
Niche Marketing of Beef
Niche marketing of beef has been around many years. Over the last several years the “Buy
Local” trend has added to the demand for niche beef. Niche beef can include, but is not limited to, lean
beef, all natural beef, organic beef, grass fed beef, miniature breed beef or simply beef marketed
directly from the farm. Consumers that prefer these alternative beef Choices sometimes find it difficult
to find the product that they want (Fanatico 2006). Niche marketing has allowed producers to market
cattle that do not typically fit into standard marketing situations, thus enhancing sustainability and
profitability.
Current Carcass Trends
The typical carcass that the major meat packers desire is a carcass with a yield grade 3 and a
quality grade of mid Choice to low Choice. The base price on beef carcasses are derived from carcasses
with the following characteristics; HCW between 575lb – 999lbs, yield grade of 3, Choice grade and

9
under 30 months of age (National Beef Grid Definitions 2009). These statistics for base carcass pricing
have remained constant over many years. While the base determinate has remained consistent, the
statistics from the feedlots have not. Randy Blach, executive vice president of Cattle‐Fax (in Rasby 2007)
summarized recent carcass trends by saying the following: average weight put on in the feedyard
increased 166lbs from 1980 to 2006;average weight in fed cattle increased 180lbs from 1985 to2006;
carcass weights have increased 150lbs over the last 25 year;, 30 to 40% of cattle in 2006 were yield
grade four and in spite of all the increases in days on feed and carcass weights, the quality grades are
falling. The trends from the feedlots are fairly alarming. Possibly the lack of performance information
sent back to the cow/calf producer is contributing to these trends. While the tools that are in place are
helpful, nothing replaces carcass merit data. Everything starts with the cow/calf producer and this too is
where the improvements should begin (Crouch 1997).

10
Materials and Methods
Animals
During the last six years, over 700 steers have entered in the Clarksville Better Beef Show (held
every May in Clarksville, Tennessee). One aspect of the show is carcass merit, commonly referred to as
“The Carcass Show”. Having this many animals each year produces a wealth of carcass data that can be
useful in determining trends in local beef. Like any other show, there are some full‐blooded animals
from their respective breeds and some cross bred or commercial breed animals. This is similar to what
one would expect at a feed lot.
For the purpose of this project, data from the 2003 – 2008 Clarksville Better Beef shows have
been examined. Each year, around the first weekend in December, the steers were brought into the
Kentucky‐Tennessee Livestock Center in Guthrie, KY for the initial weigh‐in. Steers weighed from 550 lbs
to 800 lbs. Over the next 155 days, the steers were fed a ration at the owner’s discretion. The goal was
to have the steers at finishing weight by the 1st of May (when the show was held). The average weight
of the animal was approximately 1230 lbs.
After the show, the steers were harvested at the Tyson plant in Joslin, IL (or one of the local
processing plants near Montgomery County, TN) depending on who purchased the steers. Animals
purchased by Tyson were immediately transported to the Tyson plant (Joslin IL). Animals going to the
local facilities were transported that evening or early the next morning. Upon arrival to the processing
plant the animals were harvested and processed according to standard protocol.

11
Data Collection
The data collection team was headed by Montgomery County Extension agent, John Bartee. Mr.
Bartee has over 30 years experience working with beef grading including being a former grader for the
state of Tennessee. The team headed to the Tyson plant in Joslin IL the morning after the steer show to
collect the carcass data. Annually, more than half of all the steers entered in the Clarksville Better Beef
Show were processed at the Tyson plant. This is unique because large scale packers rarely allow civilians
access to their grading floor. With the help of Lee Denzer from Black Hawk University, the team was
allowed full access to record the grades assigned by the USDA grader. Beginning in 2007, instrument
grading, a fairly new concept in the beef industry, was used. Industry professionals speculate that these
instruments will replace human grading in the near future.
Carcass data was collected from the local facilities over the two days following the show.
Grades were assigned by Mr. Bartee, since these facilities are not served by a USDA grader.
The data collected each year included: calf ID number, yield grade, hot carcass weight, dressing
percentage, rib fat, kidney, pelvic and heart fat and average daily gain. The data were processed and
sorted in a Microsoft (MS) Excel spreadsheet.
Data Analysis
To look for trends over time, MS Excel was used to conduct simple linear regression analyses
with time as the independent variable and rib eye area, hot carcass weight, dressing percentage and
yield grade as the dependent variables. Each dependent variable was analyzed separately. Years were
assigned values of 0, 1, 2 etc., to simplify interpretation of the results. Correlation coefficients among all

12
measured characteristics were also calculated using MS Excel. To look at trends in quality grade, linear
and polynomial regression was conducted in MS Excel with year as the independent variable and
percent of animals in either Choice or Select grades as the dependent variables.

13
Results and Discussion
Ribeye Size
Over the last six years, mean ribeye size generally decreased by about 2 in2, from a mean of 13.2
in2 in 2003 to a mean of 12.0 in2 in 2008 (Table 2, Figure 2). However, the mean in 2006 was also 13.2
in2, so there were exceptions. Because ribeye size is an indicator of an animal’s muscling ability, a
smaller ribeye would translate into smaller carcasses and perhaps a higher yield grade.
Regression analysis over time showed that there was a significant (P=0.00001) negative
relationship between ribeye area and year (Table 3). However, R2 value (0.0263) was very low,
indicating that, although significant, this relationship was weak and there may have been other factors
that influenced ribeye area.
Ribeye was negatively correlated (P<0.01) with year (r=‐0.16), yield grade (r=‐0.46), and rib fat
(r=‐0.20; Table 4). It was positively correlated (P<0.01) with HCW (r=0.40), as would be expected.
HCW
Over the last six years, the mean HCW has decreased from 792 lbs in 2003 to 753 lbs in 2008
(Table 2, Figure 3). The mean did decrease each year with the exception of 2008 in which there was a
mean increase of 4 lbs. Though there were decreases in HCW from 2003 to 2007, the weights were still
within acceptable industry standards for HCW.
Regression analysis over time showed that there was a significant (P=0.00002) negative
relationship between HCW and year (Table 3). However the R2 value (0.0255) was very low, indicating
that, although significant, this relationship was weak and there were many other factors that influenced
HCW.

14
HCW was negatively correlated (P<.01) with year (r=‐0.16; Table 4). It was positively correlated
(P<0.01) with yield grade (r=0.30), rib fat (r=0.35) and ribeye (r=0.40; Table 4) as expected as well.
Dressing Percentage
Dressing percentage has generally decreased over the last six years, although there was an
increase from the previous year in 2005 and 2008 (Table 2, Figure 4). In 2003 the average dressing
percentage was 63.8% while in 2008 the average was 62.2% (Table 2). In 2005 there was an increase to
63% and in 2008 there was an increase to 62.2%. Again the dressing percentage means for each year
were close to industry standards (Springer et al. 2009).
Regression analysis over time did not show that there was a significant (P= 0.49; Table 3)
relationship between dressing percentage and year.
Dressing percentage was not significantly correlated with any of the other factors reported for
this project.
Rib Fat
Rib fat mean remained fairly consistent over the six years with slight declines in 2005, 2006 and
2007 (Table 2, Figure 5). The means for the amount of rib fat were not out of the ordinary for any of
the six years represented.
The regression analysis over time showed that there was no significant (P=0.6227) relationship
between rib fat and year (Table 3). Rib fat was positively correlated (P<0.01) with yield grade(r=0.80)
and HCW (r=0.35; Table 4). It was negatively correlated (P<0.01) with ribeye (r=‐0.16; Table 4).

15
Yield Grade
Over the last six years, yield grade has increased with the exception of 2005 (Table 2, Figure 6).
While there was a numerical increase in yield grade means, there was no increase in actual yield grade.
Yield grades are only given in whole numbers and are not rounded up, but are instead always rounded
down to the nearest whole number (Parish et al. 2009). Therefore mean yield grades remained constant
(at yield grade 2) over the six year project.
Regression analysis over time showed that there was a significant (P=0.03906) positive
relationship between yield grade and year (Table 3). However, the R2 value (0.0058) was very low, again
indicating that, although significant, many other factors influenced yield grade.
Yield grade was negatively correlated (P<0.01) with ribeye area (r=‐0.46; Table 4). It was
positively correlated (P<0.01) with HCW (r=0.30), rib fat (r=0.80) and ADG (r=0.17; Table 4).
Quality Grade
Quality grade remained fairly constant over the six year project as well. Choice and Select is
where the majority of the carcasses graded. Choice and Select carcasses made up over 90% of all the
carcasses studied with the majority of those grading Choice (Figure 7).
Regression analysis over time showed that was no significant relationship between percent of
animals with a grade of Choice and year, and between percent of animals with a grade of Select and
year for either linear regression (not shown) or curvilinear regression (Figure 8). Figure 8 show that the
Choice curve and Select curve mirror one another. The number of Choice grades increases as Select
grades decrease.
16
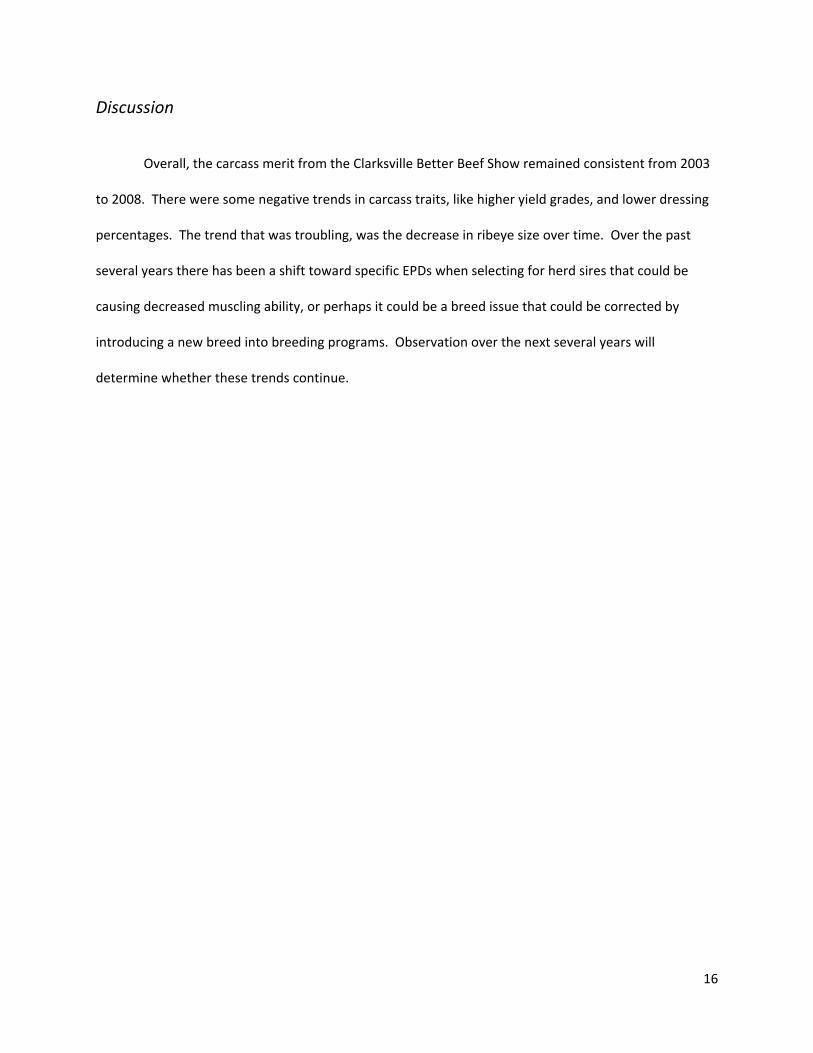
Discussion
Overall, the carcass merit from the Clarksville Better Beef Show remained consistent from 2003
to 2008. There were some negative trends in carcass traits, like higher yield grades, and lower dressing
percentages. The trend that was troubling, was the decrease in ribeye size over time. Over the past
several years there has been a shift toward specific EPDs when selecting for herd sires that could be
causing decreased muscling ability, or perhaps it could be a breed issue that could be corrected by
introducing a new breed into breeding programs. Observation over the next several years will
determine whether these trends continue.

17
Conclusion
According to trends in data over the past six years, carcass merit of the cattle at the Clarksville
Better Beef Show is generally declining. Regression analysis showed significant negative slopes, though
R2 values were very low, indicating that there was much unexplained variability in the carcass
characteristics studied. There are many factors that may explain these declines. One could speculate
that cattle in this study had lower carcass merit over time due to genetic short comings. Many cow/calf
producers have been selecting bulls with low birth weight EPDs. While this is an acceptable strategy for
first calf heifers, older cows should probably be bred to bulls with more aggressive EPDs to encourage
ultimate growth potential. In addition, cattle in this study were not on the same ration or in the same
environment. To better examine carcass merit data, experiments with more cattle and more controlled
finishing environments would be required. While the carcass data collected over the last six years may
prove to be a very valuable teaching tool, the linear regression models do not show any strong trends in
data over time.
Many studies have been done on carcass information related to various feed rations and feeding
programs. There are companies that provide producers with carcass data, but the private nature of the
beef industry has not allowed this information to be shared with the public.

18
Tables and Figures
Table 1. The quality grade of beef is based on marbling scores (from Hale no date). Previously the marbling score is not reported, but with new instrument grading the marbling score is now recorded.
Grade Marbling Score
Prime +* Abundant 00-100**
Prime °* Moderately Abundant 00-100**
Prime -* Slightly Abundant 00-100**
Choice +* Moderate 00-100**
Choice °* Modest 00-100**
Choice -* Small 00-100**
Select +* Slight 50-100**
Select -* Slight 00-49**
Standard +* Traces 34-100**
Standard °* Practically Devoid 67-100** to
Traces 00-33**
Standard -* Practically Devoid 00-66**
*represents quality grade. + is high range, o is mid range and ‐ is low range
**is the corresponding marbling score.

19
Figure 1. Relationship between Marbling, Maturity and Carcass Grade* (from USDA 1997) *Assumes that firmness of lean is comparably developed with the degree of marbling and that the carcass is not a "dark cutter." **Maturity increases from left to right (A through E) *** The A maturity portion of the figure is the only portion available to bullock carcasses
20
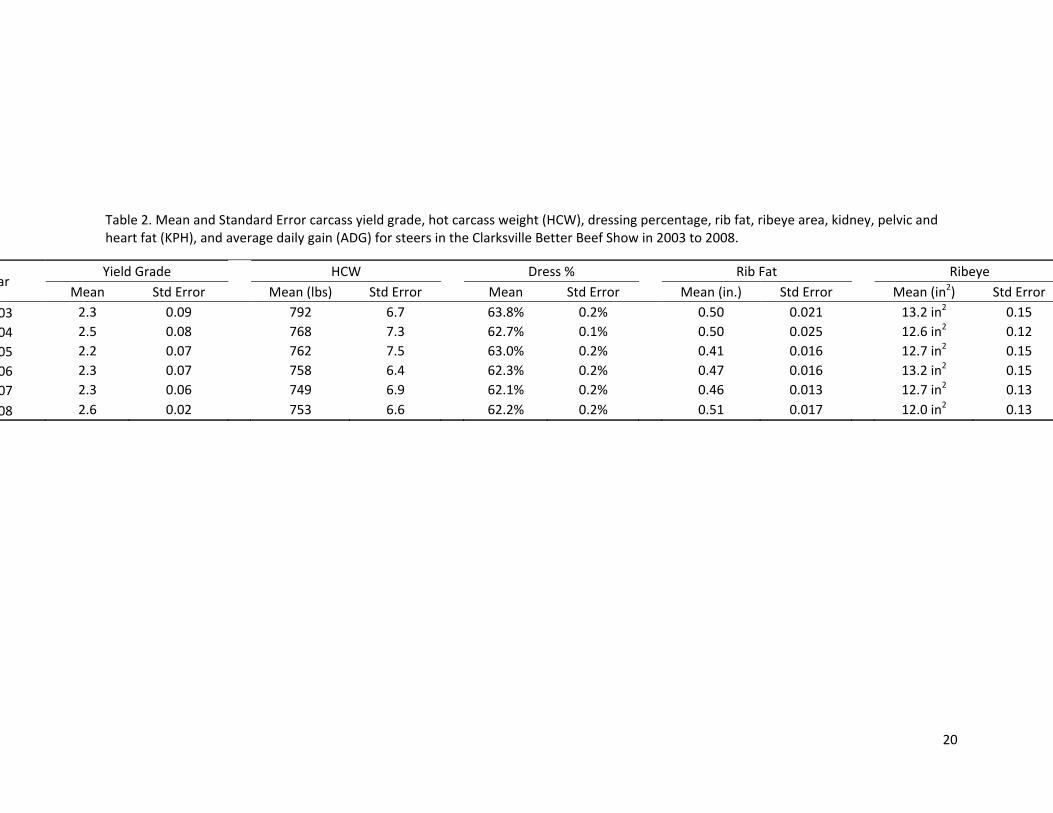
Table 2. Mean and Standard Error carcass yield grade, hot carcass weight (HCW), dressing percentage, rib fat, ribeye area, kidney, pelvic and heart fat (KPH), and average daily gain (ADG) for steers in the Clarksville Better Beef Show in 2003 to 2008.
ar Yield Grade HCW Dress % Rib Fat Ribeye
Mean Std Error Mean (lbs) Std Error Mean Std Error Mean (in.) Std Error Mean (in2) Std Error 03 2.3 0.09 792 6.7 63.8% 0.2% 0.50 0.021 13.2 in2 0.15 04 2.5 0.08 768 7.3 62.7% 0.1% 0.50 0.025 12.6 in2 0.12 05 2.2 0.07 762 7.5 63.0% 0.2% 0.41 0.016 12.7 in2 0.15 06 2.3 0.07 758 6.4 62.3% 0.2% 0.47 0.016 13.2 in2 0.15 07 2.3 0.06 749 6.9 62.1% 0.2% 0.46 0.013 12.7 in2 0.13
08 2.6 0.02 753 6.6 62.2% 0.2% 0.51 0.017 12.0 in2 0.13

21
Figure 2. Mean ribeye size by year of steers in the Clarksville Better Beef Show, 2003‐2008. **Significant at P<0.01
Table 3. Summary of regression analyses with time as the independent variable and ribeye area, hot carcass weight (HCW), dressing percentage, yield grade, average daily gain (ADG) and rib fat as the dependent variables.
Carcass Trait
Slope Coefficients
Y Intercept R Square Significance F
Ribeye Area ‐0.151 13.11 0.0263 0.00001
HCW ‐7.299 781.64 0.0255 0.00002
Dressing % ‐0.002 0.63 0.0006 0.48759
Yield Grade 0.037 2.27 0.0058 0.03906
Rib Fat 0.002 0.47 0.0003 0.6227
0.00
2.00
4.00
6.00
8.00
10.00
12.00
14.00
16.00
2003 2004 2005 2006 2007 2008
Rib Eye size in
Squ
are Inches
Year
y=13.11 ‐.151xR2 = 0.0263**

22
Table 4. Table 4 shows the correlation between the various carcass factors. *Indicates that the correlation coefficient is significant at the .05 level. **Indicates that the correlation coefficient is significant at the .01 level.
Year Yield Grade HCW Dress % Rib Fat Rib Eye
Yield Grade 0.08*
HCW ‐0.16** 0.30**
Dress % ‐0.03 0.03 ‐0.04
Rib Fat 0.02 0.80** 0.35** ‐0.03
Rib Eye ‐0.16** ‐0.46** 0.40** ‐0.09* ‐0.16**
ADG ‐0.10** 0.17** 0.36** 0.01 0.20** 0.11**
Figure 3. Mean hot carcass weight by year of steers in the Clarksville Better Beef Show, 2003‐2008 **Significant at P<0.01
0.00
100.00
200.00
300.00
400.00
500.00
600.00
700.00
800.00
900.00
2003 2004 2005 2006 2007 2008
Hot Carcass W
eight in lbs
Year
y=781.64 ‐ 7.299xR2 = 0.0255**

23
Figure 4. Mean dressing percentage by year of steers shown at the Clarksville Better Beef Show, 2003‐2008. NS‐Not significant at P≤0.05
Figure 5. Mean rib fat by year of steers in the Clarksville Better Beef Show, 2003‐2008 NS‐Not significant at P≤0.05
0.00%
10.00%
20.00%
30.00%
40.00%
50.00%
60.00%
70.00%
2003 2004 2005 2006 2007 2008
Dressing Pe
rcen
tage
Year
y=0.63 ‐ 0.002xR2 = 0.0007 NS
0.00
0.10
0.20
0.30
0.40
0.50
0.60
2003 2004 2005 2006 2007 2008
Rib Fat/Inches
Year
y=0.47 + 0.002xR2 = 0.0003 NS

24
Figure 6. Mean yield grades by year of steers in the Clarksville Better Beef Show, 2003‐2008. *Significant at P<0.05
Figure 7. Quality Grade by year of steers shown at the Clarksville Better Beef Show, 2003‐2008.
0.00
0.50
1.00
1.50
2.00
2.50
3.00
2003 2004 2005 2006 2007 2008
Yield Grade
Year
y=2.27 + 0.037xR2 = 0.0058*
9%
1% 2% 1% 2% 1%5%
1%5%
2% 4%8%
40%
31% 32% 30%
40% 39%44%
64%
58%
64%
54%50%
2% 3% 3% 3%0% 2%
0%
10%
20%
30%
40%
50%
60%
70%
2003 2004 2005 2006 2007 2008Qua
lity Grade
Percentage
YearDark Cutter Standard Select Choice Prime

25
Figure 8. Number of Choice and Select quality grades by year of steers shown at the Clarksville Better Beef Show, 2003‐2008
0
10
20
30
40
50
60
70
2003 2004 2005 2006 2007 2008
Num
ber of Carcasses
Year
Select Choice
y=1.36x2 – 6.21x + 38.43
y=‐2.43x2 + 12.31 + 47.14

26
References
Crouch, J. 1997. Carcass Merit: Using Carcass EPDs Can Add Value to Beef Cattle Operations. American Angus Association. www.albcia.org/Carcass_Merit‐Use_of_Carcass_EPDs.html Accessed on June 19, 2009.
Drake, D. J. 2004. Understanding and Improving Beef Cattle Carcass Quality. Publ 8130. University of California: Division of Agriculture and Natural Resources. http://ucanr.org/freepubs/docs/8130.pdf Accessed Nov. 8, 2009.
Eenennaam, A. V. 2007. DNA Markers: Explanation of Validation and Utilization. University of California at Davis: UC Davis Cooperative Extension. http://animalscience.ucdavis.edu/animalbiotech/Outreach/VanEenennaam%20PopularPressArticle.pdf Accessed Nov. 8, 2009.
Fanatico, A. 2006. Beef Marketing Alternatives. National Sustainable Agriculture Information Service. http://attra.ncat.org/attra‐pub/PDF/altbeef.pdf Accessed Nov. 8, 2009.
Greiner, S.P. 2002. Understanding Expected Progeny Differences (EPDs). Publication Number 400‐804. Virginia Tech University: Virginia Cooperative Extension.
Haag, E. 2009. Beef Processing 300. Angus Journal, May 2009. P54
Hale, D.S., K. Goodson, J.W. Savell. no date. Beef Quality and Yield Grades. Department of Animal Science. Texas Agriculture Extension Service. http://meat.tamu.edu/beefgrading.html. Accessed June 6 , 2008
Hansen, G.R. and D.G. Riley. 2006. Expected Progeny Differences in Beef Cattle. University of Florida IFAS Extension. Publ. #AN164. http://edis.ifas.ufl.edu/AN164 Accessed Nov. 13, 2009
National Beef Grid Definitions: Updated August 24, 2009. http://www.nationalbeef.com/PDFs/NationalBeefGridDefinitions.pdf Accessed Nov. 8, 2009
Parish, J.A., J.D. Rhinehart, and J.M. Martin. 2009. Beef Grades and Carcass Information. Mississippi State University Cooperative Extension Service. Publ. 2522
Rasby, R. 2007. Beef Carcass Trends. Animal Science Department, University of Nebraska. http://beef.unl.edu/stories/200708230.shtml Accessed on June 6, 2008
Rincker, C.B. 2006. Predicting Carcass Composition in Early‐Weaned Simmental Steers Using a Combination of Real‐time Ultrasound, Live Evaluation, Carcass Expected Progeny Differences and GeneSTAR Marbling Marker. American Registry of Professional Animal Scientists. 22:144‐152 Provided by ProQuest Information and Learning Company.
Springer, J.D., J.T. Biermacher, M.D. Childs, D.O. Alkire and B. Grooms. 2009. Attributes Preferred and Premiums Offered for Naturally Produced Beef Cattle. Southern Agriculture Economics Association Annual Meeting, Georgia, January 31‐February 3, 2009.
Smith, T. 2007. What is good carcass data, and what is it worth. Consumers First Beef Partners. www.beefquality.biz/BQCContent/tabid/55/Default.aspx?tid=1&cid=7495 Accessed on Oct. 9, 2009

27
Tatum, D. 1996. Beef Grading. Department of Animal Science, Colorado State University. http://www.beefresearch.org/CMDocs/BeefResearch/Beef%20Grading.pdf Accessed on Nov. 8, 2009.
USDA 1997. United States Standards for Grades of Carcass Beef. United States Department of Agriculture. http://www.ams.usda.gov/AMSv1.0/getfile?dDocName=STELDEV3002979 Accessed Dec. 12, 2009.
Wagner, W.R. and P.I. Osborne. 1997. Quality and Yield Grades in Beef Cattle. West Virginia University Extension Service. http://www.caf.wvu.edu/~forage/yieldgrd/yieldgrades.htm Accessed on Nov. 13, 2009.