
Carboxymethyl Chitosan as a Selective Depressant in ... xanthate collectors. However, ... Figure 3.3...
93
Carboxymethyl Chitosan as a Selective Depressant in Differential Flotation of Galena and Chalcopyrite by Yahui Xiang A thesis submitted in partial fulfillment of the requirements for the degree of Master of Science in Chemical Engineering Department of Chemical and Materials Engineering University of Alberta © Yahui Xiang, 2015
Transcript of Carboxymethyl Chitosan as a Selective Depressant in ... xanthate collectors. However, ... Figure 3.3...

Carboxymethyl Chitosan as a Selective Depressant in Differential Flotation of Galena
and Chalcopyrite
by
Yahui Xiang
A thesis submitted in partial fulfillment of the requirements for the degree of
Master of Science
in
Chemical Engineering
Department of Chemical and Materials Engineering
University of Alberta
© Yahui Xiang, 2015

ii | P a g e
Abstract
Toxic inorganic depressants are routinely used in the differential flotation of polymetallic
sulfide ores and it is desirable that they be replaced with environmentally benign chemicals.
Chitosan, as a natural and non-toxic polymer, has been proven to be an efficient depressant
for copper sulfide (e.g., chalcopyrite) while allowing lead sulfide (e.g., galena) to be floated
by xanthate collectors. However, the poor solubility of chitosan limits its potential
applications as the flotation could only be carried out at about pH 4 where chitosan is
soluble.
Three carboxymethyl derivatives of chitosan, named N-CMC, O-CMC and N-O-CMC,
were synthesized by introducing carboxymethyl groups on the backbones of chitosan. The
substitution on amino groups significantly improved the solubility of chitosan.
The structures of CMC were studied and compared with chitosan via Fourier transform
infrared spectroscopy (FTIR) and 13C nuclear magnetic resonance (NMR) spectrometry.
Flotation tests were performed on single minerals and mineral mixtures (with weight ratio
of 1:1) with the addition of appropriate amounts of potassium ethyl xanthate (KEX) and
N-CMC. The solution pH was varied from neutral to alkaline. The flotation concentrates
and tailings were collected and analysed for the contents of copper and lead.
Single mineral flotation tests indicated that N-CMC could depress either chalcopyrite or
galena depending on pH. The results were not affected by the sequence of KEX and N-
CMC addition. Therefore, N-CMC is potentially useful in Cu-Pb sulfide separation
following a bulk Cu-Pb flotation. The N-CMC was also found to have surface cleaning
functions, and was able to remove contaminating copper ions from galena surfaces.
The adsorption mechanisms of N-CMC on sulfide minerals were then delineated by several
analysis techniques. Metal ions binding tests showed that N-CMC had a stronger
interaction with Cu2+ than Pb2+. The distribution of N-CMC on mineral mixtures was
mapped out by time-of-flight secondary ion mass spectrometry (ToF-SIMS). The results
of ToF-SIMS analysis confirmed that N-CMC preferentially adsorbed on chalcopyrite at
pH 7 but uniformly distributed on both minerals at pH 10. The high resolution N 1s X-ray

iii | P a g e
photoelectron spectroscopic (XPS) spectra of N-CMC-treated chalcopyrite and galena
showed that chemical bonds formed between the secondary amino groups of N-CMC and
both mineral surfaces. At pH 7, the bond with Cu was stronger than with Pb, while at pH
10, one additional bond was formed between N-CMC and Pb. Zeta-potential measurements
showed the presence of electrostatic interaction between N-CMC and both chalcopyrite
and galena, but it was not the reason for N-CMC’s selective depression of chalcopyrite.
Mineral surface cleaning tests explained the good flotation result in the absence of any
chelating reagents, such as EDTA, since N-CMC also possesses the similar function of
removing the Cu2+ adsorbed on the galena surface.
Overall, the application of N-CMC in sulfide ore flotation is expected to be more robust
than the original chitosan.

iv | P a g e
Acknowledgement
First and foremost, I would like to acknowledge my profoundest gratitude to my supervisor,
Dr. Qi Liu, who showed no hesitation whenever I approached him for help. He is more
than a mentor on my academic career, but also cares about me like a family member. His
sincere attitude when doing research and his kindness for fellows and students made a good
example for me during my graduate study. Without his guidance, support and
encouragement, I would not have accomplished this project so smoothly. It is my luck and
great honor to be his student.
I am very grateful for Dr. Kaipeng Wang who brought out the idea of this study, instructed
me in using experimental instruments, and helped me on editing my papers. I would also
like to thank Dr. Peng Huang, who shared a lot of knowledge and experiences with me,
and helped me with the surface area measurement.
I really appreciate the assistance from Shiraz Merali for conducting the AAS analysis, and
the technicians from ACSES for their help with XPS, ToF-SIMS, FTIR measurements. I
must also acknowledge Erin Furnell and Dr. Chad Liu for letting me use the total carbon
analyzer.
I would like to thank the financial support from Alberta Innovates - Energy and
Environment Solutions (AI-EES) through the Canadian Center for Clean Coal/Carbon and
Mineral Processing Technologies (C5MPT).
Finally, I am very indebted to my husband Chen Wang, who keeps loving and supporting
me throughout the past two years. He was always the first audience for my presentation
and the first reviewer for my paper. His passion and persistence in scientific research also
infected me and encouraged me to work hard. And I shall not fail to express my great
gratitude for my beloved parents, without whose understanding and thoughtfulness, I
would not be able to pursue my master study in Canada. I dedicate this dissertation to my
family with my endless love.

v | P a g e
Table of content
1. Introduction ..................................................................................................................... 1
2. Research Objective and Approach .................................................................................. 3
3. Literature review ............................................................................................................. 4
3.1. Froth flotation ........................................................................................................... 4
3.1.1. Flotation reagents .............................................................................................. 4
3.2. Depressants in differential flotation of sulfide minerals .......................................... 5
3.3. Adsorption mechanism ............................................................................................. 8
3.3.1. Hydrogen bonding ............................................................................................. 8
3.3.2. Hydrophobic interaction .................................................................................... 9
3.3.3. Chemical complexation ................................................................................... 10
3.3.4. Surface charge, electrical double layer and zeta potential ............................... 11
3.3.5. Electrostatic interactions .................................................................................. 14
3.3.6. Surface activation or contamination of sulfide minerals ................................. 15
3.4. Chitosan .................................................................................................................. 15
3.4.1. Structure and property of chitosan ................................................................... 15
3.4.2. Carboxymethylation of chitosan ...................................................................... 18
3.4.3. Application of chitosan and its derivatives ...................................................... 19
4. Experimental ................................................................................................................. 22
4.1. Mineral samples ..................................................................................................... 22
4.2. Reagents and chemicals ......................................................................................... 22
4.3. Carboxymetylation of chitosan .............................................................................. 23
4.3.1. Synthesis of N-carboxymethyl chitosan (N-CMC) ......................................... 23
4.3.2. Synthesis of O-carboxymethyl chitosan (O-CMC) ......................................... 24
4.3.3. Synthesis of N-O-carboxymethyl chitosan (N-O-CMC) ................................. 25
4.4. Structural analysis of carboxymethyl chitosan....................................................... 25
4.4.1. Infrared spectroscopy ...................................................................................... 25
4.4.2. Solid state 13C nuclear magnetic resonance (NMR) spectroscopy .................. 26
4.5. Flotation tests ......................................................................................................... 26
4.5.1. Micro-flotation................................................................................................. 26
4.5.2. Batch flotation ................................................................................................. 28
4.6. Adsorption mechanism studies .............................................................................. 29

vi | P a g e
4.6.1. Metal ion binding tests .................................................................................... 29
4.6.2. ToF-SIMS imaging .......................................................................................... 30
4.6.3. X-ray photoelectron spectroscopy (XPS) ........................................................ 30
4.6.4. Zeta potential measurements ........................................................................... 31
4.7. Mineral surface cleaning test.................................................................................. 32
5. Results and discussion .................................................................................................. 34
5.1. Structural analysis of carboxymethyl chitosan....................................................... 34
5.1.1. Infrared spectroscopy ...................................................................................... 34
5.1.2. Solid state 13C nuclear magnetic resonance (NMR) spectroscopy .................. 36
5.1.3. Summary .......................................................................................................... 39
5.2. Flotation tests ......................................................................................................... 41
5.2.1. Single mineral micro-flotation ......................................................................... 41
5.2.2. Mixed minerals micro-flotation ....................................................................... 45
5.2.3. Batch flotation ................................................................................................. 48
5.2.4 Summary ........................................................................................................... 49
5.3. Adsorption mechanism studies .............................................................................. 49
5.3.1. Metal ions binding tests ................................................................................... 49
5.3.2. ToF-SIMS imaging .......................................................................................... 51
5.3.3. X-ray photoelectron spectroscopy (XPS) ........................................................ 52
5.3.4. Zeta potential measurements ........................................................................... 58
5.3.5. Summary .......................................................................................................... 60
5.4. Mineral surface cleaning tests ................................................................................ 61
6. Conclusions ................................................................................................................... 63
6.1. General findings ..................................................................................................... 63
6.2. Suggested future work ............................................................................................ 64
7. Appendix ....................................................................................................................... 65
7.1. Detailed procedures and raw data for batch flotation test ...................................... 65
7.1.1. Test procedures ................................................................................................ 65
7.1.2. Metallurgical balance ...................................................................................... 67
7.2. Adsorption isotherm ............................................................................................... 68
7.2.1. Experimental procedures ................................................................................. 69
7.2.2. Results and discussion ..................................................................................... 71
References ......................................................................................................................... 73

vii | P a g e
List of Figures
Figure 3.1 Schematics of froth flotation process 4
Figure 3.2 The five-membered ring complex between dextrin and lead 11
Figure 3.3 The eight-membered ring complex between starch or starch fraction (amylose
and amylopection) and hematite 11
Figure 3.4 The dissociation of oxide minerals in aqueous solutions 12
Figure 3.5 Schematic representation of the Gouy-Chapman electrical double layer and
potential drop across the double layer 13
Figure 3.6 Chemical Structure of: a) cellulose, b) chitin and c) chitosan 17
Figure 3.7 Structure of incompletely deacetylated chitosan, a copolymer characterized by
its average degree of deacetylation (DA) 17
Figure 3.8 The chemical structure of phosphorylated chitosan using methanesulfonic
acid as a blocking agent 21
Figure 4.1 The synthesis reaction of N-CMC 23
Figure 4.2 The synthesis reaction of O-CMC 24
Figure 4.3 The synthesis reaction of N-O-CMC 25
Figure 4.4 The micro-flotation device 27
Figure 4.5 JKTech flotation machine: a) side view; b) top view of 1.5 L flotation cell 28
Figure 5.1 The DRIFTS spectra of unmodified chitosan and carboxymethyl chitosan 34
Figure 5.2 Solid-state 13C NMR spectra of chitosan and the three carboxymethyl chitosans
37
Figure 5.3 The structure of chitosan with the positions of carbon marked 37
Figure 5.4 The resolved solid-state 13C NMR spectra of: a) chitosan, b) N-CMC, c) O-
CMC, and d) N-O-CMC 38
Figure 5.5 The resolved solid-state 13C NMR spectra of N-CMC with 3.5 g CHO-COOH
39
Figure 5.6 N-CMC structure 39
Figure 5.7 O-CMC structure 40
Figure 5.8 N-O-CMC structure 40
Figure 5.9 The recovery of single mineral micro-flotation as a function of KEX

viii | P a g e
concentration at natural pH (6.8-7.0). 1.5 g mineral, 150 mL distilled water.
Flotation time: 3 min. (a) The recovery of galena. (b) The recovery of
chalcopyrite 41
Figure 5.10 Single mineral micro-flotation of galena and chalcopyrite using N-CMC as a
depressant and KEX as a collector. 1.5 g mineral, 150 mL distilled water, 2.5
ppm KEX. Flotation time: 3 min. (a) With different concentration of N-CMC
at natural pH (6.8-7). (b) At different pH with 1 ppm N-CMC 42
Figure 5.11 Single mineral micro-flotation of galena and chalcopyrite using N-O-CMC as
a depressant and KEX as a collector. 1.5 g mineral, 150 mL distilled water,
2.5 ppm KEX. Flotation time: 3 min. (a) With different concentration of N-O-
CMC at natural pH (6.8-7). (b) At different pH with 10ppm N-O-CMC for
galena and 3 ppm N-O-CMC for chalcopyrite 44
Figure 5.12 Mixed minerals micro-flotation of galena and chalcopyrite (weight ratio 1:1)
using N-CMC as a depressant and KEX as a collector. 1.5 g mineral, 150 mL
distilled water. Flotation time: 3 min. (a) 1 ppm N-CMC followed by 2.5 ppm
KEX, pH 6.8; (b) 1 ppm N-CMC followed by 2.5 ppm KEX, pH 10; (c) 2.5
ppm KEX followed by 5 ppm N-CMC, pH 6.8; (d) 2.5 ppm KEX followed
by 5 ppm N-CMC, pH 10 46
Figure 5.13 Mixed minerals micro-flotation of galena and chalcopyrite (weight ratio 1:1)
using N-O-CMC as a depressant and KEX as a collector. 1.5 g mineral, 150
mL distilled water. Flotation time: 3 min. 2.5 ppm KEX followed by 10 ppm
N-O-CMC, pH 10 47
Figure 5.14 Batch flotation for mixed minerals of galena and chalcopyrite 48
Figure 5.15 Photometric dispersion analyzer root-mean-square output of Cu2+ and Pb2+
binding with N-CMC. 20 mL cupric sulfate or lead nitrate solution (0.1 mol/L)
was titrated with a 0.2 g/L N-CMC solution in 0.25 mL increment every 30
seconds 50
Figure 5.16 Negative ions spectra at natural pH (107 μm ×107 μm) 51
Figure 5.17 Positive ions spectra at pH 10 (55.7 μm × 55.7 μm) 52
Figure 5.18 The resolved narrow scan N 1s spectrum of chitosan 53
Figure 5.19 The resolved narrow scan N 1s spectrum of N-CMC 53
Figure 5.20 The resolved narrow scan N 1s spectrum of N-CMC on chalcopyrite at pH 7
54
Figure 5.21 The resolved narrow scan N 1s spectrum of N-CMC on chalcopyrite at pH 10

ix | P a g e
55
Figure 5.22 The resolved narrow scan N 1s spectrum of N-CMC on galena at pH 7 56
Figure 5.23 The resolved narrow scan N 1s spectrum of N-CMC on galena at pH 10 57
Figure 5.24 Zeta potentials of chalcopyrite and galena at different pH, with or without
N-CMC 59
Figure 5.25 The concentration of copper ions released to HCl solution from Cu-coated
galena sample. The Cu-coated galena sample was either treated with N-CMC
(“With N-CMC”) or not treated with N-CMC (“Blank”) before being washed
by the HCl solutions 61
Figure 5.26 The N-C-C-O sequence in the structure of: a) EDTA; b) N-CMC 62
Figure 7.1 The standard curve 70
Figure 7.2 The adsorption isotherm (natural pH: 5.5-6.5, 25 ℃) of N-CMC on chalcopyrite
and galena 71
Figure 7.3 Effect of pH on the adsorption of N-CMC on chalcopyrite and galena with
100 ppm N-CMC 72

x | P a g e
List of Tables
Table 3.1 Some inorganic depressants and their primary functions in differential flotation
of sulfide minerals 6
Table 7.1 Detailed procedures for batch flotation test 65
Table 7.2 Raw data and calculations for bulk flotation 67
Table 7.3 Raw data and calculations for Cu-Pb separation 68

1 | P a g e
1. Introduction
In the differential flotation of complex sulfide ores, depressants are usually added to
selectively prevent a certain mineral from floating. The currently used depressants in
industry are mostly inorganic, such as sodium cyanide (NaCN), potassium dichromate
(K2Cr2O7) and potassium permanganate (KMnO4). These inorganic depressants are very
effective but also toxic and hazardous, resulting in potential harms to both human and
environment. In this respect, the study on natural polysaccharide depressants, which are
non-toxic and biodegradable, becomes very desirable and increasingly attracts attention
(Rath & Subramanian, 1999).
For the past few decades, the research works on polysaccharide depressants have been
mainly focused on starch, dextrin, carboxymethyl cellulose and guar gum. Only recently,
chitosan was shown to be a selective depressant for chalcopyrite in the differential flotation
of galena and chalcopyrite by Huang et al. (2012a, 2012b). Chitosan is a non-toxic
polyaminosaccharide which possesses a large number of amino and hydroxyl groups.
These provide active sites for the formation of metal complexes and the substitution of new
functional groups (Juang et al., 1999).
Though chitosan showed good selectivity which can depress chalcopyrite without affecting
the flotation of galena as recorded by Huang et al. (2012a), its depressive function was only
observed at the acidic pH of 3 to 5. At higher pH, chitosan was insoluble in water and
depressed both galena and chalcopyrite. This disadvantage limits its potential application
as sulfide mineral flotation is usually carried out under alkaline conditions (Jayakumar et
al., 2010; Wills & Napier-Munn, 2006).
The solubility of chitosan can be greatly improved by carboxymethylation (Muzzarelli,
1988). The carboxymethyl chitosan was found to have a stronger chelation ability to metal
ions than the parent chitosan (Delben et al., 1989). Dobetti & Delben (1991) reported that
it was the carboxyl groups and amino groups that provided sites for binding with Cu2+.
Muzzarelli et al. (1982) pointed out that the effectiveness of carboxymethyl chitosan as a
chelation agent for metal ions was due to its bidentate functions, and the secondary and
tertiary alcoholic groups present on a single polymer chain.

2 | P a g e
The main purpose of this study is, therefore, to synthesize the carboxymethyl chitosan, test
its efficiency as a selective depressant in the differential flotation of chalcopyrite and
galena, and investigate its adsorption mechanism on the mineral surfaces. The significance
of conducting this research work is profound since it is vitally important to find effective
and non-toxic replacements for inorganic depressants in the flotation industry. The new
application of chitosan and its carboxymethyl derivative will also be of interest for
researchers in various areas.

3 | P a g e
2. Research Objective and Approach
As mentioned in Chapter 1, the objective of this study is to investigate the efficiency and
adsorption mechanism of carboxymethyl chitosan as a depressing reagent in the differential
flotation of galena and chalcopyrite. Chalcopyrite and galena were chosen as they are the
most common sulfide minerals coexisting in polymetallic sulfide ores. Potassium ethyl
xanthate (KEX) was used as a collector. Carboxymethyl derivatives of chitosan were
synthesized, and their structures were determined by Fourier transform infrared
spectroscopy (FTIR), solid state 13C nuclear magnetic resonance (NMR) spectroscopy and
X-ray photoelectron spectroscopy (XPS). The selective depressing effect of carboxymethyl
chitosan was studied in both micro and batch flotation of chalcopyrite and galena. The
flotation results were further confirmed and explained by adsorption mechanism studies
using photometric dispersion analysis (PDA), time-of-flight secondary ion mass
spectrometry (ToF-SIMS), X-ray photoelectron spectroscopy (XPS), and zeta potential
measurements. In addition, mineral surface cleaning tests were also conducted to show that
carboxymethyl chitosan possesses the specific function of cleaning mineral surfaces by
removing contaminating metal ions.

4 | P a g e
3. Literature review
3.1. Froth flotation
Froth flotation is a widely used separation method in the mineral processing industry with
a history of about 100 years. During the flotation process, mineral particles are separated
based on their different surface properties--mostly hydrophobicity. Figure 3.1 provides an
illustration of a basic froth flotation process in a mechanical flotation cell. Typically,
liberated mineral particles with a certain size are first agitated and mixed vigorously in the
flotation cell with water. Then air is introduced from the bottom of flotation cell and
generates air bubbles in the pulp. Hydrophobic particles are likely to attach to air bubbles
and then levitated to the pulp surface, while most hydrophilic particles remain in the bulk.
Therefore, by collecting the froth layer on top of the pulp, mineral particles with
hydrophobic surfaces can be separated from those with hydrophilic surfaces.
Figure 3.1 Schematics of froth flotation process (Wills & Napier-Munn, 2006)
3.1.1. Flotation reagents
Some minerals are naturally hydrophobic, such as diamonds, graphite and coal, etc., while
most of the minerals are not. In order to selectively separate certain minerals, chemicals
called flotation reagents are usually added in the flotation process which can modify the

5 | P a g e
hydrophobicity of mineral surfaces or change the chemical environment in flotation
systems. Generally, flotation reagents are categorized into three groups: collectors, frothers
and regulators. Collectors are bipolar organic reagents that can impart hydrophobicity to
minerals by adsorption on mineral surfaces. Frothers are added to stabilize a froth layer
and control the size of bubbles. Regulators are utilized to modify the behavior of collectors
and minerals thus making the flotation process more selective. Regulators can be further
classified into three types as activators, depressants and pH modifiers. Activators are
specific chemical compounds that introduce hydrophobicity to the minerals by promoting
collectors’ interactions. On the contrary, depressants are usually used to selectively prevent
certain minerals from floating by rendering them hydrophilic. The application of
depressants especially organic polysaccharide depressants in differential flotation of
sulfide minerals will further be discussed in Section 3.2. As indicated by the name, pH
modifiers are utilized to change the pH in the flotation pulp. The change of pH can affect
the flotation system in many ways. For example, surface charge of minerals can be altered
under different pH conditions; ionic species and their concentrations will also be different
at different pH.
3.2. Depressants in differential flotation of sulfide minerals
In the flotation of complex polymetallic sulfide ores, depressants are usually added to
selectively render given minerals hydrophilic thus achieving the isolation of individual
minerals (Bulatovic & Wyslouzil, 1995). For example, with xanthate as a collector, it is
possible to separate galena (PbS) from chalcopyrite (CuFeS2) using sodium cyanide as the
depressant. Unlike xanthate which interacts with both sulfides, the depression effect of
sodium cyanide only works on chalcopyrite with no interference with the flotation of
galena.
There are several ways by which depressants prevent minerals from floating in differential
flotation, some of which are listed below:
(1) Depressants can remove the coating of collectors from mineral surfaces, resulting
in depression of the mineral.

6 | P a g e
(2) Depressants are capable of reacting with mineral surfaces directly, causing the
change of composition on mineral surfaces. In this way, they can prevent the
adsorption of collectors on the mineral surface entirely.
(3) Some depressants also have the ability to depress certain minerals no matter how
well the latter react with collectors. By adsorbing on the mineral surface, these
depressants create a hydrophilic film on the surface rendering the mineral non-
floatable.
Depressants can be simply classified into two types: inorganic depressants and organic
depressants. The most widely used depressants in industry are usually inorganic. Some
inorganic depressants and their applications in differential flotation of sulfide minerals are
given in Table 3.1.
Table 3.1 Some inorganic depressants and their primary functions in differential flotation
of sulfide minerals (Pearse, 2005)
Typical inorganic depressants used in
differential flotation of sulfide minerals Primarily used as the depressant for
Cyanide (NaCN and KCN) Pyrite and sphalerite
Zinc sulfate (ZnSO4) Sphalerite
Sodium sulfite (Na2SO3) Pyrite, sphalerite and oxidised galena
Ammonium sulfate (NH4)2SO4 Sphalerite
Dichromate (K2Cr2O7, Na2Cr2O7) Galena
Potassium permanganate (KMnO4) Most sulfide minerals including
sphalerite, pyrrhotite and chalcopyrite
Obviously, most of the aforementioned inorganic depressants are toxic and hazardous,
whose uses are more and more restricted with the increasing concern of environmental
issues. This results in a growing interest of investigating effective organic depressants as
replacements for toxic depressants (Liu & Laskowski, 1989a).
Most of the organic depressants are naturally derived polysaccharides composed of
monosaccharides (sugar) units (Liu et al., 2000). Based on their polar groups, these
polysaccharide depressants can be further divided into four major groups: a) Non-ionic,

7 | P a g e
which contain hydrolyzing polar groups -OH, C=O; b) anionic, containing anionic groups,
-COOH, -SO3H, -OSO3H; c) cationic, containing cationic groups, -NH2, =NH; d)
amphoteric with both anionic and cationic groups (Bulatovic, 1999). Starch, dextrin and
guar gum are usually considered to be non-ionic polysaccharides, while they also have
slight anionic character (Pugh, 1989a). Carboxymethyl cellulose is the representative
polysaccharide depressant with anionic groups.
Studies on the use of polysaccharides in the differential flotation of sulfide minerals are
limited (Laskowski et al., 1991). In 1957, Dolivo-Dobrovoskii and Rogachevskaya did a
series of experiments on the separation of ZnS (sphalerite)-PbS (galena) and PbS-CuFeS2
(chalcopyrite) mixtures using water-soluble starch as the depressant. Their laboratory
results showed that in neutral pH, starch depressed chalcopyrite and sphalerite while galena
was floated (Dolivo-Dobrovoskii & Rogachevskaya, 1957). However, starch, dextrin and
guar gum are more widely used as depressants for galena in differential flotation of
chalcopyrite and galena, and mostly together with sulfuric acid or sulfur dioxide (Schnarr,
1978; Allan & Bourke 1978; Lin & Burdick 1988). By adjusting the pulp pH and changing
the addition sequence of reagents, dextrin can be used as the depressant for either galena
or chalcopyrite under different conditions. As reported by Liu and Laskowski (1989), when
xanthate was used as the collector and added prior to dextrin, galena was depressed around
pH 12 while chalcopyrite was floated; when dextrin was added prior to xanthate,
chalcopyrite was depressed around pH 6 while galena was floated from the mixture (Liu
& Laskowski, 1989a).
Modification to polysaccharides can be made by introducing different functional groups
through etherification or esterification reactions with hydroxyl groups (Liu et al., 2000). A
typical example is carboxymethyl cellulose, with the protons in some hydroxyl groups
being replaced by carboxymethyl groups. Carboxymethyl cellulose is extensively used as
a depressant for hydrophobic gangue and silicate minerals in Cu-Ni sulfide flotation.
Bakinov et al. (1964) studied the relationship between the structure of carboxymethyl
cellulose and its depression performance in the flotation of nickel ores. It was found that,
by using carboxymethyl cellulose with high levels of polymerization and a low degree of
substitution, the nickel content in the concentrate was greatly improved. In another work,

8 | P a g e
carboxymethyl cellulose was used as a depressant for galena under alkaline condition,
whereas Cu-activated sphalerite was floated from the concentrate (Jin et al., 1987). As
pointed out by their results, under alkaline pH, carboxymethyl cellulose was more likely to
adsorb on galena than sphalerite, due to their chemical bonding to galena rather than only
hydrogen bonding with sphalerite. The adsorption mechanism between polysaccharide
depressants and minerals will be further discussed in the next section.
3.3. Adsorption mechanism
The adsorption mechanism between polysaccharides and minerals is very different from
collector adsorption and other inorganic reagents adsorption. The type and steric
configuration of functional groups, molecular weight and charge density, etc., all contribute
to the adsorption behavior of polysaccharides (Bulatovic, 2007). However, the limited
application of polysaccharides in mineral processing and the lack of a thorough
understanding of polysaccharides adsorption mechanism on minerals mutually hinder the
development of each other (Liu et al., 2000). Currently, the most widely proposed
adsorption mechanisms between polysaccharides and minerals are: hydrogen bonding,
hydrophobic interaction, chemical complexation and electrostatic interactions. The
standard free energy for the adsorption (∆𝐺°𝑎𝑑𝑠 ) of a polysaccharide on the mineral-
solution interface can be expressed by adding up the standard free energies of these four
contributions:
∆𝐺°𝑎𝑑𝑠 = ∆𝐺°ℎ−𝑏𝑜𝑛𝑑 + ∆𝐺°𝑝ℎ𝑜𝑏𝑖𝑐 + ∆𝐺°𝑐ℎ𝑒𝑚 + ∆𝐺°𝑒𝑙𝑒𝑐 (3-1)
The sign and magnitude of each aforementioned term depend on the surface properties of
minerals and the characteristics of polysaccharides, and vary with different mineral-
polysaccharide pairs (Jenkins & Ralston, 1988).
3.3.1. Hydrogen bonding
Hydrogen bonding is essentially an electrostatic dipole-dipole attraction which is formed
when hydrogen is bound with highly electronegative elements (usually F, N, O) or highly

9 | P a g e
electronegative groups such as –CN, –CCl3. The strength of hydrogen bonding is much
weaker than covalent bonds but stronger than other dipole forces (Israelachvili, 2011).
In many early studies, hydrogen bonding is suggested to be the primary adsorption
mechanism between polysaccharides and minerals without any direct proof (Balajee and
Iwasaki, 1969; Hanna, 1973; Afenya, 1982). These hypotheses were mainly focused on the
hydroxyl groups in polysaccharides and assumed that they can form hydrogen bonds with
the hydroxyl groups on mineral surfaces. However, if hydroxyl groups in aqueous solutions
are considered, they would have formed hydrogen bonds with minerals and
polysaccharides already before new hydrogen bonding occurs between minerals and
polysaccharides. In this case, the formation of a new hydrogen bond requires the
breakdown of at least two existing hydrogen bonds, while the energy involved in this
process has remained unstudied. Taking hydrogen bonding alone as the adsorption
mechanism in aqueous solutions is then regarded as questionable (Liu & Laskowski, 2002).
3.3.2. Hydrophobic interaction
The occurrence for hydrophobic interaction is usually due to the tendency of non-polar
groups on polymer chains to adhere with other non-polar species in a polar aqueous
environment (Nemethy & Scheraga, 1962).
Dextrin was found out to have an exclusive preference for naturally hydrophobic minerals,
such as talc, graphite, molybdenite and coals in its early applications. The
“hydrophobicinteraction” was thus proposed as the adsorption mechanism for dextrin on
mineral surfaces (Wie and Fuerstenau, 1974; Haung et al 1978; Afenya, 1982). In the study
of Miller et al. (1983), evidences of hydrophobic interaction were given, based on the
increasing dextrin adsorption with the increasing hydrophobicity on coal surfaces. Another
proof for hydrophobic interaction from a different perspective was provided by Beaussart
et al. (2009). In their study, dextrin adsorbed more significantly on graphite than on
molybdenite and talc when these three minerals have similar surface hydrophobicities.
They believed that the hydrophobic interaction between dextrin and graphite was enhanced
by their closer geometric match.

10 | P a g e
In addition to dextrin, other polysaccharide depressants like carboxymethyl cellulose were
also believed to adsorb on minerals through hydrophobic interaction (Morris et al., 2002).
3.3.3. Chemical complexation
The adsorption between polysaccharides and minerals had long been attributed to hydrogen
bonding and hydrophobic interaction, while experimental evidences for chemical
complexation were increasingly recorded (Liu et al., 2000). Somasundaran (1969) studied
the adsorption of starch on calcite and proposed that a chemical complex formed between
starch and calcium species at the surface. His hypotheses was based on the fact that, by
adding starch to calcite suspension, there was an increase in the amount of calcium ions in
the solution. A similar phenomenon was reported by Khosla et al. (1984), in whose work,
there was a positive discrepancy (increase) in the conductivity of both Fe3+/starch and
Ca2+/starch systems. Besides, in their infrared spectra for the mixture of starch or starch
fraction (amylose and amylopectin) and Fe2O3 or Fe3+, new adsorption bands at 1200 cm-1
were observed, which was ascribed to the chemical interaction between Fe2O3 or Fe3+ with
starch or starch fractions. These two studies above did draw attention to chemical
complexation, but neither of them shed any light on how the chemical complex was formed.
Liu and Laskowski (1989b) did a series of IR measurements on the precipitates formed in
dextrin/lead nitrate solutions of different dextrin-lead ratios. They found that the peaks of
dextrin between 1000 and 700 cm-1 gradually disappeared when the ratio of dextrin-lead
decreased from 5:1 to 1:1 to 1:5. The peaks at 930 and 760 cm-1 were related to asymmetric
and symmetric deformation of the glucose ring which can be strongly influenced by the
substitution on hydroxyl groups. They believed that the weakening and disappearance of
these peaks were due to the strain placed on the glucose ring after chemical bonding formed
between lead ions and hydroxyl groups on C-2 and C-3. In their summary, they proposed
a five-member ring complex (as shown on Figure 3.2) formed on the lead hydroxide surface
to explain the interactions between dextrin and lead.

11 | P a g e
Figure 3.2 The five-membered ring complex between dextrin and lead proposed by Liu
& Laskowski, 1989b
Later, a very similar complexation model was proposed by Weissenborn et al. (1995). They
used diffuse reflectance infrared Fourier transform spectroscopy (DRIFTS) to study the
adsorption of wheat starch amylose and amylopectin on hematite. The major changes of
adsorbed wheat starch, amylose and amylopectin after their adsorption on hematite were
the shifts of glucopyranose ring vibration and C1-H deformation. These observed shifts
indicated that an eight-membered ring complex formed between polysaccharide hydroxyl
groups attached to C-2 and C-3 and surface iron atoms from hematite (Figure 3.3).
Figure 3.3 The eight-membered ring complex between starch or starch fraction (amylose
and amylopection) and hematite proposed by Weissenborn et al., 1995
3.3.4. Surface charge, electrical double layer and zeta potential
In aqueous solutions, solid surfaces can be charged for many reasons which include: the
preferential dissolution of surface species, hydrolysis and ionization of surface species,
adsorption of various charged ions and complexes (Somasundaran & Wang, 2006).

12 | P a g e
In terms of oxide minerals and silicates in aqueous solutions, the charge on mineral surfaces
is mainly due to the hydrolysis of surface species followed by pH-dependent dissociation
of surface hydroxyl groups (Fuerstenau et al., 2007):
𝑀𝑂𝐻 = 𝑀𝑂− + 𝐻+ (3-2)
𝐻+ +𝑀𝑂𝐻 = 𝑀𝑂𝐻+ (3-3)
The pH-dependent dissociation of oxide minerals was also illustrated by Fuerstenau and
Fuerstenau (1982) as:
Figure 3.4 The dissociation of oxide minerals in aqueous solutions (Fuerstenau &
Fuerstenau, 1982)
M and Me in the equations and schematic above both represent the interfacial metal atom.
The surface charge of oxide minerals in aqueous solution can therefore be controlled by
pH. At a specific pH, the surface charge is zero, and this pH value is called point-of-zero-
charge, PZC. Oxide minerals will be positively charged in the solutions with lower pH than
PZC, while in the solutions that are more alkaline than PZC, they can be negatively charged
(Fuerstenau et al., 2007).
Once the solid surface gets charged, a potential will be introduced between the solid surface
and aqueous phase. Ions in the surrounding solution will be redistributed to neutralize the
surface charge on the solid surface and leads to the electrical double layer. Basically, the
electrical double layer consists of a Stern layer which formed by the surface charge together
with the adsorbed counter ions, and a diffuse layer which is an atmosphere of ions in rapid
thermal motion close to the surface. The ions at diffuse layer have more freedom compared
to the bound ions in the Stern layer. (Israelachvili, 2011; Graham, 1947).

13 | P a g e
Figure 3.5 Schematic representation of the Gouy-Chapman electrical double layer and
potential drop across the double layer (Fuerstenau et al., 1985)
A schematic representation of the Gouy-Chapman electric double layer and potential drop
across the double layer are shown in Figure 3.5. Ions involved in the double layer can be
classified into three parts: a) the potential-determining ions at the mineral surface; b) a
layer of counter ions adsorbed on the mineral surface; c) counter ions in the surrounding
solution which form a diffuse layer. In Gouy-Chapman’s model, the potential decreases
exponentially as a function of distance away from the surface. The total double layer
potential or surface potential is 𝜓𝑜, the potential at the Stern layer where the closest counter
ions locate is called 𝜓𝛿, and the potential at shear plane or slipping plane is called the zeta
potential (). Since it is not possible to measure the surface potential 𝜓𝑜 directly, the
electrokinetic behavior of mineral particles and adsorption phenomena in flotation are
usually characterized by zeta potential measurements (Fuerstenau et al., 1985). The pH
𝜓𝛿
𝜓𝑜

14 | P a g e
value where the zeta potential is zero, is called the isoelectric point (i.e.p.). The i.e.p and
PZC are often used interchangeably; however, they indeed have different values when there
is specific adsorption on the mineral surface.
3.3.5. Electrostatic interactions
Depending on the charges on mineral surfaces and on the polysaccharide chains, the
attractive or repulsive electrostatic interactions can take place with the free energy given
by:
∆𝐺𝑒𝑙𝑒𝑐 = 𝑧𝐹𝜓𝛿 (3-4)
where 𝑧 is the valency of the adsorbate species, 𝐹 is the Faraday constant, and 𝜓𝛿 is the
potential at the δ plane where the polysaccharide head group is located (Fuerstenau et al.,
2007).
As discussed in section 3.2, carboxymethyl cellulose is an anionic polysaccharide, while
starch, dextrin and guar gum are non-ionic. However, the non-ionic polysaccharides can
also obtain surface charge by the introduction of anionic or cationic species. Furthermore,
the ionization of impurities or hydroxyl groups in these polysaccharides can also render
their surface charged (Foster et al., 1965).
Somasundaran (1969) proposed that there was an attractive electrostatic interaction
between the negatively charged starch and positive sites on calcite. His hypothesis was
based on the previous studies about the negative charge on starch (Taylor and Iddles, 1926;
Frahn and Mills, 1959) and further supported by the negative shifts in the zeta potential
measurement of calcite in aqueous solutions after the addition of starch.
Bicak et al. (2007) studied the adsorption of guar gum and carboxymethyl cellulose on
pyrite, and found that, unlike guar gum, carboxymethyl cellulose did not adsorb effectively
on pyrite. In addition, they also observed that the adsorption density of carboxymethyl
cellulose with a low substitution degree (with less anionic carboxymethyl groups) on pyrite
is higher than the highly substituted one (with more anionic carboxymethyl groups). The
main reason was the repulsive electrostatic interactions between the negatively charged
groups on carboxymethyl cellulose and the negatively charged pyrite.

15 | P a g e
3.3.6. Surface activation or contamination of sulfide minerals
The surface activation or contamination is a specific phenomenon in sulfide minerals
flotation, especially in the case of zinc sulfide flotation. In practice, zinc sulfide does not
float effectively with xanthate collector, since the products that are formed by the collector,
such as zinc xanthate, are comparatively soluble in aqueous solutions, and fail to render
the zinc sulfide surface hydrophobic (Wills & Napier-Munn, 2006). When the flotation of
zinc sulfide is desired, surface activation can be realized by adding metal ions whose
sulfides are more insoluble. By far, Cu(II) is the most commonly used metal ion as the
activator for zinc sulfide, while Pb(II), and Fe(II/III) are also found to improve the
floatability of zinc sulfide or other minerals (Fornasiero & Ralston, 2006). A thorough
review about the activation of sulfide minerals in flotation and another review about the
activation mechanism were given by Finkelstein (1997) and Chandra and Gerson (2008),
respectively.
However, in the differential flotation of sulfide minerals, the selectivity can also be reduced
due to the unwanted activation effect, i.e., surface contamination. The unintentional surface
contamination caused by metal ions or metal hydroxides can be removed by using chelating
reagents, such as EDTA (ethylenediaminetetraacetic acid).
3.4. Chitosan
3.4.1. Structure and property of chitosan
Chitosan is a polyaminosaccharide produced from the deacetylation of chitin (Wan Ngah
et al., 2011). Chitin, as the second most abundant polysaccharide in nature after cellulose,
exists predominately in the shells of crustaceans, such as crabs, shrimps, and lobsters (Pillai
et al., 2011; Kittur et al., 2002). Figure 3.6 shows the structure of cellulose, chitin, and
chitosan. As can be seen, chitin has a similar structure to cellulose, and can be regarded as
cellulose with hydroxyl groups on C-2 substituted by acetamido group (Kumar, 2000). The
high percentage of N (6.89%) in the structures of chitin and chitosan compared to
synthetically modified cellulose (1.25%) is their main reason for winning commercial
interest (Kumar, 2000). For chitosan, the primary and secondary hydroxyl groups and

16 | P a g e
amino groups on the glucosamine provide active sites for the formation of metal complexes
and the substitution of new functional groups (Zeng et al., 2008; Pillai et al., 2011). With
the presence of amino groups, chitosan can be cationized in acidic environment, and is then
able to adsorb on anionic surfaces by electrostatic interactions (Zeng et al., 2008). As the
N-deacetylated products of chitin, only those with the degree of deacetylation greater than
50% can be considered as chitosan (Pillai et al., 2011). However, the deacetylation of chitin
is almost never complete, and there will always be some residual acetyl groups on chitosan
(Varma et al., 2004). Therefore, chitosan is indeed a copolymer of glucosamine and N-
acetyl glucosamine (Figure 3.7). The degree of deacetylation (DA) of chitosan has been
studied and examined by many analytical instruments, including IR spectroscopy, 1H NMR
and 13C solid state NMR, UV spectrophotometry, etc., and more recently by near-infrared
spectroscopy (Jayakumar et al., 2010).
As the major component of crustaceans shells, chitin is extremely hydrophobic and
insoluble in water and most organic solvents, while only a few solvents are applicable for
its dissolution, such as hexafluoroisopropanol, hexafluoroacetone and chloroalcohols with
mineral acids in aqueous solutions. Chitosan can be dissolved in dilute aqueous acids, such
as acetic acid and formic acid (Kumar, 2000).
The molecular weight (M) of chitosan can be determined rapidly by the viscometry method
through the Mark-Houwink equation:
[𝜂] = 𝐾𝑀𝛼 (3-5)
where [𝜂] is the intrinsic viscosity, and the constants K and 𝛼 depend on the particular
polymer-solvent system.
However, attention should be paid when choosing these constants, due to the cationization
and aggregation of chitosan in dilute acid (Pillai et al., 2011). The weight-average
molecular weight (𝑀𝑤) of chitosan can be determined by light scatting (Muzzarelli et al.,
1987). The 𝑀𝑤 for chitin is 1.03×10⁶ to 2.5×10⁶, while for chitosan is 1×10⁵ to 5×10⁵ (Lee,
1974).

17 | P a g e
Figure 3.6 Chemical Structure of: a) cellulose, b) chitin and c) chitosan (Okuyama
et al., 2000)
Figure 3.7 Structure of incompletely deacetylated chitosan, a copolymer characterized by
its average degree of deacetylation (DA) (Dutta et al., 2004)

18 | P a g e
3.4.2. Carboxymethylation of chitosan
With the presence of amino groups, primary and secondary hydroxyl groups, chitosan can
be modified through chemical reactions. The carboxymethylation is one of the most
widely-studied modifications for chitosan, which can introduce carboxymethyl groups (–
CH2-COOH) onto chitosan. Since there is more than one reactive site in chitosan’s
molecular structure, three carboxymethyl derivatives with different substitution sites, i.e.,
O-CMC (with –OH being substituted), N-CMC (with –NH2 being substituted), N-O-CMC
(with both –OH and –NH2 being substituted), can be prepared through different synthesis
routes (Kong, 2012). A thorough and detailed review about the synthesis procedures of
carboxymethyl chitosans was provided by Muzzearelli in 1988.
These three carboxymethyl derivatives of chitosan are named as CMC (carboxymethyl
chitosan) in general and share some properties in common including:
1. Water-soluble: One of the most desirable characters for chitosan’s derivatives is the
good solubility in aqueous solutions, and this can be realized by introducing
hydrophilic carboxymethyl groups in chitosan’s structure (Mourya et al., 2010). It
has been experimentally proved that CMC can become soluble in aqueous solutions
in the entire pH range, though a minimum DS (degree of substitution) may be
required (Chen et al., 2003; Tungtong et al., 2012).
2. Amphoteric: Chitosan is a cationic polysaccharide because of the positively
charged amino groups in acidic solutions. The introduction of carboxymethyl
groups can render chitosan amphoteric which contains both cationic and anionic
groups. The ionic strength as well as the adsorption behaviour of CMC can,
therefore, be controlled by the DS of carboxymethyl groups or pH values (Tiwary
et al., 2011).
3. Strong chelation ability: Chitosan itself is an excellent selective chelating reagent
for transition metals, such as Ag, As, Cu, Co, Fe, Hg, Mo, Ni, Pb (Mourya et al.,
2010). The strong chelation ability of chitosan is mainly attributed to –NH2 groups
which can form chemical complexation with metal ions through either a “bridge”
or a “pendent” method (Nieto et al., 1992; Ogawa et al., 1993). N-CMC and N-O-
CMC are shown to adsorb more Fe3+, Co2+, Cu2+, Pb2+, Ni2+, Cd2+ ions than chitosan

19 | P a g e
(Wang et al., 2008; Delben et al., 1989; Delben & Muzzarelli, 1989), and their
enhanced chelation ability can be ascribed to the –NH-CH2-COOH (glycine) group
which was found to enable the formation of pentaatomic rings in metal chelates
(Muzzarelli et al., 1982). Besides, the carboxyl groups which exist in all CMC
structures also contribute to their high chelation abilities. In the study by Muzzarelli
(1988), a typical adsorption band for the charge transfer from carboxylate to copper
was observed on the IR spectrum of O-CMC/copper chelate, which indicated that
Cu2+ ions were mainly bound to COO- groups.
3.4.3. Application of chitosan and its derivatives
Chitosan is a natural cationic polysaccharide with large numbers of hydroxyl groups and
amino groups. It shows many advantages over artificial materials such as biodegradability,
biocompatibility, non-toxicity, and adsorption properties (Kumar, 2000). In addition to
these advantages that are inherited from the parent chitosan, carboxymethylated chitosan
(CMC) also possesses good solubility and amphoteric properties. Both chitosan and CMC
have been extensively tested in various areas which include: biomedical & pharmaceutical
fields (Dash et al., 2011; Upadhyaya et al., 2013; Jayakumar et al., 2010); water & waste
treatment (Bhatnagar & Sillanpää, 2009; Wan Ngah et al., 2011; Chattopadhyay & Inamdar,
2014; Zeng et al., 2008); battery industry (Morni & Arof, 1999; Subban & Radhakrishna,
1996; Yue et al., 2014); cosmetics (Hirano et al., 1991; Chen et al., 2006); and food industry
(Shahidi et al., 1999; Dutta et al., 2009).
The application of chitosan in mineral flotation was never discussed earlier until recently.
Huang et al. reported a series of research works on using chitosan as a depressing reagent
in the differential flotation of sulfide minerals. Their motivation was to find a non-toxic
and environmentally friendly alternative to the currently used inorganic and toxic
depressants in sulfide mineral flotation. In their first study of chitosan in 2012 (Huang et
al., 2012a), chitosan was exploited as the depressant in the differential flotation of
chalcopyrite (CuFeS2) and galena (PbS) with potassium ethyl xanthate (KEX) as a collector.
It was observed that, in the mixed mineral flotation, galena was floated while chalcopyrite
was selectively depressed by chitosan. However, this depressive effect only occurred at
acidic conditions between pH 3 and 5. The best result was observed at pH 4 where the

20 | P a g e
recovery for galena was 95% while only 30% for chalcopyrite. The adsorption mechanism
between chitosan and Cu and Pb sulfide minerals was investigated by adsorption isotherms
and XPS measurements in this paper, and further studied by FTIR and ToF-SIMS in their
subsequent work (Huang et al., 2012b). Through the adsorption density study, it was shown
that Cu2+ ions exhibited higher affinity to chitosan than Pb2+ ions. The ToF-SIMS images
together with elemental maps showed that chitosan’s image matched the pattern of
chalcopyrite instead of galena, which indicated chitosan mainly adsorbed on chalcopyrite.
XPS and FTIR analysis revealed the fact that the amino groups and hydroxyl groups on
chitosan took active part in the strong interaction with chalcopyrite, while chitosan-galena
interaction was more likely a hydrophobic interaction through the acetyl units of chitosan.
In this respect, chitosan with a complete degree of deacetylation (DA) would be a highly
selective depressant in Cu-Pb sulfide mineral flotation. Later on, they continued the study
of chitosan as a depressing reagent in the differential flotation of galena (PbS) and
sphalerite (ZnS) with KEX as a collector (Huang et al., 2013a), followed by the differential
flotation of galena (PbS) and pyrite (FeS2) using chitosan as a depressant as well (Huang
et al., 2013b). Sphalerite was selectively depressed by chitosan while galena was floated at
pH 4, with either the addition of EDTA or pre-coating sphalerite by Cu2+ ions. Pyrite was
selectively depressed (23% recovery) by chitosan while galena was floated (68% recovery)
at pH 4. In both of these flotation studies, amino groups and hydroxyl groups on chitosan
were found to be involved in the interaction with minerals that were depressed, through a
chemisorption mechanism, while the weak interaction between chitosan and galena was
attributed to physisorption. Based on the preferential adsorption of chitosan on chalcopyrite,
sphalerite and pyrite over galena, they assumed that it was due to the tendency of the amino
groups on chitosan to bind with metal ions that have a higher electron affinity. Among all
these studies about chitosan in differential flotation of sulfide minerals, the selectivity of
chitosan as a depressant was indeed observed but only under acidic pH condition. The low
pH range is, however, not suitable for sulfide mineral flotation processes, especially when
the flotation is carried out on a large scale, since most collectors including xanthates are
stable under alkaline condition and corrosion of cells and pipelines also need to be
minimised (Wills & Napier-Munn, 2006). The application of using chitosan as a depressant
in the flotation industry is, therefore, hindered.

21 | P a g e
Inspired by Peng Huang’s work, efforts on utilizing chitosan’s derivative as a depressant
in oxide mineral flotation were later made by Wang and Liu (2013). Phosphorylated
chitosan was synthesized and structural analyses showed that during the synthesis
procedure, methanesulfonic acid was ionically bound to the amino groups of chitosan, and
the phosphate groups were grafted on C-6 hydroxyl sites on chitosan. The chemical
structure of phosphorylated chitosan can be seen from Figure 3.8. Single mineral flotation
tests were carried out on rhodochrosite (MnCO3) and malachite (Cu2CO3(OH)2) by using
phosphorylated chitosan as depressant and sodium oleate as a collector. The results indicate
that the depressive function of phosphorylated chitosan was observed on both minerals but
at different pH: for rhodochrosite it was at pH 7 to 11, and for malachite it was only at pH
7. FTIR and XPS analyses revealed the adsorption mechanism, that the strong interaction
between phosphorylated chitosan and rhodochrosite was attributed to the covalent bonds
of both P=O and P-OH groups with rhodochrosite, while for malachite only P-OH was
involved in the adsorption through hydrogen bonding.
Figure 3.8 The chemical structure of phosphorylated chitosan using methanesulfonic
acid as a blocking agent. The product has nitrogen, phosphorous and sulfur
(Wang & Liu, 2013)
22 | P a g e
4. Experimental
4.1. Mineral samples
Natural chalcopyrite (originated from Durango, Mexico) and galena (mined from Moroco)
minerals were purchased from Ward’s Scientific Establishment. Chemical compositions of
the two mineral samples were measured by X-ray diffraction (XRD) and no impurities
except quartz were found in chalcopyrite. According to XRD and elemental analyses, the
purity of chalcopyrite was 84.5% (containing 29.26% Cu), and the purity of galena was
97% (containing 84% Pb). The lumps of chalcopyrite and galena were crushed by a Retsch
Jaw Crusher (Retsch, USA), then ground in a mechanized mortar/pestle grinder (Fritsch
Mortar Grinder Pulverisette 2, Germany) to collect the desired fractions. The -75+45 μm
and -200+150 μm fractions were respectively used in micro-flotation test and batch
flotation test. The mineral particles of -20 μm were used in adsorption tests, and their
specific surface areas were analyzed by BET method. The specific surface area was 1.391
m2/g for the -20 µm chalcopyrite and 0.390 m2/g for the -20 µm galena.
The ground quartz (>99.5% SiO2) that was used in batch flotation tests was purchased from
U.S. Silica. It was produced from high purity silica powder, and precision ground down to
the top size of 90 µm.
4.2. Reagents and chemicals
Chitosan (MW 100,000-300,000, degree of deacetylation >90%) was purchased from
ACROS Organics Canada Inc. Glyoxylic acid, sodium borohydride and chloroacetic acid
were purchased from Sigma-Aldrich Canada Inc. All other reagents used in this study, such
as acetic acid, sodium hydroxide, hydrochloric acid, acetone, ethanol, cupric sulfate and
lead nitrate, were of pure analytical grade purchased from Fisher Scientific Canada. The
KBr powder used in FTIR analysis was of spectroscopic grade purchased from PIKE
Technologies, USA.
Commercial-grade potassium ethyl xanthate (KEX) was obtained from Prospec Chemicals
Ltd., Canada and was purified by multiple recrystallization from acetone. Hydrochloric

23 | P a g e
acid and sodium hydroxide (Fisher Scientific Canada) were used to adjust pH. All the
aqueous solutions used throughout the study were prepared using distilled water.
4.3. Carboxymetylation of chitosan
4.3.1. Synthesis of N-carboxymethyl chitosan (N-CMC)
The synthesis reaction of N-CMC is shown in Figure 4.1 and the procedure was adopted
from the preparation process by Muzzarelli et al. (1982) with modification. The detailed
procedure is as follows:
1. Dissolve 1 g chitosan in 50 mL 1% acetic acid to prepare a chitosan acetate
solution.
2. Add 1.72 g glyoxylic acid and stir for 1.5 hours under room temperature.
3. Adjust pH to 10 by adding 10% sodium hydroxide solution drop wise.
4. Then gradually add 0.69 g sodium borohydride and stir for 1.5 hours in an ice
bath.
5. Pour the solution into vigorously stirred anhydrous ethanol solution. A white
precipitate is immediately formed.
6. Filter the precipitate and further rinse it with anhydrous ethanol for three times.
7. Vacuum dry the product overnight.
The final N-CMC product shows excellent solubility in water. It dissolves well under any
pH.
Figure 4.1 The synthesis reaction of N-CMC (Muzzarelli et al., 1982)

24 | P a g e
4.3.2. Synthesis of O-carboxymethyl chitosan (O-CMC)
The synthesis reaction of O-CMC is shown in Figure 4.2, and the procedure was based on
the method of Muzzarelli (1988) with modifications:
The first three steps are the same as the synthesis of N-CMC.
4. Gradually add 5 g chloroacetic acid and stir for 1.5-2 hours in a 60 ℃ water bath.
5. After reaction, pour the solution into a vigorously stirred anhydrous ethanol
solution.
5. Filter the precipitate and vacuum dry.
6. Add the raw product from the previous step into 1% hydrochloric acid solution
and stir for 1 hour.
7. Pour the solution again into anhydrous ethanol, filter the precipitate and rinse
three times with anhydrous ethanol.
8. Vacuum dry the product overnight.
The final product of O-CMC is hardly soluble in water.
Figure 4.2 The synthesis reaction of O-CMC

25 | P a g e
4.3.3. Synthesis of N-O-carboxymethyl chitosan (N-O-CMC)
The synthesis reaction of N-O-CMC is shown in Figure 4.3. The procedure was based on
Hayes (1986) but greatly simplified:
The first four steps are the same as the synthesis of O-CMC.
5. Allow the solution to cool to room temperature after reaction.
6. Gradually add 0.69 g sodium borohydride and stir for 1.5 hours in an ice bath.
7. After the reaction, pour the solution into vigorously stirred anhydrous ethanol,
filter the precipitate and rinse with anhydrous ethanol for three times.
8. Vacuum dry the product overnight.
The final product of N-O-CMC shows a good solubility in water.
Figure 4.3 The synthesis reaction of N-O-CMC
4.4. Structural analysis of carboxymethyl chitosan
4.4.1. Infrared spectroscopy
Infrared spectroscopy is a commonly used technique to identify the chemical bonds in
unknown materials. The adsorption of specific wavelength infrared light by molecules can
reveal information about their molecular masses, molecular geometry and the strength of
chemical bonds (Larkin, 2011). The size of absorption peaks also provides direct
indications about the material amounts (Thermo Nicolet Corporation, 2001).

26 | P a g e
Diffuse reflectance infrared Fourier transform spectroscopy (DRIFTS) was used to
investigate the chemical structure of the three carboxymethyl chitosan products.
Measurements were conducted on a Nicolet 8700 (Thermo) instrument using a “Smart
Collector” accessory. Each sample was scanned 128 times and a spectral resolution of 4
cm-1 was chosen. Pre-dried KBr powders (0.8 g ± 0.002 g) were thoroughly mixed and
gently ground with sample powders (0.05g ± 0.002g) in an agate mortar. The mixtures
were then transferred to the DRIFTS sample cell and placed in the instrument. The DRIFTS
spectra were obtained with a pure KBr spectrum as the background.
4.4.2. Solid state 13C nuclear magnetic resonance (NMR) spectroscopy
13C NMR spectroscopy has been widely used in the structural determination of synthetic
polymers (Domard et al., 1987; Cheng, 1984; Blümich et al., 1990). The chemical shifts of
13C between the synthetic material and the known referential-material can provide
indications of different functional groups (Dybowski et al., 2010)
Solid state 13C MAS NMR measurements for chitosan and carboxymethyl chitosan were
conducted on a Varian INOVA 500 MHz spectrometer at ambient temperature, using a
Varian T3 HFXY 2.5 mm probe with an MAS rate of 10 kHz. The parameters for spectra
acquisition were as follows: 2 s recycle delay, 200 kHz sweep width with 5 ms dwell time,
and 102.4 ms for acquisition time.
4.5. Flotation tests
4.5.1. Micro-flotation
The micro-flotation tests of high purity minerals were conducted to evaluate the ability of
carboxymethyl chitosan (CMC) as a selective depressant in the differential flotation of
galena and chalcopyrite. A flotation tube made in-house with a Siwek et al. (1981) top,
shown in Figure 4.4, was used as the flotation device. The narrow throat at the top which
leads to the collection bulb only allows one bubble to pass at a time if no frother is used.
This design thus minimizes mechanical entrainment. The base of the flotation tube is a

27 | P a g e
sintered glass frit with a pore size of 1.6 μm, on top of which sits a magnetic stirring bar
(Cao & Liu, 2006).
Figure 4.4 The micro-flotation device
The amount of sample (-75+45 μm) for each single mineral test or mixed mineral test
(galena and chalcopyrite with a weight ratio of 1:1) was 1.5 g. The mineral samples were
pre-cleaned in 0.1 mol/L hydrochloride acid solution with stirring for 5 min. After several
times rinsing and filtration with distilled water, the mineral samples were suspended in 150
mL distilled water and conditioned for 2 min while the desired pH value was adjusted by
hydrochloric acid or sodium hydroxide.
Purified potassium ethyl xanthate (KEX) was used as the collector, and carboxymethyl
chitosan (CMC) was used as a depressant. The collector and depressant were respectively
added by a desired sequence, and conditioned for 3 min after each reagent addition. The
conditioned slurry was finally transferred to the flotation tube and floated for 3 min using
high purity nitrogen gas. The weight recovery was calculated from the dry weights of the
flotation concentrates and tails. For mixed mineral samples, the concentration of Pb and
Cu in the flotation concentrate and tail were measured by a Varian SpectrAA-220FS atomic
absorption spectrometer (AAS) (Varian, USA) following the desired dilution of the mixed
minerals suspension which was digested with heated aqua regia.

28 | P a g e
4.5.2. Batch flotation
To investigate the selective depressant function of N-CMC in the simulation of an
industrial flotation procedure, the batch flotation tests of high purity mixed minerals were
conducted in a bottom-drive open top flotation cell (1.5 L, JKTech, Australia), as shown
in Figure 4.5. The amount of mixed mineral sample for each test was 400 g composed of
50 g chalcopyrite, 50 g galena and 300 g quartz. In general, the batch flotation procedure
consisted of two major steps: Cu-Pb bulk flotation followed by Cu-Pb differential flotation
to separate chalcopyrite and galena from the bulk Cu-Pb concentrate. Detailed information
about batch flotation tests can be seen in the Appendix.
(a) (b)
Figure 4.5 JKTech flotation machine: a) side view; b) top view of 1.5 L flotation cell
(Courtesy of Xiao Ni, 2010)
4.5.2.1. Bulk flotation
The mineral mixture sample was first wet ground with 300 mL distilled water in a rod mill
(Titan Process Equipment Ltd, 17 L steel cylinder with 17 kg steel rod: Φ31 mm × 2, Φ25
mm × 4, Φ19 mm × 8, Φ12 mm × 11) for 30 seconds. Then, the slurry was transferred into

29 | P a g e
the flotation cell with constant stirring (900 rpm) and conditioned for 2 min while the pH
value was adjusted to 10 by 0.5 mol/L sodium hydroxide solution. After 3 min conditioning
with the desired amount of KEX, the bulk flotation was carried out for 2 min at an air flow
rate of 7 L/min.
4.5.2.2. Cu-Pb separation
The bulk Cu-Pb concentrate was filled into the 1.5 L flotation cell with constant stirring
(900 rpm) and conditioned while the desired pH was adjusted by hydrochloric acid or
sodium hydroxide. The N-CMC and KEX were respectively added according to a desired
sequence and dosage, and conditioned for 3 min after each reagent addition. Then, the
differential flotation was carried out under a desired pH for 2 min at an air flow rate of 7
L/min. The weight recovery was calculated from the dry weights of the flotation
concentrates and tails. The concentrations of Pb, Cu and Si in the flotation concentrate and
tail were determined by a Varian SpectrAA-220FS atomic absorption spectrometer (AAS)
(Varian, USA) following digestion with hot nitric acid.
4.6. Adsorption mechanism studies
The adsorption mechanisms between N-CMC and the tested minerals were investigated by
a photometric dispersion analyzer (PDA), ToF-SIMS, zeta potential and XPS
measurements to explain the flotation results and N-CMC’s selectivity. In addition, the
adsorption isotherm was studied by total carbon content measurements and the results are
included in the Appendix.
4.6.1. Metal ion binding tests
The binding ability of N-CMC with copper and lead ions was investigated by a photometric
dispersion analyzer (PDA 2000, Rank Brothers). The metal ion solutions were prepared
individually with the same ion concentration at 0.1 mol/L. Twenty (20) mL of the metal
ion solution was placed in a beaker, agitated and circulated through the PDA 2000 by a
peristaltic pump. Under constant stirring, a 0.2 g/L N-CMC aqueous solution was gradually
30 | P a g e
added into the beaker in 0.25 mL increments every 30 seconds. The root-mean-square
(RMS) output of the PDA 2000 was recorded.
4.6.2. ToF-SIMS imaging
Time-of-flight secondary ion mass spectrometry (ToF-SIMS) is one the most sensitive
surface analytical techniques, with a resolution less than 1 nm, and a sensitivity of 1 ppm
(Boulton et al., 2003). The elemental distribution maps can be obtained by rastering over
interested areas with focused ion beam, and have been widely exploited to study the
adsorption of reagents on mineral surfaces (Stowe et al., 1994; Brinen & Reich 1992). In
this study, ToF-SIMS was utilized to characterize the adsorption density and map the
distribution of N-CMC on galena and chalcopyrite’s surfaces at their natural pH and pH
10.
ToF-SIMS measurements were performed on a ToF-SIMS IV-100 spectrometer (ION-
TOF GmbH) with 25 keV Bi+ primary ions. The imaging of selected ions (both positive
and negative) were obtained from each specific area under the Burst Alignment mode and
calibrated with peaks of H, C, O, S, CuS and PbS beforehand. 128 × 128 pixels were
chosen in imaging acquisition.
The preparation procedures for samples used in this study were as follows: 1.5 g of pre-
cleaned mixed minerals (galena and chalcopyrite with a weight ratio of 1:1) with a size of
-20 μm was added into 150 mL distilled water and conditioned for 2 min at a desired pH.
After adding 150 μL N-CMC solution (2 g/L), the suspension was conditioned in a shaking
incubator for 60 min at 25℃. The minerals in suspension were then filtered and washed
with distilled water through the filtration funnel three times. Before analysis, the mineral
samples were dried and kept in a vacuum desiccator. To prevent surface oxidation and
contamination, the samples were analysed within 12 h after being prepared.
4.6.3. X-ray photoelectron spectroscopy (XPS)
By irradiating the monoenergetic soft X-ray beam on a solid sample surface in high vacuum
condition, X-ray photoelectron spectroscopy (XPS) can provide a quantitative surface-
sensitive analysis for the sample. XPS spectra are obtained by recording the numbers of
electrons ejected from the top few nm and their kinetic energy. The peak intensities on XPS
31 | P a g e
spectra are related to the amount of a certain material at the sample surface, while the peak
position indicates the chemical composition (Fairley, 2009; Moulder et al., 1992)
In this study, XPS measurements were performed on six samples: unmodified chitosan, N-
CMC, N-CMC adsorbed on chalcopyrite at pH 7, N-CMC adsorbed on chalcopyrite at pH
10, N-CMC adsorbed on galena at pH 7, and N-CMC adsorbed on galena at pH 10. The
peak intensities and peak positions of these samples were compared to investigate the
changes of N-CMC’s chemical composition and amounts on mineral surfaces.
To prepare samples for XPS analysis, 1.5 mg N-CMC (750 μL of 2 g/L bulk solution) and
1.5 g of a single mineral (-20 µm chalcopyrite or galena) was added into 150 mL distilled
water. After pH adjustment, the suspension was conditioned in a shaking incubator for 30
min at 25 ℃. The minerals were then filtered and washed with 100 mL distilled water, and
further dried in a vacuum desiccator. XPS measurement were conducted within 12 hours
after the sample preparation in order to minimize surface oxidation.
The XPS measurements were carried out on an AXIS 165 X-ray spectrometer (Kratos
Analytical, USA) with a monochromatic Al-Kα source (1486.69 eV) at a power of 100W.
For survey scan and high resolution scan, the analyze pass energies were 80 eV and 20 eV
respectively, and their corresponding step sizes were 0.4 eV and 0.1 eV. Considering the
particles size (-20 μm), the area of analysis was chosen as 400 μm × 700 μm on the sample
surface. Software named CasaXPS (version 2.3.15) was used in the data processing of high
resolution spectra. All the spectra were calibrated using C 1s at 284.8 eV. The spectra were
resolved into individual peaks using the Shirley-type background and the Gaussian-
Lorentzien shape.
4.6.4. Zeta potential measurements
Electrokinetic measurements can be utilized to study the adsorption behaviour of reagents
in mineral flotation, since small changes in adsorption will bring significant modifications
in electrokinetic potentials (Fuerstenau & Pradip, 2005)
In this study, the zeta potential measurements of chalcopyrite and galena were carried out
using a ZetaPALS Zeta Potential Analyzer from Brookhaven Instrument. The

32 | P a g e
Smoluchowski model was adopted in the calculation of zeta potentials from the measured
electrophoretic mobilities.
Each sample measurement was run for 10 times, with 20 measurement cycles per run. The
final recorded zeta potential of each sample is the mean value without considering the
highest and lowest runs.
The preparation procedures for samples were as follows:
1. A stock mineral suspension was first prepared by adding 0.5 g of -20 μm pre-
cleaned mineral powders into 100 mL 10-2 M NaCl solution. The suspension was
left to stand for 24 hours before using.
2. 10 mL of the stock mineral suspension was withdrawn after agitating the
suspension fiercely. Then the 10 mL mineral suspension was diluted to 100 mL
using 10-2 M NaCl solution. In the studies with N-CMC, the N-CMC solution was
also prepared with the 10-2 M NaCl solution.
3. For each chosen pH value, the 100 mL diluted suspension was conditioned for
20 minutes. The pH value was adjusted and maintained by adding sodium
hydroxide and hydrochloric acid solutions prepared by the 10-2 M NaCl solution.
4. After conditioning, 1.6 mL of suspension was transferred to the sample cell in
which the electrodes were inserted for measurement.
4.7. Mineral surface cleaning test
In these tests, 1.5 g hydrochloric acid pre-cleaned galena sample (-75+45 μm) was
suspended in a beaker with 150 mL distilled water, and 0.75 mL of 0.2 mol/L cupric sulfate
solution was added with constant stirring for 5 min. The original concentration of Cu2+ in
the suspension was 1×10⁻³ mol/L. Then, the galena sample was filtered and rinsed by
alkaline water (pH 8) four times to avoid dissolution of the copper from the surface of
galena. After vacuum drying for 12 hours, the galena sample was divided into two equal
parts. One part was marked as “Blank” and suspended with only 150 mL distilled water.
The other part was suspended in 150 mL distilled water but with the addition of 75 μL N-
CMC solution (2 g/L), and labeled as “N-CMC”. After 10 min stirring, the two suspensions

33 | P a g e
were filtered to collect the galena samples. The collected galena samples were separately
washed with 20 mL of 0.1 mol/L hydrochloric acid and filtered. The filtrates were collected
and analyzed by the Varian SpectrAA-220FS atomic absorption spectrometer (Varian,
USA) to measure the concentration of Cu2+.

34 | P a g e
5. Results and discussion
5.1. Structural analysis of carboxymethyl chitosan
5.1.1. Infrared spectroscopy
Figure 5.1 shows the DRIFTS-FTIR spectra of three carboxymethyl chitosans (CMC) and
unmodified chitosan. As can be seen from the figure, the spectra of the CMCs were
different from each other, indicating that they were three different substances. The
characteristic peaks of CMC in the range of 700-1800 cm-1 were identified by comparing
their spectra with that of chitosan.
Figure 5.1 The DRIFTS spectra of unmodified chitosan and carboxymethyl chitosan
35 | P a g e
5.1.1.1. Characteristic peaks of chitosan
The spectrum of unmodified chitosan powder was analyzed based on the investigation of
Pearson et al. (1960). It shows a characteristic peak of amide I at 1663 cm-1 (C=O stretching)
with relatively low intensity due to the high DA of the chitosan sample. In the meantime,
the peak of N-H deformation in the amino group at 1590 cm-1 (N-H deformation of –NH2)
has a relative strong intensity and covers up the peak of amide II at 1556 cm-1 (N-H
deformation in amide group). The peaks at 1377 cm-1 and 1321 cm-1 are assigned as O-H
deformation of –CH2-OH and –CH-OH, respectively. The peaks at 1034 cm-1 and 1070
cm-1 belong to the C-O stretching of –CH2-OH and –CH-OH, respectively. The peak at
1151 cm-1 comes from the asymmetric stretching of the bridge oxygen (C-O-C).
5.1.1.2. Characteristic peaks of N-CMC
In the spectrum of N-CMC, the newly appeared peaks at 1717 cm-1 and 1302 cm-1 can be
assigned to the C=O stretching and C-O stretching of –COOH, respectively (Sahu et al.,
2011; Larkin, 2011), which illustrate the successful introduction of the carboxymethyl
group. Another new peak at 1513 cm-1 also appeared, in comparison with a dramatic
decrease in the intensity of the peak at 1594 cm-1. This phenomenon indicates that the
amino groups were the main substitution sites for N-CMC, and the peak at 1513 cm-1 can
be assigned as N-H deformation of –NH– (Larkin, 2011). As a consequence of incomplete
substitution, the peak of N-H deformation (–NH2) at 1594 cm-1 (Larkin, 2011; Chen &
Park, 2003) can still be observed but with a lower intensity. Due to the substitution on the
amino groups, the C-N stretching of –C-NH2 at 1421 cm-1 also shifts to 1409 cm-1 (Mourya
et al., 2010; Pearson et al., 1960). The characteristic peaks of the –CH2-OH at 1378 cm-1
and 1036 cm-1, and peaks of –CH-OH at 1318 cm-1 (overlapped by the peak at 1302 cm-1)
and 1073 cm-1, do not show any shift or change compared to the original peaks on chitosan.
Their shifts are within the resolution of the infrared spectrometer which indicates that
hydroxyl groups are likely not involved in the substitution.
5.1.1.3. Characteristic peaks of O-CMC
Similarly, the peaks at 1715 cm-1 and 1300 cm-1 on O-CMC’s spectrum belong to the C=O
stretching and C-O stretching of –COOH respectively, indicating that the carboxymethyl

36 | P a g e
group has been introduced on O-CMC. During O-CMC’s synthesis, the addition of 1%
hydrochloric acid resulted in the ionization of -NH2 into –NH3+. Therefore, the peak at
1590 cm-1 (N-H deformation of –NH2) on chitosan shifts to 1577 cm-1 (N-H deformation
of –NH3+) on O-CMC’s spectrum (Chen & Park, 2003; Mourya, Inamdar & Tiwari, 2010).
The new peak at 1520 cm-1 with a low intensity can be assigned to the symmetric –NH3+
deformation vibration (Huang, Cao & Liu, 2012b; Muzzarelli et al., 1982). The shift of C-
N stretching from 1421 cm-1 to 1413 cm-1 is also due to the ionization. Another new peak
at 1096 cm-1, corresponding to the C-O-C asymmetric stretching of –CH2-O-CH2–, shows
that the primary hydroxyl groups were the substitution sites for O-CMC (Larkin, 2011;
Chen & Park, 2003).
5.1.1.4 Characteristic peaks of N-O-CMC
Similar to the other two CMC products, the peaks of –COOH at 1718 cm-1 and 1312 cm-1
appeared in N-O-CMC’s spectrum with strong intensities. Both the peak of –NH– at 1522
cm-1 (overlapped with symmetric –NH3+ deformation) and the peak of –CH2-O-CH2– at
1085 cm-1 can be observed on N-O-CMC. Their coexistence illustrates that the amino
groups and the primary hydroxyl group both took part in the substitution reaction.
5.1.2. Solid state 13C nuclear magnetic resonance (NMR) spectroscopy
Figure 5.2 shows the solid-state 13C NMR spectra of the three synthesized CMC products
and the spectrum of unmodified chitosan. Figure 5.3 shows the structure of chitosan,
indicating where the C1, C2, C3, C4, C5 and C6 locate.
According to previous studies (Wang & Liu, 2013; Rinaudo et al., 1992), C1, C2, C3, C4,
C5 and C6 on the spectrum of chitosan are identified as peaks at 105.3 ppm, 57.6 ppm, 61.3
ppm, 72.6 ppm, 75.4 ppm and 82.7 ppm, respectively. It can be seen from the spectra of
CMC that, C2 and C6 peaks on the CMC products have the most apparent changes and
shifts. This phenomenon indicates that either C2, C6 or both provided the substitution sites
for the carboxymethyl groups in CMC. To locate the exact substitution site, the 13C NMR
spectra were resolved to focus on the peaks of C2 and C6.
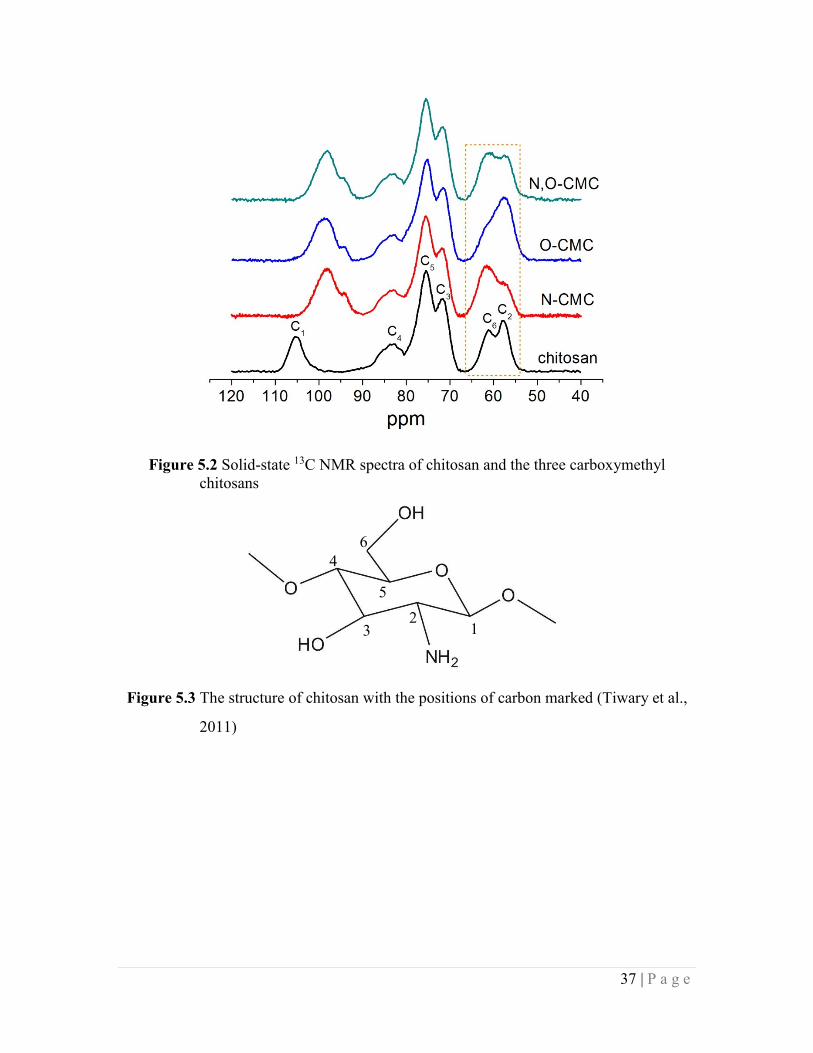
37 | P a g e
Figure 5.2 Solid-state 13C NMR spectra of chitosan and the three carboxymethyl
chitosans
Figure 5.3 The structure of chitosan with the positions of carbon marked (Tiwary et al.,
2011)
4
1 2
3
5
6

38 | P a g e
Figure 5.4 The resolved solid-state 13C NMR spectra of: a) chitosan, b) N-CMC, c) O-
CMC, and d) N-O-CMC.
The resolved NMR spectra of CMC and chitosan with only C2 and C6 peaks are shown in
Figure 5.4. For chitosan, the original peaks of C2 (C-NH2, amino group) and C6 (C-OH,
primary hydroxyl group) can be observed at 57.6 ppm and 61.3 ppm respectively.
For N-CMC, in comparison with chitosan, the intensity of C2 decreases significantly. In
addition, the peak of C2 shifts to a higher ppm value. By adding more glyoxylic acid (CHO-
COOH) in the synthesis process, the peak intensity of C2 becomes even lower, as shown in
Figure 5.5. Therefore, the substitution indeed happened on the amino group (C2).
a) Chitosan b) N-CMC
c) O-CMC d) N-O-CMC

39 | P a g e
Figure 5.5 The resolved solid-state 13C NMR spectra of N-CMC with 3.5 g
CHO-COOH.
For O-CMC, the intensity of C6 becomes lower when compared with the peaks on chitosan.
Meanwhile, partial C6 shifts to lower ppm value, slightly broadens the peak of C2. These
changes show that the primary substitution site is the hydroxyl group on C6.
For N-O-CMC, the peaks of C2 and C6 both have lower intensities compared with the
original peaks on chitosan. It can be possibly attributed to the shifts of two peaks: the
downward shift of C6 and the upward shift of C2, whose overlap creates more peak area.
Since both peaks shift on N-O-CMC, it can be assumed that both the amino group (C2) and
the primary hydroxyl group (C6) provided the sites for substitution.
5.1.3. Summary
According to the results from infrared spectroscopy and NMR analyses, the structures of
the three carboxymethyl chitosan products can be confirmed as follows:
Figure 5.6 N-CMC structure
N-CMC with 3.5 g CHO-COOH

40 | P a g e
In N-CMC, only the amino groups were substituted by carboxymethyl groups and its
structure is shown as Figure 5.6.
Figure 5.7 O-CMC structure
For O-CMC, only the primary hydroxyl groups on C6 were replaced by carboxymethyl
groups and its structure is illustrated as Figure 5.7.
Figure 5.8 N-O-CMC structure
For N-O-CMC, both the amino groups and the primary hydroxyl groups on C6 were
substituted by carboxymethyl groups and its structure can be drawn as Figure 5.8.

41 | P a g e
5.2. Flotation tests
5.2.1. Single mineral micro-flotation
Figure 5.9 The recovery of single mineral micro-flotation as a function of KEX
concentration at natural pH (6.8-7.0). 1.5 g mineral, 150 mL distilled water.
Flotation time: 3 min. (a) The recovery of galena. (b) The recovery of
chalcopyrite.
The critical concentration of KEX in micro-flotation was determined before any
depressants were added. As shown on Figure 5.9, when KEX concentration reaches 2.5
ppm, the recoveries for both galena and chalcopyrite reach their maximum values.
Therefore, the critical concentration of KEX in micro-flotation can be set as 2.5 ppm. Due
to the poor solubility, O-CMC has been ruled out as a depressant. Only N-CMC and N-O-
CMC were used in the following micro-flotation tests.
5.2.1.1. Single mineral micro-flotation using N-CMC as the depressant
Under natural pH (6.8-7) and the fixed collector concentration of 2.5 ppm, N-CMC was
added to observe its depressant effect on the two sulfide mineral samples respectively
(reagent adding sequence was N-CMC followed by KEX). Figure 5.10a shows that
chalcopyrite was apparently depressed, as its recovery sharply dropped from 85% to 5% at
1 ppm N-CMC, and then remained at around 5% at higher N-CMC concentrations.
However, the recovery of galena was not affected and remained around 95% in the entire
N-CMC concentration range tested (up to 10 ppm).
a) b)

42 | P a g e
Figure 5.10 Single mineral micro-flotation of galena and chalcopyrite using N-CMC as a
depressant and KEX as a collector. 1.5 g mineral, 150 mL distilled water, 2.5
ppm KEX. Flotation time: 3 min. (a) With different concentration of N-CMC
at natural pH (6.8-7). (b) At different pH with 1 ppm N-CMC.
The flotation behavior of chalcopyrite and galena was then tested individually at different
pH at a fixed N-CMC concentration of 1 ppm. As can be seen in Figure 5.10b, the recovery
a)
b)

43 | P a g e
of galena did not change too much and remained at around 95% in the slightly acidic and
neutral solution, but dramatically decreased at higher pH and dropped to 10% at pH 10.
Interestingly, the recovery of chalcopyrite showed a “U” shape with the lowest recovery
(about 5%) occurring between pH 6 and 8. At the acidic and alkaline pH, the recovery of
chalcopyrite was above 70%. Obviously, two separation windows exist: One is at pH 7,
where chalcopyrite can be depressed by N-CMC but galena can be floated; another is
expected to be above pH 10, where galena is depressed by N-CMC and chalcopyrite can
be floated.
5.2.1.2. Single mineral micro-flotation N-O-CMC as the depressant
When pH remained under natural value (6.8-7) and the collector concentration was fixed
at 2.5 ppm, different concentrations of N-O-CMC were added in several single mineral
micro-flotation tests to investigate its depressing effect (reagent adding sequence was N-
O-CMC followed by KEX). As shown in Figure 5.11a, by increasing the concentration of
N-O-CMC, both galena and chalcopyrite tended to have lower recoveries. Chalcopyrite
was completely depressed with only 3 ppm N-O-CMC, whereas at least 10 ppm N-O-CMC
was required to depress galena.
a)

44 | P a g e
Figure 5.11 Single mineral micro-flotation of galena and chalcopyrite using N-O-CMC as
a depressant and KEX as a collector. 1.5 g mineral, 150 mL distilled water,
2.5 ppm KEX. Flotation time: 3 min. (a) With different concentration of N-O-
CMC at natural pH (6.8-7). (b) At different pH with 10ppm N-O-CMC for
galena and 3 ppm N-O-CMC for chalcopyrite.
The flotation behaviour of galena and chalcopyrite at different pH was then investigated
independently with the critical concentrations of KEX and N-O-CMC (2.5 ppm KEX; 10
ppm N-O-CMC for galena, 3 ppm N-O-CMC for chalcopyrite). As can be seen from Figure
5.11b, the recovery of galena decreased sharply from the acidic to neutral pH condition
and dropped to about 8% at pH 7. This was followed by a slight increase in the recovery at
higher pH, remaining at about 20% at pH 9-10. It indicates that N-O-CMC had a good
depressing effect on galena under neural and alkaline pH condition. For chalcopyrite, the
recovery again was the lowest at the neutral pH resembling N-CMC. The recovery was
about 5% at pH 7, around 40% under acidic pH and above 80% at pH over 9. Therefore,
the depressive effect of N-O-CMC on chalcopyrite was weaker under acidic and alkaline
pH. Since acidic pH is not ideal for sulfide ore flotation, only one separation window may
be used when using N-O-CMC as a depressant: at pH 10, galena can be depressed by N-
O-CMC while chalcopyrite is floated.
b)

45 | P a g e
5.2.2. Mixed minerals micro-flotation
5.2.2.1. Mixed minerals micro-flotation using N-CMC as the depressant
As discussed previously in the single mineral micro-flotation tests of chalcopyrite and
galena, when N-CMC is used as the depressant, the separation of the two sulfide minerals
can be expected at natural pH (6.8-7) or at pH 10. Based on these results, the differential
micro-flotation tests on mixed minerals (chalcopyrite and galena with 1:1 weight ratio)
were carried out to verify the selectivity of N-CMC. The results are shown in Figure 5.12,
in which the yield represents the total weight of concentrates collected from each flotation
(normalized to the initial feed weight), and the recovery of Cu or Pb was calculated from
Cu or Pb assay data for the flotation concentrate and tail.
With the same reagent addition sequence (N-CMC followed by KEX) and dosage (1 ppm
N-CMC and 2.5 ppm KEX), N-CMC exhibited different depressant functions at different
pH, similar to single mineral flotation. Figures 5.12a shows that at pH 6.8, the concentrate
yield was about 51%, which recovered 84% of the Pb but only 15% of the Cu. At pH 10,
the concentrate yield was 63% and it recovered 88% of the Cu, but only 41% of the Pb.
Therefore, at neutral pH, most of the chalcopyrite was depressed by N-CMC while most of
the galena was floated, and the gap between galena recovery and chalcopyrite recovery
was about 70 percentage points. Although under alkaline conditions galena was indeed
depressed, the gap between chalcopyrite recovery and galena recovery was barely about
50 percentage points, which was not considered sufficient to separate them well.

46 | P a g e
Figure 5.12 Mixed minerals micro-flotation of galena and chalcopyrite (weight ratio 1:1)
using N-CMC as a depressant and KEX as a collector. 1.5 g mineral, 150 mL
distilled water. Flotation time: 3 min. (a) 1 ppm N-CMC followed by 2.5 ppm
KEX, pH 6.8; (b) 1 ppm N-CMC followed by 2.5 ppm KEX, pH 10; (c) 2.5
ppm KEX followed by 5 ppm N-CMC, pH 6.8; (d) 2.5 ppm KEX followed
by 5 ppm N-CMC, pH 10.
As shown in Figures 5.12c and d, the dosages of N-CMC and KEX were increased to 5
ppm and 2.5 ppm, respectively. In addition, KEX was added prior to N-CMC. As can be
seen, at neutral pH (Figure 5.12c), chalcopyrite was still selectively depressed by N-CMC
while galena was floated. The concentrate yield was 60% which recovered 92% of the Pb
and 24% of the Cu. However, at pH 10, the yield of concentrate was 41% and it recovered
48% of the Cu and 34% of the Pb. The selective depressing ability of N-CMC did not seem
to exist at pH 10 and the higher reagent dosages.
a) b)
c) d)

47 | P a g e
5.2.2.2. Mixed minerals micro-flotation using N-O-CMC as the depressant
Since N-O-CMC only showed its selectivity at pH 10 in single mineral micro-flotation tests,
a trial micro-flotation test for mixed minerals (chalcopyrite and galena with 1:1 weight
ratio) with N-O-CMC was conducted at pH 10 to investigate its ability in separating the
two sulfide minerals. As shown in Figure 5.13, the concentrate yield was 72% which
recovered 91% of the Cu and 58% of the Pb. Therefore, even at the high dosage of 10 ppm,
the N-O-CMC did not depress chalcopyrite and only slightly depressed galena, and the
selectivity was very weak. It can be seen that N-O-CMC’s application as a selective
depressant in sulfide minerals is not very promising compared with N-CMC.
Figure 5.13 Mixed minerals micro-flotation of galena and chalcopyrite (weight ratio 1:1)
using N-O-CMC as a depressant and KEX as a collector. 1.5 g mineral, 150
mL distilled water. Flotation time: 3 min. 2.5 ppm KEX followed by 10 ppm
N-O-CMC, pH 10.

48 | P a g e
5.2.3. Batch flotation
Due to the poor selectivity and depressing effect of N-O-CMC in mixed minerals micro-
flotation tests, only N-CMC was further studied in batch flotation tests. The batch flotation
tests were conducted to investigate the selective depressant function of N-CMC in the
simulation of an industrial flotation procedure, i.e., a Cu-Pb bulk flotation followed by Cu-
Pb separation. Figure 5.14 shows the results of one of these batch flotation tests. In this
figure, the yield is the weight of the flotation concentrate normalized against the weight of
the Cu-Pb bulk concentrate. As can be seen, at 58% yield, the flotation concentrate
recovered 89% of the Pb and 24% of the Cu. The selective depressant ability of N-CMC
can, therefore, be expected in industrial applications.
Figure 5.14 Batch flotation for mixed minerals of galena and chalcopyrite

49 | P a g e
5.2.4 Summary
During the single mineral micro-flotation tests, two separation windows are observed for
N-CMC: One at pH 7 where chalcopyrite is depressed by N-CMC but galena can be floated,
and another is above pH 10 where galena is depressed by N-CMC and chalcopyrite can be
floated. For N-O-CMC, galena can be depressed by N-O-CMC while chalcopyrite can be
floated at pH 10.
Based on mixed mineral flotation results, the addition sequence of collector (KEX) and
depressant (CMC) will not affect the selectivity of the depressant. For N-CMC, at neutral
pH, most of the chalcopyrite was still depressed by N-CMC while most of the galena was
floated, and the difference between their recoveries can be as high as 70 percentage points.
While at pH 10, N-CMC’s selectivity became weak and the separation of two minerals
became difficult. When using N-O-CMC as a depressant in mixed mineral flotation, both
galena and chalcopyrite were floated and the selectivity was absent.
N-CMC was used in batch flotation tests which simulated commercial bulk Cu-Pb flotation
followed by Cu-Pb differential flotation. The results indicated that Cu-Pb separation was
achieved by depressing chalcopyrite while floating galena.
The reason for N-CMC’s selectivity will be discussed in the next section via its adsorption
mechanism onto galena and chalcopyrite surfaces.
5.3. Adsorption mechanism studies
5.3.1. Metal ions binding tests
Photometric dispersion analysis was performed to gain an understanding of the binding
capacity of N-CMC with metal ions. The PDA 2000 photometric dispersion analyzer
monitors the in-situ precipitation process of N-CMC at different dosages with Cu2+ and
Pb2+ ions. When the metal ions react with N-CMC, the initially clear metal ion and N-CMC
solutions would turn cloudy to show the formation of precipitates. The particle size of the
precipitates was represented by the “RMS” signal (root mean square value of the amplified
ac signal) of the PDA 2000 photometric dispersion analyzer, since the appearance and/or

50 | P a g e
flocculation of particles can cause a great increase of the RMS readings (Rank Brothers
Ltd, 2013).
As can be seen from Figure 5.15, the RMS output of the PDA 2000 continuously increased
when N-CMC was gradually added to a cupric sulfate solution. However, the RMS output
maintained a stable low value when N-CMC was added to a lead nitrate solution. It,
therefore, seems that N-CMC had a stronger binding capacity with Cu2+ than with Pb2+. It
can also be assumed that the different depressing effect of N-CMC on chalcopyrite and
galena possibly originates from its different affinities to the lattice metal ions in these
minerals.
Figure 5.15 Photometric dispersion analyzer root-mean-square output of Cu2+ and Pb2+
binding with N-CMC. 20 mL cupric sulfate or lead nitrate solution (0.1 mol/L) was titrated
with a 0.2 g/L N-CMC solution in 0.25 mL increment every 30 seconds.
RM
S

51 | P a g e
5.3.2. ToF-SIMS imaging
Both negative and positive ion spectra were generated for mineral samples at natural pH
and pH 10. Two representative spectra were selected to illustrate the adsorption of N-CMC
on galena and chalcopyrite. COOH was used to indicate the carboxyl group on N-CMC.
NH2 came from the unmodified monomers of chitosan without carboxylmethyl groups.
C2H4NO2, as the carboxymethyl group grafted on N, was used to delineate the distribution
of N-CMC. CuS and PbS represented chalcopyrite and galena, respectively. The position
of each ion was shown on the map in bright colours.
Figure 5.16 Negative ion spectra at natural pH (107 μm ×107 μm)
Figure 5.16 shows the negative ion spectra at the natural pH condition on an area of 107
μm ×107 μm. As can be seen, images of COOH and C2H4NO2 match the pattern of CuS.
Both COOH and C2H4NO2 were from the N-CMC, indicating that N-CMC adsorbed
mostly on the chalcopyrite. This result is in accordance with the flotation tests, in that N-
CMC depressed chalcopyrite at natural pH. It can also be seen that at natural pH, carboxyl
groups played an important role in the selectivity of N-CMC. However, the distribution of
N-CMC still has some overlap area with galena, as can be seen from the images of COOH
and PbS. This phenomenon is also supported by mixed mineral flotation results that about
20% galena was depressed by N-CMC at natural pH. The positions of NH2 seem to be
evenly distributed on the image, and do not show any preference towards either sulfide

52 | P a g e
mineral. Therefore, the NH2 groups seem to have no impact on N-CMC’s selectivity at
natural pH.
Figure 5.17 Positive ion spectra at pH 10 (55.7 μm × 55.7 μm)
Figure 5.17 shows the positive ion spectra at pH 10 on a region of 55.7 μm × 55.7 μm. The
images of Cu and Pb complement each other very well, but the distributions of COOH and
C2H4NO2 show no obvious resemblance with either Cu or Pb. It seems that there was no
preference of N-CMC’s adsorption on either mineral particles. It is consistent with the
mixed minerals micro-flotation tests at pH 10.
5.3.3. X-ray photoelectron spectroscopy (XPS)
XPS was utilized to investigate the adsorption bonds formed between N-CMC and mineral.
The XPS survey scan and narrow scan of N 1s were first conducted on unmodified chitosan
and N-CMC. The XPS spectra of N 1s were also collected on chalcopyrite and galena after
they were treated by N-CMC at either pH 6.8 or at pH 10. By comparing the N 1s binding
energies, a better understanding of the adsorption process can be obtained.

53 | P a g e
5.3.3.1. The N 1s spectrum of chitosan
Figure 5.18 The resolved narrow scan N 1s spectrum of chitosan
As shown in Figure 5.18, two peaks can be resolved on the narrow scan N 1s spectrum of
chitosan. The peak at 399.3 eV is assigned to –NH2 (the basic structural unit of chitosan).
Another peak at 400.6 with a small intensity belongs to O=C–NH– (amide in acetyl group),
which is the undeacetylated part of chitosan.
5.3.3.2. The N 1s spectrum of N-CMC
Figure 5.19 The resolved narrow scan N 1s spectrum of N-CMC

54 | P a g e
Compared to the spectrum of chitosan, the binding energy of N 1s on N-CMC has
significant changes after the carboxymethylation, as shown in Figure 5.19. Since one
hydrogen of –NH2 on chitosan has been replaced by the carboxymethyl group, –NH2
changes to –NH–. The peak at 399.6 eV on CMC is due to the shift of the peak at 399.3 eV
on chitosan, and the shifted peak can be assigned as –NH–. Meanwhile, a new peak appears
at 397.2 eV on the N 1s spectrum of N-CMC with a high intensity. According to the NIST
XPS database version 2.0 (Wagner et al., 1997), this peak can be attributed to –NH-CH2-
COOH. The peak at 400.6 eV on chitosan is probably overlapped with the upward shifted
peak of –NH–.
5.3.3.3. The N 1s spectrum of N-CMC treated chalcopyrite at pH 7
Figure 5.20 The resolved narrow scan N 1s spectrum of N-CMC on chalcopyrite at pH 7
As can be seen from Figure 5.20, the peak of –NH– and the peak of –NH-CH2-COOH shift
upwardly to 399.8 eV and 397.5 eV respectively, compared to the N 1s spectrum of N-
CMC. The shifts of peaks can be attributed to the bonds formed between –COOH and Cu.
Due to this interaction, the distribution of electron cloud density will migrate to the copper
side, leading to the upward shifts of the –NH– peak (from 399.6 eV to 399.8 eV) and the
–NH-CH2-COOH peak (from 397.2 eV to 397.5 eV). In addition, a new peak appeared at

55 | P a g e
401.1 eV, most likely due to the direct bonds formed between Cu and N on secondary
amino groups.
5.3.3.4. The N 1s spectrum of N-CMC treated chalcopyrite at pH 10
Figure 5.21 The resolved narrow scan N 1s spectrum of N-CMC on chalcopyrite at
pH 10
Figure 5.21 shows that similar peak shifts were observed at pH 10. The peak of –NH– now
shifts to 399.9 eV while the peak of –NH-CH2-COOH shifts to 397.5 eV, as a result of the
interaction between Cu and –COOH. A new peak appears at 400.7 eV with a low intensity,
indicating that a very weak bond formed between Cu and the secondary amino group. It
also implies that only a limited amount of secondary amino groups are involved in the
binding reaction.

56 | P a g e
5.3.3.5. The N 1s spectrum of N-CMC treated galena at pH 7
Figure 5.22 The resolved narrow scan N 1s spectrum of N-CMC on galena at pH 7
Compared with N-CMC’s spectrum (Figure 5.19), after the adsorption on galena at pH 7,
the peak of –NH-CH2-COOH only changed by 0.1 eV which is within the resolution of the
XPS measurement (Figure 5.22). Meanwhile, the peak of –NH– did not shift. Therefore,
there seems to be no direct bonding between Pb and –COOH. When compared to the N 1s
spectrum on galena at pH 10 (Figure 5.23), the average peak intensity on galena at pH 7 is
relatively low. This indicates that the amount of N-CMC adsorbed on galena at pH 7 was
much smaller than that at pH 10.

57 | P a g e
5.3.3.6. The N 1s spectrum of N-CMC treated galena at pH 10
Figure 5.23 The resolved narrow scan N 1s spectrum of N-CMC on galena at pH 10
The N1s binding energy spectrum after treating galena with N-CMC is shown in Figure
5.23. As can be seen, the peak of –NH-CH2-COOH also stayed the same as at pH 7. The
peak of –NH– still did not shift, illustrating that no bonds were formed between Pb and –
COOH. In addition to the peak at 400.3 eV which appeared on both spectra at pH 7 and at
pH 10, another new peak at 399.9 eV also appeared at pH 10 with a relatively high intensity.
The peaks at 400.3 eV and 399.9 eV are probably due to the N-Pb bonding with Pb at
different valence states. Meanwhile, the total peak intensity is much higher than at pH 7 as
mentioned before, indicating that more N-CMC was adsorbed on galena at pH 10.
5.3.3.7. Comparison between the spectra of chalcopyrite and galena
At pH 7, comparison of Figures 5.20 and 5.22 show that the N 1s binding energy in –NH–
and –NH-CH2-COOH shifted when N-CMC was reacted with chalcopyrite but it did not
shift after reaction with galena. In addition, the overall binding energy peak intensity of N
1s on chalcopyrite is much higher than that on galena. Therefore, the adsorption of N-CMC
on chalcopyrite was much stronger than on galena at pH 7. Furthermore, two types of

58 | P a g e
bonding were formed between N-CMC and chalcopyrite, through –NH– and –COOH,
whereas for galena, no bond was formed between Pb and –COOH.
At pH 10, comparison of Figures 5.21 and 5.23 shows that although the N 1s binding
energy peak shift and peak intensity on chalcopyrite were higher than those on galena,
there was an extra N 1s binding energy peak with a high intensity on galena. Therefore, it
is possible that the adsorption of N-CMC on galena was also strong at pH 10.
These analyses are consistent with the results of the flotation tests in that N-CMC exhibited
a stronger depressing effect on chalcopyrite than galena at pH 7, while at pH 10 it showed
little selectivity between chalcopyrite and galena.
5.3.4. Zeta potential measurements
Figure 5.24 shows the effects of pH and N-CMC’s concentration on the zeta potential
values of chalcopyrite and galena. The measurements were carried out using 10-2 M NaCl
as an indifferent electrolyte. In the absence of N-CMC, both chalcopyrite and galena
showed negative zeta potentials in the whole tested pH range, with projected isoelectric
points (i.e.p.) lying somewhere between pH 2 and 3. Similar i.e.p. values for both
chalcopyrite and galena were reported in the literature (Bebie et al., 1998; Rath &
Subramanian, 1999). Due to the negative charge on both galena and chalcopyrite, a cationic
depressant is supposed to be favored through electrostatic interaction. N-CMC is
amphoteric in aqueous solutions: at low pH, the secondary amino groups on –NH-CH2-
COOH will be protonated, while at high pH, the –COOH group will lose a proton.
Therefore, it can be cationic, electrically neutral or anionic depending on pH. The titration
process of N-CMC can be expressed as the following formula based on the study by Wang
et al. (2008):
𝑅 − 𝑁𝐻2+ − 𝐶𝐻2 − 𝐶𝑂𝑂𝐻
+ 𝑂𝐻− → 𝑅 − 𝑁𝐻2
+ − 𝐶𝐻2 − 𝐶𝑂𝑂−
+ 𝑂𝐻− → 𝑅 − 𝑁𝐻 − 𝐶𝐻2 − 𝐶𝑂𝑂
−
where R represents the glucose ring of N-CMC’s structure.
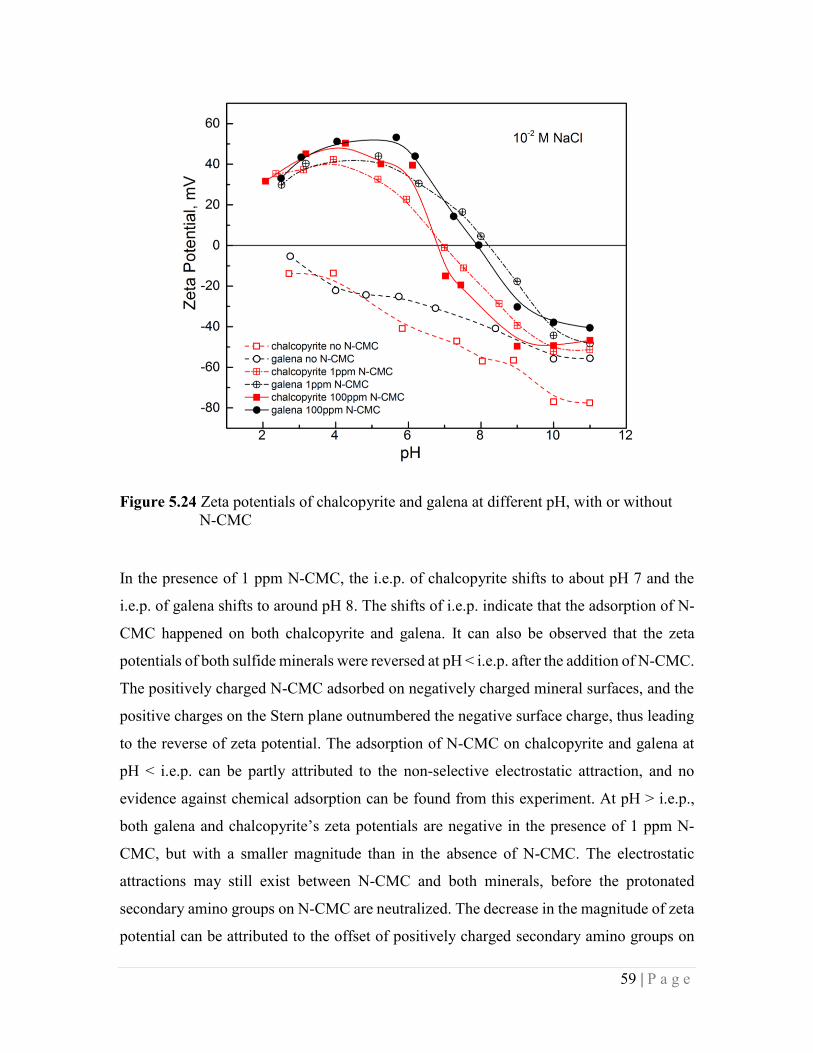
59 | P a g e
Figure 5.24 Zeta potentials of chalcopyrite and galena at different pH, with or without
N-CMC
In the presence of 1 ppm N-CMC, the i.e.p. of chalcopyrite shifts to about pH 7 and the
i.e.p. of galena shifts to around pH 8. The shifts of i.e.p. indicate that the adsorption of N-
CMC happened on both chalcopyrite and galena. It can also be observed that the zeta
potentials of both sulfide minerals were reversed at pH < i.e.p. after the addition of N-CMC.
The positively charged N-CMC adsorbed on negatively charged mineral surfaces, and the
positive charges on the Stern plane outnumbered the negative surface charge, thus leading
to the reverse of zeta potential. The adsorption of N-CMC on chalcopyrite and galena at
pH < i.e.p. can be partly attributed to the non-selective electrostatic attraction, and no
evidence against chemical adsorption can be found from this experiment. At pH > i.e.p.,
both galena and chalcopyrite’s zeta potentials are negative in the presence of 1 ppm N-
CMC, but with a smaller magnitude than in the absence of N-CMC. The electrostatic
attractions may still exist between N-CMC and both minerals, before the protonated
secondary amino groups on N-CMC are neutralized. The decrease in the magnitude of zeta
potential can be attributed to the offset of positively charged secondary amino groups on

60 | P a g e
N-CMC or due to the conformational rearrangement of electrically neutral N-CMC
molecules adsorbed on mineral surfaces (Rath & Subramanian, 1999).
In the presence of 100 ppm N-CMC, the zeta potential – pH curves of both minerals are of
similar shapes to those of 1 ppm N-CMC. Even though the concentration of N-CMC is 100
times higher, the zeta potentials of the two minerals are similar to those at 1 ppm N-CMC.
It is reasonable to believe that the adsorption of N-CMC on both minerals was saturated at
only 1 ppm N-CMC. This conclusion was also consistent with the result of single mineral
flotation tests.
According to the zeta potential measurements, the secondary amino groups on N-CMC can
adsorb on both galena and chalcopyrite through electrostatic attraction, but this interaction
is non-selective and is ruled out as the reason for N-CMC’s selectivity.
5.3.5. Summary
In the study of metal ion binding tests, N-CMC showed a stronger binding capacity with
Cu2+ than with Pb2+. The different depressant ability of N-CMC to chalcopyrite and galena
was very possibly based on their affinities for the respective metal ions.
Based on the ToF-SIMS images and XPS analyses, it can be seen that N-CMC adsorbed
mostly on chalcopyrite at pH 7 and the chemical bonds between N-CMC and chalcopyrite
were stronger than galena. Meanwhile, the substituted –COOH groups played an important
role in the selective depression of chalcopyrite at pH 7. Whereas at pH 10, although the
affinity of N-CMC towards galena was not obvious from ToF-SIMS images, XPS
measurements of the N 1s binding energies showed the formation of a relatively strong
new bond between the N atom in N-CMC and the galena surface.
Zeta potential measurements showed electrostatic interaction between N-CMC and both
chalcopyrite and galena. But this is not the reason for N-CMC’s selectivity.
In general, the results of adsorption mechanism studies are consistent with the results from
flotation tests in that N-CMC’s depressant ability to chalcopyrite was much stronger than
to galena at pH 7; while at pH 10, it depressed galena more than chalcopyrite but the
selectivity was rather weak.

61 | P a g e
5.4. Mineral surface cleaning tests
In sulfide mineral flotation, it is known that the dissolved copper ions can adsorb on the
surface of other sulfide minerals (Chandra & Gerson, 2009). The masking effect makes the
separation of Cu-bearing minerals from other minerals difficult (Finkelstein, 1997). Often
a surface cleaning agent, such as EDTA (ethylenediaminetetraacetic acid), needs to be used
to clean the mineral surface (e.g., Wang & Forssberg, 1990). From the successful
separation between chalcopyrite and galena conducted in this study, we believe that due to
its strong binding capacity with copper ions, N-CMC may have a similar function as EDTA
to remove the adsorbed copper ions from the surface of galena particles. A series of mineral
surface cleaning tests were carried out to verify this assumption. The results are shown in
Figure 5.25. This figure shows the copper ion concentrations detected in hydrochloric acid
solution after using it to wash the Cu2+-coated galena without (“Blank”) or with prior
treatment by N-CMC. As can be seen, much less copper ions were washed off by
hydrochloric acid when the Cu2+-coated galena was treated by N-CMC first. Therefore, N-
CMC is capable of cleaning the galena surfaces of adsorbed copper ions.
Figure 5.25 The concentration of copper ions released to HCl solution from Cu-coated
galena sample. The Cu-coated galena sample was either treated with N-CMC (“With N-
CMC”) or not treated with N-CMC (“Blank”) before being washed by the HCl solutions.

62 | P a g e
Figure 5.26 The N-C-C-O sequence in the structure of: a) EDTA; b) N-CMC.
According to Muzzarelli et al. (1982), the sequence of N-C-C-O in EDTA (shown as Figure
5.26a) which enables the formation of pertaatomic rings in metal chelates can also be found
in N-CMC (shown as Figure 5.26b). This is probably the reason why N-CMC can function
as a surface cleaning reagent as EDTA.
a) b)

63 | P a g e
6. Conclusions
6.1. General findings
Three carboxymethyl derivatives of chitosan were synthesized and their structures
were confirmed by FTIR and NMR analyses. They were named as N-CMC, O-
CMC and N-O-CMC with their amino groups on C-2, hydroxyl groups on C-6, and
both amino and hydroxyl groups substituted by carboxymethyl groups, respectively.
The solubility of these CMC products in aqueous solutions was in the order of N-
CMC > N-O-CMC > O-CMC.
N-CMC and N-O-CMC were tested as depressants in micro-flotation tests for
chalcopyrite and galena with KEX as a collector. The selectivity of N-O-CMC was
only observed in single mineral flotation but was absent in mixed mineral flotation
tests. N-CMC showed a good selectivity in both single mineral and mixed mineral
flotation tests, and it can depress chalcopyrite selectively under neutral pH without
affecting the flotation of galena. At pH 10, galena was depressed by N-CMC and
chalcopyrite can be floated.
Only N-CMC was further studied in batch flotation tests following a bulk flotation
and Cu-Pb differential flotation procedure. The test results indicated that N-CMC
depressed chalcopyrite very well while allowing galena to be floated. The gap
between their recoveries can be as high as 65 percentage points.
As revealed by the adsorption mechanism studies, N-CMC had an affinity to Cu2+
ions over Pb2+ ions. At pH 7, N-CMC mainly adsorbed on chalcopyrite and the
chemical bonds formed between chalcopyrite and N-CMC were stronger than the
bonds between N-CMC and galena. At pH 10, the chemical interaction between N-
CMC and galena may be slightly stronger than chalcopyrite, due to an extra bond
formed between N and Pb. The electrostatic adsorption of N-CMC happened on
both chalcopyrite and galena and it was not the reason for selectivity. Both –NH–
(secondary amino) and –COOH groups were involved in the chemical and
64 | P a g e
electrostatic adsorption of N-CMC on chalcopyrite and galena, and the N-CMC’s
preference for chalcopyrite at pH 7 was mainly due to the –COOH group while the
preference for galena at pH 10 was more likely due to the –NH– group.
According to the mineral surface cleaning test results, N-CMC had the ability of
removing adsorbed Cu2+ from the galena surface. This function is very similar to
EDTA and may be attributed to the same sequence of N-C-C-O in their structures.
With this function, N-CMC can separate Cu bearing sulfide minerals well from
other sulfide minerals even when the mineral surfaces are cross-contaminated by
various metal ions.
In general, the selective depression and surface cleaning function make N-CMC a
strong candidate to replace toxic depressants for the differential flotation of
chalcopyrite and galena.
6.2. Suggested future work
In order to achieve a better understanding of N-CMC’s adsorption behaviour on galena and
chalcopyrite, the adsorption densities of N-CMC on both minerals are required to be
studied with an increasing pH or increasing concentration of N-CMC.
Batch flotation tests were carried out in this study on mineral mixtures that were ground
together. They are not sufficient as proof for N-CMC’s effectiveness in industrial
applications. Lab scale flotation tests using real ore samples mined from operating mines
are very essential to further verify N-CMC’s performance as a selective depressant.
The depressing effect of N-CMC was only studied on the differential flotation of
chalcopyrite and galena in this work. Since N-CMC showed a stronger affinity on
chalcopyrite, the separation between chalcopyrite and other sulfide minerals can also be
expected. It is worthwhile to study the selectivity of N-CMC among different sulfide
minerals.
The cleaning function of N-CMC to remove Cu2+ ions was only studied on galena’s surface,
and can be further investigated on sphalerite and other sulfide minerals. The experimental

65 | P a g e
procedures can also be redesigned since the method used in this study was not direct and
convenient.
7. Appendix
7.1. Detailed procedures and raw data for batch flotation test
7.1.1. Test procedures
Table 7.1 Detailed procedures for batch flotation test
STAGE TIME pH ADDITION COMMENTS
min Reagent g/t
50 g chalcopyrite, 50 g galena, 300 g quartz
grinding 30 seconds, 300 mL distilled water
Cu Pb Bulk
Flotation 400 g sample (dry basis)
1.5 L cell (bottom driven flotation machine, 900 rpm)
Air flow rate: 7 L/min
Condition 10 10%
NaOH to pH 10.0
3 KEX 25 5 mL KEX (2 g/L)
Cu Pb Bulk float 1 2 MIBC 1
drop use if necessary
9.7
Condition 10 10%
NaOH to pH 10.0
2 KEX 20 4 mL KEX (2 g/L)
Cu Pb Bulk float 2 2 MIBC 1
drop use if necessary
Pb Flotation Fine mineral from the Cu Pb Roughrt Flotation
1.5 L cell (bottom driven flotation machine, 900 rpm)
Air flow rate: 7 L/min
Condition 1 10 10%
NaOH to pH 10.0

66 | P a g e
3 N-CMC 40 8 mL N-CMC (2 g/L)
Pb float 1 1 10 MIBC 2
drop use if necessary to white bubble rare out
Condition 2 3 10 N-CMC 10 2 mL N-CMC (2 g/L)
Pb float 2 1 10 MIBC 2
drop use if necessary to white bubble rare out
Condition 3 3 10 N-CMC 5 1 mL N-CMC (2 g/L) nothing can be floated out
3 KEX 10 2 mL KEX (2 g/L)
but nothing can be floated out
10 to
8
Pb float 3 2 8 MIBC 2
drop use if necessary to white bubble
Condition 4 3 10 KEX 10 2 mL KEX (2 g/L)
10 to
8
Pb float 4 1 MIBC 2
drop use if necessary to white bubble
Condition 5 3 10 N-CMC 5 1 mL N-CMC (2 g/L)
3 KEX 5 1 mL KEX (2 g/L)
10 to
8
Pb float 5 1 8 MIBC 2
drop use if necessary
Condition 6 3 10 N-CMC 5 1 mL N-CMC (2 g/L)
3 KEX 5 1 mL KEX (2 g/L)
nothing can be floated out
10 to
8
3 8 N-CMC 5 1 mL N-CMC (2 g/L)
18 KEX 65 13 mL KEX (2 g/L)
8 to
10

67 | P a g e
Pb float 6 2 10 MIBC 2
drop use if necessary to white bubble
Condition 7 3 8 KEX 15 3 mL KEX (2 g/L)
8 to
10
Pb float 7 2 10 MIBC 2
drop use if necessary to white bubble
Condition 8 3 8 KEX 15 3 mL KEX (2 g/L)
3 N-CMC 10 2 mL N-CMC (2 g/L)
12 KEX 90 16 mL KEX (2 g/L)
8 to
10
Pb float 8 2 10 MIBC 2
drop use if necessary to white bubble
7.1.2. Metallurgical balance
Table 7.2 Raw data and calculations for bulk flotation
Product Weight Assay Distribution (%)
(g) (%) Fe (%) Pb (%) Si (%) Cu Fe Pb Si
Pb conc 1 4.43 1.19 8.54 44.62 14.59 3.74 4.02 5.16 0.46
Pb conc 2 1.21 0.33 8.13 43.05 11.67 1.03 1.05 1.36 0.10
Pb conc 1+2 5.64 1.51 8.45 44.28 13.96 4.77 5.06 6.52 0.56
Pb conc 3 13.43 3.61 3.17 69.42 5.95 4.11 4.52 24.34 0.57
Pb conc 1+2+3 19.07 5.12 4.73 61.99 8.32 8.89 9.59 30.86 1.13
Pb conc 4 14.55 3.91 3.65 67.59 5.68 6.38 5.64 25.68 0.59
Pb conc 1+2+3+4 33.62 9.03 4.26 64.41 7.18 15.27 15.23 56.54 1.72
Pb conc 5 6.94 1.86 3.12 68.89 6.20 2.48 2.30 12.48 0.31
Pb conc 1+2+3+4+5 40.56 10.90 4.07 65.18 7.01 17.75 17.53 69.02 2.03
Pb conc 6 7.89 2.12 3.71 64.21 11.05 3.23 3.11 13.23 0.62
Pb conc
1+2+3+4+5+6 48.45 13.01 4.01 65.02 7.67 20.99 20.64 82.25 2.65
Pb conc 7 7.47 2.01 11.89 24.56 8.51 10.24 9.44 4.79 0.45
Pb conc 1-7 55.92 15.02 5.06 59.62 7.78 31.23 30.07 87.04 3.11
Pb conc 8 1.36 0.37 12.61 19.86 23.09 2.16 1.82 0.71 0.22
Pb conc 1-8 57.28 15.39 5.24 58.67 8.14 33.38 31.89 87.75 3.33
Pb flotation tail 26.50 7.12 15.81 6.82 17.05 52.80 44.51 4.72 3.23
Cu-Pb bulk conc 83.78 22.50 8.58 42.27 10.96 86.18 76.40 92.47 6.56
Cu Pb Bulk tail 288.50 77.50 0.77 1.00 45.37 13.82 23.60 7.53 93.44
Total 372.28 100.00 2.53 10.29 37.63 100.00 100.00 100.00 100.00
Measured 3.80 10.83 35.03

68 | P a g e
Table 7.3 Raw data and calculations for Cu-Pb separation
Product Weight Assay Distribution (%)
(g) (%) Fe
(%)
Pb
(%)
Si
(%) Cu Fe Pb Si
Pb conc 1 4.43 5.29 8.54 44.62 14.59 4.34 5.26 5.58 7.04
Pb conc 2 1.21 1.44 8.13 43.05 11.67 1.19 1.37 1.47 1.54
Pb conc 1+2 5.64 6.73 8.45 44.28 13.96 5.54 6.63 7.05 8.58
Pb conc 3 13.43 16.03 3.17 69.42 5.95 4.77 5.92 26.33 8.70
Pb conc 1+2+3 19.07 22.76 4.73 61.99 8.32 10.31 12.55 33.38 17.28
Pb conc 4 14.55 17.37 3.65 67.59 5.68 7.41 7.38 27.77 9.00
Pb conc 1+2+3+4 33.62 40.13 4.26 64.41 7.18 17.72 19.93 61.15 26.28
Pb conc 5 6.94 8.28 3.12 68.89 6.20 2.88 3.01 13.50 4.69
Pb conc
1+2+3+4+5 40.56 48.41 4.07 65.18 7.01 20.60 22.94 74.65 30.96
Pb conc 6 7.89 9.42 3.71 64.21 11.05 3.75 4.07 14.31 9.49
Pb conc
1+2+3+4+5+6 48.45 57.83 4.01 65.02 7.67 24.35 27.01 88.95 40.46
Pb conc 7 7.47 8.92 11.89 24.56 8.51 11.88 12.35 5.18 6.92
Pb conc 1-7 55.92 66.75 5.06 59.62 7.78 36.23 39.36 94.13 47.38
Pb conc 8 1.36 1.62 12.61 19.86 23.09 2.50 2.38 0.76 3.42
Pb conc 1-8 57.28 68.37 5.24 58.67 8.14 38.74 41.75 94.90 50.80
Pb flotation tail 26.50 31.63 15.81 6.82 17.05 61.26 58.25 5.10 49.20
Cu Pb Bulk Conc 83.78 100.00 8.58 42.27 10.96 100.00 100.00 100.00 100.00
Measured
7.2. Adsorption isotherm
Traditionally, in the process of determining the polysaccharides’ adsorption isotherm, the
concentration of polysaccharides in solution is measured as the determining parameter. By
subtracting the residual amount of polysaccharides in solution from its total amount, the
adsorbed amount of polysaccharides on mineral particles will be obtained. The most
common methods of measuring the polysaccharides concentration are the DNS (3, 5-
dinitrosalicylic aid) method (Miller, 1959) and the phenol-sulfuric acid method (Dubois et
al.,1956). Both of them are based on the colors produced in the chemical reaction between

69 | P a g e
reducing sugar and phenol or 3, 5-dinitrosalicylic acid, and they both require colorimetric
tests. However, by trial and error, the author found out neither of them can be used in
determining the content of N-CMC. The detectable range in the DNS method is only from
200 ppm to 1000 ppm while the most interesting range for this study is below 100 ppm.
Phenol-sulfuric acid has been successfully used in many tests for dextrin and starch, but
the colours produced by N-CMC were too light to reveal any difference regardless of N-
CMC’s concentration. The reason for this phenomenon is still uncertain but it is very
possible due to the unique structure of NH-CH2-COOH in N-CMC, which might disable
the hydrolysis of N-CMC into reducing sugar.
Due to the failure of calorimetry methods, N-CMC’s adsorption isotherm was then
measured by the total carbon method. The amount of CO2 produced by burning the N-
CMC solution can provide an indirect hint for N-CMC’s amount. However, the results
obtained from this method are not very satisfactory. As can be seen from Figure 7.2 below,
there is a drop for N-CMC’s adsorption densities on both chalcopyrite and galena around
100 ppm which is hard to explain. In addition, as shown on Figure 7.3, the adsorbed amount
of N-CMC on galena is higher than on chalcopyrite which is contradictory to the previous
results. There are many possible reasons for the imperfect experiment results, including
malfunction of the total carbon analyzer, carbon contamination from water or other sources,
and the operating errors when picking up 200 μL samples, etc. Therefore, the adsorption
isotherm experiment still requires further study by a new apparatus or repeated
measurements, and can only be presented in the appendix as a reference.
7.2.1. Experimental procedures
As a function of pH and equilibrium N-CMC concentration, the adsorption densities of N-
CMC on chalcopyrite and galena were studied. The concentration of N-CMC solution was
determined by total carbon analysis, using the CM 5015 CO2 coulometer together with the
CM5300 furnace module from UIC Inc. The CO2 coulometer can detect carbon in the range
of 0.01 μg to 100 mg. A standard curve shown in Figure 7.1 was first drawn to figure out
the linear relationship between the amount of carbon and the amount of N-CMC. And the
linear equation was also calculated as: y=0.3035x-0.141.

70 | P a g e
Figure 7.1 The standard curve
In the adsorption tests, 1 g of the -20 μm mineral powders were mixed with 50 mL of the
N-CMC solution with a certain concentration. After the pH was adjusted and recorded, the
suspension was then conditioned in a SI-600 shaking incubator (Jeio Tech, USA) for 30
minutes at 250 rpm, 25 ℃. After the conditioning, the solution pH was measured again
and recorded. The suspension was then allowed to stand for a period until the supernatant
was clear. 10 mL supernatant was taken as the sample, using a syringe with a 1 μm filter
on the tip, and then stored in a sample bottle for carbon analysis.
In the carbon analysis, only 200 μL sample was measured each time. Each time before
injecting a sample into the furnace, the system was allowed to purge for five minutes. The
temperature of the furnace was set to 850 ℃ to thoroughly generate CO2 from C in the
sample. The result was shown as the amount of C and then translated in to the amount of
N-CMC using the linear equation from above.

71 | P a g e
7.2.2. Results and discussion
The adsorption isotherms of N-CMC on chalcopyrite and galena at their natural pH are
shown as Figure 7.2. The adsorption densities are presented per unit weight of minerals
rather than per unit area. The adsorption isotherms of N-CMC on chalcopyrite and galena
were similar. Both of them are shown as a high-affinity (a special Langmuir) type since
they all reached the first maximum around a concentration of 60 ppm. A multilayer build-
up appeared on both isotherms at higher N-CMC concentration. Overall, the adsorption
densities of N-CMC on chalcopyrite were always higher than on galena.
To obtain the Langmuir equation of both isotherms, more data are required below 60 ppm.
Figure 7.2 The adsorption isotherm (natural pH: 5.5-6.5, 25 ℃) of N-CMC on
chalcopyrite and galena
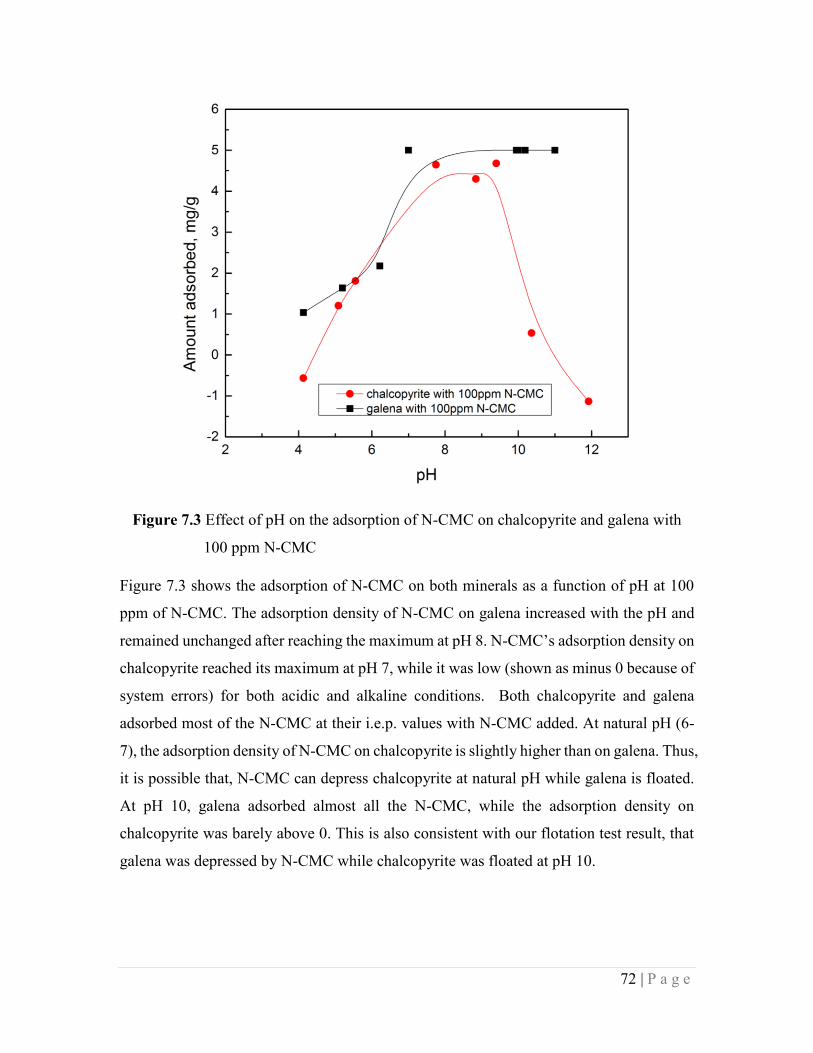
72 | P a g e
Figure 7.3 Effect of pH on the adsorption of N-CMC on chalcopyrite and galena with
100 ppm N-CMC
Figure 7.3 shows the adsorption of N-CMC on both minerals as a function of pH at 100
ppm of N-CMC. The adsorption density of N-CMC on galena increased with the pH and
remained unchanged after reaching the maximum at pH 8. N-CMC’s adsorption density on
chalcopyrite reached its maximum at pH 7, while it was low (shown as minus 0 because of
system errors) for both acidic and alkaline conditions. Both chalcopyrite and galena
adsorbed most of the N-CMC at their i.e.p. values with N-CMC added. At natural pH (6-
7), the adsorption density of N-CMC on chalcopyrite is slightly higher than on galena. Thus,
it is possible that, N-CMC can depress chalcopyrite at natural pH while galena is floated.
At pH 10, galena adsorbed almost all the N-CMC, while the adsorption density on
chalcopyrite was barely above 0. This is also consistent with our flotation test result, that
galena was depressed by N-CMC while chalcopyrite was floated at pH 10.

73 | P a g e
References
Afenya, P. M. (1982). Adsorption of xanthate and starch on synthetic
graphite. International Journal of Mineral Processing, 9(4), 303-319.
Allen, W., & Bourke, R. D. (1978). Milling Practice in Canada. CIM Spec, 16, 175.
Balajee, S. R., & Iwasaki, I. (1969). Adsorption mechanism of starches in flotation and
flocculation of iron ores. Trans. AIME, 244, 401-406.
Bakinov, K. G., Vaneev, I. I., Gorlovsky, S. I., Eropkin, U. I., Zashikhin, N. V., & Konev,
A. S. (1964). New methods of sulfide concentrate upgrading. 7th International Mineral
Processing Congress, New York, 227-238.
Beaussart, A., Mierczynska-Vasilev, A., & Beattie, D. A. (2009). Adsorption of dextrin on
hydrophobic minerals. Langmuir, 25(17), 9913-9921.
Bebie, J., Schoonen, M. A., Fuhrmann, M., & Strongin, D. R. (1998). Surface charge
development on transition metal sulfides: an electrokinetic study. Geochimica et
Cosmochimica Acta, 62(4), 633-642.
Bhatnagar, A., & Sillanpää, M. (2009). Applications of chitin-and chitosan-derivatives for
the detoxification of water and wastewater—a short review.Advances in Colloid and
Interface Science, 152(1), 26-38.
Bicak, O., Ekmekci, Z., Bradshaw, D. J., & Harris, P. J. (2007). Adsorption of guar gum
and CMC on pyrite. Minerals engineering, 20(10), 996-1002.
Blümich, B., Hagemeyer, A., Schaefer, D., Schmidt‐Rohr, K., & Spiess, H. W. (1990).
Solid State NMR spectroscopy in polymer science. Advanced Materials, 2(2), 72-81.
Boulton, A., Fornasiero, D., & Ralston, J. (2003). Characterisation of sphalerite and pyrite
flotation samples by XPS and ToF-SIMS. International journal of mineral
processing, 70(1), 205-219.
Brinen, J. S., & Reich, F. (1992). Static SIMS imaging of the adsorption of diisobutyl
dithiophosphinate on galena surfaces. Surface and interface analysis, 18(6), 448-452.

74 | P a g e
Brothers, R. (2002). Photometric Dispersion Analyzer THE PDA 2000 Operating
Manual. Cambridge, UK.
Bulatovic, S., & Wyslouzil, D. M. (1995). Selection and evaluation of different depressants
systems for flotation of complex sulphide ores. Minerals engineering, 8(1), 63-76.
Bulatovic, S. M. (1999). Use of organic polymers in the flotation of polymetallic ores: A
review. Minerals engineering, 12(4), 341-354.
Bulatovic, S. M. (2007). Handbook of flotation reagents: chemistry, theory and practice:
volume 1: flotation of sulfide ores. Elsevier.
Cao, M., & Liu, Q. (2006). Reexamining the functions of zinc sulfate as a selective
depressant in differential sulfide flotation — the role of coagulation. Journal of colloid and
interface science, 301(2), 523-531.
Chandra, A. P., & Gerson, A. R. (2009). A review of the fundamental studies of the copper
activation mechanisms for selective flotation of the sulfide minerals, sphalerite and
pyrite. Advances in Colloid and Interface Science, 145(1), 97-110.
Chattopadhyay, & D. P., Inamdar, M. S. (2014). Application of chitosan and its derivatives
in Cu(II) ion removal from water used in textile wet processing. Textile Research Journal,
84(14), 1539-1548.
Chen, L., Du, Y., & Zeng, X. (2003). Relationships between the molecular structure and
moisture-absorption and moisture-retention abilities of carboxymethyl chitosan: II. Effect
of degree of deacetylation and carboxymethylation. Carbohydrate research, 338(4), 333-
340.
Chen, R. N., Wang, G. M., Chen, C. H., Ho, H. O., & Sheu, M. T. (2006).
Development of N,O-(carboxymethyl) chitosan/collagen matrixes as a wound
dressing. Biomacromolecules, 7(4), 1058-1064.
Chen, X. G., & Park, H. J. (2003). Chemical characteristics of O-carboxymethyl chitosans
related to the preparation conditions. Carbohydrate Polymers, 53(4), 355-359.

75 | P a g e
Cheng, H. N. (1984). Carbon-13 NMR analysis of ethylene-propylene rubbers.
Macromolecules, 17(10), 1950-1955.
Dash, M., Chiellini, F., Ottenbrite, R. M., & Chiellini, E. (2011). Chitosan—A versatile
semi-synthetic polymer in biomedical applications. Progress in Polymer Science, 36(8),
981-1014.
Delben, F., Muzzarelli, R. A., & Terbojevich, M. (1989). Thermodynamic study of the
protonation and interaction with metal cations of three chitin derivatives. Carbohydrate
polymers, 11(3), 205-219.
Delben, F., & Muzzarelli, R. A. (1989). Thermodynamic study of the interaction of N-
Carboxymethyl chitosan with divalent metal ions. Carbohydrate polymers, 11(3), 221-232.
Dobetti, L., & Delben, F. (1992). Binding of metal cations by N-carboxymethyl chitosans
in water. Carbohydrate polymers, 18(4), 273-282.
Dolivo-Dobrovoskii, V.V., Rogachevskaya, T.A., (1957). Depression action of some high-
molecular organic compounds on sulfide minerals. Obogashch. Rud 1, 30-40, CA
53:11135.
Domard, A., Gey, C., Rinaudo, M., & Terrassin, C. (1987). 13C and 1H nmr spectroscopy
of chitosan and N-trimethyl chloride derivatives. International Journal of Biological
Macromolecules, 9(4), 233-237.
Dubois, M., Gilles, K. A., Hamilton, J. K., Rebers, P., & Smith, F. (1956). Colorimetric
method for determination of sugars and related substances. Analytical chemistry, 28(3),
350-356.
Dutta, P. K., Dutta, J., & Tripathi, V. S. (2004). Chitin and chitosan: Chemistry, properties
and applications. Journal of Scientific and Industrial Research, 63(1), 20-31.
Dutta, P. K., Tripathi, S., Mehrotra, G. K., & Dutta, J. (2009). Perspectives for chitosan
based antimicrobial films in food applications. Food Chemistry, 114(4), 1173-1182.
Dybowski, C., Glatfelter, A., Cheng, H. N. (2010). 13C NMR, Methods. Encyclopedia of
Spectroscopy and Spectrometry (Second Edition), 355-364.

76 | P a g e
Fairley, N. (2009). CasaXPS manual 2.3. 15. Acolyte Science.
Finkelstein, N. P. (1997). The activation of sulphide minerals for flotation: a
review. International Journal of Mineral Processing, 52(2), 81-120.
Fornasiero, D., & Ralston, J. (2006). Effect of surface oxide/hydroxide products on the
collectorless flotation of copper-activated sphalerite. International Journal of Mineral
Processing, 78(4), 231-237.
Foster, J. F., Whistler, R. L., & Paschall, E. F. (1965). Starch: chemistry and
technology. Academic, New York, 349.
Frahn, J. L., & Mills, J. A. (1959). Paper ionophoresis of carbohydrates. I. Procedures and
results for four electrolytes. Australian Journal of Chemistry, 12(1), 65-89.
Fuerstenau, D. W., & Fuerstenau, M. C. (1982). The flotation of oxide and silicate
minerals. Principles of flotation, 109-158.
Fuerstenau, M. C., Miller, J. D., & Kuhn, M. C. (1985). Chemistry of flotation. Society for
Mining Metallurgy.
Fuerstenau, D. W., Pradip, I. V. (2005). Zeta potentials in the flotation of oxide and silicate
minerals. Advances in Colloid and Interface Science, 114, 9-26.
Fuerstenau, M. C., Jameson, G. J., & Yoon, R. H. (Eds.). (2007). Froth flotation: a century
of innovation. SME.
Grahame, D. C. (1947). The electrical double layer and the theory of electrocapillarity.
Chemical Reviews, 41(3), 441-501.
Hanna, H. S. (1974). Adsorption of some starches on particles of spar minerals. In Recent
Advances in Science and Technology of Materials, Springer US, 365-374.
Haung, H. H., Calara, J. V., Bauer, D. L., & Miller, J. D. (1978). Adsorption reactions in
the depression of coal by organic colloids. Recent Developments in Separation Science, 4,
115-133.
Hayes, E. R. (1986). U.S. Patent No. 4,619,995. Washington, DC: U.S. Patent and
Trademark Office.

77 | P a g e
Hirano, S., Hirochi, K., Hayashi, K. I., Mikami, T., & Tachibana, H. (1991). Cosmetic and
pharmaceutical uses of chitin and chitosan. In Cosmetic and Pharmaceutical Applications
of Polymers, Springer US, 95-104.
Huang, P., Cao, M., & Liu, Q. (2012a). Using chitosan as a selective depressant in the
differential flotation of Cu–Pb sulfides. International Journal of Mineral Processing, 106,
8-15.
Huang, P., Cao, M., & Liu, Q. (2012b). Adsorption of chitosan on chalcopyrite and galena
from aqueous suspensions. Colloids and Surfaces A: Physicochemical and Engineering
Aspects, 409, 167-175.
Huang, P., Cao, M., & Liu, Q. (2013a). Selective depression of sphalerite by chitosan in
differential PbZn flotation. International Journal of Mineral Processing, 122, 29-35.
Huang, P., Cao, M., & Liu, Q. (2013b). Selective depression of pyrite with chitosan in Pb–
Fe sulfide flotation. Minerals Engineering, 46, 45-51.
Israelachvili, J. N. (2011). Intermolecular and surface forces: revised third edition.
Academic press.
Jayakumar, R., Prabaharan, M., Nair, S. V., Tokura, S., Tamura, H., & Selvamurugan, N.
(2010). Novel carboxymethyl derivatives of chitin and chitosan materials and their
biomedical applications. Progress in Materials Science, 55(7), 675-709.
Jenkins, P., & Ralston, J. (1998). The adsorption of a polysaccharide at the talc–aqueous
solution interface. Colloids and Surfaces A: Physicochemical and Engineering
Aspects, 139(1), 27-40.
Jin, R., Hu, W., & Meng, S. (1987). Flotation of sphalerite from galena with sodium
carboxymethyl cellulose as a depressant. Mineral and Metall Process, 4, 227-232.
Juang, R. S., Wu, F. C., & Tseng, R. L. (1999). Adsorption removal of copper (II) using
chitosan from simulated rinse solutions containing chelating agents. Water Research,
33(10), 2403-2409.

78 | P a g e
Khosla, N. K., Bhagat, R. P., Gandhi, K. S., & Biswas, A. K. (1984). Calorimetric and
other interaction studies on mineral—starch adsorption systems. Colloids and
surfaces, 8(4), 321-336.
Kittur, F. S., Harish Prashanth, K. V., Udaya Sankar, K., & Tharanathan, R. N. (2002).
Characterization of chitin, chitosan and their carboxymethyl derivatives by differential
scanning calorimetry. Carbohydrate polymers, 49(2), 185-193.
Kong, X. (2012). Simultaneous determination of degree of deacetylation, degree of
substitution and distribution fraction of –COONa in carboxymethyl chitosan by
potentiometric titration. Carbohydrate Polymers, 88(1), 336-341.
Larkin, P. (2011). Infrared and Raman spectroscopy; principles and spectral
interpretation. Elsevier.
Laskowski, J. S., Liu, Q., & Bolin, N. J. (1991). Polysaccharides in flotation of sulphides.
Part I. Adsorption of polysaccharides onto mineral surfaces. International journal of
mineral processing, 33(1), 223-234.
Lee, V. F. F. (1974). Solution and shear properties of chitin and chitosan (Doctoral
dissertation, University of Washington.).
Lin, K.F., Burdick, C.L. (1988). Polymeric depressants. In: Somasundaran, P., Moudgil,
B.M. (Eds.), Reagents in Mineral Technology. Marcel Dekker, New York, pp. 471–483.
Liu, Q., & Laskowski, J. S. (1989a). The role of metal hydroxides at mineral surfaces in
dextrin adsorption, II. Chalcopyrite-galena separations in the presence of dextrin.
International Journal of Mineral Processing, 27(1), 147-155.
Liu, Q., & Laskowski, J. S. (1989b). The interactions between dextrin and metal
hydroxides in aqueous solutions. Journal of Colloid and Interface Science, 130(1), 101-
111.
Liu, Q., Zhang, Y., & Laskowski, J. S. (2000). The adsorption of polysaccharides onto
mineral surfaces: an acid/base interaction. International Journal of Mineral
Processing, 60(3), 229-245.

79 | P a g e
Liu, Q., & Laskowski, J. S. (2002). Adsorption of polysaccharides on mineral surfaces
from aqueous solutions. In Encyclopedia of Surface and Colloid Science (Arthur Hubbard,
Ed.), Marcel Dekker, 573-590.
Miller, G. L. (1959). Use of DNS reagent for the measurement of reducing sugar.
Analytical Chemistry, 31(1), 426-428.
Miller, J. D., Laskowski, J. S., & Chang, S. S. (1983). Dextrin adsorption by oxidized
coal. Colloids and surfaces, 8(2), 137-151.
Morni, N. M., & Arof, A. K. (1999). Chitosan–lithium triflate electrolyte in secondary
lithium cells. Journal of power sources, 77(1), 42-48.
Morris, G. E., Fornasiero, D., & Ralston, J. (2002). Polymer depressants at the talc–water
interface: adsorption isotherm, microflotation and electrokinetic studies. International
Journal of Mineral Processing, 67(1), 211-227.
Moulder, J. F., Stickle, W. F., Sobol, P. E., & Bomben, K. D. (1992). Handbook of X-ray
photoelectron spectroscopy (Vol. 40). Eden Prairie, MN: Perkin Elmer.
Mourya, V. K., Inamdar, N. N., & Tiwari, A. (2010). Carboxymethyl chitosan and its
applications. Advanced Materials Letters, 1(1), 11-33.
Muzzarelli, R. A., Tanfani, F., Emanuelli, M., & Mariotti, S. (1982). N-
(carboxymethylidene) chitosans and N-(carboxymethyl) chitosans: Novel chelating
polyampholytes obtained from chitosan glyoxylate. Carbohydrate Research, 107(2), 199-
214.
Muzzarelli, R. A., Lough, C., & Emanuelli, M. (1987). The molecular weight of chitosans
studied by laser light-scattering. Carbohydrate research, 164, 433-442.
Muzzarelli, R. A. (1988). Carboxymethylated chitins and chitosans. Carbohydrate
polymers, 8(1), 1-21.
Nieto, J. M., Peniche-Covas, C., & Del Bosque, J. (1992). Preparation and characterization
of a chitosan-Fe (III) complex. Carbohydrate polymers, 18(3), 221-224.

80 | P a g e
Némethy, G., & Scheraga, H. A. (1962). Structure of water and hydrophobic bonding in
proteins. I. A model for the thermodynamic properties of liquid water. The Journal of
Chemical Physics, 36(12), 3382-3400.
Ogawa, K., Oka, K., & Yui, T. (1993). X-ray study of chitosan-transition metal
complexes. Chemistry of materials, 5(5), 726-728.
Okuyama, K., Noguchi, K., Kanenari, M., Egawa, T., Osawa, K., & Ogawa, K. (2000).
Structural diversity of chitosan and its complexes. Carbohydrate Polymers, 41(3), 237-247.
Pearse, M. J. (2005). An overview of the use of chemical reagents in mineral
processing. Minerals Engineering, 18(2), 139-149.
Pearson, F. G., Marchessault, R. H., & Liang, C. Y. (1960). Infrared spectra of crystalline
polysaccharides. V. Chitin. Journal of Polymer Science, 43(141), 101-116.
Pillari, C. K. S., Paul, W., & Sharma, C. P. (2011). Chitosan: manufacture, properties and
uses. In Chitosan: Manufacture, Properties and Usage (Samuel P. Davis, Ed.), Nova
Science Publisher, 133-215.
Pugh, R. J. (1989a). Macromolecular organic depressants in sulphide flotation—a review,
1. Principles, types and applications. International Journal of Mineral Processing, 25(1),
101-130.
Rath, R. K., & Subramanian, S. (1999). Adsorption, electrokinetic and differential flotation
studies on sphalerite and galena using dextrin. International journal of mineral processing,
57(4), 265-283.
Ravi Kumar, M. N. (2000). A review of chitin and chitosan applications. Reactive and
functional polymers, 46(1), 1-27.
Rinaudo, M., Dung, P. L., Gey, C., & Milas, M. (1992). Substituent distribution on O, N-
carboxymethylchitosans by 1H and 13C nmr. International journal of biological
macromolecules, 14(3), 122-128.

81 | P a g e
Sahu, S. K., Maiti, S., Maiti, T. K., Ghosh, S. K., & Pramanik, P. (2011). Hydrophobically
modified carboxymethyl chitosan nanoparticles targeted delivery of paclitaxel. Journal of
drug targeting, 19(2), 104-113.
Schnarr, J. R. (1978). Brunswick mining and smelting corporation. Milling Practice in
Canada. CIM Spec, 16, 158-161.
Shahidi, F., Arachchi, J. K. V., & Jeon, Y. J. (1999). Food applications of chitin and
chitosans. Trends in Food Science & Technology, 10(2), 37-51.
Siwek, B., Zembala, M., & Pomianowski, A. (1981). A method for determination of fine-
particle flotability. International Journal of Mineral Processing, 8(1), 85-88.
Somasundaran, P. (1969). Adsorption of starch and oleate and interaction between them
on calcite in aqueous solutions. Journal of Colloid and Interface Science, 31(4), 557-565.
Somasundaran, P., & Wang, D. (2006). Solution chemistry: minerals and reagents (Vol.
17). Elsevier.
Stowe, K. G., Chryssoulis, S. L., & Kim, J. Y. (1995). Mapping of composition of mineral
surfaces by TOF-SIMS. Minerals engineering, 8(4), 421-430.
Subban, R. H. Y., Arof, A. K., & Radhakrishna, S. (1996). Polymer batteries with chitosan
electrolyte mixed with sodium perchlorate. Materials Science and Engineering: B, 38(1),
156-160.
Taylor, T. G., & Iddies, H. A. (1926). Separation of the amyloses in some common
starches. Industrial & Engineering Chemistry, 18(7), 713-717.
Thermo Nicolet Corporation (2001). Introduction to Fourier Transform Infrared
Spectrometry, Retrieved from Thermo Nicolet Corporation website:
<http://mmrc.caltech.edu/FTIR/FTIRintro.pdf>.
Tiwary, A. K., Sapra, B., Kaur, G., & Rana, V. (2011). Chitosan: manufacture, properties
and uses. In Chitosan: Manufacture, Properties and Usage (Samuel P. Davis, Ed.), Nova
Science Publisher, 71-131.

82 | P a g e
Tungtong, S., Okonogi, S., Chowwanapoonpohn, S., Phutdhawong, W., &
Yotsawimonwat, S. (2012). Solubility, viscosity and rheological properties of water-
soluble chitosan derivatives. Maejo International Journal of Science and Technology,
6(02), 315-322.
Upadhyaya, L., Singh, J., Agarwal, V., & Tewari, R. P. (2013). Biomedical applications of
carboxymethyl chitosans. Carbohydrate polymers, 91(1), 452-466.
Varma, A. J., Deshpande, S. V., & Kennedy, J. F. (2004). Metal complexation by chitosan
and its derivatives: a review. Carbohydrate Polymers, 55(1), 77-93.
Wagner, C. D., Powell, C. J., Allison, J. W., & Rumble, J. R. (1997). NIST X-ray
Photoelectron Spectroscopy Database (Version 2.0). Retrieved from NIST Standard
Reference Data Program website: <http://www.nist.gov/srd>.
Wan Ngah, W. S., Teong, L. C., & Hanafiah, M. A. K. M. (2011). Adsorption of dyes and
heavy metal ions by chitosan composites: A review. Carbohydrate Polymers, 83(4), 1446-
1456.
Wang, K., & Liu, Q. (2013). Adsorption of phosphorylated chitosan on mineral
surfaces. Colloids and Surfaces A: Physicochemical and Engineering Aspects, 436, 656-
663.
Wang, L. C., Chen, X. G., Liu, C. S., Li, P. W., & Zhou, Y. M. (2008). Dissociation
behaviors of carboxyl and amine groups on carboxymethyl-chitosan in aqueous
system. Journal of Polymer Science Part B: Polymer Physics, 46(14), 1419-1429.
Wang, M., Xu, L., Zhai, M., Peng, J., Li, J., & Wei, G. (2008). γ-ray radiation-induced
synthesis and Fe (III) ion adsorption of carboxymethylated chitosan
hydrogels. Carbohydrate polymers, 74(3), 498-503.
Wang, X., & Forssberg, E. (1990). EDTA-induced flotation of sulfide minerals. Journal of
colloid and interface science, 140(1), 217-226.
Weisseborn, P. K., Warren, L. J., & Dunn, J. G. (1995). Selective flocculation of ultrafine
iron ore. 1. Mechanism of adsorption of starch onto hematite. Colloids and surfaces A:
Physicochemical and engineering aspects, 99(1), 11-27.

83 | P a g e
Wie, J., & Fuerstenau, D. W. (1974). The effect of dextrin on surface properties and the
flotation of molybdenite. International Journal of Mineral Processing, 1(1), 17-32.
Wills, B. A., & Napier-Munn, T. (2006). Wills’ mineral processing technology: an
introduction to the practical aspects of ore treatment and mineral recovery. Butterworth-
Heinemann.
Yue, L., Zhang, L., & Zhong, H. (2014). Carboxymethyl chitosan: A new water soluble
binder for Si anode of Li-ion batteries. Journal of Power Sources, 247, 327-331.
Zeng, D., Wu, J., & Kennedy, J. F. (2008). Application of a chitosan flocculant to water
treatment. Carbohydrate polymers, 71(1), 135-139.


![Effect of Starch Physiology, Gelatinization and Retrogradation …...[16]. Starch amylose/amylopectin ratio, morphological attributes along with other biopolymers and plasticizers](https://static.fdocuments.net/doc/165x107/60ef84ec794f946f0c2778b9/effect-of-starch-physiology-gelatinization-and-retrogradation-16-starch.jpg)


