Carbon Nanotubes Plant - University of Oklahoma · Carbon Nanotubes Plant Linh Do Sabrina Pepper...
68
Carbon Nanotubes Plant Linh Do Sabrina Pepper Ilze Veidemane
Transcript of Carbon Nanotubes Plant - University of Oklahoma · Carbon Nanotubes Plant Linh Do Sabrina Pepper...

Carbon Nanotubes Plant
Linh DoSabrina PepperIlze Veidemane

Presentation Outline
Carbon nanotube historyProduction methods Economic ForecastHiPCO plant designCoMoCat plant design Plant Capacity and LocationBusiness Plan

History
The discovery of nanotubes comes from the Buckyballin 1980
Nanotubes discovered in 1991 by S. Iijima (http://www.slb.com)

Types of CNT’s
Single wall (SWNT)single layer walldiameter 0.7-5 nm
Multi-wall (MWNT)concentric tubesinner diameter: 1.5-15 nmouter diameter: 2.5-30 nm

Orientation and Properties
All possible structures of SWNTs can be formed from chiral vectors

Bond Types
Armchair (conductor)Zigzag (semiconductor)Chiral(semiconductor)

Properties
The chart compares the tensile strength of SWNT's to some common high-strength materials.Electrical conductivity is as high as copperThermal conductivity is as high as diamondStrength 100 times greaterthan steel at one sixth the weight

SWNT Applications
Application Diameter (nm) Length (µm) Desired Form
Lithium batteries 0.7- 1.4 5. -40. Defects
Chemical sensors 1.4 - 2.3 20. - 40. Higly aligned carbon nanotubes
Flat panel displays 1.0 - 5.0 5. - 100Highly ordered arrays on substrate
Hydrogen storage 1.85 - 5.0 10.-50 Produced by Ar and H2 arc method
AFM tips 1.0 - 2.0 18. - 35.
Grown directly by CVD onto Si tips (can be attached later)

Production Methods
Arc discharge
Laser ablation
Chemical Vapor Deposition (CVD)

Arc-discharge apparatus
ArcArc––Discharge ProcessDischarge ProcessHigh-purity graphite rods under a helium atmosphere.T > 3000oC 20 to 40 V at a current in the range of 50 to 100 AGap between the rods approximately 1 mm or less Lots of impurities: graphite, amorphous carbon, fullerenes

Laser ablation apparatus
Laser Ablation ProcessTemperature 1200oCPressure 500 TorrCu collector for carbon clusters MWNT synthesized in pure graphiteSWNT synthesized when Co, Ni, Fe, Y are usedLaminar flowFewer side products than Arc discharge

Gas phase process
No substrate
FROM CARBON MONOXIDE
(HiPCO®) (CoMoCat®)
CVD
Chemical Vapor Deposition

Growth Mechanism

CVD in Gas Phase Process
Catalysts: Fe, Ni, Co, or alloys of the three metalsHydrocarbons: CH4, C2H2, etc.Temperature: First furnace 1050oC
Second furnace: 750oC Produce large amounts of MTWNs

HiPCO® PROCESS
CVD of Carbon Monoxide
Thermal decomposition of iron pentacarbonyl in a flow of COTemperature ~1050oCPressure ~10 atm
Fe(CO)52CO(g) C(s) + CO2(g)

CoMoCat® PROCESS
CVD of Carbon Monoxide
Disproportionation of CO over a Co/Mo, silica supported catalystTemperatures 700-950oCPressure (1–10 atm)
2CO(g) C(s) + CO2(g)Co : Mo
recirculating pump

Comparison of Nanotube Production Technology
Conductor CNTs
Continuous or Semi Batch.
50%
Produces MWNT and SWNT; hard to separate.Semi Conductor Semi Conductor

Market ForecastDerived from information and news sources
Two sectors: Research and Commercial
Research demand assumed to increase in proportion to government spending
Commercial demand evaluated for 6 applications:• Chemical Sensors• Hydrogen Storage• Fibers and Composites
• Batteries• Flat Panel Displays• AFM Probe Tips

Research Demand
Research demand was assumed to increase at the same rate as government spending
Research demand is essentially independent of price
Government spending was estimated from the National Nanotechnology Initiative
Largest spenders: U.S., Japan, W. Europe
Projected Global Government Spending
0
2000
4000
6000
8000
1995 2000 2005 2010 2015Year
Mill
ions
of D
olla
r
Research Demand
700
900
1100
1300
1500
1700
2004 2006 2008 2010 2012 2014
Year
Qua
ntity
(kg)
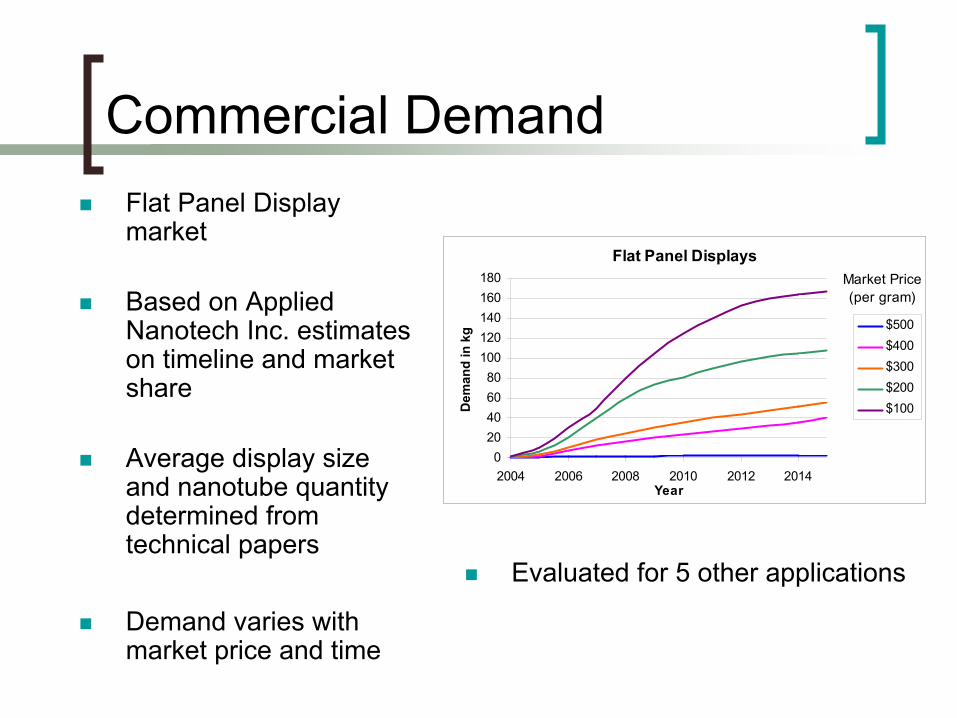
Commercial DemandFlat Panel Display market
Based on Applied Nanotech Inc. estimates on timeline and market share
Average display size and nanotube quantity determined from technical papers
Demand varies with market price and time
Flat Panel Displays
020406080
100120140160180
2004 2006 2008 2010 2012 2014Year
Dem
and
in k
g $500 $400 $300 $200 $100
Market Price(per gram)
Evaluated for 5 other applications

Forecasted Demand Curves
Total demand in both research and commercial sectorsDemand curves shift to the right with timeDemand becomes less inelastic with time and at lower price
$100
$200
$300
$400
$500
0 1000 2000 3000 4000
Demand in Kilograms
Mar
ket P
rice
($/g
)
2004
2005
2006
2007
2008
2009
2010
2011
2012
2013
2014
2015
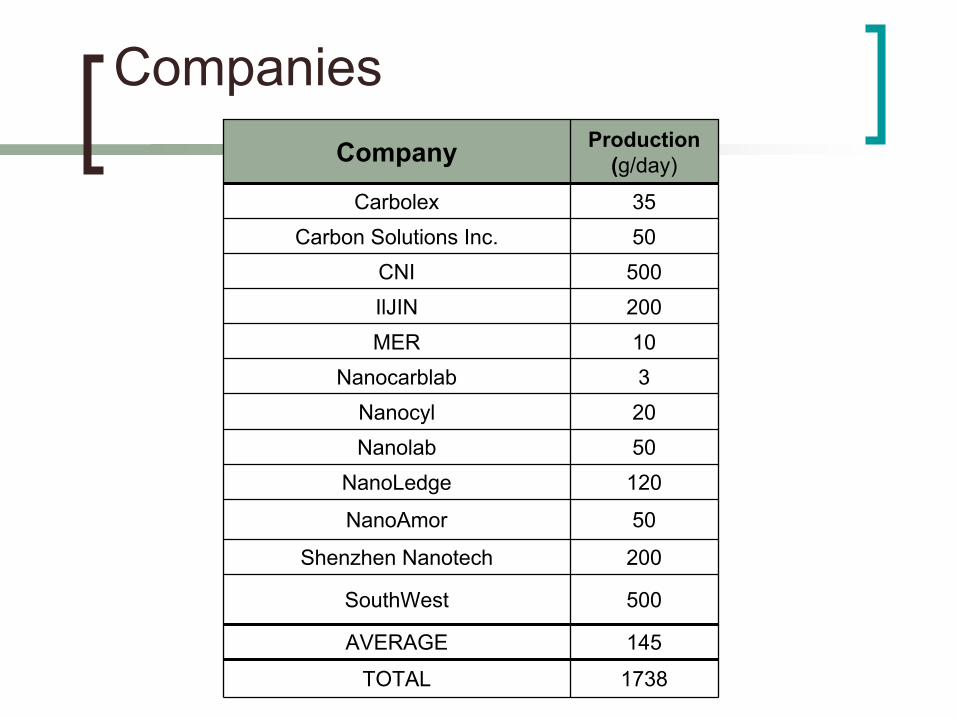
Companies
1738TOTAL
145AVERAGE
500SouthWest
200Shenzhen Nanotech
50NanoAmor
120NanoLedge50Nanolab20Nanocyl3Nanocarblab10MER200IlJIN500CNI50Carbon Solutions Inc.35Carbolex
Production(g/day)Company

Companies
The projected number of companies in the market was estimated based on the past trendAverage production rate determined from market research
Projected Entry of Companies into Market
05
101520253035
2000 2002 2004 2006 2008 2010 2012 2014
Year
Num
ber o
f SW
NT
Pro
duct
ioFa
cilit
ies

Supply ForecastBased on projected number of companiesAverage production rate to increase at a maximum of 10% per yearSupply curves were assumed to be linear
0
100
200
300
400
500
0 1000 2000 3000 4000 5000Quantity (kg/year)
Mar
ket P
rice
($/g
200420052006200720082009201020112012201320142015

Market Equilibrium
Intersection of supply and demand curves
Price and quantity determined for each year
Market Equilibrium for 2005
100
200
300
400
500
0 300 600 900 1200 1500
Quantity (kg/year)
Mar
ket P
rice
($/g
)
DemandSupply
E

EquilibriumEquilibrium Quantity
700
1300
1900
2500
2004 2007 2010 2013Year
Qua
ntity
(kg/
yea
Equilibrium Price
0100200300400500
2004 2007 2010 2013Year
Pric
e ($
/gra
m
• Equilibrium quantity will increase at a nearly linear rate
• Equilibrium price will decrease over the next ten years
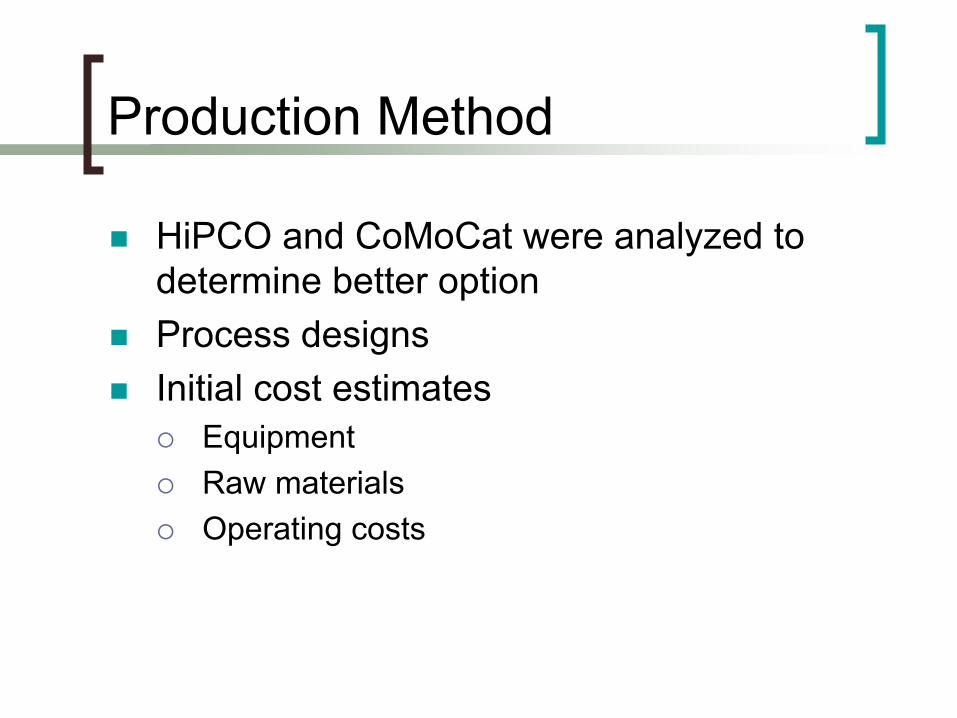
Production Method
HiPCO and CoMoCat were analyzed to determine better optionProcess designs Initial cost estimates
EquipmentRaw materialsOperating costs

HiPCO Process

HiPCO Reactor
Scaled-up from pilot as bundle of tubesStainless steel tubes with heating elementsChannels bored in tube wallTube cost: $225
CO & Fe(CO)5 inlet into reaction
chamber
CO Showerhead
flow
36 in
2.75 in
1.5 in
0.375 in
Heating element

Purification Process
Heat in furnaceSonicate in concentrated HClFilter and dry in vacuum ovenAnneal at 800oC
Filtered Nanotubes
Furnace325oC1.5 h
Argon, O2
SonicatorHCl
15 min
Filter paper1µm
H2O, CH4 rinse
Vacuum oven
Anneal800oC Packaging
Cole Parmer Vacuum Oven1000W, 300oC
Cole Parmer Furnace1200oC, 1000WCole Parmer
Ultrasonic Processor10L, 100L/hr, 1500 W
Cole Parmer Furnace1200oC, 1000W

HiPCO Equipment Costs
109,490Total500Vacuum pump
7,940Ultrasonic processor2,000Furnace2,700Vacuum oven1,300Nanotube filter
10,000Molecular sieve60,000Compressor25,050Reactor
Cost ($)Equipment
•Shown for a capacity of 360 kg per year

CoMoCat Flow Diagram
Height 1 m Diameter 0.4 m
Scale model designed so that ratio of all of the important forces is the same in the model as in the full-scale bed. Similar geometryUse Froude number

CoMoCat Flow Diagram

Purification Flow Diagram

CNT Handling Diagram

Delivering Forms
Forms of delivering the nanotubes :
a) freeze-dried web
b) stable suspension
b
a

CoMoCat Equipment Costs
144,900Total11,500Sonicating Beds 10,000Gel Drying bed 15,000Catalyst heater 11,000Gas heater
1,300Filters10,000Molecular sieve50,300Compressor35,800Reactor
Cost ($)Equipment
•Shown for a capacity of 360 kg per year•Pricing info: Matches & T.P.McNulty Associates
M.S. Peters and K.D. Timmerhaus, Plant Design & Economics for Chemical Engineers

Production method comparisons
QualityTechnologyPotential MarketFixed Capital InvestmentOperating Cost

Comparison of Quality
Bundle size - CoMoCat (10-20 CNT’s)
- HIPCO (50-100 CNT’s)
Impurities - CoMoCat: less by wt%- HiPCO: fewer types

Our SWeNT
HIPCO
0.8 nm diameter
HIPCO
HIPCO1.0 nm diameter
Comparison of Quality Distribution of semiconducting nanotubes (Chiral).
The diameter of the nanotubes increases to the right.
CoMoCat 0.8 nm diameter
HIPCO1.0 nm diameter

Plug flow reactorLaminar flowSimple catalystYield
50wt% SWNT50wt% Fe impurities
Lower SelectivityBigger bundles (50-100 CNTs)
Semi Batch reactorTurbulent flowComplicated catalystYield
10wt% SWNT90wt% impurities
Higher SelectivitySmaller bundles (10 – 20 CNTs)
HiPCO CoMoCat
Technology Comparisons

Potential Market
Potential market for both processes are essentially the sameProcesses were evaluated on a cost basis
BatteriesFlat Panel DisplaysAFM Probe TipsChemical SensorsFibers and CompositesHydrogen Storage
HiPCOCoMoCat

Operating Cost Analysis
5,250,000Annual Operating Costs4,185,500
1,000,000Labor cost ($/year)1,000,000
2,020,000Annual raw material cost($/year)596,000
2,230,000Annual utility cost ($/ year )2,589,499
CoMoCatHiPCO
•Shown for a capacity of 360 kg per year

Fixed Cost Analysis
• Shown for a capacity of 360 kg per year

Mathematical Model
Input:FCI vs. CapacityOperating CostsRaw materialsLocationsTaxesLabor wagesDemand
Output:Net present valuePlant locationProduct market
Mathematical Model
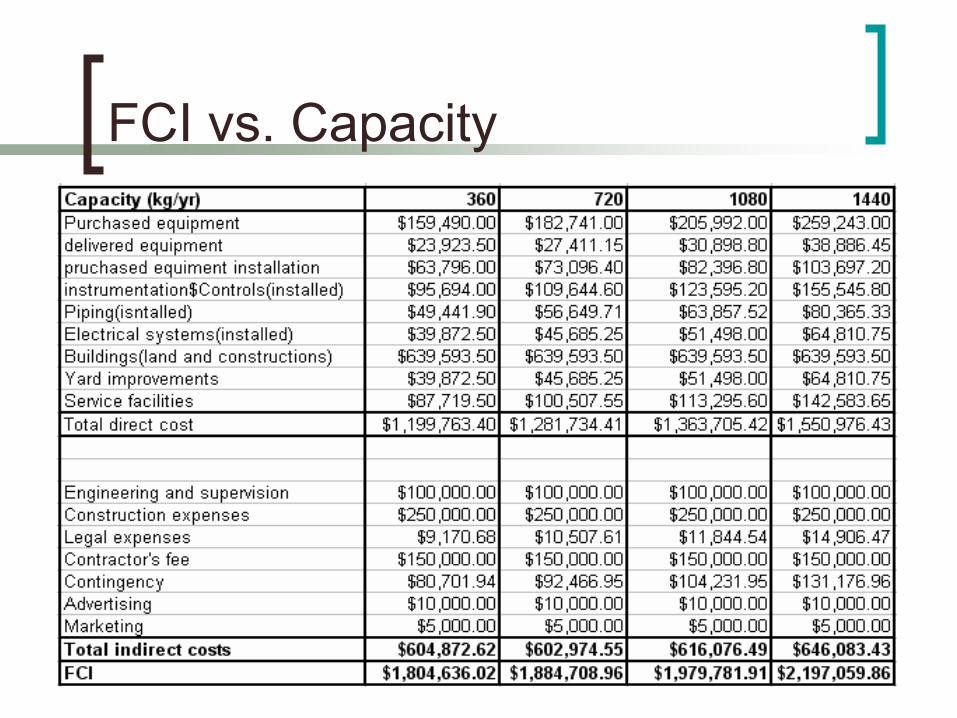
FCI vs. Capacity

Model InputFCI vs capacity
y = 353.43x + 2E+06
0
500000
1000000
1500000
2000000
2500000
0 500 1000 1500 2000
capacity (kg/yr)
FCI (
$)

Model Inputoperating cost vs capacity
y = 194.2x + 2E+06
2050000
2100000
2150000
2200000
2250000
2300000
0 200 400 600 800 1000 1200 1400 1600
capacity (kg/yr)
cost
($)

Silicon ValleyStrengths -$100M in state funding pledged over 4
years -Tech-focused infrastructure, with myriad Of top players from high-tech industry
Weaknesses -Still recovering from dot-com excesses -High cost of living
South CaliforniaStrengths - $ 100 M in state funding pledged over 4 years
- VC firms view funding of So.Cal start- ups favorably
- Cal. NanoSystems Institute fostering academic-industry collaboration
Weaknesses- Competitive entrepreneurial environment can make funding difficult
- High cost of living
Texas Strengths - 1 of 6 NSF Nano research centers at Rice
- Experience in attracting tech companies - Texas Nanotechnology initiative fostering collaboration between industry, academia,government
Weaknesses - Austin- Huston – Dallas cluster is geographically dispersed
- No concrete state funding or initiative yet
Illinois Strengths-2 of 6 NSF Nano researchcenters at Northwestern andUIUC (including RPI’s center, due to NSEC grant partnership)
-Strong nano research base -Significant additional talent and infrastructure nearly at Purdue, Notre Dame, and WisconsinWeaknesses Investment capital believed to be more conservative than elsewhere
MassachusettsStrengths- 1 of 6 NSF nano research centers at
Harvard - Track record of establishing new industries - Abundant entrepreneurship
Weaknesses - State has little money to fund initiatives - High cost of living
NY/NJStrengths- 3 of 6 NSF Nano research ceantersat Columbia, RPI and Cornell
- Great access to NYC-based venture capital
- NJ very supportive of industry-academic partnerships. Lucent recently donated its facility to serve as a NJ Nanotech Park
- Over $ 150M in state and IBM support for Center for Excellence in Nano (NY University at Albany)
Weaknesses- No coordinated effort yet - High cost of living
OklahomaStrengths-University of Oklahoma research -SouthWest NanoTechnology Inc.-CoMoCAT technology Weaknesses -Taxes

Taxes and Labor
Total staff : 22
Total wage paid per year: $ 1,000,000
States State Income Tax State Sales Tax Property Tax California 1% - 9.3 % 6% 30%Texas 0% 6.25% 25%NY/NJ 1.4 % - 6.37 % 6% 34%Massachusetts 5.30% 5% 30%Illinois 3% 6.25% 33.33%Oklahoma 0.5 % - 7 % 4.50% 15%

Model Input
Forecasted demand for nanotubes
Equilibrium Quantity
700
1300
1900
2500
2004 2007 2010 2013Year
Qua
ntity
(kg/
yea

Model Input
Forecasted price
Equilibrium Price
0
100
200
300
400
500
2004 2006 2008 2010 2012 2014
Year
Pric
e ($
/gra
m)

Equations
tptpitpitpi
iitpitpitpi
iiii
CapimproveostsOperatingCRawMatCostTotalCosts
taxpropFCIdvenuevenueCF
CapacityCbcBbiAFCI
++=
−−=
++=
,,,
,,, *)*(ReRe
***
Binary Variables
bi = 1 if constructed
bc = 1 if expandedAmount taken directly from revenues to pay for capital investment
Equations
∑ ∑
−⋅
++
++
=
=
i tp iitpws
tptpi
ii
TCIFCIiIV
iCF
NPW
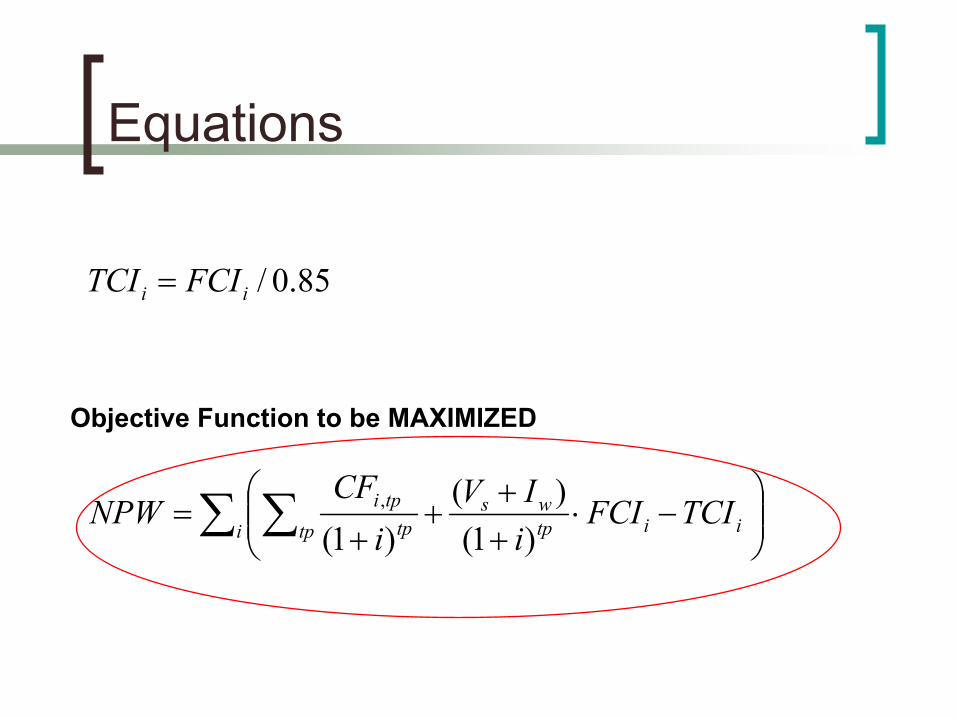
FCITCI
)1()(
)1(
85.0/
,
Objective Function to be MAXIMIZED

Constraints
∑
∑
∑
∑
=
≥
≥
≥
=
=j tpji
ii
i tpjitpj
j tpjiii
i i
x
CapacityMaxCap
xPMDemand
xbiCapacity
biNumPlants
0
)(*
*
1,,
,,,
,, Percentage of targeted market

Sensitivity Analysis
241
18
10%
140
4.6
5%
29Capacity (kg)
0.5NPW (million$)
1%Market Share
6.418NPW (million$)
30% less than
forecast price
Forecast price
Product Price
0.74518NPW (million$)
+ 50%Current price
Raw materials
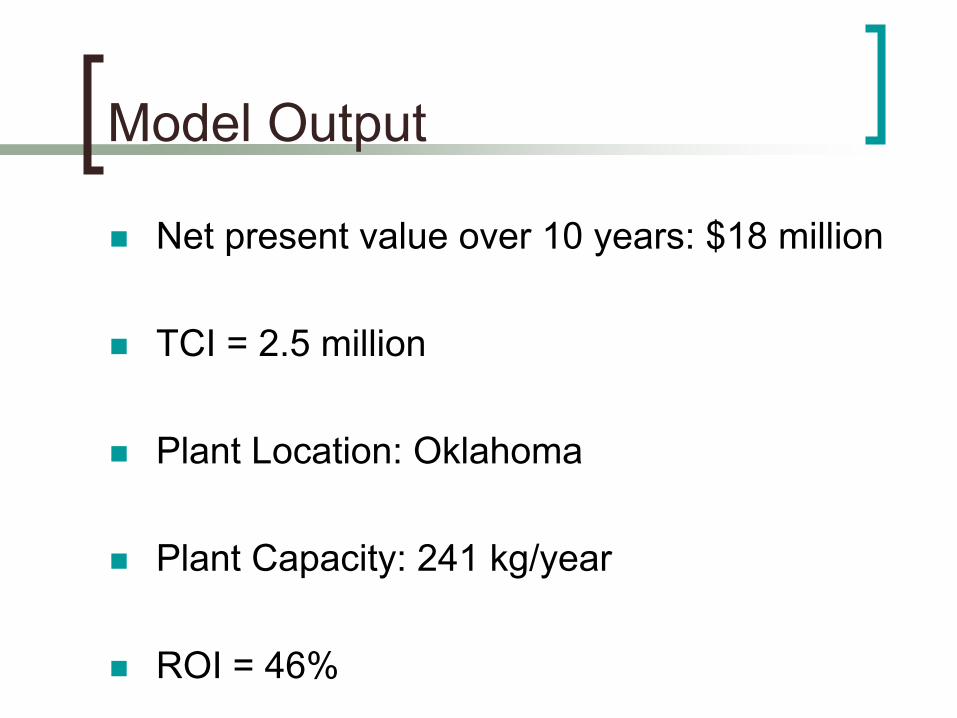
Model Output
Net present value over 10 years: $18 million
TCI = 2.5 million
Plant Location: Oklahoma
Plant Capacity: 241 kg/year
ROI = 46%

Plant Capacity
• For $2.5 million total capital investment
Plant Capacity
0
50
100
150
200
250
300
350
400
450
1 2 3 4 5 6 7 8 9 10
Year (year1 = 2006)
kilo
gram
s
capacity
production rate
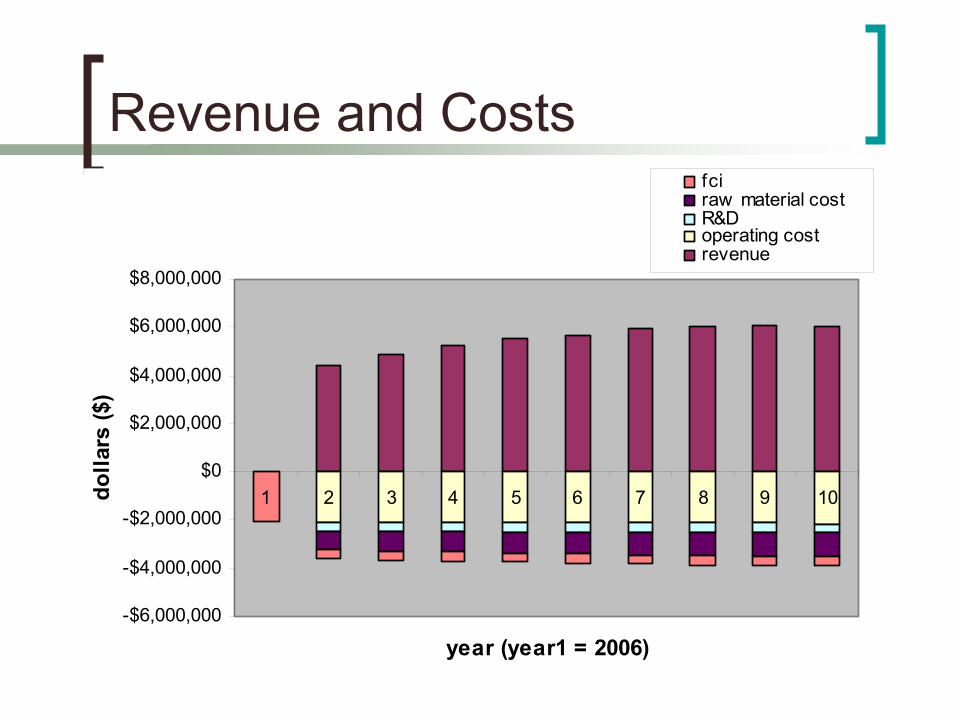
Revenue and Costs
-$6,000,000
-$4,000,000
-$2,000,000
$0
$2,000,000
$4,000,000
$6,000,000
$8,000,000
1 2 3 4 5 6 7 8 9 10
year (year1 = 2006)
dolla
rs ($
)
fciraw material costR&Doperating costrevenue

Annual Cash Flow
-3000000
-2000000
-1000000
0
1000000
2000000
3000000
4000000
1 2 3 4 5 6 7 8 9 10
Year (year1 = 2006)
dolla
rs ($
)

Risk analysisRISK CURVE
0
20
40
60
80
100
120
140
160
-400
0000
1000
000
6000
000
1100
0000
1600
0000
2100
0000
2600
0000
3100
0000
NPW
Freq
uenc
y
.00%
20.00%
40.00%
60.00%
80.00%
100.00%
120.00%
FrequencyCumulative %

Business PlanPlan to capture 10% of the market
Competitive production rate of 1kg/dayAdvertising and promotionLow product cost allows to undersell competition
Market product to research sectors until commercial applications develop
Largest commercial sectors are fibers and composites and flat panel displays

Funding RequirementSeeking a backer to provide financial investment of $2.5 million
Investor will receive 15% ownership of the company
TCISalaries
AdvertisingMiscellaneous

Conclusions
Construct facility with HiPCO processCapacity: 241 kg/yearLocation: California
Total capital investment: $2.5 millionExpected net present worth: $18 millionReturn on investment: 46 %

Future Considerations
Expand plant to include functionalization
Apply profits toward research facility
Seek contracts with large companies

Questions?

Fluidized bed Reactor scale up
Scale model designed so that ratio of all of the important forces is the same in the model as in the full-scale bed. Similar geometryUse Froude number
Solid recycle volumetric flow /Gas volumetric flow Gs/ ρs Uo
Solid inertia/ Gas inertia forceρs / ρf
Gas inertia/ Gas viscous force ρfUoL/µInertia /gravity force Uo
2/gL
Bed height/ bed diameter L/D
Particle inertia/ gas viscous force ρsUodp/µ

Froude number (Dm/Dc) = ((Vf)m/(Vf)c)2/3
((Vf)m/(Vf)c)1/3 = (Gs/ρ)m/(Gs/ρs)c
Wen-Ching Yang, Handbook of Fluidization and Fluid-Particle Systems,2003
Fluidized bed Reactor scale up