CARBON GAS CONCENTRATIONS AND FLUXES IN LAKE … · carbon gas concentrations and fluxes in lake...
46
CARBON GAS CONCENTRATIONS AND FLUXES IN LAKE VESIJÄRVI - POSSIBLE EFFECTS OF ARTIFICIAL AERATION HUIZHONG ZHANG UNIVERSITY OF HELSINKI DEPARTMENT OF ENVIRONMENTAL SCIENCES MSc THESIS OCTOBER 2014
Transcript of CARBON GAS CONCENTRATIONS AND FLUXES IN LAKE … · carbon gas concentrations and fluxes in lake...

CARBON GAS CONCENTRATIONS AND FLUXES IN LAKE
VESIJÄRVI - POSSIBLE EFFECTS OF ARTIFICIAL AERATION
HUIZHONG ZHANG
UNIVERSITY OF HELSINKI
DEPARTMENT OF ENVIRONMENTAL
SCIENCES
MSc THESIS
OCTOBER 2014

2
Tiedekunta/Osasto – Fakultet/Sektion – Faculty Faculty of Biological and Environmental Sciences
Laitos – Institution – Department Department of Environmental Sciences
Tekijä – Författare – Author Huizhong Zhang
Työn nimi – Arbetets titel – Title Carbon gas concentrations and fluxes in Lake Vesijärvi - possible effects of artificial aeration
Oppiaine – Läroämne – Subject Environmental ecology
Työn laji – Arbetets art – Level MSc
Aika – Datum – Month, year Helsinki 28/10/2014
Sivumäärä – Sidoantal – Number of pages 45 + 1
Tiivistelmä – Referat – Abstract
Lakes play an important role in both global and regional carbon cycling, especially, the role of lakes is
pronounced in the boreal zone, where lakes cover up to 20% of the land area. Allochthonous carbon is discharged
mainly from terrestrial processes, but also through anthropogenic eutrophication. The role of allochthonous carbon
load in lacustrine ecosystems is important, which can have far-reaching effects on lacustrine biogeochemistry in
general and especially on carbon cycling. Part of dissolved organic carbon is transformed to carbon dioxide (CO2)
and methane (CH4) in biological processes that result in carbon gas concentrations in water that increase above
atmospheric equilibrium, thus making boreal lakes serve as sources of the important greenhouse gases.
Lake Vesijärvi is renowned for its clear-water, but it has suffered eutrophication for a long history. The severely
affected Enonslkä lake basin is the most eutrophic part since it surrounded mainly by urban area (28%) and forests
(31%). To improve the water quality, large scale aeration in the autumn 2009 was started with the Mixox-
oxygenerators. Aeration is used to weaken thermal stratification and recharge oxygen by increasing vertical flow
circulation within the water columns. This leads to most chemical cocnetrations become more homogenous with
depth and concentrations of reduced forms decrease in the hypolimnion. The aeration units were operated on
campaign basis in summer 2013.
One aim here was to investigate carbon gas concentrations and fluxes from the urban boreal lake basin, and
examine the impacts of artificial aeration on greenhouse gases during the open water period in 2013. Besides CO2
and CH4 concentrations and fluxes, I measured also the water temperature and dissolved oxygen concentration of
the water columns for monitoring the efficiency of artificial aeration. All gas samples were analyzed at the Lammi
Biological Station of University of Helsinki with gas chromatography using the head space technique. As
background data I used the information on temperature and oxygen profiles collected from the measuring platform
on Lake Vesijärvi, and a reference study on CO2 and CH4 concentrations and fluxes dating back to 2005 when
there was no aeration going on.
In 2013, the studied lake basin was a source of CO2 to the atmosphere during the open water period, although the
lake basin showed uptake of CO2 from the atmosphere for short times. The lake acted as a steady source of CH4 to
the atmosphere throughout the measuring period. The mean CO2 flux was 34.1 mmol m-2
d-1
, which was over 2.5
times higher than in the reference year 2005 when there was no the aeration yet. During the campaigns, the CO2
fluxes were higher from aerated than non-aerated water column and from the longer aerations as well. Therefore,
aeration mixed stratified water columns and thus enhanced release of gases such as CO2 from surface water to the
atmosphere. The mean CH4 flux was 0.2 mmol m-2
d-1
. The CH4 fluxes from the Enonselkä basin were slightly
decreased in 2013. These decreased CH4 fluxes in Enonselkä basin can be attributed to the limited CH4 production
and high rate of CH4 oxidation in the oxygenated hypolimnion and surface of sediment. The daily CH4 fluxes
fluxes during the long time aerated operations decreased. The significance of aeration to carbon cycling processes
dpended on the residual CH4 concentrations in the water column.
Avainsanat – Nyckelord – Keywords Carbon gases (CO2 and CH4), fluxes, areation, Oxygen, Lake Vesijärvi
Säilytyspaikka – Förvaringställe – Where deposited
Muita tietoja – Övriga uppgifter – Additional information Supervisors: Dr. Anne Ojala, Professor Jukka Horppila , Professor Timo Vesala

3
CONTENTS
1. INTRODUCTION ·········································································································· 5
1.1. Seasonal patterns in lakes ······················································································· 5
1.2. Carbon loading and production of carbon gases ···················································· 7
2. AIMS OF STUDY AND HYPOTHESIS ············································································· 8
3. MATERIAL AND METHODS ························································································· 9
3.1. Study sites ················································································································ 9
3.2. Aeration in Lake Vesijärvi ····················································································· 11
3.3. Sampling ················································································································ 14
3.4. Carbon gas measurements ···················································································· 16
3.5. Calculation of carbon gas fluxes ············································································ 17
4. RESULTS ···················································································································· 18
4.1. Air temperature ····································································································· 18
4.2. Precipitation ·········································································································· 18
4.3. Wind direction distribution ·················································································· 19
4.4. Thermal stratification ······························································································ 20
4.5. Oxygen conditions ···································································································· 23
4.6. CO2 concentrations ·································································································· 25
4.7. CH4 concentrations ·································································································· 28
4.8. Gas fluxes ················································································································ 30
5. DISCUSSION ·············································································································· 33
6. CONCLUSION ············································································································· 40
7. ACKNOWLEDGMENTS ······························································································· 41

4
8. REFERENCES ············································································································· 42

5
1. Introduction
Carbon dioxide (CO2) and methane (CH4) are among the most important and abundant
greenhouse gases (GHG) in the atmosphere. Global warming and climate change are mainly the
results of GHG concentrations rising in the Earth’s atmosphere. The increase in atmospheric CO2
is accelerating, and the 2013 average annual CO2 concentration in the atmosphere is 396 ppm
with the average annual increase of 2.1 ppm per year in the past decade (2003-2012)
(http://co2now.org/). CH4 is a highly potent GHG in the atmosphere; it has a Global Warming
Potential (GWP) 25 times that of CO2 on a 100 –year timescale (Forster et al. 2007). Moreover,
globally 6-16% of CH4 emissions are derived from lakes (Bastviken et al. 2004, Juutinen et al.
2009, Bastviken et al. 2010).
Freshwater ecosystems such as lakes, play an important role in both global and regional carbon
cycling, even they share in total only ca. 3% (4.6 million km2) of the Earth’s continental surface
area (Downing et al. 2006). In the boreal zone, the role of lakes is especially pronounced, since
lakes can locally cover up to 20% of the continental area (Huotari 2011). Therefore, it is worthy
and meaningful to study carbon cycling within lacustrine ecosystems, and reveal their role as
sources or sinks of CO2 and CH4. Cole et al. (1994) manifested that most lakes worldwide are
supersaturated with CO2 and thus sources of atmospheric CO2. Besides, CH4 concentrations in
surface water of boreal lakes are usually higher than atmospheric equilibrium, especially during
the spring and autumn turnover periods (Michmerhuizen et al. 1996, Riera et al. 1999). Therefore,
the carbon gas fluxes of air-surface water interface are controlled by several factors such as
seasonal stratification patterns of lakes, weather conditions, basin morphometry, landscape and
regional hydrology, ecosystem process and perturbations.
1.1. Seasonal patterns in lakes
Dimictic mixing pattern and stratification are typical phenomena in deep boreal lakes during the
open-water period. The dimictic lakes mean that lakes have two mixing periods, the spring and
autumn turnovers, each year. The typical dimictic lake stratifies during the warm months and the
water column is then thermally divided into three layers: the epilimnion, the metalimnion, and
the hypolimnion. The epilimnion, the upper warm water layer is mixed well by wind whereas the

6
hypolimnion, the dense colder water at the bottom is little affected by wind action. Between the
relatively isothermal epilimnion and the hypolimnion, there is an intermediate region of steep
thermal gradient, the metalimnion. Thus, the cross section of a stratified lake is portrayed with
dense cold water lying beneath lighter warm layers. The summer stratification affects gas and
nutrient transfer in water column. Loss of stratification takes place when decreasing air
temperatures and negative heat flux cools the surface waters, which then destroys the stratum of
thermal discontinuity and initiates a circulation in the water column. As the entire water column
is included in the circulation, the autumnal turnover starts. With the warming days of spring, the
entire water column has a uniform temperature, and little thermal resistance to mixing. At this
time, lake exposed even to weak winds, start to mix completely. Large lakes often circulate for a
period of weeks, and wind can lengthen the both circulations (Cole 1983, Wetzel, 2001).
When observed continuously, higher latitude lakes are usually sources of CO2 during the spring
and autumn; however, the lakes can also have short periods when they are serving as sinks in
summer (Riera et al. 1999, Huotari et al. 2009). The lake turnovers, mainly determined by
weather conditions, contribute to gas exchange at the air-surface water interface, and circulate
oxygen from the epilimnion to the hypoxic zone; meanwhile they also supply nutrients from the
hypolimnion to the epilimnion. The carbon gas exchanges are also characterized by seasons. For
instance, CO2 fluxes in boreal lakes are higher in autumn than in spring, whereas CH4 fluxes can
be lower in autumn than in spring (López Bellido et al. 2009). The onset and duration of turnover
period can result in high interannual variation in gas fluxes.
Weather conditions (temperature, precipitation, wind speed, solar radiation, etc.) can induce
diverse changes in lacustrine carbon concentrations. Particularly sudden changes in weather
patterns can result in increases in carbon gas fluxes, because surface waters show clear diel and
day-to-day variations (Cole and Caraco 1998, Riera et al. 1999). Snowmelt and extreme rain
events sustain a large portion of annual allochthonous carbon loading entering lake in a short
period of time (Findlay and Sinsabaugh 2003). It is also demonstrated both in the field and in the
laboratory that the rate of gas exchange can be affected and greatly enhanced by heavy rains (Ho
et al. 2007). Moreover, strong wind can accelerate the loss of ice cover, and light wind is enough
to initiate circulation of the water column and prolong the turnover period as well. Especially,

7
wind impinging on the surface of lake affects the carbon gas fluxes and thus, most correlative
studies suggest that the magnitude of the gas exchange depends on the gas transfer velocity (k),
while the k increases predictably with increasing wind speed at winds ≥ 3 m s-1
(Cole and Caraco
1998, Wetzel 2001).
1.2. Carbon loading and production of carbon gases
Basic metabolic processes in lakes are photosynthesis and respiration, which correspondingly
predominate the trophogenic processes in the epilimnion and the tropholytic processes in the
hypolimnion. The lacustrine net production of CO2 is a result of photosynthetic incorporation of
inorganic carbon and respiration of organic carbon in lake. In the pelagic zone most of the CH4 is
produced through methanogentic decomposition of organic matter in the hypolimnion and the
lake sediment zone, where the conditions are hypoxic and finally anoxic with the absence of
alternative electron acceptors (NO3−, Fe3
+ and SO42−; cf. Capone and Kiene (1988)). CH4 can be
biologically oxidized to CO2, resulting in spatial increase in CO2 concentrations. Anaerobic
oxidation of CH4 is also possible but regarded as less important in lacustrine ecosystems (Schink
1997, Raghoebarsing et al. 2006). Through turbulent diffusion and lateral advection, CO2 can be
transported in the water column and then across the air-water interface. In the pelagic CH4 fluxes
are due to vertical diffusion and ebullition as well as lateral advection, whereas in the shallow
areas fluxes can also be plant mediated (Cole 1983, Grinham et al. 2011).
Allochthonous carbon loading can widely affect lacustrine biogeochemistry and especially
carbon cycling. Terrestrial ecosystems provide high productivity of organic carbon, and as a
result, large amounts of organic carbon go into the adjacent waters mainly in the form of
dissolved organic carbon (DOC) (Huotari 2011, Linnaluoma 2012). In lacustrine ecosystems in
the boreal zone, the DOC magnitude derived from the surrounding catchments is always
substantial (Ojala et al. 2011, López Bellido et al. 2011). Loading of allochthonous organic
carbon is controlled by several factors including climate, hydrology, landscape morphometry,
drainage ratio, as well as the land use of catchment (Linnaluoma 2012). Part of the DOC is
processed in the lake, and mineralized to CO2 and CH4, whereas part is drained to further down

8
in the lake chain. By this way, gas saturation and the resulting emissions from lakes to the
atmosphere increase (Ojala et al. 2011).
Anthropogenic allochthonous loading is derived from human activities, such as discharge of
sewage water, storm water runoff, and industrial effluents. The excessive nutrients and organic
matter have serious ecological effects by enhancing productivity in lakes (Wetzel 2001).
Eutrophication can induce extra carbon gas emissions to the atmosphere, through the increased
primary production and the following demineralization of organic compounds in the sediment,
but simultaneously due to vigorous photosynthesis by algae, eutrophicated lakes can occasionally
be subsaturated in terms of CO2. The most directly influenced water bodies are those surrounded
by or adjacent to densely populated areas, especially urban areas. Because there is a strong
tendency of urbanization nowadays, as a consequence, there is potential to increased greenhouse
gas fluxes, too.
CO2 and CH4 emissions from lakes to the atmosphere in the boreal zone have been intensively
studied, especially in brown-water lakes. Among the few studies on clear-water lakes, truly
urban lakes are rare. Lake Vesijärvi, a boreal urban clear-water lake, has been studied for its
carbon gas fluxes in 2005 (López Bellido et al. 2011), i.e. at time without artificial aeration.
Studies concerning carbon cycling but also aeration, are more common in small temperate lakes,
Cowell et al. (1987) studied a hypereutrophic lake central Florida, and Martinez et al. (2013) a
shallow eutrophic lake in southern California. In Finland, a study of carbon gases in artificially
oxygenated eutrophic lake in winter time was carried out by Huttunen et al. (2001), whereas
Forsius et al. (2010) studied a small humic lake under aeration.
2. Aims of study and hypothesis
This study concerns about the carbon gas concentrations in and fluxes from Lake Vesijärvi at the
time the water columns were oxygenated by aeration in summer. I hypothesize that, due to
artificial aeration, the atmospheric fluxes of CH4 decreased, whereas the CO2 fluxes increased.
As a result of aeration, CH4 is transported efficiently from hypolimnion and transformed to CO2
through methanotrophic activity in the water column. Besides CO2 and CH4 concentrations and

9
fluxes, I will determine the possible influence of temperature and dissolved oxygen
concentrations upon them. The hypolimnetic temperature and O2 concentrations tend to increase
when the water columns are mixed by artificial aeration. I will also look at weather patterns, i.e.
wind speed and precipitation. All the measurements are throughout the open water period 2013.
As a reference study I will use the data on CO2 and CH4 concentrations and fluxes dating back to
2005, when there was no aeration going on (López Bellido et al. 2011).
3. Material and methods
3.1. Study sites
The fluxes of CO2 and CH4 were studied in the open-water period 2013 in the pelagic regions of
Lake Vesijärvi (61°4’58’’N, 25°32’18’’E), which is situated in southern Finland, and surrounded
by the City of Lahti and the municipalities of Hollola and Asikkala (Figure 3 A). Lake Vesijärvi
is a glacial drift lake, and a part of the River Kymijoki water course (Linnaluoma 2012). This
irregularly shaped lake is made up of several basins connected by narrows and shoals. The four
largest basins are Enonselkä, Kajaanselkä, Komonselkä and Laitialanselkä.
Lake Vesijärvi has a total area of 109 km2, and by definition it is a large lake (the total area >
100 km2). It is the 42nd largest lake in Finland, with the mean and maximum depths of 6 m and
42 m, respectively. The mean retention time of water is 5.4 years. The catchment area is 514
km2, which is covered by forest (60%), arable land (23%), peat land (9%), and populated area
(9%). The shoreline of Lake Vesijärvi is 180 km long, 45% of which is used for forestry, 33%
for summer cottage (recreation) settlement, 13% for permanent settlement and the remaining 9%
for agriculture (http://www.puhdasvesijarvi.fi/).
Lake Vesijärvi was a renowned for its clear-water, and thus named by its originally transparent
water (’vesi’ in Finnish language means ’water’, ‘järvi’ means ‘lake’) (Kairesalo et al. 1999,
Kairesalo & Vakkilainen 2004). Lake Vesijärvi and its surroundings benefitted human dwellings
and various human activities, mainly agriculture, fishery, industry and transportation (Kairesalo
& Vakkilainen 2004). The City of Lahti grew vigorously in the first half of the 20th
century and

10
the growth took its toll on Lake Vesijärvi. Thus, eutrophication appeared and was documented as
early as 1928 as a consequence of increased industrial and sewage effluent discharges from the
City of Lahti (Kairesalo et al. 1999, Kairesalo & Vakkilainen 2004). Such situation lasted until
the middle of the 1970s. In the 1960s and 1970s, Lake Vesijärvi was one of the most eutrophic
large lakes in Finland; especially the severely affected Enonselkä basin in the southern part of
the lake and close to the City of Lahti, was in bad shape (Kairesalo & Vakkilainen 2004, Keto et
al. 2012). The lake started to recover in 1976 when the sewage loading was diverted from the
lake to a nearby river and the loading of phosphorus and nitrogen into the basin fell to 8 % of the
previous level. However, the recovery faded in the 1980s. Then to restore the lake,
biomanipulation through mass removal of planktivorous and benthivorous fish was performed in
1989-1994. As a result, cyanobacteria blooms disappeared, water clarity increased and
submerged macrophytes colonized larger areas (Kairesalo & Vakkilainen 2004).
The study was carried out in Enonselkä basin (Figure 1 B), which has a total area of 26 km2
(61°04’N, 25°35’E). It is the southernmost basin of Lake Vesijärvi, and surrounded by the City
of Lahti. The mean and maximum depths in the basin are 6.8 m and 33 m, respectively. The
catchment area is 84 km2, which is covered by urban areas (28%), forest (31%), arable land (7%)
and peat land (1%). The retention time of water in the basin is 5.5 years
(http://www.puhdasvesijarvi.fi/). The lake water is neutral (pH 7.5) and the concentration of
dissolved organic carbon (DOC) is 6-7 mg L-1
. The total nitrogen concentration is moderate, but
the total phosphorus concentration is high (total N, 740 µg L-1
; total P, 60 µg L-1
). The water
colour is 30 mg Pt L-1
, and the chlorophyll а concentration in summer is around 8 µg L-1
(Linnaluoma 2012). The Enonselkä basin was sampled from two pelagic sites equipped with the
aeration units, i.e. Lankiluoto and Vasikkasaari (Figure 1). Lankiluoto is deep with a maximum
depth of 31 m. Vasikkasaari has a maximum depth of 22 m.

11
Figure 1. Location of (A) Lake Vesijärvi in Finland (B) Enonselkä basin in Lake Vesijärvi (C)
The red dots indicate the sampling sites: Lankiluoto (31 m) and Vasikkasaari (22 m) in
Enonselkä basin.
3.2. Aeration in Lake Vesijärvi
During the early 2000s, Enonselkä basin was monitored, and the water quality development
turned again to the unwanted direction. Especially the development of oxygen conditions was
alarming. Large part of the hypolimnion became anoxic during the summer stratification period.
As a consequence of anoxia, harmful substances like hydrogen sulphide (HS), methane (CH4),
ammonia (NH3) appeared (Kauppinen 2013). To improve the water quality and reduce the
internal phosphorus loading, a large scale aeration in the autumn 2009 was started with the
Mixox-oxygenators. (Figure 2) Aeration is used to weaken or eliminate thermal stratification and
density barriers by increasing circulation within the lake (Cowell et al. 1987). This results in

12
oxygenation of bottom waters and leads to general increases in rates of decomposition of organic
matter in the sediment and water column, and decrease in the concentrations of reduced forms of
iron, manganese, nitrogen, and sulphur.
Figure 2. Mixox-oxygenator in operation in lake. (http://www.vesieko.fi/fi/palvelut-ja-
tuottee/mixos-hapetus )
Artificial aeration in Lake Vesijärvi was started firstly in Myllysaari location in the southern
Enonselkä basin, where a Mixox MC 500 (Vesi-Eko Oy, Kuopio, Finland) was installed in
winter 2007-2008. Another set of 8 units of Mixox MD 1100 were installed in the lake in 8 deep
locations in autumn 2009 (Figure 3). Mixox pumps surface water to the bottom layers and
creates a peaceful and very large-scale water cycle. One oxygenator influences an area of 50 to
500 ha, depending on the dimensions of the oxygenator. Mixox MD 1100 may pump about 680
000 m3 day
-1, whereas the pump power of Mixox MC 500 is about 15 000 m
3 day
-1. However,
Mixox-oxygenator does not add air or oxygen to upper water layer when it pumps, i.e. the device
does not need much energy (Kauppinen 2013). Lankiluoto and Vasikkasaari in the Enonselkä
basin are among the locations with the aeration equipment Mixox MD 1100 installed and they
are the locations this thesis on urban limnology of a clear-water boreal lake is based on.

13
Figure 3. Locations of oxygenators (cycles with number), oxygenator's power stations (black
solid points) and observation points/measurement stations (red points) in Lake Vesijärvi (NB:
This figure does not show all the existing observation locations). The base map copyright Land
Survey of Finland, permit No. 135/MML/12. Base map copied from (Kauppinen 2013).

14
The aeration equipment (Mixox-oxygenator) was on and operating in the both locations
intermittently during the stratified period in 2013 (Table 1). The winter aeration in Vasikkasaari
as well as in Lankiluoto started on 28 December 2012, and stopped on 19 April 2013. In both
locations, the summer aeration was going on at the same time in July, August and September,
with a malfunction break in July in Lankiluoto. In Lankiluoto the oxygenator was operating for a
few days in June, whereas in Vasikkasaari it was off for the whole June. On 20 September at the
time of autumn turnover, both aeration equipments were turned off. Approximately, the aeration
equipment in Lankiluoto was on for 6 days in June, 6 days in July, 23 days in August, and 20
days in September. In Vasikkasaari the oxygenator was on for 0 day, 21 days, 23 days, and 20
days in June, July, August and September, respectively.
Table 1. Operation times of the aeration equipment in Vasikkasaari and Lankiluoto in 2013.
Location Winter 2012-2013 2013/6/1 2013/7 2013/8 2013/9
Vasikkasaari
Winter oxygenation
started on 28.12.2012,
and stopped on
19.4.2013.
OFFSummer oxygenation
started on 12.7.2013.
The equipment has a
break during 2.-
5.8.2013, and then
started again on
6.8.2013, until has a
break again during 23.-
26.8.2013.
Summer oxygenation
stopped on 20.9.2013
Lankiluoto
Winter oxygenataion
started on 28.12.2012,
and stopped on
19.4.2013
The equipment turned
on 20.-25.6. 2013
Summer oxygenation
started on 12.7.2013.
But malfunction break
on 14.-29.7.13
The equipment has a
break during 2.-
5.8.2013, and then
started again on
6.8.2013, until has a
break again during 23.-
26.8.2013.
Summer oxygenation
stopped on 20.9.2013
3.3. Sampling
All samplings were carried out between the end of April and the beginning of October 2013.
Samples were once taken from the ice-covered lake before ice-out, on 24 April 2013. The ice-out
took place on 2 May, and in the Enonselkä basin the open-water period lasted then to 5
December. The intensive samplings were carried out in June – August on campaign basis, i.e.
there were three measuring periods, each lasting for two weeks. During the campaigns the
aeration systems in Lankiluoto and Vasikkasaari were turned either off or on, depending on the

15
objective of the measurements. During the campaign each site was visited at maximum 3 times
per week. Each time the water column was sampled for carbon gas concentrations (CO2, CH4),
temperature, and oxygen concentrations.
At the both sites, samples were taken with a Limnos tube sampler (height 30 cm, total volume
2.1 L) at various depths throughout the water column. From the upper five meters, I took
samples at 1- m interval, i.e. the samples were taken from depths of 0, 1, 2, 3, 4, and 5 m in both
sites, and then at 5- m interval, i.e. samples of 10 m, 15 m, 20 m, 25 m, and 30 m in Lankiluoto,
and 10 m, 15 m, 20 m in Vasikkasaari. The samples were always taken between 9:30 a.m. and
11:30 a.m. (solar time; Greenwich Mean Time +2h). Throughout the water column, the
stratification pattern of water temperature (°C) and the profile of dissolved O2 concentration (mg
L-1
) was measured at 1-m interval down to the bottom using a temperature-compensated
dissolved oxygen meter (YSI 58, Yellow Springs Instruments).
Estimation of carbon gas fluxes based on scanty samples during one open-water period limited
testing of the validity of hypothesis. Fortunately, there is a measuring station in Lankiluoto
(Figure 3) providing background monitoring data for measuring the water temperature and
oxygen concentrations constantly (at depths of 10 m, 20 m and 30 m) during 2009 – 2013. Note
that, there are other two monitoring stations located around Myllysaari and Enonselkä, but only
the data/site most relevant to this thesis was adopted.
I used also the information on wind speed and wind direction, as well as precipitation. The wind
and precipitation data were from the Lahti Laune weather station (60° 57' N, 25° 37' E, and
elevation 84 m) run by the Finnish Meteorological Institute (FMI). Lahti Laune weather station
is located in the City of Lahti, and it is the nearest weather station to Lake Vesijärvi, ca. 7.5 km
and 8.5 km from Vasikkasaari and Lankiluoto, respectively. The wind data from Laune station
were only used as background data and to confirm that application of gas transfer velocity
deduced form Lake Kuivajärvi was correct (see section 3.4). Determinations of the relationship
between gas transfer velocity and wind speed in lakes are often based on data form
meteorological stations located on land, sometimes quite far away from the lake itself. However,
it cannot be assumed that the same wind conditions will prevail over the water because of the

16
vastly different drag coefficients between different ecosystems (Kwan and Taylor 1994,
Markfort et al. 2010).
3.4. Carbon gas measurements
Dissolved gas samples of CH4 and CO2 (volume 30 mL) were taken from the Limnos sampler
throughout the water column. Water samples from each depth were drawn into 60 mL
polypropylene syringes (Terumo), which could be closed with three-way stopcocks (Luer-lock,
Codan, Steritex) after removing any gas bubbles. The syringes were invariably stored in crushed
ice filled cool-box until analysis on the same day at the Lammi Biological Station of University
of Helsinki using gas chromatograph (GC) and head-space technique. In the laboratory, the
syringes were placed in a water bath at a temperature of 20 °C for 5-10 min. Then 30 mL of
nitrogen gas was added into the syringes, and mixed with the water samples. Samples from the
gas phases were injected into vacuumed 12 mL Labco Exetainer® vials (Labco Limited, High
Vycombe, Buckinghamshire, UK), which were placed in Gilson 222 XL autosampler (Gilson
Inc., Middleton, Wisconsin, USA). Samples were then transferred to the GC through a 1 mL
Valco 10-port valve (VICI Valco Instruments Co. Inc., Houston, USA). Analyses were carried
out with an Agilent 6890 N (Agilent Technologies, Santa Clara, California, USA) GC equipped
with a flame ionization detector (FIC) (temperature 210 °C) and a thermal conductivity detector
(TCD) (temperature 120 °C, oven 40 °C, PlotQ capillary column, flow rate 12 mL min-1
, helium
gas as a carrier gas). The GC was calibrated with CO2 using concentrations of 4010 ppm and
15200 ppm, and with CH4 using concentration of 503 ppm, and in addition, using air with CO2
concentration of 393 ppm and CH4 concentration of 1.74 ppm (Oy AGA Ab, Finland).
The concentrations of carbon gases in the water (C; µmol L-1
) were determined from solubility of
CO2 and CH4 as a function of temperature and applying the appropriate Henry’s law constant
(KH; mol L-1
atm-1
):
𝑪 = 𝒙𝒈 𝒑𝒂𝒕𝒎 𝑲𝑯, (1)

17
where χg is the mole fraction of CH4 and CO2 in water samples (given by the detector output),
and patm is the atmospheric pressure ( = 1 atm).
The equilibrium concentration of carbon gas was calculated with the equation (1). The
atmospheric CO2 and CH4 concentrations are 393.84 ppm (http://co2now.org/ ) and 2 ppm,
respectively.
3.5. Calculation of carbon gas fluxes
Briefly, the carbon gas flux, between the lake surface-water layer and the overlying atmosphere,
depends on two main factors: the concentration gradient between the water and the air (𝑪𝒔 −
𝑪𝒆𝒒), and the gas transfer velocity (𝒌) for a given gas at a given temperature (Cole and Caraco
1998). The boundary layer method according to Cole and Caraco (1998) is as follow:
𝑭𝒈 = 𝒌 (𝑪𝒔 − 𝑪𝒆𝒒), (2)
where 𝑪𝒔 is the concentration of carbon gas (CH4 or CO2) in the surface-water and 𝑪𝒆𝒒 is the
concentration of carbon gas in equilibrium with the air.
In my study, for the atmospheric CH4 concentrations and the gas transfer velocity (k), I used
information and an empirical parameterization from Lake Kuivajärvi (61˚50’ N, 24˚17’ E) in
Hyytiälä. Lake Kuivajärvi is a humic lake in southern Finland with a maximum depth of 13.2 m,
and a surface and catchment area of 0.638 km2 and 9.35 km
2, respectively. The gas transfer
velocity in Lake Kuivajärvi was 6.5 cm h-1
at low winds (<1 m s-1
) from which it increased to 10
cm h-1
at stronger winds (~ 4 m s-1
). Since Lake Vesijärvi and Enonselkä basins are much bigger
than Lake Kuivajärvi, with generally higher wind speeds, I adopted the value of 10 cm h-1
for k
in my calculation (Heiskanen J.et al. 2014).

18
4. Results
4.1. Air temperature
The mean air temperatures for the measuring period from May – October and the summer period
from June – August were 13.1 and 16.5 °C, respectively. Thus, these mean temperatures were
close to the mean values of the past two years (2011 & 2012). The air temperature followed the
seasonal change, which led to the temperature increase in May and June and decrease since late
August. However, the monthly mean air temperature differed between 2013 and the previous
years. The study year had a relatively higher air temperature in May and June, but relatively
lower mean temperature in July. The monthly air temperature was 13.3, 17.1, 16.9, 15.5, 10.6,
and 5.2 °C in May - October, respectively. In addition, the largest monthly temperature
difference was 13, 12.8, 8.6, 9.3, 10.6, 14.1 °C in May – October, respectively. The highest mean
and maximum daily air temperatures were 24.4 and 30.8 °C registered on the same day, on 26
June (Figure 4). During autumn, the first sub-zero daily mean air temperature was registered on
19 October. During each aeration period (see Table 1), the corresponding mean air temperature
was 18.2 (n = 6), 16.6 (n = 21), 16.3 (n = 17) and 12.7 (n = 25) °C in June, July, August and
September, respectively.
4.2. Precipitation
According to the observations from Laune weather station, precipitation in May - October 2013
was 433.4 mm (Figure 4). The study year was rainier than usually since the precipitation was
higher than the long-term (2000-2012) mean precipitation of 381.9 mm, and in 2013 the annual
precipitation was the fourth highest in the past decade. The highest precipitation (556.5 mm) was
recorded in 2004.

19
Figure 4. Daily and cumulative precipitation (mm) and daily main air temperature (°C) from
May to October in 2013.
The monthly precipitation was 31.1, 85.7, 57.7, 117.6, 48.7, and 92.6 mm in May to October,
respectively. August was thus the rainiest month, but also June and October had a relatively high
precipitation (Figure 4). The major rain events occurred on 14 August, 27 June, 1 October, 18
July and 1 September with the daily precipitation of 54 mm, 28.4 mm, 23.5 mm, 19 mm and 16.9
mm (Figure 4).
4.3. Wind direction distribution
The dominant wind direction was always inconstant (Figure 5). Wind from southeast was
dominant in July and from south-west in August and October. In June, wind from northwest was
the prevailing wind blowing on the lake. Wind from northeast occurred more often in May. Thus,
most of the time the fetch in Lake Vesijärvi was consistent.

20
Figure 5. Wind direction and speed (m s-1
) distribution in May to October 2013 in Laune
weather station. N.B. different scale for wind speed in October.
In May to October the average wind speed was 1.1 m s-1
. Winds were < 3 m s-1
over 93% of the
time. The windiest months were May, July and October (Figure 5). On 2 May, the day of the ice
break-up, the maximum wind speed recorded was 6.2 m s-1
, and the high wind started at 7 a.m. in
the morning and lasted until 3 p.m.in the afternoon. Beyond that, it was windier in mid-June,
when the highest wind speed was 5.2 m s-1
, recorded on 15 June. This was also the highest wind
speed during the open water period 2013. However, between May and October, the most
dominant feature of the wind profile was the light breeze or gentle breeze. In pelagic zone light
breeze results in small wavelets, and crests have a glassy appearance and they do not break.
Gentle breeze can create larger wavelets, when crests begin to break and foam of glassy
appearance shows up.
4.4. Thermal stratification
In 2013 the open-water period lasted from 2 May to 5 December in the Enonselkä basin. One
week before the ice out, i.e. on 24 April, the temperature beneath the ice cover varied from 2.9 to

21
3.3 °C (Figures 6 & 7). Most probably the lake basin attained the state of spring turnover already
before the ice breakup. The temperatures in the entire water column were ca. 4 °C at the
beginning of May, and with the help of wind the spring turnover lasted till early May when the
temperature stratification started to appear. At the beginning, the epilimnetic temperature
followed the increase in air temperature and a weak thermal stratification developed. The thermal
discontinuity in the water columns developed to more and clearer one and finally by the early
June the water columns were clearly stratified. After that the thermocline gradually sank deeper
and in mid-August the metalimnion was located between ca. 6 - 13 m depth.
Figure 6. Temperature (°C) stratification in Lankiluoto in 2013. Blue shades indicate the days
when the artificial aeration was in operation.

22
Figure 7. Temperature (°C) stratification in Vasikkasaari in 2013. Blue shades indicate the days
when the artificial aeration was in operation.
During the open-water period the epilimnetic temperature varied from ca. 3 to 21 °C; the
maximum surface water temperatures of 20.7 °C and 20.8 °C in Lankiluoto and Vasikkasaari
were registered on 26 June and 8 July, respectively. In hypolimnion the temperature ranged from
3.3 to 14.7 °C, i.e. the temperature difference was 11.4 °C. The monthly mean water
temperatures in June, July and August throughout the hypolimnion were 7.2 °C (n=112), 8.8 °C
(n=64) and 13.7 °C (n=80) in Lankiluoto and 7.5 °C (n=70), 9.8 °C (n=40) and 14.3 °C (n=50) in
Vasikkasaari. During stratification (ca. June - August), there was one long aeration period in
Lankiluoto in August, whereas Vasikkasaari was aerated both in July and August. Both locations
showed a clear temperature effect of aeration, i.e. the thermal stratification eroded as a result of
aeration (Figures 6 & 7). The hypolimnetic temperature was usually higher in Vasikkasaari than
in Lankiluoto, especially in July, probably due to successful aeration in Vasikkasaari, whereas in
Lankiluoto the aeration equipment was malfunctioning. The stratification in Enonselkä basin
began to break up in the end of July and in mid-July in Lankiluoto and Vasikkasaari, respectively.
Finally, by the end of September, the water columns were homogeneous at ca. 12 °C, thus the
basin was in a state of complete autumn turnover.

23
4.5. Oxygen conditions
In the study year, the mean oxygen concentrations in the water column were 6.7 mg L-1
, in
Lankiluoto (n= 540, SE 0.13) and Vasikkasaari (n=324, SE 0.14). There was a slight difference
in epilimnetic oxygen concentration which varied from 4.0 to 11.55 mg L-1
in Lankiluoto and
from 3.8 to 10.8 mg L-1
in Vasikkasaari. The mean hypolimnetic oxygen concentration was 5.7
mg L-1
in both Lankiluoto (n=324) and Vasikkasaari (n=162), i.e. in general the sampling
locations had similar oxygen conditions (Figures 8 & 9).
Similar to temperature, from early June onwards the water column started to stratify also in terms
of oxygen concentration. As a consequence of stratification, oxygen in the hypolimnion was
rapidly depleted in Lankiluoto by the end of July and in Vasikkasaari by mid-July, which times
were consistent with the starting time of artificial aeration in each water column. The range in
decline was from ca. 6 to ≤1 mg L-1
in Lankiluoto and from ca. 9 to ≤1 mg L-1
in Vasikkasaari.
The lowest concentration of oxygen in both locations was 0.8 mg L-1
, measured close to the
bottom in both locations. Thus, the hypolimnion was hypoxic and anoxic from mid-July to the
end of August and from mid-July to late August in Lankiluoto and Vasikkasaari, respectively.
However, in summer 2013 anoxia in the Enonselkä basin lasted only for a short time. As a result
of aeration, the hypolimnetic oxygen concentrations in both water columns showed an increasing
trend. In Vasikkasaari the 3 week aeration was not started until 12 July and thus, the oxygen
concentration declined till mid-July. In Lankiluoto the long-time aeration started on 6 August
and the oxygen depletion lasted until that (Figures 8 & 9). As a consequence, the oxygen
concentration rose up in Vasikkasaari earlier than in Lankiluoto. The concentration increased
from 3 to 10.2 mg L-1
with a daily increasing slope of 0.08 in Vasikkasaari, and from 1.55 to 9.8
mg L-1
with a daily increasing slope of 0.12 in Lankiluoto.

24
Figure 8. Oxygen concentration (mg L-1) in Lankiluoto in 2013. Blue shades indicate the days
with artificial aeration on.
Figure 9. Oxygen concentration (mg L-1) in Vasikkasaari in 2013. Blue shades indicate the days
with artificial aeration on.

25
4.6. CO2 concentrations
During thermal stratification there was also stratification pattern in CO2 concentrations starting
in mid-June in both measuring locations (Figures 10 & 11). In general, the concentrations in
Lankiluoto varied from 3.1 to 389.4 µM (mean = 86.8 ± 5.8), whereas in Vasikkasaari the
concentrations range was from 3 to 263.9 µM (mean = 73.6 ± 5.8). In both locations, the mean
hypolimnetic concentration was approximately 4-fold higher than the epilimnetic one (Table 2),
i.e. the CO2 concentrations were always much higher in hypolimnion than in epilimnion during
the open-water period, in particular during the summer months. In the hypolimnion, the high CO2
concentrations emerged concomitantly with the development of hypoxia. The highest
concentrations were recorded on 11 July at the depth of 20 m in Lankiluoto and 26 June at the
depth of 20 m in Vasikkasaari. There was a negative correlation (r = -0.9) between the
hypolimnetic concentrations of O2 and CO2.
Table 2. Carbon gas concentrations (µM) and fluxes of CO2 and CH4 (mmol m-2
d-1
) in
Lankiluoto (blue) and Vasikkasaari (light blue) in 2013. Values in bold are daily means ± SE and
values in parenthesis indicate the range.
Location
Gas concentrations (µM)
Gas fluxes
(mmol m-2
d-1
) Surface
(0-30 cm)
Epilimnion
(0-5 m)
Hypolimnion
(10-30m/10-20
m)
CO2
Lankiluoto 36.5 ± 9.8
(4.2 – 191.8)
36.7 ± 3.4
(3.1 – 215.7)
146.8 ± 8.5
(23.3 – 389.4)
46.5 ± 23.3
(-27.3 – 422)
Vasikkasaari 25.6 ± 3.4
(3.4 – 54.8)
34.1 ± 2.6
(3 – 135. 5)
152.7 ± 10
(13– 263.9)
20.2 ± 8.2
(-29.4 – 89.1)
CH4
Lankiluoto 0.1 ± 0.01
(0.05 – 0.3)
0.10 ± 0.007
(0.03 – 0.7)
0.2 ± 0.02
(0.01 – 0.9)
0.2 ± 0.03
(0.1 – 0.6)
Vasikkasaari 0.1 ± 0.01
(0.02 – 0.2)
0.1 ± 0.003
(0.02 – 0.2)
0.1 ± 0.01
(0.03 – 0.7)
0.2 ± 0.02
(0.05 – 0.4)

26
Before ice-out, the aquatic CO2 concentration in the surface water of Lankiluoto was ca. 50 µM,
but the concentration immediately increased to over 100 µM under the ice cover, whereas close
to the bottom the concentration was 191.5 µM (Figure 10). Straight after ice-out, the surface CO2
concentration started to increase, but from May onwards, the CO2 concentration declined in the
surface water as well as deeper down till the depth of ca. 16 m and was below 50 µM. In this part
of the water column also chlorophyll a was high indicating vigorous photosynthesis. (Appendix
I). In the hypolimnion the CO2 concentration was over 100 µM. In Vasikkasaari (Figure 11), the
CO2 concentrations beneath the ice cover varied more than in Lankiluoto, i.e. between 21.6 and
242.4 µM. Similarly to Lankiluoto, the concentration in Vasikkasaari declined in May. In early
June the water column was fairly well homogenized in terms of CO2.
In Lankiluoto, a peak of CO2 concentration appeared in the metalimnion and hypolimnion right
after mid-June; the highest concentration 207.3 µM was registered on 24 June. As a consequence
of the short aeration (on 22 – 26 June), CO2 concentration in the surface and metalimnion
increased, whereas the hypolimnetic CO2 concentration dropped to an average of 28.7 µM on 26
June. From the beginning of July, CO2 started to accumulate again in the hypolimnion, and the
maximum CO2 concentration of 398.4 µM was observed on 11 July at 20 m. A similar pattern in
CO2 concentration was observed in Vasikkasaari, but the maximum concentration close to
bottom was only ca. 260 µM.
Due to the long-time aeration in Lankiluoto in August, the hypolimnetic concentration slowly
declined from the middle of August from 213.9 µM (n=4) to 193.2 µM (n=12). However, in
Vasikkasaari the long-time aeration started already on 11 July, and the hypolimnetic CO2
concentration decreased during a longer time period. Before and after the aeration, the mean
hypolimnetic concentrations in Vasikkasaari were 229.5 µM (n=6) and 162.7 µM (n=21). After
aeration, in July, concentration was 177.4 µM (n=9) and in August, 151.6 µM (n=12). When the
sampling ceased on 1 October, the water column concentration of CO2 was almost homogeneous
at ca. 40 µM and ca. 34 µM in Lankiluoto and Vasikkasaari, respectively. Thus, the
concentrations indicated that the water column was completely mixed in both locations.

27
Figure 10. Carbon dioxide (CO2) concentration (µM) in Lankiluoto in 2013. Blue shades
indicate the days with artificial aeration in operation.
Figure 11. Carbon dioxide (CO2) concentration (µM) in Vasikkasaari in 2013. Blue shades
indicate the days with artificial aeration in operation.

28
In 2013 the average annual concentration of CO2 in the atmosphere was 396.5 ppm (ca. 17.2 µM)
(http://co2now.org/). In Lankiluoto and Vasikkasaari, CO2 concentration at the depth of 0-30 cm
varied from 4.2 to 191.8 µM and from 3.4 to 54.8 µM, respectively. On average, the
concentrations in Lankiluoto and Vasikkasaari were 2.1 (range 0.3 – 12), and 1.5 (range 0.2 –
3.1) times higher than that of the atmospheric equilibrium and for the most of the summer time -
with only few exceptions - the surface water CO2 concentrations were above the atmospheric
equilibrium. In Lankiluoto, concentrations below the equilibrium were recorded on 29 July (4.2
µM) and 7 August (4.4 µM). In Vasikkasaari concentrations lower than the equilibrium were
observed on 24 April (21.6 µM), 4 June (4.6 µM), 24 June (9.3 µM), 29 July (6 µM) and 7
August (3.4 µM). Concentrations below the equilibrium were recorded at the time of high
chlorophyll a concentration.
4.7. CH4 concentrations
In 2013, the CH4 concentrations were low in Enonselkä basin, and only occasionally higher
concentrations emerged within 5 m above the bottom at the time of hypoxia and anoxia (Figures
8, 9, 12 & 13). The CH4 concentrations in Lankiluoto were in general higher than in
Vasikkasaari, and showed more daily variations all the time. In Lankiluoto, the CH4
concentrations varied from 6.8 to 913.7 nM (mean = 126.7 nM ±8.5), and in Vasikkasaari from
28.2 to 649.6 nM (mean = 100.7 nM ±5). The hypolimnetic concentrations were approximately
1.5-fold higher than the epilimnetic ones (Table 2). During the open water period, the highest
hypolimnetic CH4 concentrations were recorded on 11 July (863.4 nM) in Lankiluoto and on 20
August (649.6 nM) in Vasikkasaari. The hypolimnetic concentrations of CH4 correlated
negatively (r = -0.7) with O2 concentrations. Additionally, the CO2 and CH4 concentrations
throughout the water columns were weakly positively correlated (r = 0.4).
In Lankiluoto, the hypolimnetic CH4 concentrations before ice-out were high due to the oxygen
depletion; at the 30 m depth the maximum concentration was 913.7 nM (Figure 12). Right after
the ice out, the hypolimnetic CH4 decreased and in terms of CH4, the water column beneath the
epilimnion was homogeneous till the end May. At the beginning of June, a peak of CH4
concentration was observed at the depth of 1 m in Lankiluoto. In mid-June and early July the

29
hypolimnetic CH4 concentration grew transiently. In August when the aeration was in use, the
hypolimnetic concentration increased to approx. 500 nM. During each break in aeration, the
concentration in the hypolimnion decreased (Figure 12). Throughout the open water period, the
concentrations in the epilimnion and metalimnion did not vary distinctly, and the mean
concentrations in June, July and August were 113.0, 109.0 and 87.9 nM, respectively. During the
autumn turnover, the concentration of CH4 throughout the water column was 160.9 nM (Figure
12).
Figure 12. Methane (CH4) concentration (nM) in Lankiluoto in 2013. Blue shades indicate the
days with artificial aeration on the lake.
In Vasikkasaari, CH4 concentrations in the epilimnion were low ranging from 28.2 to 208.4 nM
(mean = 90.9 ± 3.5 nM). CH4 accumulated in the hypolimnion until August. Thus, the
concentrations in Vasikkasaari increased only in August when the aeration was in use. The
highest concentration of 649.6 nM was registered on 20 August. When the sampling ceased on 1
October, the water column mean concentration of CH4 was 86.9 nM (Figure 13).

30
Figure 13. Methane (CH4) concentration (nM) in Vasikkasaari in 2013. Blue shades indicate the
days with artificial aeration on the lake.
The surface water (0 – 30 cm) concentrations varied from 50 to 268.8 nM in Lankiluoto and
from 28.2 to 164.9 nM in Vasikkasaari. In Lankiluoto the highest and the lowest surface water
concentrations were observed, respectively, on 4 June and 21 August. In Vasikkasaari, the
highest CH4 concentration was recorded on 15 July during windy days, and the lowest CH4
concentration was recorded on 22 August at the end of the aeration operation. Besides these
extreme values, CH4 concentrations in the surface water showed very little variation. On 1
October, the CH4 concentration in surface water in Lankiluoto was twice of that in Vasikkasaari.
The CH4 concentrations in the surface water were clearly higher than the atmospheric
equilibrium concentration (2 ppm ≈ 3 nM), and the surface water was thus supersaturated with
CH4. On average, the concentrations were ca. 30 times higher than that of the equilibrium.
However, there was very little variation in surface water values.
4.8. Gas fluxes
In Lankiluoto, the CO2 fluxes varied from -27.3 to 422 mmol m-2
d-1
(mean = 46.5±23.3 mmol
m-2
d-1
) and the CH4 fluxes varied from 0.1 to 0.6 mmol m-2
d-1
(mean = 0.2±0.03 mmol m-2
d-1
).

31
In Vasikkasaari, the respective ranges of fluxes were -29.4 to 89.1 mmol m-2
d-1
(mean =
20.2±8.2 mmol m-2
d-1
) for CO2, and 0.06 to 0.4 mmol m-2
d-1
(mean = 0.2±0.02 mmol m-2
d-1
)
for CH4. Thus, Enonselkä basin was constantly an atmospheric source of CH4, whereas in CO2
the flux was occasionally towards the lake and thus for short periods in summer, the lake acted as
a sink of CO2. (Figure 14)
In Lankiluoto the highest peaks in effluxes of CO2 and CH4 were observed since 4 June and they
lasted for about a week at the beginning of stratification (Figure 14 A), and the corresponding
proportions of the peak fluxes were 67% in the total CO2 flux and 23% in the total CH4 flux
during the open-water period. After the peak, CO2 flux decreased steadily until 7 August. The
CO2 flux was close to zero or towards the lake from 11 July until the beginning of August.
Contrary to CO2, CH4 flux did not show any trend but fluctuated during the sampling period.
There was a contradictory pattern between CO2 and CH4 fluxes on 20-24 June, 11-15 July, and in
the end of July and August, i.e. when the oxygenators were operating. Thus, the short-time
aerations induced diverse trends in the CO2 and CH4 fluxes, whereas the long-time aeration in
Lankiluoto in August increased the CO2 fluxes but the CH4 fluxes decreased. Both carbon gas
fluxes showed a smaller peak when the stratification began to erode.
In Vasikkasaari (Figure 14 B), CO2 as well as CH4 fluxes fluctuated throughout the summer
months, but always in a contradictory way. Similar to Lankiluoto, higher fluxes were observed in
June. Also, CO2 and CH4 fluxes tended to reverse when the aeration unit was in operation.
In both measuring points, CO2 fluxes showed rather similar trends regardless of the status of the
artificial aeration, whether it was on or off. For CH4 fluxes, the long-time aerations induced
similar decreasing trends in both locations.

32
Figure 14. Fluxes of carbon dioxide (CO2) and methane (CH4) (mmol m-2
d-1
) in Lankiluoto (A)
and Vasikkasaari (B) in 2013. Line segments in yellow indicate the days with artificial aeration
in operation. Please note that positive values indicate fluxes from the lake to the atmosphere and
negative fluxes towards the lake. Light blue bars denote the time of ice cover period. N.B.
different scale for different location.
-0,05
0,05
0,15
0,25
0,35
0,45
0,55
0,65
-50
0
50
100
150
200
250
300
350
400
450
CH
4 (m
mo
l m-2
d-1
)
CO
2 (
mm
ol m
-2 d
-1)
CO2 Lankiluoto
CH4 Lankiluoto
0
0,1
0,2
0,3
0,4
0,5
-40
-20
0
20
40
60
80
100
CH
4 (m
mo
l m-2
d-1
)
CO
2 (
mm
ol m
-2 d
-1)
CO2 Vasikkasaari
CH4 Vasikkasaari
A
B

33
5. Discussion
Dissolved CO2 concentration and the resulting CO2 flux to the atmosphere is primarily sustained
by decomposition of organic matter through respiration, and largely associated with the
allochthonous DOC input. CO2 can be produced through aerobic or anaerobic degradation (Cole,
1983). Significant input of DOC renders the lake heterotrophic and can affect CO2 production in
water column. (Cole et al. 2000, Huttunen et al. 2003, Huotari 2011, Linnaluoma 2012). The
allochthonous carbon load can greatly vary from lake to lake depending on factors such as lake
characteristics and human activities. The Enonselkä lake basin is known to be net heterotrophic
(Linnaluoma 2012). As a result of urbanization, the hypolimnetic CO2 concentrations in the
Enonselkä basin have been clearly higher than they should be in this kind of boreal lake (López
Bellido et al. 2011). The same kind of high CO2 concentrations throughout the years without and
with aeration indicate that Enonselkä basin is always abundant with organic carbon compounds,
and thus, the eutrophic condition of the lake cannot be easily regulated by the artificial aeration.
The production of CO2 in the bottom waters and sediment resulted in accumulation of gases in
the hypolimnion (Huttunen et al. 2001), in 2013 the hypolimnetic CO2 concentrations were
sometimes very high, which contributed to the higher average CO2 concentrations of the
Enonselkä lake basin. In this study year, under oxic condition, CH4 oxidation is also a significant
pathway of CO2 production (López Bellido et al. 2011, Huttunen et al. 2001, 2003). The most
obvious CO2 concentration gradient in the water column appeared between 10 – 15 m under the
water surface, indicating the location of the oxic-anoxic boundary layer (López Bellido et al.
2011). The surface concentrations of carbon gases markedly increased at the time of autumn
turnover. These findings are in good agreement with previous studies in lakes showing that there
is a general seasonal pattern in carbon gas concentrations during the open water period
(Michmerhuizen et al. 1996, Riera et al. 1999, Linnaluoma 2012, Miettinen et al. 2014).
In 2013 the Enonselkä lake basin was a source of CO2 throughout the open-water period,
although the surface water concentration was occasionally lower than the atmospheric
equilibrium (Figure 14 A). The action as a carbon sink rarely happened in the non-aeration year
2005. However, it seems to be common that boreal lakes act as a sink of CO2 for short times

34
(Ojala et al. 2010, Huotari et al. 2011). The seasonal flux of CO2 in Lankiluoto, integrated over
the measuring period, was over 2.5 times higher than in 2005, when the summer was warm and
with average precipitation (López Bellido et al. 2011). Higher CO2 fluxes are often recorded in
rainy years (Huotari et al. 2009, Einola et al. 2011). These observations could be one explanation
for the higher fluxes of CO2 in 2013. Moreover, there were unexcepted peak fluxes of CO2,
which emerged in June, especially in Lankiluoto. The peak fluxes were up to 67% of the
integrated seasonal flux from Lankiluoto and 23% from Vasikkasaari. A negative correlation
between CO2 and chlorophyll a imply that photosynthesis can regulate the CO2 concentration in
the epilimnion through CO2 consumption (cf. Miettinen et al. 2014). However, in the study year,
chlorophyll a concentration after May was normal or even lower than usually (Appendix I). In
that way, the unexpected CO2 effluxes in June could at least partly be explained with modest
amount of photosynthesis but vigorous catabolic processes. In autumn, the timing of CO2 release
to the atmosphere is in agreement with the time of increased surface CO2 concentration due to
turnover.
In spite of the increased seasonal CO2 fluxes, between these peak fluxes, CO2 fluxes were close
to zero or towards the lake in mid summer 2013, and the lowest CO2 fluxes were registered in
the end July and early August. In 2005 the lake basin showed a steady increase in CO2 fluxes
throughout the summer (López Bellido et al. 2011). The different trend in CO2 fluxes in July
between the two years can be attributed to the efficient mixing of the water columns. The
artificial aeration led CO2 concentrations to be more homogeneous throughout the water column.
The general trends of CO2 fluxes from both study locations were quite consistent with each other
(Figure 14), but during the campaign, the CO2 fluxes were higher from the aerated water column
than from the non-aerated water column. Also, more CO2 was released during longer aerations.
Therefore, the aeration enhanced mixing of the stratified water columns and thus increased CO2
fluxes (Cowell et al. 1987, Huttunen et al. 2001).
The bottom water is oxygenated due to the artificial aeration, leading to homogeneous O2
concentration throughout the treated water columns (Cowell et al. 1987). The efficiency of
aeration was well presented in dissolved oxygen concentrations and distribution also in Lake

35
Vesijärvi. For instance, the O2 concentrations at 10 m were similar at the beginning of June in
both the reference year (López Bellido et al. 2011) and the study year (Figures 8 & 9), whereas
in hypolimnion, dissolved oxygen was rapidly depleted in 2005 but only decreased slightly in
2013. Till the end of June, the bottom water layer was anoxic in 2005, but in 2013 the
concentration at that time of the year was ca. 6 mg L-1
throughout the water column. Even the
period of hypoxia and anoxia was shortened: the hypolimnion was anoxic (DO ≤ 1 mg L-1
) and
hypoxic (DO ≤ 2 mg L-1
) for 98 days (17 June – 24 September) in 2009, 41 days (14 July – 23
August) in 2012 and 63 days (15 July – 15 September) in 2013. Particularly, the hypolimnion
suffered from anoxia for approximately 30 days in 2005, i.e. from mid-July to mid-August
(López Bellido et al. 2011), whereas in both 2012 and 2013, the Enonselkä basin was completely
anoxic only for 14 days (Figure 15). Prevention of oxygen depletion in the hypolimnion due to
the aeration was also observed by Huttunen et al. (2001).
The amount of dissolved oxygen increases when water temperature decreases and pressure
increases. However, dissolved oxygen in the whole water column in summer 2013 was similar to
previous summers until August (Figure 15) even though the water temperatures were apparently
lower (Figure 16). The situation implies that more oxygen was consumed for the CO2 production
during summer.
36
Figure 15. Oxygen concentration (mg L-1
) in Lankiluoto at the depths of 10, 20, and 30 m in
2009-2013. Recordings for this figure adopted from the automatic monitoring in Lankiluoto.
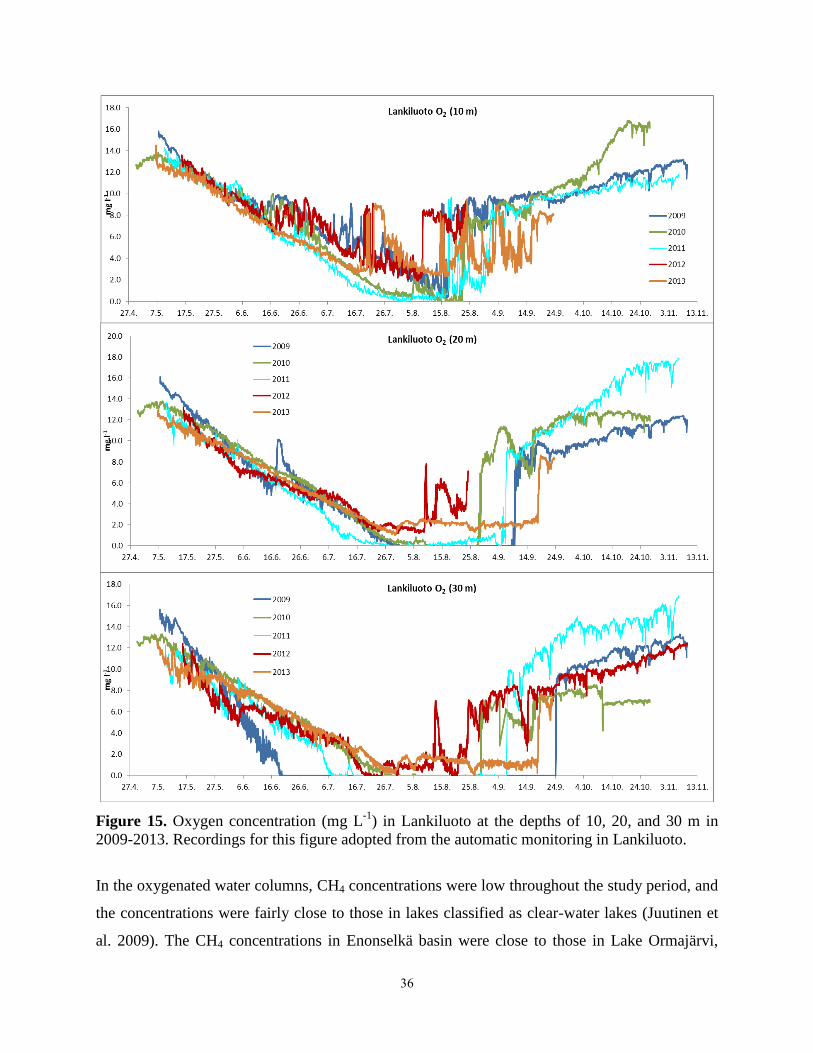
In the oxygenated water columns, CH4 concentrations were low throughout the study period, and
the concentrations were fairly close to those in lakes classified as clear-water lakes (Juutinen et
al. 2009). The CH4 concentrations in Enonselkä basin were close to those in Lake Ormajärvi,

37
which is a smaller, shallow (surface area 6.53 km2, maximum and mean depth 30 m and 10.7 m,
respectively) clear-water lake stratifying in summer (Ojala et al. 2011). The mean hypolimnetic
CH4 concentrations in Lake Vesijärvi were on average 0.12 µM, which was approx. 1/100 of that
from the Enonselkä basin in summer 2005 with prolonged hypoxia/anoxia and no aeration in
operation (López Bellido et al. 2011). In contrast with CO2, there was no sharp CH4 gradient in
the water columns in the Enonselkä basin during this open water period and the CH4
concentrations did not increase concomitantly with the stratification in summer months.
Artificial aeration plays a significant role in limiting methanogenesis in the hypolimnion and
anaerobic sediment surface (Cowell et al. 1987, Huttunen et al. 2001). Only one distinct but
unexpected high CH4 concentration, similar to CO2, was observed in the surface water of
Lankiluoto between the end of May and beginning of June, which was then reflected in the gas
flux to the atmosphere (Figures 12 & 14 A).
Water temperature and dissolved oxygen are of considerable significance for controlling the CH4
concentration above the sediment (Liikanen 2002, Huttunen et al. 2003), thus in 2013, CH4
release was restrained by the lower hypolimnetic temperature and oxic condition. CH4 can be
transported up via turbulent diffusion, ebullition, or the transportation can be plant-mediated,
which is only of importance in shallow, littoral areas. CH4 escapes from sediment with bubbling
through the water column, and the ebullition rate is closely tied to the production of CH4 (Kiene
1991, Huttunen et al. 2003, Linnaluoma 2012). Unfortunately, the bubbling of CH4 was not
measured in this study, but from earlier echo sounding campaigns for fishery purposes it is
known that there is bubble formation in the profundal sediment, but the bubbles disappear before
reaching the surface water (Anne Ojala, personal communication). CH4 diffusion can be
markedly affected by biological oxidation which thus regulates the flux of CH4 from lakes to the
atmosphere.
Consumption of CH4 through methanotrophic oxidation is prevailing in presence of dissolved
oxygen, and the extent can be up to 90% of the CH4 produced; furthermore CH4 oxidation is also
possible in the stratified and anaerobic conditions, yet the importance of this process is difficult
to evaluate (Kiene 1991). In spite of apparent CH4 oxidation, some CH4 escaped methanotrophic
oxidation because the lake basin was supersaturated with CH4. The Enonselkä basin acted as a

38
steady source of CH4 to the atmosphere throughout the measuring period in 2013 with the mean
CH4 flux of 0.2 mmol m-2
d-1
. The CH4 fluxes clearly decreased during the long time aeration in
2013. These decreased CH4 fluxes in Enonselkä basin can be attributed to the limited CH4
production under oxygenation and high rate of CH4 oxidation (Kiene 1991).
Artificial aeration can result in marked changes in thermodynamic properties of a lake, for
instance, by eliminating the thermal stratification and increasing water temperature in the
hypolimnion during summer-autumn season (Cowell et al. 1987, Forsius et al. 2010). In terms of
flow dynamics, the warmer upper part of water column is circulated into the cool hypolimnion
by artificial vertical mixing force. In the study year, the Enonselkä lake basin started its thermal
stratification with an indistinct thermocline which then gradually sank deeper. The stratified
period shortened in 2013 (Figures 6 & 7) and was different in comparison to the year 2005
without aeration when the stratification was steeper and lasted longer. (Figure 1 A) (López
Bellido et al. 2011).
In the Enonselkä basin, the hypolimnetic temperature increased distinctly already in 2010 which
was the second year after the aeration equipment was installed, and the hypolimnetic temperature
remained high in 2011 and 2012 (Figure 16). Yet, the water temperatures in both thermocline
and hypolimnion were continuously lower in May – August 2013 than during the corresponding
periods in 2009 – 2012 (Fig 15). In 2013, the monthly mean of hypolimnetic temperature in
May–August was 4.8 °C, 6.6 °C, 8.4 °C, and 13.4 °C, respectively, whereas, for instance in 2012,
the corresponding monthly means were 7.8 °C, 11.4 °C, 15.1 °C and 16.9 °C, and in 2009 were
7.7 °C, 9.7 °C, 11.4 °C and 12.2 °C. Thus, the hypolimnetic water temperature in the end of July
2013 was ca. 7 °C lower than in 2012. When comparing with the reference year 2005 when the
aeration was not in use, the mean hypolimnetic temperature between May and October 2013 was
still ca. 3 °C lower than in 2005 (López Bellido et al. 2011).

39
Figure 16. Water temperatures (°C) in Lankiluoto at the depths of 10, 20, and 30 m in 2009-
2013. Recordings for this figure adopted from the thermistor chain in Lankiluoto.
Lakes stratify in winter as well, but the temperature distribution in water column is reversed of
that during summer stratification (Wetzel. 2001). Similar to summer aeration, artificial aeration
during winter weakens the thermal discontinuity in the whole water column (Huttunen et al.
2001). In the Enonselkä lake basin, winter aeration started on 28 December and lasted until 19

40
April in winter 2012 – 2013, which was 40 days longer than in the winter 2011 – 2012. However,
the water column in winter 2012-2013 had a thermal pattern comparable to winter 2011-2012
(Pauliina Salmi, personal communication). And actually, the water in Enonselkä basin was the
coolest in winter 2011-2012. Therefore, the seasonal stratification pattern in winter was not the
cause of the low water temperature later in 2013. The lower mean water temperature in
Enonselkä basin could have been due to groundwater input, since the input can be significant
(Linnaluoma 2012). Precipitation in summer 2013 was higher than usually making the extra
supply of groundwater a possible explanation, but unfortunately I do not have any data on inflow
of groundwater. The most plausible explanation for the cool water in 2013 is in warm spring and
in the resulting rapid stratification. This highlights the importance of weather and thus climatic
drivers for lacustrine carbon gas fluxes.
6. Conclusion
As a result of efficient aeration, the water temperature and dissolved oxygen concentration in the
hypolimnion increased, and these changes were very well in agreement with the aeration times.
Stratification was eliminated and hypoxic/anoxic period was shortened, due to the mixed and
oxygenated water column, which then affected the production and spatial as well as temporal
distribution of carbon gases. In particular, the hypolimnetic CH4 concentrations in the lake basin
were lower all the time than they were in summer 2005, and decreased to the level which is
typical of boreal lakes.
Fluxes of CO2 and CH4 revealed that the Enonselkä lake basin of Lake Vesijärvi was a source of
carbon gases during the open water period 2013, although the CO2 fluxes showed also negative
values occasionally. The averaged seasonal CO2 flux was higher in the aeration year than in the
non-aeration year, whereas the flux of CH4 remained the same as before. When the artificial
aeration units were operating, there was contradictory pattern between CO2 and CH4 fluxes; the
CO2 fluxes increased while CH4 fluxes decreased, which means that the hypothesis was
supported but only on the condition of long time of aeration. The unexpected flux peaks of CO2
and CH4 in June contributed markedly to the total seasonal emission; the cause of the flux peaks
remained unknown.

41
I can conclude that in terms of greenhouse gas emissions, the artificial aeration was successful,
but for the desired outcome, the aeration – e.g. timing and duration of operation - needs to be
carefully planned.
7. Acknowledgments
This study was run as a part of the project ‘Ilmastonkestävä kaupunki’ ILKKA programme and
funded by the City of Lahti. The study was carried out at the Department of Environmental
Sciences of the University of Helsinki.
I want to acknowledge especially my supervisor, Dr. Anne Ojala for taking me into this study
and for guiding and commenting my thesis through the study. I am also thankful to Prof. Jukka
Horppila and Prof. Timo Vesala for being also my supervisors and for their scientific thinking
and constructive comments. I also want to thank Taru Hämäläinen and Ismo Malin from the City
of Lahti for helping me in the field and with organizing the work as well for work data support,
Jaakko Vainionpää from Lammi Biological Station of University of Helsinki for laboratory
instruction, Dr. Jouni Heiskanen and Dr. Miitta Rantakari for instructions in the calculations. I
have learned a lot from all of you.

42
8. References
Bastviken, D., Cole, J., Pace, M., & Tranvik, L. (2004). Methane emissions from lakes:
Dependence of lake characteristics, two regional assessments, and a global estimate. Global
Biogeochemical Cycles, 18(4), 1-12.
Bastviken, D., Santoro, A. L., Marotta, H., Pinho, L. Q., Calheiros, D. F., Crill, P., et al. (2010).
Methane emissions from Pantanal, South America, during the low water season: Toward
more comprehensive sampling. Environmental Science and Technology, 44(14), 5450-5455.
Capone, D. G., & Kiene, R. P. (1988). Comparison of microbial dynamics in marine and
freshwater sediments: Contrasts in anaerobic carbon catabolism. Limnology &
Oceanography, 33(4), 725-749.
Cole, G. A. (1983). Textbook of Limnology. 2nd
edition. – St.Louis, MO: The C.V. Mosby
Company. 89-105, 183-199, 261-266.
Cole, J. J., & Caraco, N. F. (1998). Atmospheric exchange of carbon dioxide in a low-wind
oligotrophic lake measured by the addition of SF6. Limnology and Oceanography, 43(4),
647-656.
Cole, J. J., Caraco, N. F., Kling, G. W., & Kratz, T. K. (1994). Carbon dioxide supersaturation in
the surface waters of lakes. Science, 265(5178), 1568-1570.
Cowell, B. C., Dawes, C. J., Gardiner, W. E., & Scheda, S. M. (1987). The influence of whole
lake aeration on the limnology of a hypereutrophic lake in central Florida. Hydrobiologia,
148(1), 3-24.
Downing, J. A., Prairie, Y. T., Cole, J. J., Duarte, C. M., Tranvik, L. J., Striegl, R. G., et al.
(2006). The global abundance and size distribution of lakes, ponds, and impoundments.
Limnology and Oceanography, 51(5), 2388-2397.
Findlay, S., & Sinsabaugh, R. L. (2003). Response of hyporheic biofilm metabolism and
community structure to nitrogen amendments. Aquatic Microbial Ecology, 33(2), 127-136.
Forsius, M., Saloranta, T., Arvola, L., Salo, S., Verta, M., Ala-Opas, P., et al. (2010). Physical
and chemical consequences of artificially deepened thermocline in a small humic lake - A
paired whole-lake climate change experiment. Hydrology and Earth System Sciences,
14(12), 2629-2642.

43
Forster, P., Ramaswamy, V., Artaxo, P., Berntsen, T., Betts, R., Fahey, D. W., et al. (2007).
Chapter 2: Changes in atmospheric constituents and in radiative forcing. - contribution of
working group I to the fourth assessment report of the intergovernmental panel on climate
change, 2007. Cambridge University Press. IPCC web page,
http://www.ipcc.ch/publications_and_data/ar4/wg1/en/ch2.html
Grinham, A., Dunbabin, M., Gale, D., & Udy, J. (2011). Quantification of ebullitive and
diffusive methane release to atmosphere from a water storage. Atmospheric Environment,
45(39), 7166-7173.
Heiskanen, J. J., Mammarella, I., Haapanala, S., Pumpanen, J., Vesala, T., Macintyre, S., et al.
(2014). Effects of cooling and internal wave motions on gas transfer coefficients in a boreal
lake. Tellus, Series B: Chemical and Physical Meteorology, 66(1), 1-16.
Ho, D. T., Veron, F., Harrison, E., Bliven, L. F., Scott, N., & McGillis, W. R. (2007). The
combined effect of rain and wind on air-water gas exchange: A feasibility study. Journal of
Marine Systems, 66(1-4), 150-160.
Huotari, J. (2011). Carbon dioxide and methane exchange between a boreal pristine lake and the
atmosphere. (PhD thesis, Helsingin yliopisto). (http://ethesis.helsinki.fi)
Huotari, J., Ojala, A., Peltomaa, E., Pumpanen, J., Hari, P., & Vesala, T. (2009). Temporal
variations in surface water CO2 concentration in a boreal humic lake based on high-
frequency measurements. Boreal Environment Research, 14(SUPPL. A), 48-60.
Huttunen, J. T., Hammar, T., Alm, J., Silvola, J., & Martikainen, P. J. (2001). Greenhouse gases
in non-oxygenated and artificially oxygenated eutrophied lakes during winter stratification.
Journal of Environmental Quality, 30(2), 387-394.
Juutinen, S., Rantakari, M., Kortelainen, P., Huttunen, J. T., Larmola, T., Alm, J., et al. (2009).
Methane dynamics in different boreal lake types. Biogeosciences, 6(2), 209-223.
Kairesalo,T., Vakkilainen, K. (2004). Lake Vesijärvi and the City of Lahti comprehensive
interactions between the lakes and the couples human community. SilNews, 41, 1-5.
Kairesalo, T., Laine, S., Luokkanen, E., Malinen, T., & Keto, J. (1999). Direct and indirect
mechanisms behind successful biomanipulation. Hydrobiologia, 395-396, 99-106.
Kauppinen, E. (2013). Vesijärvi mixox- hapetus vuonna 2012 Vuosiraportti. Lahden kaupunki,
tekninen ja ympäristötoimiala, Lahden seudun ympäristöpalvelut & Vesi-Eko Oy, 1-14.

44
Keto, J., Kolunen, H., Pekkarine, A., & Tuominen, L. (Eds.). (2012). Lake Vesijärvi: Daughter
of the Salpausselkä rigdes. – Lahti Region Environmental Service and the Lake Vesijärvi
Foundation. The City of Lahti, 7-32 & 43-61.
Kwan, J., & Taylor, P. A. (1994). On gas fluxes from small lakes and ponds. Boundary-Layer
Meteorology, 68(4), 339-356.
Linnaluoma, J. (2012). Factors controlling carbon gas fluxes in boreal lakes. (PhD thesis,
Helsingin yliopisto), (http://ethesis.helsinki.fi).
López Bellido, J., Peltomaa, E., & Ojala, A. (2011). An urban boreal lake basin as a source of
CO2 and CH4. Environmental Pollution, 159(6), 1649-1659.
López Bellido, J., Tulonen, T., Kankaala, P., & Ojala, A. (2009). CO2and CH4 fluxes during
spring and autumn mixing periods in a boreal lake (pääjärvi, southern finland). Journal of
Geophysical Research G: Biogeosciences, 114(4), 1-12.
Markfort, C. D., Perez, A. L. S., Thill, J. W., Jaster, D. A., Porté-Agel, F., & Stefan, H. G. (2010).
Wind sheltering of a lake by a tree canopy or bluff topography. Water Resources Research,
46(3), 1-13.
Martinez, D., & Anderson, M. A. (2013). Methane production and ebullition in a shallow,
artificially aerated, eutrophic temperate lake (Lake Elsinore, CA). Science of the Total
Environment, 454-455, 457-465.
McGillis, W. R., Edson, J. B., Zappa, C. J., Ware, J. D., McKenna, S. P., Terray, E. A., et al.
(2004). Air-sea CO2 exchange in the equatorial pacific. Journal of Geophysical Research C:
Oceans, 109(8), C08S02 1-17.
Michmerhuizen, C. M., Striegl, R. G., & McDonald, M. E. (1996). Potential methane emission
from north-temperate lakes following ice melt. Limnology and Oceanography, 41(5), 985-
991.
Miettinen H., Pumpanen J., Heiskanen J.J., Aaltonen H., Mammarella I., Ojala A., Levula J. &
Rantakari M. (2014). Towards a more comprehensive understanding of lacustrine
greenhouse gas dynamics – two-year measurements of concentrations and fluxes of CO2,
CH4 and N2O in a typical boreal lake surrounded by managed forests. Personal
Communication.

45
Ojala, A., Bellido, J. L., Tulonen, T., Kankaala, P., & Huotari, J. (2011). Carbon gas fluxes from
a brown-water and a clear-water lake in the boreal zone during a summer with extreme rain
events. Limnology and Oceanography, 56(1), 61-76.
Puhdas vesijärvi.http://www.puhdasvesijarvi.fi/fi/vesijarvi
Raghoebarsing, A. A., Pol, A., Van De Pas-Schoonen, K. T., Smolders, A. J. P., Ettwig, K. F.,
Rijpstra, W. I. C., et al. (2006). A microbial consortium couples anaerobic methane
oxidation to denitrification. Nature, 440(7086), 918-921.
Riera, J. L., Schindler, J. E., & Kratz, T. K. (1999). Seasonal dynamics of carbon dioxide and
methane in two clear-water lakes and two bog lakes in northern Wisconsin, U.S.A.
Canadian Journal of Fisheries and Aquatic Sciences, 56(2), 265-274.
Schink, B. (1997). Energetics of syntrophic cooperation in methanogenic degradation.
Microbiology and Molecular Biology Reviews, 61(2), 262-280.
Wanninkhof, R., Asher, W. E., Ho, D. T., Sweeney, C., & McGillis, W. R. (2009). Advances in
quantifying air-sea gas exchange and environmental forcing. Annual Review of Marine
Science, 1, 213-244.
Wetzel, R. G. (2001). Limnology: Lake and River Ecosystems 3rd
edition. – San Diego:
Academic Press. 72-86.

46
Appendix I. Chlorophyll a concentration (µg L-1
) in Lankiluoto at the depths of 10, 20, and 30
m in 2009-2013. Recordings for this figure adopted from the automatic monitoring in Lankiluoto.