Carbon Footprint Reduction - An MIT Journey
49
REDUCTION OF CARBON FOOTPRINT – A JOURNEY FEBRUARY 21, 2013 AV 1, MIT INTRAMUROS
-
Upload
diomar-de-castro -
Category
Engineering
-
view
107 -
download
2
Transcript of Carbon Footprint Reduction - An MIT Journey
REDUCTION OF CARBON FOOTPRINT – A JOURNEYFEBRUARY 21, 2013AV 1, MIT INTRAMUROS

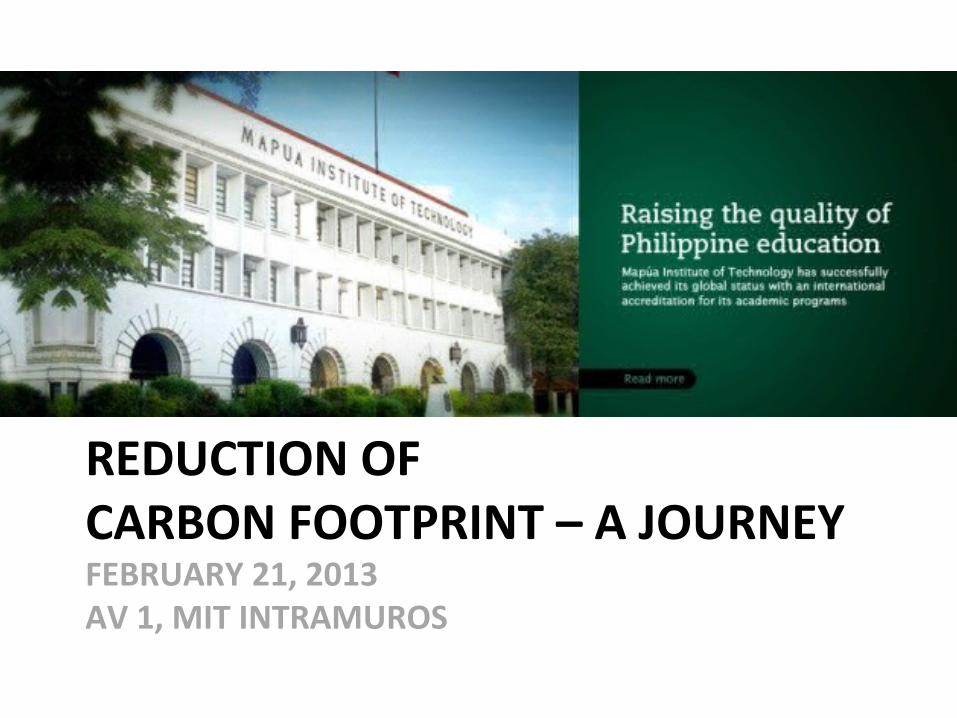
Green Motivation
“Cats have 9 lives, but earth has one;so we must take care and loveour only one – planet earth”
Green Motivation
Consider joining the International Sustainable Campus Network

International Sustainable Campus Network


Pagtatapon ng Basura

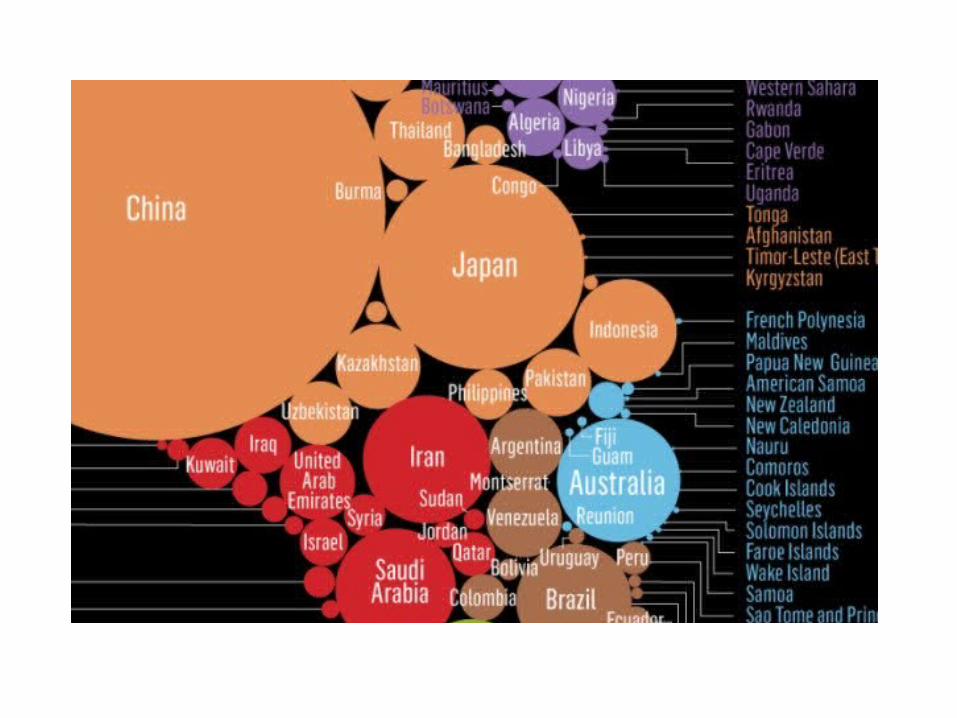
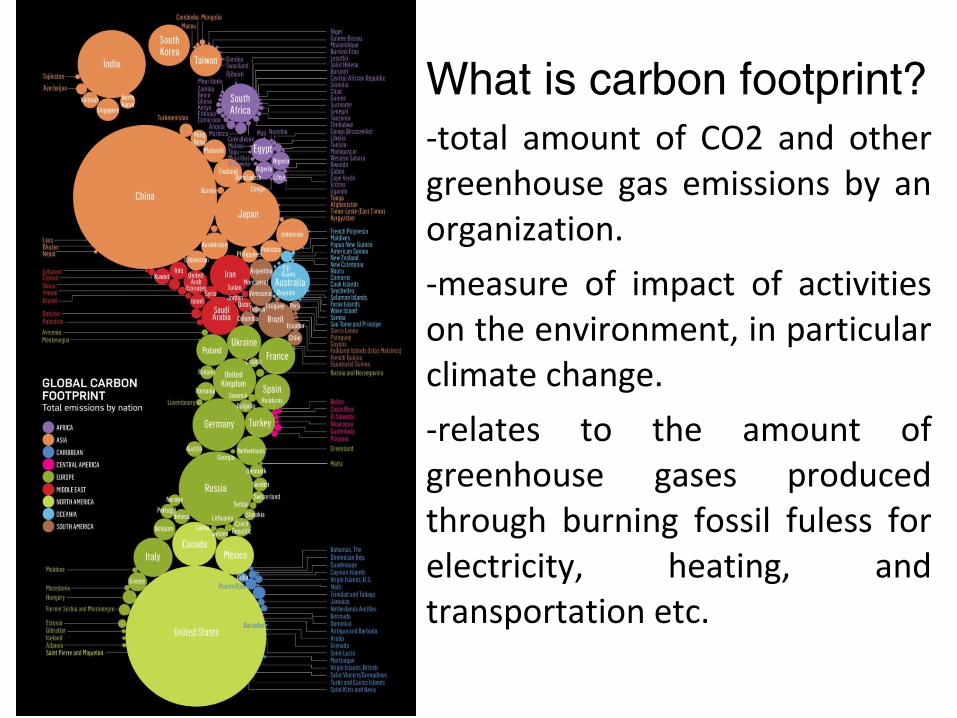
What is carbon footprint?-total amount of CO2 and other greenhouse gas emissions by an organization.
-measure of impact of activities on the environment, in particular climate change.
-relates to the amount of greenhouse gases produced through burning fossil fuless for electricity, heating, and transportation etc.

What GHG Gases are measured?
1. Carbon Dioxide
2. Methane
3. Nitrous Oxide
4. Hydrofluorocarbons
5. Perfluorocarbons
6. Sulfur Hexaflouride
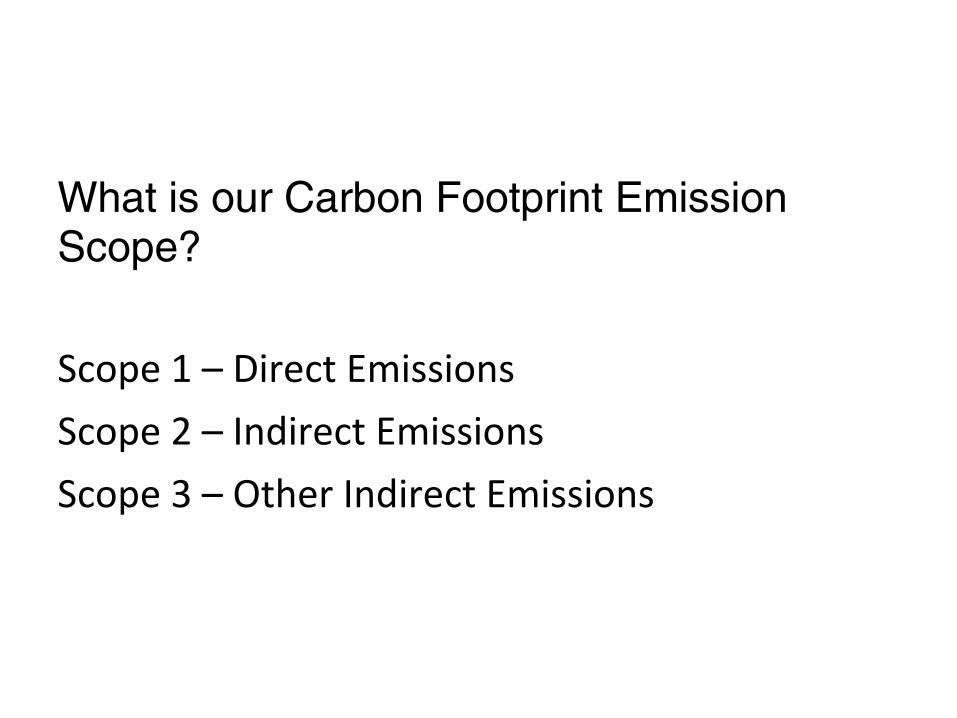
What is our Carbon Footprint Emission Scope?
Scope 1 – Direct Emissions
Scope 2 – Indirect Emissions
Scope 3 – Other Indirect Emissions
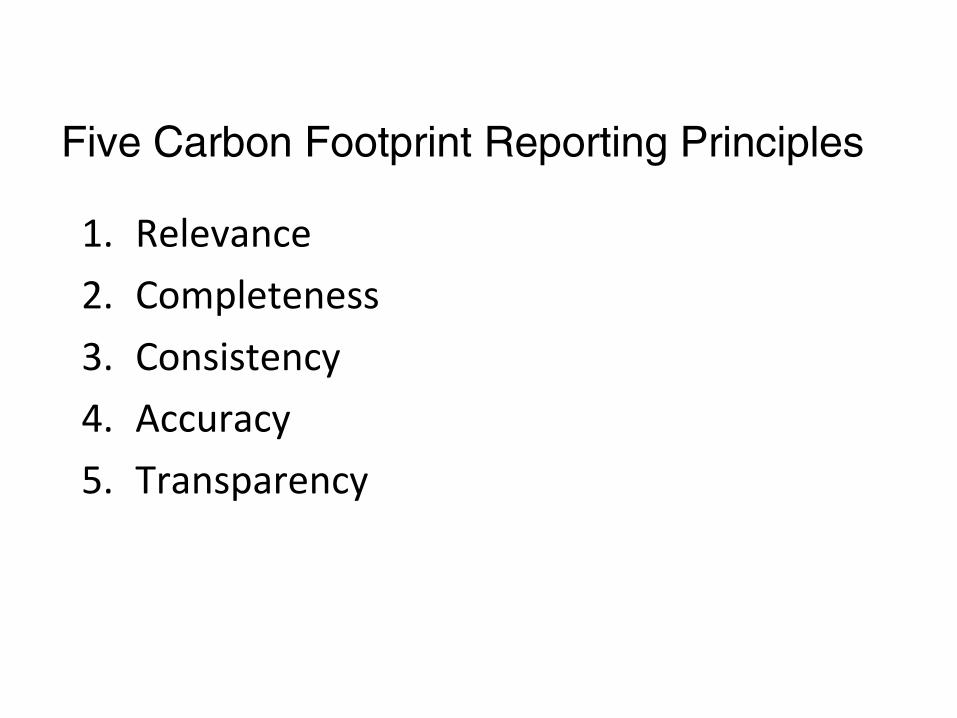
Five Carbon Footprint Reporting Principles
1. Relevance
2. Completeness
3. Consistency
4. Accuracy
5. Transparency

Emerging Carbon Market Place


Source: http://unfccc.int/kyoto_protocol/mechanisms/clean_development_mechanism/items/2718.php
Climate Change
MAKE MIT A LIVING LABORATORY IN
CARBON FOOTPRINT REDUCTION AND RENEWABLE ENERGY RESEARCH

A Journey to Carbon Footprint Reduction
1. Form/Update Stakeholder Group
2. GHG Inventory
3. Develop Strategic Climate Action Plan
4. Identify Resource Investments
5. Implement a Tactical Plan

1. The Stakeholder Group
1. Strategic Administrative Partner - RBV, RCF, BTD, GCG & Trustees
2. Sustainability Director & Committee Members -RBV, BTD, RRubielos, GTeodoro, ASoriano,
DDC,RSantiago, KDeCastro, et al.
3. Communicator and Motivator- IT & Corp Comm (BCo and AOnte)
4. Academic Liaison & Support Staff - Deans, FAMIT, OSA & Students, MITLU, GAMSI, BSA
2. Greenhouse gas emissions inventory

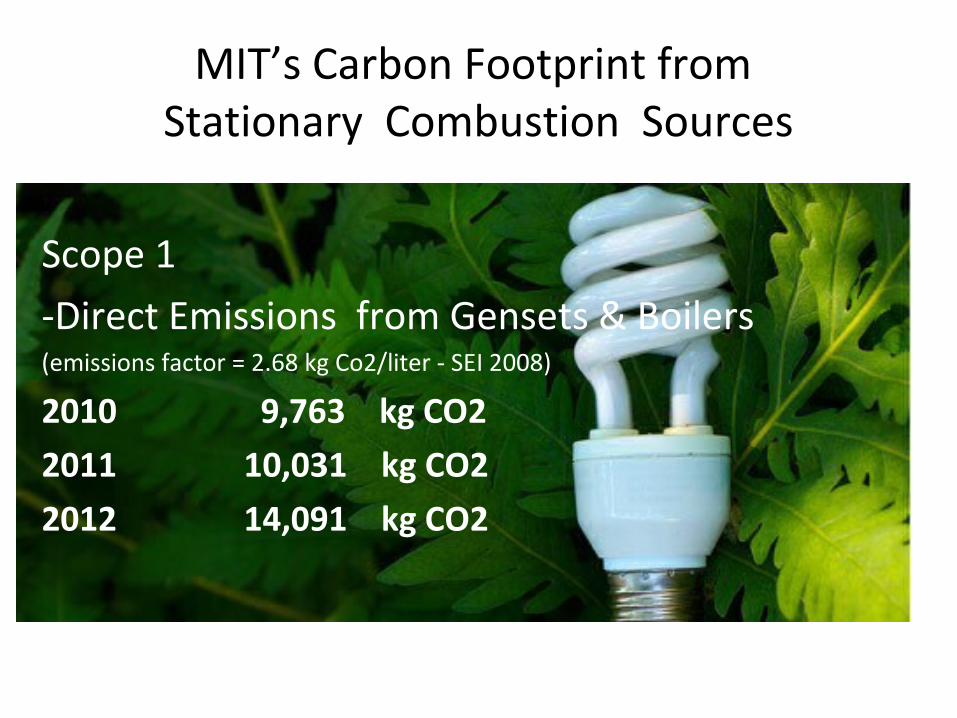
MIT’s Carbon Footprint from Stationary Combustion Sources
Scope 1
-Direct Emissions from Gensets & Boilers(emissions factor = 2.68 kg Co2/liter - SEI 2008)
2010 9,763 kg CO2
2011 10,031 kg CO2
2012 14,091 kg CO2
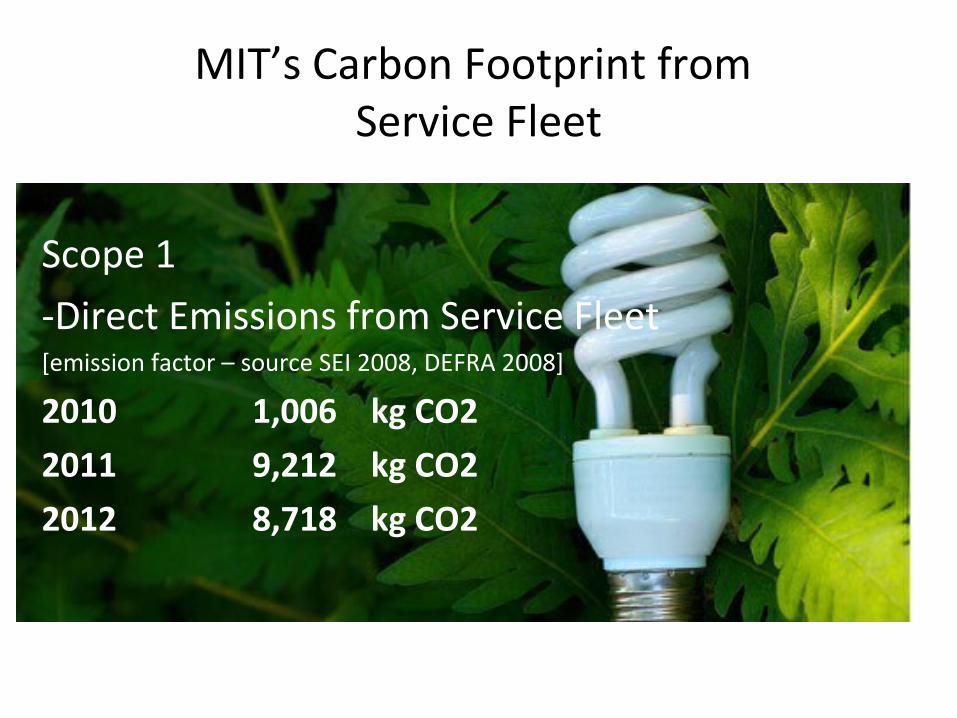
MIT’s Carbon Footprint from Service Fleet
Scope 1
-Direct Emissions from Service Fleet[emission factor – source SEI 2008, DEFRA 2008]
2010 1,006 kg CO2
2011 9,212 kg CO2
2012 8,718 kg CO2

Mga ilang paalala:1. Isara ang exhaust fans ng toilet kapag walang
gumagamit.
2. Magtipid pa tayo sa tubig.
3. Magbawas ng ilaw kung maari kapag nagwawalis ng classroom.
4. I-adjust ang AC tuwing tag-lamig/tag-ulan.
Look beyond the money

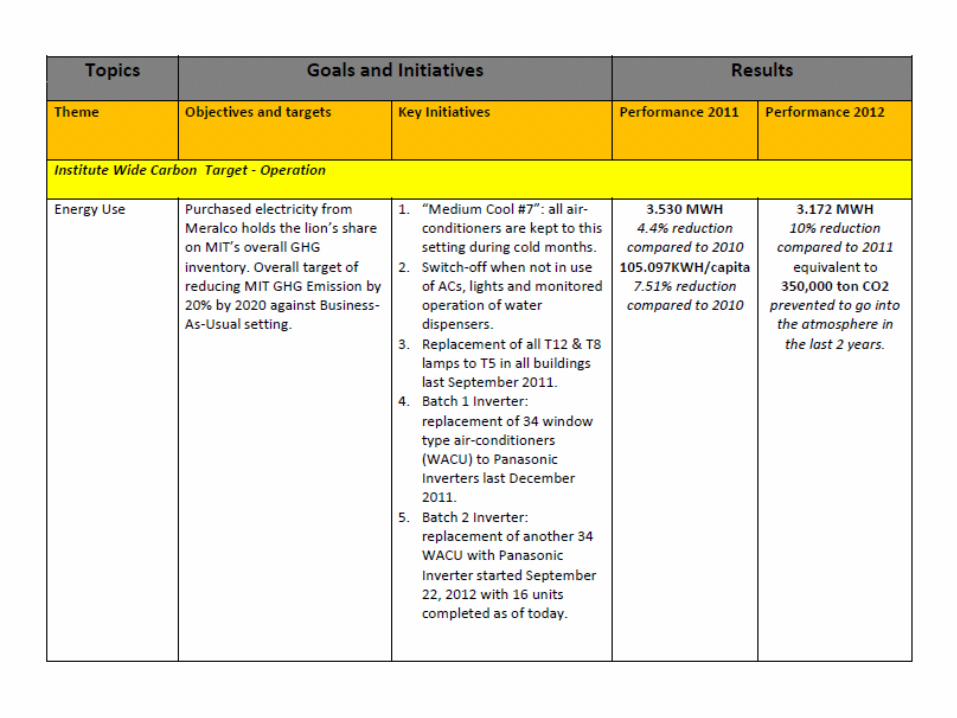
MIT’s Carbon Footprint from Purchased Electricity
Scope 2
-Indirect Emissions from Purchased Electricity(emissions factor = 0.667 Luzon Grid Emission Factor)
2010 2,462,630 ton CO2
2011 2,354,109 ton CO2 (4% Reduction)
2012 2,118,698 ton CO2 (10% Reduction)


Visualization of MIT’s 2012 Carbon Emission


Visualization of MIT’s 2012 Carbon Emission

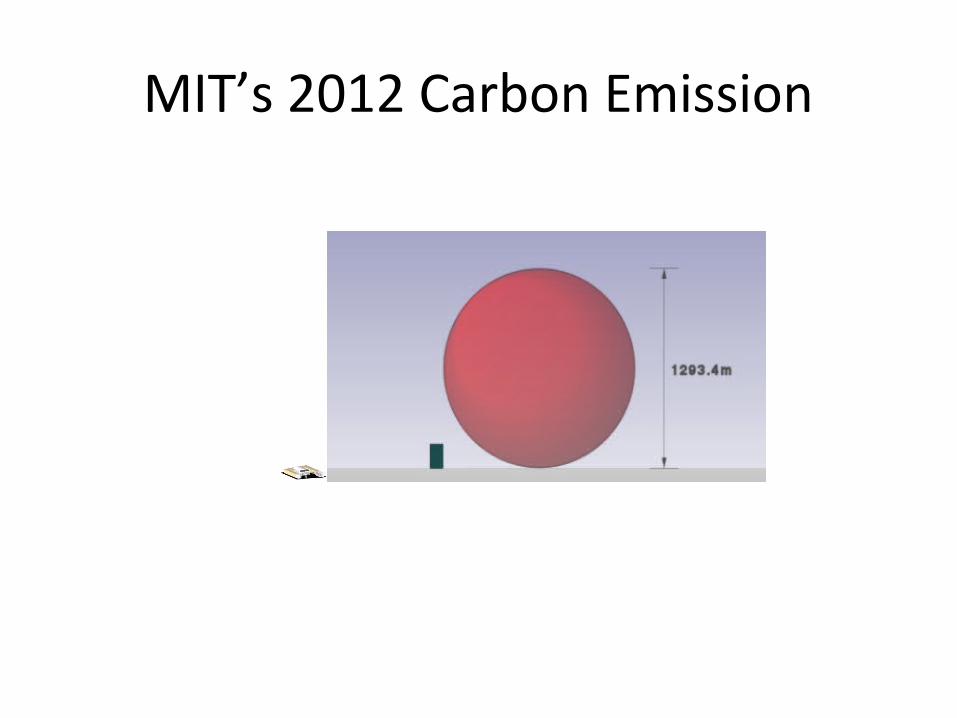
MIT’s 2012 Carbon Emission
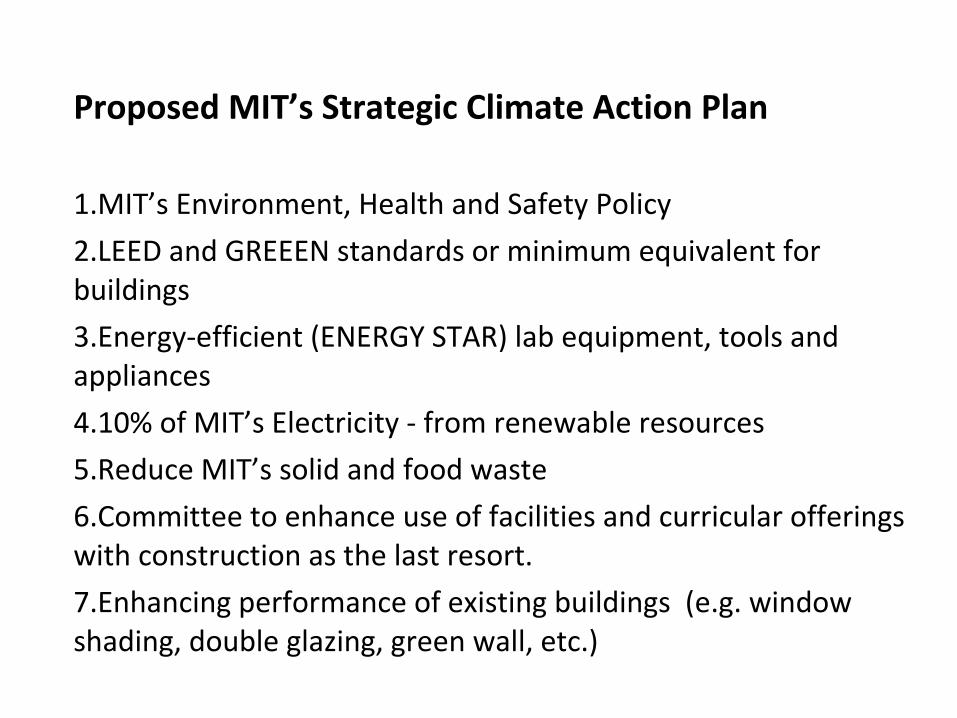
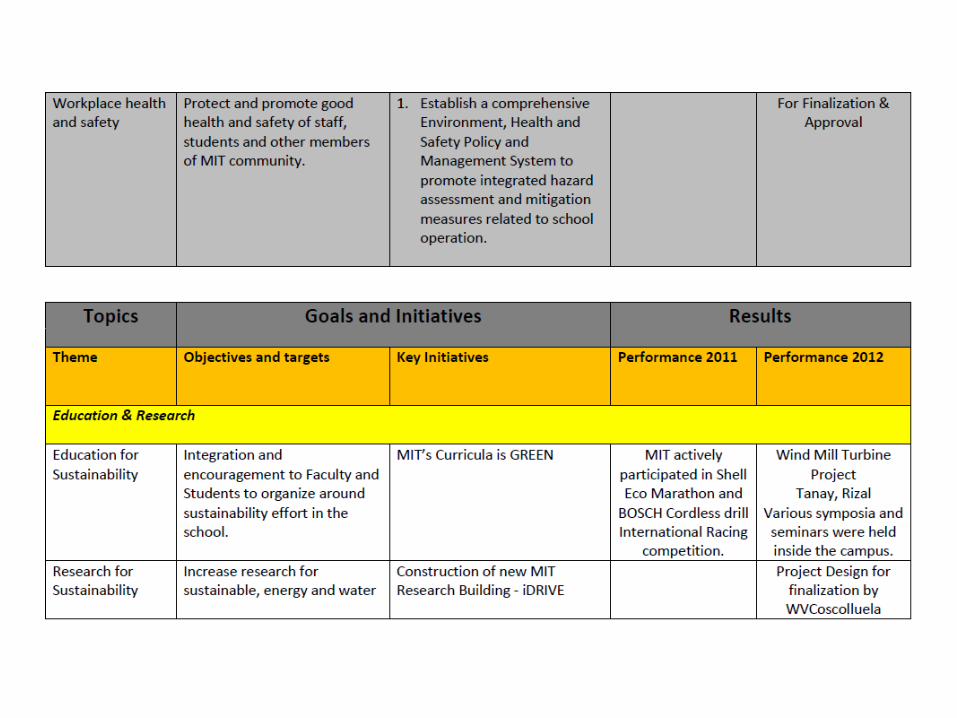
Proposed MIT’s Strategic Climate Action Plan
1.MIT’s Environment, Health and Safety Policy
2.LEED and GREEEN standards or minimum equivalent for buildings
3.Energy-efficient (ENERGY STAR) lab equipment, tools and appliances
4.10% of MIT’s Electricity - from renewable resources
5.Reduce MIT’s solid and food waste
6.Committee to enhance use of facilities and curricular offerings with construction as the last resort.
7.Enhancing performance of existing buildings (e.g. window shading, double glazing, green wall, etc.)

8. Promote energy conservation awareness and outreach programs.
9. *Metering technologies -accurate picture of the full campus carbon footprint.
10. Investment in personnel
11. Greening curriculum and research of other non-engineering programs.
12. Reduce carbon footprint by 50% in 2025.
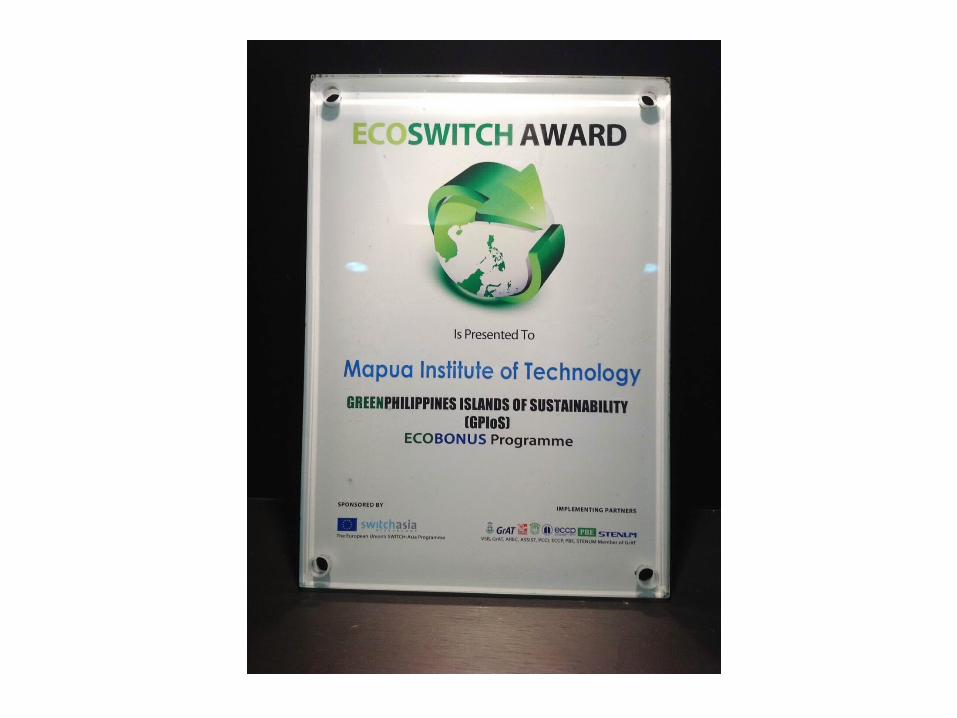


GPIoS Ecoswitch Performance Award

Dean Gloria Teodoro and Archt. Diomar de Castro receiving the Ecoswitch Performance Award last September 25, 2012
at New World Hotel, Makati City, Philippines

T5 & Inverter InvestmentProject Performance 2012
Actual Cash Flow P2,533,830.00 (Savings on Electricity Bill as of Sept 2012)
Required Cash Flow P1,893,839.76 [T5 (1.7yrs. ROI) & Inverter (4.27 yrs. ROI)]
P 639,990.24

Expect good things
www.dnv.or
g

THANK YOU!