Carbon Estimate and Reporting Tool Guidelines · Carbon Estimate and Reporting Tool September 2015...
46
Carbon Estimate and Reporting Tool | September 2015 1 Carbon Estimate and Reporting Tool Guidelines September 2015 | Version: 1
Transcript of Carbon Estimate and Reporting Tool Guidelines · Carbon Estimate and Reporting Tool September 2015...
Carbon Estimate and Reporting Tool | September 2015 1
Carbon Estimate and Reporting Tool Guidelines
September 2015 | Version: 1

The following Carbon Estimate and Reporting Guide has been produced by Transport for New South Wales to assist with the measurement and reporting of Greenhouse Gas Emissions in line with the requirements of the Infrastructure and Services Division Sustainable Design Guidelines.
Carbon Estimate and Reporting Tool | September 2015 2
Contents1 Introduction 5
1.1 General guidance and information 6
1.1.1 Understanding the terminology 6
1.1.2 Hints and tips before you start 6
2 Core tabs 10
2.1 Navigation tab 10
2.1.1 Selecting the relevant project reporting stage 10
2.2 Project details tab 11
2.3 Data input tab 12
2.4 SDR stage: data entry 13
2.4.1 Materials 13
2.4.2 Materials mitigation measures 19
2.4.3 Energy use 20
2.4.4 Energy use - mitigation measures 22
2.4.5 Waste generated 23
2.4.6 Waste mitigation measures 23
2.4.7 Land use/vegetation clearing 23
2.4.8 Revegetation – mitigation 24
2.4.9 Completion of SDR stage data entry 24
2.5 CDR stage: data entry 25
2.5.1 Data input 25
2.6 Six monthly construction stages: data entry 28
2.7 Detailed results tab 28
2.7.1 Emissions per category, scope and project stage 28
2.7.2 Six-monthly cumulative or absolute project emissions 29
2.7.3 Reductions achieved across key emitting categories (materials, energy, land use, waste) 29
2.8 Dashboard tab 29
Carbon Estimate and Reporting Tool | September 2015 3
Contents3 Appendices 32
Appendix A: CERT terminology 32
Appendix B: Maxbio classification maps – NSW 34
Appendix C: Supporting information 35
Mitigation evidence requirements 35
Submission requirements 36
Constraints and common questions 36
Constraints 36
Frequently asked questions 37
Appendix D: CERT overview and context 40
Introduction 40
Purpose and objectives 40
Developing the CERT 41
CERT structure 43
Appendix E: Reporting template 44
Carbon Estimate and Reporting Tool | September 2015 4
Abbreviations and definitions
ALCAS Australian Life Cycle Assessment Society
AusLCI Australian National Life Cycle Inventory Database
BOQ Bill of Quantities
BPIC Building Products Innovation Council
CDR Critical Design Review – refers to completed (100%) detailed design
CERT Carbon Estimate and Reporting Tool (the ‘tool’)
EPD Environmental Product Declaration
FAQs Frequently Asked Questions
GHGs Greenhouse Gas Emissions
GREP Government Resource Efficiency Policy
GWP Global Warming Potential
HDPE High-density polyethylene
IPCC Intergovernmental Panel on Climate Change
I&S Infrastructure and Services Division
ISCA Infrastructure Sustainability Council of Australia
IS rating tool Infrastructure Sustainability rating tool – administered by ISCA
NGA National Greenhouse Accounts
NGERS National Greenhouse and Energy Reporting Scheme
LCA Lifecycle Assessment
PVC Polyvinyl chloride
TAGG Transport Authorities Greenhouse Group
TfNSW Transport for New South Wales
SDGs TfNSW Sustainable Design Guidelines
SDR System Design Review – refers to designs that are at least 20% complete
Carbon Estimate and Reporting Tool | September 2015 5
1 Introduction
Within Transport for New South Wales (TfNSW), the Infrastructure and Services Division (I&S) is responsible for delivering cost-effective and sustainable transport solutions to support the growth of NSW, enhancing its natural and urban environments to provide tangible benefits to customers.
I&S deliver a diverse portfolio of projects ranging in type and size. This includes:
• Infrastructure projects – rail, light rail, commuter car parks, station upgrades, etc.
• Fleet procurement – rolling stock, ferries, etc.
• Power supply upgrades.
In addition to project delivery, I&S delivers environmental, urban design, heritage, sustainability, property, quality management, safety management and commercial support services.
The Carbon Estimate and Reporting Tool (CERT) – ‘the tool’ - has been developed to provide consistency in Greenhouse Gas (GHG) emissions assessment and reporting across all I&S projects, and to streamline and simplify the GHG assessment process for I&S, its service providers/contractors and its stakeholders.
The introduction of the CERT supersedes the previous reporting requirements within the current TfNSW Greenhouse Gas Inventory for Construction Projects.
TfNSW’s Standard Requirements – Environment (TSR-E) will be updated to require completion of the CERT by suppliers, for all projects ≥ $15 million that are also required to complete the Sustainable Design Guidelines.
The tool, an Excel spread sheet, has been structured to enable the user to input data across a range of stages, from System Design Review (SDR) - or equivalent design stage - through to construction (at six-monthly intervals).
The tool is structured across six core tabs:
1. Introduction (light orange tab) – Information only tab - no data input required. Provides an overview of the background of the tool.
2. Navigation (yellow tab) – Data input required - enables the user to select their relevant input reporting stage (e.g. SDR, CDR, six-monthly periods during construction).
3. Project detail (grey tab) – Data input required - requires the user to input relevant project information, including any project-specific reduction targets, and includes a section for signing off on data validation and approval prior to submission.
Carbon Estimate and Reporting Tool | September 2015 6
4. Data input (orange tab) – Data input required - comprises the core data entry component of the tool. It includes data entry sections and conversion calculators associated with usage and mitigation for: Materials; Energy Use; Waste; Land Use/Vegetation Clearance.
5. Detailed results (red tab) – Information only tab - no data input required. There are two red tabs, both of which provide report summary information including useful tables and graphs. The detailed results tab also provides a breakdown of scope 1 and scope 2 emissions for use towards the ISCA Ene-1 credit.
6. Dashboard (red tab) – Information only tab - no data input required. The dashboard provides a performance summary of the relevant project stages in comparison to a base case (an auto-generated business–as-usual scenario) and analyses performance against project GHG reduction targets.
In addition the following accompanying tabs provide background detail on the operation of the tool (flow-chart): calculations; formulas; emission factors and data sources; and a series of empty worksheets to enable interim calculations, note taking etc. throughout the completion process.
The CERT emission categories and sources have been determined based on a materiality assessment exercise undertaken by I&S. The tool is specifically designed to capture a project’s most significant/material carbon emissions.
1.1 General guidance and information
The following provides a summary of supporting information that will be useful in completing the tool.
Further support can be obtained by contacting [email protected]. TfNSW also welcomes feedback on the tool and encourages its stakeholders to provide comment through use of this email address.
1.1.1 Understanding the terminology
Appendix A provides a summary of commonly used terminology referenced throughout the tool. A full list of abbreviations is included in the front of this guide.
1.1.2 Hints and tips before you start
There are a number of CERT functions that are common, and therefore featured repeatedly across the various themes of the tool and throughout the lifecycle of a project’s assessment (i.e. will appear across SDR, CDR and construction stage reporting). These are captured below.
Note: Unless a particular material, energy source, etc. is not being used – data must be entered for all emitting categories.
Updating the CERT across relevant project stages
To keep track of the CERT data entries across the respective project stages, it is recommended each version is saved using a unique name. The following naming convention is suggested:
“[tool version] – [project name] – [reporting period] – [submission date]”
For example: “TfNSW CERT v1 – Newcastle Light Rail – CDR – 30 June 2015”. When reporting against each reporting period, it is recommended the latest version of the file is used and is renamed/updated according to the relevant reporting period.
Carbon Estimate and Reporting Tool | September 2015 7
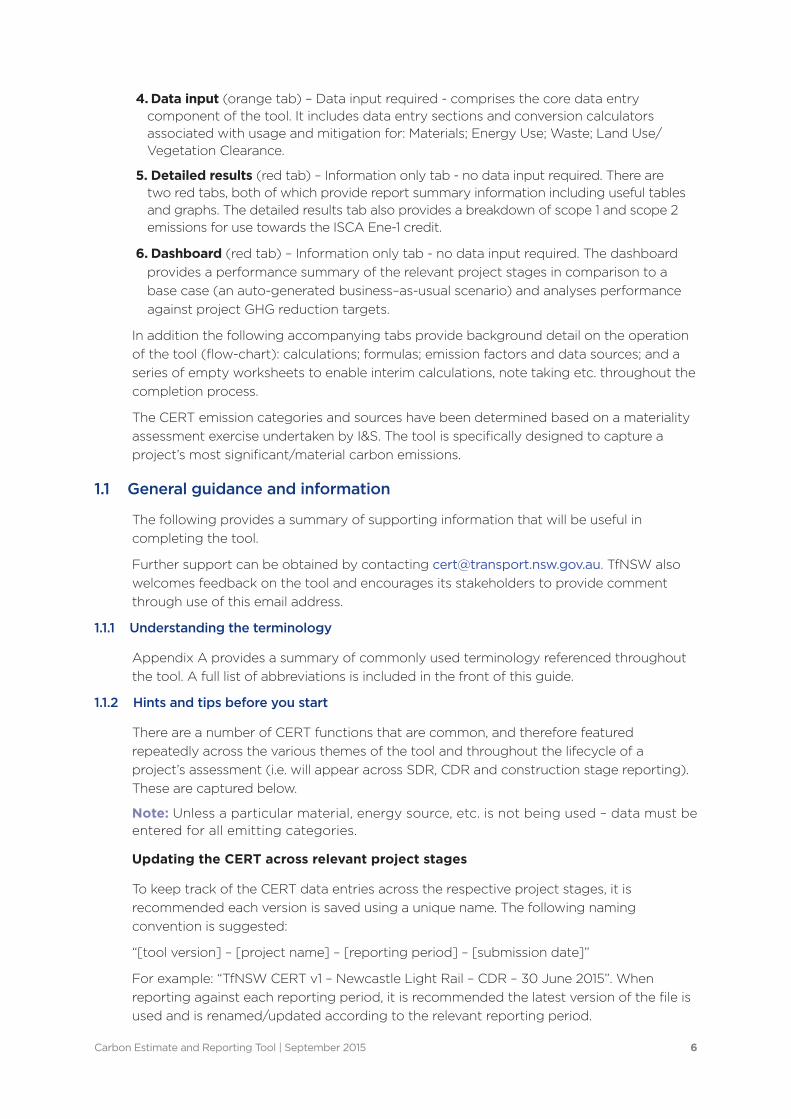
Quantity Unittonnes
Evidence / data source / comments
Precast concrete
Quantity Unitm30.0
kgtonnesmm2m3tkm
Select unit You can enter your data in mass (tonnes) or volume (m3)
Pop up notes: Many data entry cells will show a pop-up note when selected. These notes contain useful information to assist users when entering data.
Go back to Main data entry section
Orange cells: represent editable data input cells – the user is required to enter information directly into these cells. To avoid error, some cells may have limitations to the values that can be entered.
Orange cells: When a dropdown is available, a value from the dropdown menu must be selected (or the cell should remain empty if not relevant).
Grey cells: represent non-editable cells. The data in these cells comprise calculations and formulas that are automatically generated by carrying information over from other parts of the tool. I.e. completing the associated emissions calculators will automatically update these cells.
Blue cells: represent evidence cells – the user is required to enter evidence/data sources/comments to support the information provided.
Orange underlined text: Hyperlinked text. Clicking on the hyperlinked text will take the user to the relevant section of the CERT for data entry.
Data entry cells
As stated, there are six main tabs within the tool that relate to its completion. Within these tabs are the associated data entry cells that enable the user to enter relevant information. The data entry tabs are colour coded as follows:
Returning to main entry sheet
Throughout the tool, and in particular on the relevant calculator worksheets, a ‘go back’ button has been included. This button enables easy navigation between the main data entry sheet and the respective (conversion) calculators. Clicking on the ‘go back’ button will return the user to the main data entry sheet once they have finished completing the calculator section.
Carbon Estimate and Reporting Tool | September 2015 8
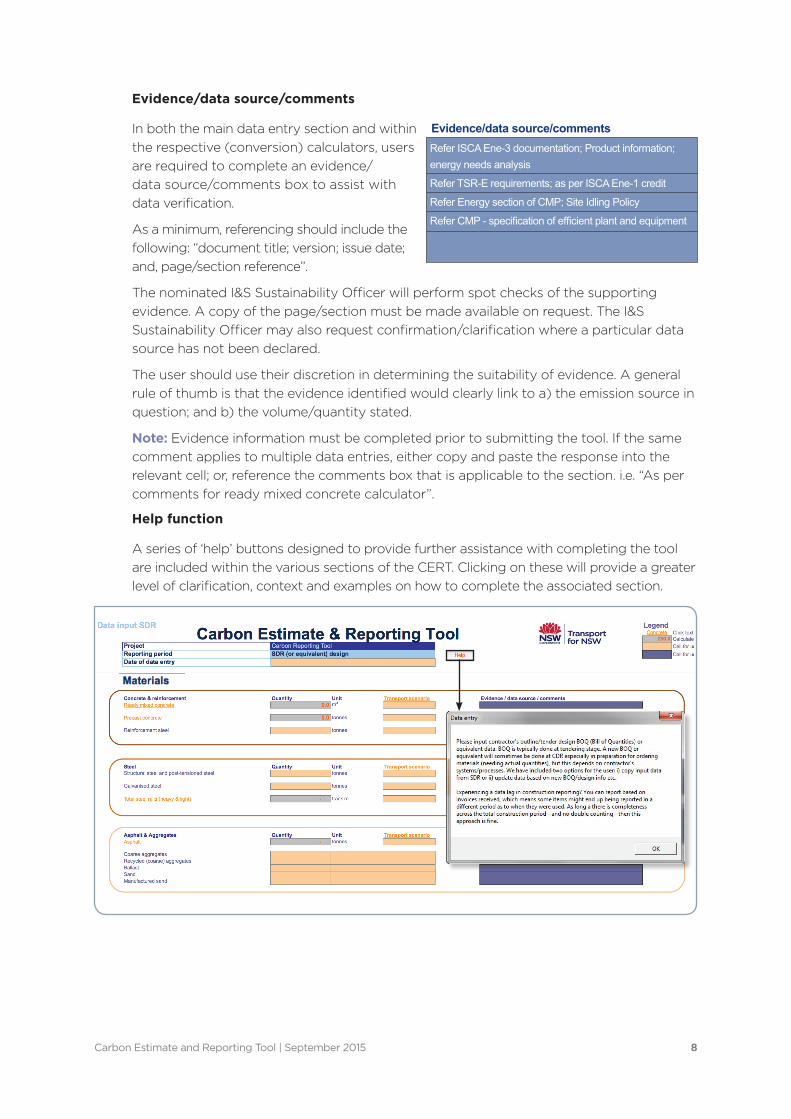
Evidence/data source/comments
In both the main data entry section and within the respective (conversion) calculators, users are required to complete an evidence/ data source/comments box to assist with data verification.
As a minimum, referencing should include the following: “document title; version; issue date; and, page/section reference”.
The nominated I&S Sustainability Officer will perform spot checks of the supporting evidence. A copy of the page/section must be made available on request. The I&S Sustainability Officer may also request confirmation/clarification where a particular data source has not been declared.
The user should use their discretion in determining the suitability of evidence. A general rule of thumb is that the evidence identified would clearly link to a) the emission source in question; and b) the volume/quantity stated.
Note: Evidence information must be completed prior to submitting the tool. If the same comment applies to multiple data entries, either copy and paste the response into the relevant cell; or, reference the comments box that is applicable to the section. i.e. “As per comments for ready mixed concrete calculator”.
Help function
A series of ‘help’ buttons designed to provide further assistance with completing the tool are included within the various sections of the CERT. Clicking on these will provide a greater level of clarification, context and examples on how to complete the associated section.
Evidence/data source/commentsRefer ISCA Ene-3 documentation; Product information;energy needs analysis
Refer TSR-E requirements; as per ISCA Ene-1 credit
Refer Energy section of CMP; Site Idling Policy
Refer CMP - specification of efficient plant and equipment
Carbon Estimate and Reporting Tool | September 2015 9
Go back to Main data entry sectionGo back to Main data entry section
Tab
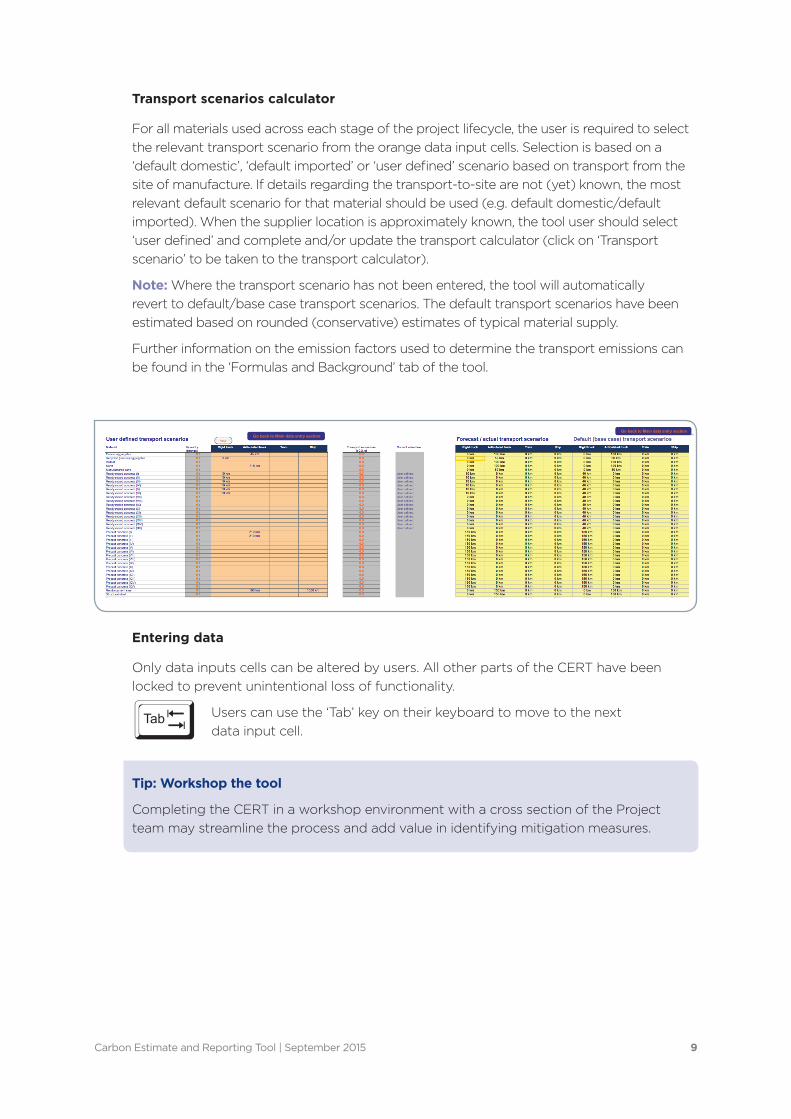
Transport scenarios calculator
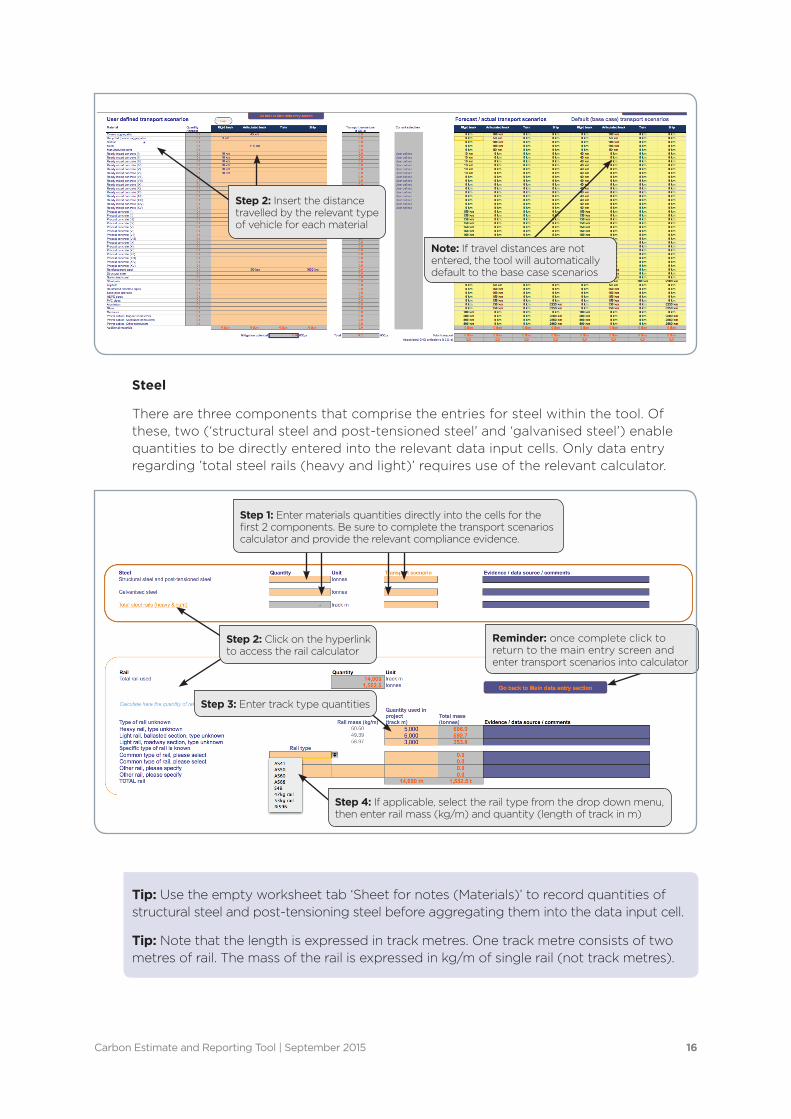
For all materials used across each stage of the project lifecycle, the user is required to select the relevant transport scenario from the orange data input cells. Selection is based on a ‘default domestic’, ‘default imported’ or ‘user defined’ scenario based on transport from the site of manufacture. If details regarding the transport-to-site are not (yet) known, the most relevant default scenario for that material should be used (e.g. default domestic/default imported). When the supplier location is approximately known, the tool user should select ‘user defined’ and complete and/or update the transport calculator (click on ‘Transport scenario’ to be taken to the transport calculator).
Note: Where the transport scenario has not been entered, the tool will automatically revert to default/base case transport scenarios. The default transport scenarios have been estimated based on rounded (conservative) estimates of typical material supply.
Further information on the emission factors used to determine the transport emissions can be found in the ‘Formulas and Background’ tab of the tool.
Entering data
Only data inputs cells can be altered by users. All other parts of the CERT have been locked to prevent unintentional loss of functionality.
Users can use the ‘Tab’ key on their keyboard to move to the next data input cell.
Tip: Workshop the tool
Completing the CERT in a workshop environment with a cross section of the Project team may streamline the process and add value in identifying mitigation measures.
Carbon Estimate and Reporting Tool | September 2015 10
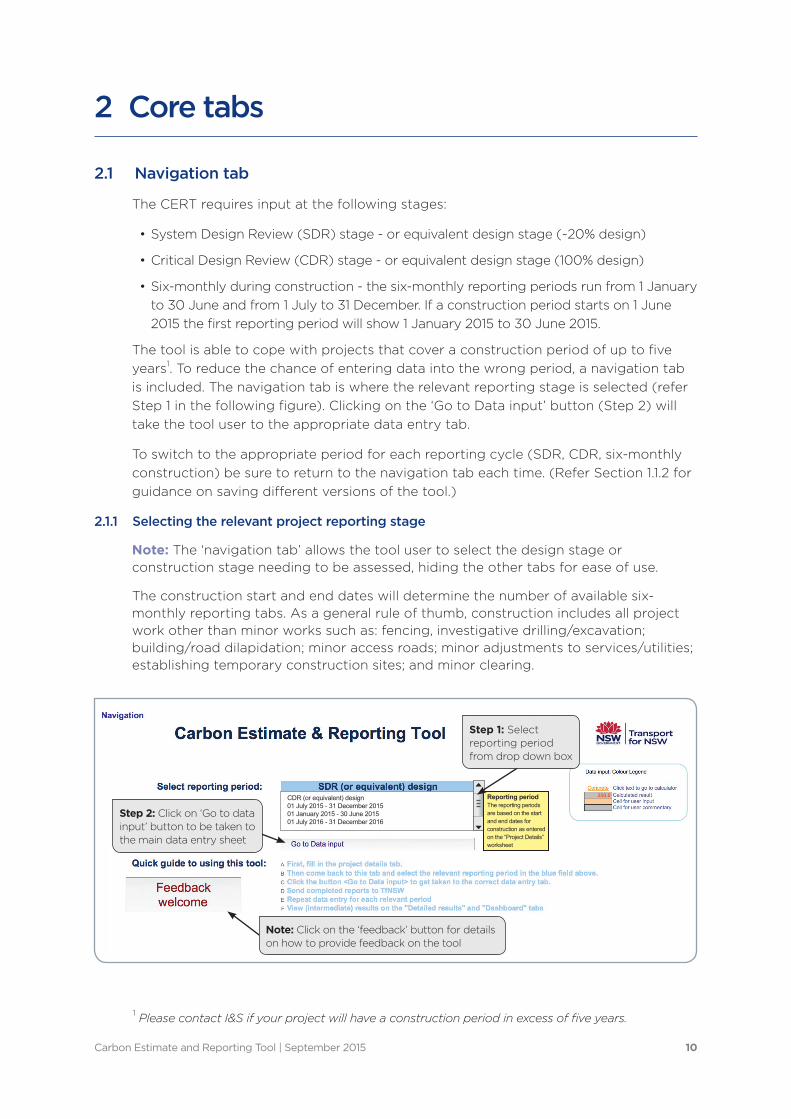
CDR (or equivalent) design 01 July 2015 - 31 December 2015 01 January 2015 - 30 June 2015 01 July 2016 - 31 December 2016
Reporting period The reporting periods are based on the start and end dates for construction as entered on the “Project Details” worksheet
Step 1: Select reporting period from drop down box
Step 2: Click on ‘Go to data input’ button to be taken to the main data entry sheet
Note: Click on the ‘feedback’ button for details on how to provide feedback on the tool
2 Core tabs
2.1 Navigation tab
The CERT requires input at the following stages:
• System Design Review (SDR) stage - or equivalent design stage (~20% design)
• Critical Design Review (CDR) stage - or equivalent design stage (100% design)
• Six-monthly during construction - the six-monthly reporting periods run from 1 January to 30 June and from 1 July to 31 December. If a construction period starts on 1 June 2015 the first reporting period will show 1 January 2015 to 30 June 2015.
The tool is able to cope with projects that cover a construction period of up to five years1. To reduce the chance of entering data into the wrong period, a navigation tab is included. The navigation tab is where the relevant reporting stage is selected (refer Step 1 in the following figure). Clicking on the ‘Go to Data input’ button (Step 2) will take the tool user to the appropriate data entry tab.
To switch to the appropriate period for each reporting cycle (SDR, CDR, six-monthly construction) be sure to return to the navigation tab each time. (Refer Section 1.1.2 for guidance on saving different versions of the tool.)
2.1.1 Selecting the relevant project reporting stage
Note: The ‘navigation tab’ allows the tool user to select the design stage or construction stage needing to be assessed, hiding the other tabs for ease of use.
The construction start and end dates will determine the number of available six-monthly reporting tabs. As a general rule of thumb, construction includes all project work other than minor works such as: fencing, investigative drilling/excavation; building/road dilapidation; minor access roads; minor adjustments to services/utilities; establishing temporary construction sites; and minor clearing.
1 Please contact I&S if your project will have a construction period in excess of five years.
Carbon Estimate and Reporting Tool | September 2015 11
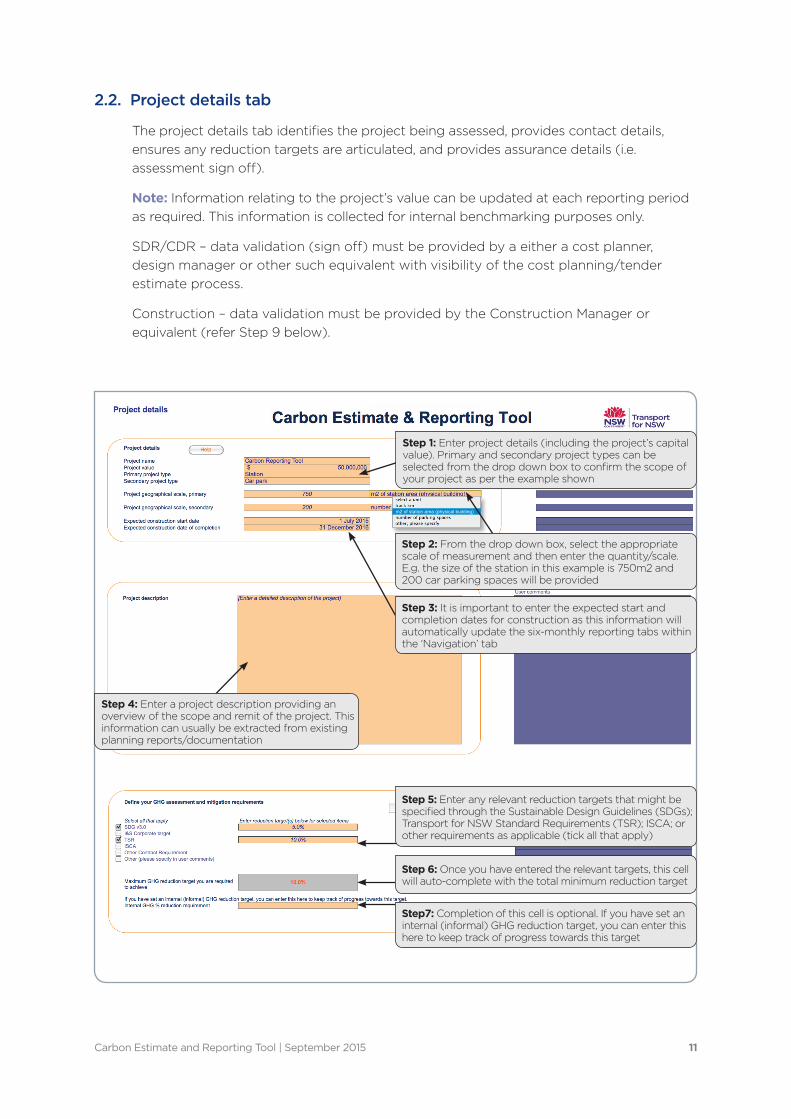
Step 1: Enter project details (including the project’s capital value). Primary and secondary project types can be selected from the drop down box to confirm the scope of your project as per the example shown
Step 3: It is important to enter the expected start and completion dates for construction as this information will automatically update the six-monthly reporting tabs within the ‘Navigation’ tab
Step 5: Enter any relevant reduction targets that might be specified through the Sustainable Design Guidelines (SDGs); Transport for NSW Standard Requirements (TSR); ISCA; or other requirements as applicable (tick all that apply)
Step 4: Enter a project description providing an overview of the scope and remit of the project. This information can usually be extracted from existing planning reports/documentation
Step 6: Once you have entered the relevant targets, this cell will auto-complete with the total minimum reduction target
Step7: Completion of this cell is optional. If you have set an internal (informal) GHG reduction target, you can enter this here to keep track of progress towards this target
m2 of station area (physical building)
Step 2: From the drop down box, select the appropriate scale of measurement and then enter the quantity/scale. E.g. the size of the station in this example is 750m2 and 200 car parking spaces will be provided
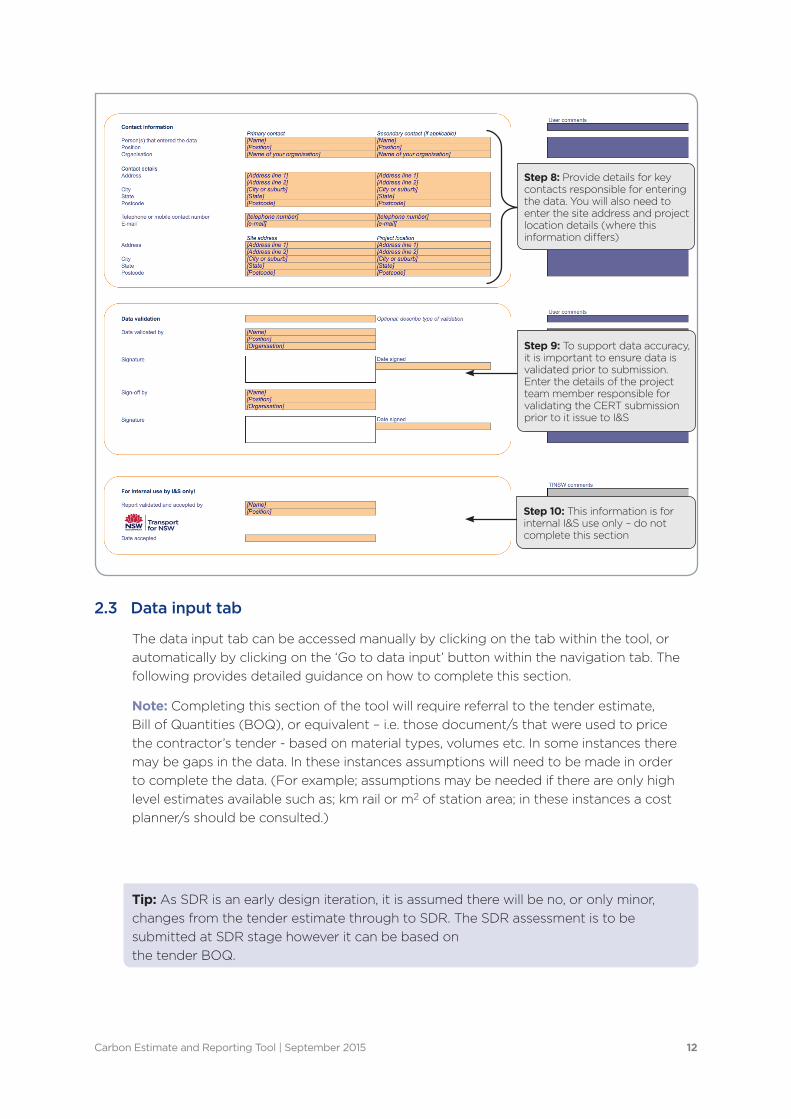
2.2. Project details tab
The project details tab identifies the project being assessed, provides contact details, ensures any reduction targets are articulated, and provides assurance details (i.e. assessment sign off).
Note: Information relating to the project’s value can be updated at each reporting period as required. This information is collected for internal benchmarking purposes only.
SDR/CDR – data validation (sign off) must be provided by a either a cost planner, design manager or other such equivalent with visibility of the cost planning/tender estimate process.
Construction – data validation must be provided by the Construction Manager or equivalent (refer Step 9 below).
Carbon Estimate and Reporting Tool | September 2015 12
Step 8: Provide details for key contacts responsible for entering the data. You will also need to enter the site address and project location details (where this information differs)
Step 9: To support data accuracy, it is important to ensure data is validated prior to submission. Enter the details of the project team member responsible for validating the CERT submission prior to it issue to I&S
Step 10: This information is for internal I&S use only – do not complete this section
2.3 Data input tab
The data input tab can be accessed manually by clicking on the tab within the tool, or automatically by clicking on the ‘Go to data input’ button within the navigation tab. The following provides detailed guidance on how to complete this section.
Note: Completing this section of the tool will require referral to the tender estimate, Bill of Quantities (BOQ), or equivalent – i.e. those document/s that were used to price the contractor’s tender - based on material types, volumes etc. In some instances there may be gaps in the data. In these instances assumptions will need to be made in order to complete the data. (For example; assumptions may be needed if there are only high level estimates available such as; km rail or m2 of station area; in these instances a cost planner/s should be consulted.)
Tip: As SDR is an early design iteration, it is assumed there will be no, or only minor, changes from the tender estimate through to SDR. The SDR assessment is to be submitted at SDR stage however it can be based on the tender BOQ.
Carbon Estimate and Reporting Tool | September 2015 13
Select unit You can enter your data in mass (tonnes) or volume (m3)
m3tonnes
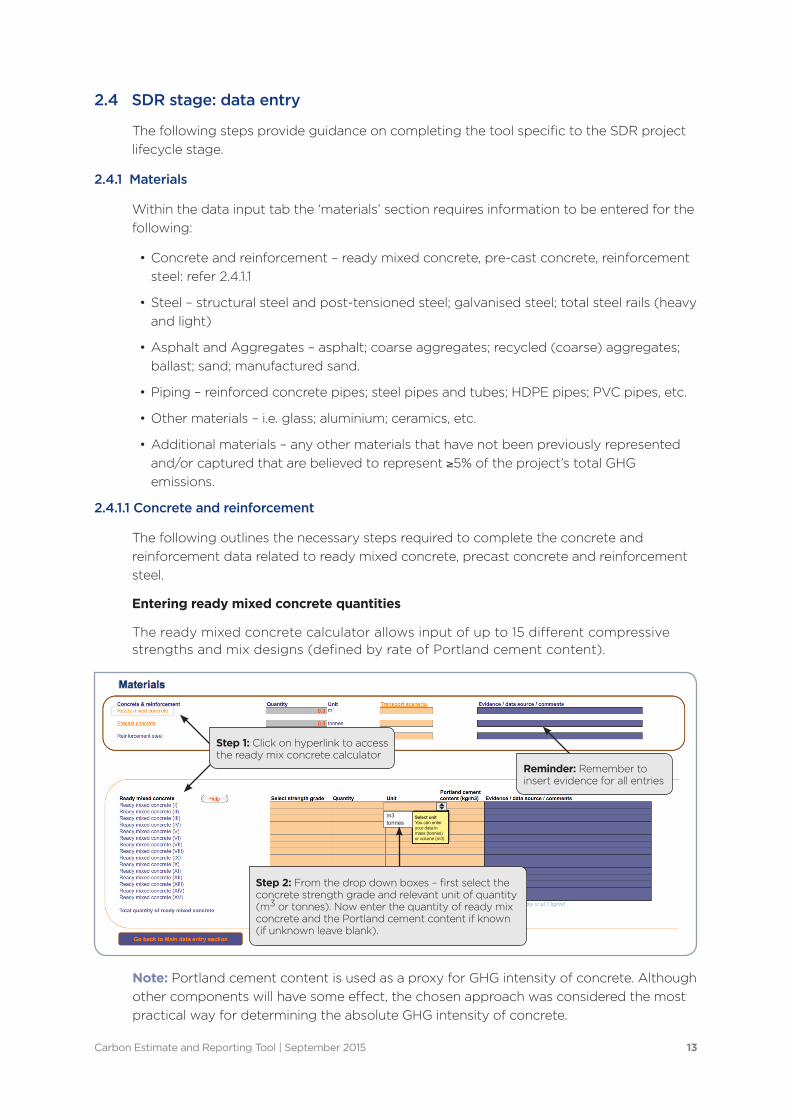
Step 1: Click on hyperlink to access the ready mix concrete calculator
Reminder: Remember to insert evidence for all entries.
Step 2: From the drop down boxes – first select the concrete strength grade and relevant unit of quantity (m3 or tonnes). Now enter the quantity of ready mix concrete and the Portland cement content if known (if unknown leave blank).
2.4 SDR stage: data entry
The following steps provide guidance on completing the tool specific to the SDR project lifecycle stage.
2.4.1 Materials
Within the data input tab the ‘materials’ section requires information to be entered for the following:
• Concrete and reinforcement – ready mixed concrete, pre-cast concrete, reinforcement steel: refer 2.4.1.1
• Steel – structural steel and post-tensioned steel; galvanised steel; total steel rails (heavy and light)
• Asphalt and Aggregates – asphalt; coarse aggregates; recycled (coarse) aggregates; ballast; sand; manufactured sand.
• Piping – reinforced concrete pipes; steel pipes and tubes; HDPE pipes; PVC pipes, etc.
• Other materials – i.e. glass; aluminium; ceramics, etc.
• Additional materials – any other materials that have not been previously represented and/or captured that are believed to represent ≥5% of the project’s total GHG emissions.
2.4.1.1 Concrete and reinforcement
The following outlines the necessary steps required to complete the concrete and reinforcement data related to ready mixed concrete, precast concrete and reinforcement steel.
Entering ready mixed concrete quantities
The ready mixed concrete calculator allows input of up to 15 different compressive strengths and mix designs (defined by rate of Portland cement content).
Note: Portland cement content is used as a proxy for GHG intensity of concrete. Although other components will have some effect, the chosen approach was considered the most practical way for determining the absolute GHG intensity of concrete.
Carbon Estimate and Reporting Tool | September 2015 14
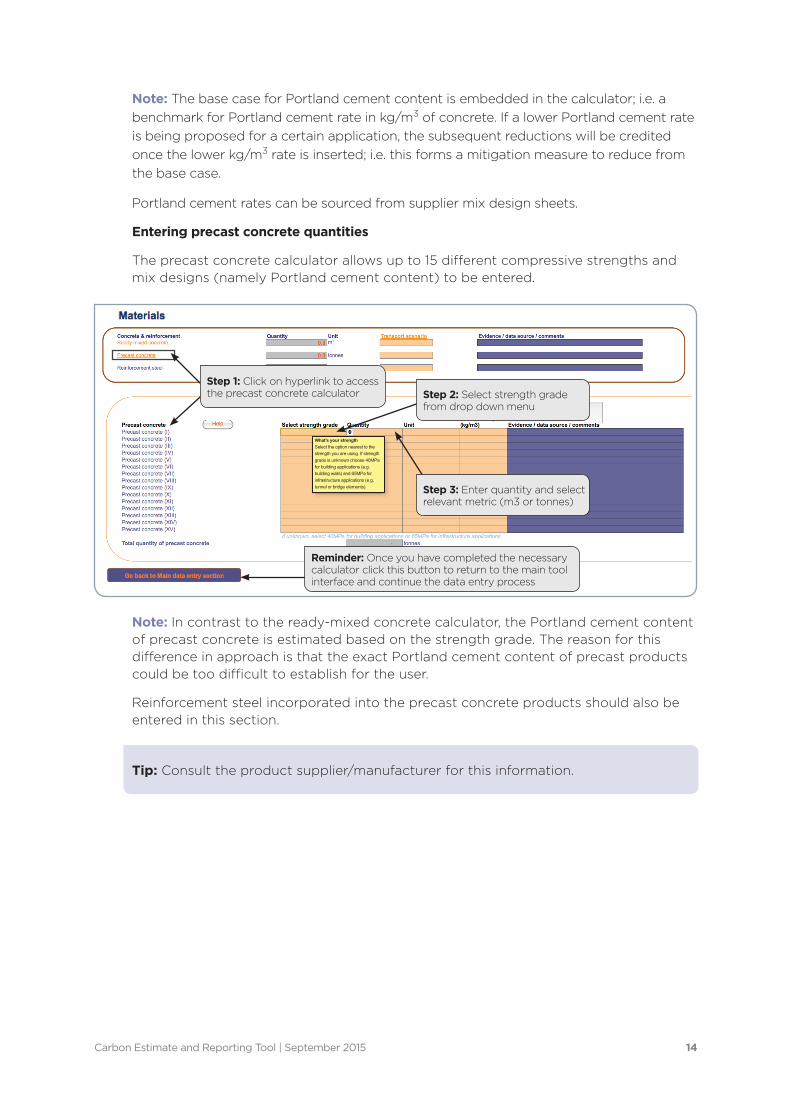
What’s your strength Select the option nearest to the strength you are using. If strength grade is unknown choose 40MPa for building applications (e.g. building walls) and 65MPa for infrastructure applications (e.g. tunnel or bridge elements).
Step 1: Click on hyperlink to access the precast concrete calculator Step 2: Select strength grade
from drop down menu
Step 3: Enter quantity and select relevant metric (m3 or tonnes)
Reminder: Once you have completed the necessary calculator click this button to return to the main tool interface and continue the data entry process
Note: The base case for Portland cement content is embedded in the calculator; i.e. a benchmark for Portland cement rate in kg/m3 of concrete. If a lower Portland cement rate is being proposed for a certain application, the subsequent reductions will be credited once the lower kg/m3 rate is inserted; i.e. this forms a mitigation measure to reduce from the base case.
Portland cement rates can be sourced from supplier mix design sheets.
Entering precast concrete quantities
The precast concrete calculator allows up to 15 different compressive strengths and mix designs (namely Portland cement content) to be entered.
Note: In contrast to the ready-mixed concrete calculator, the Portland cement content of precast concrete is estimated based on the strength grade. The reason for this difference in approach is that the exact Portland cement content of precast products could be too difficult to establish for the user.
Reinforcement steel incorporated into the precast concrete products should also be entered in this section.
Tip: Consult the product supplier/manufacturer for this information.
Carbon Estimate and Reporting Tool | September 2015 15
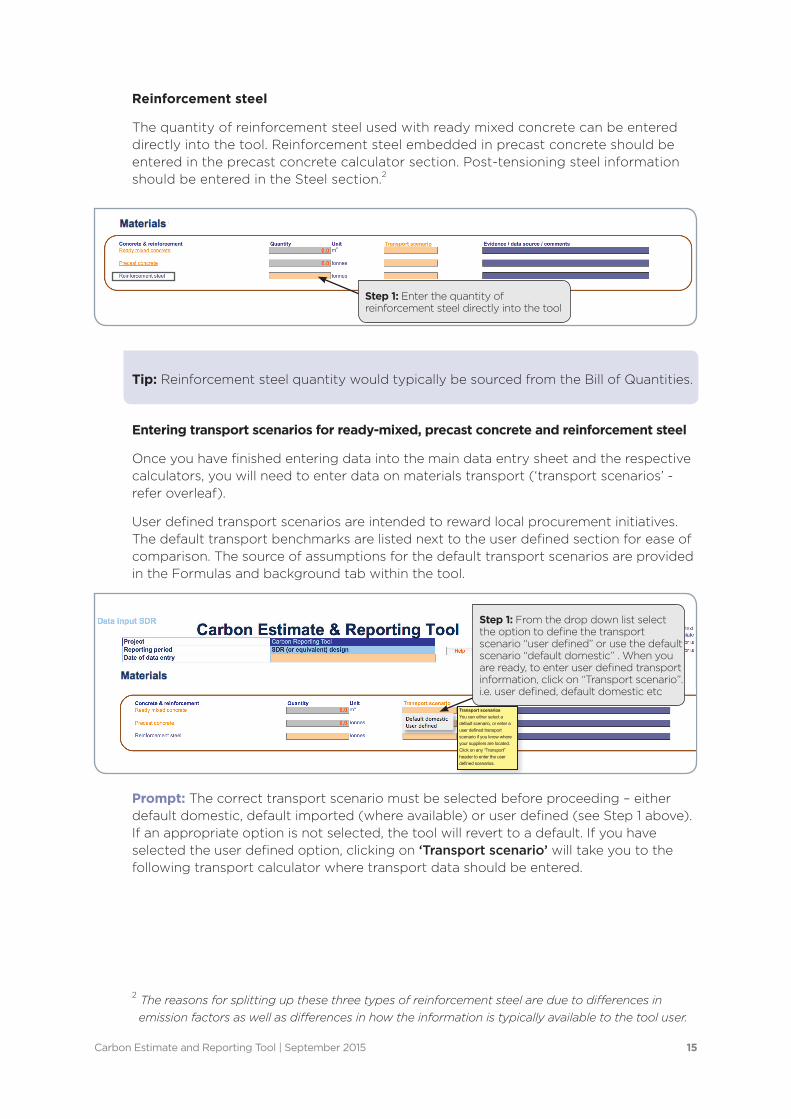
Transport scenarios You can either select a default scenario, or enter a user defined transport scenario if you know where your suppliers are located. Click on any “Transport” header to enter the user defined scenarios.
Step 1: Enter the quantity of reinforcement steel directly into the tool
Step 1: From the drop down list select the option to define the transport scenario “user defined” or use the default scenario “default domestic” . When you are ready, to enter user defined transport information, click on “Transport scenario”. i.e. user defined, default domestic etc
2 The reasons for splitting up these three types of reinforcement steel are due to differences in emission factors as well as differences in how the information is typically available to the tool user.
Reinforcement steel
The quantity of reinforcement steel used with ready mixed concrete can be entered directly into the tool. Reinforcement steel embedded in precast concrete should be entered in the precast concrete calculator section. Post-tensioning steel information should be entered in the Steel section.2
Tip: Reinforcement steel quantity would typically be sourced from the Bill of Quantities.
Entering transport scenarios for ready-mixed, precast concrete and reinforcement steel
Once you have finished entering data into the main data entry sheet and the respective calculators, you will need to enter data on materials transport (‘transport scenarios’ - refer overleaf).
User defined transport scenarios are intended to reward local procurement initiatives. The default transport benchmarks are listed next to the user defined section for ease of comparison. The source of assumptions for the default transport scenarios are provided in the Formulas and background tab within the tool. Prompt: The correct transport scenario must be selected before proceeding – either default domestic, default imported (where available) or user defined (see Step 1 above). If an appropriate option is not selected, the tool will revert to a default. If you have selected the user defined option, clicking on ‘Transport scenario’ will take you to the following transport calculator where transport data should be entered.
Carbon Estimate and Reporting Tool | September 2015 16
Step 2: Insert the distance travelled by the relevant type of vehicle for each material
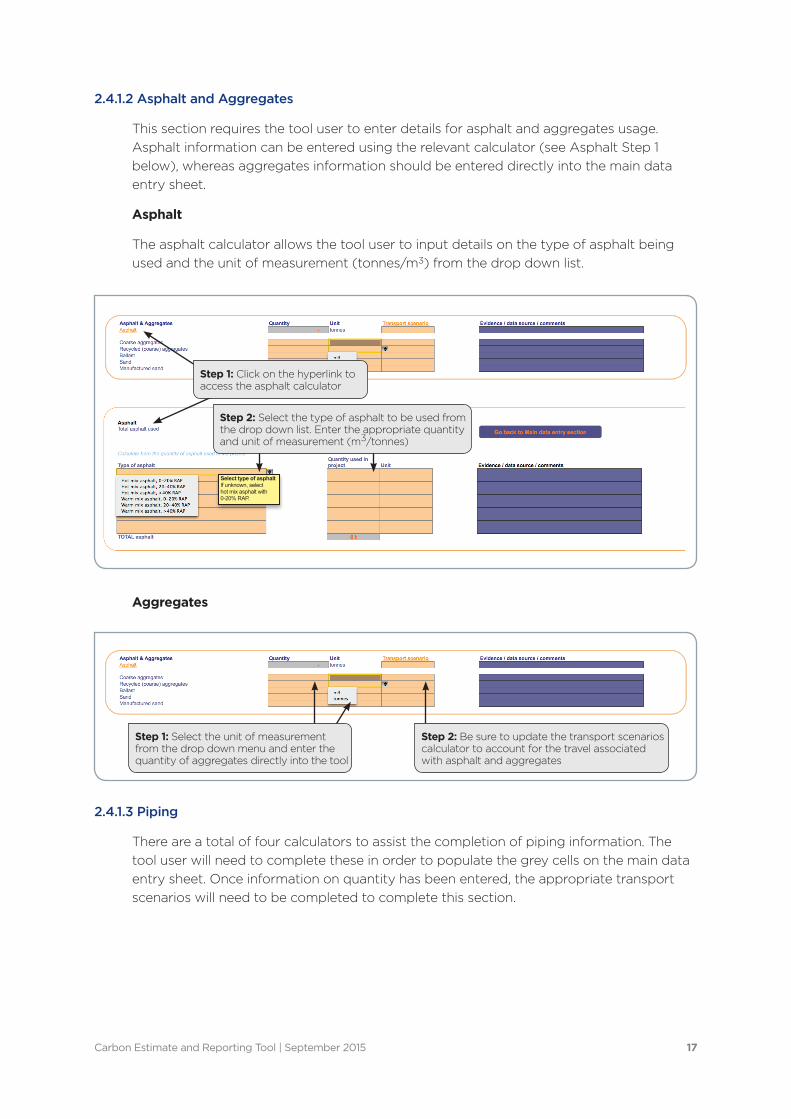
Step 3: Enter track type quantities
Step 4: If applicable, select the rail type from the drop down menu, then enter rail mass (kg/m) and quantity (length of track in m)
Note: If travel distances are not entered, the tool will automatically default to the base case scenarios
Step 1: Enter materials quantities directly into the cells for the first 2 components. Be sure to complete the transport scenarios calculator and provide the relevant compliance evidence.
Step 2: Click on the hyperlink to access the rail calculator
Reminder: once complete click to return to the main entry screen and enter transport scenarios into calculator
Steel
There are three components that comprise the entries for steel within the tool. Of these, two (‘structural steel and post-tensioned steel’ and ‘galvanised steel’) enable quantities to be directly entered into the relevant data input cells. Only data entry regarding ’total steel rails (heavy and light)’ requires use of the relevant calculator.
Tip: Use the empty worksheet tab ‘Sheet for notes (Materials)’ to record quantities of structural steel and post-tensioning steel before aggregating them into the data input cell.
Tip: Note that the length is expressed in track metres. One track metre consists of two metres of rail. The mass of the rail is expressed in kg/m of single rail (not track metres).
Carbon Estimate and Reporting Tool | September 2015 17
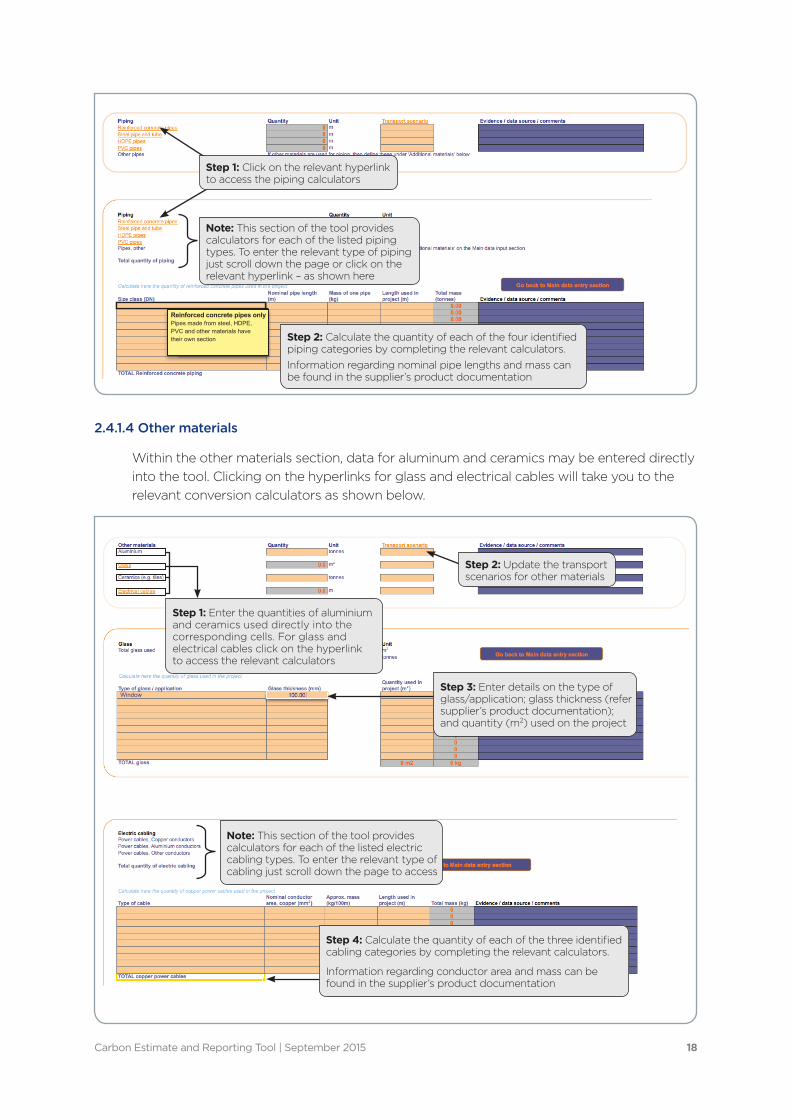
Select type of asphalt If unknown, select hot mix asphalt with 0-20% RAP.
Step 1: Click on the hyperlink to access the asphalt calculator
Step 1: Select the unit of measurement from the drop down menu and enter the quantity of aggregates directly into the tool
Step 2: Be sure to update the transport scenarios calculator to account for the travel associated with asphalt and aggregates
Step 2: Select the type of asphalt to be used from the drop down list. Enter the appropriate quantity and unit of measurement (m3/tonnes)
2.4.1.2 Asphalt and Aggregates
This section requires the tool user to enter details for asphalt and aggregates usage. Asphalt information can be entered using the relevant calculator (see Asphalt Step 1 below), whereas aggregates information should be entered directly into the main data entry sheet.
Asphalt
The asphalt calculator allows the tool user to input details on the type of asphalt being used and the unit of measurement (tonnes/m3) from the drop down list.
Aggregates
2.4.1.3 Piping
There are a total of four calculators to assist the completion of piping information. The tool user will need to complete these in order to populate the grey cells on the main data entry sheet. Once information on quantity has been entered, the appropriate transport scenarios will need to be completed to complete this section.
Carbon Estimate and Reporting Tool | September 2015 18
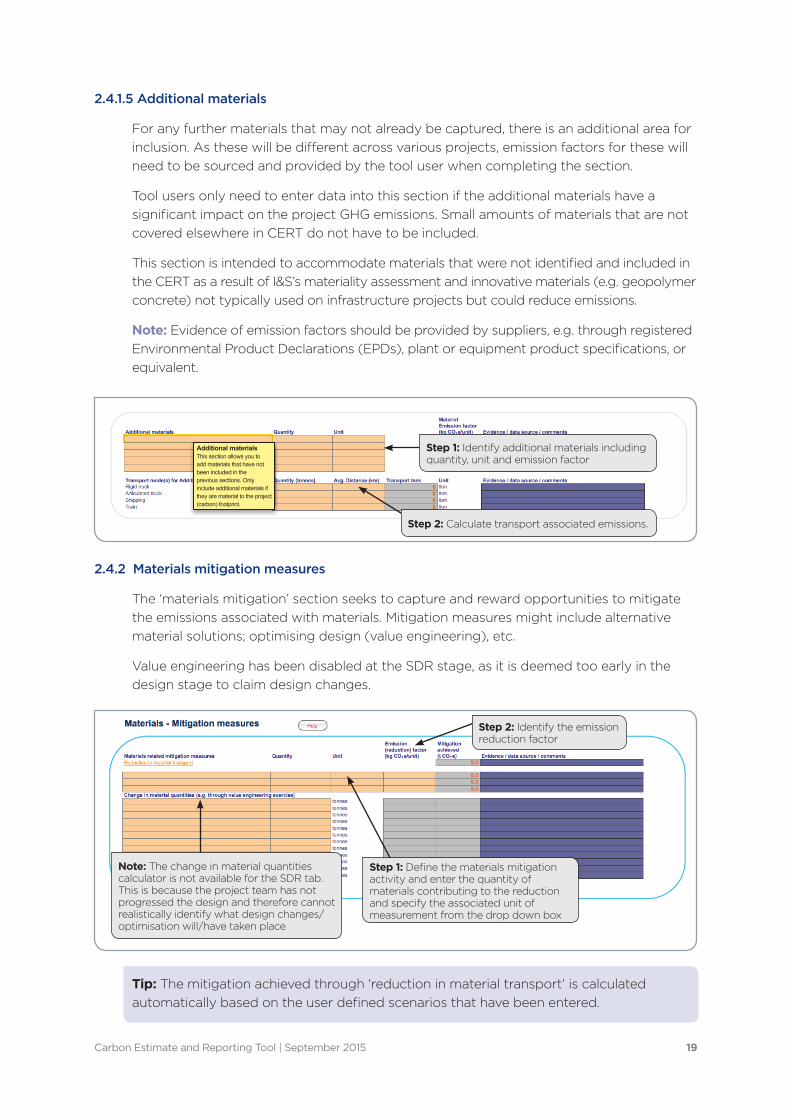
Step 4: Calculate the quantity of each of the three identified cabling categories by completing the relevant calculators.
Information regarding conductor area and mass can be found in the supplier’s product documentation
Window
Reinforced concrete pipes only Pipes made from steel, HDPE, PVC and other materials have their own section
Note: This section of the tool provides calculators for each of the listed piping types. To enter the relevant type of piping just scroll down the page or click on the relevant hyperlink – as shown here
Step 2: Calculate the quantity of each of the four identified piping categories by completing the relevant calculators.Information regarding nominal pipe lengths and mass can be found in the supplier’s product documentation
Step 1: Click on the relevant hyperlink to access the piping calculators
Step 1: Enter the quantities of aluminium and ceramics used directly into the corresponding cells. For glass and electrical cables click on the hyperlink to access the relevant calculators
Note: This section of the tool provides calculators for each of the listed electric cabling types. To enter the relevant type of cabling just scroll down the page to access
Step 2: Update the transport scenarios for other materials
Step 3: Enter details on the type of glass/application; glass thickness (refer supplier’s product documentation); and quantity (m2) used on the project
2.4.1.4 Other materials
Within the other materials section, data for aluminum and ceramics may be entered directly into the tool. Clicking on the hyperlinks for glass and electrical cables will take you to the relevant conversion calculators as shown below.
Carbon Estimate and Reporting Tool | September 2015 19
Additional materials This section allows you to add materials that have not been included in the previous sections. Only include additional materials if they are material to the project (carbon) footprint.
Step 1: Identify additional materials including quantity, unit and emission factor
Step 1: Define the materials mitigation activity and enter the quantity of materials contributing to the reduction and specify the associated unit of measurement from the drop down box
Step 2: Identify the emission reduction factor
Note: The change in material quantities calculator is not available for the SDR tab. This is because the project team has not progressed the design and therefore cannot realistically identify what design changes/optimisation will/have taken place
Step 2: Calculate transport associated emissions.
2.4.1.5 Additional materials
For any further materials that may not already be captured, there is an additional area for inclusion. As these will be different across various projects, emission factors for these will need to be sourced and provided by the tool user when completing the section.
Tool users only need to enter data into this section if the additional materials have a significant impact on the project GHG emissions. Small amounts of materials that are not covered elsewhere in CERT do not have to be included.
This section is intended to accommodate materials that were not identified and included in the CERT as a result of I&S’s materiality assessment and innovative materials (e.g. geopolymer concrete) not typically used on infrastructure projects but could reduce emissions.
Note: Evidence of emission factors should be provided by suppliers, e.g. through registered Environmental Product Declarations (EPDs), plant or equipment product specifications, or equivalent.
2.4.2 Materials mitigation measures
The ‘materials mitigation’ section seeks to capture and reward opportunities to mitigate the emissions associated with materials. Mitigation measures might include alternative material solutions; optimising design (value engineering), etc.
Value engineering has been disabled at the SDR stage, as it is deemed too early in the design stage to claim design changes.
Tip: The mitigation achieved through ‘reduction in material transport’ is calculated automatically based on the user defined scenarios that have been entered.
Carbon Estimate and Reporting Tool | September 2015 20
Equipment type Identify the equipment types used on the project
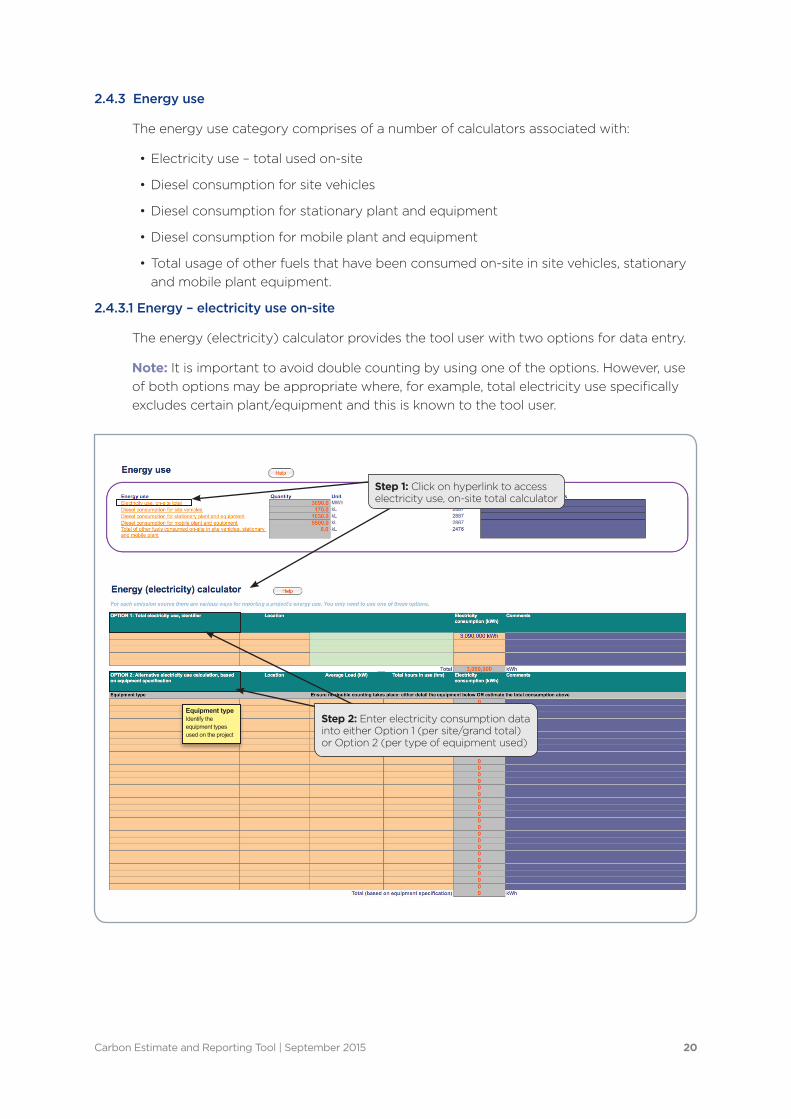
Step 1: Click on hyperlink to access electricity use, on-site total calculator
Step 2: Enter electricity consumption data into either Option 1 (per site/grand total) or Option 2 (per type of equipment used)
2.4.3 Energy use
The energy use category comprises of a number of calculators associated with:
• Electricity use – total used on-site
• Diesel consumption for site vehicles
• Diesel consumption for stationary plant and equipment
• Diesel consumption for mobile plant and equipment
• Total usage of other fuels that have been consumed on-site in site vehicles, stationary and mobile plant equipment.
2.4.3.1 Energy – electricity use on-site
The energy (electricity) calculator provides the tool user with two options for data entry.
Note: It is important to avoid double counting by using one of the options. However, use of both options may be appropriate where, for example, total electricity use specifically excludes certain plant/equipment and this is known to the tool user.
Carbon Estimate and Reporting Tool | September 2015 21
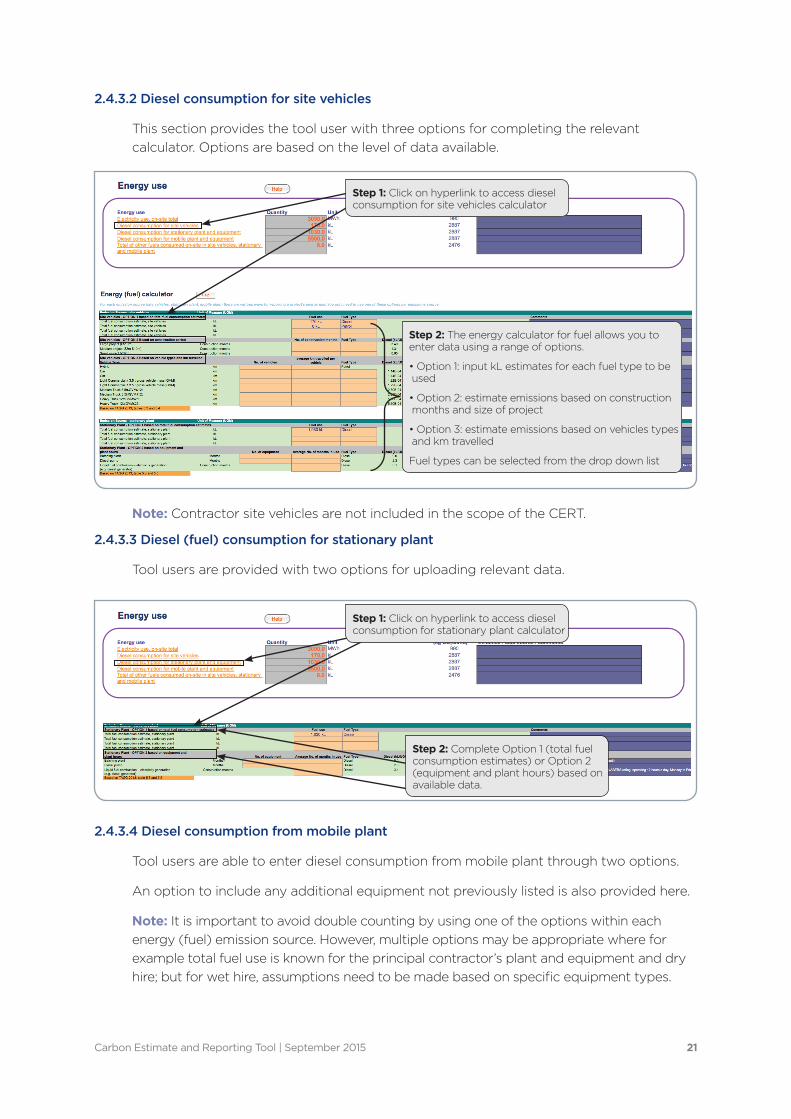
Step 2: The energy calculator for fuel allows you to enter data using a range of options.
• Option 1: input kL estimates for each fuel type to be used
• Option 2: estimate emissions based on construction months and size of project
• Option 3: estimate emissions based on vehicles types and km travelled
Fuel types can be selected from the drop down list
Step 2: Complete Option 1 (total fuel consumption estimates) or Option 2 (equipment and plant hours) based on available data.
Step 1: Click on hyperlink to access diesel consumption for stationary plant calculator
Step 1: Click on hyperlink to access diesel consumption for site vehicles calculator
2.4.3.2 Diesel consumption for site vehicles
This section provides the tool user with three options for completing the relevant calculator. Options are based on the level of data available.
Note: Contractor site vehicles are not included in the scope of the CERT.
2.4.3.3 Diesel (fuel) consumption for stationary plant
Tool users are provided with two options for uploading relevant data.
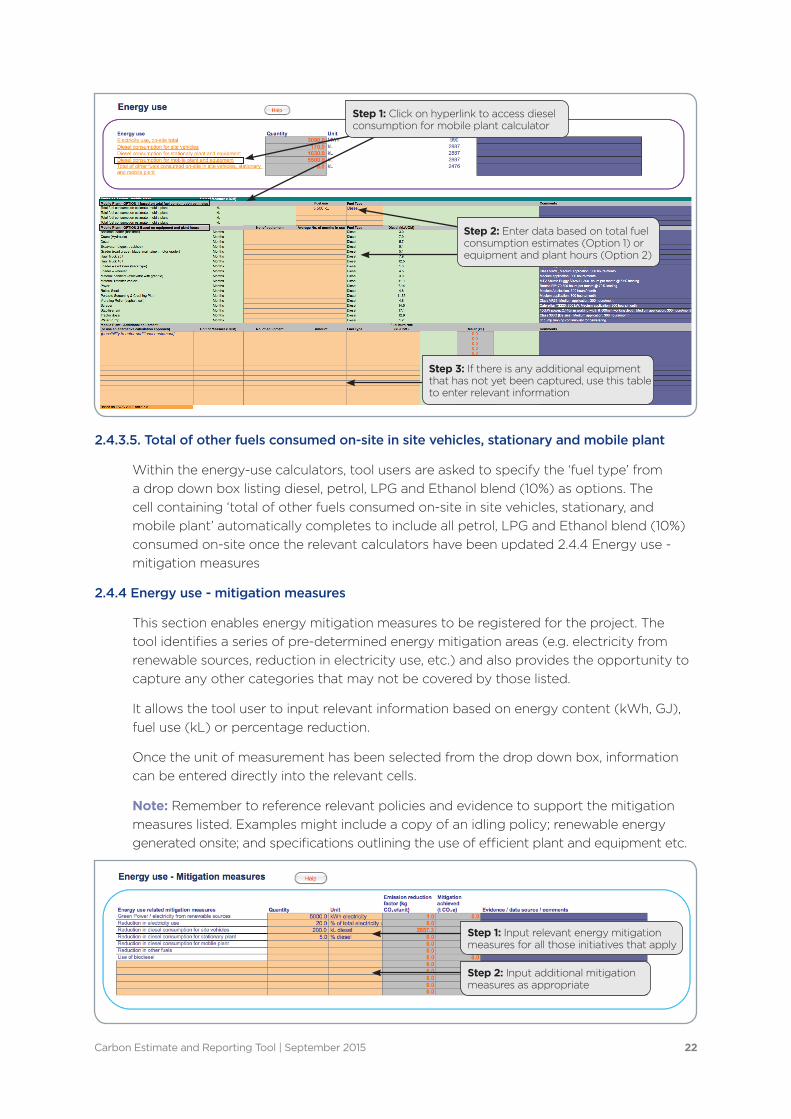
2.4.3.4 Diesel consumption from mobile plant
Tool users are able to enter diesel consumption from mobile plant through two options.
An option to include any additional equipment not previously listed is also provided here.
Note: It is important to avoid double counting by using one of the options within each energy (fuel) emission source. However, multiple options may be appropriate where for example total fuel use is known for the principal contractor’s plant and equipment and dry hire; but for wet hire, assumptions need to be made based on specific equipment types.
Carbon Estimate and Reporting Tool | September 2015 22
Step 1: Input relevant energy mitigation measures for all those initiatives that apply
Step 2: Input additional mitigation measures as appropriate
Step 1: Click on hyperlink to access diesel consumption for mobile plant calculator
Step 3: If there is any additional equipment that has not yet been captured, use this table to enter relevant information
Step 2: Enter data based on total fuel consumption estimates (Option 1) or equipment and plant hours (Option 2)
2.4.3.5. Total of other fuels consumed on-site in site vehicles, stationary and mobile plant
Within the energy-use calculators, tool users are asked to specify the ‘fuel type’ from a drop down box listing diesel, petrol, LPG and Ethanol blend (10%) as options. The cell containing ‘total of other fuels consumed on-site in site vehicles, stationary, and mobile plant’ automatically completes to include all petrol, LPG and Ethanol blend (10%) consumed on-site once the relevant calculators have been updated 2.4.4 Energy use - mitigation measures
2.4.4 Energy use - mitigation measures
This section enables energy mitigation measures to be registered for the project. The tool identifies a series of pre-determined energy mitigation areas (e.g. electricity from renewable sources, reduction in electricity use, etc.) and also provides the opportunity to capture any other categories that may not be covered by those listed.
It allows the tool user to input relevant information based on energy content (kWh, GJ), fuel use (kL) or percentage reduction.
Once the unit of measurement has been selected from the drop down box, information can be entered directly into the relevant cells.
Note: Remember to reference relevant policies and evidence to support the mitigation measures listed. Examples might include a copy of an idling policy; renewable energy generated onsite; and specifications outlining the use of efficient plant and equipment etc.
Carbon Estimate and Reporting Tool | September 2015 23
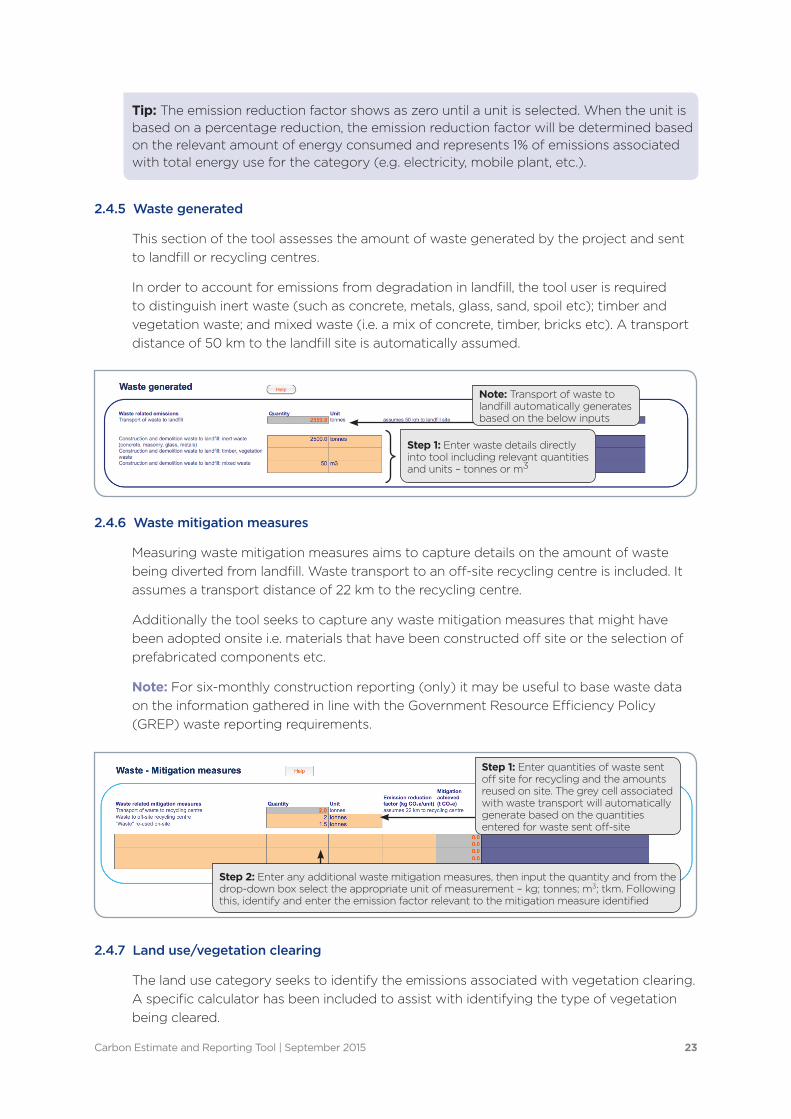
Note: Transport of waste to landfill automatically generates based on the below inputs
Step 1: Enter waste details directly into tool including relevant quantities and units – tonnes or m3
Step 2: Enter any additional waste mitigation measures, then input the quantity and from the drop-down box select the appropriate unit of measurement – kg; tonnes; m3; tkm. Following this, identify and enter the emission factor relevant to the mitigation measure identified
Step 1: Enter quantities of waste sent off site for recycling and the amounts reused on site. The grey cell associated with waste transport will automatically generate based on the quantities entered for waste sent off-site
Tip: The emission reduction factor shows as zero until a unit is selected. When the unit is based on a percentage reduction, the emission reduction factor will be determined based on the relevant amount of energy consumed and represents 1% of emissions associated with total energy use for the category (e.g. electricity, mobile plant, etc.).
2.4.5 Waste generated
This section of the tool assesses the amount of waste generated by the project and sent to landfill or recycling centres.
In order to account for emissions from degradation in landfill, the tool user is required to distinguish inert waste (such as concrete, metals, glass, sand, spoil etc); timber and vegetation waste; and mixed waste (i.e. a mix of concrete, timber, bricks etc). A transport distance of 50 km to the landfill site is automatically assumed.
2.4.6 Waste mitigation measures
Measuring waste mitigation measures aims to capture details on the amount of waste being diverted from landfill. Waste transport to an off-site recycling centre is included. It assumes a transport distance of 22 km to the recycling centre.
Additionally the tool seeks to capture any waste mitigation measures that might have been adopted onsite i.e. materials that have been constructed off site or the selection of prefabricated components etc.
Note: For six-monthly construction reporting (only) it may be useful to base waste data on the information gathered in line with the Government Resource Efficiency Policy (GREP) waste reporting requirements.
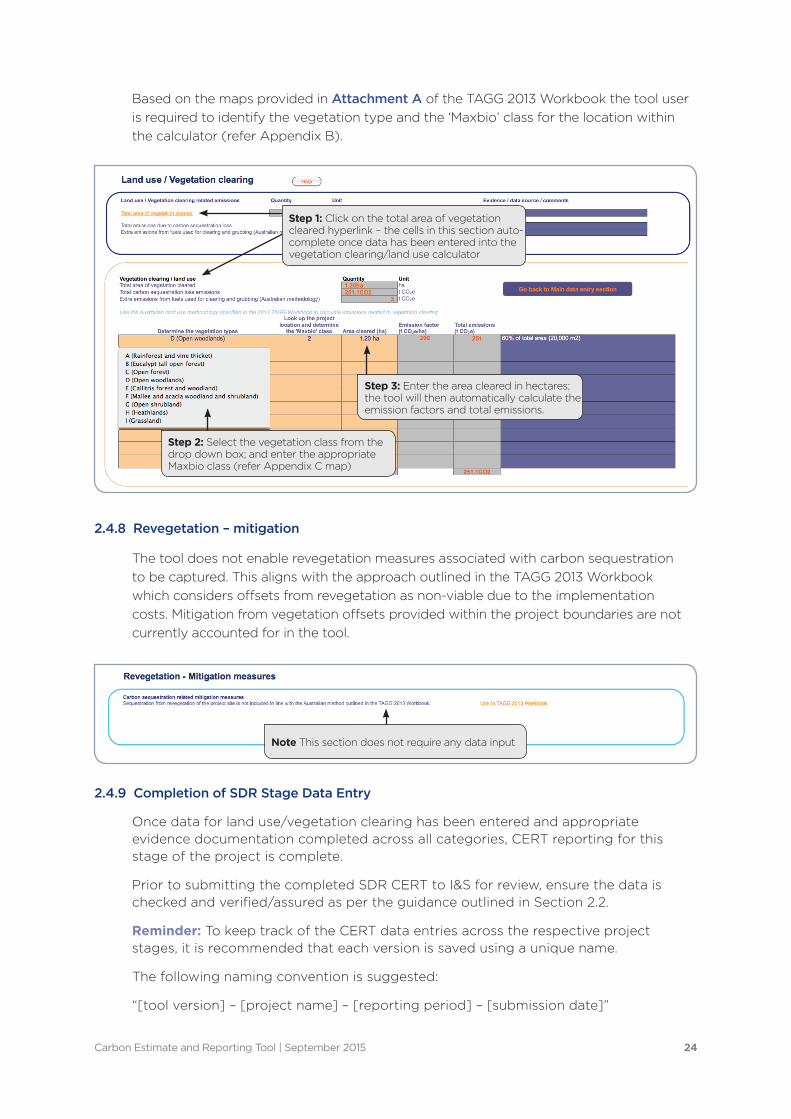
2.4.7 Land use/vegetation clearing
The land use category seeks to identify the emissions associated with vegetation clearing. A specific calculator has been included to assist with identifying the type of vegetation being cleared.
Carbon Estimate and Reporting Tool | September 2015 24
Note This section does not require any data input
Step 1: Click on the total area of vegetation cleared hyperlink – the cells in this section auto-complete once data has been entered into the vegetation clearing/land use calculator
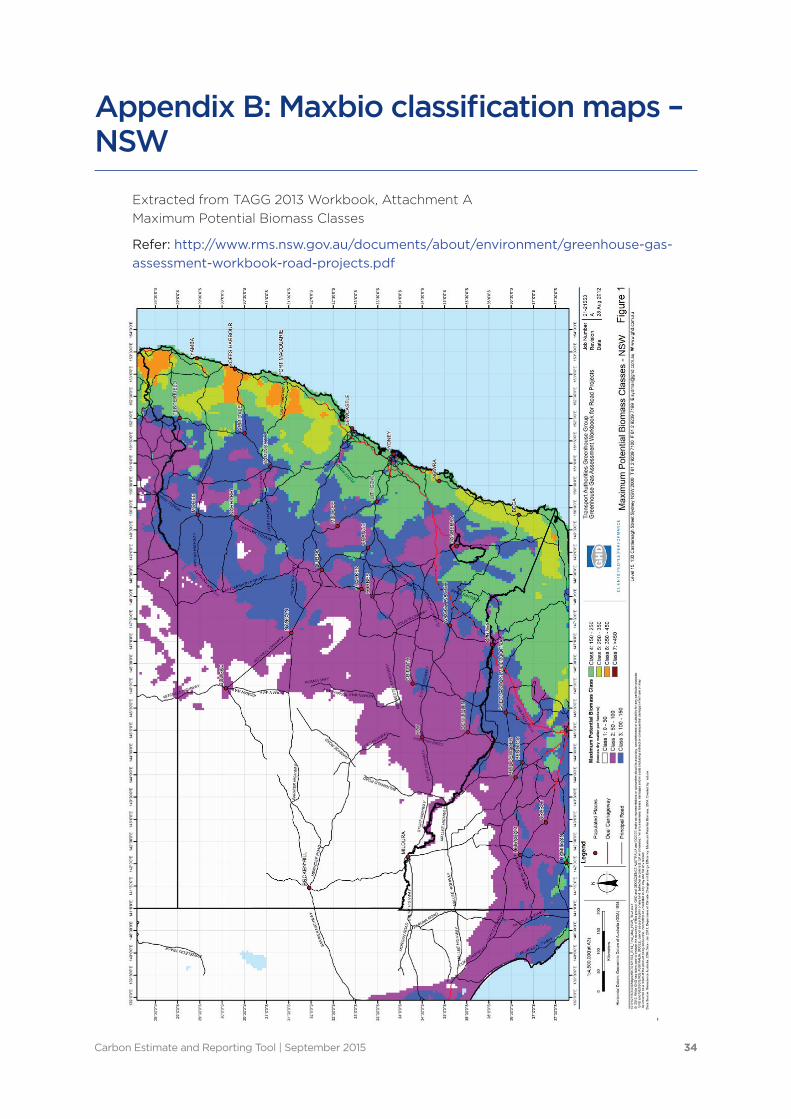
Step 2: Select the vegetation class from the drop down box; and enter the appropriate Maxbio class (refer Appendix C map)
Step 3: Enter the area cleared in hectares; the tool will then automatically calculate the emission factors and total emissions.
Based on the maps provided in Attachment A of the TAGG 2013 Workbook the tool user is required to identify the vegetation type and the ‘Maxbio’ class for the location within the calculator (refer Appendix B).
2.4.8 Revegetation – mitigation
The tool does not enable revegetation measures associated with carbon sequestration to be captured. This aligns with the approach outlined in the TAGG 2013 Workbook which considers offsets from revegetation as non-viable due to the implementation costs. Mitigation from vegetation offsets provided within the project boundaries are not currently accounted for in the tool.
2.4.9 Completion of SDR Stage Data Entry
Once data for land use/vegetation clearing has been entered and appropriate evidence documentation completed across all categories, CERT reporting for this stage of the project is complete.
Prior to submitting the completed SDR CERT to I&S for review, ensure the data is checked and verified/assured as per the guidance outlined in Section 2.2.
Reminder: To keep track of the CERT data entries across the respective project stages, it is recommended that each version is saved using a unique name.
The following naming convention is suggested:
“[tool version] – [project name] – [reporting period] – [submission date]”
Carbon Estimate and Reporting Tool | September 2015 25
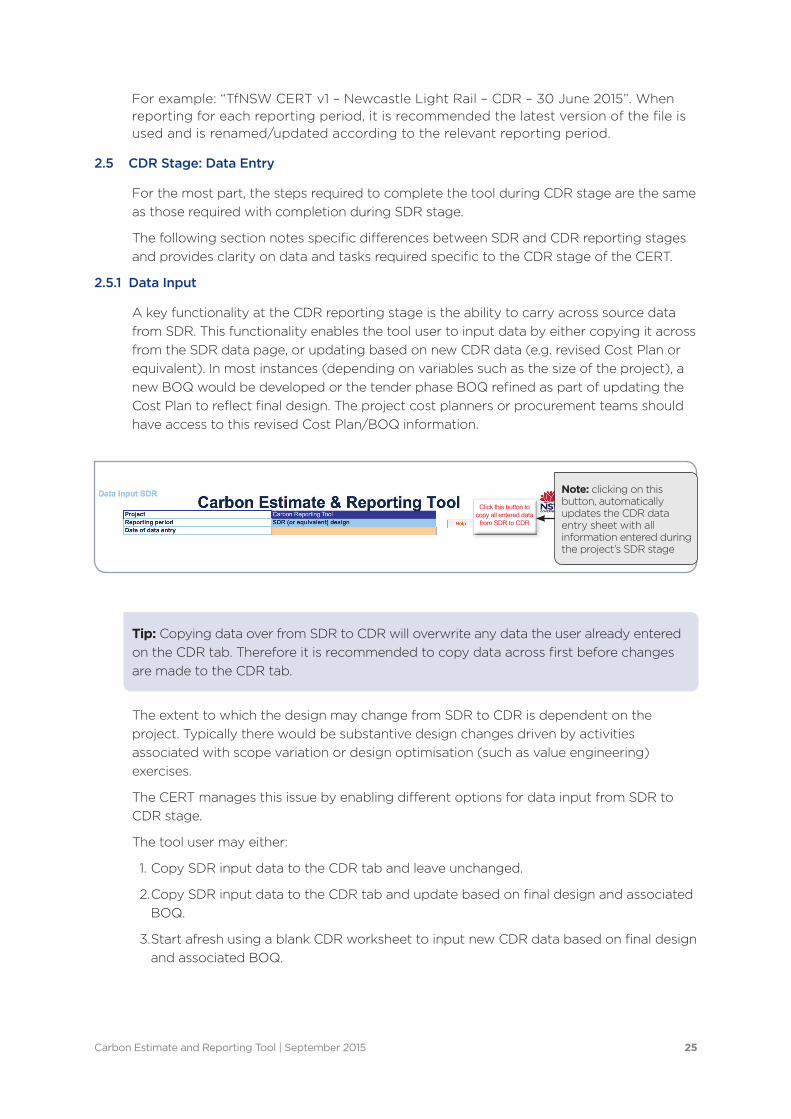
Click this button to copy all entered data
from SDR to CDR
Note: clicking on this button, automatically updates the CDR data entry sheet with all information entered during the project’s SDR stage
For example: “TfNSW CERT v1 – Newcastle Light Rail – CDR – 30 June 2015”. When reporting for each reporting period, it is recommended the latest version of the file is used and is renamed/updated according to the relevant reporting period.
2.5 CDR Stage: Data Entry
For the most part, the steps required to complete the tool during CDR stage are the same as those required with completion during SDR stage.
The following section notes specific differences between SDR and CDR reporting stages and provides clarity on data and tasks required specific to the CDR stage of the CERT.
2.5.1 Data Input
A key functionality at the CDR reporting stage is the ability to carry across source data from SDR. This functionality enables the tool user to input data by either copying it across from the SDR data page, or updating based on new CDR data (e.g. revised Cost Plan or equivalent). In most instances (depending on variables such as the size of the project), a new BOQ would be developed or the tender phase BOQ refined as part of updating the Cost Plan to reflect final design. The project cost planners or procurement teams should have access to this revised Cost Plan/BOQ information.
Tip: Copying data over from SDR to CDR will overwrite any data the user already entered on the CDR tab. Therefore it is recommended to copy data across first before changes are made to the CDR tab.
The extent to which the design may change from SDR to CDR is dependent on the project. Typically there would be substantive design changes driven by activities associated with scope variation or design optimisation (such as value engineering) exercises.
The CERT manages this issue by enabling different options for data input from SDR to CDR stage.
The tool user may either:
1. Copy SDR input data to the CDR tab and leave unchanged.
2. Copy SDR input data to the CDR tab and update based on final design and associated BOQ.
3. Start afresh using a blank CDR worksheet to input new CDR data based on final design and associated BOQ.
Carbon Estimate and Reporting Tool | September 2015 26
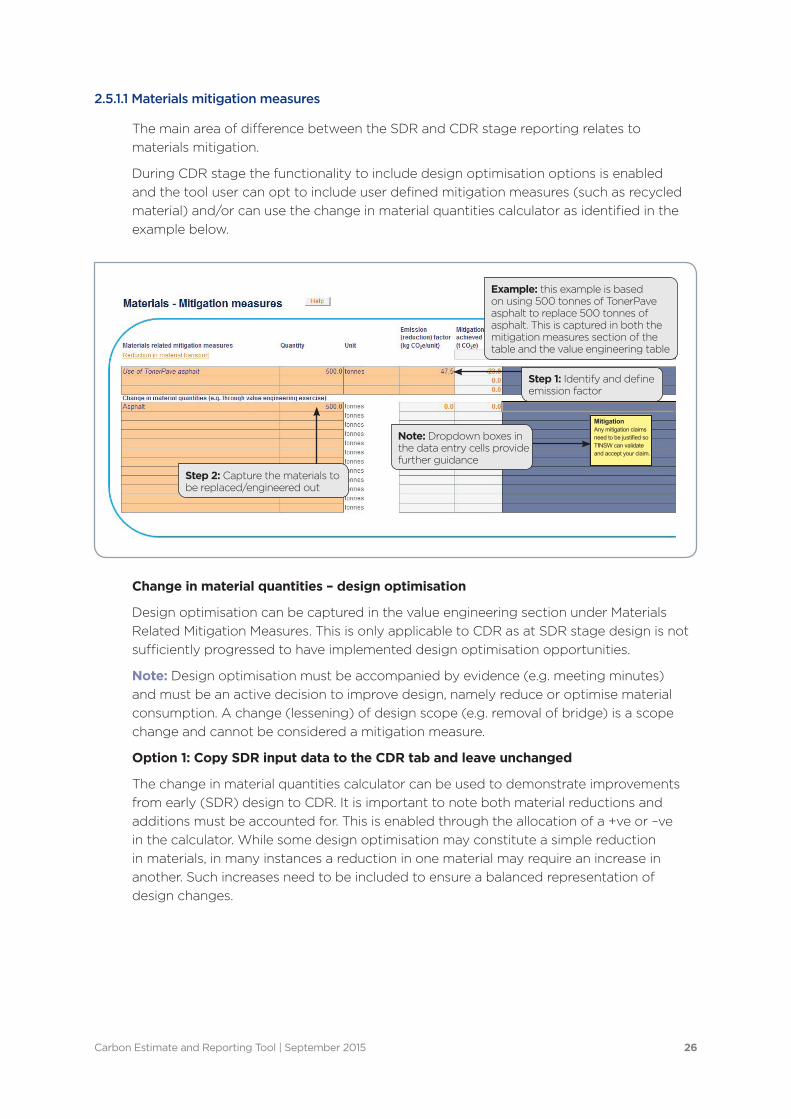
Example: this example is based on using 500 tonnes of TonerPave asphalt to replace 500 tonnes of asphalt. This is captured in both the mitigation measures section of the table and the value engineering table
Step 1: Identify and define emission factor
Note: Dropdown boxes in the data entry cells provide further guidance
Step 2: Capture the materials to be replaced/engineered out
Mitigation Any mitigation claims need to be justified so TfNSW can validate and accept your claim.
2.5.1.1 Materials mitigation measures
The main area of difference between the SDR and CDR stage reporting relates to materials mitigation.
During CDR stage the functionality to include design optimisation options is enabled and the tool user can opt to include user defined mitigation measures (such as recycled material) and/or can use the change in material quantities calculator as identified in the example below.
Change in material quantities – design optimisation
Design optimisation can be captured in the value engineering section under Materials Related Mitigation Measures. This is only applicable to CDR as at SDR stage design is not sufficiently progressed to have implemented design optimisation opportunities.
Note: Design optimisation must be accompanied by evidence (e.g. meeting minutes) and must be an active decision to improve design, namely reduce or optimise material consumption. A change (lessening) of design scope (e.g. removal of bridge) is a scope change and cannot be considered a mitigation measure.
Option 1: Copy SDR input data to the CDR tab and leave unchanged
The change in material quantities calculator can be used to demonstrate improvements from early (SDR) design to CDR. It is important to note both material reductions and additions must be accounted for. This is enabled through the allocation of a +ve or –ve in the calculator. While some design optimisation may constitute a simple reduction in materials, in many instances a reduction in one material may require an increase in another. Such increases need to be included to ensure a balanced representation of design changes.
Carbon Estimate and Reporting Tool | September 2015 27
0.0
0.0
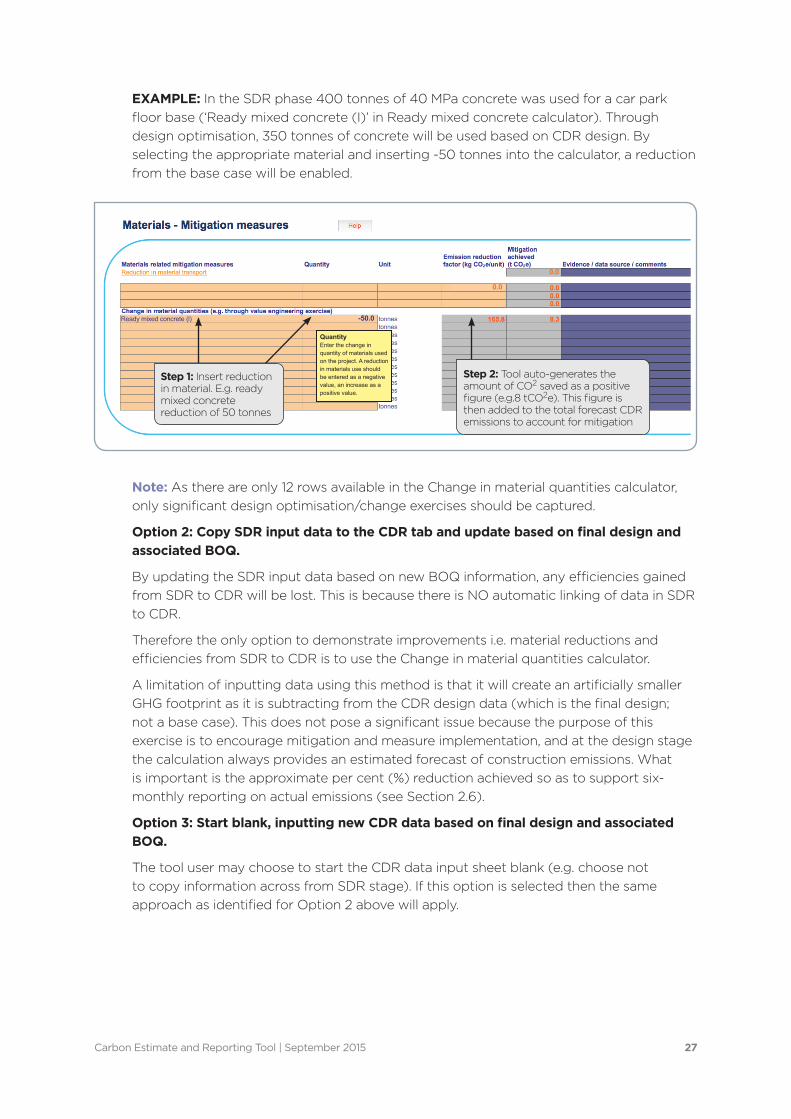
-50.0
Quantity Enter the change in quantity of materials used on the project. A reduction in materials use should be entered as a negative value, an increase as a positive value.
Ready mixed concrete (l)
Step 2: Tool auto-generates the amount of CO2 saved as a positive figure (e.g.8 tCO2e). This figure is then added to the total forecast CDR emissions to account for mitigation
Step 1: Insert reduction in material. E.g. ready mixed concrete reduction of 50 tonnes
EXAMPLE: In the SDR phase 400 tonnes of 40 MPa concrete was used for a car park floor base (‘Ready mixed concrete (I)’ in Ready mixed concrete calculator). Through design optimisation, 350 tonnes of concrete will be used based on CDR design. By selecting the appropriate material and inserting -50 tonnes into the calculator, a reduction from the base case will be enabled.
Note: As there are only 12 rows available in the Change in material quantities calculator, only significant design optimisation/change exercises should be captured.
Option 2: Copy SDR input data to the CDR tab and update based on final design and associated BOQ.
By updating the SDR input data based on new BOQ information, any efficiencies gained from SDR to CDR will be lost. This is because there is NO automatic linking of data in SDR to CDR.
Therefore the only option to demonstrate improvements i.e. material reductions and efficiencies from SDR to CDR is to use the Change in material quantities calculator.
A limitation of inputting data using this method is that it will create an artificially smaller GHG footprint as it is subtracting from the CDR design data (which is the final design; not a base case). This does not pose a significant issue because the purpose of this exercise is to encourage mitigation and measure implementation, and at the design stage the calculation always provides an estimated forecast of construction emissions. What is important is the approximate per cent (%) reduction achieved so as to support six-monthly reporting on actual emissions (see Section 2.6).
Option 3: Start blank, inputting new CDR data based on final design and associated BOQ.
The tool user may choose to start the CDR data input sheet blank (e.g. choose not to copy information across from SDR stage). If this option is selected then the same approach as identified for Option 2 above will apply.
Carbon Estimate and Reporting Tool | September 2015 28
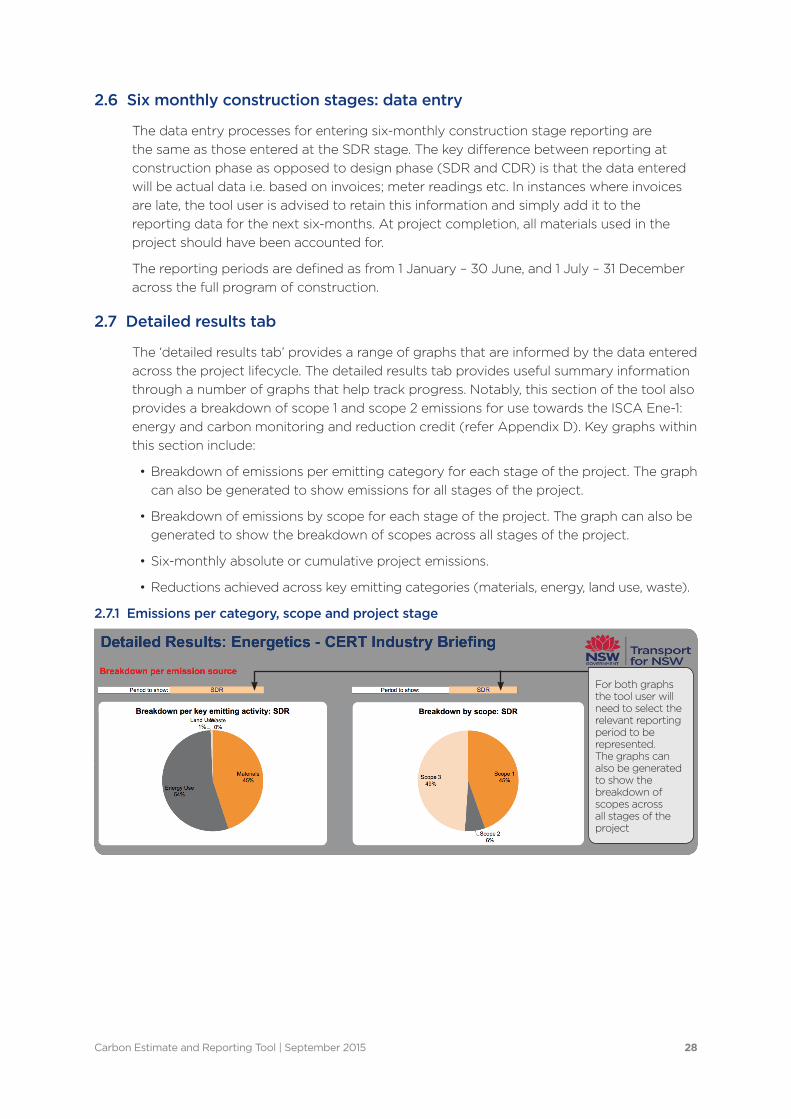
For both graphs the tool user will need to select the relevant reporting period to be represented. The graphs can also be generated to show the breakdown of scopes across all stages of the project
2.6 Six monthly construction stages: data entry
The data entry processes for entering six-monthly construction stage reporting are the same as those entered at the SDR stage. The key difference between reporting at construction phase as opposed to design phase (SDR and CDR) is that the data entered will be actual data i.e. based on invoices; meter readings etc. In instances where invoices are late, the tool user is advised to retain this information and simply add it to the reporting data for the next six-months. At project completion, all materials used in the project should have been accounted for.
The reporting periods are defined as from 1 January – 30 June, and 1 July – 31 December across the full program of construction.
2.7 Detailed results tab
The ‘detailed results tab’ provides a range of graphs that are informed by the data entered across the project lifecycle. The detailed results tab provides useful summary information through a number of graphs that help track progress. Notably, this section of the tool also provides a breakdown of scope 1 and scope 2 emissions for use towards the ISCA Ene-1: energy and carbon monitoring and reduction credit (refer Appendix D). Key graphs within this section include:
• Breakdown of emissions per emitting category for each stage of the project. The graph can also be generated to show emissions for all stages of the project.
• Breakdown of emissions by scope for each stage of the project. The graph can also be generated to show the breakdown of scopes across all stages of the project.
• Six-monthly absolute or cumulative project emissions.
• Reductions achieved across key emitting categories (materials, energy, land use, waste).
2.7.1 Emissions per category, scope and project stage
Carbon Estimate and Reporting Tool | September 2015 29
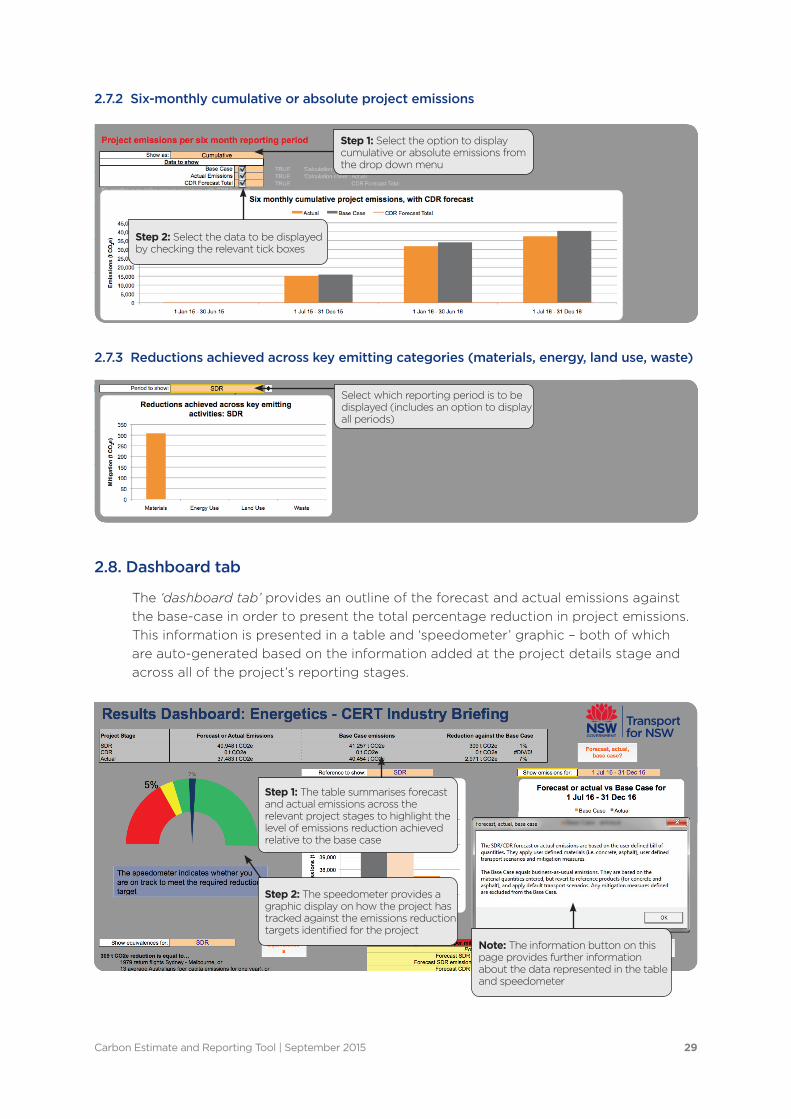
Step 1: Select the option to display cumulative or absolute emissions from the drop down menu
Select which reporting period is to be displayed (includes an option to display all periods)
Step 1: The table summarises forecast and actual emissions across the relevant project stages to highlight the level of emissions reduction achieved relative to the base case
Step 2: The speedometer provides a graphic display on how the project has tracked against the emissions reduction targets identified for the project
Step 2: Select the data to be displayed by checking the relevant tick boxes
Note: The information button on this page provides further information about the data represented in the table and speedometer
2.7.2 Six-monthly cumulative or absolute project emissions
2.7.3 Reductions achieved across key emitting categories (materials, energy, land use, waste)
2.8. Dashboard tab
The ‘dashboard tab’ provides an outline of the forecast and actual emissions against the base-case in order to present the total percentage reduction in project emissions. This information is presented in a table and ‘speedometer’ graphic – both of which are auto-generated based on the information added at the project details stage and across all of the project’s reporting stages.
Carbon Estimate and Reporting Tool | September 2015 30
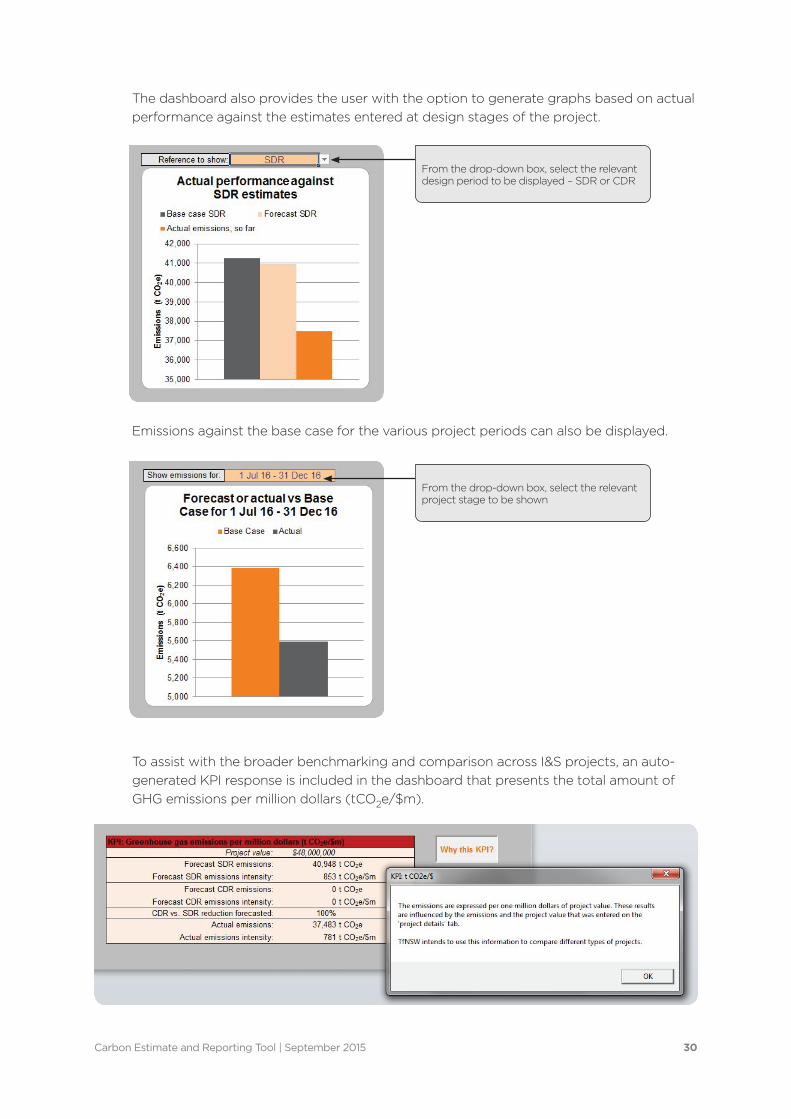
From the drop-down box, select the relevant design period to be displayed – SDR or CDR
From the drop-down box, select the relevant project stage to be shown
The dashboard also provides the user with the option to generate graphs based on actual performance against the estimates entered at design stages of the project.
Emissions against the base case for the various project periods can also be displayed.
To assist with the broader benchmarking and comparison across I&S projects, an auto-generated KPI response is included in the dashboard that presents the total amount of GHG emissions per million dollars (tCO2e/$m).
Carbon Estimate and Reporting Tool | September 2015 31
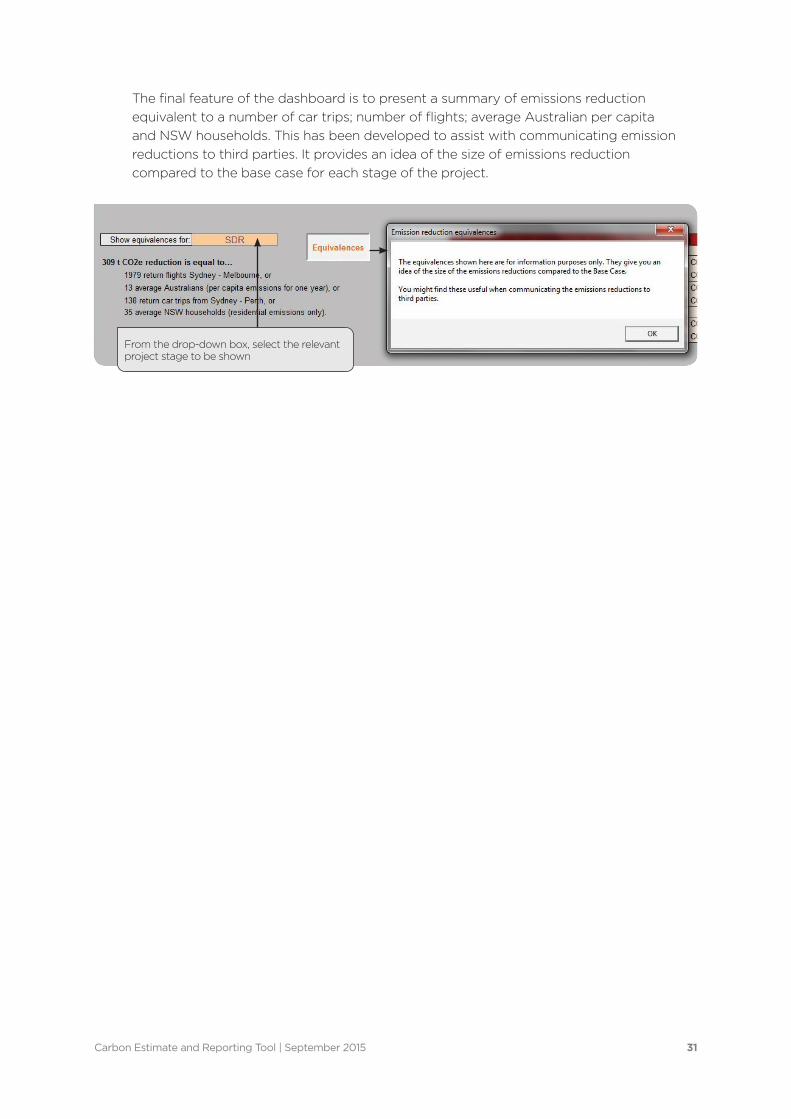
From the drop-down box, select the relevant project stage to be shown
The final feature of the dashboard is to present a summary of emissions reduction equivalent to a number of car trips; number of flights; average Australian per capita and NSW households. This has been developed to assist with communicating emission reductions to third parties. It provides an idea of the size of emissions reduction compared to the base case for each stage of the project.

Carbon Estimate and Reporting Tool | September 2015 32
Appendix A: CERT glossary
Term Definition
Actual Emissions Relates to the project’s construction stage emissions. As the name suggests, these relate to the actual emissions being produced during project construction. Data will largely be informed and confirmed by invoices.
Base Case The tool automatically calculates a project base case for each associated stage of the tool (SDR, CDR or actual). It is designed to provide an understanding of a business-as-usual approach that does not factor in mitigation measures.
Emissions reduction across the construction life of the project is measured against the respective base-case NOT against each respective stage. For example, CDR emissions reductions are based on the auto-generated CDR base case – they are not based on emissions reduced through design refinements since SDR.
The base case is calculated by applying default emission factors for relevant materials (e.g. concrete, asphalt etc.) to the quantities of materials entered by the tool user. It also takes into account a default transport scenario for the associated materials.
Any value engineering options that lead to changes in the materials quantities (typically a reduction in materials or switch from one material to another) should be entered in the ‘Materials – mitigation measures’ section. (This is possible from CDR stage onwards.)
Note: It is possible to end up with a design that has higher emissions than the base case. This would be the case if for example the cement content in the specified concrete is higher than business as usual, or if transport distances are much larger than usual.
The base case relates to all data (excluding mitigation measures) associated with materials, energy, waste and land use.
Carbon dioxide equivalent (CO2e)
A standard measure that takes account of the different global warming potentials (GWPs) of greenhouse gases and expresses the cumulative effect in a common, universal unit of measurement.
CERT uses GWPs taken from the IPCC’s Second Assessment Report (SAR), applying a 100 year time horizon. This is consistent with NGA and NGERS reporting.
Critical Design Review (CDR)
CDR represents design completion. CDR tool entries would be based on the project’s completed detailed design (i.e. 100%).

Carbon Estimate and Reporting Tool | September 2015 33
Term Definition
Emission Factors Emission factors for calculating emissions are generally expressed in the form of a quantity of GHG emitted per unit of activity – e.g. energy (kg CO2e /GJ), fuel (kg CO2e/L diesel) or material (kg CO2e/kg steel). Emission factors are used to calculate GHG emissions by multiplying the factor (e.g. kg CO2e/GJ energy in petrol) with activity data (e.g. kilolitres x energy density of petrol used).
The emission factors used in CERT cover scope 1, 2 and 3 emissions.
Forecast Emissions Forecast emissions relate to those emissions estimated during SDR and CDR reporting stages. They are based on design estimates rather than actual emissions that are generated through the construction phase.
Mitigation Represents measures and initiatives to reduce the GHG emissions associated with materials, energy and waste in the project.
System Design Review (SDR)
SDR commonly represents approximately 20% design completion. The CERT supports completion of a preliminary carbon estimate based on early design details.
User Throughout the steps outlined in the guide, reference is made to the ‘user’. This is the person or people whose responsibility it is to complete the CERT for their respective project.
Note: It is at the discretion of the contractor/consultant to nominate the individual/s responsible for completing the CERT and submitting the accompanying reports. However at both SDR and CDR or equivalent stages, signoff must be provided by a cost planner, design manager or equivalent representative with visibility of the cost planning/tender estimate process.
Carbon Estimate and Reporting Tool | September 2015 34
Appendix B: Maxbio classification maps – NSW
Extracted from TAGG 2013 Workbook, Attachment A Maximum Potential Biomass Classes
Refer: http://www.rms.nsw.gov.au/documents/about/environment/greenhouse-gas-assessment-workbook-road-projects.pdf
Appe
ndix
EV
eget
atio
n Em
issi
ons
Met
hodo
logy
4
Carbon Estimate and Reporting Tool | September 2015 35
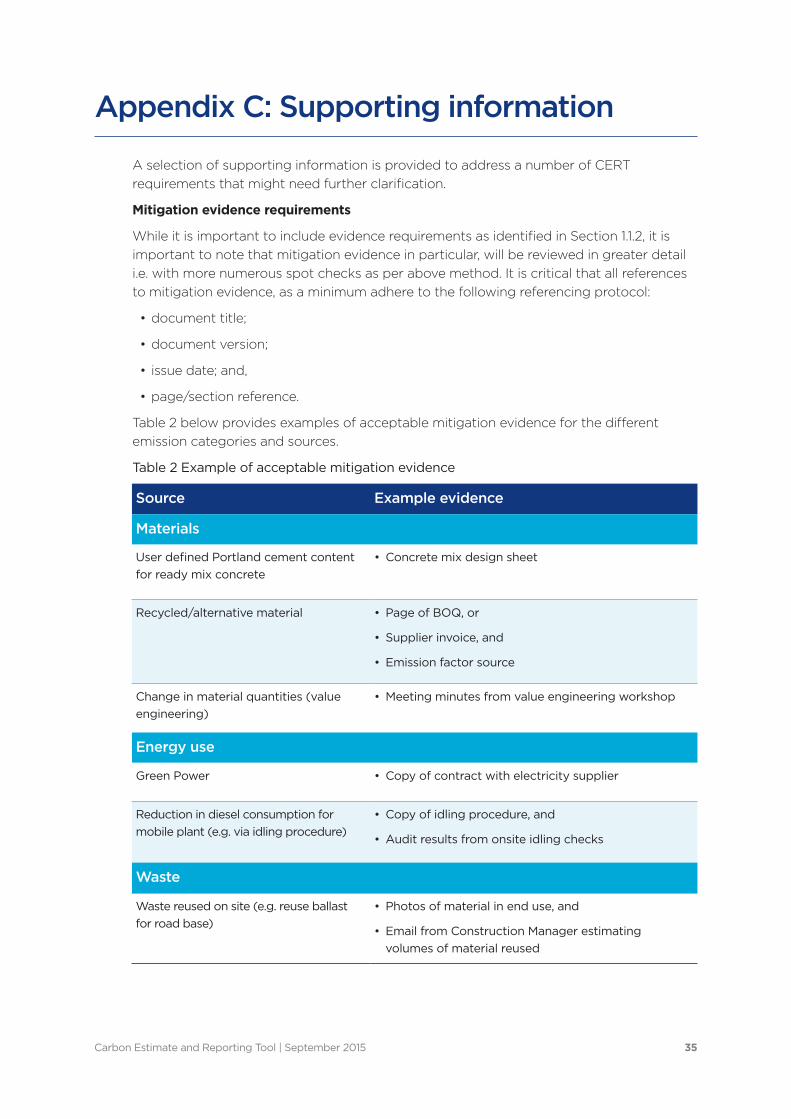
Source Example evidence
Materials
User defined Portland cement content for ready mix concrete
• Concrete mix design sheet
Recycled/alternative material • Page of BOQ, or
• Supplier invoice, and
• Emission factor source
Change in material quantities (value engineering)
• Meeting minutes from value engineering workshop
Energy use
Green Power • Copy of contract with electricity supplier
Reduction in diesel consumption for mobile plant (e.g. via idling procedure)
• Copy of idling procedure, and
• Audit results from onsite idling checks
Waste
Waste reused on site (e.g. reuse ballast for road base)
• Photos of material in end use, and
• Email from Construction Manager estimating volumes of material reused
Appendix C: Supporting information
A selection of supporting information is provided to address a number of CERT requirements that might need further clarification.
Mitigation evidence requirements
While it is important to include evidence requirements as identified in Section 1.1.2, it is important to note that mitigation evidence in particular, will be reviewed in greater detail i.e. with more numerous spot checks as per above method. It is critical that all references to mitigation evidence, as a minimum adhere to the following referencing protocol:
• document title;
• document version;
• issue date; and,
• page/section reference.
Table 2 below provides examples of acceptable mitigation evidence for the different emission categories and sources.
Table 2 Example of acceptable mitigation evidence
Carbon Estimate and Reporting Tool | September 2015 36
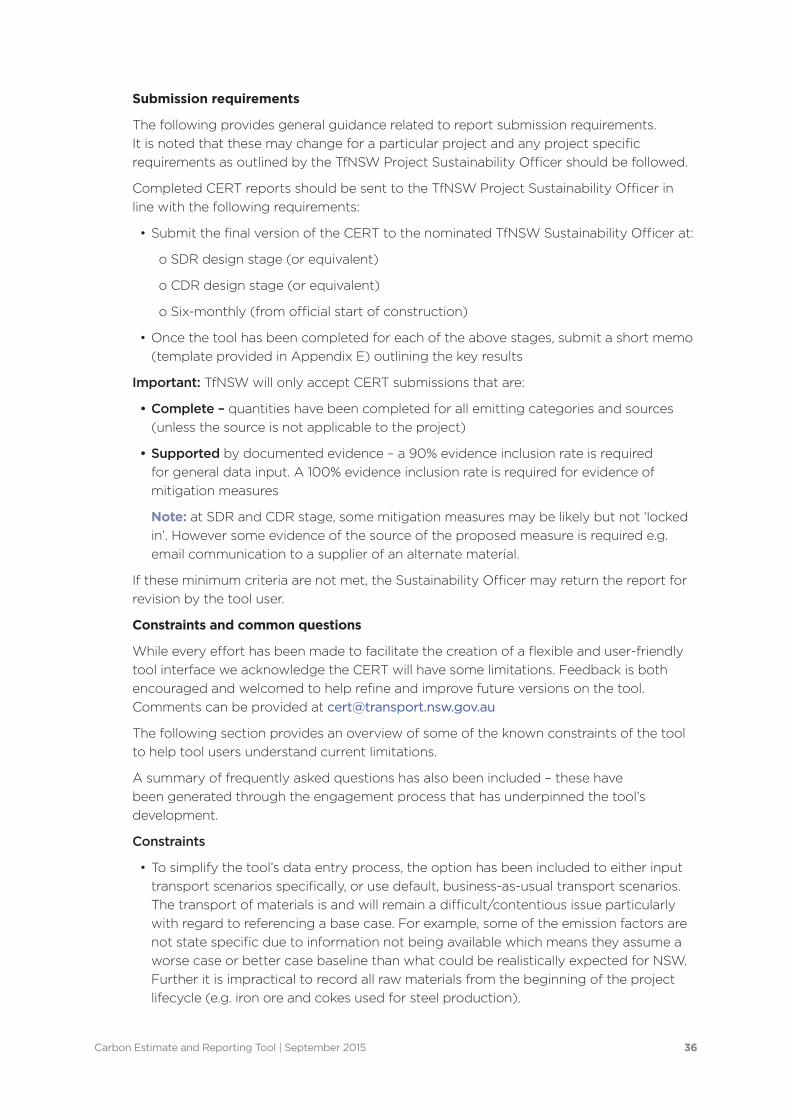
Submission requirements
The following provides general guidance related to report submission requirements. It is noted that these may change for a particular project and any project specific requirements as outlined by the TfNSW Project Sustainability Officer should be followed.
Completed CERT reports should be sent to the TfNSW Project Sustainability Officer in line with the following requirements:
• Submit the final version of the CERT to the nominated TfNSW Sustainability Officer at:
o SDR design stage (or equivalent)
o CDR design stage (or equivalent)
o Six-monthly (from official start of construction)
• Once the tool has been completed for each of the above stages, submit a short memo (template provided in Appendix E) outlining the key results
Important: TfNSW will only accept CERT submissions that are:
• Complete – quantities have been completed for all emitting categories and sources (unless the source is not applicable to the project)
• Supported by documented evidence – a 90% evidence inclusion rate is required for general data input. A 100% evidence inclusion rate is required for evidence of mitigation measures
Note: at SDR and CDR stage, some mitigation measures may be likely but not ‘locked in’. However some evidence of the source of the proposed measure is required e.g. email communication to a supplier of an alternate material.
If these minimum criteria are not met, the Sustainability Officer may return the report for revision by the tool user.
Constraints and common questions
While every effort has been made to facilitate the creation of a flexible and user-friendly tool interface we acknowledge the CERT will have some limitations. Feedback is both encouraged and welcomed to help refine and improve future versions on the tool. Comments can be provided at [email protected]
The following section provides an overview of some of the known constraints of the tool to help tool users understand current limitations.
A summary of frequently asked questions has also been included – these have been generated through the engagement process that has underpinned the tool’s development.
Constraints
• To simplify the tool’s data entry process, the option has been included to either input transport scenarios specifically, or use default, business-as-usual transport scenarios. The transport of materials is and will remain a difficult/contentious issue particularly with regard to referencing a base case. For example, some of the emission factors are not state specific due to information not being available which means they assume a worse case or better case baseline than what could be realistically expected for NSW. Further it is impractical to record all raw materials from the beginning of the project lifecycle (e.g. iron ore and cokes used for steel production).

Carbon Estimate and Reporting Tool | September 2015 37
• Transport is not a major contributor to GHG emissions for most projects (less than 10% on average based on the materiality assessment undertaken by I&S). The decisions made regarding transport distances, modes, return loads, etc. will have a limited effect on the overall carbon footprint of a project.
• In order to develop the base case some assumptions have been required due to a lack of existing data and/or reference material. Where assumptions have been made this information is documented, refer ‘formulas and background tab’.
• In line with the TAGG 2013 Workbook vegetation offsets are not included as part of land clearing mitigation. It is acknowledged that this could present an issue for greenfield projects as land clearing can produce large emissions profile. It is anticipated this will be reconsidered when the second version of the tool is planned.
• The CERT tool is a simplified, high level GHG reporting tool. It is not designed to substitute detailed Life Cycle Analysis (LCA) models – future versions of the tool may seek to reconcile the inclusion of LCA.
Frequently asked questions
The following outlines a number of frequently asked questions (FAQ) that have been posed during the tool’s development and pilot stages. They are designed to provide further context and guidance to support completion of the tool.
Table 3 CERT frequently asked questions
Question Response
Interface with design
My project has more than one design package, with design review/submission dates differing in terms of program. How does the CERT facilitate this?
Please use more than one copy of the CERT for each major design package. TfNSW will accept multiple submission of the CERT for large projects with complex design packages. However the memo (refer Appendix E) should collate the results to represent one project.
Can’t I just “over design” at SDR to look better at CDR and construction stage reporting?
No. The aim of the tool is not to compare the various stages against each other, but to compare them against the auto-generated base case. Conservative/over designing at SDR stage to try and achieve efficiencies later in the project will serve no benefit as all emissions reductions are charted against the respective base case.
Why haven’t operational emissions been included in the tool?
Development of the CERT has borne out of the GHG Inventory Guide for Construction Project – this approach has not included operational emissions and as such at this point in time operational emissions are not included.
What if the quantification is way off, quantification can be way out from reality? Is there a margin for error? Contingency?
There is always a risk that quantities are off. Until now, this was difficult to spot because of the variation in reporting formats, scope, etc. With CERT, TfNSW can compare materials use and greenhouse gas emissions to other (similar) projects.
I can only change the Portland cement quantity to achieve reductions for ready mix and precast concrete. What about recycled aggregates etc?
Recycled aggregates only have minor impacts on the carbon footprint of concrete. Therefore it was determined that there is no need to distinguish these for the purposes of the CERT.
Carbon Estimate and Reporting Tool | September 2015 38
Question Response
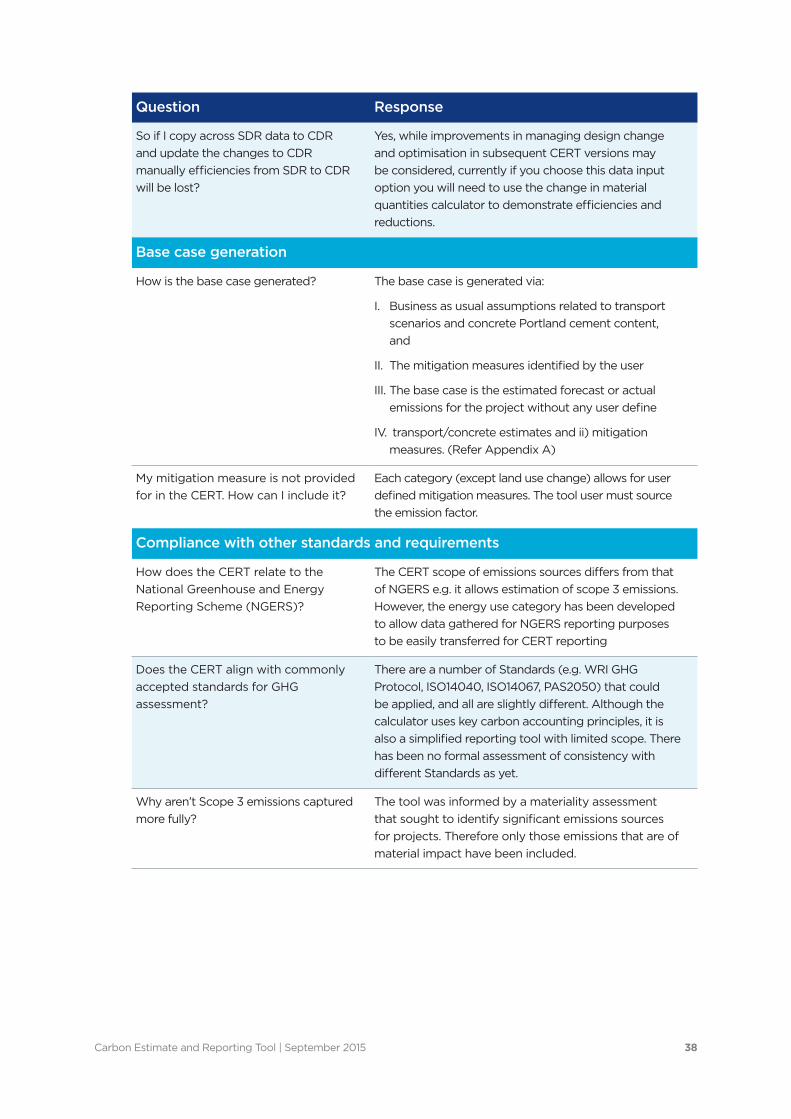
So if I copy across SDR data to CDR and update the changes to CDR manually efficiencies from SDR to CDR will be lost?
Yes, while improvements in managing design change and optimisation in subsequent CERT versions may be considered, currently if you choose this data input option you will need to use the change in material quantities calculator to demonstrate efficiencies and reductions.
Base case generation
How is the base case generated? The base case is generated via:
I. Business as usual assumptions related to transport scenarios and concrete Portland cement content, and
II. The mitigation measures identified by the user
III. The base case is the estimated forecast or actual emissions for the project without any user define
IV. transport/concrete estimates and ii) mitigation measures. (Refer Appendix A)
My mitigation measure is not provided for in the CERT. How can I include it?
Each category (except land use change) allows for user defined mitigation measures. The tool user must source the emission factor.
Compliance with other standards and requirements
How does the CERT relate to the National Greenhouse and Energy Reporting Scheme (NGERS)?
The CERT scope of emissions sources differs from that of NGERS e.g. it allows estimation of scope 3 emissions. However, the energy use category has been developed to allow data gathered for NGERS reporting purposes to be easily transferred for CERT reporting
Does the CERT align with commonly accepted standards for GHG assessment?
There are a number of Standards (e.g. WRI GHG Protocol, ISO14040, ISO14067, PAS2050) that could be applied, and all are slightly different. Although the calculator uses key carbon accounting principles, it is also a simplified reporting tool with limited scope. There has been no formal assessment of consistency with different Standards as yet.
Why aren’t Scope 3 emissions captured more fully?
The tool was informed by a materiality assessment that sought to identify significant emissions sources for projects. Therefore only those emissions that are of material impact have been included.
Carbon Estimate and Reporting Tool | September 2015 39
Question Response
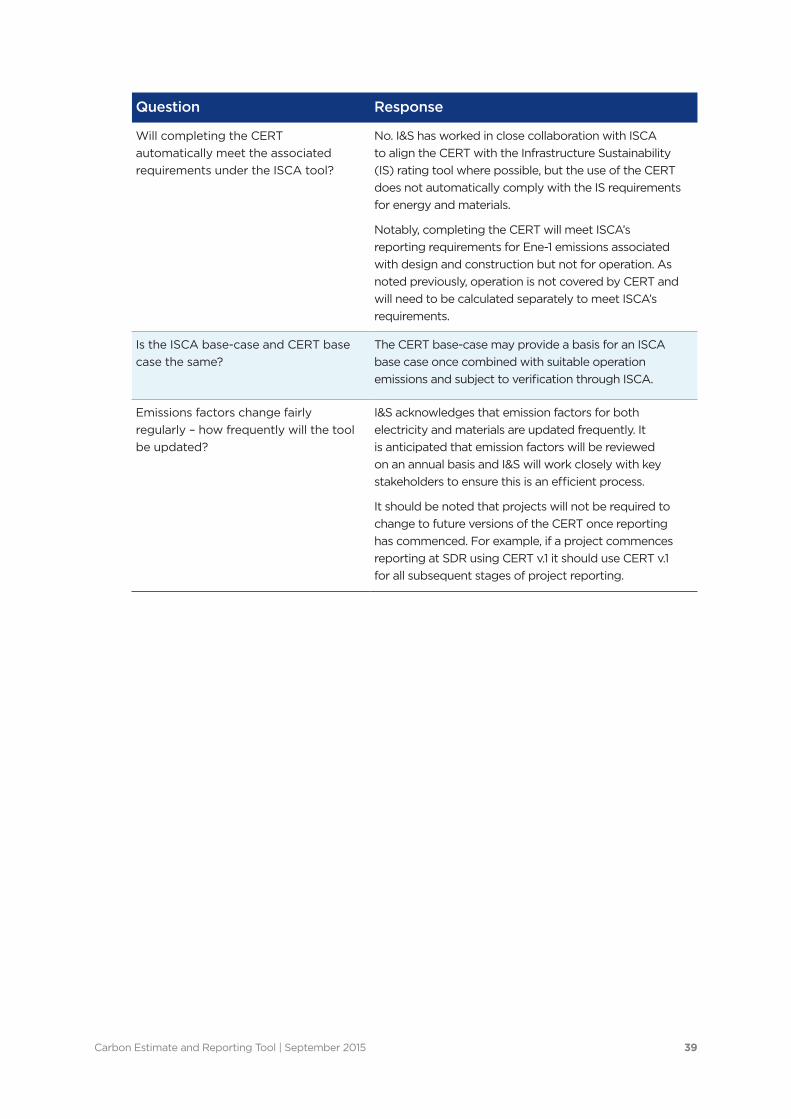
Will completing the CERT automatically meet the associated requirements under the ISCA tool?
No. I&S has worked in close collaboration with ISCA to align the CERT with the Infrastructure Sustainability (IS) rating tool where possible, but the use of the CERT does not automatically comply with the IS requirements for energy and materials.
Notably, completing the CERT will meet ISCA’s reporting requirements for Ene-1 emissions associated with design and construction but not for operation. As noted previously, operation is not covered by CERT and will need to be calculated separately to meet ISCA’s requirements.
Is the ISCA base-case and CERT base case the same?
The CERT base-case may provide a basis for an ISCA base case once combined with suitable operation emissions and subject to verification through ISCA.
Emissions factors change fairly regularly – how frequently will the tool be updated?
I&S acknowledges that emission factors for both electricity and materials are updated frequently. It is anticipated that emission factors will be reviewed on an annual basis and I&S will work closely with key stakeholders to ensure this is an efficient process.
It should be noted that projects will not be required to change to future versions of the CERT once reporting has commenced. For example, if a project commences reporting at SDR using CERT v.1 it should use CERT v.1 for all subsequent stages of project reporting.
Carbon Estimate and Reporting Tool | September 2015 40
Appendix D: CERT Overview and context
Introduction
TfNSW is committed to working in partnership to deliver innovative and sustainable transport networks that make NSW a great place to live and work. As an organisation, TfNSW has a demonstrated commitment to sustainability and aims to be a world class authority delivering safe, reliable and integrated transport across the State.
As part of its broader sustainability commitment, greenhouse gas (GHG) or carbon emissions, are viewed as a key sustainability issue for TfNSW and have been identified as an appropriate metric for measuring sustainability performance. The measurement of GHG emissions are central themes in the:
• TfNSW Environment and Sustainability Framework: the Department’s corporate sustainability framework includes key themes around energy and resource management that seek to reduce consumption and emissions.
• TfNSW Transport Projects’ Sustainability Framework: Infrastructure and Services Division (I&S) confirms a GHG emissions reduction target of 15% (from a 2010 baseline) by 2020. It also identifies a need to reduce the absolute quantity of Portland cement by at least 30% as an average across all concrete mixes subject to meeting strength and durability requirements.
• TfNSW Sustainable Design Guidelines: The Sustainable Design Guidelines (SDGs) support the preparation of a carbon footprint assessment for all projects, and, reducing the use of Portland cement quantity.
It is important to note, the introduction of the CERT does not place an additional reporting requirement on I&S’s stakeholders. Rather, it seeks to streamline and simplify the current process associated with the assessment of project GHG emissions from design through to construction. The introduction of the CERT will supersede the requirements within the current TfNSW Greenhouse Gas Inventory for Construction Projects, and in future TfNSW’s Standard Requirements – Environment (TSR-E) will be updated to require completion of the CERT for all projects > $15million.
Purpose and objectives
Development of the CERT serves two main purposes for I&S:
• To provide consistency in GHG assessment and reporting (i.e. to ensure all projects measure and report emissions in the same way).
• To streamline and simplify the GHG reporting and assessment process for both I&S and its supply chain.
Its main objectives are:
• To estimate a project’s construction phase GHG emissions profile from detailed (SDR) design stage through to construction completion.
• To encourage the investigation and implementation of GHG reduction (mitigation) measures.
Ultimately, it is anticipated the CERT will ease the burden of reporting by making the data input process easier and more straightforward.
Carbon Estimate and Reporting Tool | September 2015 41
Developing the CERT
At its core, the GHG emission sources included in the CERT have been informed by a materiality review undertaken by I&S’s Sustainability and System’s team. The aim of the review was to identify the material (i.e. significant and/or important) emissions sources across a cross-section of typical I&S projects.
The outcomes from this materiality assessment have directly informed development of the CERT. The tool comprises a number of predefined GHG emitting activities/sources.
A comprehensive engagement process has further informed development of the CERT. Key stakeholders that were engaged throughout the process include (but are not restricted to):
• Sydney Trains
• Roads and Maritime Services (RMS)
• Transport Projects Delivery Office (I&S)
• Various tier 1 and 2 contractors
• Wickham Transport Interchange (WTI) project team
• Infrastructure Sustainability Council of Australia (ISCA)
A key component of developing the tool was testing and piloting the draft tool on the Wickham Transport Interchange project to gain practical insight into its useability and functionality. I&S has also worked closely with ISCA to seek alignment (where possible) with relevant categories within the Infrastructure Sustainability (IS) rating tool e.g. Energy-1 (Ene-1) and Materials-1 (Mat-1).
Further details on the tool’s engagement and development process can be found in Appendix D.
ISCA and CERT
Reflecting the I&S requirement for all projects ≥$50 million to achieve an ISCA rating, many I&S projects will be applying both the CERT and the ISCA IS rating tool in parallel. As such efforts have been made to align the requirements of the CERT with those included in the IS rating tool where possible.
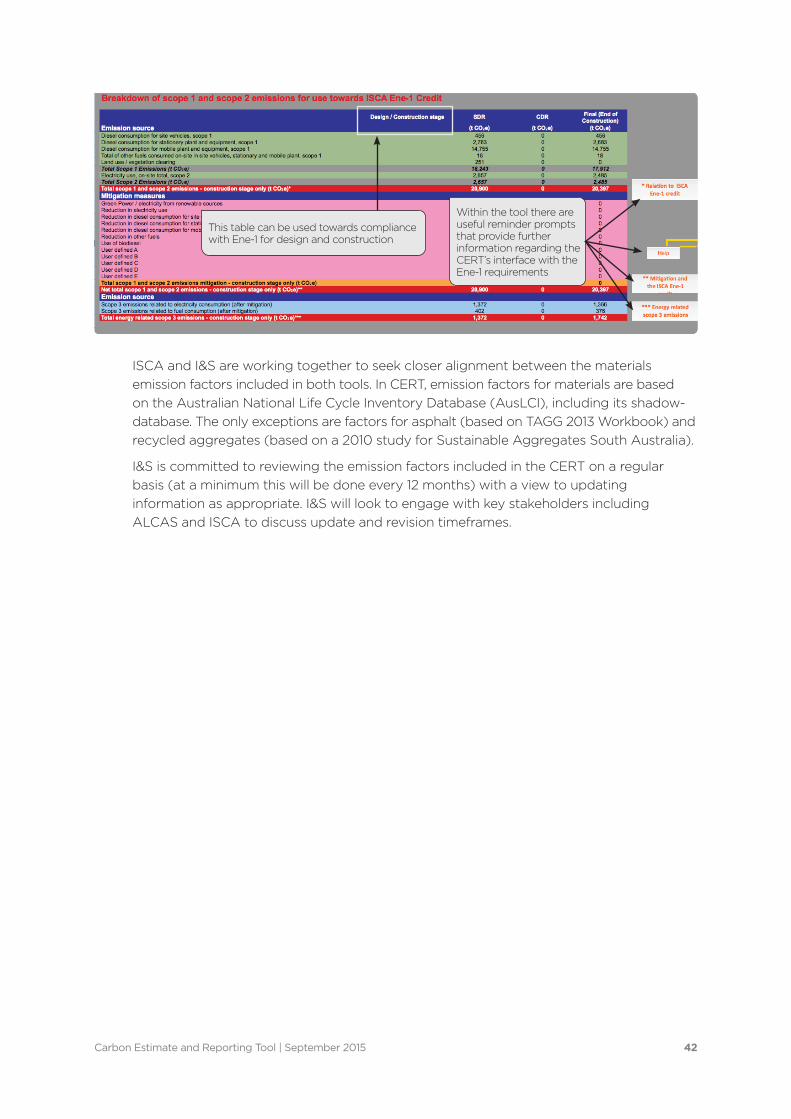
An Ene-1 output table has been included in the Detailed Results tab of the CERT (refer below). Completion of this table supports the reporting requirements for design and construction as outlined in ISCA’s Ene-1 category: Energy and carbon monitoring and reduction.
IS rating tool: Ene-1 alignment
To achieve the ISCA credits associated with the Ene-1 criteria, additional work will be needed to estimate operational emissions. The CERT only provides emissions estimates for design and construction.
Carbon Estimate and Reporting Tool | September 2015 42
This table can be used towards compliance with Ene-1 for design and construction
Within the tool there are useful reminder prompts that provide further information regarding the CERT’s interface with the Ene-1 requirements
ISCA and I&S are working together to seek closer alignment between the materials emission factors included in both tools. In CERT, emission factors for materials are based on the Australian National Life Cycle Inventory Database (AusLCI), including its shadow-database. The only exceptions are factors for asphalt (based on TAGG 2013 Workbook) and recycled aggregates (based on a 2010 study for Sustainable Aggregates South Australia).
I&S is committed to reviewing the emission factors included in the CERT on a regular basis (at a minimum this will be done every 12 months) with a view to updating information as appropriate. I&S will look to engage with key stakeholders including ALCAS and ISCA to discuss update and revision timeframes.

Carbon Estimate and Reporting Tool | September 2015 43
SDR Stage: ~20% design
• First step in CERT completion process
• Base responses on Bill of Quantities
information
• Provides a summary of forecast project
emissions
CDR Stage: 100% design
• Second step in CERT completion
process
• Able to copy across information from
SDR stage
• Provides a summary of forecast project
emissions
Six-monthly during construction
• Final step in CERT completion process
• Need to update CERT every six months
based on construction program
• Provides a summary of actual project
emissions
CERT structure
The CERT is structured to require input during three key stages of the project (initial/preliminary design – System Design Review; design completion – Critical Design Review; and six-monthly reporting during construction (refer Figure 1).
The tool is designed to capture relevant and material Scope 1, 2 and 3 GHG Emissions as identified through the internal I&S emissions materiality assessment.
The information entered during each stage of the project informs the next. For example, once the System Design Review (SDR) equivalent (representing approximately 20% design completion) has been completed, this information can then be used to inform the Critical Design Review (CDR) stage which represents the 100% completed design. Following the design stages; reporting is to take place every six months during construction. The tool will automatically show the relevant number of reporting periods to cover the construction duration of your project.
Defining emissions scopes:
Scope 1: All direct GHG emissions. E.g. emissions generated by the use of diesel fuel by construction plan/equipment; clearing of vegetation.
Scope 2: Indirect GHG emissions from consumption of purchased electricity, heat or steam. E.g. Energy purchased to operate and run plant and equipment, power site offices, etc.
Scope 3: Indirect upstream emissions. E.g. emissions from construction materials; disposal of waste; fuel used to transport materials and waste.
Figure 1 CERT completion process
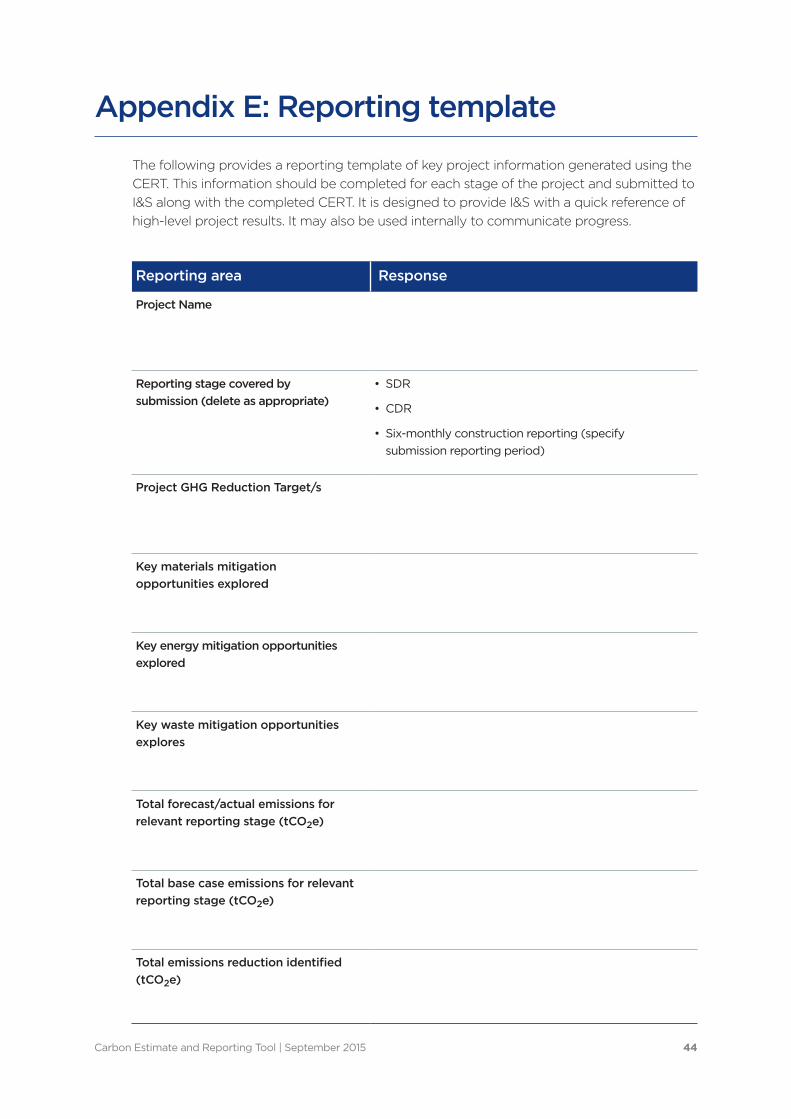
Carbon Estimate and Reporting Tool | September 2015 44
Reporting area Response
Project Name
Reporting stage covered by submission (delete as appropriate)
• SDR
• CDR
• Six-monthly construction reporting (specify submission reporting period)
Project GHG Reduction Target/s
Key materials mitigation opportunities explored
Key energy mitigation opportunities explored
Key waste mitigation opportunities explores
Total forecast/actual emissions for relevant reporting stage (tCO2e)
Total base case emissions for relevant reporting stage (tCO2e)
Total emissions reduction identified (tCO2e)
Appendix E: Reporting template
The following provides a reporting template of key project information generated using the CERT. This information should be completed for each stage of the project and submitted to I&S along with the completed CERT. It is designed to provide I&S with a quick reference of high-level project results. It may also be used internally to communicate progress.

ISBN 000-0-000000-00-0Job Ref Number
transport.nsw.gov.au
Tel 02 8202 2702 Fax 02 8202 3890
18 Lee Street Chippendale NSW 2008
PO Box K659 Haymarket 1240
DisclaimerWhile all care is taken in producing this work, no responsibility is taken or warranty made with respect to the accuracy of any information, data or representation. The authors (including copyright owners) expressly disclaim all liability in respect of anything done or omitted to be done and the consequences upon reliance of the contents of this information.
© Transport for NSWUsers are welcome to copy, reproduce and distribute the information contained in this report for non-commercial purposes only, provided acknowledgement is given to Transport for NSW as the source.