Carbohydrates and Carbohydrate metabolism (Chemistry of Carbohydrate )
CARBOHYDRATE UTILIZATION.
I. RATE OF DISAPPEARANCE OF d-GLUCOSE FROM THE BLOOD.
BY VINCENT DU VIGNEAUD AND WALTER G. KARR.
(From the Biochemical Laboratories of the Philadelphia General Hospitaland the Graduate School of Medicine of the University of
Pennsylvania, Philadelphia.)
(Received for publication, August 20, 1925.)
Although the disappearance of d-glucose from the blood hasbeen used as the basis of many clinical investigations for thetesting of the tolerance of the body for glucose, very little isreally known of the factors involved in this mechanism of regulat-ing and maintaining the blood sugar level.
The alimentary sugar tolerance test depends on giving adefinite amount of d-glucose per kilo body weight and on deter-mining the blood sugar concentration before the test and atcertain intervals thereafter. Normally the blood sugar rises toamaximum at about the hour period and returns to the normallevel within 1 to 2 hours.
It has been shown by a number of investigators that the fall in the bloodsugar is not due to absorption. Johansson (1), by x-ray examination, gaveevidence that the absorption of 200 gm. of glucose is not complete untilafter about 4 hours. Indirect evidence was obtained by Janney and Isaac-son (2) that absorption was not a factor in their experiments. They fol-lowed the excretion of nitrogen after the feeding of meat to their dogs beforeand after thyroidectomy in which they found a decreased tolerance. Mac-Lean and de Wesselow (3) found that additional large doses of sugar givenduring the height of absorption failed to raise the blood sugar above theprevious level. Furthermore, these same investigators, as well as Foster(4), Hamman and Hirschman (5), and others have found that a second doseof sugar, given after the return of the blood sugar level to normal from theeffects of the first dose, gives little if any rise in the blood sugar value. OurOwn results support this.
When the glucose is introduced into the alimentary canal, it is readily.bsorbed from the gut, thence passing into the blood causing an increaseIthebloodsugar concentration. At some time during the rise of the blood
281
by guest on May 3, 2018
http://ww
w.jbc.org/
Dow
nloaded from
282 Carbohydrate Utilization. I
sugar a mechanism is stimulated that soon takes the sugar out of the bat a faster rate than it is being absorbed, bringing the blood sugarlback to normal or even slightly below normal. By tolerance for sugar,this paper, we mean the ability of the organism to remove this excess,from the blood, or in other words the rate of disappearance of the sqtfrom the blood. We are not interested in the amount of sugar excretethe urine. MacLean and de Wesselow (3) have put forth the hypoththat it is the presence of an excess of sugar in the circulation that stilates the mechanism that deals with sugar. This is strongly supportedFoster (4). Although sugar must stimulate this mechanism as showythe successive tolerances, there must be some other factors than the con"tration of the blood sugar itself, as we shall show later. Greenwald( although agreeing with the excess sugar stimulation hypothesis in opart, nevertheless felt that hyperglycemia itself could not explain thesuits he obtained in the lowering of sugar tolerance by fat diets and notkproteins. There seems no doubt, though, that there is some mechanicthat is dormant during the first part of the tolerance test, which isl Istimulated to action.
What this mechanism is, we can only hypothecate for the present. do know though that the glycogenetic function of the liver and musclespha major part, and that the endocrine secretions are intimately conceral
Foster (4) has suggested that the ingestion of glucose or the hypergcemia that ensues stimulates the pancreas to put out its internal secretwhich then operates in some way to accelerate both glycogen formationaloxidation of sugar. This investigator further points out that the mIstissues are more important in connection with glycogen storage thaiperhaps generally believed. Evidence for this is based on the great difenence between the sugar concentration of the arterial and venous blood alfthe ingestion of glucose. Cori and Cori (7), Frank, Nothmann, andWIaner (8), and Lawrence (9), have also found a greater difference betwarterial and venous blood during the action of insulin. These factsphasize the importance of the muscles and tissues in the mechanismstaking sugar out of the blood. Mann and Magath (10) have shown tUthe liver is not concerned with the fall in blood sugar due to insulin ithat it is necessary for the return to normal.
We generally speak of the glycogen formation in connection vitht}disappearance of sugar from the blood. However, there are many indittions that this disappearance of the sugar is due to the formation of 0sstances other than glycogen. Macleod (11) states in his review onins*u". ... the outstanding facts are that insulin causes the sugar of blood (and tissues) to diminish both in the normal and diabetic aniwLpartly because of the increase in the relative amount of carbohydrthat is metabolized and partly because some of the glucose is convertinto non-saccharine material, which is mainly glycogen in diabetdbut is some other substance in the normal animal." Palmer (12) 'to the conclusion that there are present in muscle tissue higher sugor polysaccharides of which maltose probably constituted the I0
by guest on May 3, 2018
http://ww
w.jbc.org/
Dow
nloaded from
V. du Vigneaud and W. G. Karr 283
prt. Since phosphorus has been found to decrease in the blood afterthe injection of insulin, it is highly indicative that the substance formedmight be a phosphoric acid complex (6, 13-16). Although they foundthat there was a fall in the organic phosphates of the blood after in-slin, Blatherwick, Bell, and Hill (13) did not find that the ingestion ofglucose itself had any definite effect on the phosphates of the blood.bis tends to support the idea that the process of taking excess sugar from
the blood normally is different in principle from the effect of injected insu-lin, a point not in accord with the hypothesis of excess sugar in the bloodstimulating the pancreas. However, Harrop and Benedict (14) claim adecrease in phosphates after the ingestion of glucose. Besides confirmingthelatter, Bolliger and Hartman (17) have presented curves showing thatthe phosphate level remains very constant in diabetes after the ingestionof glucose but that under the influence of insulin the curve behavesnormally, showing a drop followed by a rise to normal. Since Cori andGolz (18) have demonstrated that the decrease of the free sugar of theliver is not due to the formation of a phosphate complex, our attention isonce more directed to the muscles as the seat of this possible synthesisprobably influenced by insulin.
Evidence pointing to the connection of the endocrines with sugar me-tabolism has been obtained both experimentally and clinically. Thesugar tolerance curve has been used in many disorders. It has been usedin diabetes, hyper- and hypothyroidism, hyper- and hypopituitarism,Addison's disease, cancer, arthritis, tuberculosis, mental diseases, infec-tion, anemia, nephritis, and cirrhosis of the liver. Consideration of thebehavior of these curves, especially in endocrine disorders, may throw somelight on the part played by these glands normally or at least indicatewhether or not they are connected with the sugar utilization mechanism.
We have already considered the rle of the pancreas from the standpointof insulin. The high and prolonged curve in diabetes again points to theimportance of the pancreas in the ability of the organism to remove excesssugar from the blood.
Consistent results have also been found in hyperthyroidism; namely,an abnormally high curve indicating a reduced tolerance (19-23). Labb,Labb6, and Nepveux (24) suggest the test as a means of differentiatingbetween simple goiter and Basedow's disease, the former giving little ifany hyperglycemia while the latter gives a very marked hyperglycemiaafter the ingestion of 45 gm. of glucose. The reduced tolerance is notconnected with the oxidation of sugar as shown by respiratory quotient
studies (25). An increased diastatic activity of the blood besides thedecreased tolerance has been found in hyperthyroid cases by Killian(23), while in hypothyroid cases the reverse was found. This seems toindicate that the thyroid secretion acts by increasing glycogenolysisrather than by decreasing or inhibiting glycogenesis. Also, Janney (2)has shown that thyroidectomy results in a distinct hypoglycemia. Asimilar fact was observed by Bodansky, Simpson, and Goldberg (26) inthyroideetomized sheep. McCurdy (27) found that removal of the thyroid
by guest on May 3, 2018
http://ww
w.jbc.org/
Dow
nloaded from
284 Carbohydrate Utilization. I
raises the assimilation limit for glucose. Furthermore, a great observations have been made in recent years to show that there isMcreased sugar tolerance in myxedema (19, 28). uriyama (29) foundfeeding thyroid to white rats produced a decreased glycogen cnOof the liver. He did not find, however, that experimental hyperthyroproduced a change in sugar content of the blood in either rats or rThis evidence rather points, although not necessarily, to an inhibitglycogenesis rather than increased glycogenolysis. Nevertheless, iicertain that disturbances of the thyroid do cause disturbances mechanism controlling sugar metabolism, but it is still an open quellwhether this is done through the thyroid itself or indirectly througheffect on the pancreas or on the nervous system.
The relationship between the parathyroid glands and carbohydmetabolism is not clear, the evidence being somewhat conflicting,general it is assumed that there is an increased mobilization of carbdrates in tetany which is considered to be due to decreased parathnactivity (30).
Cushing (31) has demonstrated the importance of the hypophysiscarbohydrate metabolism. Administration of the posterior lobe extnlowered the sugar tolerance to normal or below normal in animals in it had been raised by excision of the posterior lobe. The decreasederance has been observed frequently in acromegaly. On the otherhalhypoglycemia and an increased tolerance have been associated with hppituitarism (19, 28). In dystrophia adiposogenitalis, the carbohyetolerance is increased; sometimes it is almost unlimited (32). Accoito Cushing both the increased sugar tolerance and hypoglycemia canremedied by injection of posterior lobe extract. Cushing believes thatposterior lobe of the hypophysis has a glycogenolytic action. Furtherit has been shown that the simultaneous injection of the posterior lobestract enhances the hyperglycemia induced by intravenous injectionglucose (33). It has also been found that pituitrin causes a rise inblssugar concentration (34). Kojima obtained changes in the pancreasssresult of feeding pituitary gland (35). However, it must be borne inn6that in hypopituitarism and also in hypothyroidism there is an abnormalformation which may in part account for the increased tolerance.
It is generally accepted that adrenalin, the secretion of the adeglands, exerts a strong stimulation on the glycogenolytic function body causing a hyperglycemia. In Addison's disease, which is consideto be the result of a hypofunction of the adrenals, there is present ahYglycemia and the tolerance for glucose is raised (23, 28). Achard, Riband Binet (33) found that the simultaneous injection of adrenalin andcose produced a greater hyperglycemia than the sum of the increasestained from the injection of glucose and adrenalin separately. Thiswoindicate that adrenalin prevents the storage of sugar since it has alsoshown by Lusk and Riche (36) that adrenalin does not affect the oxidsof glucose.
Tsubura (37) has reported that castration does not lower the fs5blood sugar but that the tolerance for glucose was lowered.
by guest on May 3, 2018
http://ww
w.jbc.org/
Dow
nloaded from
V. du Vigneaud and W. G. Karr 285
From time to time references have been made in the literature as to theelect of diet and fasting on the carbohydrate tolerance of the body.l geura (38) found that the hyperglycemia resulting from the ingestionof the Sakeguchi test meal consisting of 100 gm. of rice and two eggs wasgreaterafter a carbohydrate-poor diet than after one rich in carbohydrates.
He claimed that a protein diet was equally effective in lowering the toler-ace to glucose as a fat diet (39). However, as pointed out by Greenwald(6), his protein diet consisted largely of fat. Greenwald found that inboth man and dog a fat diet lowered the tolerance to glucose but that aprotein diet did not produce this effect, in fact, it had a beneficial ratherthan detrimental effect. It was observed by Southwood (40) that an in-eresed hyperglycemia resulted in men who had been on a carbohydrate-free diet for 36 hours before the test. Staub (41) found that the hyper-glycemic reaction after the ingestion of 20 gm. of glucose was less afterfast of 10 to 15 hours than after one of 5 hours, but that it became moremarked after a fast of 24 hours. An increased hyperglycemia was obtainedafter2 days on a carbohydrate-free diet and also after severe work. Duringthe work the hyperglycemia was less than at rest. Similar results havebeen reported by Traugott (42) who found that the ingestion of 20 to 100gm. of glucose in a normal well nourished man produced a hyperglycemia of30 to 50 per cent while after 3 days starvation it produced a hyperglycemiaof 243 per cent.
We have found in rabbits that fasting greatly decreases the rate of dis-appearance of glucose from the blood after a hyperglycemia. We have en-deavored to ascertain the cause of this decrease and what substances wouldbring the tolerance back to normal, in other words what stimulates themechanism for taking the sugar out of the blood. By this we hoped lightmight possibly be thrown on the process involved in the regulation of theblood sugar level and removal of glucose from the blood.
.lethods.
The rabbits used in these experiments were bled from themarginal ear vein. About 1 cc. of blood was taken for the
determination of the blood sugar which was done by the methodof Folin and Wu (43); for the determination of pH the blood was
o01lected from the marginal vein of the ear. The blood was
brought to the ear by applying xylol freely. The vein was cutand the blood allowed to collect on the ear in a little pool covered
with paraffin oil and the blood pipetted from this. The pH wasdetermined by the method of Hawkins (44). The carbon dioxide
CaPaeity was found by the method of Van Slyke and Stadie (45).In the alimentary glucose tolerance tests the rabbits were
given 3 gin. of pure d-glucose per kilo of body weight in 35 cc. of
Water. The blood sugar was determined at hour intervals for
by guest on May 3, 2018
http://ww
w.jbc.org/
Dow
nloaded from

286 Carbohydrate Utilization. I
12 hours and then at hourly intervals for 2 hours. In itravenous tolerances 2 cc. of 50 per cent solution of d-glucoepkilo were injected into the marginal vein of the ear, andtblood sugar determined at intervals of 2 hour.
In cases where the tolerance test was made after f,the dosage of sugar was based on the weight of the animal befofasting. During the fasting periods the rabbits had waterlibitum.
TABLE I.
Alimentary Glucose Tolerance after 1 Day Fast.
3 gm. glucose per kilo.
RabbitNo.
17134578
1021233211
Average...
Normalblood sugarper 100 cc.
mg.
107
100125110125135135130105133125135
122
Periods after ingestion of glucose.
½ hr.
165170190170165 .190175171179190185260
184
1 hr.
163190230180175200180209165178200210
190
11 hrs.
142165200165175170170170137165175170
167
21 hrs.
129130125130160140140142129134140155
138
il108
120120
120125130110122122130
12
EXPERIMENTAL.
Effect of Fasting on Sugar Tolerance.
Table I gives the results of feeding 3 gm. of glucose per kito twelve rabbits that had been fasted 1 day. Table II preseTthe results of similar tests on nine rabbits that had been fasfor 4 days. The points of interest in these curves are, the heiiof the curve, the time at which it returns to normal, and especiothe time that the maximum of the curve appears. In the 5of the I day fast curves, the majority have their maximthe hour point and have generally returned to normal witb22 hours. On the other hand, in the 4 day fasted animals
---
by guest on May 3, 2018
http://ww
w.jbc.org/
Dow
nloaded from
V. du Vigneaud and W. G. Karr 287
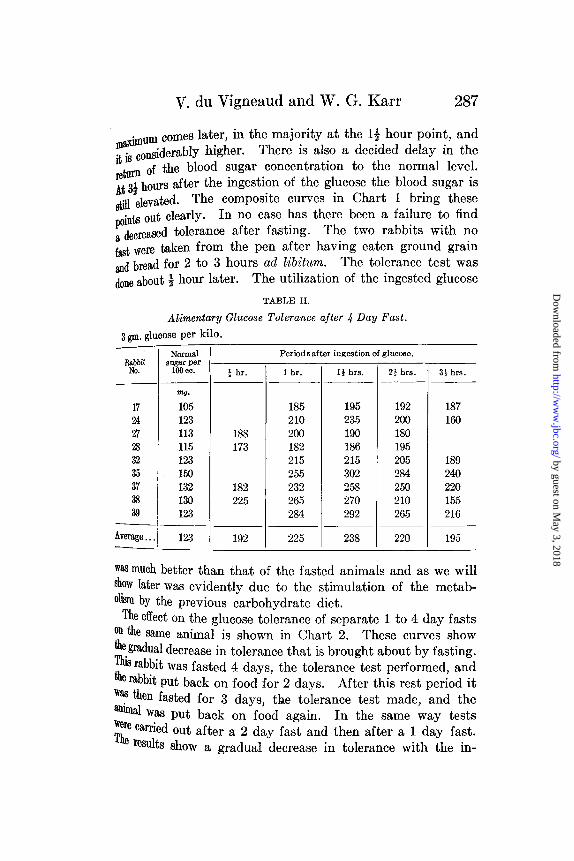
biuum comes later, in the majority at the 1 hour point, and
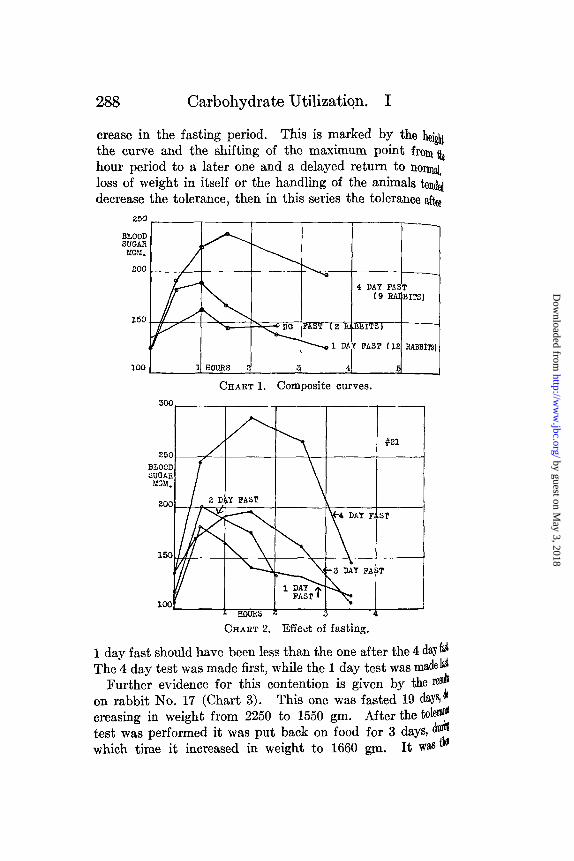
it is considerably higher. There is also a decided delay in theretrn of the blood sugar concentration to the normal level.At 3½ hours after the ingestion of the glucose the blood sugar isst elevated. The composite curves in Chart 1 bring these
points out clearly. In no case has there been a failure to finda decreased tolerance after fasting. The two rabbits with nofast were taken from the pen after having eaten ground grainand bread for 2 to 3 hours ad libitum. The tolerance test wasdone about hour later. The utilization of the ingested glucose
TABLE II.
Alimentary Glucose Tolerance after 4 Day Fast.
3 gm. glucose per kilo.
RabbitNo.
172427283235373839
Average ...
Normalsugar per
100 c.
mg.
105123113115123150132130123
123
Periods after ingestion of glucose.
X hr.
188173
182225
192
Ihr.
185210200182215255232265284
225
ii hrs.
195235190186215302258270292
238
2' hra.
192200180195205284250210265
220
31 hrs.
187160
189240220155216
195
was much better than that of the fasted animals and as we willshow later was evidently due to the stimulation of the metab-olism by the previous carbohydrate diet.
The effect on the glucose tolerance of separate 1 to 4 day fastson the same animal is shown in Chart 2. These curves showthe gradual decrease in tolerance that is brought about by fasting.This rabbit was fasted 4 days, the tolerance test performed, andthe rabbit put back on food for 2 days. After this rest period itwas then fasted for 3 days, the tolerance test made, and theanimal was put back on food again. In the same way testswere carried out after a 2 day fast and then after a 1 day fast.The results show a gradual decrease in tolerance with the in-
by guest on May 3, 2018
http://ww
w.jbc.org/
Dow
nloaded from
288 Carbohydrate Utilization. I
crease in the fasting period. This is marked by the heigtthe curve and the shifting of the maximum point from tehour period to a later one and a delayed return to normnaloss of weight in itself or the handling of the animals tendeddecrease the tolerance, then in this series the tolerance after
25C
BLOODSUGA.
200
150
100
/
HOURS 2
PAST ( 2 R
4 DAY FAS(9 RA
LBBITS)
--- DAY FAST (12
41 ACHART 1. Composite curves.
.%M.
250
BLOODSUGARMOM.
200
150
10oo
22) X AST
X\
rBITS)
RABBITS)
#21
ST
7FIAYT
CHART 2. Effect of fasting.
1 day fast should have been less than the one after the 4 day f&The 4 day test was made first, while the 1 day test was made 1l
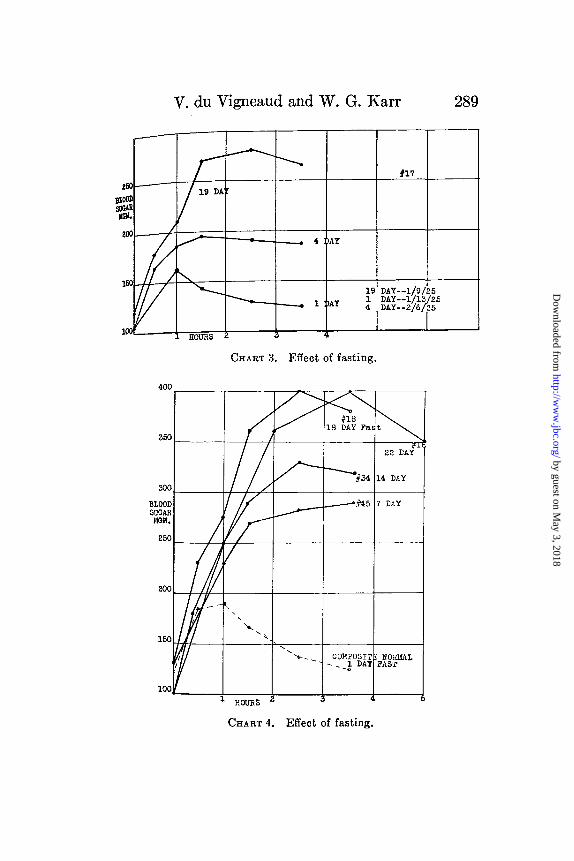
Further evidence for this contention is given by the reion rabbit No. 17 (Chart 3). This one was fasted 19 days, dcreasing in weight from 2250 to 1550 gm. After the tolertest was performed it was put back on food for 3 days, duwhich time it increased in weight to 1660 gm. It was i
4 DAY F
-3 DAY
a
FAS
I
r"I
k
r
I
ST
POURS , _A) I
by guest on May 3, 2018
http://ww
w.jbc.org/
Dow
nloaded from
V. du Vigneaud and W. G. Karr 289
CHART 3. Effect of fasting.
CHART 4. Effect of fasting.
by guest on May 3, 2018
http://ww
w.jbc.org/
Dow
nloaded from
290 Carbohydrate Utilization. I
fasted for 1 day and the sugar tolerance repeated. Aboutweeks later, a tolerance test was made after a 4 day fast.this time it weighed 1770 gm. before and 1570 gm. after the fai
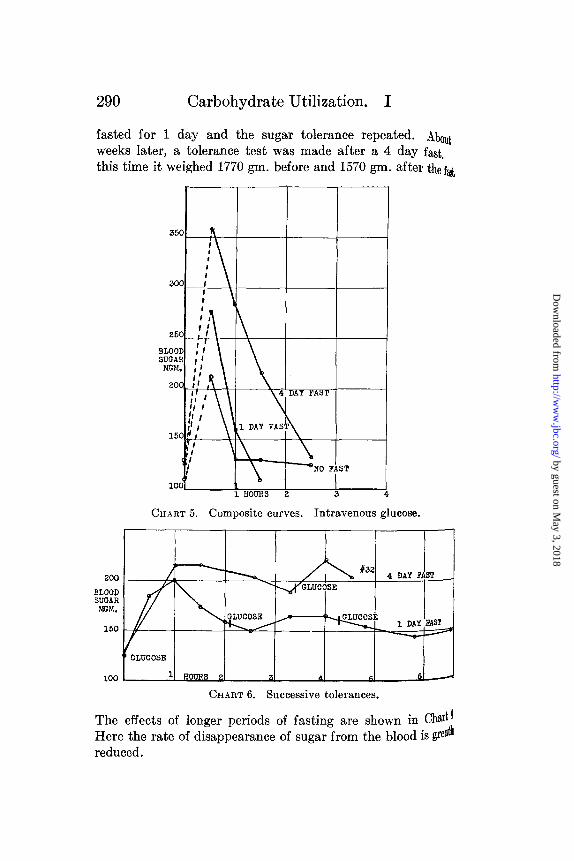
CHART 5. Composite curves. Intravenous glucose.
200
BLOODSUGAR
150
100
_N #32ST4 DAY AI/ I N
. GLUCOSE
JLUCOSE
GLUCOSE
CHART 6. Successive tolerances.
The effects of longer periods of fasting are shown in Ch'tlHere the rate of disappearance of sugar from the blood is greth
reduced.
OLco OS
Z
I I A_
n�!!�
3 111 A
,' ."l 1I
f -AV
by guest on May 3, 2018
http://ww
w.jbc.org/
Dow
nloaded from
V. du Vigneaud and W. G. Karr
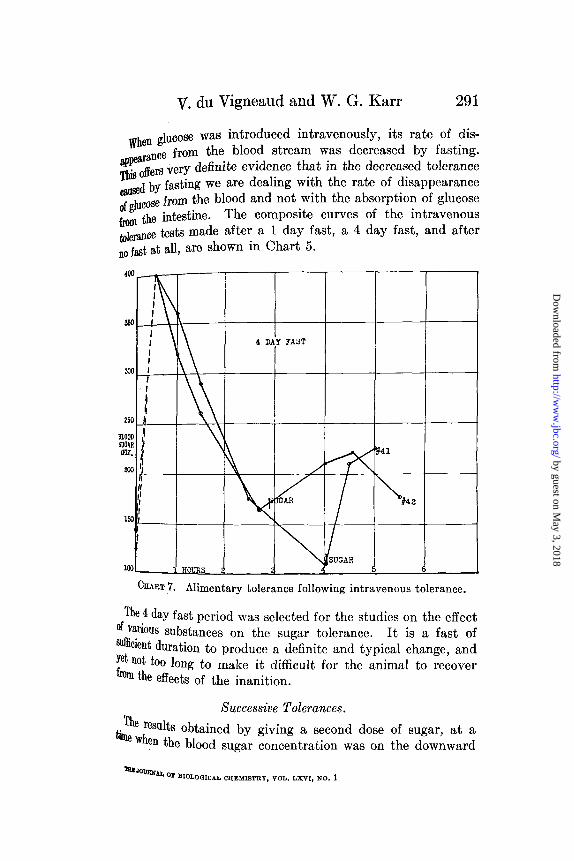
When glucose was introduced intravenously, its rate of dis-~pearance from the blood stream was decreased by fasting.
is offers very definite evidence that in the decreased toleranceused by fasting we are dealing with the rate of disappearance
of glucose from the blood and not with the absorption of glucose
from the intestine. The composite curves of the intravenoustolerance tests made after a 1 day fast, a 4 day fast, and afterno fast at all, are shown in Chart 5.
CHART 7. Alimentary tolerance following intravenous tolerance.
The 4 day fast period was selected for the studies on the effectof various substances on the sugar tolerance. It is a fast ofsuicient duration to produce a definite and typical change, andyet not too long to make it difficult for the animal to recoverfrom the effects of the inanition.
Successive Tolerances.
The results obtained by giving a second dose of sugar, at atime hen the blood sugar concentration was on the downward
OF BIOLOGIcAL CEMISTRY, VOI. LXVI, NO. I
291
by guest on May 3, 2018
http://ww
w.jbc.org/
Dow
nloaded from
292 Carbohydrate Utilization. I
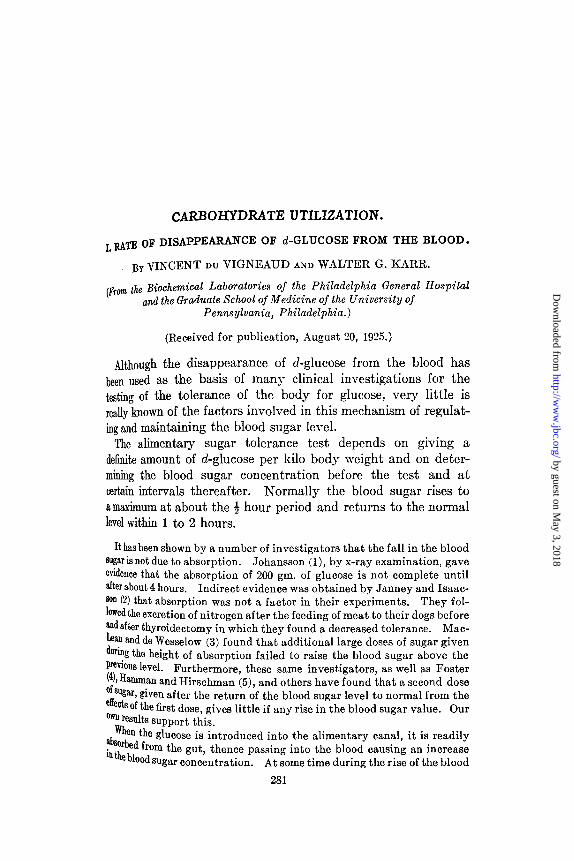
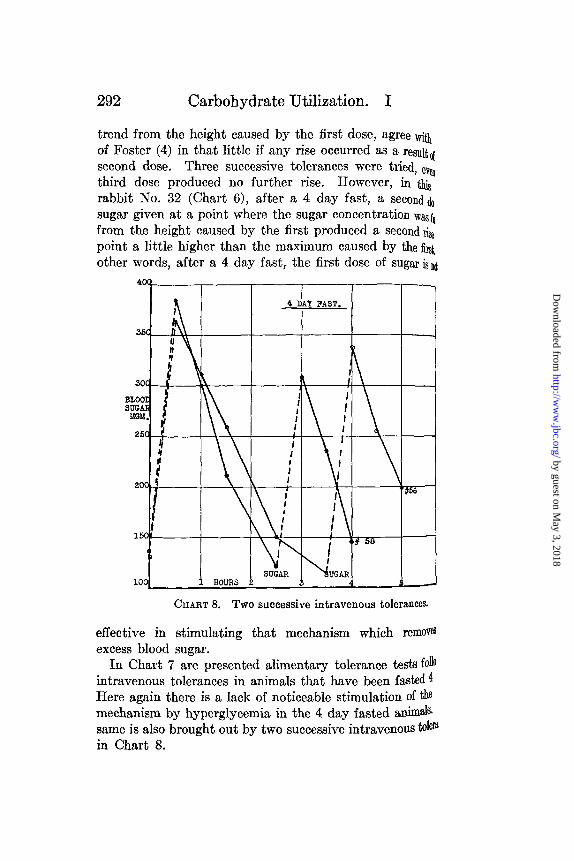
trend from the height caused by the first dose, agree withof Foster (4) in that little if any rise occurred as a resultssecond dose. Three successive tolerances were tried, evthird dose produced no further rise. However, in tirabbit No. 32 (Chart 6), after a 4 day fast, a second dosugar given at a point where the sugar concentration was ffrom the height caused by the first produced a second repoint a little higher than the maximum caused by the firsother words, after a 4 day fast, the first dose of sugar isn
CHART 8. TWO successive intravenous tolerances.
effective in stimulating that mechanism which removesexcess blood sugar.
In Chart 7 are presented alimentary tolerance tests foliointravenous tolerances in animals that have been fasted 4Here again there is a lack of noticeable stimulation of themechanism by hyperglycemia in the 4 day fasted animals.same is also brought out by two successive intravenous tol0in Chart 8.
by guest on May 3, 2018
http://ww
w.jbc.org/
Dow
nloaded from

V. du Vigneaud and W. G. Karr 293
Effect of Various Foodstuffs on the Glucose Tolerance.
In this series of experiments to determine the efficacy of vari-0 foodstuffs in stimulating the sugar-regulating mechanism,wbe animals were fasted for 4 days before the tolerance test
acept for a specific foodstuff given at a stated interval beforee test. Chart 9 compares the results obtained by the feeding
BLOOD
1GM.
200
150
100
PREVIOUS7 RABBITS
COILPOSITE
r4 DAY FA:= 18 HR.COUPOSITE
I'
18 R.PREV IOUS4 RABBITS
18 HR.PREVIOUS3 RABBITS
/ z-77-1 HOURS
CHART 9. Effect of previous diet.
CHART 10. Effect of white of egg with and before glucose.
Of fat, glucose, and protein 18 hours before the tolerance testwith the normal 4 day fast curve.
The results obtained from feeding 10 gm. of lard oil the nightbefre the test showed a decrease in tolerance.
The effect of glucose was studied by giving 10 gm. of glucose18hours before the test. A slight increase in tolerance resulted.
GLUCOSE
i_
-
4
by guest on May 3, 2018
http://ww
w.jbc.org/
Dow
nloaded from
294 Carbohydrate Utilization. I
Gelatin seemed to have the greatest effect in increasingsugar tolerance. 10 gm. given the night before, 18 hourslbthe test, in all cases produced a remarkable increase inglucose tolerance.
Chart 10 shows the glucose tolerance tests on a rabbitft4 day fast and the effects of 40 gm. of egg white given atsame time, at 4 hours before, and at 18 hours before the giwas ingested. The protein given simultaneously with theseand that given 4 hours before the test had little if any eedthe sugar tolerance, but when given the night before theresulted in a very greatly increased tolerance.
That the increased tolerance is not related with the preeof material in the alimentary tract is shown by the fact that
200
BLOODSUGARMGM.
1509
100
ADREIL
/'
//
IaB RISE0.3 IM.
~nrm
I.
i DAY PAST
OSE
.6mgADRENALIN 18 EIRS.BEFORE
I I
-4
CHART 11. Effect of adrenalin.
fat meal produced no favorable influence on the toleranceanything, it decreased the tolerance still further. Furthemothe feeding of agar-agar produced negative results.
Effect of Adrenalin and Morphine.
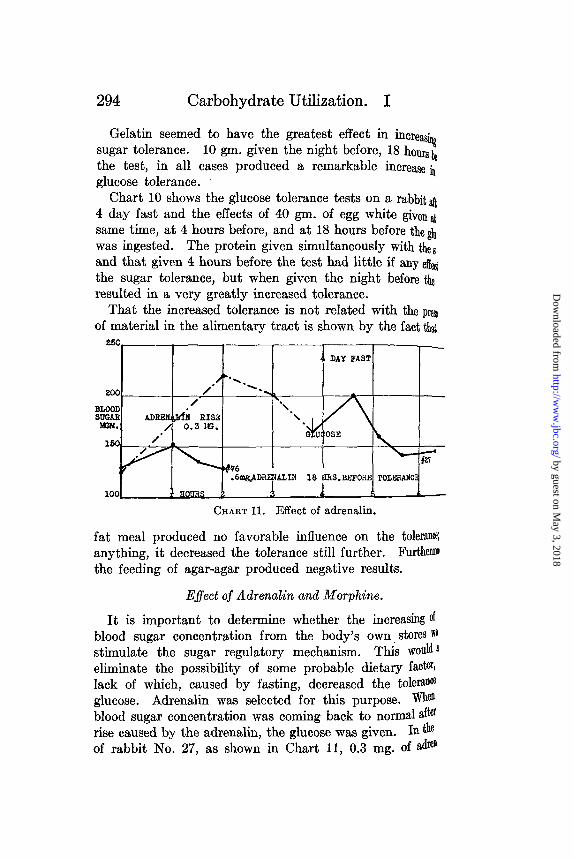
It is important to determine whether the increasing ofblood sugar concentration from the body's own stores '"stimulate the sugar regulatory mechanism. This would leliminate the possibility of some probable dietary factor,lack of which, caused by fasting, decreased the toleranceglucose. Adrenalin was selected for this purpose. Wheblood sugar concentration was coming back to normal afterrise caused by the adrenalin, the glucose was given. In theof rabbit No. 27, as shown in Chart 11, 0.3 mg. of adr
V6r I
TOLERAD _. .. _
i . v^Lv_ .
I:
_
I.-,
by guest on May 3, 2018
http://ww
w.jbc.org/
Dow
nloaded from

V. du Vigneaud and W. G. Karr 295
given hypodermically, causing a rise in the blood sugar/~m 125 to 220 mg. per 100 cc. in 2 hours. At the 3 hourpont 3 g. of glucose per kilo were given by stomach tube. Thetolerance was only slightly increased, yet more so than a tol-eracne performed after a previous dose of sugar in an animalfasted 4 days. However, when the adrenalin was given the
eight before, the tolerance was increased to a remarkable degree(Chart 11).
In considering why adrenalin should be so effective in in-creasing the tolerance, the rise in the blood sugar suggests itselfas being the causative factor. Consequently a hyperglycemiawas produced by other means to see if this also would increase
zoo
corn
CHART 12. Effect of morphine.
the tolerance. 20 mg. of morphine sulfate were given to thefated animal the night before the test. Even though the bloodSugar concentration was increased as by adrenalin, there wasno increase in the sugar tolerance (Chart 12). Evidently theincrease of the blood sugar from its own stores with its sub-8luent removal does not in itself stimulate the sugar regulatorymeehanism. The cause of the action of adrenalin in this respectmust be found elsewhere.
Effect of Insulin.
Since the action of adrenalin with its resultant hyperglycemia&ads to increase the rate of disappearance of the sugar from
20 MCl. IMORPHINE SULFATE18 HRS. PREVIOUS
> /anu a c
by guest on May 3, 2018
http://ww
w.jbc.org/
Dow
nloaded from
296 Carbohydrate Utilization. I
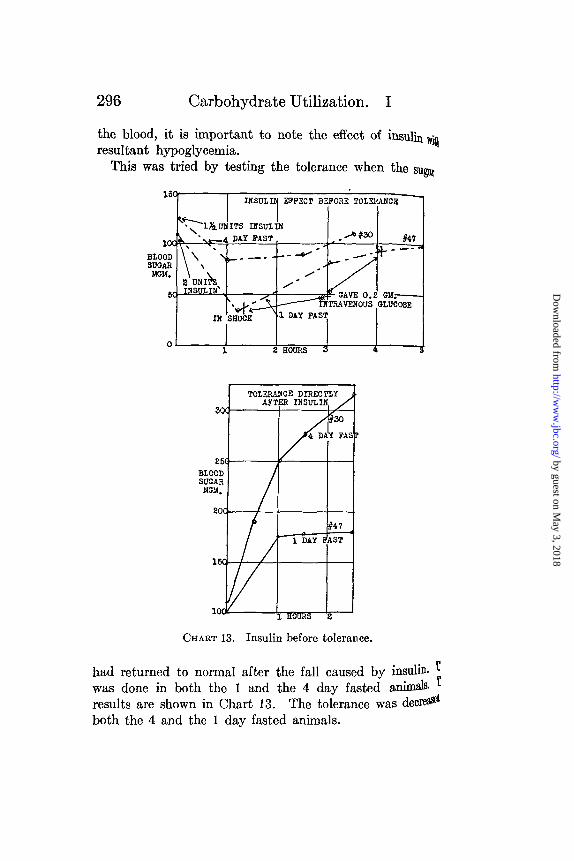
the blood, it is important to note the effect of insulin wiresultant hypoglycemia.
This was tried by testing the tolerance when the sugar
BLOODSUGARMGM.
on,
15
1o.1 f rVJ
r
CHART 13. Insulin before tolerance.
had returned to normal after the fall caused by insulin. Twas done in both the 1 and the 4 day fasted animas rIresults are shown in Chart 13. The tolerance was decreOboth the 4 and the 1 day fasted animals.
TOLERANCE DIRECTYAIP'ER TNSIT.TN -
47IST-N1 DY I
k
........... f /
30
ZATI AS/e v _
onna� pT
by guest on May 3, 2018
http://ww
w.jbc.org/
Dow
nloaded from
V. du Vigneaud and W. G. Karr 297
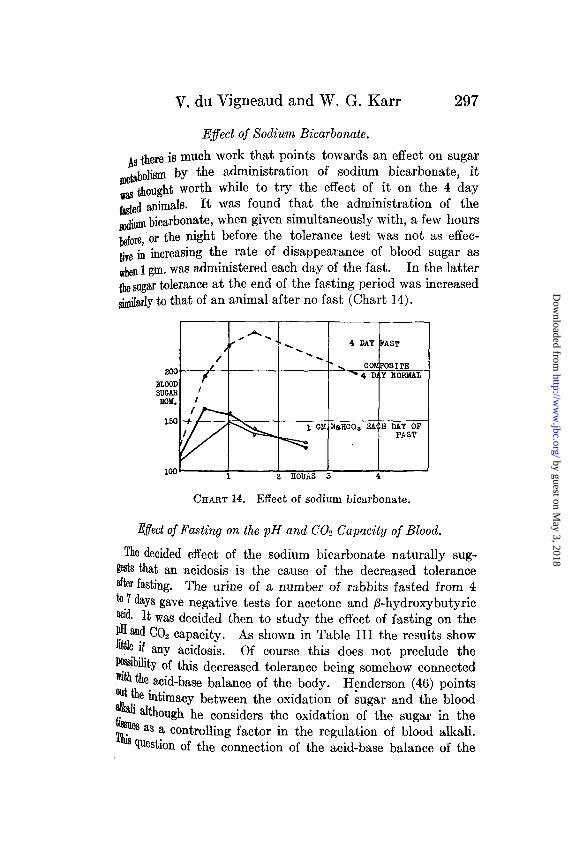
Effect of Sodium Bicarbonate.
As there is much work that points towards an effect on sugarmetabolism by the administration of sodium bicarbonate, it,as thought worth while to try the effect of it on the 4 day
fasted animals. It was found that the administration of thesodium bicarbonate, when given simultaneously with, a few hoursbefore, or the night before the tolerance test was not as effec-ive in increasing the rate of disappearance of blood sugar aswhen 1 gm. was administered each day of the fast. In the latterthe sugar tolerance at the end of the fasting period was increasedsimilarly to that of an animal after no fast (Chart 14).
BLSUIi
0 F- -4 DAY AST
200 /COMPOSITE
.OODrGARGVl. I
1501 GNaHCOs H AY OF
FAST
I n1 2B HOURS 4
CHART 14. Effect of sodium bicarbonate.
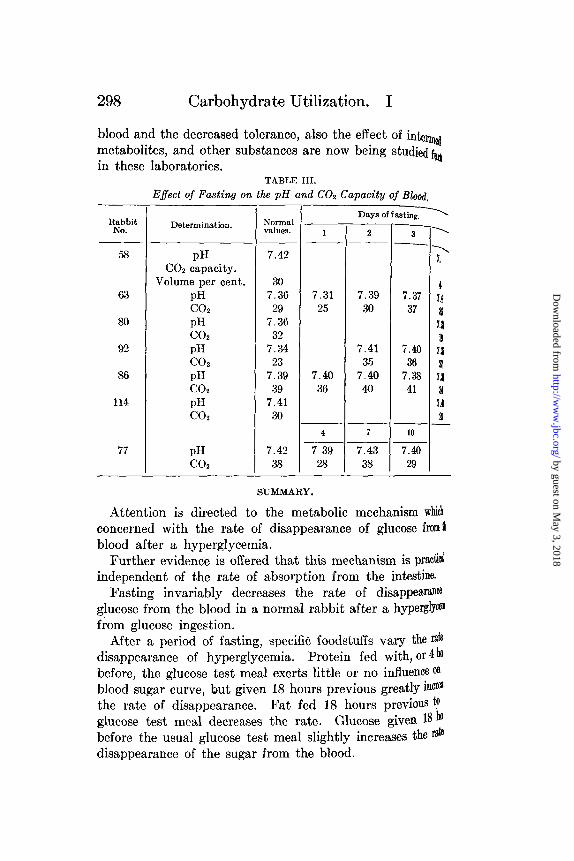
Effect of Fasting on the pH and CO 2 Capacity of Blood.
The decided effect of the sodium bicarbonate naturally sug-gests that an acidosis is the cause of the decreased toleranceafter fasting. The urine of a number of rabbits fasted from 4to 7 days gave negative tests for acetone and -hydroxybutyricaid. It was decided then to study the effect of fasting on theP1 and CO2 capacity. As shown in Table III the results showlittle if any acidosis. Of course this does not preclude thePossibility of this decreased tolerance being somehow connectedwith the acid-base balance of the body. Henderson (46) pointsout the intimacy between the oxidation of sugar and the blood
akai although he considers the oxidation of the sugar in thetissues as a controlling factor in the regulation of blood alkali.
question of the connection of the acid-base balance of the
by guest on May 3, 2018
http://ww
w.jbc.org/
Dow
nloaded from
298 Carbohydrate Utilization. I
blood and the decreased tolerance, also the effect of interimmetabolites, and other substances are now being studied foin these laboratories.
TABLE III.
Effect of Fasting on the pH and C02 Capacity of Blood.
RabbitNo.
58
63
80
92
86
114
77
Determination.
pHCO2 capacity.
Volume per cent.pHCO2pHCO2pHCO2pHCO2pHCO2
pHCO2
Normalvalues.
7.42
307.3629
7.3632
7.3423
7.3939
7.4130
7.4238
Days of f asting.
1
7.3125
7.4036
4
7 3928
2
7.3930
7.4135
7.4040
7
7.4338
3
7.3737
7.4036
7.3841
10
7.4029
7.
7.'
4
7.1
21
7.l
a
SUMMARY.
Attention is directed to the metabolic mechanism whi6concerned with the rate of disappearance of glucose fromblood after a hyperglycemia.
Further evidence is offered that this mechanism is practi4independent of the rate of absorption from the intestine.
Fasting invariably decreases the rate of disappearanceglucose from the blood in a normal rabbit after a hyperglyO'from glucose ingestion.
After a period of fasting, specifiC foodstuffs vary the ratdisappearance of hyperglycemia. Protein fed with, or 4tbefore, the glucose test meal exerts little or no influence o0blood sugar curve, but given 18 hours previous greatly inca0the rate of disappearance. Fat fed 18 hours previous toglucose test meal decreases the rate. Glucose given 18 hebefore the usual glucose test meal slightly increases the ratdisappearance of the sugar from the blood.
by guest on May 3, 2018
http://ww
w.jbc.org/
Dow
nloaded from
V. du Vigneaud and W. G. Karr 299
Adrenalin given 18 hours previous to the glucose test mealgreatly increases the rate of disappearance while morphine doesnot, although both produce hyperglycemias. This indicates that
a previous hyperglycemia is not the only stimulating factor.A glucose test meal immediately after an insulin hypoglycemia
has returned to normal shows a decreased rate of disappearanceof sugar from the blood.
Sodium bicarbonate administered during a fast prevents thedecrease in rate of disappearance of blood sugar normally occur-ring after a glucose test meal. Blood pH and CO2 studies indi-cate that acidosis is not the predominant factor in causing thischange during a fast.
The experimental data presented emphasize greatly the im-portance of carefully controlling the diet, period of fasting, andmedication before performing the customary sugar tolerance testused in clinical diagnosis.
BIBLIOGRAPHY.
1. Johansson, J. E., Skand. Arch. Physiol., 1909, xxi, 1.2. Janney, N. W., and Isaacson, V. I., Arch. Int. Med., 1918, xxii, 160.3. MacLean, H., and de Wesselow, O. L. V., Quart. J. Med., 1920-21, xiv,
103.4. Foster, G. L., J. Biol. Chem., 1923, lv, 303.5. Hamman, L., and Hirschman, I. I., Bull. Johns Hopkins Hosp., 1919,
xxx, 306.6. Greenwald, I., Gross, J., and Samet, J., J. Biol. Chem., 1924-25, lxii, 401.7. Cori, C. F., and Cori, G. T., Am. J. Physiol., 1924-25, lxxi, 68.8. Frank, E., Nothmann, M., and Wagner, A., Klin. Woch., 1924, iii, 581.9. Lawrence, R. D., Brit. Med. J., 1924, i, 516.10. Mann, F. C., and Magath, T. B., Am. J. Physiol., 1923, lxv, 403.Il. Macleod, J. J. R., Physiol. Rev., 1924, iv, 21.12. Palmer, W. W., J. Biol. Chem., 1917, xxx, 79.13. Blatherwick, N. R., Bell, M., and Hill, E., J. Biol. Chem., 1924, lxi, 241.14. Harrop, G. A., Jr., and Benedict, E. M., J. Biol. Chem., 1924, lix, 683.15. Wigglesworth, V. B., Woodrow, C. E., Smith, W., and Winter, L. B.,
J. Physiol., 1922-23, lvii, 447.16. Briggs, A. P., Koechig, I., Doisy, E. A., and Weber, C. J., J. Biol.
Chem., 1923-24, lviii, 721..Bolliger A., tman, F. W., J. Biol. Chem., 1925, lxiv, 91.
19 Cori, C. F., and Goltz, H. L., Am. J. Physiol., 1925, lxxii, 256.29 Gaman, L, and Hirschman, I. I., Arch. Int. Med., 1917, xx, 761.21' ey.elin, Ar ch. Int. Med., 1915, xvi, 975.* Deais, W., Aub, J. C., and Minot, A. S., Arch. Int. Med., 1917, xx, 964.
by guest on May 3, 2018
http://ww
w.jbc.org/
Dow
nloaded from
300 Carbohydrate Utilization. I
22. Labb6, M., Ann. med. 1925, xvii, 116.23. Killian, J. A., Proc. Soc. Exp. Biol. and Med., 1919-20, xvii, 91.24. Labb6, M., Labb6, H., and Nepveux, F., Compt. rend. Soec. biol,
lxxxvi, 1014.25. Du Bois, E. F., Arch. Int. Med., 1916, xvii, 915.26. Bodansky, A., Simpson, S., and Goldberg, S., Proc. Soc. Exp. B
Med., 1922-23, xx, 195.27. McCurdy, J., J. Ezp. Med., 1909, xi, 798.28. Olmsted, W. H., and Gay, L. P., Arch. Int. Med., 1922, xxix, 384.29. Kuriyama, S., Am. J. Physiol., 1917, xliii, 481.30. Barker, L. F., Endocrinology and metabolism, New York and I
1922, i, 635.31. Cushing, H., The pituitary body and its disorders, Philadelp
London, 1912.32. Beck, H. G., Endocrinology and metabolism, New York andl
don, 1922, i, 895.33. Achard, C., Ribot, A., and Binet, L., Compt. rend. Soc. biol.,
lxxxii, 788.34. Partos, A., and Katz-Klein, F., Z. ges. exp. Med., 1921, xxv, 98.35. Kojima, M., J. Physiol., 1915-16, 1, p. xlv.36. Lusk, G., and Riche, J. A., Arch. Int. Med., 1914, xiii, 673.37. Tsubura, Biochem. Z., 1923, cxliii, 248.38. Kageura, N., J. Biochem., 1922, i, 333.39. Kageura, N., J. Biochem., 1922, i, 389.40. Southwood, A. R., Med. J. Australia, 1923, x, pt. 2, 460.41. Staub, H., Z. klin. Med., 1922, xciii, 89.42. Traugott, K., Klin. Woch., 1922, i, 892.43. Folin, O., and Wu, H., J. Biol. Chem., 1920, xli, 367.44. Hawkins, J. A., J. Biol. Chem., 1923, Ivii, 493.45. Van Slyke, D. D., and Stadie, W. C., J. Biol. Chem., 1921, xlix, .46. Henderson, Y., Physiol. Rev., 1925, v, 131.
by guest on May 3, 2018
http://ww
w.jbc.org/
Dow
nloaded from
Vincent du Vigneaud and Walter G. KarrBLOOD
THEDISAPPEARANCE OF d-GLUCOSE FROM CARBOHYDRATE UTILIZATION: I. RATE OF
1925, 66:281-300.J. Biol. Chem.
http://www.jbc.org/content/66/1/281.citation
Access the most updated version of this article at
Alerts:
When a correction for this article is posted•
When this article is cited•
to choose from all of JBC's e-mail alertsClick here
t-1
http://www.jbc.org/content/66/1/281.citation.full.html#ref-lisfree atThis article cites 0 references, 0 of which can be accessed
by guest on May 3, 2018
http://ww
w.jbc.org/
Dow
nloaded from