Car-based Bat Monitoring in Ireland 2003-2011 - NPWS
88
Car-based Bat Monitoring in Ireland 2003-2011 Irish Wildlife Manuals No. 60
Transcript of Car-based Bat Monitoring in Ireland 2003-2011 - NPWS

Car-based Bat Monitoring in
Ireland 2003-2011
Irish Wildlife Manuals No. 60


Car-based Bat Monitoring in Ireland 2003-2011
Niamh Roche, Steve Langton and Tina Aughney
Citation:
Roche, N., Langton, S. and Aughney T. (2012) Car-based bat monitoring in Ireland 2003-2011. Irish
Wildlife Manuals, No. 60. National Parks and Wildlife Service, Department of the Arts, Heritage and
the Gaeltacht, Ireland.
Keywords: Irish bats, pipistrelle, Leisler’s, Annex IV, population monitoring, trends, street lights,
weather, climate change, cat abundance, threats
Cover image: Map of survey routes; see Page 16.
The NPWS Project Officer for this report was: Dr Ferdia Marnell; [email protected]
Irish Wildlife Manuals Series Editors: F. Marnell & N. Kingston
© National Parks and Wildlife Service 2012
ISSN 1393 – 6670


Car-based Bat Monitoring 2003-2011
____________________________
Contents
Executive Summary........................................................................................................................................ 1
Acknowledgements ........................................................................................................................................ 3
Introduction..................................................................................................................................................... 5
Why Monitor Bats? ..................................................................................................................................... 5
Red and Amber Alerts................................................................................................................................ 6
Bat Monitoring Schemes ............................................................................................................................ 6
Factors Impacting Bat Abundance............................................................................................................ 7
Weather .................................................................................................................................................... 7
Street lights .............................................................................................................................................. 8
Landscape Suitability ............................................................................................................................. 9
Aims of a Car-based Bat Monitoring Scheme ......................................................................................... 9
Aims of This Report.................................................................................................................................. 10
Methods.......................................................................................................................................................... 11
Statistical Analysis .................................................................................................................................... 12
Trends: GAM and TRIM ...................................................................................................................... 12
Weather .................................................................................................................................................. 13
Street lights ............................................................................................................................................ 13
Landscape Suitability ........................................................................................................................... 13
Smartphone Trials................................................................................................................................. 14
Other Vertebrates...................................................................................................................................... 14
Statistical Analysis ................................................................................................................................ 14
Results ............................................................................................................................................................ 15
Dataset Generated..................................................................................................................................... 17
Smartphone Trials..................................................................................................................................... 19
Common pipistrelle .................................................................................................................................. 20
Yearly Trends ........................................................................................................................................ 21
GAM and TRIM .................................................................................................................................... 22
Weather .................................................................................................................................................. 23
Landscape Suitability ........................................................................................................................... 23
Street lights ............................................................................................................................................ 26

Car-based Bat Monitoring 2003-2011
____________________________
Soprano pipistrelles .................................................................................................................................. 27
Yearly Trends ........................................................................................................................................ 27
GAM and TRIM .................................................................................................................................... 28
Weather .................................................................................................................................................. 29
Landscape Suitability ........................................................................................................................... 29
Street lights ............................................................................................................................................ 31
Leisler’s Bat................................................................................................................................................ 32
Yearly Trends ........................................................................................................................................ 32
GAM and TRIM .................................................................................................................................... 34
Weather .................................................................................................................................................. 35
Landscape Suitability ........................................................................................................................... 36
Street lights ............................................................................................................................................ 38
Summary Trends....................................................................................................................................... 40
Nathusius’ pipistrelle ............................................................................................................................... 40
Yearly Trends ........................................................................................................................................ 40
Landscape Suitability ........................................................................................................................... 42
Myotis species ............................................................................................................................................ 44
Brown long-eared bat ............................................................................................................................... 45
Other Vertebrates...................................................................................................................................... 46
Discussion ...................................................................................................................................................... 49
Species Trends........................................................................................................................................... 49
Weather Variables & Climate Change Predictions .............................................................................. 50
Street lights ................................................................................................................................................ 51
Landscape Analysis .................................................................................................................................. 52
GAM and TRIM Trends ........................................................................................................................... 53
Other Vertebrates...................................................................................................................................... 54
Summary and Assessment of Threats.................................................................................................... 54
Common pipistrelle.............................................................................................................................. 54
Soprano pipistrelle................................................................................................................................ 55
Leisler’s bat ............................................................................................................................................ 56
Conclusions and Recommendations ...................................................................................................... 56

Car-based Bat Monitoring 2003-2011
____________________________
Bibliography and Relevant Literature........................................................................................................ 59
Glossary of Terms ......................................................................................................................................... 61
Appendix ....................................................................................................................................................... 63
Summary statistics .................................................................................................................................... 63
Weather Data ............................................................................................................................................. 67
Street Light Analysis................................................................................................................................. 68
Binomial GAM Analysis: Brown Long-eared Bat................................................................................. 68
Locations and Descriptions of Survey Routes ...................................................................................... 70


Car-based Bat Monitoring 2003-2011
____________________________
1
Executive Summary
The first systematic car-based bat monitoring system in Europe was devised for the Republic of
Ireland (ROI) in 2003 by the Bat Conservation Trust (BCT, UK). The scheme has been administered by
Bat Conservation Ireland (BCIreland) since 2004 with funding from the National Parks and Wildlife
Service (NPWS) of the Department of Arts, Heritage and the Gaeltacht and the Northern Ireland
Environment Agency (NIEA). The main aim of the scheme is to monitor roadside populations of
common pipistrelle, soprano pipistrelle and Leisler’s bat and to collect sufficient data to identify
trends in bat populations.
The method involves driving a known survey route at 24kmph with a time expansion bat detector
clamped to the open window of the passenger door. Each survey route consists of 15, 1.6km transects,
separated by a 3.2km gap to minimise the possibility of repeat encounters with the same bats. Sounds
are usually recorded to minidisc, but a trial using smart phones (Android, HTC) for recording was
carried out in 2011. Recordings are analysed by BCIreland using Bat Sound™ software. In the initial
pilot study in 2003, routes were mapped and surveyed within seven, randomly selected, 30km
squares. The coverage across the country increased yearly until 2007, when routes had been mapped
in 28, 30km blocks. Surveys are carried out in July and August by trained volunteers who are mainly
staff of NPWS and NIEA, and BCIreland members. Between 60 and 70 surveyors spend approximately
300hrs per annum carrying out the survey.
All 28 squares are usually surveyed every year, meaning that the data collected has high power to
detect increases or declines in the target species. Since 2009, on average 1269km of monitoring
transects have been driven each year. From 2003 to 2011, 10351km of monitoring transects have been
surveyed. In total, 21172 bat passes have been recorded by this monitoring scheme.
The common pipistrelle is the most frequently encountered species. On average 1.55 common
pipistrelle passes are recorded during each 1.6km monitoring transect. The soprano pipistrelle is
usually the second most frequently encountered species each year. On average 0.67 soprano pipistrelle
encounters are recorded from each 1.6km transect. The Leisler’s bat is usually the third most
frequently encountered bat species. On average, 0.636 Leisler’s bat passes are recorded during each
1.6km transect. Other species such as Myotis spp., Nathusius’ pipistrelle and brown long-eared bats
are recorded by the survey in very low numbers.
Smart phones were found to produce recordings with similar results to recordings made with
traditional minidisc recorders or other digital methods. Smart phones have an additional advantage in
allowing georeferencing of bat locations, something that has not, heretofore, been possible.
GAM models fitted to the yearly (adjusted) encounter rate data for each species show that the
roadside common pipistrelle population is stable. The soprano pipistrelle is showing an increasing
trend that is just about significant. Leisler’s bat is showing a significant increase. Nathusius’ pipistrelle
data are very limited but show a fairly stable trend, although there are very wide error bars for this
species.
Comparison between the GAM and TRIM (TRends and Indices in Monitoring data) methods of
estimating population trends were made using the 2003-2011 dataset. The two methods were found to
produce very similar yearly estimates but standard errors are calculated differently so these varied
Car-based Bat Monitoring 2003-2011
____________________________
2
depending on the species. The smoothed population trend data derived from GAM modeling was
found to facilitate easier interpretation, compared with TRIM, and we propose to continue using GAM
models to interpret bat population trends from the car-based bat monitoring dataset.
An analysis of landscape suitability for bats in Ireland was carried out in 2011 by Lundy et al. and
results from that study were applied to car-based bat monitoring data. We examined whether survey-
square level activity of each species was correlated with the mean landscape suitability index (Lundy
et al. 2011) for the survey route, and whether differences in trends could be seen in squares that were
more or less suitable (than the median). Common and soprano pipistrelle activity levels were
positively correlated with predicted landscape suitability (though not significantly), while Leisler’s bat
activity was not correlated with predicted landscape suitability. The Leisler’s bat, on the other hand,
showed a significant correlation with temperature, while the pipistrelles did not. These interactions
are discussed in the context of climate change and global warming.
We also found a different relationship between Leisler’s bats and street lighting, compared with the
pipistrelles. The common and soprano pipistrelles were not significantly impacted by the presence of
street lighting along survey routes, whilst Leisler’s bat activity was positively correlated with the
presence of yellow and white street lights.
Other vertebrates were recorded by surveyors during each survey night and in total 2053 living
vertebrates other than bats have been recorded from the car-based surveys in July and August, from
2006 to 2011. The most common species is the domestic cat, which accounts for 54% of all living
vertebrates observed. Cat abundance was analysed using TRIM and was found to have increased in
the first year or two, followed by a decrease in recent years. The next most common species
encountered are foxes and rabbits. By way of contrast the most commonly recorded dead vertebrates
are rabbits, followed by cats and rats.
A summary for each monitored species is provided, along with an assessment of threats in the context
of habitat use, climate change and other factors.

Car-based Bat Monitoring 2003-2011
____________________________
3
Acknowledgements
A very special THANK YOU to the surveyors from 2003 to present:
Wesley Atkinson Fiona Farrell Annette Lynch Áine O’Connor Fiona Wheeldon
Stephen Aughney Mairead Farrell Deirdre Lynn Séamus O’Connor Betty White
Tina Aughney Aine Fenner David Lyons A. O’Donaill Chris Wilson
Eric Bann Andrew Fenner Bella Lysaght Tim O’Donoghue Jane Woodlock
Ted Barker Catherine Finlay Liam Lysaght Sylvia O’Hehir Cathy
Chris Barron Jennifer Firth Pauli Lysaght Dennis O’Higgins
Imelda Barry Leonard Floyd Seppie Lysaght Ciarán O’Keeffe
Dominic Berridge Bill Forrest Kevin Maguire Ciara O’Mahony
John Biggane Kathryn Freeman Mary Maguire Elaine O’Riordáin
Eileen Biggane Emma Glanville Fidelma Maher Mike O'Leary
Sinéad Biggane Paddy Graham Ferdia Marnell Terence O'Rourke
Andy Bleasdale Gareth Grindle Mark Masterson Cormac Parle
Emma Boston James Harnett Kate McAney Una Patterson
Patricia Boston Eilin Harnett Eddie McCourt Diane Patterson
Shaun Boyle Niamh Harnett Annie McCourt Chris Peppiatt
Dermot Breen Grace Hassard James McCrory J Rainey
Daniel Buckley Rachel Hassard Lee McDaid Darren Reidy
Kieran Buckley Ian Hassard Larry McDaid Gill Robb
Carl Byrne Clare Heardman Tommy McDermott Niamh Roche
Susan Callaghan Catherine Higgins Dave McDonagh Gráinne Roche
Ruth Carden Therese Higgins David McDonagh Tim Roderick
Stephen Carters Rob Holloway Juliet McDonnell Lorcan Scott
Donna Cassidy Austin Hopkirk Heather McDowell Joe Sheehan
Damian Clark Kyle Hunter Emer McGee Lorna Somerville
Cameron Clotworthy Justin Ivory Kevin McGuire Ger Stanton
Jimi Conroy Adrianne Ivory Barbara McInerney Robert Steed
Joe Costelloe Rebecca Jeffrey Emma McLaughlin Jonathan Stevenson
Kerry Crawford Dellwyn Kane Melina McMullan Yvonne Temple
Denis Crinigan Elaine Keegan Michael McNamara Georgina Thurgate
Sarah Crinigan Brian Keeley Simon Mickleburgh Dave Tierney
Miriam Crowley Conor Kelleher Robbie Miller Risteard Tobin
Reggie Cunningham Tara Kelleher Ken Moore Deirdre Toomey
Sharon Cunningham Ger Kelleher James Moran Maurice Turley
Guy Dalton Gerry Kelly Enda Mullen Kathryn Turner
Hannah Denniston Bee Kesso Sinead Noonan Fernando Valverde
Andrew Dick James Kilroy David Norriss Alyn Walsh
Paschal Dower Naomi Kingston Irene O’Brien Gregor Watson
Catherine Farrell John Kinsella Mark O’Callaghan Gemma Weir
Thanks to staff at the NPWS, in particular Ferdia Marnell, Deirdre Lynn, Naomi Kingston, Gemma
Weir, Rebecca Jeffrey and Terence O’Rourke for their help and advice with overall project
development as well as particular aspects such as smart phone trials.

Car-based Bat Monitoring 2003-2011
____________________________
4
Thanks also to staff at the NIEA particularly Donna Cassidy and Declan Looney.
Many thanks to Cormac Parle for database and App development and technical support over the
course of the project.
Thanks to Jon Russ for sonogram analysis advice.
Thanks also to members of Bat Conservation Ireland’s committee.

Car-based Bat Monitoring 2003-2011
____________________________
5
Introduction
Why Monitor Bats?
Bats constitute a large proportion of the mammalian biodiversity in Ireland. Nine species of bat are
known to be resident in Ireland and form almost one third of Ireland’s land mammal fauna. Bats are a
species rich group widely distributed throughout the range of habitat types in the Irish landscape.
Due to their reliance on insect populations, specialist feeding behaviour and habitat requirements,
they are considered to be valuable environmental indicators of the wider countryside (Walsh et al.,
2001).
Irish bats are protected under domestic and EU legislation. Under the Republic of Ireland’s Wildlife
Act (1976) and Wildlife (Amendment) Act (2000) it is an offence to intentionally harm a bat or disturb
its resting place. Bats in Northern Ireland are similarly protected under the Wildlife (Northern
Ireland) Order 1985.
The EU Habitats Directive (92/43/EEC) lists all Irish bat species in Annex IV and one Irish species, the
lesser horseshoe bat (Rhinolophus hipposideros), in Annex II. Annex II includes animal species of
community interest whose conservation requires the designation of Special Areas of Conservation
(SACs) because they are, for example, endangered, rare, vulnerable or endemic. Annex IV lists various
species that require strict protection. Article 11 of the Habitats Directive requires member states to
monitor all species listed in the Habitats Directive and Article 17 requires States to report to the EU on
the findings of monitoring schemes.
Ireland and the UK are also signatories to a number of conservation agreements pertaining to bats
such as the Bern and Bonn Conventions. The Agreement on the Conservation of Populations of
European Bats (EUROBATS) is an agreement under the Bonn Convention and Republic of Ireland and
the UK are two of the 32 signatories. The Agreement has an Action Plan with priorities for
implementation. One of the current priorities is to produce guidelines on standardised bat monitoring
methods across Europe. Battersby (2010), in a recent EUROBATS publication outlines various methods
for surveillance and monitoring of bats.
Whilde (1993), in the Irish Red Data Book of vertebrates, listed most Irish populations of bats (those
species that were known to occur in Ireland at the time of publication) as Internationally Important.
The Red Data List for Mammals in Ireland has been updated (Marnell et al., 2009) and most of the bat
species, including common pipistrelle (Pipistrellus pipistrellus), soprano pipistrelle (P. pygmaeus),
Daubenton’s bat (Myotis daubentonii) and brown long-eared bat (Plecotus auritus) are currently
considered of Least Concern. All of these species are monitored using one of the BCIreland
monitoring schemes. One of the species included in BCIreland’s monitoring, the Leisler’s bat (Nyctalus
leisleri), is, however, considered Near Threatened. It has been assigned this threat status because
Ireland is considered a world stronghold for the species (Mitchell-Jones et al., 1999). The status of the
European Leisler’s bat population is Least Concern (Temple and Terry 2007). This species is still,

Car-based Bat Monitoring 2003-2011
____________________________
6
however, infrequent in the rest of Europe compared with Ireland where it is quite common.
Red and Amber Alerts
Monitoring and surveillance protocols need to be able to inform conservation bodies of the trends of
the faunal group being investigated. Population trends are often used to identify species that require
conservation measures (Dunn 2002) and confirming a population decline can be used as a rationale to
adopt or implement conservation measures. The degree of population decline is also considered to be
a valuable evaluation tool with which to identify wildlife populations in trouble (Dunn 2002). Under
the Habitats Directive, Member States are required to identify species declining at >1% per year. Such
a decline would put a species into the “Red” category. Such targets may be difficult to achieve, given
the error bars produced by standard methods of surveillance.
The British Trust for Ornithology (BTO) has produced Alert levels based on IUCN-developed criteria
for measured population declines. Species are considered of high conservation priority (Red Alert) if
their population has declined by 50% or greater over 25 years and of medium conservation priority
(Amber Alert) if their populations have declined by 25-49% over 25 years (Marchant et al., 1997). These
Alerts are based on evidence of declines that have already occurred but if Alerts are predicted to occur
based on existing rates of decline in a shorter time period then the species should be given the relevant
Alert status e.g. if a species has declined by 2.73% per annum over a 10-year period then it is predicted
to decline by 50% over 25 years and should be given Red Alert status after 10 years. Monitoring data
should be of sufficient statistical sensitivity (and better, if possible) to meet these Alert levels. In
addition, the data should also be able to pinpoint population increases should these occur (for more
details on Power analysis, i.e. assessment of how robust the data is at detecting increases or declines,
for Car-Based Bat Monitoring see Roche et al., 2009 and for the Daubenton’s Waterways Survey see
Aughney et al., 2009).
Bat Monitoring Schemes
Despite high levels of legal protection for all species, until 2003 there was no systematic monitoring of
any species apart from the lesser horseshoe bat in Ireland. To redress this imbalance the Car-Based Bat
Monitoring Scheme was first piloted in 2003 and targets the two most abundant pipistrelle species
(common and soprano pipistrelles) and the Leisler’s bat (Catto et al., 2004). These species are relatively
easy to detect and distinguish from each other on the basis of echolocation calls. The car based survey
makes use of a broadband bat detector which picks up a range of ultrasound which can be recorded in
the field and analysed post-survey. This method therefore allows survey work to be carried out by
individuals with little or no experience in bat identification since identification is completed post
survey work.
The car-based monitoring scheme was followed in 2006 by the All Ireland Daubenton’s Bat

Car-based Bat Monitoring 2003-2011
____________________________
7
Waterways Monitoring Scheme (e.g. Aughney et al., 2009). This scheme follows a survey methodology
devised by the Bat Conservation Trust (BCT UK). Narrow band, heterodyne detectors are used so
volunteers who conduct the survey are trained in the identification of the Daubenton’s bat prior to
field work. Surveyors count the number ‘bat passes’ of this bat species for 4 minutes at each of the ten
fixed points on linear waterways. The onset of this scheme was a very significant development in bat
monitoring here since it represented the first large-scale recruitment of members of the Irish public to
bat conservation-related work.
More recently, in 2007, a brown long-eared bat monitoring scheme was piloted and has since run for a
3-year monitoring period (Aughney et al., 2011). This project concentrates on counts of brown long-
eared bats at their roosts and is conducted by individuals with a greater level of experience in bat
identification than is necessary for the Daubenton’s or car-based surveys. This survey protocol
involves at least two counts per annum (May to September) using three potential survey methods
depending on the structure, access and location of bats within, and emerging from, the roost, see
(Aughney et al., 2011).
The Car-Based Bat Monitoring Scheme and All Ireland Daubenton’s Bat Waterway surveys are all-
Ireland schemes. The brown long-eared roost monitoring has, so far, been based in the Republic of
Ireland only. Regular monitoring under BCIreland management is, therefore, in process for five of the
Annex IV bat species for the Republic of Ireland, and for four species in Northern Ireland. Additional
BCT UK Field Surveys are also undertaken in Northern Ireland. Data collected from those surveys
feed into the BCT’s UK reporting mechanisms.
Factors Impacting Bat Abundance
Many factors, including climate, foraging habitat quality, roost availability, disturbance at
hibernacula, landscape connectivity, artificial lighting, predation and competition, among others,
combine to regulate the local and national population of a given bat species. The car-based bat
monitoring survey takes place within a restricted timeframe each year and although the data collected
from it has been shown to be robust, it may only ever be possible to infer or surmise as to which
factors are influencing an observed trend. The following elements are among those for which we have
collected sufficient data to allow further analyses. In time, some of these may or may not, be shown to
influence roadside bat activity.
Weather
Several studies have shown that flight activity of bats generally increases with temperature (e.g. Catto
et al. 1995; Negraeff and Brigham 1995). Rainfall has also been found to modify bat activity with some
species notably reluctant to fly in heavy rain (Erkert 1982). There is some debate as to whether the
positive relationship between bat activity and temperature may be attributed to an indirect effect,
whereby increased temperature causes more insect prey to become available to bats, or whether the
response is physiological on the part of bats themselves, with warmer conditions proving inherently

Car-based Bat Monitoring 2003-2011
____________________________
8
more conducive to flight. In a detailed study of pipistrelle activity in woodlands by Roche (1998), no
significant relationship was found between pipistrelle passes and temperature when the number of
insects (caught simultaneously in suction traps) was held constant, suggesting for that study at least,
the impact of temperature on bat activity was indirect. Also, in different woodlands studied by Roche
(1998), pipistrelle activity was found to be most significantly correlated with a different weather
variable including maximum temperature, windspeed and humidity. The author hypothesized that
the most important weather variables affecting insect and pipistrelle bat activity may actually,
therefore, depend on site composition and situation.
Questions surrounding the impact of weather conditions on bat populations become increasingly
pertinent in a changing climate. The prospect of range changes and extinctions was addressed by
Rebelo et al. (2009) who studied the potential impacts of climate change on European bats using four
standard IPCC scenarios. Although the two pipistrelles monitored as part of the present car-based
scheme were not included, the Leisler’s bat was included in their assessment of 28 species. Bats were
grouped according to their biogeographic range (Boreal, Temperate, Mediterranean) and Max Ent
models were applied to occurrence data and four different climate change scenarios for the remainder
of the century. The Leisler’s bat was assigned to the Temperate biogeographic group for the purposes
of the analysis (following Principal Components Analysis). While the authors predicted a major
reduction in available habitat and possible extinction of at least one Boreal species within this century,
they also predicted a general increase in occupied area for many Temperate species, at least until the
middle of this century. After this, scenarios vary greatly but the Leisler’s bat was one of the two
Temperate species highlighted as likely to undergo range expansion under all but one of the possible
climate change scenarios over the long term. The potential usefulness of the car-based bat monitoring
trend data in informing bat species’ interactions with climate change is discussed in this report.
Street lights
Artificial light sources attract insects. Rydell (1992) examined the exploitation of insects around
streetlamps by bats in Sweden and concluded that only the fast flying species that use long-range
echolocation systems (in the case of his study: Nyctalus noctula, Vespertilio murinus and Eptesicus
nilssonii) regularly foraged around streetlamps. By way of contrast, other species such as Myotis and
Plecotus auritus appeared to avoid the streetlamps. Shiel et al. (1999) recorded Leisler’s bat in Ireland
feeding around street lights. However, street lighting, has also been shown to affect ecological
interactions across a range of taxa and to impact negatively upon animal foraging, reproduction and
communication behaviours (Longcore and Rich 2004; Rich and Longcore, 2006). Stone et al. (2009)
confirmed disruption of commuting routes of the Annex II-listed lesser horseshoe bat (Rhinolophus
hipposderos) when a lighting experiment was carried out along its commuting route from a nearby
roost.
Since the car-based bat monitoring survey takes place along roadways, street lights are often
encountered and have potential to impact activity levels, we investigate this in the present report.

Car-based Bat Monitoring 2003-2011
____________________________
9
Landscape Suitability
Bat Conservation Ireland commissioned the Centre for Irish Bat Research to carry out modeling of bat
species occurrence across Ireland based on available records for 2000-2009. This project constituted the
first major attempt to establish core ranges and determine landscape suitability for the nine confirmed
resident bat species in Ireland (Lundy et al., 2011). Maximum Entropy Models (MaxEnt) models were
constructed for each species using bat records, land cover (CORINE), soil pH, altitude and human bias
factors. MaxEnt models have an advantage over other modeling systems whereby records from
various surveys can be combined, and a lack of records is not assumed to indicate true absence of a
species.
The bat records used for the project were collated by Bat Conservation Ireland from 2000-2009 and
stored in a MySQL online database, based on Recorder 6. While data from the car-based bat
monitoring surveys are included in Bat Conservation Ireland’s online database, these were not
included in the landscape suitability modeling because they are geo-referenced to transect start points
only, due to a lack of GPS information for each transect. Thus car monitoring bat records are currently
only available at a 1.6km resolution unlike other records held in the Bat Conservation Ireland database
which are generally more accurate. Over 7,100 records for nine species were included in the Max Ent
analyses. The main results of the project were maps of landscape suitability indices for each of the
nine species in Ireland, at a 5km square resolution. Examples of these maps are shown in the Results
section.
While we had initially planned to carry out a study of CORINE land cover and car-based bat
monitoring activity of the three most common species at square level, it became apparent that the
Lundy et al. (2011) project constituted a much more detailed study using a similar, but better
populated dataset at higher resolution. Therefore, some of the results from that project are
summarized in the present report. Its limitations in aiding the interpretation of the car-based
monitoring scheme are discussed, along with possibilities for future detailed analyses of car-based
monitoring routes and bat records.
Aims of a Car-based Bat Monitoring Scheme
1. Provide a method of monitoring that can be implemented by relatively few surveyors and that
does not require highly trained individuals.
2. Provide a method of data collection that is
• objective
• easily repeatable
• cost effective.

Car-based Bat Monitoring 2003-2011
____________________________
10
3. Ensure sufficient data is collected that will allow early recognition of Red and Amber Alert
declines in certain Irish bat species’ populations.
4. Record other vertebrate wildlife during the survey.
5. To contribute to information on important areas for bats across the island.
6. To determine population trends and allow early detection of population declines or highlight
increases, if any.
Aims of This Report
This report synthesises the data collected from 2003 to present and
• reviews information from the testing and use of Android smartphones in 2011
• reviews total bat encounters in all years to-date
• examines trends in the three most commonly detected species and Nathusius’ pipistrelles using
GAM and TRIM
• analyses the impact of weather on bat abundance
• reviews information on roadside street lights to determine whether these have any observable
impact on bat activity
• correlates predicted landscape suitability indices for the three most common species with average
encounter rates per survey square and examines trends for each species in less and more suitable
areas
• reviews overall ‘other vertebrate’ data from 2006 to 2011 and roadside cat population trends are
analysed using TRIM
• makes recommendations on the future of the survey.

Car-based Bat Monitoring 2003-2011
____________________________
11
Methods
The detailed methodology for the survey was described in Roche et al. (2011).
In summary, training of surveyors is carried out each summer prior to Survey 1 each year. Each year
survey teams carry out surveys of a mapped route within a defined 30km Survey Square. Every route
covers 15 x 1.609km (1 mile) Monitoring Transects each of which is separated by a minimum distance
of 3.2km (2 miles). Surveyors are asked to carry out the survey on two dates, one in mid to late July
(Survey 1) and one in early to mid-August (Survey 2). Transect coverage begins 45 minutes after
sundown. Each of the 1.609km transects is driven at 24km (15 miles) per hour while continuously
recording from a time expansion bat detector, set to x10 time expansion, on to a recording device such
as a minidisc or digital recorder. The time expansion detector is set to record for 320ms, and it then
replays sounds at x10 time expansion so that, in effect, each recording consists of a series of 0.32sec
intervals with no sound, followed by 3.2sec of time expanded sound. 2011 the first trials were carried
out using HTC Android smartphones for recording. Minidiscs or phone mini-SD cards are forwarded
(in pre-stamped and addressed envelopes) to BCIreland for analysis.
Note that in 2003 surveys were carried out on later dates than in the following years and the survey
began 30 minutes after sunset. An additional change was made to the methodology in 2009; where
each route had originally consisted of 20 transects, the final five transects for each route was omitted,
due to safety concerns.
Each track is downloaded to Bat Sound™ and calls are identified to species level where possible.
Species that can be identified accurately using this method are the common, soprano and Nathusius’
pipistrelles (Pipistrellus nathusii). Pipistrelle calls with a peak in echolocation between 48kHz and
52kHz are recorded as ‘Pipistrelle unknown’ because they could be either common or soprano
pipistrelles. Leisler’s bat, a low frequency echolocating species, can also be easily identified using this
method. Occasional calls of Myotis bats are recorded but these are noted as Myotis spp. since they
could belong to one of a number of similar species – Daubenton’s, whiskered, Natterer’s or Brandt’s
bat (Myotis daubentonii, M. mystacinus, M. nattereri, M. brandtii). Occasional social calls of brown long-
eared bats are also recorded. Publications by Vaughan et al. (1997) and Russ (1999) are used as the
main sonogram identification reference guides.
For quality control purposes a number of randomly selected .wav files are forwarded each year to Jon
Russ of The BCT for comparative analysis.

Car-based Bat Monitoring 2003-2011
____________________________
12
Statistical Analysis
Trends: GAM and TRIM
Smoothed trends were constructed using the Generalised Additive Model approach described by
Fewster et al. (2000, see Glossary) with confidence limits generated by bootstrapping at the Survey
Square level. A Poisson error distribution was used and the number of degrees of freedom for the
spline curve was set to two since there were insufficient years to justify a more complex model. The
log of the total number of recording intervals was fitted as an offset (see Glossary) to adjust for
different recording lengths. A fully saturated GAM model, which is equivalent to a conventional GLM
with estimates for each year, was also fitted to indicate the year-to-year variation about the smoothed
curve. Indices were expressed relative to a base year of 2004, since there were relatively few surveys in
2003.
For Nathusius’ pipistrelle trend, models were constructed this year based on a binomial distribution.
This is because the species sometimes occurs in the same transect on multiple occasions but there are,
much more often, transects with no occurrences of this species and, therefore, a large number of zeros
in the dataset. No attempt was made to express these results as an index because of the low numbers
of encounters, but otherwise the same methodology was applied, with confidence limits constructed
by bootstrapping at the square level. A binomial model would not give any advantage for species with
enough passes to use a Poisson distribution (such as the pipistrelles and Leisler’s bats above) so
Poisson GAM was used for these species. It is worth noting that multiple passes are not as relevant
with a car-based survey as for a foot-based survey, since the speed of the car means that lots of passes
from the same bat are avoided.
The analysis was carried out using the first 15 x 1.6km transects only, from 2003-2008 even though 20
transects were surveyed in each survey square in those years, so that results are comparable with the
reduced 2009-2011 sampling plan of 15 transects. All annual estimates are now predicted as if each
survey had a total of 1,125 0.32second recording intervals or snapshots (i.e. 75 snapshots for each of
the 15 x 1.6km transects).
For comparative purposes, trends to 2011 were also analysed using TRIM (Trends and Indices for
Monitoring Data, Statistics Netherland). In order to provide a clear comparison between the two
approaches to the data, TRIM and GAMs were fitted to a reduced dataset including only squares with
between 1000 and 1250 5s snapshots, thus avoiding the need to use an offset or covariate. TRIM does
not fit smoothed curves in the same way as the GAM approach, instead using linear switching trends,
where the linear slope can change between some or all times. There is an option to allow automatic
detection of changepoints using a stepwise algorithm, and this was compared with the smoothed
GAM fit. The models are essentially very similar in terms of the use of a Poisson distribution and a
logarithmic link function. However, the two use very different approaches to variance estimation. The
TRIM model assumes that variances are equal and hence calculates the confidence limits, even for
years with unusual observations, using an overall estimate of variance. By contrast, the bootstrapping
approach used with GAM smoothing ensures that unusual observations have a direct impact on the
width of the confidence limits for the relevant years

Car-based Bat Monitoring 2003-2011
____________________________
13
Weather
REML (Residual or Restricted Maximum Likelihood) models were applied to log transformed bat
count data and climate variables (temperature and rainfall totals) to determine if there were any
significant relationships between bat activity and these weather variables. In most cases bat count data
from both surveys in a square in a year were included so results, therefore, compare both within
square differences (e.g. more bats present on warmer nights) and between square differences (e.g.
more bats present in warmer squares).
Street lights
Data on street lights has been collected every year by surveyors. To enable accurate identification of
the various types of lamp, illustrations of high pressure sodium (yellow) and low pressure sodium
(orange) lights were provided with the survey information pack to survey teams so that the two types
could be distinguished. The other main category of street light that surveyors are likely to encounter is
white street lights. In some cases the data collected has been inconsistent with different counts
resulting for different survey nights and different survey years. In 2011 the data was gathered into a
complete set based on maximum available counts for each transect.
To investigate the impact of street lights on the different species, a REML analysis was carried out at
the level of the 1.6km transects with the dependent variable the log-transformed passes per minute. A
quadratic term for the start time of each transect was also included, expressed as minutes after sunset,
in order to allow for the temporal pattern of activity that has been described previously. This is
particularly important for the pipistrelle species, which show a marked rise in activity until around 3
hours after sunset. Terms were fitted for log-transformed numbers of each street light colour (adding
one to avoid taking logs of zero). All street light data was included. To help visualise the REML
results, numbers of passes per minute were predicted when no lights are present, or when there are 20
lights per transect of the appropriate colour per transect. Predictions are averaged on the log-scale
over other terms in the model and so their absolute value is not necessarily realistic, but their values
provide an impression of the relative magnitude of effects.
Landscape Suitability
The index of landscape suitability (Lundy et al., 2011) for the start point of each of the 15 x 1.6km
transects was noted and the mean landscape suitability for each survey square was calculated. The
landscape suitability and car monitoring datasets were combined in a REML analysis to determine
whether the landscape suitability index was correlated with bat abundance per survey square.

Car-based Bat Monitoring 2003-2011
____________________________
14
In addition, separate GLM/GAM trends were fitted to the squares with the highest and lowest
landscape suitabilities (i.e. squares were divided according to whether they were above or below the
median value for the species). For these trends, 2010 was used as the base year, since the smaller
sample sizes in the early years creates problems if the split is not even. Randomisation tests were
carried out to determine whether the trends were significantly different between high and low
suitability squares. A difference in species trends between these two groups might be expected in
some circumstances. It is plausible, for example, that at times of population decline, numbers will
remain higher in prime habitat than in marginal areas for the species.
Smartphone Trials
Six new smartphones were purchased for the car-based bat monitoring scheme in 2011. These were
HTC Desire Z Android units. An Android App was developed to use the phone to record sound while
simultaneously recording GPS co-ordinates. In addition, suitable leads with resistors and capacitors
were made by All-Cables Ltd., Dublin for the surveys.
Other Vertebrates
Other vertebrates were also recorded by surveyors. From 2006 onwards surveyors were asked to note
all vertebrates including cats on their record sheets. In addition, observers recorded whether each
specimen was living or dead and whether each was observed during or after the transect. This means
that recorders were observing living and dead vertebrates, other than bats, along a minimum 93km
(58mile) route on each survey evening.
Statistical Analysis
The total number of live cats counted in each square each year was analysed using TRIM, with the
time taken to complete the surveys included as a weighting variable (effectively an offset).

Car-based Bat Monitoring 2003-2011
____________________________
15
Results
Seven teams participated in the 2003 pilot scheme and 17 squares were surveyed in 2004. Twenty one
squares were surveyed in 2005. An additional five squares were surveyed in 2006, bringing the total
number of surveyed squares to 26 throughout the island. Equipment for 28 squares was disseminated
from 2007 onwards (Figures 1 and 2). The survey represents a considerable input of voluntary time -
each survey takes approximately two hours and 55 minutes to complete (mean for 2011, not including
travel time to and from the survey squares), and each team typically consists of two people. In total,
therefore, surveyors contributed at least 310 hours to the survey in 2011.
The mean time taken to complete a monitoring transect (1.609km/1mile) varies between squares. As
the time expansion detector system only samples for 1/11th of the time, there is an average total
sampling time of 22 seconds per monitoring transect. Also, for every monitoring transect covered
0.146km (0.091 miles) are actually surveyed (i.e. 1/11th of the distance).
Figure 1: 30km squares in which surveys have been carried out from 2003. Seven of the above squares were
surveyed in 2003 and gradually larger numbers were surveyed each year until all survey routes had been
established by 2008. The letter and numbers refer to the south western-most corner Ordnance Survey grid
reference.

Car-based Bat Monitoring 2003-2011
____________________________
16
Figure 2: Driven routes within each of the 28 survey squares. Each circle indicates the starting point of a 1.6km
transect, with 15 monitoring transects per 30km square.
A maximum of 1576km of transects were driven in 2008, when 20 transects were driven along each
route. In the most recent survey year, 2011, 1242km of transects were driven. Grid references of
transect locations and descriptive information available for transect start points are given in the
Appendix, Table 6.
Each year some equipment problems or other difficulties arise, for example heavy rainfall, that result
in surveys being abandoned or poor recordings that cannot be included in the dataset. In general, the
quality of data collected from 2005 onwards has been very good, however. In 2011, during the pilot

Car-based Bat Monitoring 2003-2011
____________________________
17
use of smartphones by eight survey teams, occasional problems arose whereby the data was not
recorded properly on a number of driven transects.
In total, 21,172 bat encounters have been recorded since 2003. The total number of bats encountered
increased yearly from 378 in 2003 to 3280 in 2008. From 2009, when the number of monitoring
transects was reduced by one quarter (from 20 to 15) there was a drop in number of encounters. See
Table 1 to compare yearly totals.
Table 1: Total number of bat encounters and total number of 1.6km transects surveyed per year.
Dataset Generated
Quality control data returned from Jon Russ shows that identifications are carried out in the same
manner in Ireland and Britain. No correction factor is necessary since the Irish data is analysed by the
same person every year so the Irish results are very consistent. Should a new sonogram analysis
method be used in the future (e.g. automatic call identification, or change in analysis personnel) a
correction factor may have to be incorporated at that time.
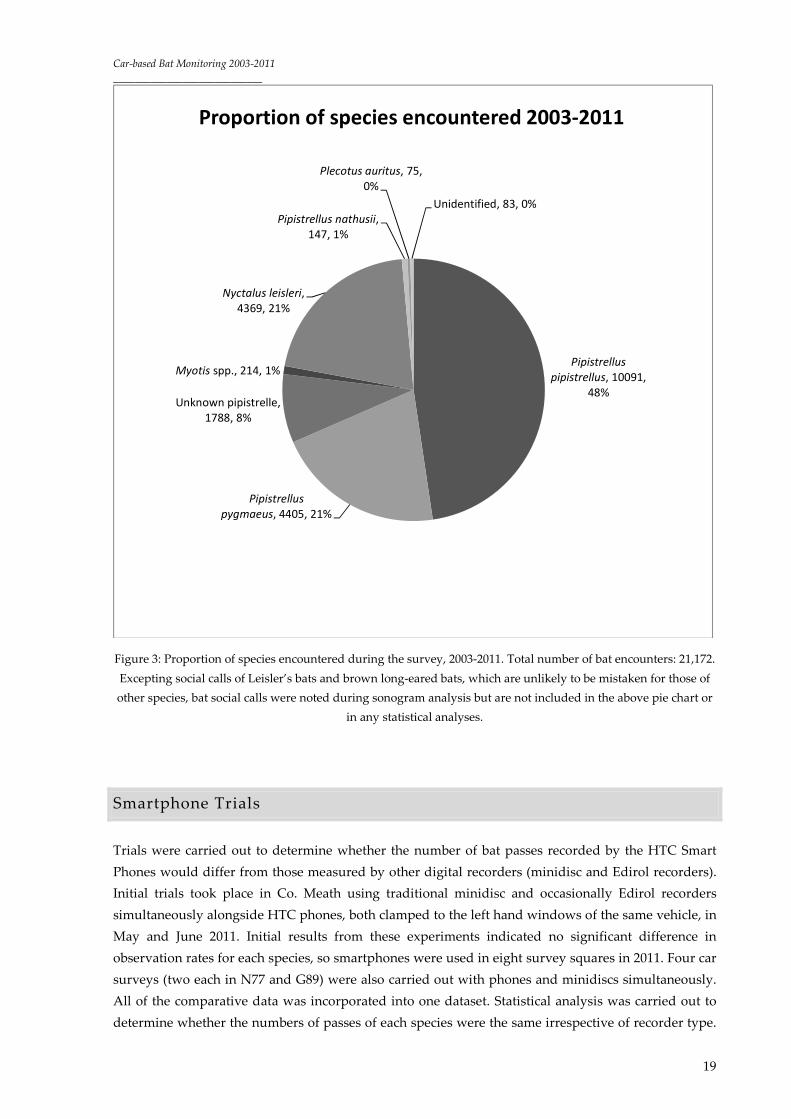
Table 2 below shows raw bat encounter data, with passes per 1.6km transect. Figure 3, a pie-chart,
shows proportions of each species or species group encountered, from 2003 to 2011. The common
pipistrelle is the most abundant species. Soprano pipistrelle and Leisler’s bat are equally represented
with 21% each of the total bat encounters. An additional 8% of bat encounters cannot be ascribed to
either the common pipistrelle or soprano pipistrelle and are, therefore, recorded as ‘Pipistrelle
unknown’. Myotis spp., Nathusius’ pipistrelles and brown long-eared bats are rarely encountered.
Note that Figure 3 is not meant to give an impression of the actual relative abundance of each species
along Irish roadsides since each species differs in its detectability and flight style. Leisler’s bats, for
1 Number of transects reduced from 20 to 15 per survey square, see Methods for details.
Year Total No. Bats Transects
2003 378 180
2004 2031 576
2005 1691 608
2006 3212 887
2007 3014 889
2008 3280 927
2009 2147 7871
2010 2672 816
2011 2748 763
TOTAL 21,172 6433

Car-based Bat Monitoring 2003-2011
____________________________
18
example, have loud, low frequency calls with much greater long-range detectability than either of the
two pipistrelles, but would not necessarily fly close to hedgerows along roadsides, unlike the
pipistrelles. So while, they are more detectable, their occurrence in the landscape would preclude
detection if they had quiet short range calls. It is not possible, therefore, to directly compare
detectability between the species and the pie-chart simply illustrates the results of the sampled
dataset, irrespective of whether social calls are included.
Table 3: Raw bat encounter data, per 1.609km/1 mile transect, not corrected to encounters per km or per hour,
Car-based Bat Monitoring Scheme 2003-2011. Average number of bats reflects the average number of bat passes
observed during each 1.609km/1 mile transect travelled. Note that the detector records for just 1/11th of the time
spent surveying so to determine the actual number of bat encounters per km this must be divided by 0.146 (the
total distance sampled for each 1.609km transect), which has not been done for this table.
Year No.
Transects
Common
pipistrelle
Soprano
pipistrelle
Pipistrelle
unid.
Nathus.
Pipistrelles
Leisler’s
bat Myotis spp.
Brown
long-eared
Total
Bats
2003 190 1.294 0.478 N/a 0.000 0.289 0.039 n/a 2.100
2004 5771 1.905 0.695 0.443 0.000 0.511 0.050 n/a 3.621
2005 608 1.344 0.574 0.266 0.001 0.544 0.035 n/a 2.781
2006 887 1.701 0.652 0.271 0.033 0.892 0.029 0.024 3.620
2007 889 1.77 0.639 0.253 0.015 0.631 0.036 0.019 3.390
2008 927 1.686 0.768 0.294 0.006 0.739 0.029 0.002 3.537
2009 787 1.212 0.714 0.221 0.032 0.492 0.032 0.011 2.728
2010 816 1.442 0.668 0.241 0.069 0.809 0.023 0.012 3.275
2011 763 1.560 0.800 0.360 0.022 0.790 0.038 0.020 3.602
Mean Per
Transect 1.546 0.665 0.294 0.020 0.633 0.035 0.015 3.184
1. Number of transects = 597 for Leisler’s bats in 2004. More data was available for Leisler’s than other species in this year due to
a detector problem in one survey square which caused sounds at frequencies above 30kHz to be non-analysable.
Car-based Bat Monitoring 2003-2011
____________________________
19
Pipistrellus
pipistrellus, 10091,
48%
Pipistrellus
pygmaeus, 4405, 21%
Unknown pipistrelle,
1788, 8%
Myotis spp., 214, 1%
Nyctalus leisleri,
4369, 21%
Pipistrellus nathusii,
147, 1%
Plecotus auritus, 75,
0%
Unidentified, 83, 0%
Proportion of species encountered 2003-2011
Figure 3: Proportion of species encountered during the survey, 2003-2011. Total number of bat encounters: 21,172.
Excepting social calls of Leisler’s bats and brown long-eared bats, which are unlikely to be mistaken for those of
other species, bat social calls were noted during sonogram analysis but are not included in the above pie chart or
in any statistical analyses.
Smartphone Trials
Trials were carried out to determine whether the number of bat passes recorded by the HTC Smart
Phones would differ from those measured by other digital recorders (minidisc and Edirol recorders).
Initial trials took place in Co. Meath using traditional minidisc and occasionally Edirol recorders
simultaneously alongside HTC phones, both clamped to the left hand windows of the same vehicle, in
May and June 2011. Initial results from these experiments indicated no significant difference in
observation rates for each species, so smartphones were used in eight survey squares in 2011. Four car
surveys (two each in N77 and G89) were also carried out with phones and minidiscs simultaneously.
All of the comparative data was incorporated into one dataset. Statistical analysis was carried out to
determine whether the numbers of passes of each species were the same irrespective of recorder type.

Car-based Bat Monitoring 2003-2011
____________________________
20
Some differences in observed bat passes may be expected because, even though the recorders are
switched on at the same time, the detectors may be triggering at a slightly different time, hence an
individual bat flying past the survey car may be missed by one recorder but picked up by the other.
Cumulative results from 12 separate recording instances in 2011, however, showed very similar tallies
(Table 4).
Table 4: Results from HTC and minidisc/Edirol recorder trials, June surveys were carried out in various locations
in Meath while the July and August surveys took place in G89 (Donegal) and N77 (Meath/Louth) during the car
surveys-proper.
Date Recording Common pipistrelle Soprano pipistrelle Leisler’s bat
(2011) Length (sec) HTC Other HTC Other HTC Other
07/06 1565 12 11 2 2 8 6
13/06 1262 10 11 0 1 4 4
13/06 1498 18 15 2 4 2 5
15/06 1340 3 2 2 3 3 20
15/06 1192 3 4 3 5 24 7
27/06 1340 6 6 1 1 15 16
27/06 1457 5 2 7 9 5 3
27/06 1420 23 24 1 1 0 0
16/08 3874 25 21 11 15 4 0
05/08 3590 24 26 14 11 7 9
26/07 3573 3 4 2 4 23 24
18/07 3813 32 24 17 7 37 36
TOTAL 25924 164 150 62 63 132 130
Wilcoxon signed ranks tests were carried out on the paired data for each species. No significant
differences were found in results for the different recording methods. Recordings made by the HTC
smartphone should, therefore, provide the same information on bat passes as minidisc recordings,
with the additional benefit of detailed GPS data enabling geo-referencing of bat records.
No comparative analysis was carried out on the irregularly occurring species such as brown long-
eared bats or Myotis species because insufficient data was available for these.
Common pipistrelle
Common pipistrelles have been the most frequently encountered species during the monitoring
scheme in all survey years to-date. In L64, Connemara, common pipistrelles have never been
confirmed in any year when surveys have been carried out in that square.

Car-based Bat Monitoring 2003-2011
____________________________
21
Yearly Trends
Common pipistrelles showed a consistent increase in the early years (until 2007), but have remained
fairly steady since then (Figure 4). The current value of the index is not quite significantly different
from the baseline 2004 (fitted) value, as can be seen from the confidence limits which enclose 100.
There are significant change points in 2009 and 2010 indicating that the trend line is starting to bend
upwards. Also, results indicate a yearly increase of 1.6% but this increase, and trend lines, are strongly
influenced by the relatively high mean in 2011 and should, therefore, be treated with caution. Table 5
shows the data used to create Figure 4.
Figure 4: GAM curve for common pipistrelles. The solid black line is the smoothed GAM curve, with 95%
confidence limits shown by the dotted lines. Green points are estimated annual means and are shown to illustrate
the variation about the fitted line.

Car-based Bat Monitoring 2003-2011
____________________________
22
Table 5: GAM results for common pipistrelles with 95% confidence limits (using first 15 transects only 2003-2008).
Index 2004 = 100
Mean passes Smoothed 95% conf limits unsmoothed
year counts sites Mean s.e. estimate s.e. lower upper estimate s.e.
2003 9 7 16.4 3.6 92.5 2.4 88.4 97.5 52.8 9.9
2004 27 17 25.6 2.9 100.0 0.0 100.0 100.0 100.0 0.0
2005 31 17 21.3 2.3 106.8 2.5 101.9 111.5 79.3 9.0
2006 45 25 24.3 2.6 112.5 4.6 103.6 121.2 103.7 13.9
2007 46 26 25.7 2.7 115.1 5.7 103.9 125.8 116.2 8.3
2008 42 23 24.1 2.8 113.7 6.0 102.3 124.9 104.6 10.8
2009 52 28 18.0 1.6 111.2 5.8 100.2 122.3 80.2 7.0
2010 53 27 20.9 2.1 110.6 6.3 98.3 122.9 92.9 11.0
2011 53 28 22.5 2.5 111.8 8.1 96.1 128.2 105.4 8.4
GAM and TRIM
In order to provide a clear comparison between the two approaches to the data, TRIM and GAMs
were fitted to a reduced dataset for common pipistrelles including only squares with between 1000
and 1250, 5 second snapshots, thus avoiding the need to use an offset or covariate. TRIM does not fit
smoothed curves in the same way as the GAM approach, instead it uses linear switching trends,
where the linear slope can change between some or all times. There is an option to allow automatic
detection of changepoints (i.e. when slope of the trend changes from one year to the next) using a
stepwise algorithm, and this is compared with the smoothed GAM fit below.
Figure 5: Comparison between TRIM and GAM results for common pipistrelle. The left hand graphs show
unsmoothed estimates; the red points are from TRIM using a linear model with all possible changepoints, whilst
the ‘GAM’ result is from a GLM model with estimates from each year and standard errors based on
bootstrapping at the site level. The right hand graphs compare a linear TRIM model, using the default stepwise
method of selecting changepoints, with a GAM curve with 2 d.f.
Car-based Bat Monitoring 2003-2011
____________________________
23
From the unsmoothed results, the annual estimates are very similar. This would be expected since the
models are essentially very similar in terms of the use of a Poisson distribution and a logarithmic link
function. For this species, the confidence limits are quite different in certain years but are generally
smaller for the TRIM model, reflecting the different approaches to variance estimation. Comparisons
between the GAM smoothed curve and the linear switching trend model of TRIM are more difficult
because the models are so different. Overall, the TRIM model is much more jagged, responding to
outlying years. The TRIM line tends to be below the GAM curve, which occurs because the base year
(2004) is an outlier and the GAM approach smoothes this out, whereas TRIM inserts a change point in
the slope to fit it. TRIM confidence limits are wider for the smoothed curve.
Weather
Survey level REML models were constructed with numbers of bat passes per minute, temperature and
rainfall. For common pipistrelles encounter rates, no significant correlation was found between these
and average monthly temperature or rainfall, although the test statistic was positive with average
temperature and negative with rainfall (see Appendix, Table 2). The relationship between the observer
recorded temperature at the start of each survey and common pipistrelles passes per minute was also
non-significant (see Appendix, Table 3).
Landscape Suitability
The landscape suitability index for common pipistrelles is shown in Figure 6. As can be seen from this
map (from Lundy et al. 2011), the areas of greatest predicted suitability for the common pipistrelle fall
largely across the centre of the island, with a larger proportion of the highly suitable squares being
situated in the southern half. The extreme north west, extreme west and areas associated with
mountain ranges are generally those predicted to be less suitable for the species. In summary, the
habitat types found to be favoured by the common pipistrelle are mixed and broadleaved woodland
(albeit at differing spatial scales), riparian habitats and low density urban areas (<30% cover).
Landcover types avoided by common pipistrelles include bog/heath, and high density urban areas.

Car-based Bat Monitoring 2003-2011
____________________________
24
Figure 6: Landscape suitability map for the common pipistrelle, darker areas are more suitable (from Lundy et al.
2011).
Using the landscape suitability indices for the start point of each 1.6km transect (derived from Lundy
et al. 2011) the mean suitability index for each survey route was calculated. A scatterplot of mean
landscape suitability and average passes per minute for common pipistrelles is shown in Figure 7.
Figure 7: Mean number of common pipistrelle passes per minute for each survey square plotted against
landscape suitability indices, averaged for each survey route.
There is a reasonable, though not significant (coefficient 0.263), correlation between observed passes
and predicted landscape suitability. One square (V99) stands out as having the highest number of
passes and a relatively low suitability (V99: mean passes per minute = 7.57; mean landscape suitability
for survey route = 30.4).

Car-based Bat Monitoring 2003-2011
____________________________
25
Further investigation was carried out by dividing survey squares into those above or below the
median landscape suitability (median=39.5) for common pipistrelles. A map differentiating between
survey squares above or below the median landscape suitability for all survey squares, is shown in
Figure 8.
Figure 8: Map showing whether each survey square is above (red) or below (grey) the median predicted
landscape suitability (for all 28 survey squares) for common pipistrelles.
Figure 9: Graph on the left shows trends in common pipistrelles passes per minute for squares with lower
landscape suitability (i.e. below the median for all survey squares) while the graph on the left shows trends in
common pipistrelles in survey squares of greater landscape suitability. Baseline 2010=100.
Figure 9 shows trends in survey squares of poorer (left) and greater (right) suitability for common
pipistrelles. 2010 has been used as the base year, as smaller sample sizes in the early years create

Car-based Bat Monitoring 2003-2011
____________________________
26
problems if the split is not even. As can be seen from the graphs, while yearly means differ slightly
there is no appreciable difference in trends between the less and most suitable squares. A
randomisation test confirms no significant differences (P=0.993).
Street lights
Street lights of varying colours were not found to have a significant impact on observed common
pipistrelle passes per minute (REML analysis with a quadratic term fitted to the model for time after
sunset, see Appendix Table 4). This is illustrated by Figure 10, which shows the predicted number of
common pipistrelle passes per minute in transects with twenty street lights of specified colour, or with
none. However, most of the transects had relatively low lighting levels, with more than 95% of them
having fewer than 20 lamps per 1.6km.
Figure 10: Predictions from the REML models for number of common pipistrelle passes per minute. Standard
errors are approximate because the model is fitted on the log scale.

Car-based Bat Monitoring 2003-2011
____________________________
27
Soprano pipistrelles
The soprano pipistrelle was the second most frequently encountered species during the car-based bat
monitoring scheme in all survey years, except 2006 and 2010, when Leisler’s bat passes exceeded those
of soprano pipistrelles.
Yearly Trends
Soprano pipistrelle numbers have been steadily climbing, although year-to-year changes have not
been significant in recent years. A high mean in 2011 means that the current index value is just
significantly different from the baseline. Results indicate a mean annual increase of 5.29%. The
soprano pipistrelle trend graph is shown in Figure 11. Data used to create Figure 11 is shown in Table
6.
Figure 11: GAM curve for soprano pipistrelles. The solid black line is the smoothed GAM curve, with 95%
confidence limits shown by the dotted lines. Green points are estimated annual means and are shown to illustrate
the variation about the fitted line.

Car-based Bat Monitoring 2003-2011
____________________________
28
Table 6: GAM results for soprano pipistrelles with 95% confidence limits (using first 15 transects only 2003-2008).
Index 2004 = 100
Mean passes smoothed 95% conf limits unsmoothed
Year Counts sites Mean s.e. estimate s.e. lower upper estimate s.e.
2003 9 7 6.8 1.7 91.7 5.0 83.6 103.1 60.3 16.9
2004 27 17 10.3 1.8 100.0 0.0 100.0 100.0 100.0 0.0
2005 31 17 7.6 0.8 108.5 5.7 96.6 119.1 79.7 16.3
2006 45 25 9.7 1.2 117.7 11.5 94.6 140.3 98.4 19.1
2007 46 26 9.2 1.0 127.3 16.6 95.4 161.8 104.4 27.5
2008 42 23 12.0 1.4 135.2 20.0 97.6 176.8 143.0 32.4
2009 52 28 10.8 1.5 139.0 20.9 100.5 183.1 117.2 28.0
2010 53 27 10.1 1.2 140.9 20.8 103.0 184.7 108.6 26.2
2011 53 28 11.5 1.0 143.4 21.5 104.7 189.7 127.3 26.1
GAM and TRIM
Results from TRIM and GAMs fitted to a reduced dataset for soprano pipistrelles, including only
squares with between 1000 and 1250, 5 second snapshots, are shown in Figure 12.
Figure 12: Comparison between TRIM and GAM results for soprano pipistrelle. The left hand graphs show
unsmoothed estimates; the red points are from TRIM using a linear model with all possible changepoints, whilst
the ‘GAM’ result is from a GLM model with estimates from each year and standard errors based on
bootstrapping at the site level. The right hand graphs compare a linear TRIM model, using the default stepwise
method of selecting changepoints, with a GAM curve with 2 d.f.
As for common pipistrelles, the annual estimates are very similar using the two methods. Comparing
the GAM smoothed curve and the linear switching trend model of TRIM indicates that the widths of
the final confidence intervals are not that different but, again, the TRIM model is much more jagged,
responding to outlying years.

Car-based Bat Monitoring 2003-2011
____________________________
29
Weather
Survey level REML models were constructed with numbers of soprano pipistrelle passes per minute,
temperature and rainfall. For soprano pipistrelle encounter rates, no significant correlation was found
between these and average monthly temperature or rainfall, although the test statistic was positive
with average temperature and negative with rainfall (see Appendix, Table 2). No significant
correlation was found between observer recorded temperature at the start of each survey and soprano
pipistrelle passes per minute (see Appendix, Table 3).
Landscape Suitability
The landscape suitability index for soprano pipistrelles is shown in Figure 13. As can be seen from this
map (taken from Lundy et al. 2011), the areas of greatest predicted suitability for the soprano
pipistrelle fall largely in the west of the island, although a number of predicted high occurrence
squares are also found in the border counties. Mountain ranges in the east are among the areas
predicted to be less suitable for the species. In summary, the habitat types found to be favoured by the
soprano pipistrelle are broadleaved woodland, riparian habitats and low density urban areas (<20%
cover). Landcover types avoided by soprano pipistrelles include altitude and high density urban
areas.
Figure 13: Landscape suitability map for the soprano pipistrelle, darker areas are more suitable (from Lundy et al.
2011).
Car-based Bat Monitoring 2003-2011
____________________________
30
Using the landscape suitability indices for the start point of each 1.6km transect (derived from Lundy
et al. 2011) the mean suitability index for each survey route was calculated. A scatterplot of mean
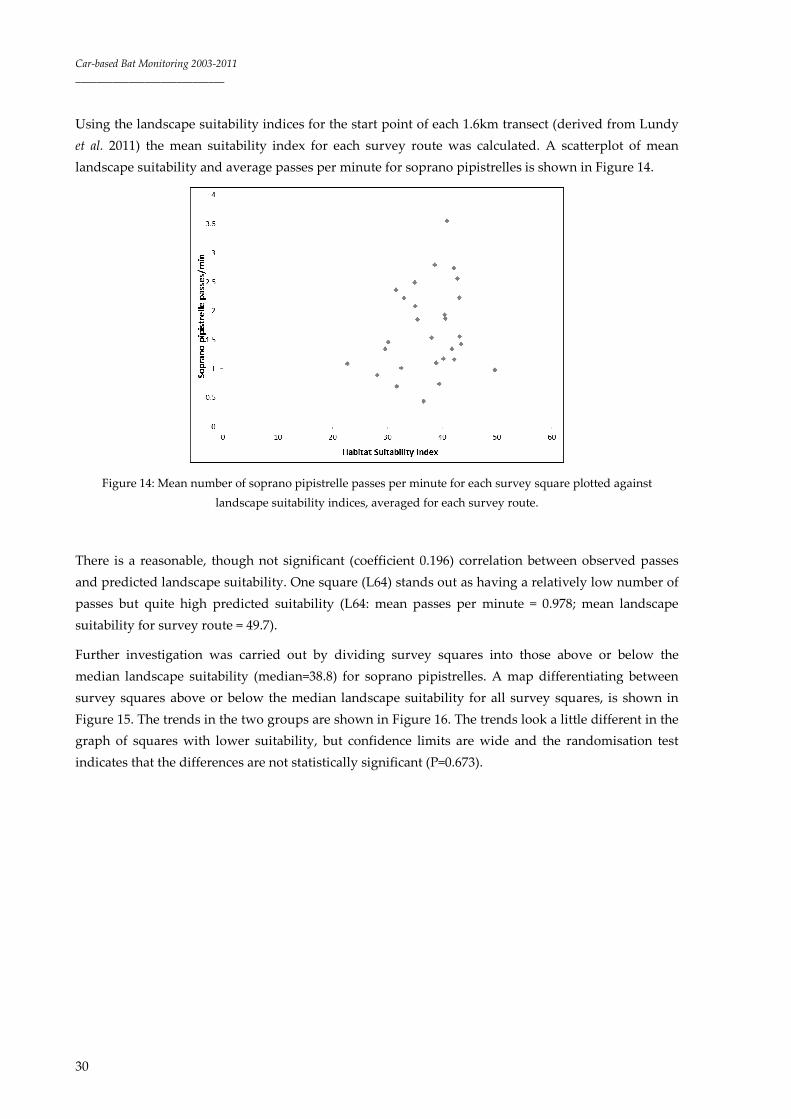
landscape suitability and average passes per minute for soprano pipistrelles is shown in Figure 14.
Figure 14: Mean number of soprano pipistrelle passes per minute for each survey square plotted against
landscape suitability indices, averaged for each survey route.
There is a reasonable, though not significant (coefficient 0.196) correlation between observed passes
and predicted landscape suitability. One square (L64) stands out as having a relatively low number of
passes but quite high predicted suitability (L64: mean passes per minute = 0.978; mean landscape
suitability for survey route = 49.7).
Further investigation was carried out by dividing survey squares into those above or below the
median landscape suitability (median=38.8) for soprano pipistrelles. A map differentiating between
survey squares above or below the median landscape suitability for all survey squares, is shown in
Figure 15. The trends in the two groups are shown in Figure 16. The trends look a little different in the
graph of squares with lower suitability, but confidence limits are wide and the randomisation test
indicates that the differences are not statistically significant (P=0.673).

Car-based Bat Monitoring 2003-2011
____________________________
31
Figure 15: Map showing whether each survey square is above (red) or below (grey) the median predicted
landscape suitability (for all 28 survey squares) for soprano pipistrelles.
Figure 16: Graph on the left shows trends in soprano pipistrelles passes per minute for squares with lower
landscape suitability (i.e. below the median for all survey squares) while the graph on the left shows trends in
soprano pipistrelles in survey squares of greater landscape suitability. Baseline 2010=100.
Street lights
Street lights of varying colours were not found to have a significant impact on observed soprano
pipistrelle passes / minute (REML analysis with a quadratic term fitted to the model for time after
sunset, see Appendix Table 4). This is illustrated by Figure 17, which shows the predicted number of
soprano pipistrelle passes / minute in transects with 20 street lights of specified colour, or with none.

Car-based Bat Monitoring 2003-2011
____________________________
32
Figure 17: Predictions from the REML models for number of soprano pipistrelle passes per minute. Standard
errors are approximate because the model is fitted on the log scale.
Leisler’s Bat
Leisler’s bats are the third, and occasionally second, most frequently encountered species during the
car-based bat monitoring survey.
Yearly Trends
Leisler’s bat yearly figures continue to oscillate somewhat, but the overall trend is significantly up.
Results indicate a mean year-on-year increase of 7.41%. An analysis of changepoints suggests that the
curve increased steeply at first, then levelled off a little (but still upwards), before rising more steeply
in 2010 and 2011. The Leisler’s bat trend graph is shown in Figure 18, and data used to create this
Figure are shown in Table 7.

Car-based Bat Monitoring 2003-2011
____________________________
33
Figure 18: GAM curve for Leisler’s bat. The solid black line is the smoothed GAM curve, with 95% confidence
limits shown by the dotted lines. Green points are estimated annual means and are shown to illustrate the
variation about the fitted line.

Car-based Bat Monitoring 2003-2011
____________________________
34
Table 7: GAM results for Leisler’s bat with 95% confidence limits (using first 15 transects only 2003-2008).
Index 2004 = 100
Mean passes Smoothed 95% conf limits unsmoothed
year counts sites Mean s.e. estimate s.e. lower upper estimate s.e.
2003 9 7 5.1 1.7 85.4 4.2 79.2 95.7 52.1 24.9
2004 28 17 7.7 1.2 100.0 0.0 100.0 100.0 100.0 0.0
2005 31 17 7.7 1.5 115.5 5.1 104.4 123.9 96.4 23.4
2006 45 25 13.3 1.6 128.9 10.1 107.6 147.0 172.1 34.5
2007 46 26 9.1 1.6 135.8 13.6 108.6 161.2 130.4 37.2
2008 42 23 9.9 1.3 139.1 15.6 108.7 168.4 143.5 28.5
2009 52 28 7.3 1.0 143.7 17.2 110.5 177.3 103.3 23.2
2010 53 27 12.2 1.7 153.2 19.1 116.0 191.7 173.3 38.2
2011 53 28 11.4 1.6 164.9 21.6 122.6 209.2 170.0 38.3
GAM and TRIM
Results from TRIM and GAMs fitted to a reduced dataset for Leisler’s bat, including only squares with
between 1000 and 1250, 5second snapshots, are shown in Figure 19.
Figure 19: Comparison between TRIM and GAM results for Leisler’s bat. The left hand graphs show unsmoothed
estimates; the red points are from TRIM using a linear model with all possible changepoints, whilst the green
‘GAM’ result is from a GLM model with estimates from each year and standard errors based on bootstrapping at
the site level. The right hand graphs compare a linear TRIM model, using the default stepwise method of
selecting changepoints, with a GAM curve with 2 d.f.
As for common and soprano pipistrelles, the annual estimates are very similar using the two methods.
Also the widths of the final confidence intervals of the GAM smoothed curve and the linear switching
trend model of TRIM are not that different, but the TRIM model is much more jagged, responding to
outlying years.

Car-based Bat Monitoring 2003-2011
____________________________
35
Weather
Survey square level REML models were constructed with numbers of bat passes per minute,
temperature and rainfall. For Leisler’s bat, a significant correlation was found between passes per
minute and average monthly temperature and rainfall. The correlation with temperature is positive
(estimate 0.033, SE 0.013, Wald p-value 0.01, Figure 20) while that with rain is negative (estimate -
0.0007, SE 0.0002, Wald p-value 0.003, Figure 21). A highly significant correlation was also found
between observer recorded temperature at the start of each survey and Leisler’s passes per minute
(estimate 0.02, SE 0.005, Wald p-value <0.001, Figure 22).
Figure 20: Relationship between Leisler’s passes per minute and average monthly temperature (Met Éireann
data). Each point represents one car survey and the fitted line is linear on the log scale.
Figure 21: Relationship between Leisler’s passes per minute and total monthly rainfall (Met Éireann data). Each
point represents one car survey and the fitted line is linear on the log scale.

Car-based Bat Monitoring 2003-2011
____________________________
36
Figure 22: Relationship between Leisler’s passes per minute and observer recorded temperature at the start of
each survey. Each point represents one car survey and the fitted line is linear on the log scale.
Landscape Suitability
The landscape suitability index for Leisler’s bat is shown in Figure 23. As can be seen from this map
(taken from Lundy et al. 2011), areas of greatest predicted suitability for the Leisler’s bat are very
widespread. Parts of the north and south west are among the areas predicted to be less suitable for the
species. In summary, the habitat types found to be favoured by the Leisler’s bat are broadleaved and
mixed woodland (at differing spatial scales), riparian habitats and low density urban areas (<30%
cover). Landcover types avoided by Leisler’s bat include bog/heath and high density urban areas.
Figure 23: Landscape suitability map for the Leisler’s bat, darker areas are more suitable (from Lundy et al. 2011).

Car-based Bat Monitoring 2003-2011
____________________________
37
Using the landscape suitability indices for the start point of each 1.6km transect (derived from Lundy
et al. 2011) the mean suitability index for each survey route was calculated. A scatterplot of mean
landscape suitability and average passes per minute for Leisler’s bat is shown in Figure 24.
Figure 24: Mean number of Leisler’s passes per minute for each survey square plotted against landscape
suitability indices, averaged for each survey route.
There is little or no correlation between the landscape suitability indices and observed passes per
survey square (coefficient -0.289).
Survey squares were divided into those above or below the median landscape suitability (median=36)
for Leisler’s bat. A map differentiating between survey squares above or below the median landscape
suitability for all survey squares, is shown in Figure 25. The trends in the two groups are shown in
Figure 26. The trends look a little different in the graph of squares with lower suitability, but
confidence limits are wide and the randomisation test indicates that the differences are not statistically
significant (P=0.673).

Car-based Bat Monitoring 2003-2011
____________________________
38
Figure 25: Map showing whether each survey square is above (red) or below (grey) the median predicted
landscape suitability (for all 28 survey squares) for Leisler’s bat.
Figure 26: Graph on the left shows trends in Leisler’s passes per minute for squares with lower landscape
suitability (i.e. below the median for all survey squares) while the graph on the left shows trends in Leisler’s bat
in survey squares of greater landscape suitability. Baseline 2010=100.
Street lights
Street lights were found to have a significant impact on observed Leisler’s passes per minute (REML
analysis with a quadratic term fitted to the model for time after sunset, see Table 8). This is illustrated
by Figure 27, which shows the predicted number of Leisler’s passes per minute in transects with
twenty street lights of specified colour, or with none. The number of passes is greatest with yellow

Car-based Bat Monitoring 2003-2011
____________________________
39
and white lights.
Table 8: P-values for Leisler’s bat in the REML models. Street light variables are fitted as log-transformed
numbers.
Street light
colour P-value
Orange 0.179
Yellow 0.004
White 0.020
Figure 27: Predictions from the REML models for number of Leisler’s bat passes per minute. Standard errors are
approximate because the model is fitted on the log scale.

Car-based Bat Monitoring 2003-2011
____________________________
40
Summary Trends
A summary trend graph has been produced for the three species monitored by the car-based scheme,
see Figure 28.
60.00
80.00
100.00
120.00
140.00
160.00
180.00
2003 2004 2005 2006 2007 2008 2009 2010 2011
Common
pipistrelle
Soprano pipistrelle
Leisler's bat
Figure 28: GAM curves for the common pipistrelle, soprano pipistrelle and Leisler’s bat. Leisler’s bats are
significantly increasing, soprano pipistrelles are increasing (the increase was significant for the first time in 2011
so should be treated with caution) and common pipistrelles are stable.
Nathusius’ pipistrelle
Nathusius’ pipistrelles remain one of the least encountered species from the survey. It has been
recorded less than 150 times since 2005.
Yearly Trends
A binomial model for the proportion of 1.6km transects with Nathusius’ pipistrelle passes has been
fitted. For this species the results are not expressed as an index, not least because 2004 cannot be used
as a baseline since none were identified in that year. After an initial increase from 2005, the proportion
has remained more or less constant since 2006. A slightly higher number of passes recorded in 2011
results in the curve no longer bending downwards. The Nathusius’ pipistrelle trend graph is shown in
Figure 29 with the data used for creating the Figure are shown in Table 9.

Car-based Bat Monitoring 2003-2011
____________________________
41
Figure 29: Results of the binomial GAM/GLM model for proportion of 1.6km transects with Nathusius’ pipistrelle
passes. Green points are estimated annual means and the bars are 95% bootstrapped confidence limits. The solid
black line is the fitted GAM curve with 95% confidence limits shown by the upper and lower dotted lines.
Table 9: Binomial GAM results with 95% confidence limits for Nathusius’ pipistrelle (using first 15 transects only
2003-2008).
Index 2010 = 100
Prop transects
with passes smoothed 95% conf limits unsmoothed
year surveys sites Mean s.e. estimate s.e. lower upper fitted s.e.
2003 9 7 0.000 0.000 0.004 0.004 0.001 0.013 0.000 0.001
2004 28 17 0.000 0.000 0.006 0.004 0.002 0.017 0.000 0.000
2005 31 17 0.002 0.002 0.009 0.005 0.003 0.022 0.003 0.004
2006 45 25 0.023 0.006 0.012 0.006 0.004 0.026 0.017 0.006
2007 46 26 0.015 0.005 0.015 0.006 0.006 0.029 0.011 0.004
2008 44 25 0.008 0.004 0.015 0.007 0.006 0.030 0.011 0.006
2009 53 28 0.014 0.004 0.016 0.007 0.006 0.032 0.015 0.007
2010 54 28 0.009 0.003 0.015 0.008 0.005 0.032 0.010 0.005
2011 53 28 0.017 0.005 0.015 0.009 0.004 0.035 0.014 0.007

Car-based Bat Monitoring 2003-2011
____________________________
42
Landscape Suitability
The landscape suitability index for Nathusius’ pipistrelle is shown in Figure 30. As can be seen from
this map (taken from Lundy et al. 2011), areas of greatest predicted suitability for the Nathusius are
very restricted compared to the previous three species. Its stronghold is the North and north east,
along with lakes in the midlands. Much of the east coast is predicted as having some suitability for the
species. It should be noted that this model was constructed on the basis of just 37 records. In
summary, the habitat types found to be favoured by the Nathusius’ pipistrelles are broadleaved
woodland, areas of freshwater (<45% cover) and pasture (<30% cover). Bog/heath is avoided by
Nathusius’ pipistrelle.
Figure 30: Landscape suitability map for Nathusius’ pipistrelle, darker areas are more suitable (from Lundy et al.
2011).
At the time that the above modeling was being carried out, records for Nathusius’ pipistrelles
collected from the car-based bat monitoring scheme had not been georeferenced. However, a back
calculation (using transect start point and time spent surveying to calculate the distance travelled and,
therefore, likely bat location) was carried out in spring 2012 to pinpoint more than 140 records for
publication.
The resulting map (Figure 31) indicates locations of Nathusius’ records from the car-based bat
monitoring scheme, plotted at a 1km level. As can be seen from this map, Nathusius’ pipistrelle bats
tend to be found in the same squares year after year, but there are some squares where the species has
never been recorded to-date. This reflects the fact that the species can be detected with relative ease
but that it has a limited distribution on the island. When viewed in the context of Figure 30 above, it
can be seen that Nathusius’ pipistrelles picked up during the car-based scheme generally occur in

Car-based Bat Monitoring 2003-2011
____________________________
43
locations predicted to be more suitable for the species. However, notable exceptions can be seen in
west Cork and east Kerry, which is not predicted as suitable for the species but where many records
for the species have been collected.
Figure 31: Locations of Nathusius’ pipistrelles records derived from the car-based bat monitoring scheme from
2005 to 2011.

Car-based Bat Monitoring 2003-2011
____________________________
44
Myotis species
Occasional records for Myotis species are collected by the car-based bat monitoring method. These
records are widespread but infrequent across the island. Myotis sp. bat passes could be Natterer’s,
Daubenton’s or whiskered bats but it is not possible to definitively identify them to species level.
While a trend graph (Figure 32) has been constructed for Myotis species passes per minute based on
the car monitoring data, this shows little evidence of any trend, up or down. Should trends in Myotis
encounter rates become apparent in time, these should be treated cautiously since the results for
Myotis bats are likely to comprise a number of species.
Figure 32: Results of GAM/GLM model for proportion of 1.6km transects with Myotis species passes. Green
points are estimated annual means and the bars are 95% bootstrapped confidence limits. The solid black line is
the fitted GAM curve with 95% confidence limits shown by the upper and lower dotted lines.

Car-based Bat Monitoring 2003-2011
____________________________
45
Table 10: GAM results with 95% confidence limits for Myotis species (using first 15 transects only 2003-2008).
Index 2004 = 100
Mean passes smoothed 95% conf limits unsmoothed
year counts sites Mean s.e. estimate s.e. Lower upper estimate s.e.
2003 9 7 0.8 0.3 109.6 15.3 87.3 146.3 78.0 44.1
2004 27 17 0.8 0.2 100.0 0.0 100.0 100.0 100.0 0.0
2005 31 17 0.5 0.2 91.1 11.3 69.3 113.6 67.1 62.2
2006 45 25 0.4 0.1 84.8 19.2 52.0 127.3 49.3 25.6
2007 46 26 0.6 0.2 81.5 24.1 43.1 137.3 86.0 58.7
2008 42 23 0.3 0.1 79.5 24.6 39.7 134.4 48.1 21.4
2009 52 28 0.5 0.1 79.8 23.7 39.9 129.3 68.8 35.1
2010 53 27 0.4 0.1 82.6 23.3 41.9 130.9 52.5 24.8
2011 53 28 0.5 0.1 88.1 25.2 44.5 142.8 81.8 39.4
Brown long-eared bat
This species was encountered for the first time by the car monitoring scheme in 2007. It is largely
undetectable during the car surveys due to its quiet echolocation calls. However, it does occasionally
produce social calls of higher amplitude (loudness) which may be recorded. The records for the
species are summarized in Table 10 but there is little in the way of an obvious trend. A surprisingly
low value was recorded in 2008. When occurrences are examined by site and year, there is little sign of
a consistent pattern; which is exactly what would be expected from a widely distributed species with
low detection rate.
Table 10: Number of 1.6km transects with brown long-eared bats in each year, excluding surveys with less than
eight transects completed.
Year Transects with species present Total surveys
2007 9 46
2008 1 44
2009 9 53
2010 10 54
2011 10 53

Car-based Bat Monitoring 2003-2011
____________________________
46
The brown long-eared bat is the subject of a roost counting surveillance methodology that provides
more detailed population information for the species than is available from the car-based monitoring
method.
Other Vertebrates
Surveyors were asked to record living and dead vertebrates, that they encountered during the surveys
during and between transects. This resulted in the collection of 2,053 records of living vertebrates
(apart from bats) from 2006 to 2011. Figure 33 is a pie chart illustrating proportions of living vertebrate
records attributed to species or species groups. In all survey years the records for living vertebrates
have been dominated by cats. In most years, these accounted for over 50% of the records collected.
Rabbits were the second most frequently encountered species with 216 records collected. Dogs and
foxes are equally common (190 records each). A number of species of conservation interest have been
recorded by surveyors including otter, pine marten, and 12 barn owls.
Dead vertebrates tend to be recorded in differing proportions to live ones (see Figure 34). Despite the
high numbers of living cats observed during the car surveys, cats are relatively infrequently observed
as road kill, relative to the proportion of live sightings, but still constitute the second most frequently
recorded dead vertebrate. The most frequently recorded dead species is the rabbit, while rats and
hedgehogs are observed less often.
Since cats are the species that occur in greatest numbers, records for this species were analysed further
using TRIM. The total number of cats counted in each square each year was calculated and the time
taken to complete the surveys in each square was included as a weighting factor (to account for the
differences in time spent). The unsmoothed time effects model with all possible changepoints is
shown by the green points in Figure 35. The smoothed data from the default method of stepwise
model selection indicated significant change points in the first year of the survey 2006, and the second,
2007. The additive slope between 2006 and 2007 was 0.307, while from 2007 onwards counts appear to
have decreased, with an additive slope of -0.092. For both models the baseline year was taken as the
second year of the survey, 2007.

Car-based Bat Monitoring 2003-2011
____________________________
47
Figure 33: Proportions of living vertebrates recorded during car-based bat monitoring surveys from 2006 to 2011.
N=2053.
0
5
10
15
20
25
30
35
40
Figure 34: Number of records of dead vertebrates collected during the car-based bat monitoring surveys 2006-
2011. N=140.

Car-based Bat Monitoring 2003-2011
____________________________
48
Figure 35: Roadside cat counts, TRIM unsmoothed estimates (the green points are from using a linear
model with all possible changepoints) and a TRIM smoothed linear model, with the default stepwise
method of selecting changepoints. The baseline year was taken as 2007.

Car-based Bat Monitoring 2003-2011
____________________________
49
Discussion
The first nine years of the car based bat monitoring survey has been very successful, with a high level
of voluntary commitment (a detailed breakdown of volunteer turnover was provided in 2008, Roche et
al. 2009), accurate and robust data collection, and routine testing of methodologies and statistical
methods. The detailed methodology for the survey was published in 2011 in the peer-reviewed
journal, Animal Conservation (Roche et al., 2011). In addition, sonogram analysis of archived Leisler’s
bat calls from the survey contributed to a paper on the status of the noctule bat (Nyctalus noctula) in
Ireland (Puechmaille et al. 2011). An additional paper is currently in preparation on the records for
Nathusius’ pipistrelle that have been collated as part of the survey (Roche et al. in prep).
In order to improve the usefulness of the bat records arising from the survey we piloted the use of
smartphones as recording devices during 2011. The results from trials were very positive; very similar
encounter rates of the three most common species were observed whether recorded by smartphone,
minidisc or digital recorder such as Edirol. The phones have the additional benefit of a GPS chip
which enables geo-referencing of the bat record without having to resort to a back-calculation (using
transect start point and time spent surveying to calculate the distance travelled and, therefore, likely
bat location).
This year, with the cumulative data from nine years of the survey scheme, we have carried out a
number of new analyses with the aim of assisting in the interpretation of bat occurrence and trend
data for the island, as well as examining potential threats to the common bat species.
Species Trends
The highest common pipistrelle encounter rates were recorded by the car-based bat monitoring
scheme in 2007. Unsmoothed estimates for this species tend to show an oscillating trend, although the
GAM smoothed trend indicates a small increase since 2003. In 2010, the BCT’s National Bat
Monitoring Programme reported that this species was significantly increasing in Britain based on the
foot-based field surveys carried out there (Anon 2010).
Highest soprano pipistrelle encounter rates were recorded by the car-based bat monitoring scheme in
2008. Again, the unsmoothed estimates for this species tend to show an oscillating trend, but the GAM
smoothed trend shows an increase of borderline significance. The BCT’s National Bat Monitoring
Programme reported in 2010 that this species was showing an increase, based on the foot-based field
surveys carried out there, also of borderline significance (Anon 2010). From the available BCT data it
appears that the species began to increase from 2004 or thereabouts. The Irish trend for this species,
therefore, appears to mirror what has been occurring in Britain.
It should be noted that both common and soprano pipistrelles are also monitored in Britain using
colony counts but trends derived from these counts have shown a decrease in both populations.

Car-based Bat Monitoring 2003-2011
____________________________
50
This decline is considered an artifact of the survey methodology and the field survey results are, in
fact, considered more robust (Anon 2010).
Leisler’s bat encounter rates were highest in 2006 and 2010. The unsmoothed estimates for this species
also oscillate, although the GAM smoothed trend highlights a significant increase since the survey’s
inception in 2003. Since this species is infrequent in Britain, it is not included in the BCT’s population
trend indices so no comparable data is available for it.
For all three species, therefore, car-based bat monitoring data indicates that they are stable or
increasing. This is encouraging, but, it must be borne in mind that there was a dearth of data on bat
populations in Ireland for most of the 20th Century. During this time, particularly during the latter half
of the century, there were severe declines documented among many species throughout Europe (e.g.
Dietz et al. 2009). It can be fairly assumed that declines also occurred here, so any current increases
must be placed within this context.
While no other species are encountered by the car-based bat monitoring survey in sufficient numbers
to allow robust analysis of trends, a binomial analysis of Nathusius’ pipistrelles tentatively indicates
that the species remains stable. The records collected for this species from car-based bat monitoring
confirm that the species is a summer resident within the Republic of Ireland (RoI), as well as Northern
Ireland, even though no maternity roosts have been found in RoI to-date.
Weather Variables & Climate Change Predictions
In the present study, overall activity of common and soprano pipistrelles was not found to be directly
impacted by climate variables (temperature or rainfall). This may be because of the relatively short
duration of the study, which takes place over the two warmest summer months when activity is
generally at its peak, or because the level of weather data available is not finely tuned enough in the
context of the myriad of microhabitats along the route of each survey. It seems likely that the latter
may be the case when the results for pipistrelles are considered in the context of the significant
positive correlation between Leisler’s bat activity (at survey and square level) and temperature.
Leisler’s bat was the only one of the three monitored species to show a significant positive correlation
with average monthly temperature and temperature data collected by surveyors on the night of the
surveys, and a significant negative correlation with rainfall. The direct association between monthly
weather conditions and Leisler’s activity is probably a reflection of the species’ flight and foraging
style. It is a high flying, fast species (Shiel et al. 2008) that covers much larger distances in one night
compared with pipistrelles (e.g. Nicholls and Racey 2006; Waters et al., 1999), so weather variables
measured at a wider resolution may be more likely to correlate with its activity levels. Well-
constructed predictive models for this species with regard to global warming and climate change may,
therefore, yield reasonably accurate results. In contrast, potential impacts of climate change on
pipistrelles, which forage within a more restricted range and are perhaps impacted at a local scale by
weather changes, may be more difficult to predict with accuracy.
The significantly positive correlation between Leisler’s bat activity and temperature from the limited

Car-based Bat Monitoring 2003-2011
____________________________
51
timeframe of this study appears to support the findings of Rebelo et al. (2009) who predicted range
expansion for this species with increasing temperatures. Many factors, climate being just one, can
combine to impact on a population, however. One of the reasons why the Leisler’s bat is hypothesized
to be particularly common in Ireland is the absence of potential competitors such as the noctule bat
(Shiel et al. 2008). The noctule bat is classified as a Boreal species and is potentially threatened with
climate change-induced range reduction (Rebelo et al. 2009). However, with predicted increasing
temperatures, other large Temperate or even Mediterranean bat species may yet extend their ranges
into Ireland thus introducing a new element of competition and potentially reducing Leisler’s bats’
available prey and/or roost resources.
The Nathusius’ pipistrelle was not included in the car-based bat monitoring weather variable analysis
since it is recorded too infrequently. Lundy et al. (2010) examined records for the species in the UK
and found that it was associated with low seasonal variation in temperature and intermediate levels of
rainfall. They noted that while suitable areas for the species had existed in the UK since the 1940’s,
these had expanded and the authors predicted a twofold increase in areas suitable by 2050. The single
most influential climate variable contributing to range expansion for the species was the projected
increase in minimum temperature (Lundy et al. 2010). The ongoing car-based bat monitoring scheme
is well placed to pick up Nathusius’ pipistrelles should it begin to occur with greater frequency in
existing survey squares. However, since this species is modeled as having a currently very restricted
range within the island (Lundy et al. 2011), it may be worthwhile carrying out stratified sampling
within predicted high occurrence areas to increase the number of records collected and to improve the
effectiveness of monitoring for the population.
Street lights
Statistical analyses of street light data did not show any significant impact, positive or negative, on
common or soprano pipistrelle passes per minute along lit transects. This indicates that neither species
is attracted to or avoids transects with low levels of street lighting. However, it must be borne in mind
that most of the transects had relatively low lighting levels, with more than 95% of them having fewer
than 20 lamps per 1.6km, whereas much higher lighting levels are likely to be present in densely
urban areas or in the vicinity of motorway junctions, for example.
The street lighting analysis showed a clear impact on Leisler’s bat activity at transect level.
Significantly higher numbers of Leisler’s bats may be expected along transects lit with yellow (low
pressure sodium lamps) or white (e.g. mercury vapour lamps) street lights. The Leisler’s bat has
previously been reported as exploiting habitats around street lights in Ireland (Shiel et al. 1999).
While street lights, in this report, have been shown to have a neutral or even positive impact on bat
activity, there are other bat species that are negatively impacted by them, not least the Annex II listed
lesser horseshoe bat (Stone et al. 2009). We do not, therefore, propose to promote increased street
lighting in the hope that it may provide some benefit to Leisler’s bat to the detriment of Ireland’s rarer
or more light-sensitive bat species. In addition, this study examined relatively low lighting levels,
whereas all three monitored species were shown by Lundy et al. (2011) to avoid dense urban areas (see
below). While a lack of foraging habitat may be one of the reasons for bats avoiding dense urban
areas, other factors such as increased traffic and the presence of intense street lighting are also likely

Car-based Bat Monitoring 2003-2011
____________________________
52
to contribute. The car-based bat monitoring scheme, for the most part, avoids dense urban areas for
practical reasons, so this habitat types is generally under-represented in the survey.
Landscape Analysis
Among the habitat types predicted as important for common pipistrelles by Lundy et al. (2011) were
mixed and broadleaf woodland, riparian habitats and low levels of urban cover. However, the species
tends to avoid densely urban areas and bog/heath. The landscape favourability index dataset from
Lundy et al. (2011) was applied to passes per minute from the car-based survey at square level and
there was a positive, though not significant, correlation; average passes per minute increased with
improved predicted habitat suitability. This relationship is to be expected. Bearing in mind that the
landscape suitability dataset is plotted at a resolution of 5km squares, it is probably not surprising that
roadside activity levels do not significantly correlate with average 30km square level habitat
favourability.
In a recent paper by Boughey et al. (2011) linear landscape features and their characteristics were
analysed in the context of the UK National Bat Monitoring Programme Field Survey that has been
running in Britain since 1999. The authors found that common pipistrelles were more likely to be
present at points adjacent to a linear feature (i.e. hedgerow or treeline), and at points close to
woodland than at points with neither.
Some subtle differences were found in habitat preferences of soprano compared with common
pipistrelles by Lundy et al. (2011). The soprano pipistrelle favoured broadleaved woodland and
riparian habitats. While the soprano pipistrelle also favoured low density urban areas, the relationship
changes from preference to avoidance at a lower urban density than for the common pipistrelle (i.e.
the soprano favoured less densely urban areas than the common pipistrelle). The soprano pipistrelle is
also predicted to avoid higher altitudes.
The landscape favourability dataset from Lundy et al. (2011) was applied to passes per minute for
soprano pipistrelles at square level and there was a positive, though not significant, correlation with
increased average passes per minute with higher predicted habitat suitability. This relationship is to
be expected. Again, since the dataset from Lundy et al. is plotted at a resolution of 5km squares, it is
probably not surprising that roadside activity levels do not significantly correlate to a greater degree
with 30km survey square level habitat favourability.
Boughey et al. (2011) also examined the importance of linear landscape features and their
characteristics for the soprano pipistrelle. The authors found that the relationship between soprano
pipistrelles and linear features was slightly more complex than that of the common pipistrelle. The
soprano pipistrelle favoured points in close proximity to woodland and hedgerows with sparse trees
present or treelines (regardless of distance to woodland). However, hedgerows with no trees were
only found to be preferred when there was no nearby woodland (>300m distant).
Thus, while overall common and soprano pipistrelle activity along survey routes is approximately
correlated with the predicted landscape suitability index, many smaller features, in particular
hedgerows and treelines, and even the distance of these from nearby woodland, are likely to impact
on pipistrelle activity levels within a locality. Further analysis at transect level may show greater
Car-based Bat Monitoring 2003-2011
____________________________
53
correlation between the landscape index and pipistrelles passes, but a combination of the landscape
index and detailed data on linear features would be ideal.
Lundy et al. (2011) showed that, in Ireland, the Leisler’s bat prefers low levels of urban cover but tends
to avoid densely urban areas. Other habitat types found to be favoured by the Leisler’s bat were
broadleaved woodland, mixed woodland and riparian habitats. Apart from dense urban areas, the
main other landcover type avoided by Leisler’s bat is bog/heath. The landscape favourability dataset
from Lundy et al. (2011) was applied to Leisler’s passes per minute at square level but there was no
correlation found between the two. This result was unexpected. However, results from the weather
analyses (above) suggest that Leisler’s bat activity is impacted to a greater degree than the two
pipistrelles by general weather conditions. The greater mobility of the Leisler’s bat compared with the
two pipistrelles may be a key factor in explaining their differing interactions with landscape and
weather.
The back-calculation of Nathusius’ pipistrelle records from the car-based bat monitoring survey has
increased the number of available records with which to run a Max Ent model of Nathusius’
landscape suitability. While the current model tallies reasonably well with occurrence of Nathusius’
pipistrelles along survey routes, there are some exceptions. In west Cork and east Kerry, for example
where many records have been collected, some repeatedly, most of the landscape is not shown as even
moderately suitable for the species. Fine tuning of the Nathusius’ pipistrelle landscape suitability
model with the car-based bat monitoring dataset would be ideal and may provide more accurate
information on the species’ requirements in Ireland.
GAM and TRIM Trends
For comparative purposes, both GAM and TRIM models were applied to bat pass data. Results
showed that there was very little difference in yearly, unsmoothed estimates. This is unsurprising
since the models are essentially very similar in terms of the use of a Poisson distribution and a
logarithmic link function. The confidence limits can be very different in some cases, reflecting the very
different approaches to variance estimation. The TRIM model assumes that variances are equal and
hence calculates the confidence limits for these years using an overall estimate of variance. By contrast
the bootstrapping approach ensures that unusual observations have a direct impact on the width of
the confidence limits for the relevant years.
Comparisons between the smoothed curve of the GAM models and the linear switching trend of the
TRIM models, are more difficult because the models are so different. Whilst the width of the final
confidence intervals is not, usually, that dissimilar, the TRIM models are much more jagged,
responding to outlying years. There is rarely an obvious explanation for the extent of year-to-year
variation in bat data, and while the GAM approach smoothes out these fluctuations rendering overall
trends more obvious, the jagged results of TRIM tend to mask the underlying trends. Manual, rather
than automatic, selection of TRIM changepoints might provide results that were more satisfactory in
this respect, but would be more subjective.
We propose to continue using the GLM/GAM method of estimating population trends since this
provides a more intuitive result with more apparent trends.

Car-based Bat Monitoring 2003-2011
____________________________
54
Other Vertebrates
The car-based bat monitoring project collects records of many living and dead vertebrates along
roadsides at night. Bat Conservation Ireland intends to make this data available to the National
Biodiversity Data Centre although the data is still collected at relatively poor resolution.
There is currently no data available on the number of cats present in Ireland. The index of cat counts
collected and analysed as part of the present project provides an initial attempt to examine trends in
cat activity along Ireland’s roadsides at night. From TRIM analysis of the available data it appears that
the trend is reasonably steady with a recent decrease negating an increase seen in the first year or two
of the survey. The prevailing culture of allowing cats to roam freely at night may result in localized
impacts to wildlife populations. While the authors of a U.S. study of domestic cats that were allowed
to freely hunt found the cats averaged 5.54 kills per month, no relationship was found between the
number of cats detected in an area and local small mammal abundance (Kays and DeWan 2006). In
contrast, Lepczyk et al. (2003) found that cat predation plays an important role in fluctuations of bird
populations and should receive more attention in wildlife conservation studies.
In Ireland, the potential for cat predation on bats can only be surmised in the absence of scientifically
validated data. In view of the current stable or increasing trends of the three bat species studied in this
report, we hypothesise that cat predation is not currently negatively impacting bat numbers on a
national scale. However, while the current decrease in roadside cat numbers may simply be
coincidental with a rise in some bat numbers, we propose that further investigation of a possible
relationship should be carried out as the survey progresses. It should be borne in mind, also, that
individual cats with access to a roost exit point have the potential to decimate bat numbers at specific
roosts.
This index of roadside night time cat activity may also be of interest to many conservationists,
particularly those involved in small mammal and song bird conservation in Ireland so we anticipate
submitting the data to a peer-reviewed journal for publication.
Summary and Assessment of Threats
As mentioned in the Introduction, many factors combine to regulate bat populations and it is
unfeasible to imply that this project can fully assess all potential positive or negative influencing
factors. The following summaries apply to the species that are monitored using the car-based scheme,
since it is not possible to assess population trends or threats to the other species using this method.
Common pipistrelle
This species has the second largest predicted core area of any bat species on the island (56,485ha)

Car-based Bat Monitoring 2003-2011
____________________________
55
(Lundy et al., 2011). Current population trend data indicates that it is stable. While the UK has seen a
significant increase in this species (Anon 2011), this has not been reflected in Ireland. It has a range of
landscape types available, but favours mixed and broadleaf woodland and riparian habitats. Current
research suggests that microhabitats such as linear features play a particularly important role in
common pipistrelle activity. It does not avoid low levels of urbanization and it is not negatively
impacted by low levels of street lighting. Since no direct correlations have been found from the car-
based survey results and weather variables it is impossible to assess how the species is reacting or will
react to increasing temperatures.
Small scale habitat management such as hedgerow maintenance (and loss) is likely to play an
important role in regulating the species at a local level. Potential loss of hedgerows and treelines is
probably one of the main threats for this species in Ireland. In addition, the species often roosts in
buildings so there is continuing potential for human disturbance and roost loss through deliberate or
accidental exclusion. The possible impacts of climate change on this species are unknown and cannot,
therefore, be assessed in terms of potential threats.
Soprano pipistrelle
This species has the largest predicted core area of any bat species on the island (62,020ha) (Lundy et
al., 2011). Current population trend data indicates that it is increasing. The Irish trend of a (just about)
significant increase has been mirrored in the UK (Anon 2011). It has a range of landscape types
available but favours broadleaf woodland and riparian habitats, and it selects low levels of
urbanization. Current research suggests that microhabitats such as linear features play a particularly
important role in soprano pipistrelle activity. This species is not negatively impacted by low levels of
street lighting. Since no direct correlations have been found from the car-based survey results and
weather variables it is impossible to assess how the species is reacting or will react to increasing
temperatures.
Small scale habitat management such as linear feature (hedgerow & treeline) maintenance (and loss) is
likely to play an important role in regulating the species at a local level. Potential loss of hedgerows
and treelines is probably one of the main threats for this species in Ireland. In addition, the species
roosts in buildings, so there is continuing potential for human disturbance and roost loss through
deliberate or accidental exclusion. This issue is particularly important for the soprano pipistrelle
which sometimes roosts in very large numbers and can cause an odour problem in roosts, therefore
resulting in a direct conflict with roost owners (C. Kelleher and P. Scott, pers. comm.). The potential
impacts of climate change on this species are unknown and cannot, therefore, be assessed in terms of
potential threats.

Car-based Bat Monitoring 2003-2011
____________________________
56
Leisler’s bat
This species also has a large predicted core area on the island (52,820ha) (Lundy et al., 2011). Current
population trend data indicates that it is increasing significantly. No comparable population
information is available from any other country since it is infrequent or rare elsewhere in Europe. It
has a range of landscape types available but favours mixed/broadleaf woodland, riparian habitats,
and low levels of urbanization. It is positively impacted by low levels of street lighting. A direct
correlation has been found between the car-based survey results for this species and temperature,
indicating that it is positively impacted by increased temperature. Models of Leisler’s bat range
indicate that it may be positively impacted by climate change in all but the most extreme scenarios
examined by Rebelo et al. (2009).
Bat Conservation Ireland carried out a voluntary survey of known Leisler’s bat roosts in 2011 and
found that of the 15 proposed Natural Heritage Areas (pNHAs) for this species, just four of these
roosts were currently occupied by Leisler’s bat (C. Shiel pers. comm.).
In Ireland, therefore, there is direct evidence of roost loss, although in most cases it is unknown
whether the bats simply moved or were deliberately or accidentally excluded. Roosting site pressure
is therefore considered the main threat to Leisler’s bat here but more information is needed. At
present, climate change does not pose a direct threat to Leisler’s bat and may even benefit the species.
However, with climate change there is a potential threat of newly arrived competing bat species
where the Leisler’s bat currently has none in Ireland. Should an extreme climate change scenario come
to fruition, this may also directly, negatively impact the species in the latter half of this century
(Rebelo et al. 2009).
Conclusions and Recommendations
• There is no evidence of decline in any of the three species, the common pipistrelle, soprano
pipistrelle or Leisler’s bat, monitored using the car-based bat monitoring scheme. There is
evidence that the common pipistrelle is stable, the soprano pipistrelle is increasing and that
the Leisler’s bat is significantly increasing. We hypothesise that increases in Leisler’s bat are,
at least in part, linked to climate change but we have no evidence that this is an influencing
factor on the increase in soprano pipistrelles.
• We examined the possibility of using TRIM as an alternative method for assessing population
trends but are satisfied that GLM/GAM analysis provides better results for our purposes.
• In a separate project with the Centre for Irish Bat Research, using centrally held data from Bat
Conservation Ireland’s bat database, we investigated landscape favourability for these species
and found that they have a range of habitats available to them while tending to prefer

Car-based Bat Monitoring 2003-2011
____________________________
57
broadleaf woodland, riparian habitats and low density urbanization (Lundy et al. 2011). Using
the landscape dataset with car-based bat monitoring analysis we found no difference in
population trends in areas that were more or less favourable for each species.
• The Leisler’s bat shows increased activity in the vicinity of yellow or white street lights while
the common and soprano pipistrelles do not show any preference for, or avoidance of, lit
roadsides.
• The Nathusius’ pipistrelle information gathered by this scheme is limited because many
squares do not fall within its core range on the island. As far as we can deduce from the
available data it appears to be reasonably stable, but a dedicated Nathusius’ pipistrelle car
survey targeting known or predicted favourable areas is likely to yield better results.
• Insufficient data are collected by this scheme for analysis of Myotis species or brown long-
eared bat population trends.
• An analysis of cat counts from roadsides in July and August indicates that this species is not
increasing at present.
We recommend the following for the next three years of the car-based bat monitoring scheme:
• Continue surveying all 28 squares twice yearly. Recruit and train new surveyors as required.
• Phase in the use of smartphones and carry out training with survey teams over the next two-
three years.
• Ensure that the App used to simultaneously record sound and GPS data is bug free for 2012
survey season.
• Consider options for using satellite tracking software, instead of hard copy maps, in tandem
with recording App for 2013 survey season. In addition, survey routes should be digitized to
allow easy transfer between devices.
• Consider options to allow geo-referencing of other vertebrate records.
• Weather data – investigate the possibility of continuous weather recording along transects.
• Detailed habitat analysis, in particular of hedgerow and treelines, of survey routes.
• Continue using GLM/GAM method of assessing population trends.
• Investigate the cost and feasibility of car-based survey specifically for Nathusius’ pipistrelle
monitoring within predicted and confirmed high occurrence areas.
• Continue assessing roadside cat trend data and submit a paper on same to peer reviewed
journal.

Car-based Bat Monitoring 2003-2011
____________________________
58
• Discuss with the National Biodiversity Data Centre options for transfer of other vertebrate
data.

Car-based Bat Monitoring 2003-2011
____________________________
59
Bibliography and Relevant Literature
Anon (2011). The State of the UK’s Bats: National Bat Monitoring Programme Population Trends 2011. The Bat
Conservation Trust, August 2011.
Aughney, T., Langton, S. and Roche, N. (2009) All Ireland Daubenton’s Bat Waterway Monitoring Scheme:
Synthesis Report for 2006-2008. Irish Wildlife Manuals No. 42. National Parks and Wildlife Service,
Department of the Environment, Heritage and Local Government.
Aughney, T., Langton, S. and Roche, N. (2011). Brown long-eared bat roost monitoring for the Republic of
Ireland: Synthesis report 2007-2010. Irish Wildlife Manuals No. 56. National Parks and Wildlife Service,
Department of the Environment, Heritage and Local Government.
Battersby, J. (comp.) (2010). Guidelines for Surveillance and Monitoring of European Bats. EUROBATS
Publication Series No. 5. UNEP / EUROBATS Secretariat, Bonn, Germany, 95 pp.
Betts, M. G., Mitchell, D., Diamond, A. W. and Bêty, J. (2007). Uneven Rates of Landscape Change as a Source of
Bias in Roadside Wildlife Surveys. Journal of Wildlife Management. 71: 2266-2273.
Boughey, K.L., Lake, I.R., Haysom, K.A. and Dolman, P.M. (2011). Improving the biodiversity benefits of
hedgerows: How physical characteristics and the proximity of foraging habitat affect the use of linear
features by bats. Biological Conservation. In Press.
Buckley D.J., Puechmaille S.J, Roche N. and Teeling E.C. (2011). A critical assessment of the presence of Barbastella
barbastellus and Nyctalus noctula in Ireland with a description of N. leisleri calls from Ireland. Hystrix Italian
Journal of Mammalogy. 22: 111-127.
Catto, C.M.C., Racey P.A., and Stephenson, P.J. (1995). Activity patterns of the serotine bat (Eptesicus fuscus) at a
roost in southern England. Journal of Zoology, London. 235: 635-644.
Catto, C., Russ, J. and Langton, S. (2004). Development of a Car Survey Monitoring Protocol for the Republic of
Ireland. The Heritage Council, Kilkenny, Ireland.
Dietz, C., von Helverson, O. and Wolz, I. (2009). Bats of Britain, Europe and Northwest Africa. A&C Black
Publishers, London. 400pp.
Dunn, E. H. (2002) Using decline in bird populations to identify needs for conservation action. Conservation
Biology, 16 (6): 1632-1637.
Erkert, H.G. (1982). Ecological aspects of bat activity rhythms. In Ecology of Bats (ed. T.H. Kunz). Plenum, New
York. pp 201-242.
Fewster, R.M., Buckland, S.T., Siriwardena, G.M., Baillie, S.R. and Wilson, J.D. (2000) Analysis of population
trends for farmland birds using generalized additive models. Ecology, 81: 1970-1984.
Kays, R.W. and DeWan, A.A. (2004). Ecological impact of inside/outside house cats around a suburban nature
preserve. Animal Conservation. 7: 273-283.
Limpens, H.J.G.A. and Kapteyn, K. (1991). Bats, their behaviour and linear landscape elements. Myotis, 29: 39-48.
Longcore, T., and Rich, C. (2004). Ecological light pollution. Frontiers in Ecology and the Environment. 2: 191–198.
Lepczyk, C.A., Mertig, A.G. and Liu J. (2003). Landowners and cat predation across rural-to-urban landscapes.
Biological Conservation. 115: 191-201.
Lundy, M., Montgomery, I. and Russ, J. (2010). Climate change-linked range expansion of Nathusius’ pipistrelles
bat, Pipistrellus nathusii (Keyserling & Blasius, 1839). J. Biogeogr. doi:10.1111/j.1365-2699.2010.02384.x

Car-based Bat Monitoring 2003-2011
____________________________
60
Lundy, M.G., Aughney, T., Montgomery, W.I., and Roche, N. (2011). Landscape conservation for Irish bats & species
specific roosting characteristics. Bat Conservation Ireland.
Marchant, J.H., Wilson A.M., Chamberlain D.E., Gregory R.D. and Baillie S.R. (1997). Opportunistic Bird Species –
Enhancements for the Monitoring of Populations. BTO Research Report No. 176. BTO, Thetford.
Marnell, F., Kingston, N. and Looney, D. (2009). Ireland Red List No. 3: Terrestrial Mammals. National Parks and
Wildlife Service, Department of the Environment, Heritage and Local Government, Dublin.
Negraeff, D.E. and Brigham R.M. (1995). The influence of moonlight on the activity of little brown bats (Myotis
lucifugus). Zeifschrift fur saugetierkunde – International Journal of Mammalian Biology. 60: 330-336.
Nicholls, B. and Racey P.A. (2006). Contrasting home range size and spatial partitioning in cryptic and sympatric
pipistrelles bats. Behavioural Ecology and Sociobiology. 61: 131-142.
Rebelo, H., Tarrosow P., and Jones G. (2009). Predicted impact of climate change on European bats in relation to
their biogeographic patterns. Global Change Biology. 16: 561-576.
Rich, C., and Longcore, T. (2006). Ecological Consequences of Artificial Night Lighting. Island Press, Washington, DC.
Roche, N. (1998). Aspects of the Ecology of Insectivorous Bats (Chiroptera) in Temperature Deciduous Woodlands. Ph.D.
Thesis. University of Warwick.
Roche, N., Aughney, T., Kingston, N., Lynn, D. and Marnell, F. (in prep.). New records for Nathusius’ pipistrelles
in the Republic of Ireland and Northern Ireland from the Car-based Bat Monitoring Scheme 2003-2011..
Roche N., Langton S., Aughney T., Russ J.M., Marnell F., Lynn D., Catto C. (2011). A car-based bat monitoring
method reveals new information on bat populations and distributions in Ireland. Animal Conservation. 14:
642-651.
Roche, N., Langton, S. and Aughney, T. (2009) The Car Based Bat Monitoring Scheme for Ireland: Synthesis
Report 2003-2008. Irish Wildlife Manuals, No. 39. National Parks and Wildlife Service, Department of
Environment, Heritage and Local Government, Dublin, Ireland.
Rydell, J. (1992). Exploitation of insects around streetlamps by bats in Sweden. Functional Ecology. 6: 744-750.
Shiel, C.B., Shiel R.E. and Fairley J.S. (1999). Seasonal changes in the foraging behaviour of Leisler's bats
(Nyctalus leisleri) in Ireland as revealed by radio-telemetry. Journal of Zoology, London. 249: 347-358.
Shiel, C.B., Jones G., and Waters, D. (2008). Leisler’s bat Nyctalus noctula. In Mammals of the British Isles:
Handbook, 4th Edition (eds. S. Harris and D.W. Yalden). The Mammal Society, Southampton, pp334-338.
Stone, E., Jones, G. and Harris, S. (2009). Street lighting disturbs commuting bats. Current Biology, 19: 1123-1127.
Temple, H.J. and Terry, A. (2007). The Status and Distribution of European Mammals. Office for Official
Publications of the European Communities, Luxembourg.
Walsh, A., Catto, C., Hutson, T., Racey, P., Richardson, P. and Langton, S. (2001). The UK’s National Bat
Monitoring Programme, Final Report 2001. Bat Conservation Trust UK.
Waters D., Jones, G. and Furlong, M. (1999). Foraging ecology of Leisler’s bat (Nyctalus leisleri) at two sites in
southern Britain. Journal of Zoology, London. 249: 173-180.
Whilde, T. (1993). Threatened mammals, birds, amphibians and fish in Ireland. Irish Red Data Book 2:
Vertebrates. HMSO, Belfast.

Car-based Bat Monitoring 2003-2011
____________________________
61
Glossary of Terms
Bootstrapping
This is a method for estimating the sampling distribution of an estimator by resampling with
replacement from the original sample. In the context of population indices the resampling is done for
entire sites and ensures that confidence limits and significance levels are unaffected by any temporal
correlation in the data. It also allows for the effects of ‘overdispersion’ which occurs when data are
more variable than expected from a Poisson distribution.
Covariate
This is a variable that is possibly predictive of the outcome under study. A covariate may be of direct
interest or be a confounding variable or effect modifier.
Doppler Effect
Apparent change in frequency of a sound (measured in kilohertz, kHz) as a result of movement, either
of the source or the observer. The apparent frequency of a sound increases as the source of the sound
moves towards an observer or the observer move towards it and decreases as the source moves away
from an observer or the observer moves away from it.
GLM
Generalised Linear Model: a generalisation of ordinary regression and analysis of variance models,
allowing a variety of different error distributions and different link functions between the response
variable and the explanatory variables. The models used here have a Poisson error distribution and a
logarithmic link.
GAM
Generalised additive model: these models allow a smooth, non-parametric curve to be fitted to an
explanatory variable, within a GLM. In estimating population indices they are used to smooth out
year-to-year variation (Fewster et al. 2000).
Offset
A covariate with a fixed slope of 1.0, in this case implying that the total count doubles if the number of
recording intervals doubles.
Poisson Distribution
The Poisson distribution is a discrete probability distribution. It expresses the probability of a number

Car-based Bat Monitoring 2003-2011
____________________________
62
of events occurring in a fixed time if these events occur with a known average rate, and are
independent of the time since the last event. It is frequently used as the basis of statistical models of
counts of organisms or events.
Power Analysis
Analysis of the power (probability) to reject a false null hypothesis. A test with high power has a large
chance of rejecting the null hypothesis when this hypothesis is false. In the case of the present project
the null hypothesis would state that that there is no decline in bat populations. Power is measured as a
percentage, and greater power reflects the increased likelihood of detecting a declining trend (as
outlined for Red or Amber Alerts). The power analysis carried out for the present project is one-tailed
(i.e. examines a declining trend only) at P=0.05 (which is equivalent to P=0.l for a two sided test).
REML
Restricted (or residual) maximum likelihood (REML) is a method for fitting linear mixed models. In
contrast to conventional maximum likelihood estimation, REML can produce unbiased estimates of
variance and covariance parameters. This method assumes the data are normally distributed.
Relative Standard Error
The standard error of an estimate expressed as a proportion of the percentage of the estimate. Also
known as the coefficient of variation.
TRIM
TRends and Indices for Monitoring Data. TRIM is a program developed for the analysis of count data
obtained from monitoring wildlife populations. It analyses time series of counts, using Poisson
regression and produces estimates of yearly indices and trends.

Car-based Bat Monitoring 2003-2011
____________________________
63
Appendix
Summary statistics
Summary statistics are shown in the table below.
Table 1: Descriptive statistics (transects with less than 50 snapshots are excluded)
a) Common pips
Statistics per mile transect Statistics per 0.32ms recording
year Total
passes
n
transects
mean
passes
% with
passes
n n with % with
passes
passes
per min
2003 217 173 1.25 50.3 13225 217 1.64 3.00
2004 1055 545 1.94 57.4 41542 1023 2.46 4.80
2005 811 596 1.36 52.2 47170 798 1.69 3.23
2006 1506 880 1.71 52.7 67314 1443 2.14 4.24
2007 1567 880 1.78 53.9 65312 1489 2.28 4.49
2008 1548 860 1.80 50.1 63830 1548 2.43 4.52
2009 954 782 1.22 48.5 58320 936 1.60 3.04
2010 1157 811 1.43 49.7 59608 1140 1.91 3.66
2011 1192 783 1.52 51.2 56231 1158 2.06 3.94
All years 10007 6310 1.59 51.7 472552 9752 2.06 3.97

Car-based Bat Monitoring 2003-2011
____________________________
64
b) Soprano pips
Statistics per mile transect Statistics per 0.32ms recording
year Total
passes
n
transects
mean
passes
% with
passes
n n with % with
passes
passes
per min
2003 82 173 0.47 24.9 13225 82 0.62 1.15
2004 386 545 0.71 34.3 41542 377 0.91 1.71
2005 333 596 0.56 31.5 47170 329 0.70 1.32
2006 573 880 0.65 33.4 67314 562 0.83 1.55
2007 566 880 0.64 32.2 65312 550 0.84 1.62
2008 701 860 0.82 38.7 63830 701 1.10 2.03
2009 562 782 0.72 32.4 58320 550 0.94 1.75
2010 545 811 0.67 33.0 59608 528 0.89 1.65
2011 611 783 0.78 36.3 56231 589 1.05 2.02
All years 4359 6310 0.69 33.8 472552 4268 0.90 1.70
c) 50khz pips (NB shown as missing in my dataset for 2003)
Statistics per mile transect Statistics per 0.32ms recording
year Total
passes
n
transects
mean
passes
% with
passes
n n with % with
passes
passes
per min
2004 247 545 0.45 29.2 41542 247 0.59 1.12
2005 159 596 0.27 20.0 47170 159 0.34 0.63
2006 239 880 0.27 18.6 67314 238 0.35 0.67
2007 225 880 0.26 17.7 65312 221 0.34 0.65
2008 266 860 0.31 18.4 63830 266 0.42 0.77
2009 173 782 0.22 14.7 58320 171 0.29 0.53
2010 194 811 0.24 16.6 59608 194 0.33 0.59
2011 272 783 0.35 21.7 56231 270 0.48 0.89
All years 1775 6137 0.29 19.2 459327 1766 0.38 0.72

Car-based Bat Monitoring 2003-2011
____________________________
65
d) Myotis spp
Statistics per mile transect Statistics per 0.32ms recording
year Total
passes
n
transects
mean
passes
% with
passes
n n with % with
passes
passes
per min
2003 7 173 0.04 2.9 13225 7 0.05 0.11
2004 28 545 0.05 4.4 41542 28 0.07 0.12
2005 21 596 0.04 2.3 47170 21 0.04 0.08
2006 26 880 0.03 2.4 67314 26 0.04 0.07
2007 32 880 0.04 2.5 65312 32 0.05 0.09
2008 26 860 0.03 2.6 63830 26 0.04 0.07
2009 25 782 0.03 2.7 58320 25 0.04 0.08
2010 19 811 0.02 1.8 59608 19 0.03 0.05
2011 29 783 0.04 3.2 56231 29 0.05 0.09
All years 213 6310 0.03 2.7 472552 213 0.05 0.08
e) Leisler’s
Statistics per mile transect Statistics per 0.32ms recording
year Total
passes
n
transects
mean
passes
% with
passes
n n with % with
passes
passes
per min
2003 52 173 0.30 15.6 13225 52 0.39 0.72
2004 295 565 0.52 23.2 43087 293 0.68 1.31
2005 314 596 0.53 21.6 47170 314 0.67 1.24
2006 787 880 0.89 27.6 67314 769 1.14 2.26
2007 557 880 0.63 20.3 65312 547 0.84 1.56
2008 556 860 0.65 22.7 63830 556 0.87 1.62
2009 384 782 0.49 19.3 58320 379 0.65 1.24
2010 651 811 0.80 24.3 59608 637 1.07 2.02
2011 605 783 0.77 25.8 56231 586 1.04 1.99
All years 4201 6330 0.66 23.0 474097 4133 0.87 1.66

Car-based Bat Monitoring 2003-2011
____________________________
66
f) Nathusius’ Pipistrelle
Statistics per mile transect Statistics per 0.32ms recording
year Total
passes
n
transects
mean
passes
% with
passes
n n with % with
passes
passes
per min
2003 0 173 0.00 0.0 13225 0 0.00 0.00
2004 0 565 0.00 0.0 43087 0 0.00 0.00
2005 1 596 0.00 0.2 47170 1 0.00 0.00
2006 29 880 0.03 2.2 67314 28 0.04 0.08
2007 13 880 0.01 1.2 65312 13 0.02 0.04
2008 6 860 0.01 0.7 63830 6 0.01 0.02
2009 25 782 0.03 1.4 58320 25 0.04 0.08
2010 56 811 0.07 0.9 59608 41 0.07 0.19
2011 17 783 0.02 1.7 56231 17 0.03 0.06
All years 147 6330 0.02 1.1 474097 131 0.03 0.06
g) Brown long-eared (not separately recorded before 2007)
Statistics per mile transect Statistics per 0.32ms recording
year Total
passes
n
transects
mean
passes
% with
passes
n n with % with
passes
passes
per min
2007 17 880 0.02 1.4 65312 17 0.03 0.05
2008 2 860 0.00 0.2 63830 2 0.00 0.01
2009 9 782 0.01 1.2 58320 9 0.02 0.03
2010 10 811 0.01 1.2 59608 10 0.02 0.03
2011 13 783 0.02 1.3 56231 13 0.02 0.04
All years 51 4116 0.01 1.0 303301 51 0.02 0.03

Car-based Bat Monitoring 2003-2011
____________________________
67
Weather Data
Table 2: estimates, standard errors and Wald p-values for the relationship between log-transformed
passes per minute (real time) and monthly met data. All species groups are shown, but results for
the less common species should be treated with great caution.
Monthly average temperature Monthly rainfall
Species estimate s.e. P estimate s.e. P
Ppipistrellus 0.00666 0.015673 0.671 -0.0003675 0.0002727 0.178
Ppygmaeus 0.01904 0.013917 0.172 -0.0002062 0.0002443 0.399
Unk_pipistrelles 0.00508 0.010352 0.624 -0.0001830 0.0001887 0.332
Myotis 0.00393 0.003824 0.305 0.0000275 0.0000726 0.706
Leislers 0.03355 0.012935 0.010 -0.0007039 0.0002329 0.003
Nathusius 0.00333 0.001891 0.080 0.0000028 0.0000375 0.940
Brown_lg_eared 0.00189 0.003209 0.556 -0.0000138 0.0000524 0.793
All_Bats 0.05031 0.016423 0.002 -0.0006999 0.0002813 0.013
Table 3: estimates, standard errors and Wald p-values for the relationship between log-transformed
passes per minute and temperature recorded by surveyor. All species groups are shown, but results
for the less common species should be treated with great caution.
Temperature at start
Species estimate s.e. P
Ppipistrellus -0.011029 0.006425 0.086
Ppygmaeus 0.005605 0.005787 0.333
Unk_pipistrelles 0.001267 0.004341 0.770
Myotis 0.001909 0.001564 0.223
Leislers 0.020168 0.005267 <0.001
Nathusius 0.000897 0.000816 0.273
Brown_lg_eared 0.000385 0.000913 0.673
All_Bats 0.006021 0.006864 0.381

Car-based Bat Monitoring 2003-2011
____________________________
68
Street Light Analysis
Table 4: P-values for terms in the REML models. Streetlight variables are fitted as log-transformed
numbers.
terms Common
pip
Soprano
pips 50khz pip
Myotis
spp Leisler’s Nath pip
Brown
long-ear
Streetlights
orange 0.726 0.232 0.217 0.624 0.179 0.084 0.256
yellow 0.391 0.331 0.058 0.888 0.004 0.136 0.817
white 0.799 0.374 0.368 0.143 0.020 0.170 0.570
Time after sunset
linear <0.001 <0.001 0.001 0.020 0.034 0.009 0.283
quadratic <0.001 <0.001 0.005 0.033 0.005 0.016 0.334
Binomial GAM Analysis: Brown Long-eared Bat
Table 5: Binomial GAM results with 95% confidence limits for Brown Long-eared (using first 15
transects only 2003-2008).
Data Smoothed GAM model
Prp transects 95% conf limits
Unsmoothed
GLM
year surveys sites Mean s.e. estimate s.e. lower upper fitted s.e.
2007 46 26 0.014 0.004 0.011 0.004 0.004 0.019 0.015 0.005
2008 44 25 0.002 0.001 0.008 0.002 0.004 0.012 0.001 0.001
2009 53 28 0.012 0.004 0.009 0.003 0.005 0.015 0.011 0.004
2010 54 28 0.013 0.004 0.012 0.003 0.007 0.017 0.012 0.004
2011 53 28 0.013 0.004 0.014 0.004 0.007 0.022 0.013 0.004

Car-based Bat Monitoring 2003-2011
____________________________
69
Figure 1: Results of the GAM/GLM model for proportion of mile transects with Brown long-eared
passes. Green points are estimated annual means and the bars are 95% bootstrapped confidence
limits. The black line is the fitted GAM curve with 95% confidence limits shown by the red dotted
lines.
0.000
0.005
2008
0.010
2010
0.015
0.020
0.025
2009 2007 2011
Pro
p p
rese
nt

Car-based Bat Monitoring 2003-2011
____________________________
70
Locations and Descriptions of Survey Routes
Table 6: Transect start and end point grid references and descriptive information. Note that
descriptive information may not have been updated since the route was first established so certain
details may no longer apply.
Square
(Transect No)
Year
Established Grid ref Start Grid ref End Description of Start Point Address
C72 (1) 2007- C982261 C989247
Start at Bogland Road, Dunaghy Road junction. House on right No. 26. End at no. 3
Green Acre lodge, Bogland Road Northern Ireland
C72 (2) 2007- C9360027000 C9260028500
Start at 186 House red brick. Seacon Road. Row of houses on left, open fields. End at
149 House Forest areas on left hand side. End at 148 on right. Northern Ireland
C72 (3) 2007- C8970026600 C9070025000
Start at Glenstall Road, riding school on left. End at bend after marina. House no. 28
pillars on right hand side. Northern Ireland
C72 (4) 2007- C9560021900 C9350021700
Start at Moneycannon road at Claughey Bridge. No. 55 House on left. End at double
gates on right. Barns on right. Northern Ireland
C72 (5) 2007- C8110021200 C8690020000 Start at Moneycarrie Road. Start at hump sign. End at first give way sign on left. Northern Ireland
C72 (6) 2007- C8550026200 C8430027100
Start at Coolyvenny Road at No. 72 House. Pillars with dogs on them. End at junction
Coolyvenny road and Ballylintogh Road at Killure Bridge. Northern Ireland
C72 (7) 2007- C8000025000 C8100026300
Start at Letterloam Road, at Shinny Bridge cross roads. End at House no. 30 on
Letterloam Road, white house on right. Northern Ireland
C72 (8) 2007- C7330020600 C7350022500
Start at Terrydo Road House no. 63/65. End at hill, stop in middle at pole with gas
arrow orange top on left. Northern Ireland
C72 (9) 2007- C7130025600 C7250026500
Start at Bolea Road at cul de sac on left, no. 19 house on right. End at wall on right
beside farmyard / shed with corrugated iron. Northern Ireland
C72 (10) 2007- C7450028900 C7470030500
Start at Altikearagh Road, conifer forest on each side at start of road. End at point
where lines on road start. Northern Ireland
C72 (11) 2007- C7170034100 C7300034900 Start at Bishop\\'s Road, at Gortmore picnic area. End at bridge wall. Northern Ireland
C72 (12) 2007- C7840033800 C7760032400 Start at the start of Sconce Road. Finsh at end of road. Northern Ireland
C72 (13) 2007- C8010030600 C8050029100 Start at no. 67 house with white pillars. End on hill, double gates on left. Northern Ireland
C72 (14) 2007- C8170034400 C8300033300
Start at Cranagh Road, at house with wooden gates on right. End at Hagheragwee
Road, fork in road. Northern Ireland
C72 (15) 2007- C8690029900 NULL
Start at Mount Sandle Road, at Mountlewood sign, woodland on right. End at house
no. 225. Northern Ireland
G20 (1) 2006- G2150504895 G2296205204 Past Pontoon Hotel until Foxford turnoff Mayo
G20 (2) 2006- G2297407907 G2238408965 Small Layby before Knockmore. Stop beside house on left and electricity pole. Mayo
G20 (3) 2006- G2037610851 G2054412525 End of row of houses with Leylandii hedge Mayo
G20 (4) 2006- G2055616258 G2130516798 Stone cottage and barns on left Mayo
G20 (5) 2006- G2547019773 G2575721619 None Mayo
G20 (6) 2006- G2633124533 G2694225914
Had to detour to get to this point (note from 2006). Trip metre mileage at start 21.5
at finish 22.6 Mayo
G20 (7) 2004- G2991324108 G3164823879
Start at newly built house and brick entrance on right. House has pebble dash. Finish
at Barrins grove house on left. line of mature sycamores and new stone wall.
G20 (8) 2004- G3251420927 G3273919317
Start at stone shed with red corrugates roof and doors on left. fork in road. Finish at
rusty metal gate on right, just after first gate.
G20 (9) 2004- G3220616373 G3195114782
Start at fork in road with western way sign pointing straight ahead. finish at slight
layby on left, telegraph pole on right.
G20 (10) 2004- G3064811719 G3010810225
Start at slight layby on left, end of forestry line on right, willow on right. Finish at
layby on left at entrance to field, on slight bend in the road.
G20 (11) 2006- G2822607930 G2921006284 T junction start. Stop at fork in road, house at the fork. Mayo
G20 (12) 2006- G3237602981 G3260904555
Start at little road off main Swinford Rd. Mileage 44. Finish at turn to left, sign on
wall Cartoonduff. Mileage 45 Mayo
G20 (13) 2004- G3450603992 G3580303486
Start at fork in the road, left road leads to houses, rusty gate on right. Finish at fork
in the road with western way marker to right.
G20 (14) 2006- G3885903985 G3934905050 None. Mileage 53 at start, 54.5 at finish. Mayo
G20 (15) 2004- G4051108229 G4078409862
Start at stone wall with gate on left after small white bungalow-rusty gate on right.
Finish at pebble dash wall on left and white metal gate into house.
G53 (1) 2004- G6752243409 G6444943879 Start stone house on right hand side. Finish at 2 large Ash trees on right hand side Sligo
G53 (2) 2004- G6106945154 G6012044439
Start at Maneghorow church sign. Finish at gate on left hand side after large 2 storey
white house. Sligo

Car-based Bat Monitoring 2003-2011
____________________________
71
G53 (3) 2004- G6317347808 G6426548671
Start at Mc Leans pub. Finish at ruin with narrow gate on right hand side of new
house. Sligo
G53 (4) 2004- G6823250713 G6957251405
Start turn right below school off main road, sign for b&b. Turn left on this road.
Finish at right hand bend, stone walls and shed on left, grey barn on right hand side. Sligo
G53 (5) 2004- G7105455708 G7245656058 Start at left turn to go along lough. Finish between two houses on right hand side. Sligo
G53 (6) 2004- G7558457003 G7690157581
Start off main road at leitrim sign. Finish on right hand side of bungalow after old
cottages (take next right to main road and go left) Leitrim
G53 (7) 2004- G7819454614 G7957254838
Turn right off main road, next right. Start at large over landscaped house on right
hand side. Finish at Yellow cottage on right hand side of the road after left bend in
the road. Leitrim
G53 (8) 2004- G7926951108 G7879149723 Start left after Conwal Bridge. Finish by house on right hand side. Leitrim
G53 (9) 2004- G7939741838 G7822642477
Start after bottle bank. Finish at first post after house on left hand side. Field gate on
right hand side. Leitrim
G53 (10) 2004- G7463643612 G7338343132
Start at lovely Leitrim sign on left hand side. Finish at the start of RH7 opposite
Bungalow and stone house. Sligo
G53 (10) 2004- G7463643612 G7338343132
Start at lovely Leitrim sign on left hand side. Finish at the start of RH7 opposite
Bungalow and stone house. Sligo
G53 (11) 2004- G7207439546 G7352539674 Start at Kilsellaghdem sign. Finish at gate on right hand side. Sligo
G53 (12) 2004- G7588837295 G7612735886 Start at activity sign on right hand side. Finish at top of hill. Sligo
G53 (13) 2004- G7944734912 G7888333940 Start at green barn. Finish at left turn sign. Leitrim
G53 (14) 2004- G7963230992 G7828830371
Start at two storey white house on right hand side. Finish at double gate entry to
cottage on left hand side. Oak trees on right hand side. Leitrim
G53 (15) 2004- G741303 NULL Start opposite turn on right hand side. Finish at concealed entrance. Sligo
G89 (1) 2006- G8150093446 G82799289
start at junction outside two storey house on left hand side. Finish at telepgraph pole
and galvanised gate. Donegal
G89 (2) 2006- G85249393 G86829401
Start at gate on the right hand side. Finish opposite junction/little bridge on right
hand side. Donegal
G89 (3) 2006- G89719437 G91109531 Start at church on left handside. Finish at old house and tractor on left hand side Donegal
G89 (4) 2006- G93809699 G95169683
Start at wire gate at hill top on right hand side. Finish at forestry sign and plantation
on left hand side. Donegal
G89 (5) 2006- G9806196714 G9958597011 Start at bungalow on left. Finish at shed on left (which is higher than road). Donegal
G89 (6) 2009- H0669896354 H09289626 Start at junction on right hand side. Finish at church on left hand side Donegal
G89 (7) 2009- C11610914 C10300995
Start at road on left hand side. Stop at B&B on left.
Donegal
G89 (8) 2009- C08881072 C09321216 Start at Y junction. Finish just after T-junction. Donegal
G89 (9) 2009- C09241507 C09971650
Start at pull in on left hand side. 2 x gates on right hand side. Finish at house with
concrete wall on left hand side. Donegal
G89 (10) 2009- C08531836 C07241849
Start at T-junction right hand side. Sign for letterkenny left hand side. Stop at little
road on left hand side with galvanised gate. Donegal
G89 (11) 2009- C05951587 C04491453
Start opposite entrance to garden centre. Stone entrance on right hand side. Stop
before road on left Donegal
G89 (12) 2009- C02061344 C00451383
Start at gate to house on left. Finish after 1 mile - no landscape features of note
Donegal
G89 (13) 2009- B97911543 B96561550 Layby on right. 2 miles since last transect. Finish after 1 mile (no features) Donegal
G89 (14) 2009- B94111356 B92951240
Start 2 miles since last transect. No visible landmarks. Finish near car park for Lough
Bana Donegal
G89 (15) 2009- B9092810230 B8957809171
Start 2 miles after last transect. No visible landmarks, some willow bushes. Stop at
old building on right. Donegal
H13 (1) 2009- H1098856297 H1169354820 Start at bend, end at bend? Northern Ireland
H13 (2) 2009- H1169751985 H1034551711
St Patrick\\'s Catholic Church. End at short lane to pebbledashed two-storey house
on right. Northern Ireland
H13 (3) 2009- H1120547467 H10184766
Start at road junction with dead end sign beside white bungalow. End at lay-by
opposite bath cow water trough. Northern Ireland
H13 (4) 2009- H1235843947 H1108043184
Start at straight concrete lane on right. End where double entrance gates meet on
road. Northern Ireland
H13 (5) 2009- H1002839359 H1159239435
Start at hardcore lane on right after tin roofed sheds on right after trees. End at
gateway with stony lane on left. Northern Ireland
H13 (6) 2009- H1027034280 H1159633650
Start at gate with layby on left (set back at angle from road before lane to left). End
at two cement lanes, one on each side of the road. Northern Ireland
H13 (7) 2009- H1991032562 H2008230983
Bungalow on the left with cream top balustrade. End at two storey house on right
with wooden fence. Northern Ireland
H13 (8) 2009- H2673531038 H2817831032
Cluster of three houses starting at McMannus 73. Ornate iron gates on right. Take
right towards? End at two opposing field gates, bad bend on right just ahead. Northern Ireland
H13 (9) 2009- H3551834742 H3413933624 Unknown Northern Ireland
H13 (10) 2009- H3808831278 H3933330479 Start at two lanes Northern Ireland
H13 (11) 2009- H397355 H384343
Start at concrete lane on right at an angle to road, old buildings behind trees up
ahead. End at staggered cross road, brown sign (Carnore 9) cycle route sign. Northern Ireland
H13 (12) 2009- H378387 H383403 Start at lane to white house on hill. End at Elim Pentecostal Church, Brookeborough. Northern Ireland
H13 (13) 2009- H387450 H387466
Start Concrete lane beside large bricke house on right with ivy and house with
monkey puzzle trees. End at Creagh Methodist Church at staggered crossroads. Northern Ireland

Car-based Bat Monitoring 2003-2011
____________________________
72
H13 (14) 2009- H379509 H389522 Start at Imeroo crossroads, fenced off outbuilding with green door just after the end. Northern Ireland
H13 (15) 2009- H399569 H394384
Start at cross roads with Aspen trees. End at junction. Red tin roofed outhouses,
farmhouse on right. Northern Ireland
H40 (1) 2006- H445019 H462018
Start at Crubany National School on left hand side. Finish at yellow dormer house on
right. Cavan
H40 (2) 2006- H492022 H504023
Start at derelict building on right. Finish at lay-by entrance to dwelling on left hand
side Cavan
H40 (3) 2006- H515023 H528870
Start at entrance to dwelling on right hand side and gate on left. Finish at two new
houses on right hand side. Cavan
H40 (4) 2006- H555008 H569014
Start at brick dormer on right hand side and derelict building on the left. Finish at
dwelling on left hand side. Cavan
H40 (5) 2006- H587037 H601031
Start after cross and old shed. Dwelling on right hand side. Finish at shed on right
hand side and gate on left. Cavan
H40 (6) 2006- H628041 H643043 Start at large 2 storey house on right hand side. Finish situated in left turn in road. Cavan
H40 (7) 2006- H631068 H632083 Start at narrow road on left hand side. Finish at gate on right hand side. Cavan
H40 (8) 2006- H623111 H615126
Start at red outhouse on right hand side. Gate on left with sunclub sign. Finish at
powerlines overhead before crossroads. Cavan
H40 (9) 2006- H647156 H661164
Start at filling station on left hand side and lake on right. Finish at lake and dormer
bungalow to left. Monaghan
H40 (10) 2006- H653204 H648218 Start at dwelling and garage on right hand side. Finish on bridge. Monaghan
H40 (11) 2006- H656262 H647275 Start just off the Cootehall Road on the left. Finish at lake on left hand side. Monaghan
H40 (12) 2006- H626297 H617293
Start at wooded area (on both sides of road). Finish at red bricked bungalow on right
hand side. Monaghan
H40 (13) 2006- H596273 H583266
Start at shed road on left hand side and road on right. Finish at gate and dwelling on
right hand side. Monaghan
H40 (14) 2006- H554252 H540255 Start at crossroads at Killevan village. Finish just before red shed on right hand side. Monaghan
H40 (15) 2006- H516244 H509235
Start at two storey house on right hand side. Finish at entrance to field on right hand
side. Monaghan
H79 (1) 2006- H7385798756 H7479097441 Northern Ireland Northern Ireland
H79 (2) 2006- H7694895498 H7810394838 Northern Ireland Northern Ireland
H79 (3) 2006- H8066196677 H8221496736 Northern Ireland Northern Ireland
H79 (4) 2006- H8378594847 H8450793531 Norhtern Ireland Northern Ireland
H79 (5) 2006- H8669391407 H8827491036 Northern Ireland Northern Ireland
H79 (6) 2006- H9086791922 H9197392934 Norhtern Ireland Northern Ireland
H79 (7) 2006- H9510093896 H9565094929 Norhtern Ireland Northern Ireland
H79 (8) 2006- H9439597686 H9345499120 Northern Ireland Northern Ireland
H79 (9) 2006- C9239702748 C9348402832 Northern Ireland Northern Ireland
H79 (10) 2006- C9527104354 C9546005564 Northern Ireland Northern Ireland
H79 (11) 2006- C9468208610 C9427510179 Northern Ireland Northern Ireland
H79 (12) 2006- C9208912577 C9090013233 Northern Ireland Northern Ireland
H79 (13) 2006- C8640414753 C8232716810 Northern Ireland Northern Ireland
H79 (14) 2006- C8232716810 C8137516359 Northern Ireland Northern Ireland
H79 (15) 2006- C7949416140 C7791216081 Northern Ireland Northern Ireland
J06 (1) 2006- J2430081300 J2440082500
Start at farm with grey metal out building. End just after thatched house with white
posts. Northern Ireland
J06 (2) 2006- J2400085000 J2300085800 Start at cross roads. End just before Templeton Hotel Northern Ireland
J06 (3) 2006- J2110087200 J1950087300 Start at gate lodge. End at Burnside Road Orange Hall. Northern Ireland
J06 (4) 2006- J1750089000 J1580089300 Start at house on right, white lanterns. Stop at crossroads. Northern Ireland
J06 (5) 2006- J1210088500 J1330087400 Start at Castleburn house. End at Gatehouse on right. Northern Ireland
J06 (6) 2006- J1520085900 J1670085400 Start halfway down road. End at Greenmount campus. Northern Ireland
J06 (7) 2006- J1720082300 J1720080900 Start just after Muckamore Abbey. End just after cross roads. Northern Ireland
J06 (8) 2006- J1680078300 J1590076900 Start at metal farm building. Finsh at junction. Northern Ireland
J06 (9) 2006- J1490074900 J1400073800 Start just past built-up area, turn right at sharp bend. End at junction. Northern Ireland
J06 (10) 2006- J1340070500 J1320068700 Start just before Hickland Cycles. End at stoney bridge on road. Northern Ireland
J06 (11) 2006- J1120067100 J0970066700 Start at left turn at Diamond Engineering. End at small cross roads. Northern Ireland
J06 (12) 2006- J0790065800 J0870064500 Start at metal barn. End at junction, 1st house on left. Northern Ireland
J06 (13) 2006- J1090062900 NULL Start where two rows of houses start. Road at right where transect ends. Northern Ireland
J06 (14) 2006- J1470061400 J1590061200 Start just after motorway bridge. End at roundabout. Northern Ireland

Car-based Bat Monitoring 2003-2011
____________________________
73
J06 (15) 2006- J1900061500 J2020061300 Start after Orange Hall. End at Robbery Road. Northern Ireland
J33 (1) 2007- J3350039900 J3670041700
Start at road junction, minor road to right hand side. End at large grey building on
right. Northern Ireland
J33 (2) 2007- J3730045500 J3660047500
Start at lin eof mature trees to left, just after buildings at road junction. End at
crosses stream (bridge), yellow house on right. Northern Ireland
J33 (3) 2007- J4130053200 J4060054600 Start at end of white wall. End at brow of hill, stone wall on right. Northern Ireland
J33 (4) 2007- J3890058300 J3760057900
Start at very prominent landmark - lone mature tree on right. End at low grey wall
and bungalow on left. Northern Ireland
J33 (5) 2007- J3170057400 J3060056700
Start at wooden post - rail fence on right, immediate left turn (steep). End at
crossroads. Northern Ireland
J33 (6) 2007- J2610057800 J2550056300
Farm entrance with galvanised gates on left, estate wall on right. End - no useful
landmark, use milometer. Northern Ireland
J33 (7) 2007- J2760052700 J2840051500
Start by large driveway on left, after tight left hand bend, just after road junction.
End at brow of hill, immediately after bridge. Northern Ireland
J33 (8) 2007- J2820047600 J2730046000
Start at bungalow on right hand side, (new, yellow). End at large gateway on right,
pillars with statues. Northern Ireland
J33 (9) 2007- J2580040900 J2490039600 Start where road exits Lowtown. End where road enters Moneyslane. Northern Ireland
J33 (10) 2007- J2240037600 J2380037000
Start at large grey Byre (new, curved roof) to left of road. Use mileometer for end
point. Northern Ireland
J33 (11) 2007- J2880034600 J3030034300
Start where large lake becomes visible to right of road after rounding bend. No
useful land mark for end point, use mileometer. Northern Ireland
J33 (12) 2007- J3760034500 J3890035300
Start at national speed limit sign, exit Maghera. No useful landmark for end point,
use mileometer. Northern Ireland
J33 (13) 2007- J4120040600 J4260041100
Start at lay-by, just after national speed limit sign, exit Clough. End at picnic area to
right hand side of road. Northern Ireland
J33 (14) 2007- J4570039700 J4560038000 Start at stone wall / end of barn on left hand side. End at bungalow on left hand side. Northern Ireland
J33 (15) 2007- J5140035700 J5230034600 Start at churchyard to left. End - use mileometer. Northern Ireland
L64 (1) 2008- L7010258626 L7014060091 Start by ESB pole on left hand side of road Galway
L64 (2) 2008- L7142562474 L7285062547 Start at house with white guitars on gate on right hand side of road Galway
L64 (3) 2008- L7555263760 L7689463240 Start at ESB pole on ledft hand side of road Galway
L64 (4) 2008- L7933361361 L8067860864 Start at gate with cattle grid on right hand side road Galway
L64 (5) 2008- L8044659616 L7917258908 Start on a rise, start of continuous white line on road, left bend, ESB pole on left. Galway
L64 (6) 2008- L8081857164 L8201556177 Start at bog, no landmarks Galway
L64 (7) 2008- L8430854042 L8504752677 Start just past bridge and sign to Inash Lodge Hotel. R344 on permanent sign. Galway
L64 (8) 2008- L8454149744 L8404448273 Start at double gates on right hand side Galway
L64 (9) 2008- L8120246962 L7992047290 Start at white bungalow on right hand side Galway
L64 (10) 2008- L7718046694 L7592346317 Start at ESB pole on right hand side with transformer. Finish just before bridge. Galway
L64 (11) 2008- L6673340195 L6520940384 Start at pullin on left hand side of the road Galway
L64 (12) 2008- L6329642651 L6228343990 Start at pullin on left hand side of road, cut stone wall Galway
L64 (13) 2008- L6358046897 L6500047481 Start at top of track on left hand side, dangerous bends ahead sign c. 40m in front. Galway
L64 (14) 2008- L6238148727 L6189649813 Start at cut stone cottage on right hand side Galway
L64 (15) 2008- L6470248424 L6594247763 start where Clifden is to left hand side across water Galway
M24 (1) 2003- M226462 M215453
Start at sign for Ower house. Finish at house under construction- left hand side, past
staggered junction. Galway
M24 (2) 2003- M208472 M207486
Start at new house under construction on left hand side, old pier on left.Finish at
bend in road at bungalow on right. Calito Miralgo Galway, Mayo
M24 (3) 2003- M204512 M202525
Start at new house being built beyond yellow house. Finish at left turn with telegraph
pole. Mayo
M24 (4) 2003- M219542 M221557
start at old house with long driveway with cattle grid. finish at T junction with yield
sign Mayo
M24 (5) 2003- M243574 M252587
Start at small green area on left hand side to pull in. Finish at 2nd house on left after
bridge Mayo
M24 (6) 2003- M258613 M260629
Start at first lane on left at end of white line. Finish at big yellow house on left with
stone wall and yellow capping. Mayo
M24 (7) 2003- M270659 M264673
start left turn in Roundfort village. Finish at low wall on left, planning permission sign
on left. Mayo
M24 (8) 2003- M278688 M292682
start at big house on left, garage building on right. Finish at second lane on left after
school and cross roads. Mayo
M24 (9) 2003- M317662 M325656 start at left turn for Garrymore spa. Finish at slatted house on left. Mayo
M24 (10) 2003- M345633 M357618
Start just after right turn before closed over trees. At pull in on left. Finish at
commemorative stone on left for Ballyglass. During course of mile transect meet a T
junction and take a right turn Mayo
M24 (11) 2003- M379613 M393613
Start at fork on the right with opposing gates. Take left, at a yield sign take left. Finish
at second wall of graveyard on right. Mayo, Galway
M24 (12) 2003- M412594 M402583
Start at council no dumping sign on left. Finish at two storey modern house on right
with unbuilt wall. Galway
M24 (13) 2003- M430553 M424541
start at right turn at t junction, two large chestnut trees at a gateway. Finish at stone
house on right, dev. land for sale sign. Galway
M24 (14) 2003- M430517 M419526
Start just beyond right turn opposite industrial buildings. Finish at industrial estate
on left. Galway

Car-based Bat Monitoring 2003-2011
____________________________
74
M24 (15) 2003- M388534 M375531 Start at second left turn at old style bungalow Galway
M87 (1) 2003- N082837 N070826
Start at junction N4, Bornacoola community alert. Finish at gravel into pink house
side entrance Longford
M87 (2) 2008- N054872 N055892
Start at end of lights in Roosky, after end of speed restriction.
End at 1st bungalow on left coming up before speed restriction to Dromard village. County Longford
M87 (3) 2003- N081902 N077920
Start at house on right hand side after school, Corracramph South. Finish at
hedgerow on left before fenced in farm house. Longford
M87 (4) 2003- N095926 N104905
Start at wrought iron fence on right hand side around house, near Lough rinn. Finish
at red barn on right hand side. Longford
M87 (5) 2003- N021864 N006862
Start at bungalow with wooden fence (R371) on left handside of Roosky-scramoge
road. finish at two houses on right hand side, just after second house Roscommon
M87 (6) 2003- M984840 M976824 Start at kilglass lake sign on right hand side. Finish before quarry entrance Roscommon
M87 (7) 2003- M947795 M933800
Start at Strokestown Park House sign on N5. Finish before 30mph sign, approx.
500m. Roscommon
M87 (8) 2003- M924832 M915844 Start at left hand turn. Strokestown house on right. Finish at sharp right road sign Roscommon
M87 (9) 2003- M898867 M884876
Start at first garden gate after crossroads on the Strokestown-Elphin road. Finish at
house on right handside before lane on right hand side Roscommon
M87 (10) 2003- M882897 M892907
Start at Kinard bridge. Finish at house on right via lane on the Carrick-
Elphin road Roscommon
M87 (11) 2003- M903936 M913948
Start slightly past left turn along Carrick-Elphin road. Finish just before crossroads
sign. Roscommon
M87 (12) 2003- M925973 M930988 Start at house on left opposite 2 road entrances. Finish at N4 T junction. Roscommon
M87 (13) 2003- M902984 M886921
Start at bungalow on left after sharp bend. Finish at house and barn on left hand
side. Roscommon
M87 (14) 2003- M857966 M847959 Start at cut stone building. finish at bump in the road before house on left Roscommon
M87 (15) 2003- M833946 M836933
Start at first dangerous bend reflective sign on right hand side. Finish at traffic sign
on right hand side. Roscommon
N11 (1) 2003- N3440039300 N3270039500 Co. Westmeath Co. Westmeath
N11 (2) 2003- N3250037400 N3330036400 Co. Westmeath Co. Westmeath
N11 (3) 2003- N3570034700 N3740034800 Co. Westmeath Co. Westmeath
N11 (4) 2003- N3980032900 N3890031900 Co. Westmeath Co. Westmeath
N11 (5) 2003- N3630029800 N3470029700 Co. Offaly Co. Offaly
N11 (6) 2003- N3130028700 N3100030300 Co. Offaly Co. Offaly
N11 (7) 2003- N2910029000 N2900027400 Co. Offaly Co. Offaly
N11 (8) 2003- N3090025400 N2950025000 Co. Offaly Co. Offaly
N11 (9) 2003- N3060022500 N3080020900 Co. Offaly Co. Offaly
N11 (10) 2003- N3000018600 N3170017900 Co. Offaly Co. Offaly
N11 (11) 2003- N3420016500 N3340015200 Co. Offaly Co. Offaly
N11 (12) 2003- N3070011600 N2950012700 Co. Offaly Co. Offaly
N11 (13) 2003- N2730015000 N2570015400 Co. Offaly Co. Offaly
N11 (14) 2003- N2380017400 N2510018700 Co. Offaly Co. Offaly
N11 (15) 2003- N2030020900 N2060022700 Co. Offaly Co. Offaly
N74 (1) 2006- N8533467628 N8372567918
Start at first house on left hand side, disused and boarded up. Young broadleaf
plantation on right hand side (Tara mines). Finish at yellow house with porch and
leylandii hedge in a group of four houses. 2nd house in the group. Meath
N74 (2) 2006- N7904667407 N7748167575
Start at crossroads (Trim/Athboy/Navan), Cortown. Finish at gateway on left hand
side into field, just before crossroads and just before row of houses on left. Meath
N74 (3) 2006- N7339569390 N7357764382
Pass a road on the right and start at gate to field on left hand side. Bungalow on right
with leylandii hedge. Stop at laneway on left just before another laneway to farm
buildings, before two storey yellow/brick house. Meath
N74 (4) 2006- N7357764382 N7416162923
Start just beyond crossroads. Finish at gateway on right between ash and large
beech. Meath
N74 (5) 2006- N7327557662 N7305056178
Start at first house on left after right turn. Gunnings concrete sign. It is a white
bungalow. Finish at another white bungalow on right with ballustrades. Copper
maple in beech hedge. Meath
N74 (6) 2006- N7332753266 N7495453408
Start after left turn. First house on left hand side, stone cottage. Finish at Boardsmill
GAA pitch. Meath
N74 (7) 2006- N7758751343 N7874850695
Start at white brick-effect bungalow with stone wall just after laneway on left. Old
concrete barn on right hand side. Finish at new dormer bungalow on left. Entrance
between beech and ash tree, next door to new yellow dormer bungalow. Meath
N74 (8) 2006- N7559147955 N7419048631
Start at white cottage on right and hay sheds on left hand side. Stop at black gate on
right hand side of road just past magnolia house with wooden fence on right hand
side. Meath
N74 (9) 2006- N7273944501 N7401744007 Start at layby just after left hand turn. Finish at double green galvanised gate. Meath

Car-based Bat Monitoring 2003-2011
____________________________
75
N74 (10) 2006- N7962145702 N8118345584
Start at entrance to quarry on right hand side. Finish at two mature ash trees and
sycamore on left hand side after bend in the road. Meath
N74 (11) 2006- N8389744378 N8475143102
Start at third house after crossroads on left hand side, two storey house. Finish at
50km sign on both sides of road, just after left hand turn. Meath
N74 (12) 2006- N8562246404 N8666647440
Start at slip road on left hand side after right hand turn. Finish at bungalow magnolia
with sheds on left hand side. Small white cottage on right. Sign - caution cows
crossing. Meath
N74 (13) 2006- N9328645525 N9250346917
Start at first house on right hand side (grey bungalow with pampas grass). Finish at
stone gates on right hand side and farm gate on left. Meath
N74 (14) 2006- N9391951701 NULL
Start at two storey white house on right hand side with driveway and with small
trees and beech hedge. Finish at modern house on right before bad bends. Meath
N74 (15) 2006- N9166655757 N9245957100 Start at entrance to church on right hand side. Finish at sign post for crossroads. Meath
N77 (1) 2009- N9729381613 N9593282437
Start at crossroads sign. Finish at electricity pylon just before two houses on left
hand side and one house on right hand side. Louth
N77 (2) 2009- O0045182026 O0165482573
Start at housing estate just before 80kmph sign. End at gate on right hand side, 200m
from crossroads Louth
N77 (3) 2009- O0140185403 O0095187002
Start 100m before tiphead on right hand side. End just at T-junction with engineering
factory. Louth
N77 (4) 2009- O0243989410 O0305890912
Start just after crossroads just before school. End at bridge adjacent to Ardee
livestock sales yard. Louth
N77 (5) 2009- O0271494253 O0213195540
Start just before house on right hand side beside farm gates on left and right, just
after line of poplars. Finish after passing through Mansfieldstown at house on right
hand side just before stop sign. Louth
N77 (6) 2009- N9934596781 N9768596741
Start 100m after junction off N52 (at 80kmph sign). End at farm house on left hand
side. Louth
N77 (7) 2009- N9580699680 N9437499650 Start 50m after The Hill pub. Finish after 1 mile (no particular feature). Louth
N77 (8) 2009- N9161298734 N9028497853
Start at farm gate on left hand side. End at wooden post and wire fence just after
large 2 storey house on left hand side. Louth
N77 (9) 2009- N8782898425 N8632898074
Start at white bungalow on left hand side just at ESB pole. End at house on brow of
hill. Cavan
N77 (10) 2009- N8542894039 N8387295189 Start at farmyard. End at gate on left. Meath
N77 (11) 2009- N8171597389 N8079898753
Start at house on left hand side, red gate with white pillars. End at stone building on
right hand side, gates on left and right. Cavan
N77 (12) 2009- N7937398229 N7766498817 Start at bend in road just after side road on right hand side. End at junction to R162. Cavan
N77 (13) 2009- N7876394783 N7869193046
Start at farm gate on left hand side just past petrol station as leaving Kingscourt on
Navan Rd. Finish at gate on left hand side and small layby on right hand side. Cavan
N77 (14) 2009- N7868590328 N7874588704
Head towards Kilmainhamwood (right turn off Navan Rd). Start at driveway of yard
on left hand side, house on right hand side. Finish at gate on right side. Meath
N77 (15) 2009- N8029286274 N8114384759
Start at rusty gate to laneway (1st entrance to Brittas House) on left hand side.
Laneway with treeline. Finish at T-junction. Meath
O04 (1) 2004- O237594 O2259 Start at Milverton farm gate. Finish at hedge lined hill, lone bungalow on right Skerries, Dublin
O04 (2) 2004- O198613 O187616
Start at start of Naul Road, 50m past no speed limit sign. Finish at small side road
with Naul 4/Balrothery 2 sign. Skerries, Dublin
O04 (3) 2004- O177643 O171657 Start at right turn sign 2 miles after kiernans sign. Finish at humpback bridge Balbriggan, Dublin
O04 (4) 2004- O153685 O1368
Start at Bellewstown road, gravel road starts on left. Finish at approach to Motorway
crossover. Gormanstown, Meath
O04 (5) 2004- O093676 O087689 Start at no speed limit sign at town limit. Finish at small road off to the right. Bellewstown, Meath
O04 (6) 2004- O024688 O009694 Start at railway bridge. Finish just before (50m) Drumman house on left Duleek, Meath
O04 (7) 2004- O004670 O0065
Start at crossroads with R150 (Navan road). Finish 100m past second entrance to
Carrickhill Stud. Balrath, Meath
O04 (8) 2004- O003614 O010598 Start at sign on right for Rathfeigh church. Finish at top of hill at L bend. Rathfeigh, Meath
O04 (9) 2004- O053613 O067619 Start at right hand corner. Finish at roadsign for right turn. Garristown, Meath
O04 (10) 2004- O104614 O1162 Start at Clonalvy National School. Finish at junction with gravel road on right Clonalvy, Naul, Meath
O04 (11) 2004- O118593 O115576 Start at white topped wall. Finish at Y junction Naul, Dublin
O04 (12) 2004- O072587 O0558 Start at end of speed limit-slane road. Finish at dip in road with layby ahead Garristown, Dublin
O04 (13) 2004- O009583 O024575 Start at wooden white painted stones. Finish at yield sign. Ratoath, Meath
O04 (14) 2004- O008542 O026540 Start at crossroads. Finish at gates on either side of the road Ratoath, Meath
O04 (15) 2004- O0351 O0349 Start at new estate entrance on right. Finish 50m before lane to right. Ratoath, Meath
R22 (1) 2004- R244265 R246279
Start at yellow house on left after junction. Finish at first house on left after pub in
strand village Limerick
R22 (2) 2004- R245310 R243325
Start at house on left with red paint. Finish at house on left with pink/white wall
(Ballypierce) Limerick
R22 (3) 2004- R255357 R253368
Start at passage on right (ashgrove). Finish at five road junction. Revisions to grid ref
in 2006 but no updates to transect description. Limerick
R22 (4) 2004- R282388 R293401
Start at pub on left after devon wood products. Finish at junction on left to
cahermoyle. revisions to grid refs in 2006 but no update of transect description. Limerick
R22 (5) 2004- R310421 R322431
Start at church on left at coolcappagh. Finish at bad bend sign after turn off to right.
Revisions to grid refs in 2006 but no update of transect description. Limerick

Car-based Bat Monitoring 2003-2011
____________________________
76
R22 (6) 2004- R331448 R341452
Start at first passage on left after sharp bend (Ardlaman). Finish at Ardgoul north-
Cottage on right. revisions to grid refs in 2006 but no update of transect description Limerick
R22 (7) 2004- R374452 R381467
Start at phone box in Cappagh. Finish at mobile home on right. Revisions to grid ref
in 2006 but no update of transect description Limerick
R22 (8) 2004- R399486 R409484
Entrance to estate on right. Finish at dormer windowed house past garden centre
(no revisions given in 2006 despite changes to grid refs) Limerick
R22 (9) 2004- R406468 R406455
Start at passage on left after junction to the right. Finish at junction at Finniterstown.
Revisions to grid refs in2006 but no update to transect description Limerick
R22 (10) 2004- R412423 R422418
Start at long passage on left. Finish at house on right after junction to the right
(Lissduff). Revisions to grid ref in 2006 but no update to transect description Limerick
R22 (11) 2004- R450415 R455401
Start at Ballyvolge cross. Finish at Liskennett-before road to left. Grid refs revised in
2006 but no updates to transect description Limerick
R22 (12) 2004- R464373 R464358
Start at Kilmore-before piggery on left. Finish at village sigh for Grenagh. Grid refs
revised in 2006 but no update of transect description Limerick
R22 (13) 2004- R489362 R496356
Start at Ballygrennan. Finish at Castletown cross. Grid refs revised in 2006 but no
updates to transect description Limerick
R22 (14) 2004- R474348 R457344
Start at Castletown cross. Finish at first road on right after cross. Grid refs revised in
2006 but no update to transect description Limerick
R22 (15) 2004- R447311 R438303
Start at Ballyruane cross. Finish at sign post for Kilmeedy. Grid refs revised in 2006
but no updates to transect description. Limerick
R28 (1) 2004- R287873 R302867
Start at junction of rhuan rd with Ennis Corofin road. Finish at white cottage with
concrete, front wall concrete piers, white washed walls. Clare
R28 (2) 2004- R334869 R335854
Start at road junction-dalcassian pub on right hand side in rhuan village. Finish at
wide stone wall entrance to quarry on right hand side. Clare
R28 (3) 2004- R345827 R357823
Start at setback for large 2 story l shaped house with valcony, circa half a mile after
bridge over river fergus. Finish at cream bungalow, first street light on left as
approaching village (telegraph pole 26) Clare
R28 (4) 2004- R385805 R396805
Start at salmon pink bungalow, cut stone pier, after windy stretch, green/white
cottage ahead. Finish at gradual bend shortly after ESB line crossing +2 new dormer
bungalows (c150m) Clare
R28 (5) 2004- R418830 R425844
Start at orange bungalow on right hand side with large front garden and concrete
post and rail fence. Finish at road sign for windy section of road on left hand side. Clare
R28 (6) 2004- R434873 R439887
Start at croos with lane to left and forest road to right, open hilltop. Finish at dip in
straightish road, land falling sharply to left, start of willow scrub or right hand side. Clare
R28 (7) 2004- R456912 R462926
Start just after ESB overhead wires, start of long stretch with wires to the right.
Finish at crest C50m beyond junction. Clare and Galway
R28 (8) 2004- R470963 R483962
Start at junction o minor road from Ballymakill with Lough Cutra-scariff road. Finish
at track on left after cross with tracks each way. Galway
R28 (9) 2004- R490991 M496004
Start at track to left up to 2 storey on bend after viewing point turn off. Finish at
Ballyturn National school gate opposite layby for lake Galway
R28 (10) 2004- M467030 M462043
Start at crossroads. Finish at setback for bungalow left, cream middle row of 3, stone
wall just before overhead line crosses road. Galway
R28 (11) 2004- M448073 M437076
Start at entrance to Lakewood factory on left. Finish at junction with road to left
after sign for Lydican Galway
R28 (12) 2004- M407085 M392092
Start at junction with road to right under overhead lines. Finish at thatched house
gable to road on left, path on right. Galway
R28 (13) 2004- M360096 M357082
Start at junction with road on right. Finish at slightly derelict thatched cottage on
right with newish orange house beside. Galway
R28 (14) 2004- M346052 M340026 Start at layby for agricultural shed on left. finish at layby for agricultual shed on right. Clare
R28 (15) 2004- M315026 M303020 Start at track on right hand side. Finish at thatched white cottage on left. Clare
R88 (1) 2004- N046057 N034066
Start left turn-start at end of junction. Finish at gates, piers and drive into farmhouse
on left. Birr, Offaly
R88 (2) 2004- N008083 N004068
Start a T-junction-start at end of junction. Finish at gates on left, white piers with
horses on top. Space to pull in. County Tipperary
R88 (3) 2004- M979078 M964082
Start at 2 storey house on left. Cream piers with eagles on top. Just before road to
right. Finish at corner, where road widens- lane on left into field. Field gate on right. Rathcabban, County Tipperary
R88 (4) 2004- M935077 M926068
Start at house on left with tall conifers in front (blue door and dashing). Just before
sign for junction (right turn) County Tipperary
R88 (5) 2004- M914038 M905027
Start at cream and pink bungalow on left. Built at an angle to the road. Elaborate bird
house out front. Finish at field gate on left, just before bungalow. Stone wall around
field gate. Gate set back slightly. Lorrha, County Tipperary
R88 (6) 2004- M889008 M876006
Start at cream piers on left with green gates- conifer lined drive into house. Cream
bunglaow on right. Finish at old two storey farmhouse on left, not painted, stop at
second gate Terryglass, County Tipperary
R88 (7) 2004- R845997 R845984
Start at bend. a drive into house on left surrounded by trees. Small wooden sign
“Kylenoe Country house”. Finish at rusty field gate on left, with ivy covered lamp
post beside it. About 100m after left turn. Ballinderry, County Tipperary
R88 (8) 2004- R863961 R848954
Start at junction. Cream bungalow on left, opposite junction, with picket fence and
brown gate. Sharp right turn. Finish at field gate on right, just around bend from new
2 storey dormer house with red roof and mock tudor effect. Ballinderry, County Tipperary
R88 (9) 2004- R849929 R866923
Start at field gate on left, immediately after speedlimit sign and before house on
right. Space to pull in. Finish at brown field gate on right. Wide gate consisting of two
gates overlapping. Just before big house with treelined drive on left. Newchapel, County Tipperary
R88 (10) 2004- R873907 R872983
Start at old farm buildings on left, just after lane- ramshackle looking, normally old
white tractor parked outside. Big slatted shed on right. Finish at lane on left with
grass in the middle, house beside lane with a wooden fence. County Tipperary
R88 (11) 2004- R858869 R864855
Start at grey cottage on left, with lots of extensions and sheds, silver gates and two
small trees in front. County Tipperary
R88 (12) 2004- R883847 R889834
Start at poplars on left, just before house, rusty field gate on right. Finish at large
dormer house on right, with large shed and red brick and white paint, just after
junction. Stop at big gates County Tipperary

Car-based Bat Monitoring 2003-2011
____________________________
77
R88 (13) 2004- R914827 R927824
Start about 30m from junction. Finish at corner, house on right, white and brick
bungalow set at an angle to the road with a garden seat beside the front gate. County Tipperary
R88 (14) 2004- R957824 R969818
Start at brown field gate on left. Silver and black patchy gate on right. At a corner.
Stone walls. Large estate house set back on right. Finish at high concrete brick wall
on left, old hidden gate on right. Just before hand bend. Well shaded by trees. County Offaly
R88 (15) 2004- R994834 R989840
Start at big entrance gates on left to estate house, wooded drive. Finish at lane on
left with red gate and sign for Roe Cottage on it. Tall trees on left. Telephone pole on
right opposite lane. County Offaly
S12 (1) 2004- S3936549954 NULL
Start at STOP sign at junction with R695 & Graigue Cross Roads (with small
corrugated buildings), starting in direction of Ballingarry. End at small bungalow on
RHS. Co. Kilkenny
S12 (2) 2004- S3521649021 NULL
Start at road junction at Jessfield (no road sign). End just after driveway to house on
LHS with pebbledash gateposts. Co. Tipperary
S12 (3) 2004- S3086448520 NULL
Start just beyond Ballingarry village, at entrance to O'Suillan Park (GAA) and opposite
garage. End on approaching bend to bridge. Co. Tipperary
S12 (4) 2004- S2684149223 NULL
Start at two story pebbledash house on left hand side, balls on piers, eagles on
gateposts. Just after bungalow on right hand side and lane after bungalow. End after
track with gate up to left on left hand side. Co. Tipperary
S12 (5) 2004- S2248248585 NULL
Take a right outside Ballynunty village on road to Cashel. Transect starts opposite
blue gate on right hand side for Ballynunty Sewage Works. End just after junction
and lane up to house on left hand side. Co. Tipperary
S12 (6) 2004- S1781546755 NULL Start just after sign for right turn, at entrance to small quarry / lane on left hand side. Co. Tipperary
S12 (7) 2004- S1306544297 NULL
Start at avenue on left hand side to Edwardian House with veranda, black and white
gateposts and railings / laurel hedge. End at sign for school (on road), beside
bungalow on right hand side. Co. Tipperary
S12 (8) 2004- S1065739913 NULL
Start at telegraph pole oppisite yield sign at T junction beside small two storey house
on left hand side with metal gate and pebbledash stone wall. End at 1st slow sign,
metal gateway on right hand side. Co. Tipperary
S12 (9) 2004- S1258137199 NULL
Start at gated land on left hand side with large beech trees. Double metal gate
opposite on right hand side. After lane on left hand side with wooden gates. End at
new 2 storey house on left hand side, slate, steep pitched roof, dormer windows. Co. Tipperary
S12 (10) 2004- S1366932201 NULL
Start at RH junction sign for Tipperary Bridge Old IRA memorial. End at metal gate on
right hand side with stone pier. Co. Tipperary
S12 (11) 2004- S1406529038 NULL
Start at T junction turning in direction of Poulnamucky. End at sharp bend - sign,
house and lane to left hand side. Co. Tipperary
S12 (12) 2004- S1369226197 NULL
Take left at sign for Lavally. Transect starts at bungalow on LHS with slate roof,
pebbledash and small swirley gates and hedge. End just after 1st turn right, at new
house on left hand side, just before gateway. Co. Tipperary
S12 (13) 2004- S1764226017 NULL
Start at house after junction, pebbledash wall, brown capping, wooden fence and
metal gate with wheels on it. End after turn onto main road, just before right hand
turn for Orchardstown with thatched cottage at junction. Co. Tipperary
S12 (14) 2004- S2112827563 NULL
Start at telegraph pole at end of wall after GAA pitch on left hand side. End at neo-
tudor bungalow on left hand side, big wooden gates and 1 house on right hand side. Co. Tipperary
S12 (15) 2004- S2394325933 NULL
Start at 1st bungalow on left hand side, small pillars on front fence and capped piers.
Just after 2nd farmyard with grain silo. End immediately after farm buildings and
farmhouse with dashed front on left hand side. (Follow signs for Ballypatrick to get
to next transect). Co. Tipperary
S15 (1) 2005- S393647 S386635 Start at sharp left hand bend. Two gates on right. Finish at right hand bend. County Kilkenny
S15 (2) 2005- S354628 S344620
Start at left hand bend on hill after holy well and pig farm. White cottage on right.
Turn right during transect. Finish before crossroads. County Kilkenny
S15 (3) 2005- S354600 S358592 Start at Killahy crossroads, at church. Turn right during transect. County Kilkenny
S15 (4) 2005- S345582 S333577 Start 2.7 miles from end of last transect. Start at T junction- Coldharbour. County Kilkenny
S15 (5) 2005- S350552 S336545 Start at crossroads, downhill into Tipperary. Finish after U- bend. County Kilkenny
S15 (6) 2005- S306532 S310545
Start facing north at crossroads. Sign for Grange, gable and fencing. Finish at sharp
bend. County Tipperary
S15 (7) 2005- S286571 S286553
Start left at Grange, round Kilcooley. Left at crossroads onto main road. Start at
crossroads. turn right during transects. County Tipperary
S15 (8) 2005- S280531 S285513
Start left for Coalbrook. Onto right for Emerald resources. Start at Junction. Go
straight on. County Tipperary
S15 (9) 2005- S253505 S247514
Start at sign left for Ballinunty. Grey house-gable on road. Start just before staggered
junction. Finish just before sharp turn on left. County Tipperary
S15 (10) 2005- S220526 S207532 Start at Cross Bog. Staggered crossroads. Finish at lane on right. County Tipperary
S15 (11) 2005- S189552 S187567 right turn at Littleton. Next left. Start at Lackin Cross. County Tipperary
S15 (12) 2005- S190612 S177620
Turn left at TwoMileBorris. Centenary Co-op, turn left over bridge. Start there. Finish
at crossroads. County Tipperary
S15 (13) 2005- S153622 S155640 Past school. Right turn at crossroads. Start at house on right with roses . County Tipperary
S15 (14) 2005- S174669 S182684 Start at crossroads (left hand side is just a lane). finish at lane to right. County Tipperary
S15 (15) 2005- S191711 S205718 Turn left in Templetouhy. Start after turning right at ruin. (Rathdowney 7 1/2). County Tipperary
S78 (1) 2003- S749804 S744815
Begin at cross roads, opposite sign post at right hand side. Finish at brow of hill-
where on right hand side, hedgerow begins after short stretch of post and wire
fence. County Kildare
S78 (2) 2003- S749839 S737846
Start immediately after telegraph pole on right hand side and before entrance to
house on right-opposite large sycamore tree. Finish on bend, immediately after
cattle grid at entrance to left, orange and black directional sign ahead County Kildare
S78 (3) 2003- S734876 S721879
Start immediately before bridge, with large willow tree to the right. Finish on bend
after small bridge, just before telephone wire cross over road and opposite end of
taller hedgerow (hawthorn) to the left. County Kildare

Car-based Bat Monitoring 2003-2011
____________________________
78
S78 (4) 2003- S716903 S729910
Start at row of houses, opposite street light on left- white concrete block wall, 2.5
blocks high before house. Finish on gradual bend, tall beech trees to right, before
telegraph pole on left, circa 50m from wide entrance on left. County Kildare
S78 (5) 2003- S736927 S737939
Start on straight stretch of road, after lone conifer growing inside hedge on left and
opposite next telegraph pole on right. Finish on straight stretch of road between two
telegraph poles on either side of road, before place to pull car in off road to left-
opposite forest ride. County Kildare
S78 (6) 2003- S734963 S741970
Start just after start of long straightwall to left and opposite telegraph pole on right
and before telegraph pole on left. Finish immediately before telegraph ple to left and
between two tall ash trees on left. County Kildare
S78 (7) 2003- S774966 S785960
Start at yield right of way sign at T Junction. Finish after entrance to house on left,
tall sycamore to left and before telephone pole on left (big gate on right c50m
ahead) County Kildare
S78 (8) 2003- S808977 S823979
Start after turning off main road-opposite small house sign- Moyle Abbey to left.
Finish after bend to lft, between two house entrances to left road sign ahead. County Kildare
S78 (9) 2003- S847978 S858968
Start at far side of entrance to Rathsallagh demense. finish after wide entrance on
left and before entrance to right-half way between both- light at right entrance
visible. County Wicklow
S78 (10) 2003- S879953 S886967
Start at entrance to house on left- opposite milk stand on right. Finish after two
telegraph poles at opposite side of road after wall to house-wall white with darker
top on right hand side County Wicklow
S78 (11) 2003- S896996 S909997
Start halfway between entrance to house on left then on after telegraph pole on left.
Finish c. 30m before old (dead) tree on left with prominent bark-two stone piers on
left. County Wicklow
S78 (12) 2003- S930977 S928964
Start just after Garda station. Finish immediately after turn to left and before turn to
right. County Wicklow
S78 (13) 2003- S922940 S937938 Start at junction-dangerous junction sign. Finish immediately after bridge County Wicklow
S78 (14) 2003- S960924 S974918
Start after turn to left- immediately after place to pull car over to left and before
next telegraph pole on left. Finish after entrance to new house on right and before
turn- opposite telegraph pole. County Wicklow
S78 (15) 2003- S991898 S994885
Start at end of forestry on left- opposite small willow bush. Finish at end of forestry
to left- old forest stand on right- immediately before wide entrance to forestry on
left. County Wicklow
T05 (1) 2003- T018788 T030790
Start at red gate into field just after junction heading east. Pasture and stone wall
covered in vegetation on both sides until 0.5 miles- several houses on left until 0.8
miles. Finish at pair of field gates opposite each other just past farm yard (which is on
left) Wicklow
T05 (2) 2003- T053772 T060764
Start at carrigroe at bend in road with gate to fork on left, broadleaved trees on
either side to 3.3 miles, stone bridge at 3.5 miles, houses on left at 3.8-3.9 miles,
then trees on both sides. Finish where two house driveways on right hand side-stop
in between them. Wicklow
T05 (3) 2003- T053737 T054727
Start at junction where house does not face road. Church gate at 6.5 miles. Some
arable uncut hedges and houses. Finish at house on left beside small lane to left with
concrete walls. Wicklow
T05 (4) 2003- T077717 T088706
Start at lane on left entrance just before house on right and roads bend to left.
Hedgerows with mature trees and pasture. Finish 10-15m past road on left. Wicklow, Wexford
T05 (5) 2003- T111687 T122676
Start 20m past road on left at gate on left into building site. Trees overhang road,
conifer plantation on left, stone bridge over river, pasture. Finish at house with well
trimmed cypress hedge-centre house in row of three on left. Wexford
T05 (6) 2003- T153661 T138654
Start at corner of memorial garden at crossroads facing southeast, trees and
hedgerows sheltered, more open hedges/pasture/arable from 10.3 miles. Finish at
side of gravelled entrance to farmyard on right after row of trees on both sides. Wexford
T05 (7) 2003- T112643 T096644
Start at entrance to church, St johns Hollyfort, treelined until 18.8 miles, mixed
hedgerows with trees all along, pasture. Finish at farm entrance to left which is
almost directly opposite a similar one on right. Wexford
T05 (8) 2003- T076664 T063671
Start at gate on left 20m after right turn, high elevation, fairly windswept, low
hedges, banks arable, small bit of clearfell on left. Finish at right turn at junction. Wexford
T05 (9) 2003- T030663 T015659
Start at right turn, just before no dumping sign, forestry plantation on right. Finish
3m after large stand alone conifer on left 100m before junction. Wicklow
T05 (10) 2003- T016630 T016616
Start after turning right on main st Carnew, start transect at large metal gates on left-
opposite Carnew grain. Stonewalls, houses then hedges etc. Finish after right turn,
just past yellow/strange house on right, stop at small layby on left. Wicklow
T05 (11) 2003- T029590 T044596
Start just past carpark wall on left, opposite church. Finish opposite white house with
gates and pillars, trees, hedgerows, houses. Wexford
T05 (12) 2003- T072598 T081589
Start gate into house on left called Farlands, with low stone wall. Finish at T junction,
low hedges. Wexford
T05 (13) 2003- T061572 T049559
Start at Carriglegan, directly opposite entrance lane on right- also with field gate and
sycamore tree. Finish at double field gate, just after bend before stone and brick
house entrance, arable. Wexford
T05 (14) 2003- T017528 T017514 Start at Kilthomas crossroad. Finish opposite bungalow with wooden fence. Wexford
T05 (15) 2003- T032495 T045503
Start at entrance to house called riverside. Finish at Ballynakill, after left turn
opposite wooden fenced entrance to small house. Wexford
V93 (1) 2003- W194488 W180479 Start at Clashnacrona wood sign, mixed woodland. Finish at black yellow post, lake Cork
V93 (2) 2003- W150469 W136465
Start at crossroad sign, telephone poles, improved grassland. Finish at metal frame
across from bungalow, Improved grassland. Cork
V93 (3) 2003- W136449 W147438
Start at telegraph pole, blue gate, improved grassland. Finish at telegraph pole,
house with stone facade, improved grassland Cork
V93 (4) 2003- W169425 W184422
Start at blue farmhouse and gate, treelines (ash) improved grassland. Finish at
telegraph pole, sitka spruce wood, improved grassland. Cork
V93 (5) 2003- W167403 W165388
Start at farmyard entrance, red walls, improved grassland. Finish at hawthorn tree on
left beyond salmon pink entrance with large metal gates, improved grassland. Cork
V93 (6) 2003- W146366 W137354
Start at pillar wall, group of bungalows, scrub. Finish at crossroad sign on right hand
side of road opposite bungalow, scrub, improved grassland. Cork

Car-based Bat Monitoring 2003-2011
____________________________
79
V93 (7) 2003- W119337 W106338
Start at bridge house pub, Skibereen, urban area. Finish at sign, Abbeystowrey
graveyard, easturine river. Cork
V93 (8) 2003- W077335 W062329
Start at gate (new court) black/yellow sign, tall tree lines. Finish directly opposite St
Matthews church of Ireland, Aughadown, Improved grassland Cork
V93 (9) 2003- W039347 W025347
Start 100m beyond coolbawn lodge b&b sign, passed overhead powerlines,
improved grassland, heath. Finish at willow scrub and heath on right. Cork
V93 (10) 2003- V998352 V984354
Start at wind stunted oak 200m off road on left, telegraph pole on right with single
wire. Finish at quarry gates beyond childrens crossing sign, tall Ash, gorse on right. Cork
V93 (11) 2003- V958369 V945374
Start at crossroads (durrus 8, Bantry 14.5, Ballydehob 2) Heathland, improved
grassland. Finish at willow tree on left, wet grassland on both sides of ditch. Cork
V93 (12) 2003- V917374 V904382
Start at tall ashes on left, cottage on right. with sycamore and semi-improved
grassland. Cork
V93 (13) 2003- V926398 V939407
Start at Dunbeacon on stone wall (house) fuschia hedge on left, grassland and birch
woodland. Finish at stone house on left and cottage on right, tall hedgerow and
amenity grassland. Cork
V93 (14) 2003- V954433 V969438
Start at white bungalow and garage off the road on right, improved grassland. Finish
opposite metal gate, lane to farm on left, improved grassland. Cork
V93 (15) 2003- V984460 V978473
Start at crossroad onto bantry road, yield sign, amenity grassland, improved
grassland. Finish at layby on left 100m before left turn to sheeps head peninsula,
scrub on right. Cork
V96 (1) 2005- W002898 NULL
Start opposite Lissivigeen school on N22, N72 junction. Finish at 100kmph sign
opposite sign for river vally farmhouse B+B. Kerry
V96 (2) 2005- W040876 NULL
Start at N22 sign after Brewterheld exit from N22. Finish at junction for Kilaha
church. Kerry
V96 (3) 2005- W075844 NULL
Start at field gate opposite bungalow with blue gate. Finish opposite Glen
farmhouse. Kerry
V96 (4) 2005- W112826 NULL Start after Clydagh bridge on N22. Finish just after Clomceen road junction on N22. Kerry
V96 (5) 2005- W142801 W152794 Start atan gaeltacht sign on N22 SE bound. Finish at 100kph sign on left handside. Cork
V96 (6) 2005- W183788 NULL
Start 30m in front of NDP/EU sign and junction. Finish at do not pass signs NW of
Ballyvourney Cork
V96 (7) 2005- W177763 W163757 Start at junction for Tir na Meala. Finish at coolea crossroads. Cork
V96 (8) 2005- W139774 W140760 Start at Coolea junction. Finish at Bardinch Bridge. Cork
V96 (9) 2005- W130738 NULL
Start at forestry layby on left hand side. Finish at wire fence on right handside not
before road to gouganbarra Cork
V96 (10) 2005- W089734 W076740
Start at Sillardane lodge on left hand side. Finish at pull in opposite taller
conifersafter Inchee bridge. Kerry
V96 (11) 2005- W051754 W042745 Start at bad bend in main road. Finish opposite gates into forestry. Kerry
V96 (12) 2005- W015735 V999733
Start at 50kph sign at Kilgarvan. Finish at conifer avenue and stone wall entrance just
after GAA sign on right hand side. Kerry
V96 (13) 2005- V968728 V955724
Start at cahir garden centre after cement mixers sign, house with blue and white
garage. Finish at 2 houses on left hand side. Kerry
V96 (14) 2005- V926716 V912707 Start at Neidin sign and heritage trail on rock. Finish at junction into town Kerry
V96 (15) 2005- V902804 NULL
Start opposite Lough on bridge on N71 before ladies view. Finish at Derrycunnihy
church Kerry
V99 (1) 2006- W0064389816 W0217589654 Start at Darby O'Gill's Hotel. End at danger sign on left, Quarry exit. Co. Kerry
V99 (2) 2006- W0609890220 W0764890605
Road widens, large farm yard on right with white wall. End approximately 100m
before before Barraduff. Birch trees on right. Co. Kerry
V99 (3) 2006- W1049291274 W1206991703 Start at Bridge (train). End at house on left with wide entrance. Co. Kerry
V99 (4) 2006- W1478792932 W1624493153
Start at pass road for Greevguille. Entrance to Monastic house on right. End at
entrance to Rathmore. Junction on right. Co. Kerry
V99 (5) 2006- W1731295862 W1720197406
Start at junction on right. Farmhouse on right. End at Knocknagree Community
Centre on left. Co. Cork
V99 (6) 2006- R1557901008 R1595202481 Start crossroads at Munster Joinery. End at right hand bend, pencil quarry on left. Co. Cork
V99 (7) 2006- R1640005100 R1755706079
Start at railing and monument to Billy Murphy on left. Old cottage on right. End -
junction to left (go left). Newmarket - Ballydesmond sign. Co. Cork
V99 (8) 2006- R1701809907 R1663811076
Start at crossroads, sign for Taur 7. Ballydesmond 8 and Abbeyfeale 21. End at house
on hill at 2 o\\'clock. Co. Cork
V99 (9) 2006- R1693214456 R1727915767 Start at church and school on right. House on left. End - tree lined left and right. Co. Cork
V99 (10) 2006- R1412818391 R1262518508
Start at football field on left, sign for Brosna. End at white farmhouse and yard on
left. Co. Kerry
V99 (11) 2006- R0890919424 R0834320080
Start details - T-junction, take right community alert sign. End details - lay-by on left.
Red house and shed on right - velux window. Co. Kerry
V99 (12) 2006- R0595920519 R0447420237
Start details: left at Knocknagabhal cross for Tralee. End details: farmyard - green
hed, pink house after bad bends. Co. Kerry
V99 (13) 2006- R0004519451 Q9851419153
Start past bad bends, house on left with poles and barbed wire fence - Fenton Lyons.
End at lay-by on left, conifers on right. Co. Kerry
V99 (14) 2006- Q9702816633 Q9734515170 Start at bridge - junction on right. End after cross roads. Co. Kerry
V99 (15) 2006- Q9897712228 Q9950210840 Start at Mullaghmarky Bridge. End at 50km/hr sign entering Castleisland. Co. Kerry
W56 (1) 2005- W7814861380 W7684061298
Start at green and red railway signal on white pole, right hand side of the road. Finish
at sign on left for road narrowing, life buoy on right. Cork
W56 (2) 2005- W7398262175 W7257062125 Start at gate to house, Brookfield on left. Finish at gate to house on left. Cork
W56 (3) 2005- W6974261868 W6836561344
Start at stone gateway on left, forestry sign, trackway on right surrounded by hazel.
Finish at grey bungalow-maryville-on left Cork

Car-based Bat Monitoring 2003-2011
____________________________
80
W56 (4) 2005- W6618661559 W6595262741
Start at tall hedges on left and willow on right. Finish at piers and gateway on left,
80kph sign on road. Cork
W56 (5) 2005- W6285762305 W6135261747
Start after flyover, signs to Cork, halfway,crossroad. Finish at layby on left,
horsechestnut tree opposite cream cottage. Cork
W56 (6) 2005- W5853561113 W5688661278
Start at layby on right, stone wall on left. Finish at bridge on bend, black and yellow
stripes. Cork
W56 (7) 2005- W5390560804 W5209061187
Start at house with stone porch on left. Finish opposite graveyard, derelict farm
buildings on right. Cork
W56 (8) 2005- W5265363954 W5221365493 Start at two silver gates on left hand side of road. Finish at croosroads yield sign. Cork
W56 (9) 2005- W5086167396 W5120068841
Start outside cream bungalow on left. Finish at white dormer on right with low stone
walls. Cork
W56 (10) 2005- W5020170701 W5154271172
Start at crossroads, black and white house walls opposite. Finish at treelines on both
sides of the road. Cork
W56 (11) 2005- W5404171385 W5562671786
Start opposite white bungalow with low white walls. finish at track to bungalow on
right tree lined road. Cork
W56 (12) 2005- W5710571286 W5599572063
Start at Crossroads outside Inniscarra bar. Finish at tree lined avenue gateway to
house on left. Cork
W56 (13) 2005- W5576274531 W5463575580
start outside two semi detached houses, opposite cream coloured wall. Finish at
slippery road sign on right. Cork
W56 (14) 2005- W5499278092 W5565079580
Start opposite bungalow outside tractor storage yard after church. Finish at iron
roofed building on right bend. Cork
W56 (15) 2005- W5610482525 W5613784083
Start outside cream coloured cottage.Next to old cottage. Finish outside white
bungalow on left just after crossroads. Cork
X49 (1) 2009- S465197 S470183 Start on bridge, bank of Fiddown island. Finish at new house and farm gate on right. Waterford
X49 (2) 2009- S467147 S453151
Start at 1st gate on right hand side 10m beyond junction. Finish at end of wall on left,
road rises. Waterford
X49 (3) 2009- S412131 S425124 Start from junction. Finish at quarry on right, 100m beyond stream/valley bottom. Waterford
X49 (4) 2009- S454104 S449085 Start at junction. Finish at back of pub just before main road. Waterford
X49 (5) 2009- S414067 S429056 Start at gate 20m after turn off main road. Finish at estate entrance. Waterford
X49 (6) 2009- S440030 S442015
Start at junction. Finish at gate into field on right just after wood on left.
Waterford
X49 (7) 2009- X466990 S464005 Start at junction at cove. Finish half way round bend, just past cottages. Waterford
X49 (8) 2009- S491027 S501017 Start beside junction with farm track. Finish at main road. Waterford
X49 (9) 2009- S537021 S545032
Start at junction. Finish at at junction.
Waterford
X49 (10) 2009- S562060 S571072 Start at junction. Finish at start of leylandii hedge on right. Waterford
X49 (11) 2009- S606082 S609067 Start at junction. Finish at estate entrance on left. Waterford
X49 (12) 2009- S636025 S642013 Start at Murphys bar. Finish at 2nd junction in 50m Waterford
X49 (13) 2009- S688007 S675097 Start at junction. Finish at layby on bend on left hand side opposite bungalows Waterford
X49 (14) 2009- S663041 S669056 Start at beginning of wood. Finish at junction. Waterford
X49 (15) 2009- S656078 S644086 Start at junction. Finish at junction. Waterford