Car accident in hawassa city
38
A senior research project on the causes of car accident a case study on drivers in Hawassa town By: - ELIAS LYKUNE stat 0682/01 Advisor: Ato alehegn worku SUBMITED TO: HAWASSA UNIVERSITY DEPARTMENT OF: Mathematical PHYSICAL SCIENCE PROGRAM: STATISTICS
Transcript of Car accident in hawassa city
A senior research project on the causes of car accident
a case study on drivers in Hawassa town
By: - ELIAS LYKUNE stat 0682/01
Advisor: Ato alehegn worku
SUBMITED TO: HAWASSA UNIVERSITY
DEPARTMENT OF: Mathematical PHYSICAL SCIENCE
PROGRAM: STATISTICS
Table of content
Content Page
Acknowledgment………………………………………………………………..……………………….……I Abstract……………………………….………………....………………………………………..…………..… II
Chapter one
Introduction background of the study…………….………………..……....…….….. 1
Statement of the problem………………………….……………………………..……………………..2
Significance of the study……………………….…….……………...……………………….…………..3
Objective ………………………………………….….…………..…………………..……………………….3
Chapter two
Literature review……………………………….………………………..………….………….………… 5
Chapter three
Methodology ………………………………..……………………….………………..…..…………………7
3.1 Method of data collection…………………………………....…..………...……….….…….…... 8
3.2 Method of statistical analysis……………………………………..…...…………..………..…....8
CHAPTER FOUR
Result and discussion …………………….…….………………………....…….……………………..12
CHAPTER FIVE
Conclusion &Recommendation ……………………………………..….……….….….…………18
Limitation of the study..…………………………………………………..…..…..…………………..19
Reference………………………….………………………...………………...……….…..…………….….20
Appendix …………………………………………………………………………………….………………
Questioners……………………………………………….……….……………………………………… IV

Acknowledgement
First, I would like to thank almighty Allah who is the most gracious and the most merciful, for his inexpressible gifts.
My deepest appreciation goes to my advisor Ato alehegn worku for his devotion in reading and giving necessary correction and invaluable advice.
I am also grateful and deeply indebted to my family for their financial and moral support.
My hurtfully gratitude also extends to my friends for their assistance in preparing this paper and throughout my stay in the university-which are not forgotten in my life.
I

Abstract
This paper discusses in the identifying the causes of car accident from the drivers point of view in Hawassa town. For conducting this study, both primary & secondary data were used. Secondary data includes the data received from the Hawassa city road and traffic biro. Where as primary data are questionnaire distributed to drivers in Hawassa town .To distribute the questioner simple random sampling method was used.
After data is analyzed using logistic regriation and chi square test of independence and interpreted study forwards some recommendations which are useful for the drivers and citizens in Hawassa town to protect themselves and their families from car accidents some of the finding of this paper is the effect of sex of the driver, speed of drivers while driving and lessening to the radio and music while driving on the incident of car accident.
II
Chapter one
Introduction
1.1 Background
Have you ever thought of dyeing? They say there is a reason way we came to this earth whatever the reason is the fact is that we will all die we don’t know when or where we will die but our earthly life might end with different causes and reasons one of the causes might be car accident. Every year More than 1.2 million people die due to car accident .It occurs as a result of several factors associated with the traffic system, namely: road users, road environment and vehicles. In higher-income countries car accident are already among the top ten leading causes of death in less developed countries car accidents were the most significant causes of lose years of healthy life .statistics shows that in one hospital bed room from ten ,one is occupied by car accident victim. According to the WHO approximately 16,000 people die every day worldwide from all types’ of injuries. Death from car injuries is a very significant part of the problem accounting for 25% of all deaths from all deaths from injury.
Developing countries have nearly four times the number of deaths from the developed world. In Ethiopia in 2004/5 about 93% of all accidents involved human factors, 5% accounted for vehicle factor and 2% were associated with road environment according to the federal police report. From this report, we can understand that most of car accidents in our country are caused by human factors so in order to minimize accidents we should focus on trying to avoid the human factors that leads to accidents .Road accident in Ethiopia is one the worst accident records in the world as expressed per 10,000 vehicles. SNNPR(southern nation nationality and peoples regain ) found in southern Ethiopia such problems are also common in SNNPR of Ethiopia. This study will be concentrated to observe the major causes of car accident from the driver’s perspective in Hawassa town (found in SNNPR).

1.2 statement of the problem
Car accident is the ninth biggest killer in the world and is predicted to become the third by 2020. Ethiopia has some of the most dangerous roads in the world and unqualified drivers with death rates one hundred and twenty times higher than in the UK and almost four times worst than neighboring Kenya.
A car accident is defined as any vehicle accident on a public highway. It includes collisions between vehicles and animals, vehicle and pedestrian or vehicle and fixed obstacles. Single vehicle users are included .In Ethiopia about 18,000 people died while above 7000 were injured in the year 2008. More over the death rate is 136 per 10,000 vehicles and Ethiopia is losing over 400 million birr yearly as a result of car accident. Such problems are common in SNNPR of Ethiopia .therefore it needs further study to identify the major factors that affect car accident in the area .This study will be conducted to know the causes or factors that lead drivers to cause car accidents.
Some of the variables that are thought to affect drivers to cause accident are the following:-
Age of the driver
Sex of the driver
Driving experience
Seat belt usage
Usage of toxic substance like chat, alcohol …….
Using cell phone while driving
Listening to music or radio while driving
The time length of driving
Educational level of the driver etc…….
1.3 significance of the study
This research contributes of the nationwide development of statistical practice through the identification of deviating and making recommendation to help drivers in Hawassa town to avoid the incidents of car accidents in the city.
The main purpose of the study:-
The finding will be obtained from the study helpful to gain information and knowledge about the causes of car accident from the driver’s perspective in Hawassa town.
It determines the factors and there association in causing car accidents.
Finally, it also helps us to carry out further research work as a reference.
Objective
1.4.1 General objectives
The main objective of this study is to identify the causes of car accident from the driver’s perspective in Hawassa town.
1.4.2 Specific objectives
To determine the effect of using seat belt while driving.
To determine the effect of speeding while driving.
To test the association or relationship between ages, sex, educational level of drivers
and the incident of car accident.
To test the association or relationship between using toxic substance like chat,
alcohol and the incident of car accident.
To test the association between using cell phone and listening to music while
driving and the incident of car accident.
To forward possible recommendation on how to be more protective in order to
avoid car accident and the disaster that go along with it.
Chapter 2
Literature review
Skills and ability of drivers to hear, see, evaluate and react vary between people and
in an individual under different conditions such as the influence of alcohol, fatigue and time
of day .Drivers decision and action depend on practicality on information received through
the senses. – Visual (sight)
_auditory (hearing)
_other senses: smell, movement, etc (traffic operation HU department of civil
engineering2011)
Automobile accidents give rise to the majority of personal injury clams in the U.S. This
is not surprised given that every 10 seconds some one in US is involved in car accident.
According to the national high, way traffic safety Administration (NHTSA)
Reckless driving a driver may be liable for as accident due to his or her intentional or
reckless conduct. A driver who is reckless is one who drives unsafely, with clear disregard
as a progression of unlawful driving actions such as
Speeding exceeding the posted limit or driving too test for conditions.
Improper passing – failing to sexual interest
Drunk driving: - every 30 minutes, some on in us dies in an alcohol related cost
year a lone one million people were injured in alcohol related traffic crashes.
Uninsured drivers are ten times more likely to drink & drive and 3 times more alone to be
convicted of driving without care & attention. They also cause one accident every six
months. My hands on the payment and wiggled out the small bole I noticed them in the
pickup truck behind the van had stopped he had called the police on his care phone.
My perspective on life andantes will dramatically choose due to this fretting experience of
car accident.
(By jack smith Car accident: a practical Recovery manual for drivers, passengers, and the
people in their lives by jack smith1999)
Chapter 3
Methodology
3.1 Method of data collection.
The data used in this study was collected by using data primary and secondary data
collection method. The primary data is collected by using the well-designed questionnaire
and by using simple random sampling method. The data collected by using the secondary
data collection method is the total number of drivers in Hawassa town.
3.1.1 Study design, area and time
The study is designed as across- sectional descriptive and inferential study with
quantitative data count. The typical local area that study conducted is Hawassa town found
in sidama zone, in SNNPRS/ Ethiopia on the causes of car accident from the driver’s
perspective in the city. The duration of the study, take about from February- June 2011.
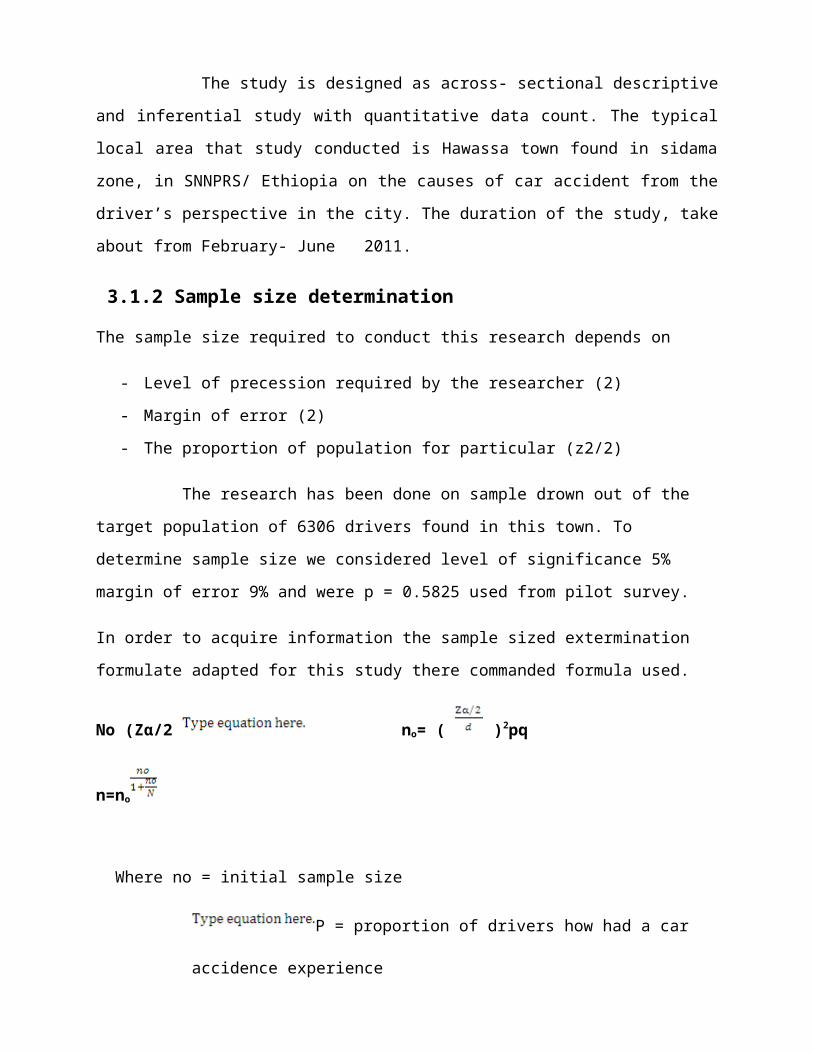
3.1.2 Sample size determination
The sample size required to conduct this research depends on
- Level of precession required by the researcher (2)
- Margin of error (2)
- The proportion of population for particular (z2/2)
The research has been done on sample drown out of the target population of 6306 drivers
found in this town. To determine sample size we considered level of significance 5% margin of
error 9% and were p = 0.5825 used from pilot survey.
In order to acquire information the sample sized extermination formulate adapted for this study
there commanded formula used.
No (Zα/2 no= ( )2pq n=no
Where no = initial sample size
P = proportion of drivers how had a car accidence experience
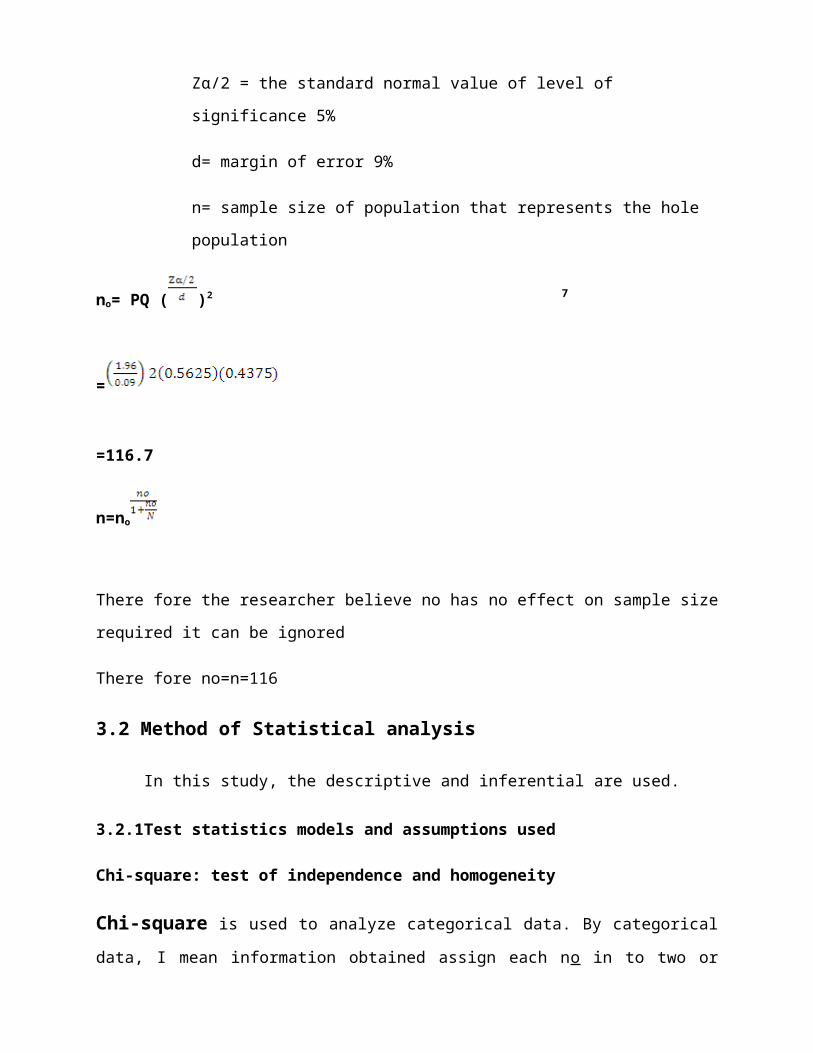
Zα/2 = the standard normal value of level of significance 5%
d= margin of error 9%
n= sample size of population that represents the hole population
no= PQ ( )2 7
=
=116.7
n=no
There fore the researcher believe no has no effect on sample size required it can be ignored
There fore no=n=116
3.2 Method of Statistical analysis
In this study, the descriptive and inferential are used.
3.2.1Test statistics models and assumptions used
Chi-square: test of independence and homogeneity
Chi-square is used to analyze categorical data. By categorical data, I mean information
obtained assign each no in to two or more categories subject being classified for one violable
depends up on the classification of other variables. Chi square lets & association is applies for
testing wheat hen there is significant deference in college & health science and called
agriculture & HU on selected universities or no I used chi state test of study whether there is
association b/n referral student and agricultural.
Assumption
The observation must be independent of each other.
The sample must be randomly selected from the pops.
The population must be normally distributed to the violable under study.
The hypothesis
H0: two factors are independent of or not the same each other. Vs
H1: Two factors are dependant or same, Homogenous, not Ho
The formula used is
Where
Eij = the expected frequency corresponding to (i, j) Th cell observe frequency oij.
Under the null hypothesis, Ho, the expected frequency,
E = ith row total Xjth column total = RXCj
Sample size n
The static’s X2 has (r-1) (C-1) Degree of freedom (DF) and (level of significance)
Decision rule
If 2 cal > X2 tabα, (DF) or if P value less than we reject H0 and conclude that the two
factor variable are not independent, rather dependant.
Logistic regression
Logistic regression is used when the regressed, the dependent variable or the response
variable is qualitative in nature or categorical. Qualitative response variable are either binary
(Dichotomous variable) or multiple category
Binomial or binately logistic regression is the form of regression, which is used when the
dependent variable is dichotomous and the independent variables are of any type.
Multinomial regression can handle the case of dependent variables with more than two classes.
Logistic regression can be used to predict a dependent variable on the basis of continuous and
(categorical independent variables) and to determined the percent of variable in the dependent
variable explained by the independents, to rank the relative importance of independent variables,
to assess the interaction effect and to understand the impact of covariate control variables.
Logistic regression models are special cases of generalized linear models (GLMS) for binary
data
The regression model when the dependent variable is quantitative our aim (objective) is to
estimate the expected or (mean) value given the values of the regresses. E (yi/xli… Xki) but in
logistic regression our objective is to find the probability of some thing happening (probability of
success)
Logistic regression is used in various areas of social sciences and medical research.
Model:
= exp (B0 + B1 X1 + … + Bk Xk)
Where p – the probability of success (probability of something happened)
1-p – the probability of failure.
Bo – is constant term
Xi – independent variables
Bi – coefficients of independent variables e = 2.718 10
The ratio of probability, success to probability of failure was ( ) is odd ratio of
success.
Exp (Bj) where j = 1, 2… K is a factor by which the odds of occurrence of success change
by a unit increase in the jth independent variables.
If L = Ln ( ) is positive, it means that the value of the repressors (s) increases, the
odds that the regress and equals 1 (meaning some event of interest happens) increases if
Ln is negative, the odds that the regress and equals 1 decrease as the value of x increases.
Assumptions of logistic regression
1. Logistic regression does not assume a linear relation ship between the dependent variable
and independent variable.
2. The dependent variable need not be normally distributed (but does assume) its
distribution is with in the range of the exponential family such as normal, poison,
binomial and gamma.
3. The dependent variables need not be homoscedastic for each level of independent
variables that is three is no homogeneity of variance assumption.
4. Normally distributed errors terms are not assumed.
5. Logistic regression does not require that the independent variables be continuous.
6. Logistic regressions do not require that the independent variables be UN bounded. However,
other assumptions still apply meaning full coding, inclusion of all relevant variables and
exclusion of all irrelevant variables.
Chapter 4
Result and discussion
4.1summary statistics
Table 4.1.1 Sex of drivers
Frequency Percent Valid PercentCumulative
PercentValid female 20 17.4 17.4 17.4
male 95 82.6 82.6 100.0
Total 115 100.0 100.0
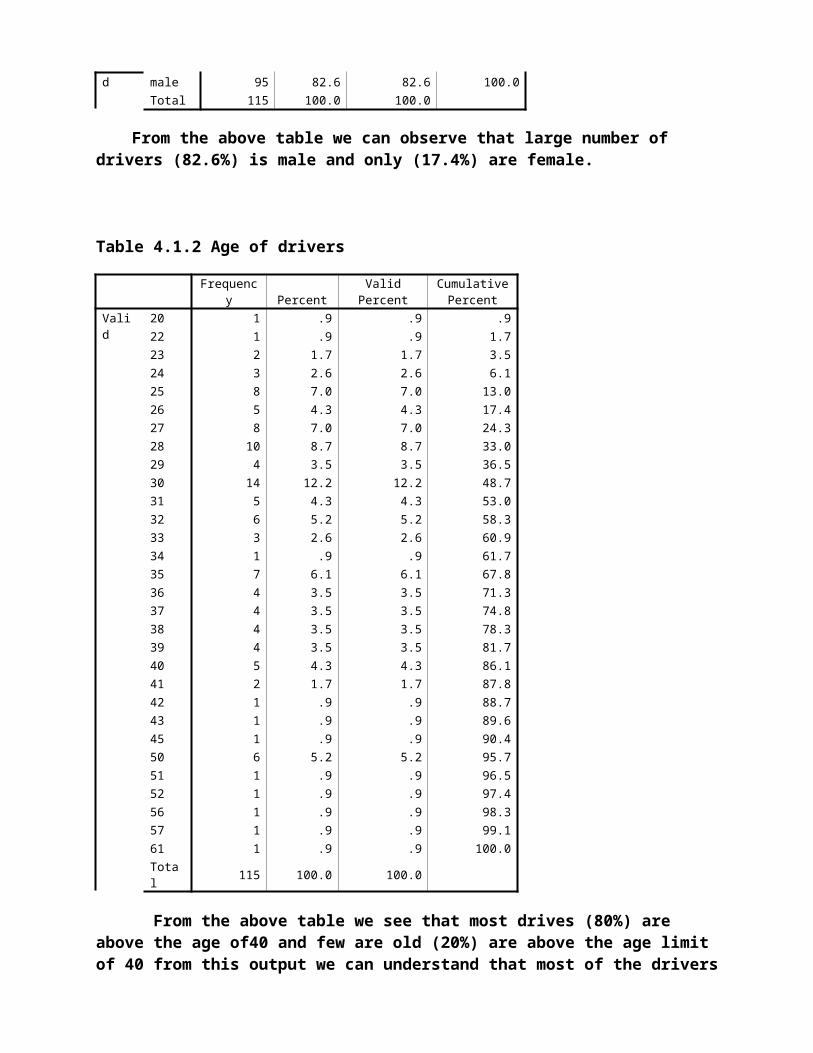
From the above table we can observe that large number of drivers (82.6%) is male and only (17.4%) are female.
Table 4.1.2 Age of drivers
Frequency Percent Valid PercentCumulative
PercentValid 20 1 .9 .9 .9
22 1 .9 .9 1.7
23 2 1.7 1.7 3.5
24 3 2.6 2.6 6.1
25 8 7.0 7.0 13.0
26 5 4.3 4.3 17.4
27 8 7.0 7.0 24.3
28 10 8.7 8.7 33.0
29 4 3.5 3.5 36.5
30 14 12.2 12.2 48.7

31 5 4.3 4.3 53.0
32 6 5.2 5.2 58.3
33 3 2.6 2.6 60.9
34 1 .9 .9 61.7
35 7 6.1 6.1 67.8
36 4 3.5 3.5 71.3
37 4 3.5 3.5 74.8
38 4 3.5 3.5 78.3
39 4 3.5 3.5 81.7
40 5 4.3 4.3 86.1
41 2 1.7 1.7 87.8
42 1 .9 .9 88.7
43 1 .9 .9 89.6
45 1 .9 .9 90.4
50 6 5.2 5.2 95.7
51 1 .9 .9 96.5
52 1 .9 .9 97.4
56 1 .9 .9 98.3
57 1 .9 .9 99.1
61 1 .9 .9 100.0
Total 115 100.0 100.0
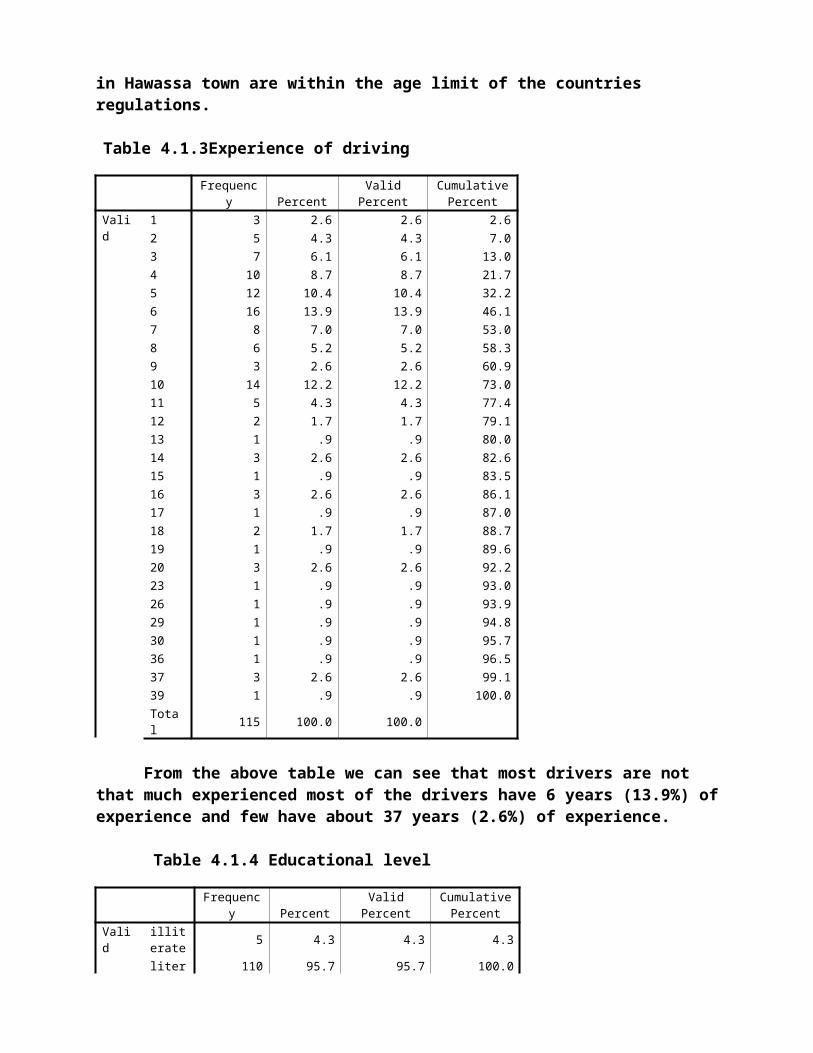
From the above table we see that most drives (80%) are above the age of40 and few are old (20%) are above the age limit of 40 from this output we can understand that most of the drivers in Hawassa town are within the age limit of the countries regulations. Table 4.1.3Experience of driving
Frequency Percent Valid PercentCumulative
PercentValid 1 3 2.6 2.6 2.6
2 5 4.3 4.3 7.0
3 7 6.1 6.1 13.0
4 10 8.7 8.7 21.7
5 12 10.4 10.4 32.2
6 16 13.9 13.9 46.1
7 8 7.0 7.0 53.0
8 6 5.2 5.2 58.3
9 3 2.6 2.6 60.9
10 14 12.2 12.2 73.0
11 5 4.3 4.3 77.4
12 2 1.7 1.7 79.1
13 1 .9 .9 80.0
14 3 2.6 2.6 82.6
15 1 .9 .9 83.5
16 3 2.6 2.6 86.1
17 1 .9 .9 87.0
18 2 1.7 1.7 88.7
19 1 .9 .9 89.6
20 3 2.6 2.6 92.2
23 1 .9 .9 93.0
26 1 .9 .9 93.9
29 1 .9 .9 94.8
30 1 .9 .9 95.7
36 1 .9 .9 96.5
37 3 2.6 2.6 99.1
39 1 .9 .9 100.0
Total 115 100.0 100.0
From the above table we can see that most drivers are not that much experienced most of the drivers have 6 years (13.9%) of experience and few have about 37 years (2.6%) of experience.
Table 4.1.4 Educational level
Frequency Percent Valid PercentCumulative
PercentValid illiterat
e5 4.3 4.3 4.3
literate 110 95.7 95.7 100.0
Total 115 100.0 100.0
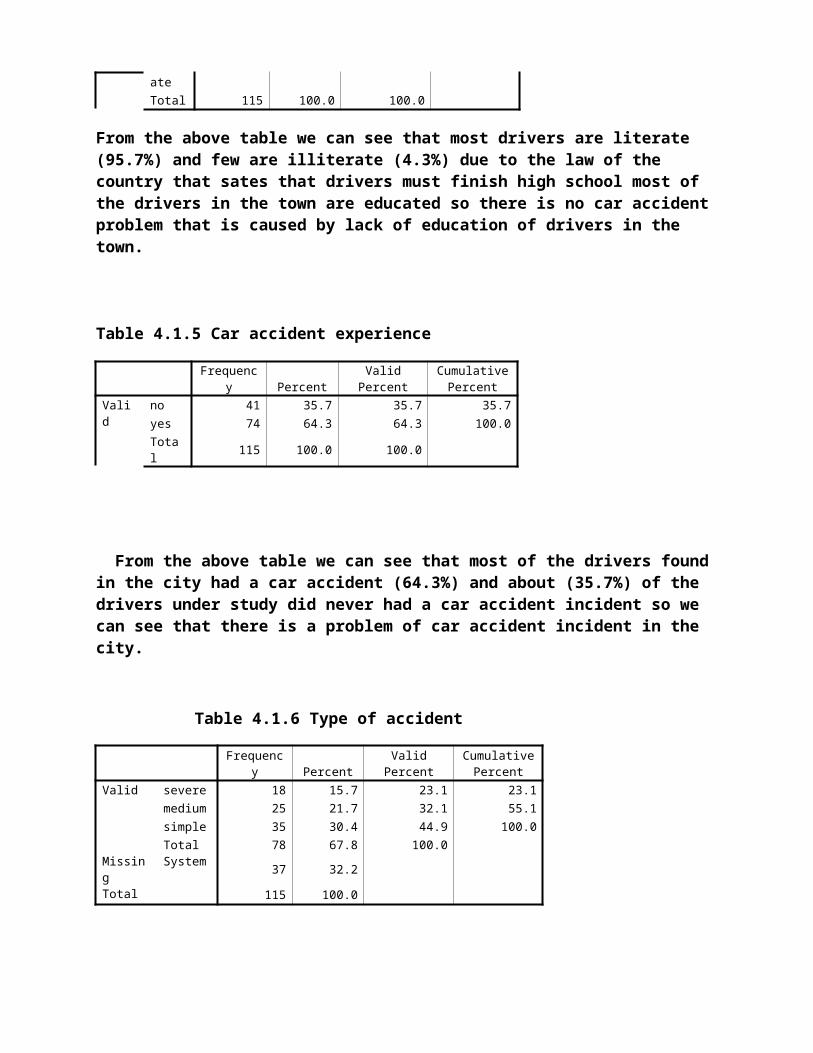
From the above table we can see that most drivers are literate (95.7%) and few are illiterate (4.3%) due to the law of the country that sates that drivers must finish high school most of the drivers in the town are educated so there is no car accident problem that is caused by lack of education of drivers in the town.
Table 4.1.5 Car accident experience
Frequency Percent Valid PercentCumulative
PercentValid no 41 35.7 35.7 35.7
yes 74 64.3 64.3 100.0
Total 115 100.0 100.0
From the above table we can see that most of the drivers found in the city had a car accident (64.3%) and about (35.7%) of the drivers under study did never had a car accident incident so we can see that there is a problem of car accident incident in the city.
Table 4.1.6 Type of accident
Frequency Percent Valid PercentCumulative
Percent
Valid severe 18 15.7 23.1 23.1
medium 25 21.7 32.1 55.1
simple 35 30.4 44.9 100.0
Total 78 67.8 100.0Missing System 37 32.2Total 115 100.0
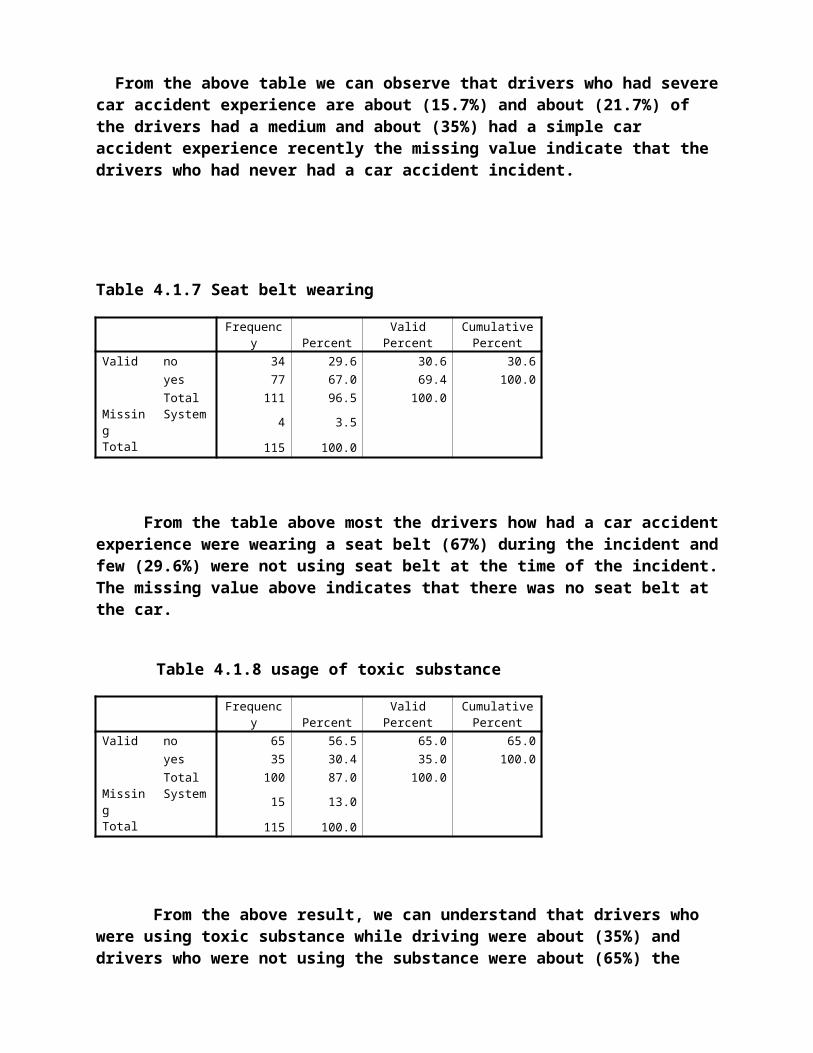
From the above table we can observe that drivers who had severe car accident experience are about (15.7%) and about (21.7%) of the drivers had a medium and about (35%) had a simple car accident experience recently the missing value indicate that the drivers who had never had a car accident incident.
Table 4.1.7 Seat belt wearing
Frequency Percent Valid PercentCumulative
PercentValid no 34 29.6 30.6 30.6
yes 77 67.0 69.4 100.0
Total 111 96.5 100.0Missing System 4 3.5Total 115 100.0
From the table above most the drivers how had a car accident experience were wearing a seat belt (67%) during the incident and few (29.6%) were not using seat belt at the time of the incident. The missing value above indicates that there was no seat belt at the car.
Table 4.1.8 usage of toxic substance
Frequency Percent Valid PercentCumulative
PercentValid no 65 56.5 65.0 65.0
yes 35 30.4 35.0 100.0
Total 100 87.0 100.0Missing System 15 13.0Total 115 100.0
From the above result, we can understand that drivers who were using toxic substance while driving were about (35%) and drivers who were not using the
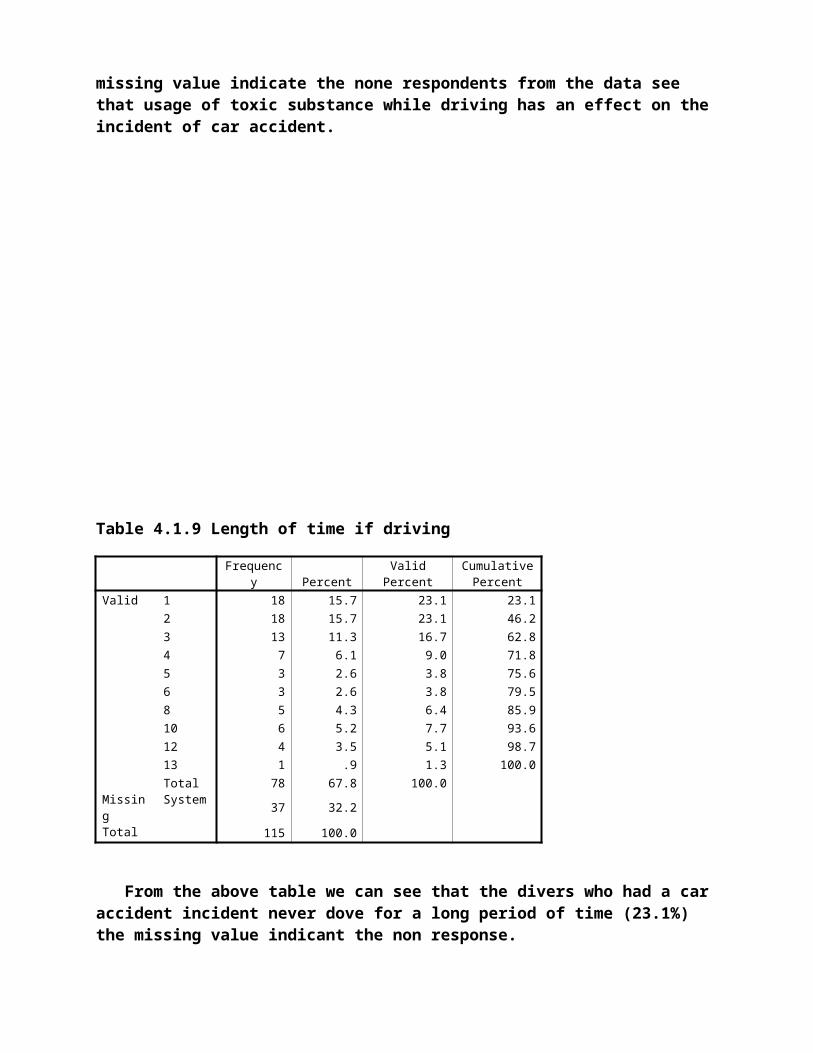
substance were about (65%) the missing value indicate the none respondents from the data see that usage of toxic substance while driving has an effect on the incident of car accident.
Table 4.1.9 Length of time if driving
Frequency Percent Valid PercentCumulative
PercentValid 1 18 15.7 23.1 23.1
2 18 15.7 23.1 46.2
3 13 11.3 16.7 62.8
4 7 6.1 9.0 71.8
5 3 2.6 3.8 75.6
6 3 2.6 3.8 79.5
8 5 4.3 6.4 85.9
10 6 5.2 7.7 93.6
12 4 3.5 5.1 98.7
13 1 .9 1.3 100.0
Total 78 67.8 100.0Missing System 37 32.2Total 115 100.0
From the above table we can see that the divers who had a car accident incident never dove for a long period of time (23.1%) the missing value indicant the non response.
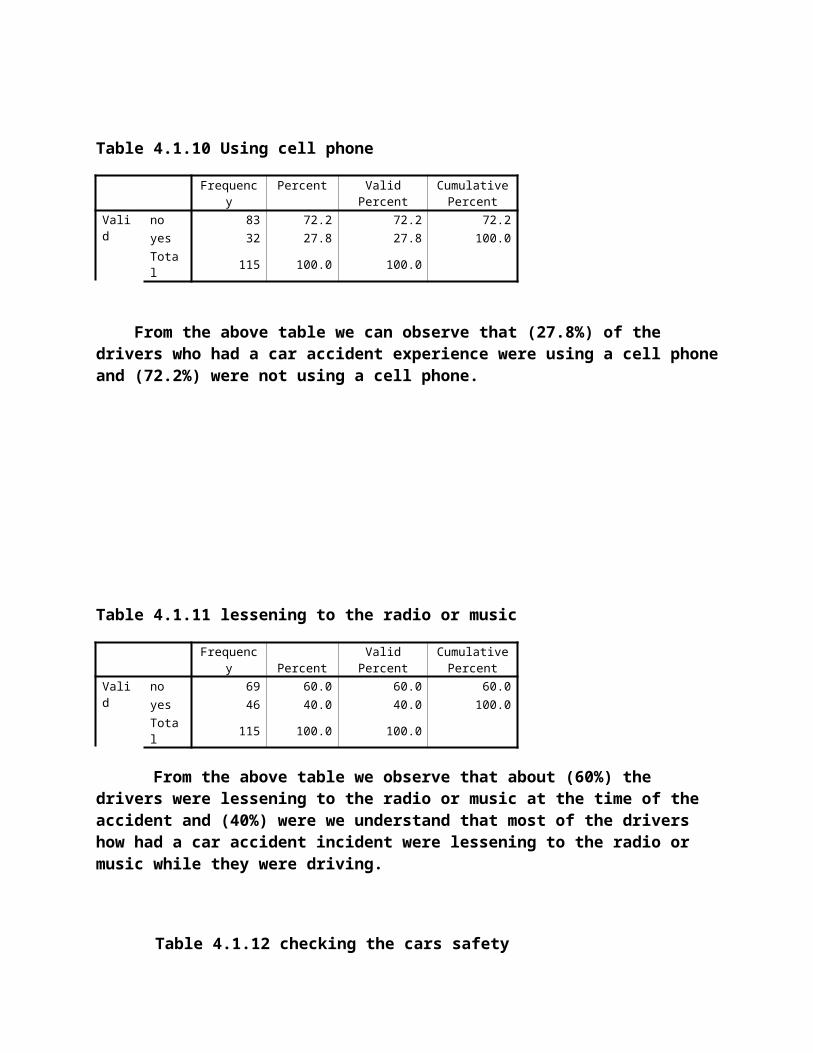
Table 4.1.10 Using cell phone
Frequency Percent Valid PercentCumulative
Percent
Valid no 83 72.2 72.2 72.2
yes 32 27.8 27.8 100.0
Total 115 100.0 100.0
From the above table we can observe that (27.8%) of the drivers who had a car accident experience were using a cell phone and (72.2%) were not using a cell phone.
Table 4.1.11 lessening to the radio or music
Frequency Percent Valid PercentCumulative
PercentValid no 69 60.0 60.0 60.0
yes 46 40.0 40.0 100.0
Total 115 100.0 100.0
From the above table we observe that about (60%) the drivers were lessening to the radio or music at the time of the accident and (40%) were we understand that most of the drivers how had a car accident incident were lessening to the radio or music while they were driving.
Table 4.1.12 checking the cars safety
Frequency Percent Valid PercentCumulative
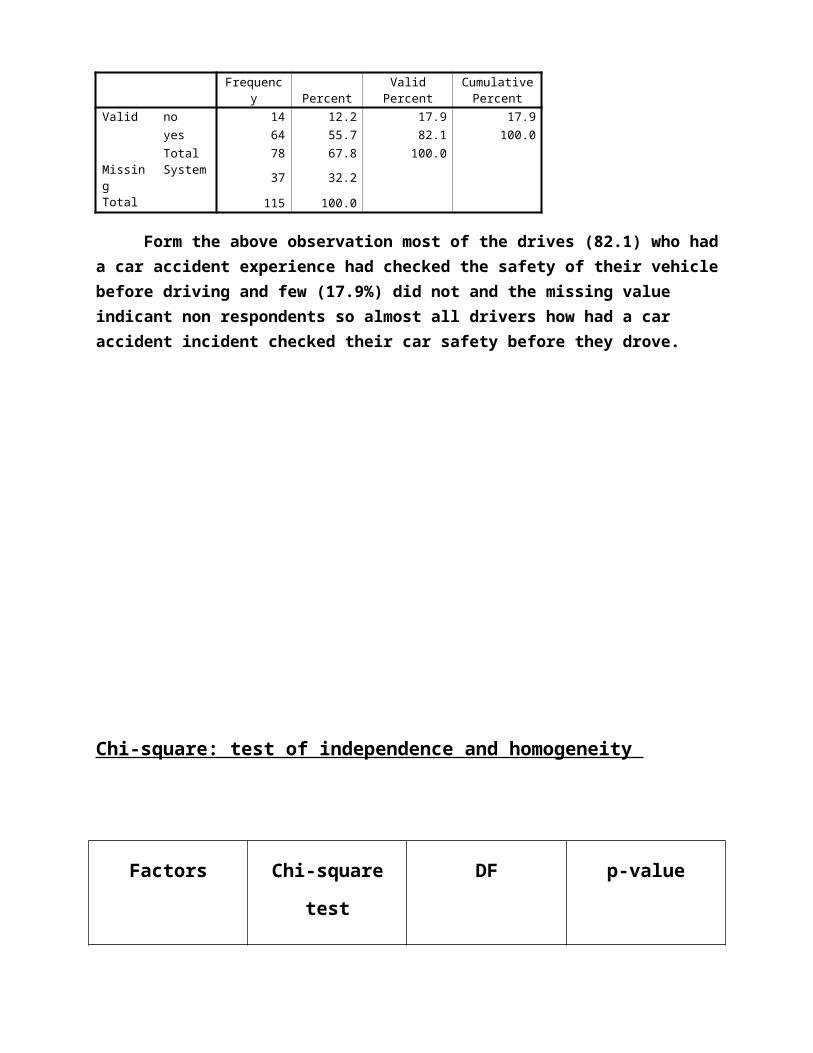
PercentValid no 14 12.2 17.9 17.9
yes 64 55.7 82.1 100.0
Total 78 67.8 100.0Missing System 37 32.2Total 115 100.0
Form the above observation most of the drives (82.1) who had a car accident experience had checked the safety of their vehicle before driving and few (17.9%) did not and the missing value indicant non respondents so almost all drivers how had a car accident incident checked their car safety before they drove.
Chi-square: test of independence and homogeneity
Factors Chi-square test DF p-value
Sex of the drivers 12.450(b) 1 0.001
Age of the driver 22.297(a) 1 0.672
Educational level of
the driver
0.043(b) 1 0.836
Usage of toxic
substance
1.039(b) 1 0.308
Lessening to the radio
or music while
driving
28.358(b) 1 0.000
speed of the driver 4.614(b) 1 0.002
Checking the cars
safety
0.922(b) 1 0.337
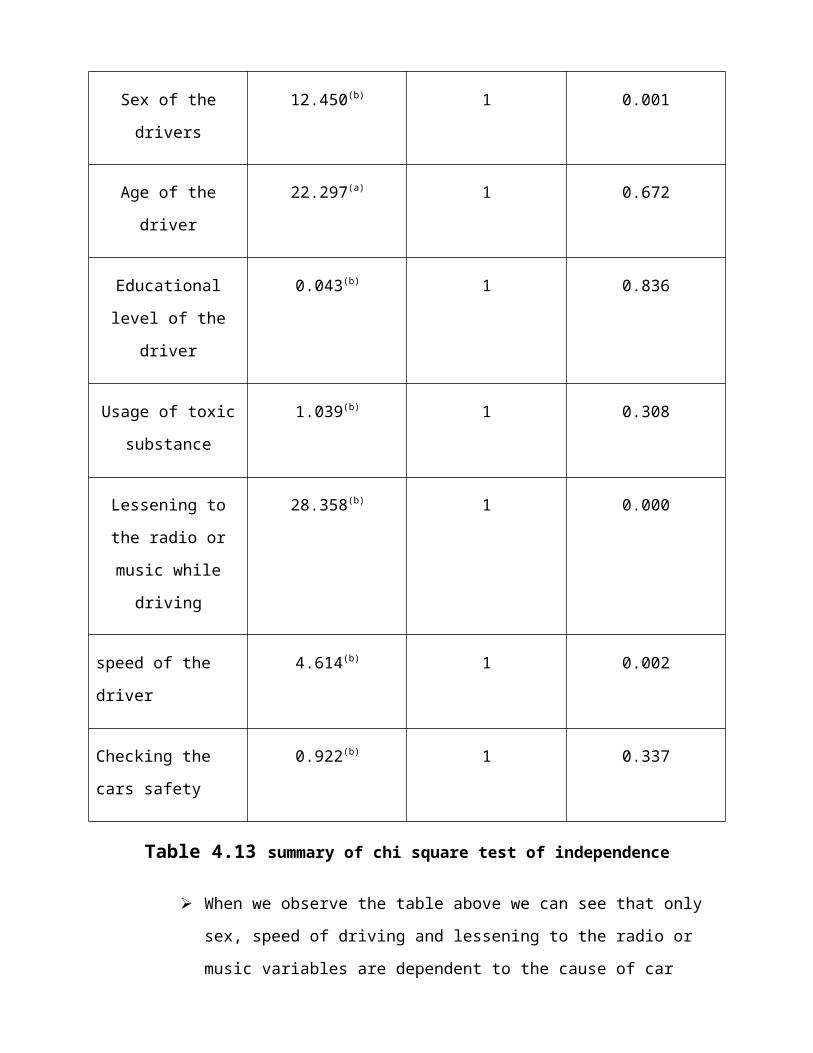
Table 4.13 summary of chi square test of independence
When we observe the table above we can see that only sex, speed of driving and
lessening to the radio or music variables are dependent to the cause of car
accident incident. Since there p- value is less than 0.05, we can say that these
variables are significant.
From the table above we can observe that the p- value of lessening to the radio
or music is 0.000, which indicate that this variable has a very significant effect
on the incident of car accident. In addition, sex, speed has 0.001, 0.002 values
respectively which also implies their significant effect.
4.2LOGISTIC regression
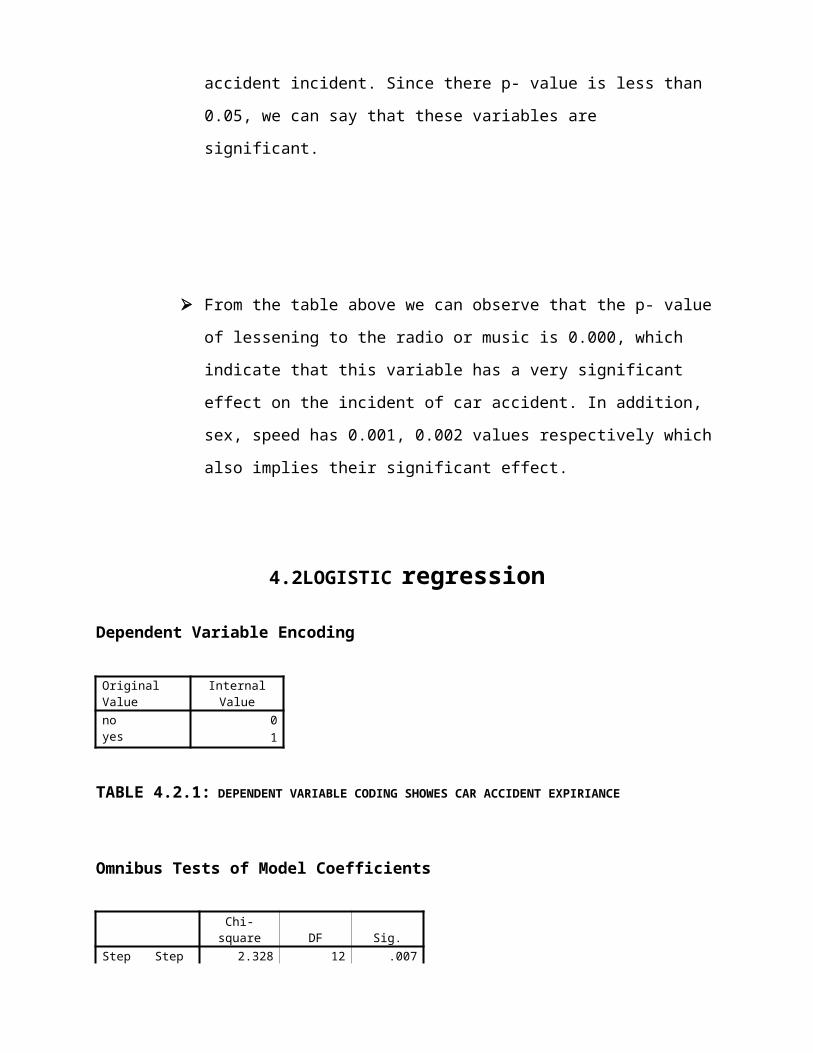
Dependent Variable Encoding
Original Value Internal Valueno 0yes 1
TABLE 4.2.1: DEPENDENT VARIABLE CODING SHOWES CAR ACCIDENT EXPIRIANCE
Omnibus Tests of Model Coefficients
Chi-square DF Sig.Step 1 Step 2.328 12 .007
Block 2.328 12 .007
Model 2.328 12 .007
TABLE 4.2.2: OMNIBUS TEST FOR MODEL COEFFICIENTES
In the table above since the p-value for the model is more than the commonly used level of significance value (0.05)reject the null hypothesis which states that the entire model
coefficient are zero therefore we conclude that at least one coefficient is deferent from zero.
Table 4.2.3 variables in the equation
Variables in the Equation
B S.E. Wald DF Sig. Exp(B)Step 1(a)
sex 1.903 .669 8.093 1 .004 6.709
age-.169 .222 .577 1 .447 .845
Driving experience .433 .489 .785 1 .376 1.543
educational level-6.782 1.883 .000 1 1.000 .001
Type of accident-18.462 1.993 .000 1 .055` .000
Seat belt-.134 1.801 .005 1 .941 .875
Toxic substance-2.887 2.841 1.032 1 .310 .056
Time OF driving-.208 .502 .172 1 .678 .812
Cell phone-40.271 1.223 .000 1 .995 .000
music 2.938 .683 18.515 1 .000 18.873
speed 0.821 0.92 .633 1 .0041 2.696
check-35.868 0.313 .000 1 .997 .000
Constant-1.769 .641 7.622 1 .006 .171
Logistic regression
The equation is written in the form of: -
Where - Bo constant
- B1, B 2 BK are the parameter estimator
- x1 speed x2 is lessening to the radio and music
n =-1.769+1.903x1+2.938x2 +0.821X3
The logistic regression model is constructed in order to examine whether the experience of
car accident by drivers in Hawassa town is affected by sex, speed & lessening to the radio or
music while driving by observing their p-value which is less than 0.05 which indicate that this
variables have significant effect on the incident of car accident.
The odd ratio of the car accident incident for the respondent female is 6.709 times that of
the male respondents were the speed, lesstning to the radio or music while driving.
The odd ratio of the car accident incident for the respondent who were lessening to the
radio or music while deriving is 18.873 times that of the drivers who were not lessening
and we can see that from all variables (sex and speed) lessening to the radio and music
has significant effect.
The odd ratio of the car accident incident for the respondent how was speeding while
driving is2.696 times that of the drivers who were not driving out of the limit or who
were not speeding while driving.
Generally, we conclude that the parameters of sex, speed, lessening to the radio or
music rare significantly different from zero at 5% level of significance. There fore, the
incident of car accident is affected by the sex, speed of driving and lessening to the radio
or music while driving.
Chapter Five
Conclusion and Recommendation
Conclusion
Based on the result and dissection we can give the following conclusion there is association
between the incident of car accident and the sex, speed of driving, lesseniing to the radio or
music while driving.
Based on the finding of the study, it is concluded that driving above the limit and lessening
to the radio or music are the causes of accidents in Hawassa city and the gender of the
driver has a sigfficat effect.
The contribution of other factors like using toxic substance, not wearing seat belt has a
positive relation in the cause of car accident in the city.
Recommendation
I would like to recommend that drivers should avoid the factors the cause car accidents in
order to avoid loss of life and deserters. Drivers should drive only in the limited that is
permitted and be focused while driving and if possible, drivers are advised not to listen to
the radio or music while driving.
Generally, both drivers and the society should work together to play an important role in
trying to minimize the causes of car accident in Hawassa city and in Ethiopia as a hole.
Limitation of the study
The study is limited to those drivers found in Hawassa town. A questioner was designed
to collect data only from drivers having driver license greater than two. It takes the analysis
for the major variables and combining some nearly identical scales as single scale in the
questioner.
In addition in the method used:
The sample may not be representative of the target population, Hawassa city
drivers, due to shortage of time and budget (cost) to include more samples.
There may be high response or non-response errors.
There may be time inconvenient to give full response of the questionnaire.
There was no enough time for the data collected to be analyzed in more and many
types of statistical methods so the data may not be reliable for further study.
Reference
1. Traffic operations (from department of civil engineering 2011)
2. http:www.injuryfindout/car accident.com
3. Car accident: a practical recovery manual for drivers, passengers,
and the people in there life by jack smith1999
4. www.whatprice/car accient.com
5. Statistical software package (spss)
6. Microsoft word and excel
7. Exercise book
8. The Internet
Appendix
No Variables in the
model
0 1 2 3 4
1 sex male female
2 Educational level Lartet Illiterate
3 Car accident
experience
yes no
4 Type of accident severe medium Simple
5 Seat belt wearing yes no
6 Usage of toxic
substance
yes no
7 Usage of cell
phone
yes no
8 Lessening to the
radio
yes no
9 Checking the car
safety
yes no