
Capturing Value in Managing Energy Flexibility | Accenture€¦ · Along with the peaks and valleys...
29
CAPTURING VALUE IN MANAGING ENERGY FLEXIBILITY
Transcript of Capturing Value in Managing Energy Flexibility | Accenture€¦ · Along with the peaks and valleys...
CAPTURING VALUE IN MANAGING ENERGY FLEXIBILITY
02 ACCENTURE
CONTENTSEXECUTIVE SUMMARY
FIVE OBSERVATIONS
1. Batteries and innovative commercial optimization models are unlocking value pools to help improve grid stability and increase security of supply
2. Industrial and residential consumers are increasingly moving toward renewable purchasing and self-generation
3. New entrants with new approaches to managing energy demand and supply are entering and disrupting the market
4. Most players are piloting multiple models to manage flexibility
5. The landscape of emerging flexibility models varies by geography and continues to evolve
0308
IMPLICATIONS FOR THE INCUMBENTS21APPENDIX: PROFILED COMPANIES27
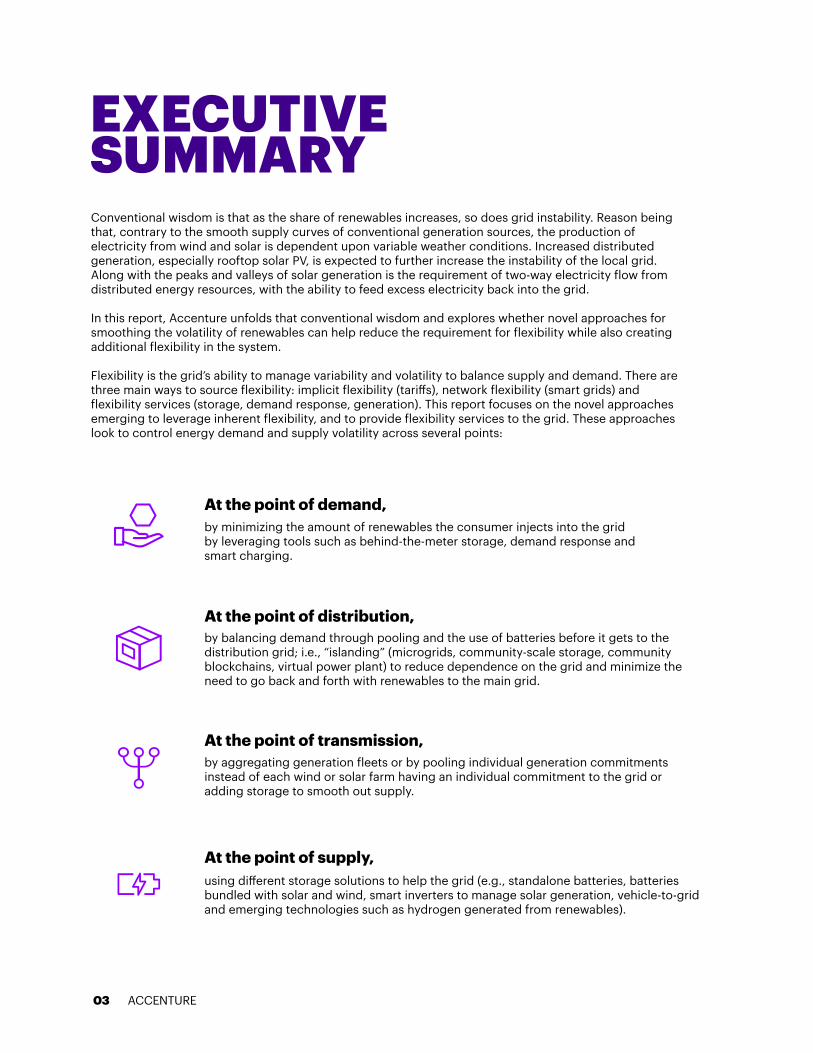
EXECUTIVE SUMMARYConventional wisdom is that as the share of renewables increases, so does grid instability. Reason being that, contrary to the smooth supply curves of conventional generation sources, the production of electricity from wind and solar is dependent upon variable weather conditions. Increased distributed generation, especially rooftop solar PV, is expected to further increase the instability of the local grid. Along with the peaks and valleys of solar generation is the requirement of two-way electricity flow from distributed energy resources, with the ability to feed excess electricity back into the grid.
In this report, Accenture unfolds that conventional wisdom and explores whether novel approaches for smoothing the volatility of renewables can help reduce the requirement for flexibility while also creating additional flexibility in the system.
Flexibility is the grid’s ability to manage variability and volatility to balance supply and demand. There are three main ways to source flexibility: implicit flexibility (tari�s), network flexibility (smart grids) and flexibility services (storage, demand response, generation). This report focuses on the novel approaches emerging to leverage inherent flexibility, and to provide flexibility services to the grid. These approaches look to control energy demand and supply volatility across several points:
by minimizing the amount of renewables the consumer injects into the grid by leveraging tools such as behind-the-meter storage, demand response and smart charging.
by balancing demand through pooling and the use of batteries before it gets to the distribution grid; i.e., “islanding” (microgrids, community-scale storage, community blockchains, virtual power plant) to reduce dependence on the grid and minimize the need to go back and forth with renewables to the main grid.
by aggregating generation fleets or by pooling individual generation commitments instead of each wind or solar farm having an individual commitment to the grid or adding storage to smooth out supply.
using di�erent storage solutions to help the grid (e.g., standalone batteries, batteries bundled with solar and wind, smart inverters to manage solar generation, vehicle-to-grid and emerging technologies such as hydrogen generated from renewables).
At the point of demand,
At the point of distribution,
At the point of transmission,
At the point of supply,
03 ACCENTURE
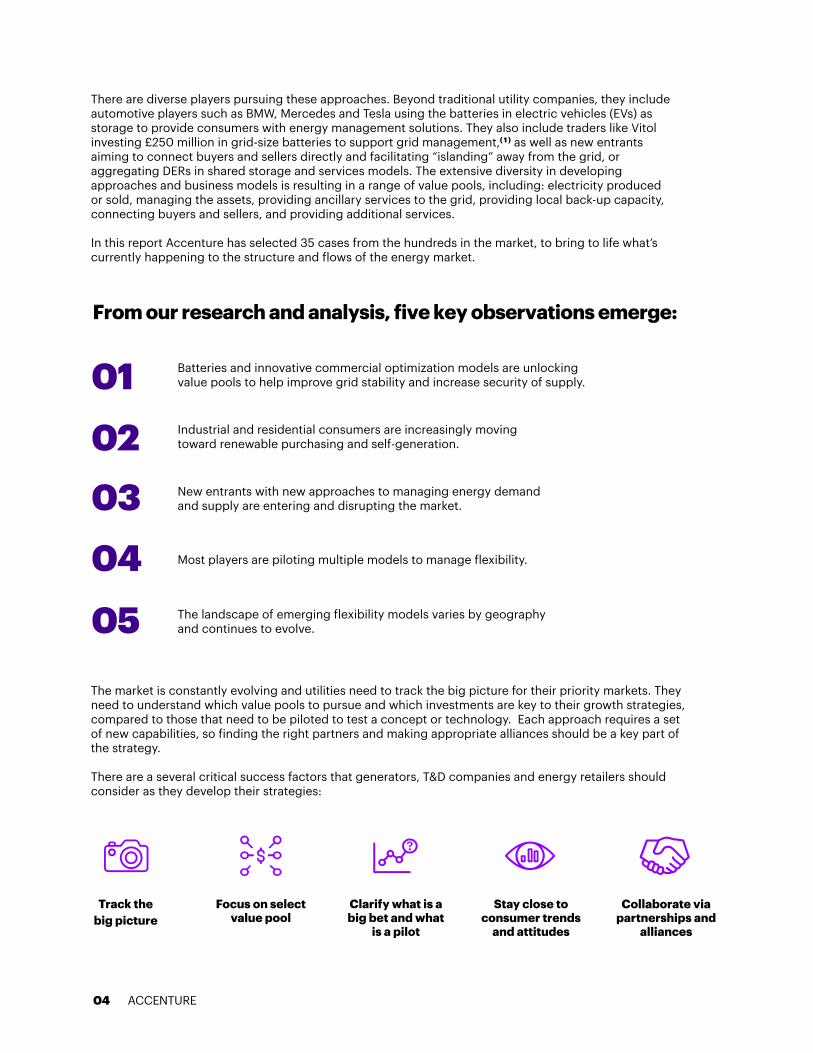
There are diverse players pursuing these approaches. Beyond traditional utility companies, they include automotive players such as BMW, Mercedes and Tesla using the batteries in electric vehicles (EVs) as storage to provide consumers with energy management solutions. They also include traders like Vitol investing £250 million in grid-size batteries to support grid management,( 1 ) as well as new entrants aiming to connect buyers and sellers directly and facilitating “islanding” away from the grid, or aggregating DERs in shared storage and services models. The extensive diversity in developing approaches and business models is resulting in a range of value pools, including: electricity produced or sold, managing the assets, providing ancillary services to the grid, providing local back-up capacity, connecting buyers and sellers, and providing additional services.
In this report Accenture has selected 35 cases from the hundreds in the market, to bring to life what’s currently happening to the structure and flows of the energy market.
The market is constantly evolving and utilities need to track the big picture for their priority markets. They need to understand which value pools to pursue and which investments are key to their growth strategies, compared to those that need to be piloted to test a concept or technology. Each approach requires a set of new capabilities, so finding the right partners and making appropriate alliances should be a key part of the strategy.
There are a several critical success factors that generators, T&D companies and energy retailers should consider as they develop their strategies:
Batteries and innovative commercial optimization models are unlocking value pools to help improve grid stability and increase security of supply.
Industrial and residential consumers are increasingly moving toward renewable purchasing and self-generation.
New entrants with new approaches to managing energy demand and supply are entering and disrupting the market.
Most players are piloting multiple models to manage flexibility.
The landscape of emerging flexibility models varies by geography and continues to evolve.
Track the big picture
Focus on select value pool
Clarify what is a big bet and what
is a pilot
Stay close to consumer trends
and attitudes
Collaborate via partnerships and
alliances
From our research and analysis, five key observations emerge:
04
01020304
05
ACCENTURE
INTRODUCTION
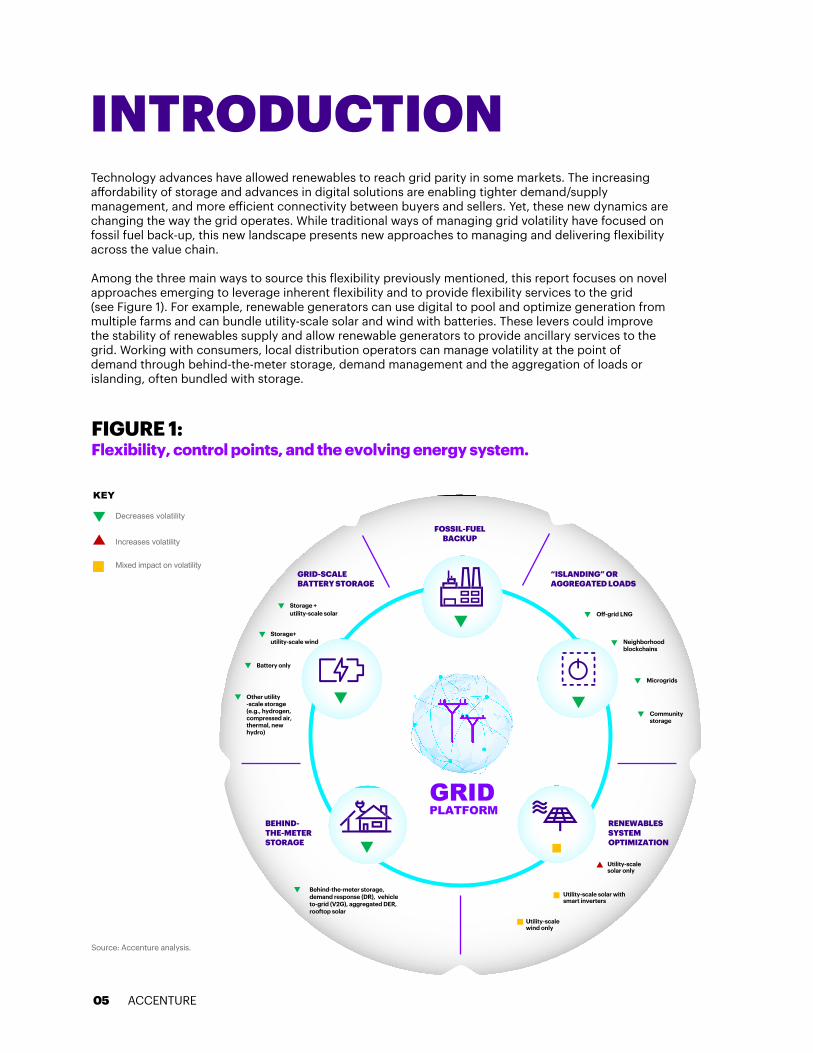
FIGURE 1: Flexibility, control points, and the evolving energy system.
05
Technology advances have allowed renewables to reach grid parity in some markets. The increasing a�ordability of storage and advances in digital solutions are enabling tighter demand/supply management, and more e�icient connectivity between buyers and sellers. Yet, these new dynamics are changing the way the grid operates. While traditional ways of managing grid volatility have focused on fossil fuel back-up, this new landscape presents new approaches to managing and delivering flexibility across the value chain.
Among the three main ways to source this flexibility previously mentioned, this report focuses on novel approaches emerging to leverage inherent flexibility and to provide flexibility services to the grid (see Figure 1). For example, renewable generators can use digital to pool and optimize generation from multiple farms and can bundle utility-scale solar and wind with batteries. These levers could improve the stability of renewables supply and allow renewable generators to provide ancillary services to the grid. Working with consumers, local distribution operators can manage volatility at the point of demand through behind-the-meter storage, demand management and the aggregation of loads or islanding, often bundled with storage.
KEY
Decreases volatility
Increases volatility
Mixed impact on volatility
Source: Accenture analysis.
Storage + utility-scale solar
Storage+utility-scale wind
O�-grid LNG
Neighborhood blockchains
Microgrids
Community storage
Behind-the-meter storage, demand response (DR), vehicle to-grid (V2G), aggregated DER, rooftop solar
Battery only
Other utility-scale storage(e.g., hydrogen, compressed air, thermal, new hydro)
FOSSIL-FUEL BACKUP
Utility-scale solar only
Utility-scale wind only
Utility-scale solar with smart inverters
“ISLANDING” OR AGGREGATED LOADS
GRID-SCALE BATTERY STORAGE
RENEWABLES SYSTEM OPTIMIZATION
BEHIND-THE-METER STORAGE
GRIDPLATFORM
ACCENTURE
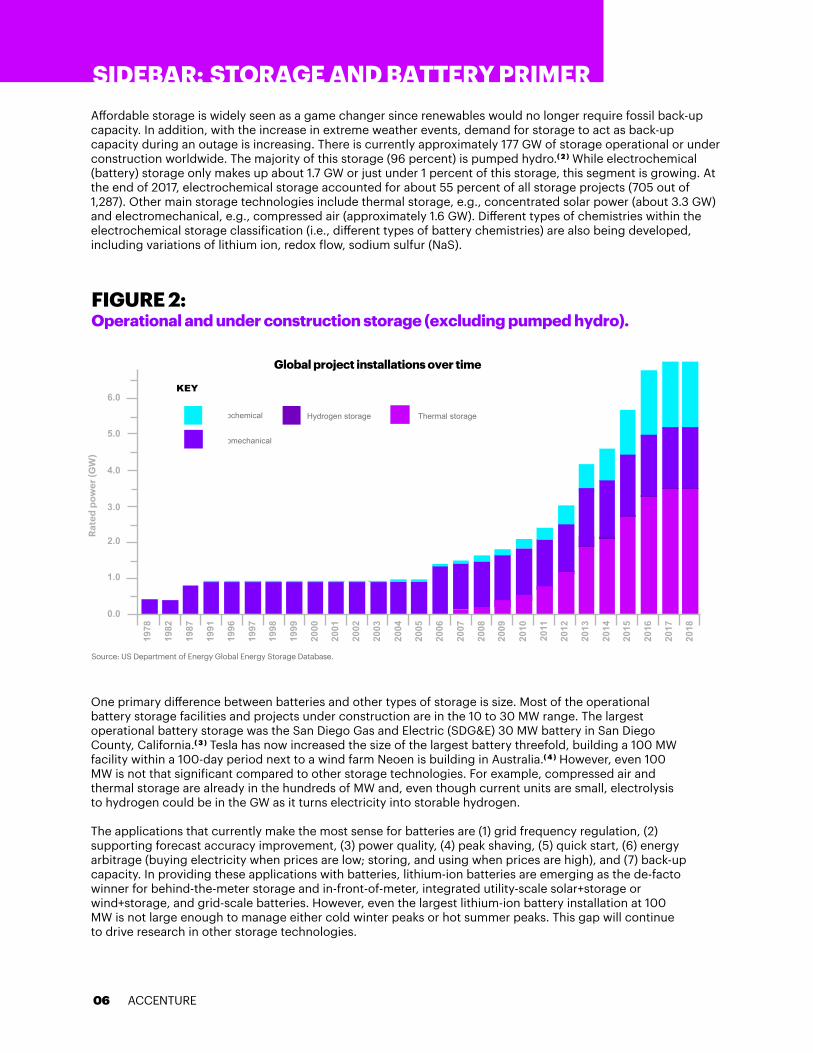
FIGURE 2: Operational and under construction storage (excluding pumped hydro).
Global project installations over time
KEY
Electrochemical Hydrogen storage Thermal storage
Electromechanical
Source: US Department of Energy Global Energy Storage Database.
A�ordable storage is widely seen as a game changer since renewables would no longer require fossil back-up capacity. In addition, with the increase in extreme weather events, demand for storage to act as back-up capacity during an outage is increasing. There is currently approximately 177 GW of storage operational or under construction worldwide. The majority of this storage (96 percent) is pumped hydro.( 2 ) While electrochemical (battery) storage only makes up about 1.7 GW or just under 1 percent of this storage, this segment is growing. At the end of 2017, electrochemical storage accounted for about 55 percent of all storage projects (705 out of 1,287). Other main storage technologies include thermal storage, e.g., concentrated solar power (about 3.3 GW) and electromechanical, e.g., compressed air (approximately 1.6 GW). Di�erent types of chemistries within the electrochemical storage classification (i.e., di�erent types of battery chemistries) are also being developed, including variations of lithium ion, redox flow, sodium sulfur (NaS).
One primary di�erence between batteries and other types of storage is size. Most of the operational battery storage facilities and projects under construction are in the 10 to 30 MW range. The largest operational battery storage was the San Diego Gas and Electric (SDG&E) 30 MW battery in San Diego County, California.( 3 ) Tesla has now increased the size of the largest battery threefold, building a 100 MW facility within a 100-day period next to a wind farm Neoen is building in Australia.( 4 ) However, even 100 MW is not that significant compared to other storage technologies. For example, compressed air and thermal storage are already in the hundreds of MW and, even though current units are small, electrolysis to hydrogen could be in the GW as it turns electricity into storable hydrogen.
The applications that currently make the most sense for batteries are (1) grid frequency regulation, (2) supporting forecast accuracy improvement, (3) power quality, (4) peak shaving, (5) quick start, (6) energy arbitrage (buying electricity when prices are low; storing, and using when prices are high), and (7) back-up capacity. In providing these applications with batteries, lithium-ion batteries are emerging as the de-facto winner for behind-the-meter storage and in-front-of-meter, integrated utility-scale solar+storage or wind+storage, and grid-scale batteries. However, even the largest lithium-ion battery installation at 100 MW is not large enough to manage either cold winter peaks or hot summer peaks. This gap will continue to drive research in other storage technologies.
06
For example, hydrogen storage (electricity to gas via electrolysis) is negligible today, but there are pilots such as the Hydrogenics’ 2.4 MW power-to-gas plant in Germany that converts excess wind power to renewable hydrogen and feeds it into the local natural gas pipeline.( 5 ) It is still uncertain whether any storage solution for renewable electricity can really compete with fuels such as natural gas, biomass, or coal to supply seasonal peaks. Some markets have access to biomass or hydro to meet the seasonal demand peaks, but most lack these renewable resources at the scale needed. The aspiration for a 100 percent renewables world will continue to drive storage technology development.
With respect to using batteries to improve grid reliability and for short-term back-up capacity, diverse operating models are emerging at di�erent scales on both the supply and demand sides. The batteries and operating models being piloted and installed range from 30 MW batteries integrated with solar or wind to support the grid operator, to smaller batteries (2 to 4 MW) that can support distribution grids in local markets, to in-home batteries as part of aggregated systems (10 to 20 kWh), to vehicle batteries (about 20 kWh). It’s di�icult to compare the various battery costs due to variation of size and battery management systems and applications required as well as the di�erent contexts and use cases. Figure 3 compares use-case and battery-technology combinations.
0.0
1978
1982
1987
1991
1996
1997
1998
1999
2000
2001
2002
2003
2004
2006
2007
2008
2009
2010
2011
2012
2013
2014
2015
2016
2017
2018
2005
1.0
2.0
3.0
Rate
d po
wer
(GW
)
4.0
5.0
6.0
STORAGE AND BATTERY PRIMERSIDEBAR:
ACCENTURE
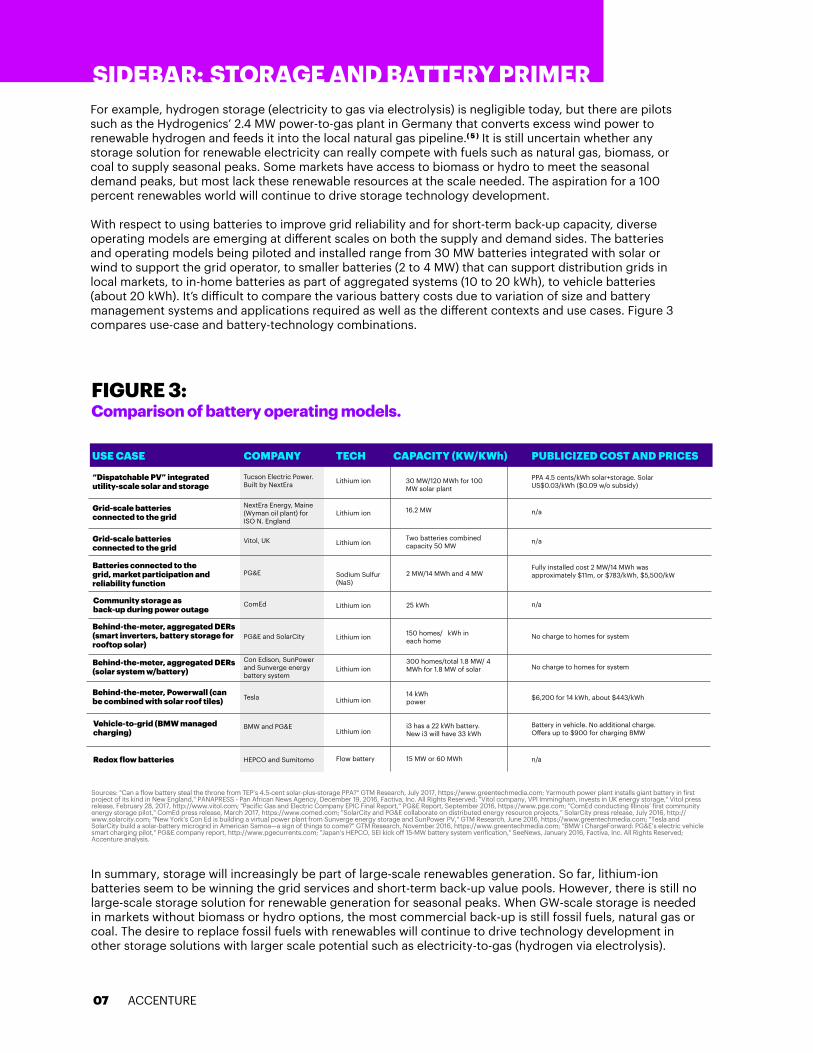
FIGURE 3: Comparison of battery operating models.
One primary di�erence between batteries and other types of storage is size. Most of the operational battery storage facilities and projects under construction are in the 10 to 30 MW range. The largest operational battery storage was the San Diego Gas and Electric (SDG&E) 30 MW battery in San Diego County, California.( 3 ) Tesla has now increased the size of the largest battery threefold, building a 100 MW facility within a 100-day period next to a wind farm Neoen is building in Australia.( 4 ) However, even 100 MW is not that significant compared to other storage technologies. For example, compressed air and thermal storage are already in the hundreds of MW and, even though current units are small, electrolysis to hydrogen could be in the GW as it turns electricity into storable hydrogen.
The applications that currently make the most sense for batteries are (1) grid frequency regulation, (2) supporting forecast accuracy improvement, (3) power quality, (4) peak shaving, (5) quick start, (6) energy arbitrage (buying electricity when prices are low; storing, and using when prices are high), and (7) back-up capacity. In providing these applications with batteries, lithium-ion batteries are emerging as the de-facto winner for behind-the-meter storage and in-front-of-meter, integrated utility-scale solar+storage or wind+storage, and grid-scale batteries. However, even the largest lithium-ion battery installation at 100 MW is not large enough to manage either cold winter peaks or hot summer peaks. This gap will continue to drive research in other storage technologies.
Sources: "Can a flow battery steal the throne from TEP’s 4.5-cent solar-plus-storage PPA?" GTM Research, July 2017, https://www.greentechmedia.com; Yarmouth power plant installs giant battery in first project of its kind in New England," PANAPRESS - Pan African News Agency, December 19, 2016, Factiva, Inc. All Rights Reserved; "Vitol company, VPI Immingham, invests in UK energy storage," Vitol press release, February 28, 2017, http://www.vitol.com; "Pacific Gas and Electric Company EPIC Final Report,” PG&E Report, September 2016, https://www.pge.com; "ComEd conducting Illinois’ first community energy storage pilot," ComEd press release, March 2017, https://www.comed.com; "SolarCity and PG&E collaborate on distributed energy resource projects,” SolarCity press release, July 2016, http://www.solarcity.com; "New York’s Con Ed is building a virtual power plant from Sunverge energy storage and SunPower PV," GTM Research, June 2016, https://www.greentechmedia.com; "Tesla and SolarCity build a solar-battery microgrid in American Samoa—a sign of things to come?" GTM Research, November 2016, https://www.greentechmedia.com; "BMW i ChargeForward: PG&E’s electric vehicle smart charging pilot," PG&E company report, http://www.pgecurrents.com; "Japan’s HEPCO, SEI kick off 15-MW battery system verification," SeeNews, January 2016, Factiva, Inc. All Rights Reserved; Accenture analysis.
In summary, storage will increasingly be part of large-scale renewables generation. So far, lithium-ion batteries seem to be winning the grid services and short-term back-up value pools. However, there is still no large-scale storage solution for renewable generation for seasonal peaks. When GW-scale storage is needed in markets without biomass or hydro options, the most commercial back-up is still fossil fuels, natural gas or coal. The desire to replace fossil fuels with renewables will continue to drive technology development in other storage solutions with larger scale potential such as electricity-to-gas (hydrogen via electrolysis).
For example, hydrogen storage (electricity to gas via electrolysis) is negligible today, but there are pilots such as the Hydrogenics’ 2.4 MW power-to-gas plant in Germany that converts excess wind power to renewable hydrogen and feeds it into the local natural gas pipeline.( 5 ) It is still uncertain whether any storage solution for renewable electricity can really compete with fuels such as natural gas, biomass, or coal to supply seasonal peaks. Some markets have access to biomass or hydro to meet the seasonal demand peaks, but most lack these renewable resources at the scale needed. The aspiration for a 100 percent renewables world will continue to drive storage technology development.
With respect to using batteries to improve grid reliability and for short-term back-up capacity, diverse operating models are emerging at di�erent scales on both the supply and demand sides. The batteries and operating models being piloted and installed range from 30 MW batteries integrated with solar or wind to support the grid operator, to smaller batteries (2 to 4 MW) that can support distribution grids in local markets, to in-home batteries as part of aggregated systems (10 to 20 kWh), to vehicle batteries (about 20 kWh). It’s di�icult to compare the various battery costs due to variation of size and battery management systems and applications required as well as the di�erent contexts and use cases. Figure 3 compares use-case and battery-technology combinations.
07
USE CASE COMPANY TECH CAPACITY (KW/KWh) PUBLICIZED COST AND PRICES
“Dispatchable PV” integrated utility-scale solar and storage
Tucson Electric Power. Built by NextEra Lithium ion 30 MW/120 MWh for 100
MW solar plant
PPA 4.5 cents/kWh solar+storage. Solar US$0.03/kWh ($0.09 w/o subsidy)
Fully installed cost 2 MW/14 MWh was approximately $11m, or $783/kWh, $5,500/kW
Battery in vehicle. No additional charge. O�ers up to $900 for charging BMW
n/a
$6,200 for 14 kWh, about $443/kWh
No charge to homes for system
No charge to homes for system
n/a
n/a
n/a16.2 MW
Two batteries combined capacity 50 MW
2 MW/14 MWh and 4 MW
25 kWh
150 homes/� kWh in each home
300 homes/total 1.8 MW/ 4 MWh for 1.8 MW of solar
i3 has a 22 kWh battery. New i3 will have 33 kWh
15 MW or 60 MWh
14 kWhpower
Lithium ion
Lithium ion
Lithium ion
Sodium Sulfur(NaS)
Lithium ion
Lithium ion
Lithium ion
Lithium ion
Flow battery
Vitol, UK
ComEd
PG&E and SolarCity
Tesla
BMW and PG&E
HEPCO and Sumitomo
Con Edison, SunPower and Sunverge energy battery system
PG&E
NextEra Energy, Maine (Wyman oil plant) for ISO N. England
Grid-scale batteries connected to the grid
Grid-scale batteries connected to the grid
Batteries connected to the grid, market participation and reliability function
Community storage as back-up during power outage
Behind-the-meter, aggregated DERs (smart inverters, battery storage for rooftop solar)
Behind-the-meter, aggregated DERs(solar system w/battery)
Behind-the-meter, Powerwall (can be combined with solar roof tiles)
Vehicle-to-grid (BMW managed charging)
Redox flow batteries
ACCENTURE
STORAGE AND BATTERY PRIMERSIDEBAR:
FIVE OBSERVATIONSAccenture selected 35 cases from the hundreds in the market, to bring to life what’s currently happening in the evolving energy system. The cases range from the lowest costs of solar and storage achieved so far in the United States to the case of a utility balancing a portfolio of renewable assets and providing services to the grid without storage. We contrast the largest pure-play grid-scale storage investments to the local aggregation and management of DERs with in-front-of-meter storage and demand management. We also reviewed the wide range of groups aggregating their demand and investing in o�-grid supply. Five observations emerge from our analysis.
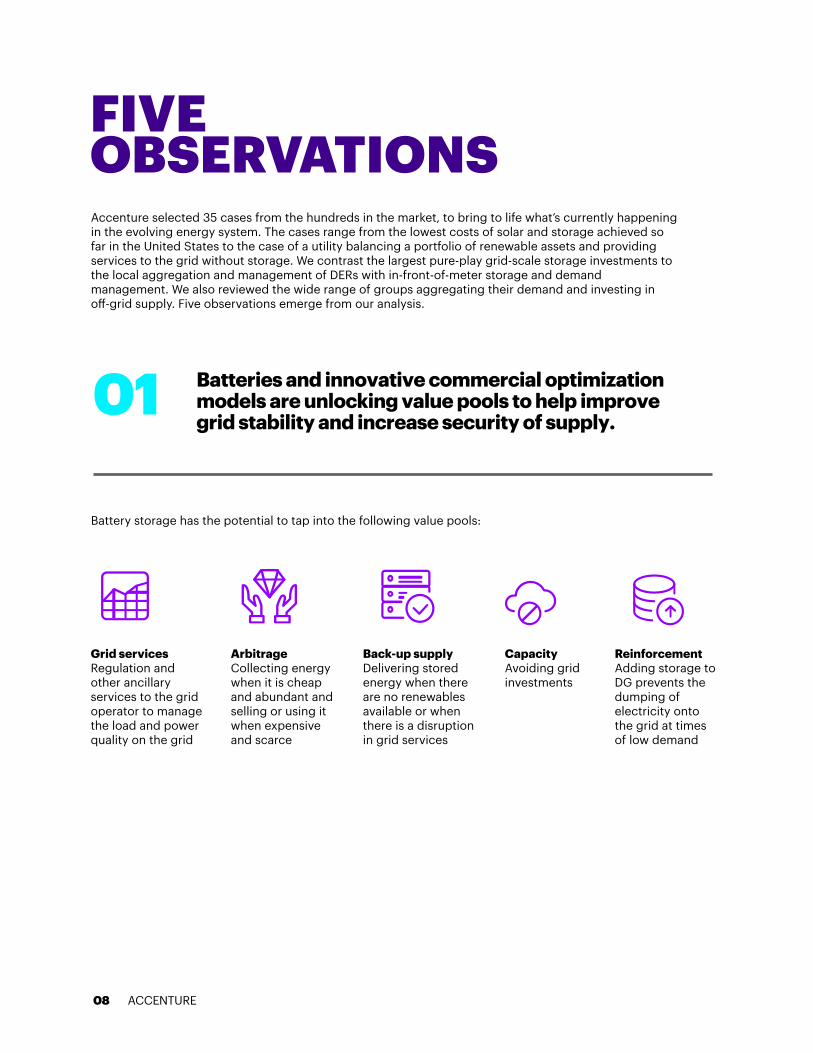
Battery storage has the potential to tap into the following value pools:
Grid servicesRegulation and other ancillary services to the grid operator to manage the load and power quality on the grid
ArbitrageCollecting energy when it is cheap and abundant and selling or using it when expensive and scarce
Back-up supplyDelivering stored energy when there are no renewables available or when there is a disruption in grid services
Capacity Avoiding grid investments
ReinforcementAdding storage to DG prevents the dumping of electricity onto the grid at times of low demand
01 Batteries and innovative commercial optimization models are unlocking value pools to help improve grid stability and increase security of supply.
08 ACCENTURE
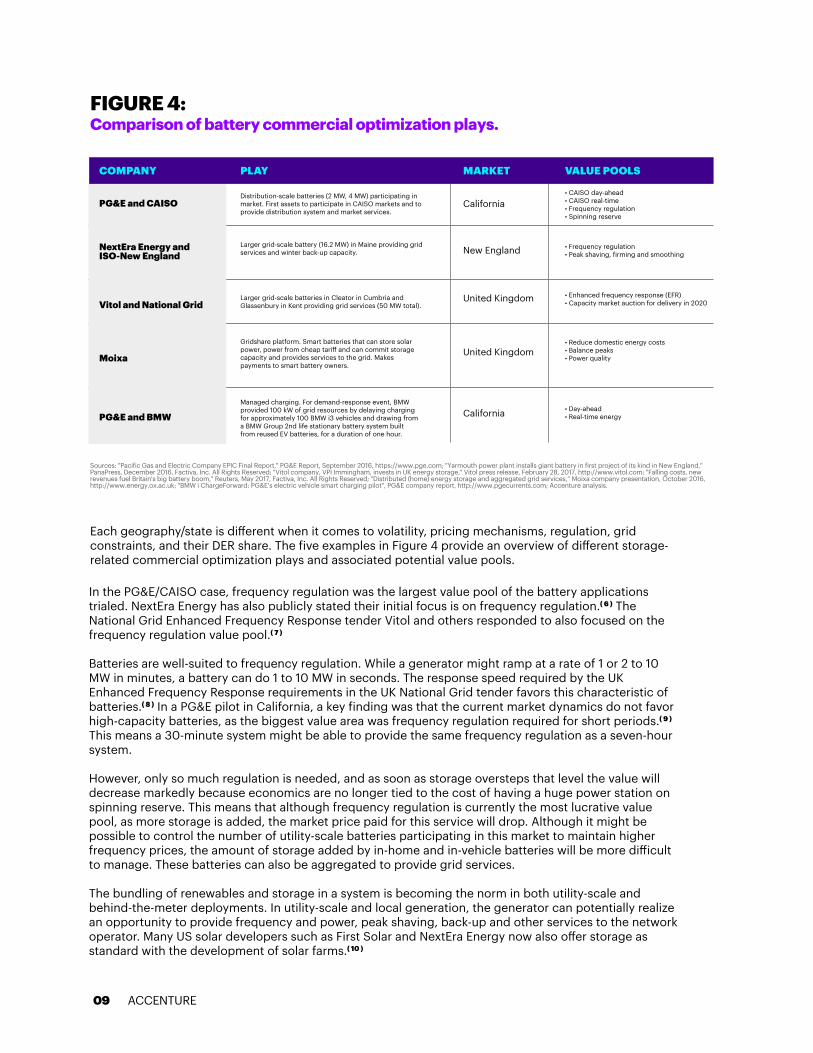
FIGURE 4: Comparison of battery commercial optimization plays.
Sources: "Pacific Gas and Electric Company EPIC Final Report," PG&E Report, September 2016, https://www.pge.com; "Yarmouth power plant installs giant battery in first project of its kind in New England," PanaPress, December 2016, Factiva, Inc. All Rights Reserved; "Vitol company, VPI Immingham, invests in UK energy storage," Vitol press release, February 28, 2017, http://www.vitol.com; "Falling costs, new revenues fuel Britain's big battery boom," Reuters, May 2017, Factiva, Inc. All Rights Reserved; "Distributed (home) energy storage and aggregated grid services,” Moixa company presentation, October 2016, http://www.energy.ox.ac.uk; "BMW i ChargeForward: PG&E’s electric vehicle smart charging pilot", PG&E company report, http://www.pgecurrents.com; Accenture analysis.
In the PG&E/CAISO case, frequency regulation was the largest value pool of the battery applications trialed. NextEra Energy has also publicly stated their initial focus is on frequency regulation.( 6 ) The National Grid Enhanced Frequency Response tender Vitol and others responded to also focused on the frequency regulation value pool.( 7 )
Batteries are well-suited to frequency regulation. While a generator might ramp at a rate of 1 or 2 to 10 MW in minutes, a battery can do 1 to 10 MW in seconds. The response speed required by the UK Enhanced Frequency Response requirements in the UK National Grid tender favors this characteristic of batteries.( 8 ) In a PG&E pilot in California, a key finding was that the current market dynamics do not favor high-capacity batteries, as the biggest value area was frequency regulation required for short periods.( 9 ) This means a 30-minute system might be able to provide the same frequency regulation as a seven-hour system.
However, only so much regulation is needed, and as soon as storage oversteps that level the value will decrease markedly because economics are no longer tied to the cost of having a huge power station on spinning reserve. This means that although frequency regulation is currently the most lucrative value pool, as more storage is added, the market price paid for this service will drop. Although it might be possible to control the number of utility-scale batteries participating in this market to maintain higher frequency prices, the amount of storage added by in-home and in-vehicle batteries will be more di�icult to manage. These batteries can also be aggregated to provide grid services. The bundling of renewables and storage in a system is becoming the norm in both utility-scale and behind-the-meter deployments. In utility-scale and local generation, the generator can potentially realize an opportunity to provide frequency and power, peak shaving, back-up and other services to the network operator. Many US solar developers such as First Solar and NextEra Energy now also o�er storage as standard with the development of solar farms.( 10 )
Each geography/state is di�erent when it comes to volatility, pricing mechanisms, regulation, grid constraints, and their DER share. The five examples in Figure 4 provide an overview of di�erent storage-related commercial optimization plays and associated potential value pools.
09
Distribution-scale batteries (2 MW, 4 MW) participating in market. First assets to participate in CAISO markets and to provide distribution system and market services.
• CAISO day-ahead• CAISO real-time• Frequency regulation• Spinning reserve
• Reduce domestic energy costs• Balance peaks• Power quality
• Day-ahead• Real-time energy
• Enhanced frequency response (EFR)• Capacity market auction for delivery in 2020
• Frequency regulation• Peak shaving, firming and smoothing
California
California
New England
United Kingdom
United KingdomGridshare platform. Smart batteries that can store solar power, power from cheap tari� and can commit storage capacity and provides services to the grid. Makes payments to smart battery owners.
Managed charging. For demand-response event, BMW provided 100 kW of grid resources by delaying charging for approximately 100 BMW i3 vehicles and drawing from a BMW Group 2nd life stationary battery system built from reused EV batteries, for a duration of one hour.
Larger grid-scale batteries in Cleator in Cumbria and Glassenbury in Kent providing grid services (50 MW total).
Larger grid-scale battery (16.2 MW) in Maine providing grid services and winter back-up capacity.
COMPANY PLAY MARKET VALUE POOLS
PG&E and CAISO
NextEra Energy and ISO-New England
PG&E and BMW
Vitol and National Grid
Moixa
ACCENTURE

ACCENTURE
Some markets are developing regulation and market structures that support the move to batteries supporting the grid. For example, in the United Kingdom, 61 out of 64 sites prequalified for the Enhanced Frequency Response tender were battery solutions. In response to the tender, new entrants such as Low Carbon/Vitol will provide National Grid with enhanced frequency response (EFR) services using batteries. So will wind generators like Vattenfall, which will add a battery to one of the largest wind farms in Wales, and other utilities that added batteries to their combined cycle gas turbine (CCGT) (EDF Renewables) or biomass plant (E.ON).( 11 ) In California, the creation of the non-generation resource (NGR) market model was created specifically for limited energy storage resources (LESRs) such as batteries. For example, in the NGR market model, batteries participate directly in the wholesale market; state of charge (SOC) is a day-ahead bid parameter, and accommodations are made for the fact that batteries are both market and distribution assets.( 12 ) The market regulation change to allow batteries to participate directly in these markets will increase the number of new third parties entering the market and that can act as aggregators.
An important consideration is that in absolute size, the market for grid services in any single market is not very large—it can be measured is MW rather than GW. The di�erent models emerging to manage flexibility will compete for the same value pools of arbitrage, grid services and small-scale back-up activities. However, as renewables become an increasingly large proportion of the generation portfolio, it will be expected that the demand for ancillary services will grow, including the addition of new services such as synthetic inertia. Generators that have wind portfolios (with and without storage) can optimize and provide grid services and flexibility. Islanding away from the grid, aggregating demand and generating supply locally to balance supply and demand for a community, industrial park, city or any type of “island” results in reduced volatility and volume of demand making it to the grid. At the point of demand, behind-the-meter storage, demand management and managed charging can reduce the interaction and electricity needed from the grid, provide local small-scale back-up capacity, and provide the opportunity to provide grid services and for arbitrage, charging when prices are low and discharging when prices are high. In fact, if electrification of transport grows as fast as some forecast, grid services could be provided primarily from vehicles, as the size of a vehicle battery is usually bigger than an in-home battery.
Market structures are adapting to include batteries that will provide grid services and short-term back-up capacity. The value pool for grid services will become more competitive as the number of new entrants grows and as battery capacity increases. The total capacity needed for these services in markets is in MW versus GW and, in some markets, in-home or in-vehicle batteries would be su�icient to meet the services required by the grid. Batteries will also change the investment profile of the grid, providing another, lower-cost option to reinforce sections of the grid. The attempt to manage flexibility at the point of demand or supply and to reduce the dependence on the grid will impact the viability of standalone battery plays as competing plays target the same value pools.
IN SUMMARY
10
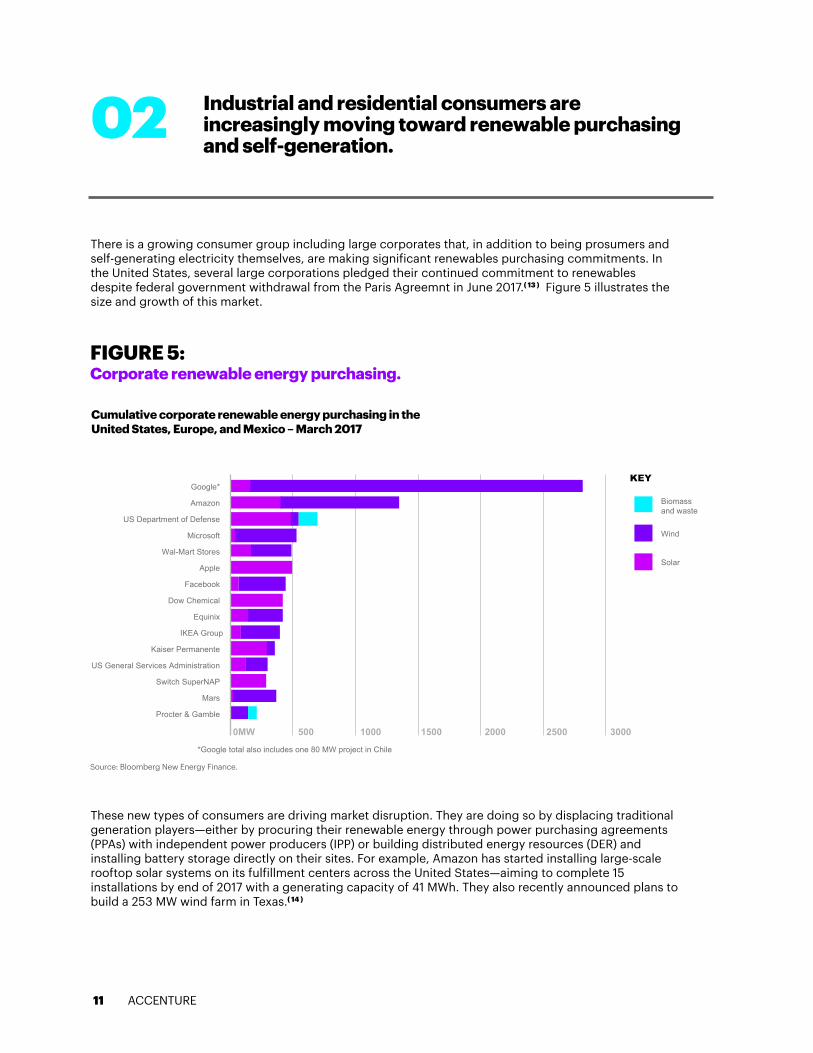
There is a growing consumer group including large corporates that, in addition to being prosumers and self-generating electricity themselves, are making significant renewables purchasing commitments. In the United States, several large corporations pledged their continued commitment to renewables despite federal government withdrawal from the Paris Agreemnt in June 2017.( 13 ) Figure 5 illustrates the size and growth of this market.
These new types of consumers are driving market disruption. They are doing so by displacing traditional generation players—either by procuring their renewable energy through power purchasing agreements (PPAs) with independent power producers (IPP) or building distributed energy resources (DER) and installing battery storage directly on their sites. For example, Amazon has started installing large-scale rooftop solar systems on its fulfillment centers across the United States—aiming to complete 15 installations by end of 2017 with a generating capacity of 41 MWh. They also recently announced plans to build a 253 MW wind farm in Texas.( 14 )
02 Industrial and residential consumers are increasingly moving toward renewable purchasing and self-generation.
11
FIGURE 5: Corporate renewable energy purchasing.
Source: Bloomberg New Energy Finance.
Cumulative corporate renewable energy purchasing in the United States, Europe, and Mexico – March 2017
KEY
Wind
Biomassand waste
Solar
0MW 500 1000 1500 2000 2500 3000
Google*
*Google total also includes one 80 MW project in Chile
Amazon
US Department of Defense
Microsoft
Wal-Mart Stores
Dow Chemical
Equinix
IKEA Group
Kaiser Permanente
US General Services Administration
Switch SuperNAP
Procter & Gamble
Mars
Apple
ACCENTURE
ACCENTURE12
We see three main groups that will accelerate the market transformation:
• Large corporates that will produce some of their own energy but, more importantly, are driving increased renewable generation through their PPAs and public renewables targets.
• Residential prosumers who want lower energy costs or back-up capacity and are happy for the solution to be developed and managed by traditional utilities or new entrants.
• A group of consumers who are looking to maximize self-su�iciency from the grid, either because of costs or energy security or because of the desire to control the mix of fuel they consume.
IN SUMMARY
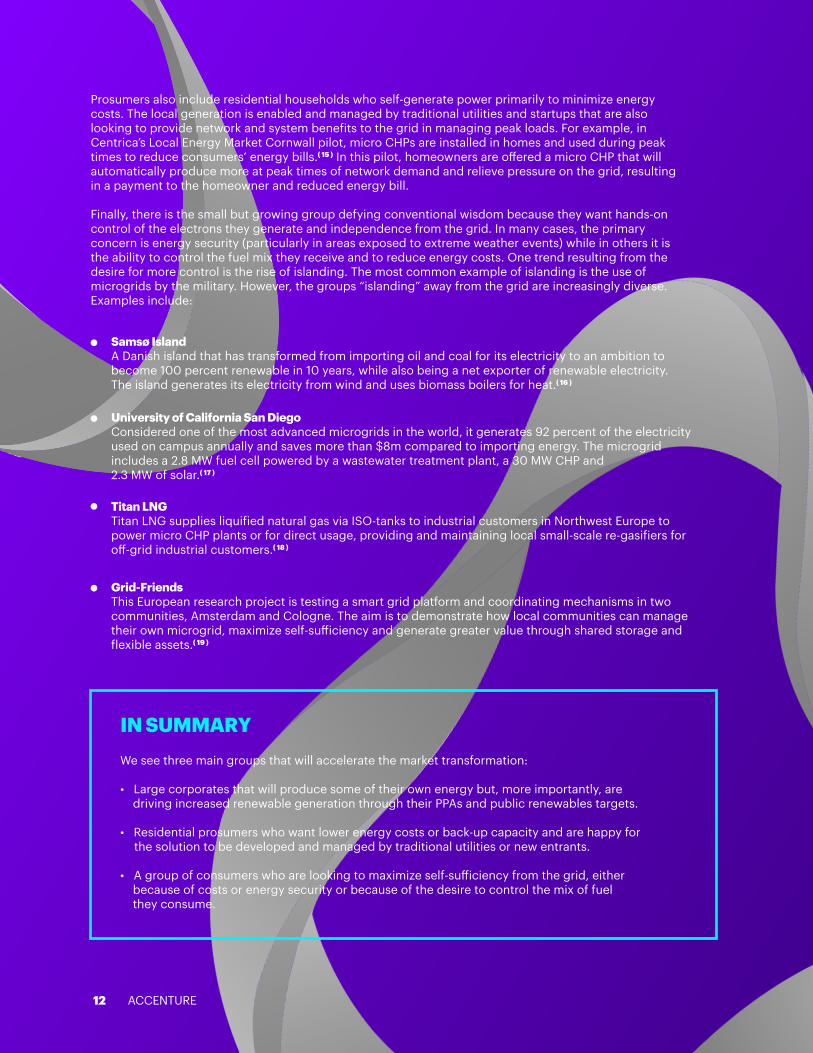
Prosumers also include residential households who self-generate power primarily to minimize energy costs. The local generation is enabled and managed by traditional utilities and startups that are also looking to provide network and system benefits to the grid in managing peak loads. For example, in Centrica’s Local Energy Market Cornwall pilot, micro CHPs are installed in homes and used during peak times to reduce consumers’ energy bills.( 15 ) In this pilot, homeowners are o�ered a micro CHP that will automatically produce more at peak times of network demand and relieve pressure on the grid, resulting in a payment to the homeowner and reduced energy bill. Finally, there is the small but growing group defying conventional wisdom because they want hands-on control of the electrons they generate and independence from the grid. In many cases, the primary concern is energy security (particularly in areas exposed to extreme weather events) while in others it is the ability to control the fuel mix they receive and to reduce energy costs. One trend resulting from the desire for more control is the rise of islanding. The most common example of islanding is the use of microgrids by the military. However, the groups “islanding” away from the grid are increasingly diverse. Examples include:
Samsø IslandA Danish island that has transformed from importing oil and coal for its electricity to an ambition to become 100 percent renewable in 10 years, while also being a net exporter of renewable electricity.The island generates its electricity from wind and uses biomass boilers for heat.( 16 )
Titan LNG Titan LNG supplies liquified natural gas via ISO-tanks to industrial customers in Northwest Europe to power micro CHP plants or for direct usage, providing and maintaining local small-scale re-gasifiers for o�-grid industrial customers.( 18 )
University of California San DiegoConsidered one of the most advanced microgrids in the world, it generates 92 percent of the electricity used on campus annually and saves more than $8m compared to importing energy. The microgrid includes a 2.8 MW fuel cell powered by a wastewater treatment plant, a 30 MW CHP and 2.3 MW of solar.( 17 )
Grid-FriendsThis European research project is testing a smart grid platform and coordinating mechanisms in two communities, Amsterdam and Cologne. The aim is to demonstrate how local communities can manage their own microgrid, maximize self-su�iciency and generate greater value through shared storage and flexible assets.( 19 )
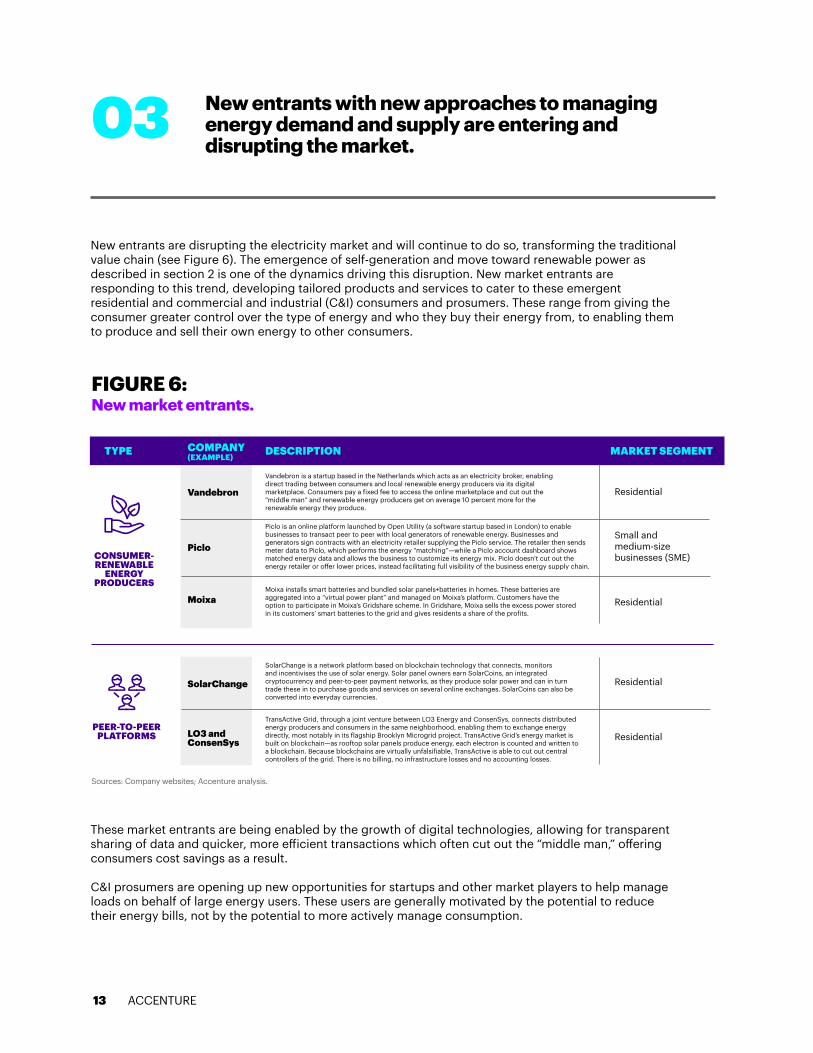
New entrants are disrupting the electricity market and will continue to do so, transforming the traditional value chain (see Figure 6). The emergence of self-generation and move toward renewable power as described in section 2 is one of the dynamics driving this disruption. New market entrants are responding to this trend, developing tailored products and services to cater to these emergent residential and commercial and industrial (C&I) consumers and prosumers. These range from giving the consumer greater control over the type of energy and who they buy their energy from, to enabling them to produce and sell their own energy to other consumers.
These market entrants are being enabled by the growth of digital technologies, allowing for transparent sharing of data and quicker, more e�icient transactions which often cut out the “middle man,” o�ering consumers cost savings as a result.
C&I prosumers are opening up new opportunities for startups and other market players to help manage loads on behalf of large energy users. These users are generally motivated by the potential to reduce their energy bills, not by the potential to more actively manage consumption.
03 New entrants with new approaches to managingenergy demand and supply are entering and disrupting the market.
FIGURE 6: New market entrants.
Sources: Company websites; Accenture analysis.
13
Vandebron is a startup based in the Netherlands which acts as an electricity broker, enabling direct trading between consumers and local renewable energy producers via its digital marketplace. Consumers pay a fixed fee to access the online marketplace and cut out the “middle man” and renewable energy producers get on average 10 percent more for the renewable energy they produce.
SolarChange is a network platform based on blockchain technology that connects, monitors and incentivises the use of solar energy. Solar panel owners earn SolarCoins, an integrated cryptocurrency and peer-to-peer payment networks, as they produce solar power and can in turn trade these in to purchase goods and services on several online exchanges. SolarCoins can also be converted into everyday currencies.
TransActive Grid, through a joint venture between LO3 Energy and ConsenSys, connects distributed energy producers and consumers in the same neighborhood, enabling them to exchange energy directly, most notably in its flagship Brooklyn Microgrid project. TransActive Grid’s energy market is built on blockchain—as rooftop solar panels produce energy, each electron is counted and written to a blockchain. Because blockchains are virtually unfalsifiable, TransActive is able to cut out central controllers of the grid. There is no billing, no infrastructure losses and no accounting losses.
Piclo is an online platform launched by Open Utility (a software startup based in London) to enable businesses to transact peer to peer with local generators of renewable energy. Businesses and generators sign contracts with an electricity retailer supplying the Piclo service. The retailer then sends meter data to Piclo, which performs the energy “matching”—while a Piclo account dashboard shows matched energy data and allows the business to customize its energy mix. Piclo doesn’t cut out the energy retailer or o�er lower prices, instead facilitating full visibility of the business energy supply chain.
Moixa installs smart batteries and bundled solar panels+batteries in homes. These batteries are aggregated into a “virtual power plant” and managed on Moixa’s platform. Customers have the option to participate in Moixa’s Gridshare scheme. In Gridshare, Moixa sells the excess power stored in its customers’ smart batteries to the grid and gives residents a share of the profits.
TYPE DESCRIPTION MARKET SEGMENTCOMPANY (EXAMPLE)
Vandebron
SolarChange
LO3 and ConsenSys
Piclo
Moixa
CONSUMER-RENEWABLE
ENERGY PRODUCERS
PEER-TO-PEERPLATFORMS
Residential
Small and medium-size businesses (SME)
Residential
Residential
Residential
ACCENTURE
Endeco Technologies is one of the aggregators emerging in response to this trend, acting as an intermediary between these large energy users and the grid operators and is using its technology platform to create a virtual power plant.( 20 )
Residential prosumers are also uncovering opportunities for new entrants. For example, Moixa’s main value proposition for its smart storage and smart solar+storage products is a reduction in energy bills by reducing grid demand when prices are high. In one of Moixa’s projects, project ERIC (Energy Resources for Integrated Communities),( 21 ) Moixa installed 2 kWh smart batteries in 82 homes and a primary school and an 8 kWh battery stack in a local community center. The batteries are linked to 200 kWp (kilowatt peak) of solar photovoltaic (PV) panels on the homes and a further 100 kWp of solar on the school and community center, creating a virtual smart local energy grid.
Increased electrification is also bringing new entrants into the market, with the electrification of transport driving the most disruption. EVs have seen dramatic growth over the past few years and, propelled by a slew of government and OEM commitments, their rise doesn’t appear to be slowing. BNEF estimates that EVs will account for 13 percent and 12 percent of electricity demand in Europe and the United States, respectively, by 2040.( 22 ) This is having an immense impact on the traditional electricity value chain. DNOs are faced with both the challenge of managing the charging impact on their networks and the potential opportunity for thousands of distributed storage units to help balance supply and demand. Suppliers are also faced with the threat of OEMs moving downstream by o�ering their customers bundled auto and energy management services. One example is the digital charging service BMW is piloting in the Netherlands and Germany.( 23 ) The service automatically and autonomously charges customers’ EVs to capture the lowest rates. When combined with owners’ rooftop solar, the software predicts generation based on weather forecasts to establish an optimum charging plan and marks a move for the vehicle manufacturer into value-add energy management services, previously the domain of specialized companies or energy utilities.
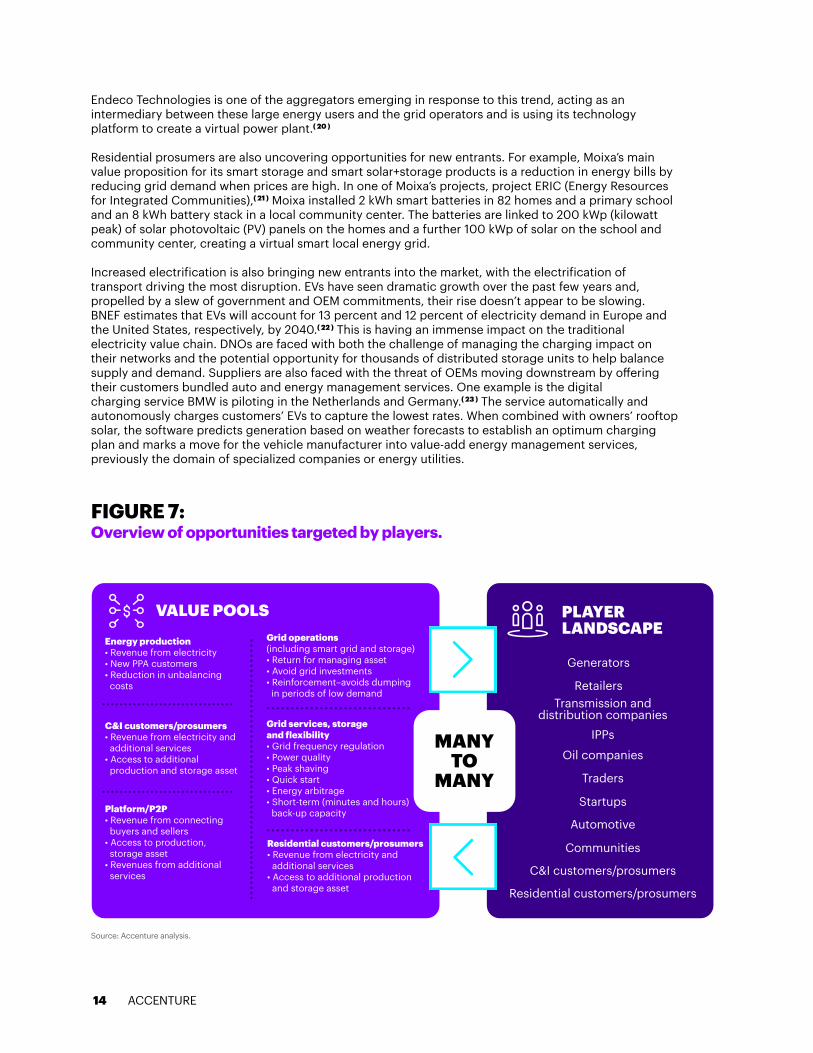
Energy production• Revenue from electricity• New PPA customers• Reduction in unbalancingcosts
Residential customers/prosumers• Revenue from electricity and
additional services• Access to additional production
and storage asset
Grid operations �(including smart grid and storage)• Return for managing asset• Avoid grid investments• Reinforcement–avoids dumping
in periods of low demand
Grid services, storage and flexibility• Grid frequency regulation• Power quality• Peak shaving• Quick start• Energy arbitrage• Short-term (minutes and hours) back-up capacity
C&I customers/prosumers• Revenue from electricity andadditional services
• Access to additionalproduction and storage asset
Platform/P2P• Revenue from connectingbuyers and sellers
• Access to production, storage asset
• Revenues from additionalservices
VALUE POOLS
14
FIGURE 7: Overview of opportunities targeted by players.
Source: Accenture analysis.
PLAYER LANDSCAPE
Generators
RetailersTransmission and
distribution companiesIPPs
Oil companies
Traders
Startups
Automotive
Communities
C&I customers/prosumers
Residential customers/prosumers
MANYTO
MANY
ACCENTURE

ACCENTURE
Faced with disruption across the value chain, utilities are looking for new ways to respond. This is resulting in the creation of new products and services as well as new partnerships and investments. For example, E.ON is partnering with Google to roll out Sunroof, a site for calculating the solar potential of buildings in Germany. The platform utilizes Google Earth, Google Maps and machine learning to precisely determine a home’s potential solar capacity and generate plans for the installation of a solar system.( 24 ) ENGIE is taking a di�erent approach, investing more than €65 million of venture capital funding in new energy startups through ENGIE New Ventures.( 25 ) This is enabling ENGIE to power its vision to lead the energy transition, learning from and partnering with new energy startups as they test emerging technologies and business models. ESB in Ireland has a similar venture capital fund called Novusmodus, which has invested in a range of energy startups including Endeco Technologies.( 26 )
Both new market entrants and existing players are testing these various business and partnership models in an attempt to capture a series of emerging value pools ranging from revenue from renewable generation to a broad degree of system services (see Figure 7). Their relative successes will shape the future player landscape and cause potential significant disruption to the traditional electricity value chain.
15
Startups, enabled by digital, are entering the market to capture value from the growing prosumer market and o�er services enabling more active energy management. C&Is’ drive to increase renewables in their energy consumption are taking market share from traditional generators. Electrification of transport is bringing automotive players into the market to provide retail and grid services. These players are all disrupting the traditional electricity market. In response, utilities are introducing new products and services and developing new partnerships and investments to transform their operating models. As they do so, they will need to take care in where they invest, distinguishing between those markets with true growth potential and those that require further testing.
IN SUMMARY
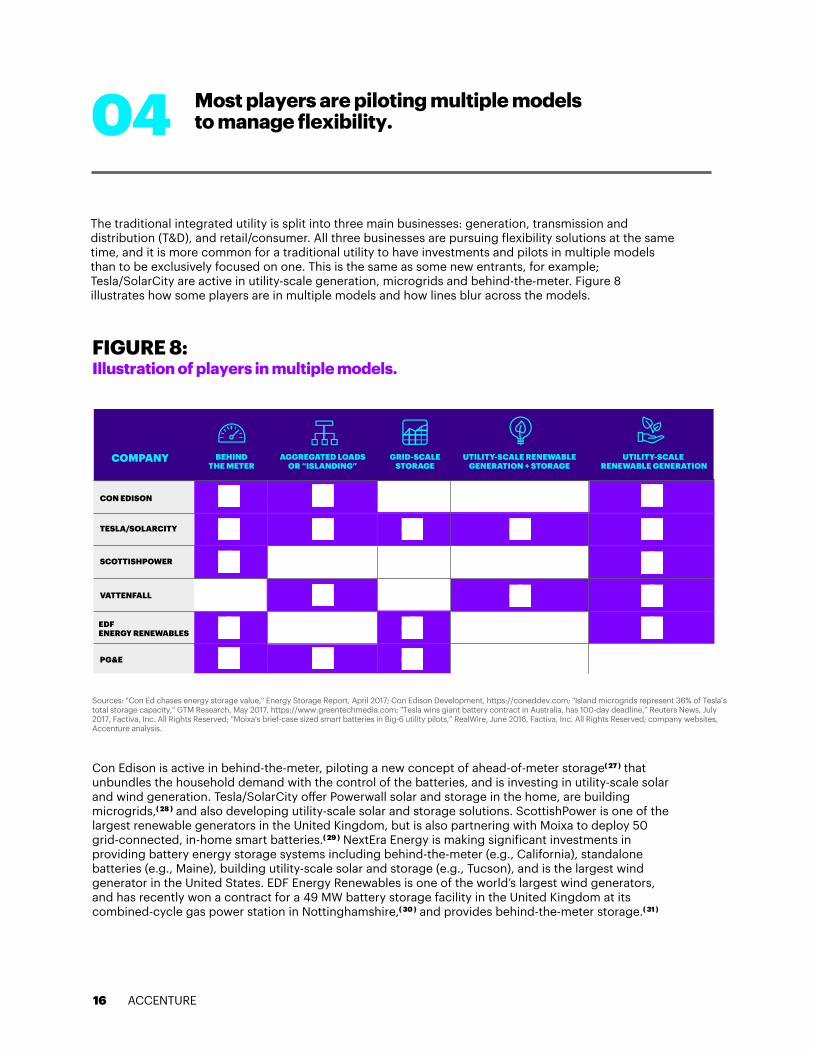
The traditional integrated utility is split into three main businesses: generation, transmission and distribution (T&D), and retail/consumer. All three businesses are pursuing flexibility solutions at the same time, and it is more common for a traditional utility to have investments and pilots in multiple models than to be exclusively focused on one. This is the same as some new entrants, for example; Tesla/SolarCity are active in utility-scale generation, microgrids and behind-the-meter. Figure 8 illustrates how some players are in multiple models and how lines blur across the models.
Con Edison is active in behind-the-meter, piloting a new concept of ahead-of-meter storage( 27 ) that unbundles the household demand with the control of the batteries, and is investing in utility-scale solar and wind generation. Tesla/SolarCity o�er Powerwall solar and storage in the home, are building microgrids,( 28 ) and also developing utility-scale solar and storage solutions. ScottishPower is one of the largest renewable generators in the United Kingdom, but is also partnering with Moixa to deploy 50 grid-connected, in-home smart batteries.( 29 ) NextEra Energy is making significant investments in providing battery energy storage systems including behind-the-meter (e.g., California), standalone batteries (e.g., Maine), building utility-scale solar and storage (e.g., Tucson), and is the largest wind generator in the United States. EDF Energy Renewables is one of the world’s largest wind generators, and has recently won a contract for a 49 MW battery storage facility in the United Kingdom at its combined-cycle gas power station in Nottinghamshire,( 30 ) and provides behind-the-meter storage.( 31 )
FIGURE 8: Illustration of players in multiple models.
Sources: "Con Ed chases energy storage value," Energy Storage Report, April 2017; Con Edison Development, https://coneddev.com; "Island microgrids represent 36% of Tesla’s total storage capacity," GTM Research, May 2017, https://www.greentechmedia.com; "Tesla wins giant battery contract in Australia, has 100-day deadline,” Reuters News, July 2017, Factiva, Inc. All Rights Reserved; "Moixa's brief-case sized smart batteries in Big-6 utility pilots,” RealWire, June 2016, Factiva, Inc. All Rights Reserved; company websites, Accenture analysis.
04 Most players are piloting multiple modelsto manage flexibility.
16
CON EDISON
TESLA/SOLARCITY
SCOTTISHPOWER
VATTENFALL
EDF ENERGY RENEWABLES
PG&E
COMPANY BEHIND THE METER
AGGREGATED LOADSOR “ISLANDING”
GRID-SCALESTORAGE
UTILITY-SCALE RENEWABLEGENERATION + STORAGE
UTILITY-SCALE RENEWABLE GENERATION
ACCENTURE
ACCENTURE
Wind and solar generators will increasingly incorporate pooling of assets optimized with digital technologies, smart inverters for solar and large-scale storage in their projects, thus making utility-scale renewables more dispatchable. The most uncertainty is on the demand side, given the di�erent demand profiles of households and industrials, EV growth and the diversity of options as to where and how to aggregate.
IN SUMMARY
On the face of it, there is so much activity that it is di�icult to distinguish a pilot-testing of a concept from the implementation of a clear strategy. Given the relative immaturity of the various markets, incumbents and new market entrants are continuously innovating, experimenting and learning. Most utilities are putting their eggs into multiple baskets, trying to assess which technologies and services will scale before they make a big bet. The resulting evolving energy system framework is at a point in time and will continue to evolve.
This picture further di�ers by market, with the balance of investment and activities varying based on the legacy infrastructure, the scale of DER, energy security concerns and the scale of the local prosumer movement. Despite these variances, there are two themes emerging:
17
Utility-scale renewables and storageA large-scale generator can maximize its profit and improve grid flexibility by bundling storage with renewables. This is becoming a more common model, with more utility-scale storage being built near wind or as part of a solar+storage solution.
Small-scale batteriesWhether these are smart in-home batteries that are aggregated, distribution-scale batteries that are shared by multiple sites, or in-vehicle batteries used in vehicle-to-grid, small-scale batteries will play a role in improving grid flexibility.
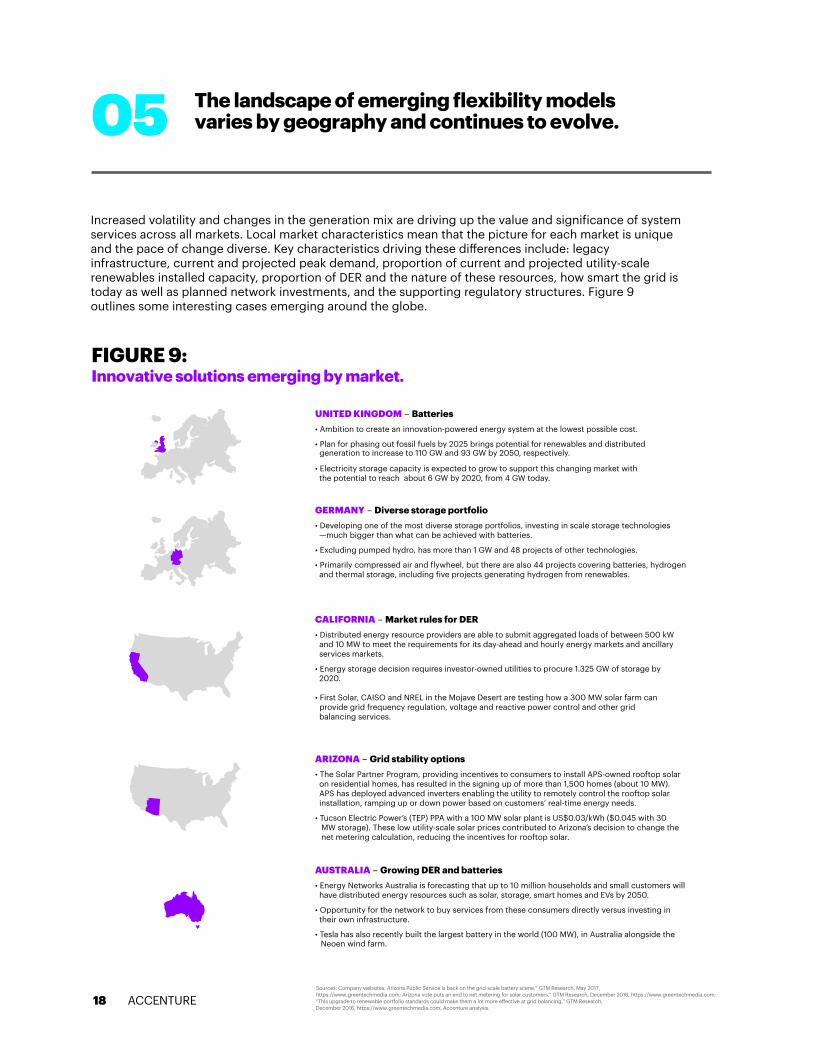
FIGURE 9: Innovative solutions emerging by market.
Sources: Company websites; Arizona Public Service is back on the grid-scale battery scene,” GTM Research, May 2017, https://www.greentechmedia.com; Arizona vote puts an end to net metering for solar customers,” GTM Research, December 2016, https://www.greentechmedia.com; “This upgrade to renewable portfolio standards could make them a lot more e�ective at grid balancing,” GTM Research, December 2016, https://www.greentechmedia.com; Accenture analysis.
05 The landscape of emerging flexibility modelsvaries by geography and continues to evolve.
Increased volatility and changes in the generation mix are driving up the value and significance of system services across all markets. Local market characteristics mean that the picture for each market is unique and the pace of change diverse. Key characteristics driving these di�erences include: legacy infrastructure, current and projected peak demand, proportion of current and projected utility-scale renewables installed capacity, proportion of DER and the nature of these resources, how smart the grid is today as well as planned network investments, and the supporting regulatory structures. Figure 9 outlines some interesting cases emerging around the globe.
18
CALIFORNIA – Market rules for DER • Distributed energy resource providers are able to submit aggregated loads of between 500 kWand 10 MW to meet the requirements for its day-ahead and hourly energy markets and ancillaryservices markets.
• Energy storage decision requires investor-owned utilities to procure 1.325 GW of storage by2020.
• First Solar, CAISO and NREL in the Mojave Desert are testing how a 300 MW solar farm canprovide grid frequency regulation, voltage and reactive power control and other gridbalancing services.
ARIZONA – Grid stability options• The Solar Partner Program, providing incentives to consumers to install APS-owned rooftop solaron residential homes, has resulted in the signing up of more than 1,500 homes (about 10 MW).APS has deployed advanced inverters enabling the utility to remotely control the rooftop solarinstallation, ramping up or down power based on customers’ real-time energy needs.
• Tucson Electric Power’s (TEP) PPA with a 100 MW solar plant is US$0.03/kWh ($0.045 with 30MW storage). These low utility-scale solar prices contributed to Arizona’s decision to change thenet metering calculation, reducing the incentives for rooftop solar.
Neoen wind farm.
generation to increase to 110 GW and 93 GW by 2050, respectively.
UNITED KINGDOM – Batteries• Ambition to create an innovation-powered energy system at the lowest possible cost.
• Plan for phasing out fossil fuels by 2025 brings potential for renewables and distributed
• Electricity storage capacity is expected to grow to support this changing market with the potential to reach about 6 GW by 2020, from 4 GW today.
GERMANY – Diverse storage portfolio• Developing one of the most diverse storage portfolios, investing in scale storage technologies—much bigger than what can be achieved with batteries.
• Excluding pumped hydro, has more than 1 GW and 48 projects of other technologies.
• Primarily compressed air and flywheel, but there are also 44 projects covering batteries, hydrogenand thermal storage, including five projects generating hydrogen from renewables.
AUSTRALIA – Growing DER and batteries• Energy Networks Australia is forecasting that up to 10 million households and small customers willhave distributed energy resources such as solar, storage, smart homes and EVs by 2050.
• Opportunity for the network to buy services from these consumers directly versus investing intheir own infrastructure.
• Tesla has also recently built the largest battery in the world (100 MW), in Australia alongside the
ACCENTURE
Another example is Germany. With 7.6 GW of storage and 76 projects, Germany has one of the most diverse storage portfolios, investing in scale storage technologies—much larger than what can be achieved with batteries.( 35 ) Although pumped hydro makes up almost 86 percent of the storage, there is over 1 GW and 48 projects of other technologies. More than half of the 1 GW is compressed air storage in two projects, RWE’s Adele ( 36) and E.ON’s Kratwerk Huntof.( 37 ) There is also a large flywheel project.( 38 ) In addition to the three electromechanical storage projects, there are 44 projects covering batteries, hydrogen and thermal storage, including five projects generating hydrogen from renewables.( 39 )
In California, DER seem to have won the battle with CAISO securing federal approval for its new distributed resource provider tari�. This allows DER providers to submit aggregated loads of between 500 kW and 10 MW to meet the requirements for its day-ahead and hourly energy markets as well as its ancillary services markets.( 40 ) We are also seeing storage being connected directly to the distribution grid to support system services. California’s energy storage decision requires investor-owned utilities to procure 1,325 MW of storage by 2020. PG&E is among the utilities with a mandate to procure 580 MW by 2020.( 41 )
With an installed solar capacity of about 3.3 GW,( 43 ) Arizona is exploring multiple options to improve grid stability. The Solar Partner Program, providing incentives to consumers to install APS-owned rooftop solar on residential homes, has resulted in the signing up of more than 1,500 homes (about 10 MW). APS has deployed advanced inverters enabling the utility to remotely control the rooftop solar installation, ramping power up or down based on customers’ real-time energy needs. APS recently installed two 2 MW AES batteries near these homes to support voltage control.( 44 ) Arizona is also home to the lowest-cost solar PPA in the United States. Tucson Electric Power’s (TEP) PPA with a 100 MW solar plant is USD 0.03/kWh (0.045 with 30 MW storage). These low utility-scale solar prices contributed to Arizona’s decision to change the net metering calculation, reducing the incentives for rooftop solar.( 45 ) Another interesting development in Arizona is the recent proposal to implement a clean peak standard (CPS), requiring utilities to meet peak demand with renewable energy resources (supported by battery storage).( 46 )
In the United Kingdom, government incentives are being implemented to promote low-carbon energy and phase out fossil fuels by 2025. This could see renewable generating capacity and installed capacity from distributed generation increase to 110 GW and 93 GW by 2050, respectively. Electricity storage capacity is also expected to grow to support this changing landscape, potentially reaching 6 GW by 2020, from 4 GW today.( 32 ) These trends are driving up the value of ancillary services and forcing National Grid, the organization responsible for balancing the grid, to rethink the way the market is structured.( 33 ) In their “Future of Balancing Services” report, National Grid set out an ambition to create an innovation-powered energy system at the lowest possible cost.( 34) As this market continues to evolve, we are seeing a move away from bilateral contracts to tendered services for the majority of energy-based contracts and an increase in the number of new smaller players and new technologies bidding to provide balancing services to the grid.
However, probably the most interesting project in California is the testing of solar’s ability to improve grid stability without batteries. First Solar, CAISO and NREL in the Mojave Desert are testing how a 300-MW solar farm can provide grid frequency regulation, voltage and reactive power control and other grid balancing services.( 42 )
19 ACCENTURE
ACCENTURE
While by no means a comprehensive overview of all market developments, the highlighted examples provide an indication of the range of models emerging, each shaped by local market characteristics. No market will look the same and in fact the only commonality is likely to be that each comprise a patchwork of solutions, as no single solution will meet the gambit of every market’s flexibility needs. This variety will require players across the landscape to maintain a global view of the various solutions being piloted and implemented while truly understanding and responding to individual market needs.
IN SUMMARY
In Australia, Energy Networks Australia is forecasting that up to 10 million households and small customers will have DER such as solar, storage, smart homes and EVs by 2050. This provides an exciting opportunity for the network to buy services directly from these consumers versus investing in their own infrastructure, potentially leading to AU$16 billion in avoided network infrastructure investment and opening up an AU$2.5 billion per annum market for grid support services by 2050.( 47 ) In an attempt to begin capturing some of this opportunity, the Australian Renewable Energy Agency (ARENA) is providing AU$450,000 in funding to new startup, GreenSync, to test its decentralized energy exchange (deX) project, which would support homes and businesses to optimize the value they get out of their PV and battery systems, providing these as a service to the grid.( 48 ) Australia is now also home to the biggest lithium ion battery in the world providing grid services.( 49 )
20
KEY
Decreases volatility
Increases volatility
Mixed impact on volatility
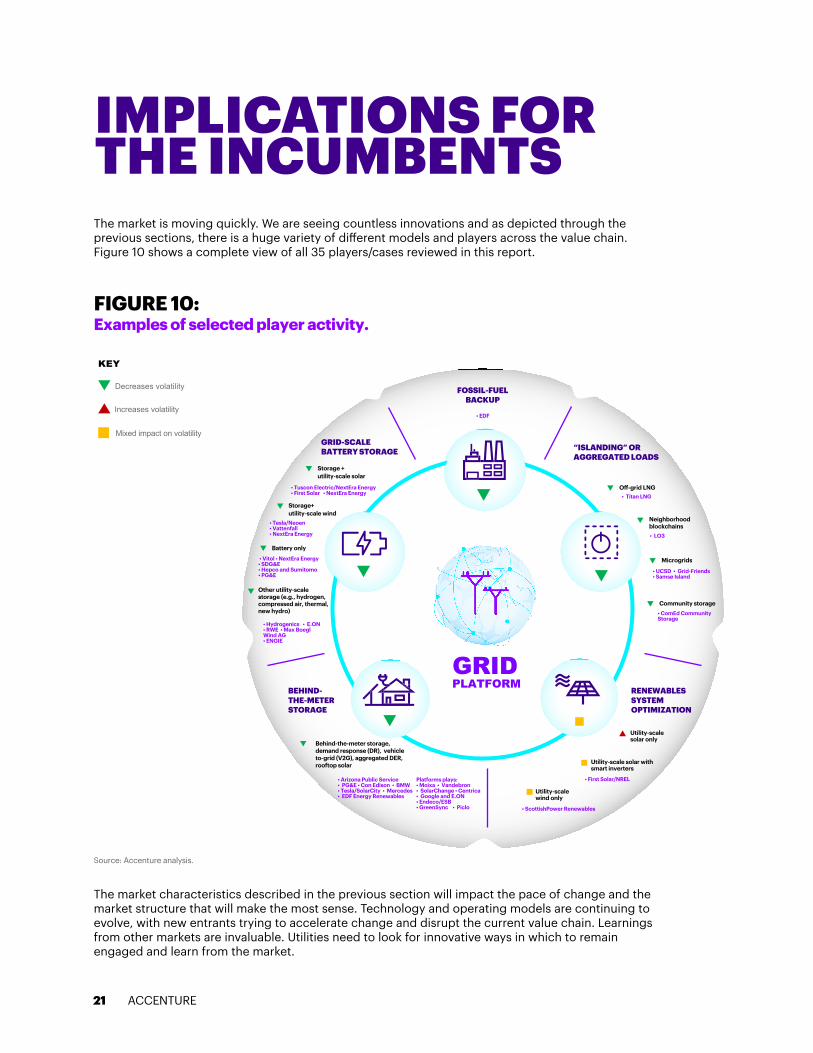
FIGURE 10: Examples of selected player activity.
Source: Accenture analysis.
IMPLICATIONS FOR THE INCUMBENTS The market is moving quickly. We are seeing countless innovations and as depicted through the previous sections, there is a huge variety of di�erent models and players across the value chain. Figure 10 shows a complete view of all 35 players/cases reviewed in this report.
The market characteristics described in the previous section will impact the pace of change and the market structure that will make the most sense. Technology and operating models are continuing to evolve, with new entrants trying to accelerate change and disrupt the current value chain. Learnings from other markets are invaluable. Utilities need to look for innovative ways in which to remain engaged and learn from the market.
21
• UCSD • Grid-Friends• Samsø Island
• ComEd Community Storage
• Titan LNG
• LO3
• Tesla/Neoen• Vattenfall • NextEra Energy
• Tuscon Electric/NextEra Energy• First Solar • NextEra Energy
• Hydrogenics • E.ON • RWE • Max Boegl Wind AG• ENGIE
• Vitol • NextEra Energy • SDG&E • Hepco and Sumitomo • PG&E
• EDF
• First Solar/NREL
• ScottishPower Renewables
• Arizona Public Service• PG&E • Con Edison • BMW• Tesla/SolarCity • Mercedes • EDF Energy Renewables
Platforms plays:• Moixa • Vandebron • SolarChange • Centrica • Google and E.ON • Endeco/ESB• GreenSync • Piclo
ACCENTURE
Storage + utility-scale solar
Storage+utility-scale wind
O�-grid LNG
Neighborhood blockchains
Microgrids
Community storage
Behind-the-meter storage, demand response (DR), vehicle to-grid (V2G), aggregated DER, rooftop solar
Battery only
Other utility-scale storage (e.g., hydrogen, compressed air, thermal, new hydro)
FOSSIL-FUEL BACKUP
Utility-scale solar only
Utility-scale wind only
Utility-scale solar with smart inverters
“ISLANDING” OR AGGREGATED LOADS
GRID-SCALE BATTERY STORAGE
RENEWABLES SYSTEM OPTIMIZATION
BEHIND-THE-METER STORAGE
GRIDPLATFORM
Track the bigpicture
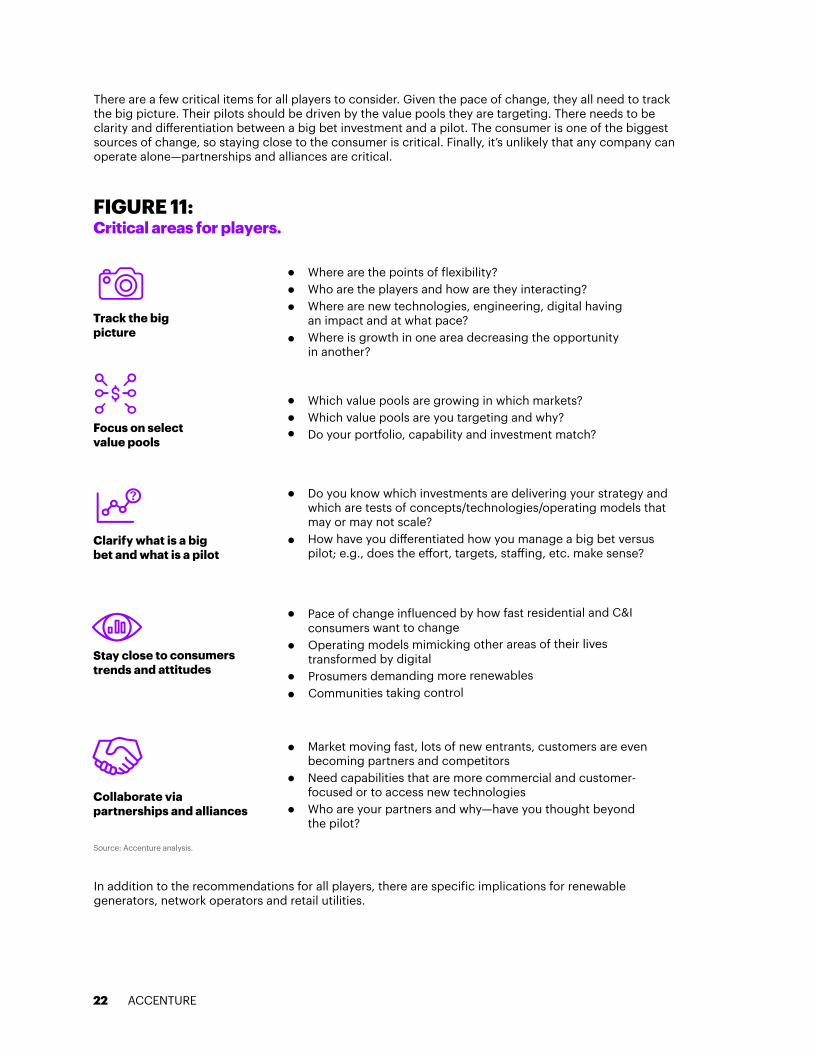
FIGURE 11: Critical areas for players.
Source: Accenture analysis.
Focus on select value pools
Clarify what is a big bet and what is a pilot
Stay close to consumers trends and attitudes
Collaborate via partnerships and alliances
There are a few critical items for all players to consider. Given the pace of change, they all need to track the big picture. Their pilots should be driven by the value pools they are targeting. There needs to be clarity and di�erentiation between a big bet investment and a pilot. The consumer is one of the biggest sources of change, so staying close to the consumer is critical. Finally, it’s unlikely that any company can operate alone—partnerships and alliances are critical.
In addition to the recommendations for all players, there are specific implications for renewable generators, network operators and retail utilities.
22
Where are the points of flexibility? Who are the players and how are they interacting? Where are new technologies, engineering, digital having an impact and at what pace?Where is growth in one area decreasing the opportunity in another?
Which value pools are growing in which markets?Which value pools are you targeting and why?Do your portfolio, capability and investment match?
Do you know which investments are delivering your strategy and which are tests of concepts/technologies/operating models that may or may not scale?How have you di�erentiated how you manage a big bet versus pilot; e.g., does the e�ort, targets, sta�ing, etc. make sense?
Pace of change influenced by how fast residential and C&I consumers want to change Operating models mimicking other areas of their lives transformed by digital Prosumers demanding more renewablesCommunities taking control
Market moving fast, lots of new entrants, customers are even becoming partners and competitorsNeed capabilities that are more commercial and customer- focused or to access new technologies Who are your partners and why—have you thought beyond the pilot?
ACCENTURE
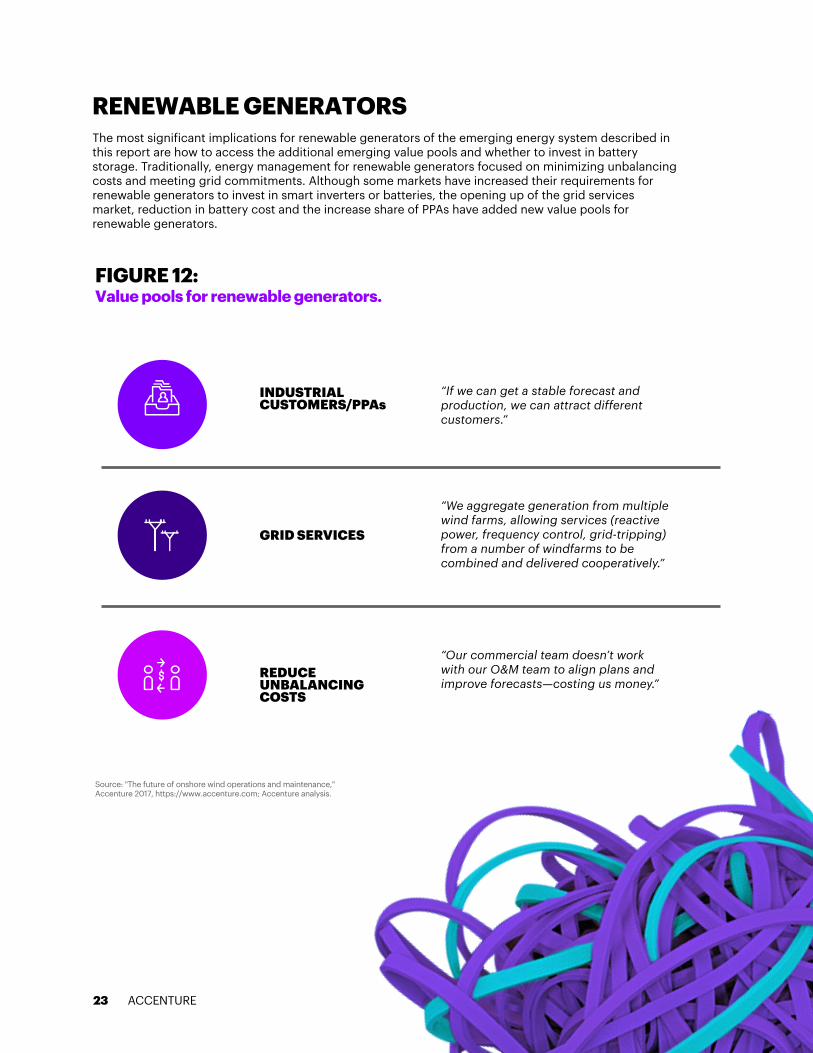
FIGURE 12: Value pools for renewable generators.
Source: "The future of onshore wind operations and maintenance," Accenture 2017, https://www.accenture.com; Accenture analysis.
The most significant implications for renewable generators of the emerging energy system described in this report are how to access the additional emerging value pools and whether to invest in battery storage. Traditionally, energy management for renewable generators focused on minimizing unbalancing costs and meeting grid commitments. Although some markets have increased their requirements for renewable generators to invest in smart inverters or batteries, the opening up of the grid services market, reduction in battery cost and the increase share of PPAs have added new value pools for renewable generators.
23
RENEWABLE GENERATORS
“If we can get a stable forecast and production, we can attract different customers.”
“We aggregate generation from multiple wind farms, allowing services (reactive power, frequency control, grid-tripping) from a number of windfarms to be combined and delivered cooperatively.”
“Our commercial team doesn’t work with our O&M team to align plans and improve forecasts—costing us money.”
INDUSTRIAL CUSTOMERS/PPAs
REDUCEUNBALANCING COSTS
GRID SERVICES
ACCENTURE
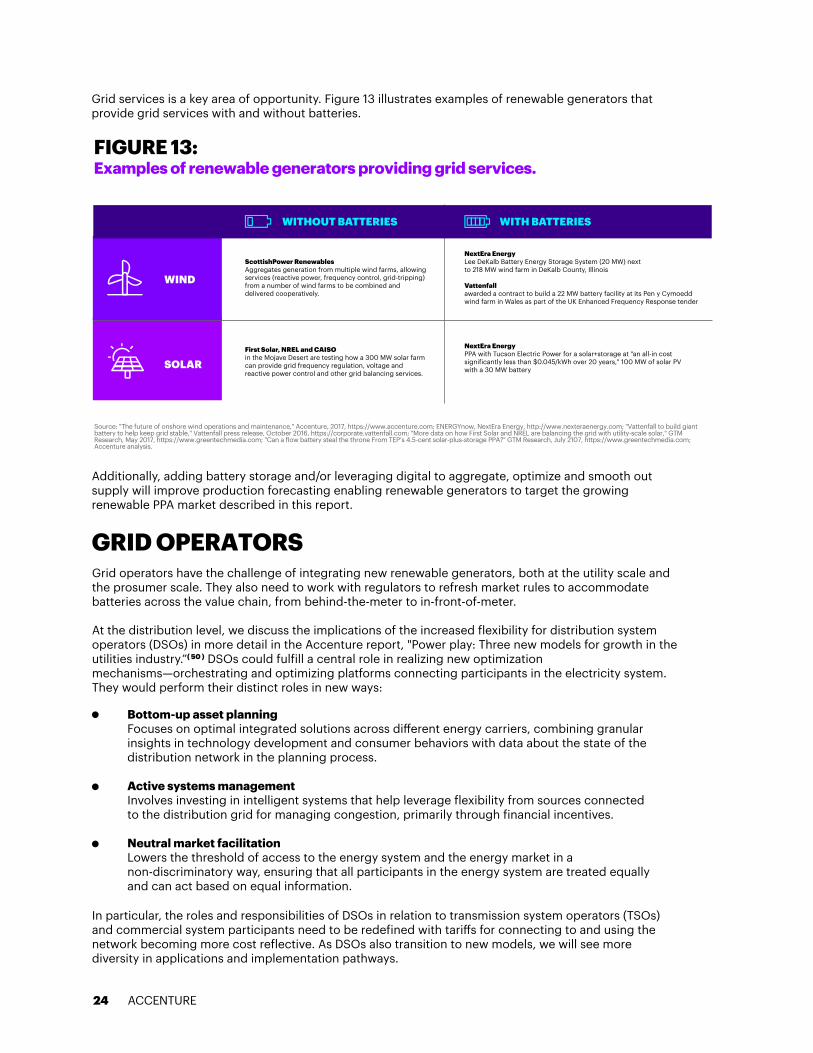
Source: "The future of onshore wind operations and maintenance," Accenture, 2017, https://www.accenture.com; ENERGYnow, NextEra Energy, http://www.nexteraenergy.com; "Vattenfall to build giant battery to help keep grid stable," Vattenfall press release, October 2016, https://corporate.vattenfall.com; "More data on how First Solar and NREL are balancing the grid with utility-scale solar," GTM Research, May 2017, https://www.greentechmedia.com; "Can a flow battery steal the throne From TEP’s 4.5-cent solar-plus-storage PPA?" GTM Research, July 2107, https://www.greentechmedia.com; Accenture analysis.
FIGURE 13: Examples of renewable generators providing grid services.
Additionally, adding battery storage and/or leveraging digital to aggregate, optimize and smooth out supply will improve production forecasting enabling renewable generators to target the growing renewable PPA market described in this report.
Grid services is a key area of opportunity. Figure 13 illustrates examples of renewable generators that provide grid services with and without batteries.
Grid operators have the challenge of integrating new renewable generators, both at the utility scale and the prosumer scale. They also need to work with regulators to refresh market rules to accommodate batteries across the value chain, from behind-the-meter to in-front-of-meter. At the distribution level, we discuss the implications of the increased flexibility for distribution system operators (DSOs) in more detail in the Accenture report, "Power play: Three new models for growth in the utilities industry.”( 50 ) DSOs could fulfill a central role in realizing new optimization mechanisms—orchestrating and optimizing platforms connecting participants in the electricity system. They would perform their distinct roles in new ways:
In particular, the roles and responsibilities of DSOs in relation to transmission system operators (TSOs) and commercial system participants need to be redefined with tari�s for connecting to and using the network becoming more cost reflective. As DSOs also transition to new models, we will see more diversity in applications and implementation pathways.
Bottom-up asset planning Focuses on optimal integrated solutions across di�erent energy carriers, combining granular insights in technology development and consumer behaviors with data about the state of the distribution network in the planning process.
Active systems management Involves investing in intelligent systems that help leverage flexibility from sources connected to the distribution grid for managing congestion, primarily through financial incentives.
Neutral market facilitation Lowers the threshold of access to the energy system and the energy market in a non-discriminatory way, ensuring that all participants in the energy system are treated equally and can act based on equal information.
GRID OPERATORS
ScottishPower Renewables Aggregates generation from multiple wind farms, allowing services (reactive power, frequency control, grid-tripping) from a number of wind farms to be combined and delivered cooperatively.
NextEra Energy Lee DeKalb Battery Energy Storage System (20 MW) next to 218 MW wind farm in DeKalb County, Illinois
NextEra EnergyPPA with Tucson Electric Power for a solar+storage at "an all-in cost significantly less than $0.045/kWh over 20 years," 100 MW of solar PV with a 30 MW battery
Vattenfall �awarded a contract to build a 22 MW battery facility at its Pen y Cymoedd wind farm in Wales as part of the UK Enhanced Frequency Response tender
First Solar, NREL and CAISO �in the Mojave Desert are testing how a 300 MW solar farm can provide grid frequency regulation, voltage and reactive power control and other grid balancing services.
WIND
SOLAR
WITHOUT BATTERIES WITH BATTERIES
24 ACCENTURE
01
02
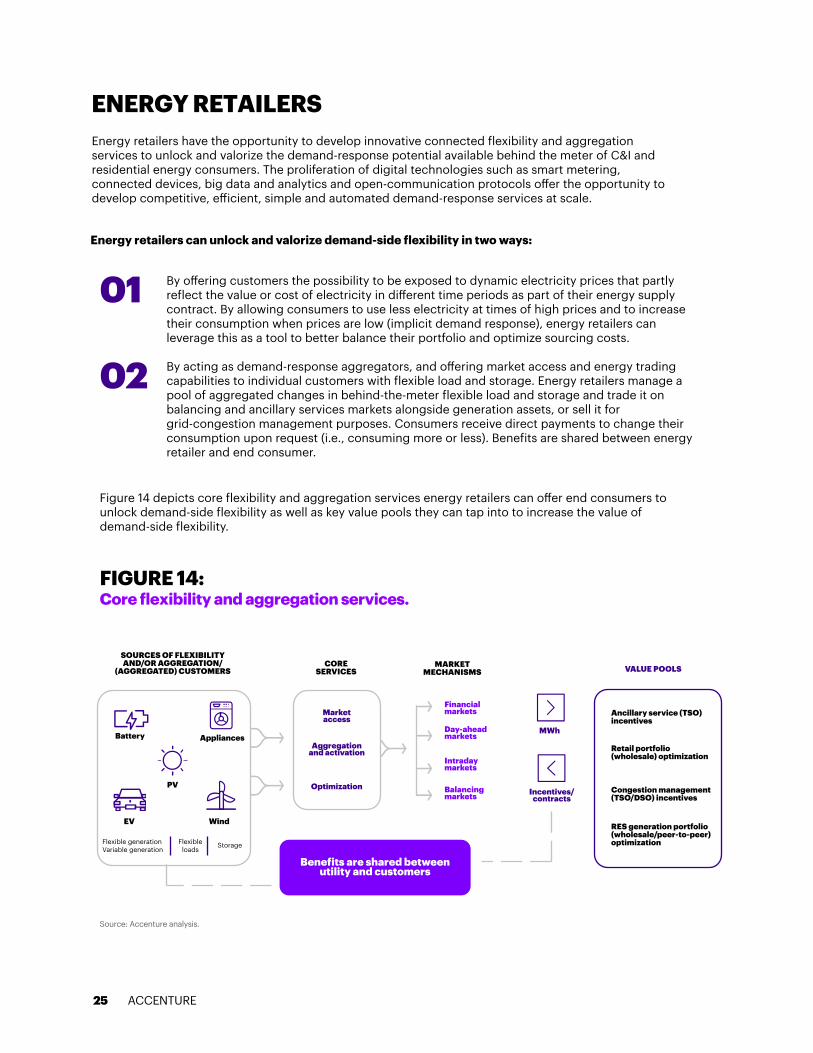
FIGURE 14: Core flexibility and aggregation services.
Source: Accenture analysis.
By o�ering customers the possibility to be exposed to dynamic electricity prices that partly reflect the value or cost of electricity in di�erent time periods as part of their energy supply contract. By allowing consumers to use less electricity at times of high prices and to increase their consumption when prices are low (implicit demand response), energy retailers can leverage this as a tool to better balance their portfolio and optimize sourcing costs. By acting as demand-response aggregators, and o�ering market access and energy trading capabilities to individual customers with flexible load and storage. Energy retailers manage a pool of aggregated changes in behind-the-meter flexible load and storage and trade it on balancing and ancillary services markets alongside generation assets, or sell it for grid-congestion management purposes. Consumers receive direct payments to change their consumption upon request (i.e., consuming more or less). Benefits are shared between energy retailer and end consumer.
Energy retailers can unlock and valorize demand-side flexibility in two ways:
Energy retailers have the opportunity to develop innovative connected flexibility and aggregation services to unlock and valorize the demand-response potential available behind the meter of C&I and residential energy consumers. The proliferation of digital technologies such as smart metering, connected devices, big data and analytics and open-communication protocols o�er the opportunity to develop competitive, e�icient, simple and automated demand-response services at scale.
ENERGY RETAILERS
Figure 14 depicts core flexibility and aggregation services energy retailers can o�er end consumers to unlock demand-side flexibility as well as key value pools they can tap into to increase the value of demand-side flexibility.
Flexible generationVariable generation
Flexible loads
Storage
EV Wind
PV
Battery Appliances
Market access
Benefits are shared between utility and customers
MWh
Incentives/ contracts
Ancillary service (TSO)incentives
SOURCES OF FLEXIBILITY AND/OR AGGREGATION/
(AGGREGATED) CUSTOMERSCORE�
SERVICESMARKET �
MECHANISMS VALUE POOLS
Retail portfolio (wholesale) optimization
Congestion management (TSO/DSO) incentives
RES generation portfolio (wholesale/peer-to-peer) optimization
Financialmarkets
Day-aheadmarkets
Intradaymarkets
Balancing markets
Aggregation and activation
Optimization
25 ACCENTURE

Flexibility tradingSelling and buying aggregated flexible load (kilowatt-hours) at optimal points in time in di�erent markets.
Flexibility aggregation and activationThe ability to manage flexible load, variable generation and storage at portfolio and local level, including flexible load/generation/storage forecast and device control services.
Flexibility contractingThe ability to procure, deliver and service electricity from flexible load, generation and storage. Proving consumer education and engagement with simple and automated flexibility value propositions that address varying needs (reduce energy cost to other values such as greater control, desire for self-su�iciency, becoming greener, or using locally produced energy) without compromising comfort will be key to enabling consumers as active market participants.
There is clearly increasing competition behind the meter. Big established players are looking to integrate energy provision with other connected devices and services. Small new entrants with novel platform and service o�erings are already entering the market as demand-response aggregators tapping into flexibility value pools, mainly on balancing and ancillary services markets. And while energy retailers must compete with o�erings of new entrants, they also have to consider forming partnerships, that can emphasize their strengths to help claim their space in the flexibility arena.
Energy retailers will need to develop three distinctive flexibility service capabilities to act as flexibility service providers, trading aggregated flexible load on electricity markets and/or o�ering smart load control service to maximize energy optimization output in line with consumer preferences (e.g., comfort, cost, green, self-su�iciency):
FIGURE 15: Three flexibility service capabilities for energy retailers.
Source: Accenture analysis.
• Commodity trading• Settlement• Risk management
FLEXIBILITY TRADING�($/EURO)
AGGREGATION AND ACTIVATION
(kWh)The ability to sell
and buy aggregated energy at optimal
points in time
The ability to procure, deliver and service
electricity from flexible load, generation and
storage
FLEXIBILITY TRADING�(EURO)
AGGREGATION AND ACTIVATION
(kWh)
FLEXIBILITY CONTRACTING
• Flexible load/generation/ storage forecast
• Flexible load/generation/ storage monitoring
• Device control(switch on/o�)
• Pricing signals
• Front-desk services• Billing and collecting• Metering and allocation• Industry interaction
26 ACCENTURE
FLEX SERVICE
PROVIDER
The ability to manage flexible load, generation
and storage
FLEXIBILITY CONTRACTING
01 ACCENTURE CONSULTINGACCENTURE27
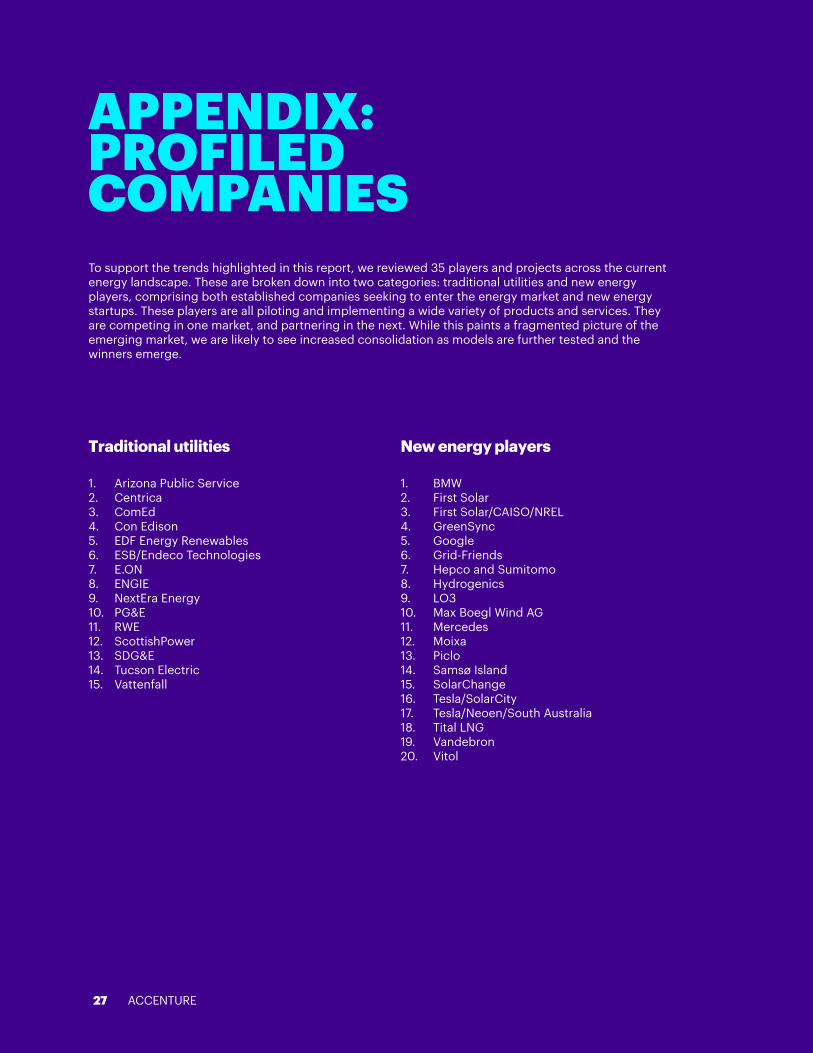
APPENDIX:PROFILED COMPANIES To support the trends highlighted in this report, we reviewed 35 players and projects across the current energy landscape. These are broken down into two categories: traditional utilities and new energy players, comprising both established companies seeking to enter the energy market and new energy startups. These players are all piloting and implementing a wide variety of products and services. They are competing in one market, and partnering in the next. While this paints a fragmented picture of the emerging market, we are likely to see increased consolidation as models are further tested and the winners emerge.
1.2.3.4.5.6.7.8.9.10.11.12.13.14.15.
Arizona Public ServiceCentricaComEdCon EdisonEDF Energy RenewablesESB/Endeco TechnologiesE.ONENGIENextEra EnergyPG&ERWEScottishPowerSDG&ETucson ElectricVattenfall
Traditional utilities
1. 2. 3.4. 5. 6. 7. 8. 9. 10. 11. 12. 13. 14. 15.16. 17. 18. 19. 20.
BMWFirst SolarFirst Solar/CAISO/NRELGreenSyncGoogle Grid-FriendsHepco and SumitomoHydrogenicsLO3Max Boegl Wind AG MercedesMoixaPicloSamsø IslandSolarChange Tesla/SolarCityTesla/Neoen/South AustraliaTital LNG VandebronVitol
New energy players
APPENDIX:PROFILED COMPANIES
1) "Vitol launches JV for British battery storage projects,” Reuters News, February 2017, Factiva, Inc. All Rights Reserved. 2) US Department of Energy Global Energy Storage Database. 3) "SDG&E unveils world’s largest lithium ion battery storage facility,” SDG&E press release, February 2017, http://sdgenews.com. 4) "Tesla switches on giant battery to shore up Australia's grid," Reuters News, December 2017, Factiva, Inc. All Rights Reserved. 5) "Hydrogenics awarded 2.4 MW power-to-gas plant in Germany,” Hydrogenics press release, March 2017, http://www.hydrogenics.com.6) ENERGYnow, NextEra Energy, http://www.nexteraenergy.com. 7) "EFR Market Information Report,” National Grid Report,“ August 2016, http://nationalgrid.prod.acquia-sites.com. 8) EFR Technical Requirements, National Grid, https://www.nationalgrid.com. 9) "Pacific Gas and Electric Company EPIC Final Report,” PG&E Report, September 2016, https://www.pge.com. 10) "Today’s top solar developers have become storage developers, too,” GTM Research, June 2017, https://www.greentechmedia.com. 11) "EFR Market Information Report,” National Grid Report,“ August 2016, http://nationalgrid.prod.acquia-sites.com. 12) "Pacific Gas and Electric Company EPIC Final Report,” PG&E Report, September 2016, https://www.pge.com.13) “Top US firms including Walmart and Ford to ignore Trump on climate change,” The Guardian, December 2017, Factiva, Inc. All Rights Reserved. 14) Energy and Environment, Amazon, https://www.amazon.com. 15) Introducing the Cornwall Local Energy Market, Centrica, https://www.centrica.com. 16) "Energy positive: how Denmark's Samsø island switched to zero carbon,” The Guardian, February 2017, Factiva, Inc. All Rights Reserved. 17) "Microgrid: Keeping the Lights On,” UC San Diego Alumni Publication, http://www.alumni.ucsd.edu. 18) Titan LNG, http://titan-lng.com. 19) Grid-Friends, http://www.grid-friends.com.20) Endeco Technologies, http://www.endeco-technologies.com. 21) "Project Eric awarded for pioneering smart community energy system,” Moixa Energy Holdings blog, December 2016, http://www.moixa.com. 22) New Energy Outlook 2017, Bloomberg New Energy Finance, https://about.bnef.com/new-energy-outlook. 23) BMW Digital Charging Service, BMW Group, https://charging.bmwgroup.com. 24) "E.ON and Google are launching partnership to expand solar energy,” E.ON press release, May 2017, https://www.eon.com. 25) ENGIE New Ventures, Engie, https://innovation.engie.com. 26) Clean Tech Fund, ESB, https://www.esb.ie. 27) "Con Edison projects explore the potential of energy storage,” Transmission & Distribution World, August 2017, Factiva, Inc. All Rights Reserved. 28) "Tesla and SolarCity build a solar-battery microgrid in American Samoa—a sign of things to come?" GTM Research, November 2016, https://www.greentechmedia.com. 29) "Moixa's brief-case sized smart batteries in Big-6 utility pilots,” RealWire, June 2016, Factiva, Inc. All Rights Reserved.30) "EDF Energy Renewables wins contract for 49 MW battery storage facility at West Burton in Nottinghamshire,” EDF Energy press release, August 2016, http://media.edfenergy.com. 31) "Distributed Electricity Storage and Solar Solutions,” EDF Renewable Energy, https://www.edf-re.com.32) "Future Energy Scenarios,” National Grid, http://fes.nationalgrid.com. 33) System Operability Framework, National Grid, http://www2.nationalgrid.com. 34) Future of Balancing Services, National Grid, http://www2.nationalgrid.com. 35) US Department of Energy Global Energy Storage Database, https://www.energystorageexchange.org. 36) "ADELE to store electricity e�iciently, safely and in large quantities,” RWE press release, January 2010, https://www.rwe.com. 37) "Compressed air energy storage,” The Green Age, https://www.thegreenage.co.uk. 38) US Department of Energy Global Energy Storage Database, https://www.energystorageexchange.org.39) Ibid. 40) Distributed energy resource provider, CAISO, https://www.caiso.com. 41) "PG&E presents innovative energy storage agreements,” PG&E press release, December 2015, https://www.pge.com. 42) "More data on how First Solar and NREL are balancing the grid with utility-scale solar," GTM Research, May 2017, https://www.greentechmedia.com. 43) “Arizona Solar,” Solar Energy Industries Association (SEIA), https://www.seia.org.44) "Arizona Public Service Is back on the grid-scale battery scene,” GTM Research, May 2017, https://www.greentechmedia.com. 45) "Arizona vote puts an end to net metering for solar customers,” GTM Research, December 2016, https://www.greentechmedia.com. 46) "This upgrade to renewable portfolio standards could make them a lot more e�ective at grid balancing,” GTM Research, December 2016, https://www.greentechmedia.com. 47) “Energy plan can deliver millions in customer savings and increased energy security,” Energy Networks Australia media release, April 28, 2017, http://www.energynetworks.com.au. 48) "Plan for solar homes to help the grid,” The Australian Financial Review, February 2017, Factiva, Inc. All Rights Reserved. 49) "Tesla switches on giant battery to shore up Australia's grid," Reuters News, December 2017, Factiva, Inc. All Rights Reserved.50) "Power play: Three new models for growth in the utilities industry," Accenture, 2015, https://www.accenture.com.
REFERENCES
28 ACCENTURE

Accenture is a leading global professional services company, providing a broadrange of services and solutions in strategy, consulting, digital, technology andoperations. Combining unmatched experience and specialized skills acrossmore than 40 industries and all business functions—underpinned by theworld’s largest delivery network—Accenture works at the intersection ofbusiness and technology to help clients improve their performance and createsustainable value for their stakeholders. With approximately 425,000 peopleserving clients in more than 120 countries, Accenture drives innovation toimprove the way the world works and lives.
This document is produced by consultants at Accenture as general guidance. It is not intended to provide specific advice on your circumstances. If you require advice or further details on any matters referred to, please contact your Accenture representative. This document makes descriptive reference to trademarks that may be owned by others. The use of such trademarks herein is not an assertion of ownership of such trademarks by Accenture and is not intended to represent or imply the existence of an association between Accenture and the lawful owners of such trademarks.
MELISSA STARKGlobal Renewables Lead
CAROLINE NARICHRenewables Strategy
Copyright © 2017 AccentureAll rights reserved.Accenture, its logo, andHigh Performance Delivered aretrademarks of Accenture.
ABOUT ACCENTURE
DISCLAIMER
CONTACT
Visit us at www.accenture.com.


![Case Histories of Manufacturing Problem Solving Advanced …€¦ · peaks down to 5 [microinches] or less before we ever start the engine, but the valleys remain. We may not always](https://static.fdocuments.net/doc/165x107/5b5701517f8b9adf7d8d4010/case-histories-of-manufacturing-problem-solving-advanced-peaks-down-to-5-microinches.jpg)