Captive Insurance Study for - Honolulu
156
Transcript of Captive Insurance Study for - Honolulu


Captive Insurance Study forthe City and County ofHonolulu
A Report to theMayorand theCity Councilof Honolulu
Submitted by
THE CITY AUDITORCITY AND COUNTYOF HONOLULUSTATE OF HAWAI`I
Report No. 06-04May 2006
Conducted by
First Risk ManagementServices, Inc.


Foreword
This is a report of the Captive Insurance Study for the City andCounty of Honolulu. The study was conducted pursuant toSection 3-114 of the Revised City Charter of Honolulu and CouncilResolution No. 05-070, that requested the City Auditor to contract afirm or person to conduct a detailed study of the cost impacts to theCity of a captive insurance company. The firm of First RiskManagement Services, Inc. conducted the study, which wasperformed in accordance with Generally Accepted GovernmentAuditing Standards.
We wish to express our appreciation for the cooperation andassistance extended by the officials and staff of the Department ofBudget and Fiscal Services, the Department of Human Resources andothers who we contacted during this study.
Leslie I. Tanaka, CPACity Auditor

TABLE OF CONTENTS
Page
I. Executive Summary 1 II. Risk Management Organization 5 III. Current Risk Practices 9
A. COR (Cost of Risk) B. Risk Financing C. Risk Control
IV. Appropriate Captive Covers 19 A. Workers Compensation B. General Liability C. Automobile Liability D. Property E. Other
V. Captive Advantages and Disadvantages 23
A. Advantages B. Disadvantages
VI. Cost of Current and Expected Losses 25
A. Workers Compensation B. General Liability C. Automobile Liability
VII. Cost of Captive vs. Self-Insurance 31
A. Start-Up Costs B. Ongoing Expenses C. Loss Reserve Funding Approaches D. Comparison to Self-Insurance
VIII. Feasibility of Captive 37
A. Conceptual B. Financial C. Conclusions
v

Appendices A Workers Compensation Projected Loss Exhibits 45 B General Liability Projected Loss Exhibits 61 C Automobile Liability Projected Loss Exhibits 75 D Fund to Ultimate Pro Forma Financials 89 E Loan Back Pro Forma Financials 109 F General Liability and Auto Liability Pro Forma Financials Scenario 1 129 G General Liability and Auto Liability Pro Forma Financials Scenario 2 137 Attachments 1 Letter to the Department of Budget and Fiscal Services requesting response to draft report 145
2 Response of the Department of Budget and Fiscal Services 146 3 First Risk Management Services, Inc. comments to the Department of Budget and Fiscal Services response 148
vi

I. EXECUTIVE SUMMARY The purpose of this study is to evaluate the advisability and feasibility of establishing a captive insurance company to address the City and County of Honolulu’s risk and liability obligations and make recommendations as appropriate. The study was conducted pursuant to Section 3-114 of the Revised City Charter of Honolulu and Council Resolution No. 05-070, that requested the City Auditor to contract a firm or person to conduct a detailed study of the cost impacts to the City of a captive insurance company. The firm of First Risk Management Services, Inc. conducted the study, which was performed in accordance with Generally Accepted Government Auditing Standards. The study findings and recommendations are summarized below. Feasibility Of Captive A captive insurance company is a feasible risk financing option for the City from both a conceptual and financial perspective. A captive will also allow the City to better maintain accountability for its entire insurance and risk management program. Recommendation
We recommend that the City form a captive to address its risk and liability obligations.
Comparison Of Captive To Self-Insurance Captive funds can be invested in longer-term securities compared to the City’s current investment capability. In general, the rates for allowable long-term securities are approximately 2% higher under a normal yield curve than the interest rates for short-term securities. In addition to reserve funds for traditional insurance coverages, the City could also place funds for its long-term liabilities into the captive. We estimate these long-term liabilities to be around $60 million. The City sets aside and invests funds for some of these liabilities while others are only listed as accounting liabilities. The additional investment income earned on currently unfunded liabilities could be as much as 5% of the liability amount and provide an even greater investment income opportunity.
If the City places funds for its long-term liabilities into the captive, it could earn additional income in the range of $1 - $3 million annually.
A captive funds its actuarial reserves to a confidence level determined by the Actuary. Typically a captive will ensure that these reserves are “funded to ultimate”. This terminology means that the full amount of actuarially projected ultimate losses for each line of insurance coverage is deposited into the captive. This is different than the City’s current method of only funding the expected paid losses in the coming fiscal year.
1
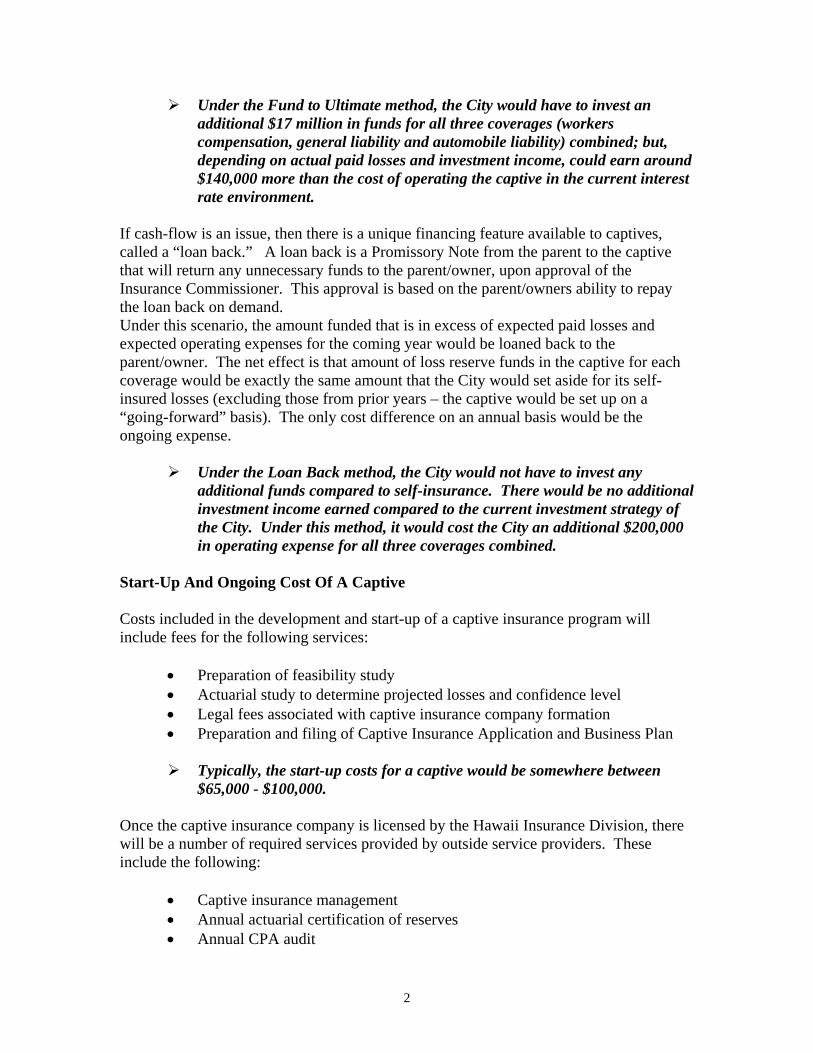
Under the Fund to Ultimate method, the City would have to invest an additional $17 million in funds for all three coverages (workers compensation, general liability and automobile liability) combined; but, depending on actual paid losses and investment income, could earn around $140,000 more than the cost of operating the captive in the current interest rate environment.
If cash-flow is an issue, then there is a unique financing feature available to captives, called a “loan back.” A loan back is a Promissory Note from the parent to the captive that will return any unnecessary funds to the parent/owner, upon approval of the Insurance Commissioner. This approval is based on the parent/owners ability to repay the loan back on demand. Under this scenario, the amount funded that is in excess of expected paid losses and expected operating expenses for the coming year would be loaned back to the parent/owner. The net effect is that amount of loss reserve funds in the captive for each coverage would be exactly the same amount that the City would set aside for its self-insured losses (excluding those from prior years – the captive would be set up on a “going-forward” basis). The only cost difference on an annual basis would be the ongoing expense.
Under the Loan Back method, the City would not have to invest any additional funds compared to self-insurance. There would be no additional investment income earned compared to the current investment strategy of the City. Under this method, it would cost the City an additional $200,000 in operating expense for all three coverages combined.
Start-Up And Ongoing Cost Of A Captive Costs included in the development and start-up of a captive insurance program will include fees for the following services:
• Preparation of feasibility study • Actuarial study to determine projected losses and confidence level • Legal fees associated with captive insurance company formation • Preparation and filing of Captive Insurance Application and Business Plan Typically, the start-up costs for a captive would be somewhere between
$65,000 - $100,000. Once the captive insurance company is licensed by the Hawaii Insurance Division, there will be a number of required services provided by outside service providers. These include the following:
• Captive insurance management • Annual actuarial certification of reserves • Annual CPA audit
2

• Legal • Claims Administration (these services may be provided by current City
personnel) The cost of these services would vary by the line of insurance coverage included in the captive insurance company. The reason for this variance in cost is attributable to the labor involved in preparing and maintaining captive insurance services for certain lines of insurance coverage. An example is that workers compensation coverage is a more labor intensive line of insurance than property coverage.
Below is a breakdown of the estimated cumulative annual operating expenses if the City was to implement and license a captive insurance subsidiary. These fees are allocated by line of coverage and assumes the City will continue to administer claims:
• Workers compensation - $130,000 • General liability - $35,000 • Automobile liability - $35,000 • Property - $25,000 • Other - $25,000
Risk Management Organization The optimum risk management structure is to have one department with overall responsibility for reducing the cost of premiums and self-insured losses (“Cost of Risk” – See Chapter IV for a further discussion) by effective usage of insurance, self-insurance, claims management and loss control. Other departments can assist with this process but the ultimate risk management decisions should be made by the same department to ensure consistency in risk management approaches. The risk management function was established under Section 2-5 of the Revised Ordinances of Honolulu requiring the creation of a risk management program to identify and control the City’s exposures to liability. Since this responsibility was placed under the direction of the Department of Budget and Fiscal Services, Risk Management Division, it makes sense that the management of all of the City’s risks should be centralized in this area as well. Recommendation
We recommend the City centralize oversight of its entire risk management program under the direction of the Department of Budget and Fiscal Services, Risk Management Division.
Current Risk Practices Because the largest contributor to the City’s COR is workers compensation, it does not seem prudent for the City to self-insure this exposure. This approach leaves the City vulnerable to catastrophic losses. The City has 778 employees concentrated at the
3

municipal building and another 358 at City Hall. It is not inconceivable that a fire or some other natural disaster could occur and injure/kill 500 employees or more. If such an event occurs and the average claim for each employee is $100,000, the total loss would be $50 million. For comparison purposes, civilians killed or seriously injured during the World Trade Center attacks received a total of $8.7 billion, or an average of $3.1 million per recipient. It is not anticipated that the City might incur a loss as great as this but it does show how large unexpected losses can be and underscore the need for catastrophic insurance protection. Recommendation
We recommend the City consider purchasing excess workers compensation insurance and have its broker obtain premium quotations excess of various retention levels.
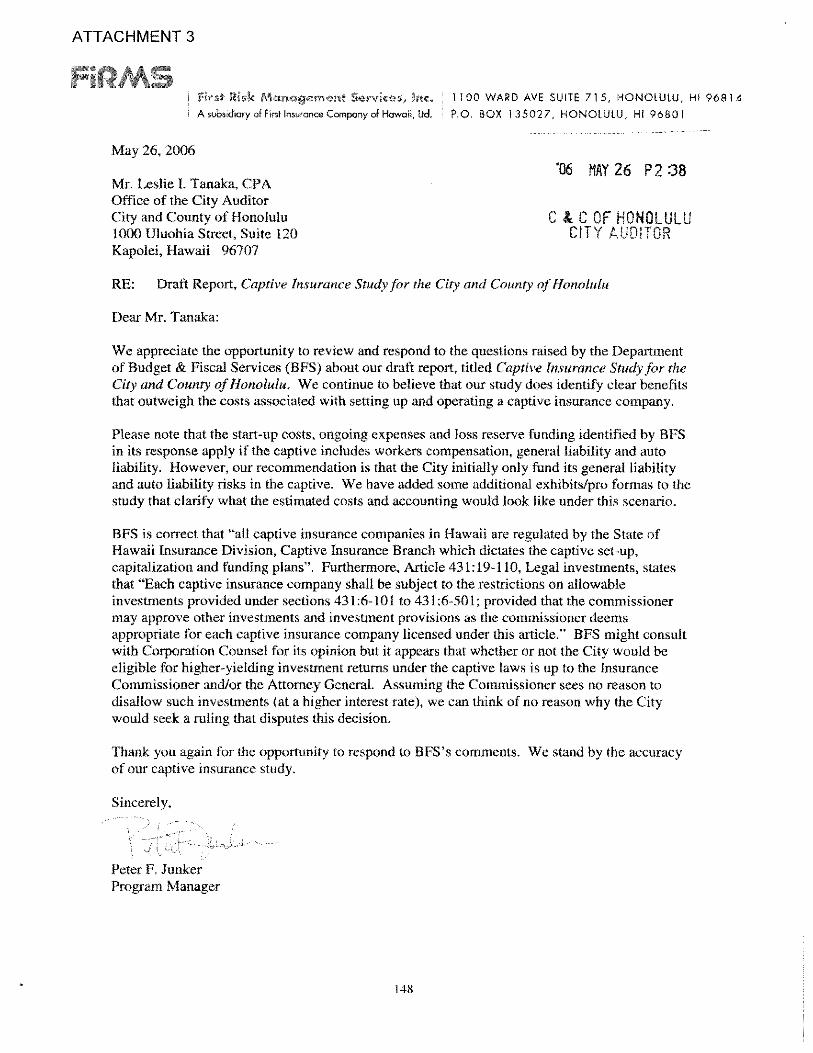
The recommendations in this chapter are detailed in the body of the report. The report should be read in its entirety to obtain a complete understanding of our findings. Response of the Department of Budget and Fiscal Services In its response to the draft study (Attachment 2), the Department of Budget and Fiscal Services (BFS) stated that it generally disagreed with the recommendation that the City form a captive insurance company to address its risk and liability obligations. The director of the Department of Budget and Fiscal Services noted that the “draft study is consistent with our past analyses and does not identify any clear benefits that outweigh the significant added costs associated with setting up and operating a captive insurance company.” As related to the other recommendations made in the draft study, the director of BFS noted that it will: 1) analyze and evaluate the centralized oversight of the City’s risk management program with its implementation of a consolidated computerized information system; 2) evaluate the risks, probabilities, costs and benefits associated with the recommendation to purchase excess workers’ compensation insurance; and 3) begin a more comprehensive program of periodic independent workers’ compensation claims handling audits in the next fiscal year. First Risk Management Services, Inc. Comments to BFS’ Response In its comments to BFS’ response to the draft study (Attachment 3), First Risk Management Services, Inc. (FiRMS) noted that the start-up costs, ongoing expenses, and loss reserve funding identified by BFS in its response apply only if the captive includes workers compensation, general liability and auto liability. However, FiRMS noted that its recommendation in the draft study is for the City to initially only fund its general liability and auto liability risks in the captive. It continues to believe that the study does identify clear benefits that outweigh the costs associated with setting up and operating a captive insurance company and stands by the accuracy of the study.
4

II. RISK MANAGEMENT ORGANIZATION Before considering if a captive is feasible for the City, it is important to understand how the City is organized for the management of its risks. Risk management at the City is provided by the following departments:
• Department of Budget and Fiscal Services, Risk Management Division (RM) • Department of Human Resources, Industrial Safety and Workers
Compensation Division (ISWC) • Department of Corporation Counsel (CC)
Table II-1 below outlines how various risk management duties are divided among these departments.
Table II-1 Risk Management
Areas of Responsibility
Risk Management Discipline
Workers Compensation
General Liability
Automobile Liability Property
Program Management ISWC RM RM RM
Risk Financing ISWC/RM* RM RM RM
Claims Management ISWC CC RM RM
Legal Defense CC CC CC N/A
Loss Control ISWC RM RM RM *The City is currently self-insured and does not purchase any Workers Compensation insurance. If the City did decide to purchase this coverage, it would be a joint decision between RM, ISWC and the Managing Director. The individual staff and departments that oversee risk management functions are highly skilled and each area of risk management appears to be properly handled by appropriate staff. However, there does not appear to be specific oversight and accountability for the entire program. For example, ISWC handles workers compensation claims and provides loss control in an autonomous manner with no oversight from RM. Furthermore, there is
5

not an IT system in place that is utilized by each department that would allow them to share information on open and closed claims and reserves for future claims. The optimum risk management structure is to have one department with overall responsibility for reducing the cost of risk (premiums and self-insured losses – See Chapter III for a further discussion) by effective usage of insurance, self-insurance, claims management and loss control. Other departments can assist with this process but the ultimate risk management decisions should be made by the same department to ensure consistency in risk management approaches. The risk management function was established under Section 2-5 of the Revised Ordinances of Honolulu requiring the creation of a risk management program to identify and control the City’s exposures to liability. Since this responsibility was placed under the direction of the Department of Budget and Fiscal Services, Risk Management Division, it makes sense that the management of all of the City’s risks should be centralized in this area as well. Recommendation
We recommend the City centralize oversight of its entire risk management program under the direction of the Department of Budget and Fiscal Services, Risk Management Division.
The main function of RM is to provide budget stabilization associated with the cost of risk. This is accomplished through the following:
• Development and ongoing maintenance of the City risk financing and risk
control programs (individual departments are responsible for safety programs).
• The purchase of commercial insurance and determination of limits and
retention for the City insurance program. • Review of all insurance contracts. • Maintenance of Certificates of Insurance. • Completion of RFP process for hiring of outside service providers, such as
insurance brokers, claims administrators and adjusters.
RM provides a report to the City Council each year for the review of the City’s insurance program and to receive approval for the risk management provisional account. This account is used to purchase commercial insurance, claim payments and all other costs associated with risk management, except for salaries. The funds within the risk management provisional account that are not used at the end of the fiscal year revert to the general fund. If funds are encumbered at the end of the fiscal period, then the funding will remain in the risk management provisional account to pay those expenses, such as third-party administrative contracts or settled claims.
6

Within the Budget and Fiscal Services Policies and Procedures Manual is a section on Risk Management. This manual is available via intranet to City employees. It includes a section on risk management and loss control. A hard copy manual is not provided to staff or departments.
7

This page intentionally left blank.
8

III. CURRENT RISK PRACTICES Risk management consists of risk financing (purchase of insurance and retention/self-insurance decisions) and risk control (claims management and loss control). A captive is a risk financing tool and its impact is dependent on how risk management is structured within an organization. For example, if risk management is set up with its focus on reducing or minimizing an entity’s cost of risk (COR), then a captive could very well enhance this process. On the other hand, if risk management is not organized in an efficient manner and/or little or no attention is paid to controlling losses, then it is doubtful if a captive would have any beneficial effect. A. COR (Cost of Risk) COR is a concept that attempts to quantify and tabulate the amounts expended on risk treatment methods. The major risk cost elements are:
1. Insurance Premiums – Amounts paid to commercial insurers. 2. Self-Insured Losses – Losses paid under deductibles, self-insured retentions,
or from incidents simply not covered by insurance. 3. Administration – Administrative expenses include contract or in-house staff
expenses and related overhead associated with claims adjusting, loss prevention and financial management of risks.
4. Indirect Risk Costs – These are secondary expenses that arise as a result of
losses incurred. For the purpose of this report, we will concentrate only on the first two items. Exhibit III-1 includes a Summary of Insurance for the City. It breaks down the premium cost for liability and property policies as well as projected self-insured losses for workers compensation, general liability and automobile liability.
9

Exhibit III-1 City And County Of Honolulu
Schedule of Insurance FY2005-06
Coverage Policy Term Limits Deductible/SIR Premium
Ambulance Professional Liability 7/1/05 - 7/1/06 $1,000,000 $50,000 $340,710
Aircraft Liability 7/1/05 - 7/1/06 $20,000,000 $0 $59,020
Auto Liability - HPD Subsidized Fleet
7/1/05 - 7/1/06
$300,000 BI $250,000 PD $25,000 $931,831
Excess Liability AL&GL 7/1/05 - 7/1/06 $10,000,000 $2,000,000 $1,653,400
Kekaulike 8/1/05 - 8/1/06 $1,000,000 $0 $19,319
LIABILITY SUBTOTAL $3,004,280
Aircraft Hull Damage 7/1/05 - 7/1/06 stated value 2.5% of hull value $119,820
All Risk Property ($2.7 Bil TIV) 7/1/05 - 7/1/06
$125M blanket $50M quake & flood
$75,000 AOP 2% wind
5% quake 5% flood $1,656,391
Boiler & Machinery 7/1/05 - 7/1/06 $50,000,000 $75,000 $70,415
3-D Crime 7/1/05 - 7/1/06
$5,000,000 $1,000,000 $100,000 $48,444
Flood Insurance Various $322,100 $5,000 $26,399
PROPERTY SUBTOTAL $1,921,469
PREMIUM SUBTOTAL (Liability + Property) $4,925,749
PROJECTED SELF-INSURED LOSSES (see table below) $23,964,000
TOTAL COST OF RISK $28,889,749
SELF INSURANCE EXPECTED LOSSES Subsidized Auto $524,000 Auto Liability (City) $740,000 General Liability $4,686,000 Workers Compensation $18,014,000 TOTAL EXPECTED LOSSES $23,964,000
10

The graph below illustrates how the City’s COR is distributed among its workers compensation, liability and property risks. As you can see, more than 60% of the City’s COR is from its workers compensation exposures.
COR by Coverage Type
FY2005-06
Workers Compensation $18,014,000
62.3%
Liability $8,954,280
31.0%
Property $1,921,469
6.7%
11

Projected self-insured losses ($23,964,000) make up about 83% of the City’s total COR ($28,889,749). The graph below illustrates how the City’s projected self-insured losses are distributed among workers compensation, general liability and automobile liability. Approximately 75% of the City’s projected self-insured losses are from its workers compensation risks.
Self Insured Losses by Risk Type*
FY2005-06
Workers Compensation $18,014,000
75.2%
Auto Liability $1,264,000
5.3%
General Liability $4,686,000
19.5%
*Per Actuarial Report as of 6/30/05
By far, the largest portion and main factor in driving the City’s risk costs are self-insured losses, particularly workers compensation. This element can vary widely, especially since the City does not have excess workers compensation coverage. The fact that losses make up such a large portion of the COR reinforces the need for proper risk retention levels and a strong loss control program. This is true regardless if the City decides to form a captive to cover some of its risks.
12

B. RISK FINANCING To determine the dollar amount of accidental losses that an organization can absorb, it must evaluate several subjective and objective factors, including:
1. Unencumbered retained income, reserves or fund balances. 2. Certainty and amount of its annual gross income. 3. Amount of operating and capital expenditures that could be canceled or
deferred to meet short-term cash needs caused by an accidental loss. 4. Legal and financial ability to issue debt. 5. Ability to increase taxes or otherwise raise revenue to finance accidental
losses. 6. Existence of financial reserves designated for catastrophic loss payment. 7. Attitude of senior management towards risk.
The ideal risk retention approach includes retaining small, predictable losses and insuring catastrophic or unpredictable losses. Regardless of which risk retention policy is chosen, it should be clear and applied consistently to all risks. Exhibit III-2 illustrates the City’s self-insured retentions for its various exposures.
Exhibit III-2 City and County of Honolulu
Deductible/SIR FY2005-06
Coverage Ded/SIR
Aircraft Liability $0 Kekaulike Project Liability $0 Flood $5,000 Auto Liability-Subsidized Fleet $25,000 Ambulance Professional $50,000 Property $75,000 Boiler & Machinery $75,000 Crime $100,000 Auto Liability-City $2,000,000 General Liability $2,000,000 Median Ded/SIR $433,000 Workers Compensation Unlimited/Statutory
13

The City’s risk retention approach (deductibles/self-insurance) varies from “no retention” of aircraft liability losses to “unlimited/statutory” self-insured losses for workers compensation. Even general liability and automobile liability (City vehicles) are limited to $2 million per occurrence. Because the largest contributor to the City’s COR is workers compensation, it does not seem prudent for the City to self-insure this exposure. This approach leaves the City vulnerable to catastrophic losses. The City has 778 employees concentrated at the municipal building and another 358 at City Hall. It is not inconceivable that a fire or some other natural disaster could occur and injure/kill 500 employees or more. If such an event occurs and the average claim for each employee is $100,000, the total loss would be $50 million. For comparison purposes, civilians killed or seriously injured during the World Trade Center attacks received a total of $8.7 billion, or an average of $3.1 million per recipient. It is not anticipated that the City might incur a loss as great as this but it does show how large unexpected losses can be and underscore the need for catastrophic insurance protection. Recommendation
We recommend the City consider purchasing excess workers compensation insurance and have its broker obtain premium quotations excess of various retention levels.
C. RISK CONTROL A strong risk control program that includes proactive loss control and effective claims management must be in place to ensure that self-insured losses are minimized or reduced. Various departments have responsibility for claims management and loss control for the type of risks listed below:
1. Workers Compensation The oversight of workers compensation is the responsibility of the Department
of Human Resources (DHR). The Department includes an Industrial Safety & Workers’ Compensation (ISWC) Division and also a Labor Relations and Training Division. The DHR is responsible for the administration of all the City’s workers compensation claims. The ISWC division has 12 claims adjusters on staff. These adjusters work on a case load of 1400 claims per year, which equates to a case load of about 130 to 150 per adjuster. The industry standard is an average between 125-150 claims per adjuster. Workers compensation claims are filed with the division usually within 7 days of the accident. Based on discussions with ISWC, the average reporting period is 2 days.
The claim forms are online and available to all of the City’s staff. The two methods for payment of workers’ compensation claims are wage replacement
14

and a provisional indemnity account. If the wage replacement account is used, then payment will be made out of the department which the injured worker is employed. The provisional account is budgeted for by the DHR on an annual basis. The wage replacement is budgeted as salaries and wages for each individual department. If the ISWC Division requires attorneys to get involved in a case, then the City’s attorneys are used. These attorneys are paid a salary by their department and their expense is not allocated to the case.
Individual departments are responsible for return-to-work programs. The DHR has a Safety Specialist on staff that provides oversight to each City department. Each department has its own safety staff. The Safety Specialist acts as a consultant to each of the City departments and provides training and materials to each department’s safety staff. Since the City’s workers compensation program is self-insured, claims are accounted for on a “pay-as-you-go” basis. This means that workers compensation claims are treated on a “cash basis” for accounting purposes. As claims are reported, the claims adjuster provides for a reserve amount in the claims system. This reserve amount is not accounted for in the annual audited financial statements of the City, but is located in a footnote to the audited financial statements. This footnote is listed under item 13 – Contingent Liabilities as part of the City’s annual audited financial statements. The City is also required pursuant to Hawaii Revised Statutes §386-153 to pay an assessment on an annual basis to the Department of Labor and Industrial Relations. This assessment has averaged approximately $800,000 per year.
Throughout any given fiscal year, a budget is appropriated for the payment of workers compensation claims. Senior adjusters have settlement authority up to $20,000. Settlements in excess of this amount must be approved by the Workers Compensation Manager. Settlements in excess of the value of 25% of the “whole person” amount must also have the approval of the City’s Managing Director. ISWC contracts with an outside vendor for bill review and medical management. During the period of 1/1/05 – 12/31/05, this service achieved bill reductions of 35% overall for outpatients and 52% for inpatients. The ISWC Division last had a workers compensation claim audit completed in 1991 by Watson Wyatt. Generally accepted risk management “best practices” is to have an audit of claims handlers performed every 3-5 years. This is to ensure that claims are being handled as efficiently and effectively as possible. Improper handling most likely would lead to increased claim costs. Periodic reviews of this function is important since Workers Compensation comprises the bulk of the City’s self-insured losses and COR.
15

Recommendation
We recommend the City contract with an outside agency for an audit of its workers compensation claims handling and repeat this process at least every five years.
As mentioned previously, there is no oversight provided by RM for workers compensation claims. Nor is there any interaction, verbally or via access to claim data, between the two departments. This practice does not allow the City to have an integrated, proactive management of its risks. 2. General Liability The City self-insures general liability claims up to $2,000,000 for each occurrence. The oversight of adjusting and settling liability claims is the responsibility of the Department of Corporation Counsel (CC). Within the CC, there is one division responsible for litigation and another for investigation of claims.
Liability claims may be filed through the City via telephone or submission of a completed claim form. Claim forms are available at satellite City Halls around Oahu. Once a claim has been filed, the CC then assigns the claim to an investigator for review. Upon completing the investigation, the claim is then forwarded to an attorney within the CC. The CC has the authority to settle all liability claims up to $5,000. Any claim over $5,000 requires the approval of the City Council. Payment of liability claims is made out of the Judgment & Losses Fund. If a lawsuit is filed with a court of law, then the lawsuit is assigned to a Deputy of the CC. The Deputy will determine whether to settle the claim or litigate the claim in court. In some circumstances, outside counsel is hired to defend the claim. This occurs when the specifics of the case require an expert counsel or because of the ramifications of the case. It is mandated to utilize outside counsel if multiple City employees are involved in the litigation. If the case is litigated in court and the result is a court ordered settlement, then City Council approval is not required for the payment of the settlement. If a liability claim reserve is made for greater than 25% of the $2,000,000 self-insured retention of the City, then the Deputy is required to notify Risk Management so that it can be reported to the excess general liability insurance carrier.
Liability claim payments are made out of the Judgment and Losses Fund. Operating expenses for consultants, experts, outside defense and related expenses to court cases are typically around $2,000,000 per year. Other departments may also have monies budgeted for outside legal counsel. The use of that budget is approved by the CC.
16

The CC works with RM in reporting claims and tracking the self-insured retention.
3. Automobile Liability The City self-insures auto liability claims up to $2,000,000 per occurrence. RM provides oversight for these claims. Automobile claims are submitted by the department where the motor vehicle is assigned. The claim form is usually filed within two working days of the accident. Major accidents are phoned in immediately. RM contacts the third-party administrator, Specialty Risk Services, LLC (“SRS”). SRS then adjusts the claim. If a claim is made by a third party, the City is usually notified by the claimants insurance carrier. RM then requests a copy of the police report, if filed, from the Honolulu Police Department. The report is then provided to SRS to assist them in adjusting the claim. SRS has authority to provide payment for claims up to $5,000. Any claim over $5,000 requires the approval of the City Council.
4. Property Fire and other types of property losses are reported to the Property insurance carrier and are handled by its designated adjuster. Repairs for claims within the deductible are handled by individual departments. Automobile physical damage claims are handled by the responsible departments with subrogation assistance provided by RM and CC.
17

This page intentionally left blank.
18

IV. APPROPRIATE CAPTIVE COVERS
Captive insurance companies have been formed by companies large and small, for-profit and not-for-profit, private and public entities. The use of captive insurance is not a new idea. Over the past thirty years, the evolution of risk management has fueled the growth of captive insurance from a sophisticated alternative to an effective risk financing tool that is now commonplace in corporate risk management programs. Captives have the ability to provide a variety of coverages. In general, a captive may provide coverage for any line or type of insurance allowed by law. This would include the following:
• Workers Compensation • General Liability • Automobile Liability • Property • Surety • Fidelity • Employee Benefits
Generally an entity’s insurance program is required to have appropriate premium levels before it makes sense to consider a captive. This threshold amount used to be $1 million but today, captives are being formed with premium as little as $250,000. Pursuant to Hawaii Revised Statutes (HRS) §46-1.5, the City is allowed to insure risks through a captive insurance subsidiary. Following are types of coverages that would be appropriate for the City to consider insuring through a captive. A. WORKERS COMPENSATION Pursuant to HRS §386-121, an organization may insure its workers compensation risks through the use of self-insurance programs, commercial insurance or a captive. If a Hawaii-based captive insures workers compensation risk, then those risks may be insured on a direct basis. This means that the captive insurance company may provide first-dollar primary insurance company to the Hawaii-based parent company or insured entity. If a non-Hawaii-based captive insurance company is used to insure workers compensation risk, then a Hawaii licensed insurance company is required to provide “fronting” coverage to the parent company or insured entity. This licensed insurer requirement for workers’ compensation insurance is a common requirement in all fifty states. Workers Compensation would be an appropriate risk to cover in a captive because its frequency and severity of losses is generally predictable. However, as with self-
19

insurance, it is advisable to purchase excess coverage to protect against catastrophic events. Prior loss experience and the marketplace will dictate whether it makes sense to purchase protection in excess of $2 million, $5 million or even higher. Insuring workers compensation coverage in a captive will also provide for accountability in tracking the true cost of insurance for this type of coverage. All expenses related to administering the workers compensation portion of the captive insurance program could be allocated to this line of business. B. GENERAL LIABILITY General liability insurance does not have any specific requirements for coverage by statute. Restrictions placed on general liability coverage are dictated by contracts, banks or loan administrators. Some examples are that general contractors are required by Hawaii Revised Statute to carry $1,000,000 of general liability insurance through a licensed insurance carrier. A captive insurance company would allow a general contractor to meet those requirements. In the case of a government contract or banking requirement, sometimes the general liability insurance is required to be purchased through an A.M. Best rated insurance company. A.M. Best is a highly respected insurance company rating agency. If none of these specific requirements exist, then a captive may provide general liability insurance to a parent company/insured. This coverage is typically either in the primary layers or even in upper levels of an insurance program. A captive could insure a self-insured retention or deductible. A captive may also reinsure high level limits or be part of an excess insurance program. As with workers compensation, general liability would be an appropriate risk to cover in a captive because its frequency and severity of losses is generally predictable. Again, excess coverage should be purchased to provide catastrophic loss protection. Insuring general liability coverage in a captive insurance subsidiary will also provide for accountability in tracking the true cost of insurance for this type of coverage. All expenses related to administering the general liability portion of the captive insurance program could be allocated to this line of business. C. AUTOMOBILE LIABILITY Insuring automobile liability insurance through a captive is similar to self-insuring automobile liability. Typically a self-insurance certificate is valid for a period of one year and may be renewed annually. As a captive insurance company, the City would receive its initial Certificate of Authority upon licensure. The Certificate of Authority, unless revoked, is good for the life of the captive. A captive is a licensed insurance company in the State of Hawaii. The captive has the ability to issue and provide certificates of insurance for automobile coverages up to statutory limits. Captives and
20

self-insurers of automobile liability insurance are both regulated by the Hawaii Insurance Division. It would be appropriate to insure automobile liability risks in a captive and again, excess protection should be purchased. A captive insurance company would allow its parent company/insured additional flexibility in drafting its commercial automobile liability policy and also in addressing the stated limits of protection. Insuring automobile liability coverage in a captive will also provide for accountability in tracking the true cost of insurance for this type of coverage. All expenses related to administering the auto liability portion of the captive insurance program could be allocated to this line of business. D. PROPERTY Property insurance may also be insured through a captive insurance company, with minimal licensed insurer requirements. A Hawaii-based captive can insure property risks on a direct basis for any amount of coverage desired, upon approval by the Insurance Commissioner. A captive can be a very effective tool in developing a property insurance program. The captive could be utilized in many different ways. It may act as the primary insurer or it may act as the reinsurer or excess insurer of the program. Specific levels of coverage could be insured, such as $5,000,000 xs $1,000,000. It could also insure high level excess layers, such as $25,000,000 xs $125,000,000. Having a captive would provide the parent company/insured additional flexibility when developing its property insurance program. A captive also will allow the parent company/insured to include terrorism insurance as part of the property program, pursuant to the Terrorism Risk Insurance Act of 2002. This would enable the City to access an additional funding source if an act of terrorism occurred in Hawaii and impacted property owned by the City.
21

E. OTHER The other coverage mentioned that might be included in a captive – fidelity, surety and employee benefits – would only be considered after the captive was well established. This is because these coverages don’t fit the same frequency and severity predictability as the other ones discussed above. Other opportunities for the City would be to insure environmental liabilities in a captive insurance company. Captives have been formed in Hawaii and in other domiciles that insure such risks as pollution liability, contract pollution liability and remediation cost cap insurance. These captives have been formed by a variety of private sector companies, which include government contractors. Currently the Environmental Financial Advisory Board, which advises the Environmental Protection Agency on financial assurance related to closure and cleanup liabilities and is exploring the use of a captive insurance company as a financial assurance mechanism.
The captives that have been formed to insure these coverages have the ability to fund future potential liabilities in the captive and then are able to invest the monies according to a long-term loss payout pattern. This allows the captive investment to grow over time at potentially more aggressive investment rates than reserves for typical lines of insurance, such as property and automobile liability.
The City might also consider insuring some of its various types of future liabilities in the captive insurance program. Some examples would be liabilities related to the Clean Water Act, Sewer Fund, Solid Waste Landfill Closure and Post-closure Care Costs and Citizen Lawsuits. Currently, the City funds for these types of liabilities out of the General Fund as they arise (pursuant to Footnote 14, City and County of Honolulu, June 30, 2005 audited financial statements). By funding these reserves in a captive insurance company, the City would be allowed to tailor its insurance and risk management program to fit current and future liability needs. The captive will also have the ability to earn additional investment income for the City by funding these types of insurance coverage in the captive instead of retaining the liabilities on the balance sheet of the City or as a footnote in the financials.
22

V. CAPTIVE ADVANTAGES AND DISADVANTAGES A captive insurance program has advantages as well as disadvantages compared to the City’s current risk financing practices. Certain captive disadvantages are also inherent in self-insurance programs and those similarities are noted. Before considering implementing a captive insurance program, each of these points should be carefully evaluated. A. ADVANTAGES Some of the advantages for starting up a captive insurance program include the following:
• Improved cash flow – A captive insurance program provides the opportunity to invest capital and premium dollars paid into the captive. Based on HRS §431:19-110, a pure captive insurance company is required to invest in accordance with HRS §431:6, but has the ability to seek the approval of the Insurance Commissioner for use of other types of investments. This allows for a captive insurance company to have the ability to earn a higher rate of return. The typical interest rate for the types of long-term investments allowed for a captive is generally about 2% higher than the short-term investments utilized by the City. Of course, unforeseen factors could affect both types of interest rates in the future.
• Broader coverage – Unlike commercial insurance, captive insurers are not
required to make rate and form filings with the Department of Insurance. Captive insurance companies can offer a tailored policy to fit the needs of their insureds.
• Market stability – A captive provides insurance coverage and price stability in an
otherwise unstable marketplace that traditionally has short-term swings in the pricing and availability of insurance.
• Direct reinsurer access – A captive insurance company is allowed to negotiate
directly with reinsurance companies and pools. This direct access should also provide a better opportunity for a reduced overall cost of insurance by eliminating the cost of intermediaries.
• Accountability – The formation of a captive insurance program provides a
mechanism to track the expenses related to each type of coverage for each City department. All claims made would be reported to the captive insurance company. All expenses related to the function of the captive (employee salaries
23

and benefits, service providers, claim payments, etc) would be tracked to provide a true cost of risk.
B. DISADVANTAGES Some of the potential disadvantages of forming a captive insurance program:
• Capitalization and Commitment – The establishment of a captive insurance program will require a substantial outlay of initial capital (a letter of credit is an acceptable form of capital). Depending on the specifics of the captive insurance company formed, this amount of capital could be one-third to one-half of the annual premium paid to the captive. The amount of capital required is set by the Insurance Commissioner and the captive insurance company is required to maintain that capital funding at all times. Any reductions in capital require an additional contribution from the parent company.
• Inadequate loss reserves and potential losses – Captive owners must be prepared
for the possibility that in any given policy year greater losses than expected might occur (this is also true for self-insurance). This situation could trigger the need for additional capital contributions and also require notification to the Insurance Division. Independent Actuaries will review the adequacy of loss reserves on an annual basis.
• Additional service providers – By implementing a captive insurance program, the
parent company will be required to hire the following service providers:
1. Captive insurance manager 2. Independent actuary (also required for self-insurance) 3. Independent CPA 4. Claims administrator (also required for self-insurance)
24

VI. COST OF CURRENT AND EXPECTED LOSSES Information in this chapter and pertinent exhibits in Appendices A, B and C were developed for the purpose of evaluating the establishment of a captive insurance company. This data should not be used for any other purpose or released to any agency or person, except upon prior written approval of the City Auditor. The loss data used in this study was obtained from RM for an evaluation period as of June 30, 2005. This data was relied upon without audit or independent verification; however, it was evaluated for consistency and reasonableness. The City currently retains statutory limits for workers compensation and $2 million per occurrence for general liability and automobile liability exposures. These high retention limits create the potential for substantial variability in the projected loss estimates caused by, but not limited to, changes in the legal environment, expansion of benefits beyond what is reflected in historical experience, public attitudes, social conditions, and economic inflation. There is no guarantee that future loss payments will not differ from estimates projected herein. Moreover, these projections make no provision for extraordinary future loss emergence or experience not sufficiently represented in the historical data.
Projected losses for FY2006-07 are as follows:
• Workers compensation - $16,090,000 • General liability - $4,902,000 • Automobile liability - $1,277,000
Below is a description of the exhibits included in Appendices A, B and C. A. WORKERS COMPENSATION Exhibit A-1 summarizes the projected loss payments for workers compensation benefits over the ten-year fiscal period for losses with accident dates during this time period. Special Compensation Fund expenses are projected in Exhibit A-13 based upon actual payments made over a ten-year period. The selected amount of $1,000,000 per fiscal period is projected based upon the most recent three-year average of actual payments made to the Fund by the City and County of Honolulu. Fiscal Year 2006-07 total projected losses are estimated to be $16,090,000. One-half of these losses are projected to be paid within the first two years following the date of the covered accident, and the remaining expenditures are projected to be paid over a period of many years.
25

Exhibit A-2 provides information about City payroll expenditures, headcount and exposure trend. RM provided the FY2005-06 estimate of payroll and headcount. For the purposes of this study, future payroll increases are projected at 103% of the FY2005-06 level, and increasing 3% per year beyond that level. City workers compensation claim frequency is calculated in Exhibit A-3. Claim frequency based upon either payroll or headcount has been consistently declining over the experience period. The selected claim frequency projection for the future used in this study reflects this favorable trend, and expects that it will continue into the future years. Exhibit A-4 presents the first of four actuarial methods to estimate loss rates per $100 of payroll. Paid indemnity loss data is evaluated as of June 30, 2005. These amounts, segmented by accident/fiscal period, are projected to ultimate settlement values using the NCCI paid loss development factors appropriate for each fiscal period. Loss rates are consistent within a narrow range over the prior ten-year period, down from earlier fiscal periods in the early 1990’s. Declining claim frequency over this time period largely offsets increases in wage replacement costs due to inflationary pressures. Medical loss rates are calculated similarly in Exhibit A-5. These rates display a decreasing trend in the early 1990’s consistent with the decline in indemnity costs as accidents were eliminated. Medical loss rates are increasing more rapidly in recent years as medical inflation is rising faster than wage inflation. Exhibits A-6 and A-7 provide an alternate actuarial method to calculate these loss rates for indemnity and medical benefits. The results of the four methods are summarized in Exhibit A-8, and an average is taken to produce a selected estimate of ultimate loss in each fiscal period. This is a preliminary step to producing the indicated loss rate per $100 of payroll in Exhibit A-9. In Exhibit A-10, loss severity and trend indices are calculated for later use in this analysis. Average claim costs observed in the early years increased in line with inflationary expectations. Costs in later years increased more than inflationary indices due to the reduction in claim counts. Fewer total claim occurrences translate to higher average claim amounts for the claims that do occur. Since this analysis assumes that the favorable claim frequency reduction calculated in Exhibit A-3 will continue into the future, the trend severity index is selected consistent with this assumption. Future projected losses and loss rates for the ten fiscal periods are calculated in Exhibit A-11. Losses and loss rates are projected to increase over time due to moderate inflationary pressures. These estimates do not include any provision for extraordinary future loss emergence that could arise. Further, changes in the payroll amounts may affect these estimates. There is no guarantee that future amounts will not differ from these projected amounts, perhaps even substantially. Exhibit A-12 is needed to provide an estimate of annual costs associated with vocational rehabilitation benefits. The selected amount of $80,000 is included in projected losses in
26

Exhibit A-11, and trended for inflationary cost adjustments in subsequent years. This analysis assumes that the vocational rehabilitation program in existence today will continue to function at a similar level into the future. Exhibit A-13 calculates the expected annual average costs to the City for the State Special Compensation Fund assessment. Since this amount varies widely between years with a low observed amount of $452,000 and a high observed amount of $1,109,000, an average amount on the high end of estimates was selected and no inflationary adjustments were made. B. GENERAL LIABILITY A similar analysis is performed for general liability. The City currently retains the first $2,000,000 of loss arising from any one event, and this retention amount is assumed to continue in effect for the ten projected fiscal periods. Exhibit B-1 displays the projected loss amounts for the ten-year fiscal period starting in FY2006-07. Amounts projected in the first fiscal period displayed, FY2006-07 are for accidents or covered events occurring during FY2006-07. Exhibit B-2 examines historical operating budget and exposure trends for later use in this analysis. Exhibit B-3 summarizes claim count experience, and calculates claim frequency percentages based upon both operating budget and headcount. Exhibit B-4 presents the first of four actuarial methods to estimate loss rates per $1,000 of operating budget. In Exhibit B-4, paid loss amounts evaluated as of June 30, 2005 are used as the basis of the projection. In Exhibit B-5, incurred loss amounts are used as the basis of the projection. In Exhibit B-6, an alternate method is used with paid losses. And in Exhibit B-7 the alternate projection method is used with reported incurred loss amounts. The results of these four projections are summarized in Exhibit B-8 and a selection of projected loss in each fiscal period is made. In Exhibit B-9, loss rate amounts are calculated with the operating budget in effect for each historical fiscal period. In Exhibit B-10, average ultimate loss severity is calculated for the historical fiscal periods. In Exhibit B-11, a smoothed severity trend is fit to the observed historical data from Exhibit B-10. This smoothed trend line assumes that, on average, general liability costs for the City have been increasing by 3.2% annually, consistent with inflationary indices. Future projected losses and loss rates for the ten fiscal periods are calculated in Exhibit B-12. Losses and loss rates are projected to increase over time due to moderate inflationary pressures. Actual loss amounts can reasonably be expected to vary from these amounts due to the absence or presence of large losses during a fiscal year. These estimates do not include any provision for extraordinary future loss emergence that could
27

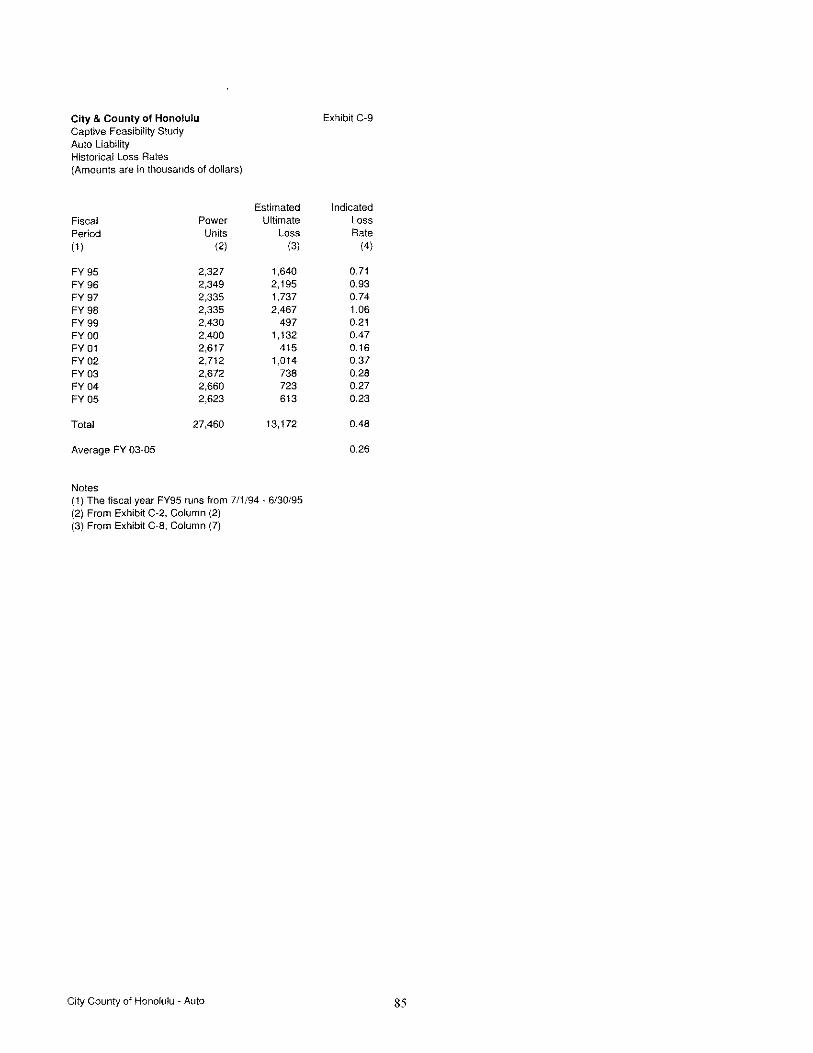
arise. Further, changes in the operating budget amounts may affect these estimates. There is no guarantee that future amounts will not differ from these projected amounts, perhaps even substantially. C. AUTOMOBILE LIABILITY The review of automobile liability includes the City’s subsidized fleet of vehicles. The City currently retains the first $2,000,000 of loss arising from any one event, for automobile liability, and $25,000 per occurrence for the subsidized fleet, and these retention amounts are assumed to continue in effect for the ten projected fiscal periods. Of the three lines examined in this study, the experience for the automobile coverage is the smallest in volume, and therefore subject to greater fluctuation. Actual results in individual fiscal years can vary substantially between years due to the absence or presence of a single large loss. Exhibit C-1 summarizes the projected loss payments for automobile liability and the subsidized fleet for the ten fiscal years commencing with FY2006-07. Similar to the prior exhibits in this study, the loss amounts projected in FY2006-07 are for accidents that occurred during FY2006-07. In Exhibit C-2, operating budget and exposure trend indices are calculated. Power units, or vehicle counts have fluctuated slightly during the prior five fiscal periods. For the purposes of this analysis, power unit amounts are assumed to be a constant 2,600 for the projected ten fiscal years. Accident claim frequency is computed in Exhibit C-3, for later use in this study. Exhibit C-4 presents the first of four actuarial methods to estimate loss rates. The method used in this exhibit relies upon paid losses, evaluated as of June 30, 2005 as the basis of the estimate. In Exhibit C-5, reported incurred loss amounts evaluated as of June 30, 2005 are used as the basis of the estimate. An alternate projection using paid losses is employed in Exhibit C-6. Similarly, the alternate projection method is used with reported incurred losses in Exhibit C-7. The results of these four methods are summarized in Exhibit C-8, and a selection of ultimate loss is made for each historical fiscal year. Loss rates for each fiscal year are then calculated in Exhibit C-9 with the selected projected ultimate loss amounts. Average historical auto loss severities are calculated in Exhibit C-10. Due to the sparsity of the data, a trend index could not be calculated from this data. A 3.0% inflationary assumption was selected for use in this study based upon other trend indices. Future projected losses and projected loss rates for the ten fiscal periods are calculated in Exhibit C-11. Losses and loss rates are projected to increase over time due to moderate inflationary pressures. These projected amounts are reflective of historical average loss experience of the City. Actual loss amounts can reasonably be expected to vary from
28

these amounts due to the absence or presence of large losses during a fiscal year. These estimates do not include any provision for extraordinary future loss emergence that could arise. There is no guarantee that future amounts will not differ from these projected amounts, perhaps even substantially. Exhibit C-12 provides estimated annual costs for the subsidized fleet, assuming a $25,000 retention amount. The projected amount for FY2006-07 is included in the projected losses in Exhibit C-11, and trended for inflationary cost adjustments in subsequent fiscal years.
29

This page intentionally left blank.
30

VII. COST OF CAPTIVE VS. SELF-INSURANCE In general, the cost difference between self-insurance and a captive for the City would be the amount of start-up and ongoing expenses as well as the initial capital outlay (although this could be in the form of a letter of credit). A. START-UP COSTS Costs included in the development and start-up of a captive insurance program will include fees for the following services:
• Preparation of feasibility study • Actuarial study to determine projected losses and confidence level • Legal fees associated with captive insurance company formation • Preparation and filing of Captive Insurance Application and Business Plan Typically, the start-up costs for a captive would be somewhere between
$65,000 - $100,000. B. ONGOING EXPENSES Once the captive insurance company is licensed by the Hawaii Insurance Division, there will be a number of required services provided by outside service providers. These include the following:
• Captive insurance management • Annual actuarial certification of reserves • Annual CPA audit • Legal • Claims Administration (these services may be provided by current City
personnel) The cost of these services would vary by the line of insurance coverage included in the captive insurance company. The reason for this variance in cost is attributable to the labor involved in preparing and maintaining captive insurance services for certain lines of insurance coverage. An example is that workers compensation coverage is a more labor intensive line of insurance than property coverage.
Below is a breakdown of the estimated cumulative annual operating expenses if the City was to implement and license a captive insurance subsidiary. These fees are allocated by line of coverage and assumes the City will continue to administer claims:
31

• Workers compensation - $130,000 • General liability - $35,000 • Automobile liability - $35,000 • Property - $25,000 • Other - $25,000
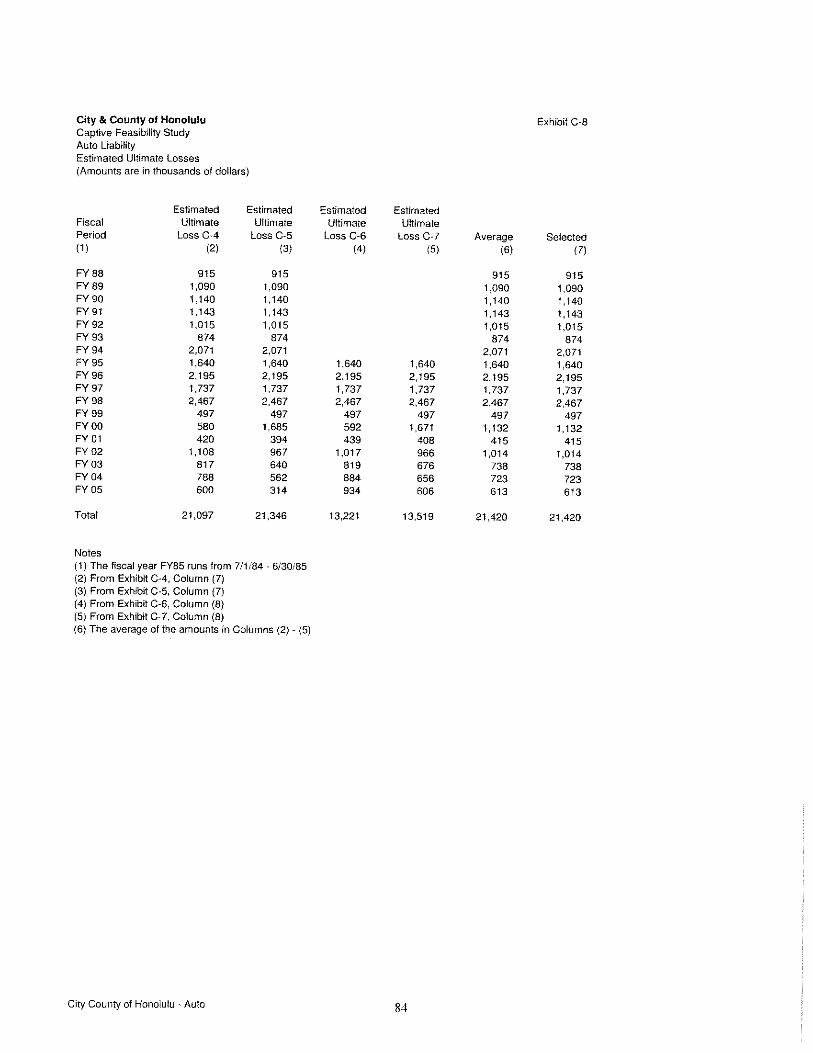
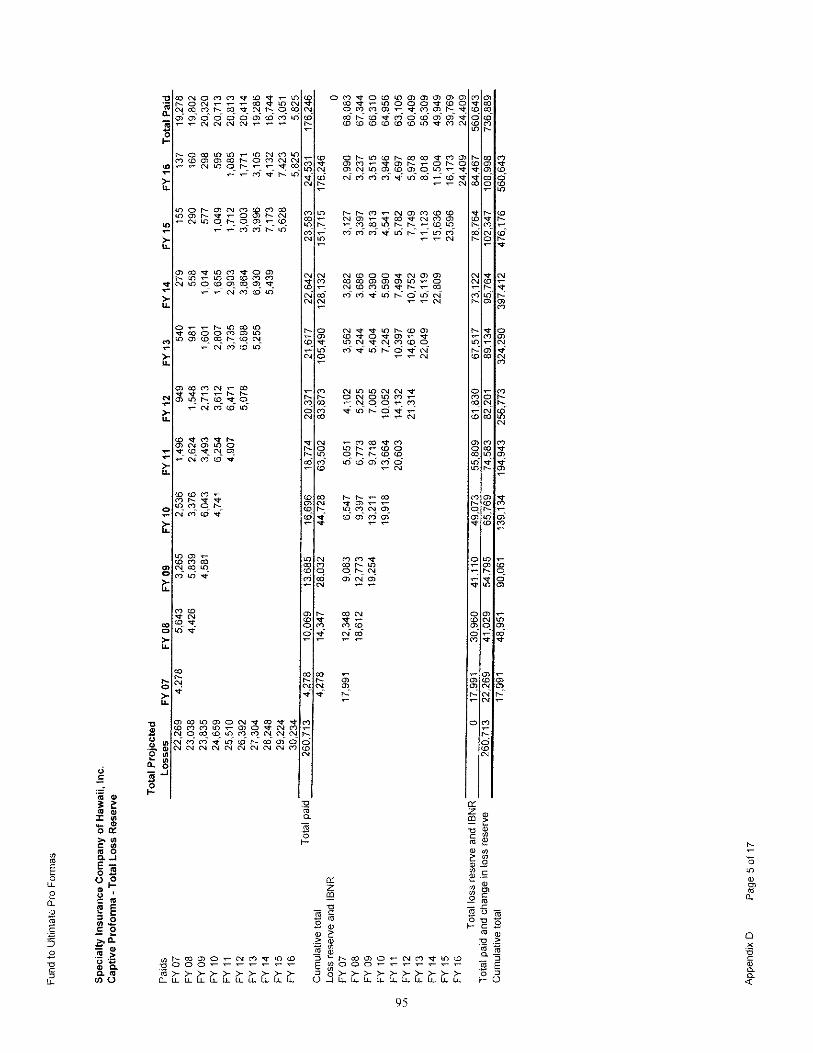
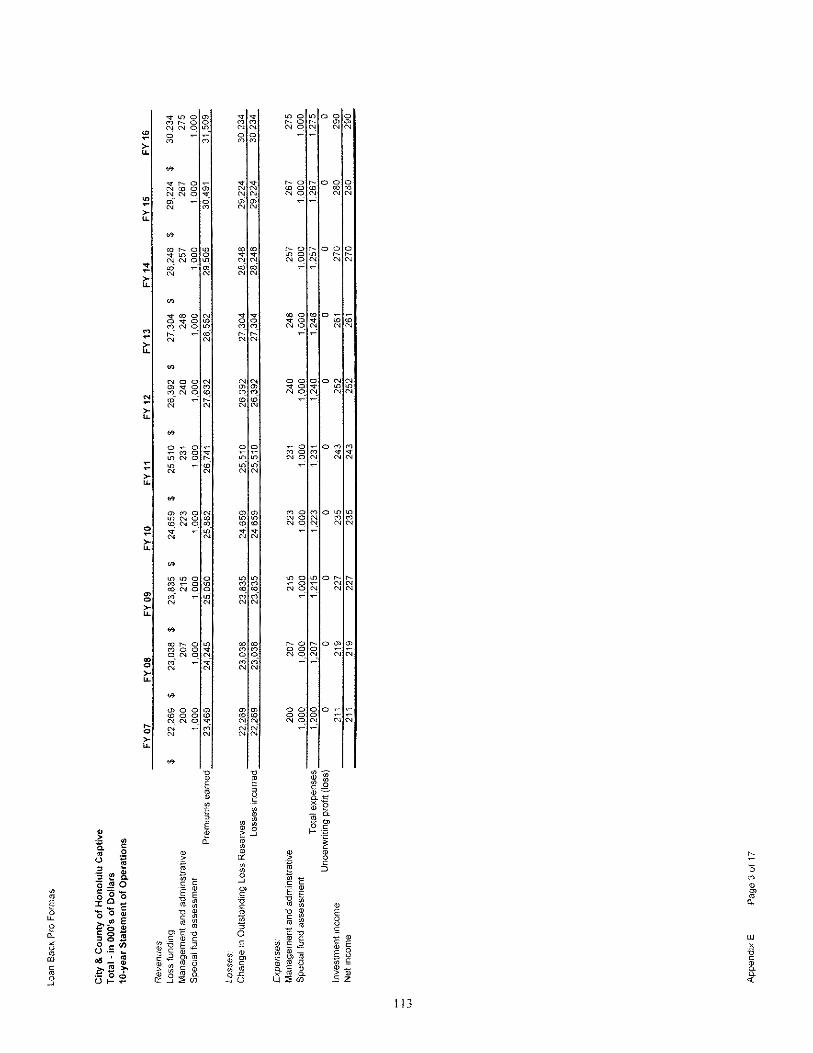
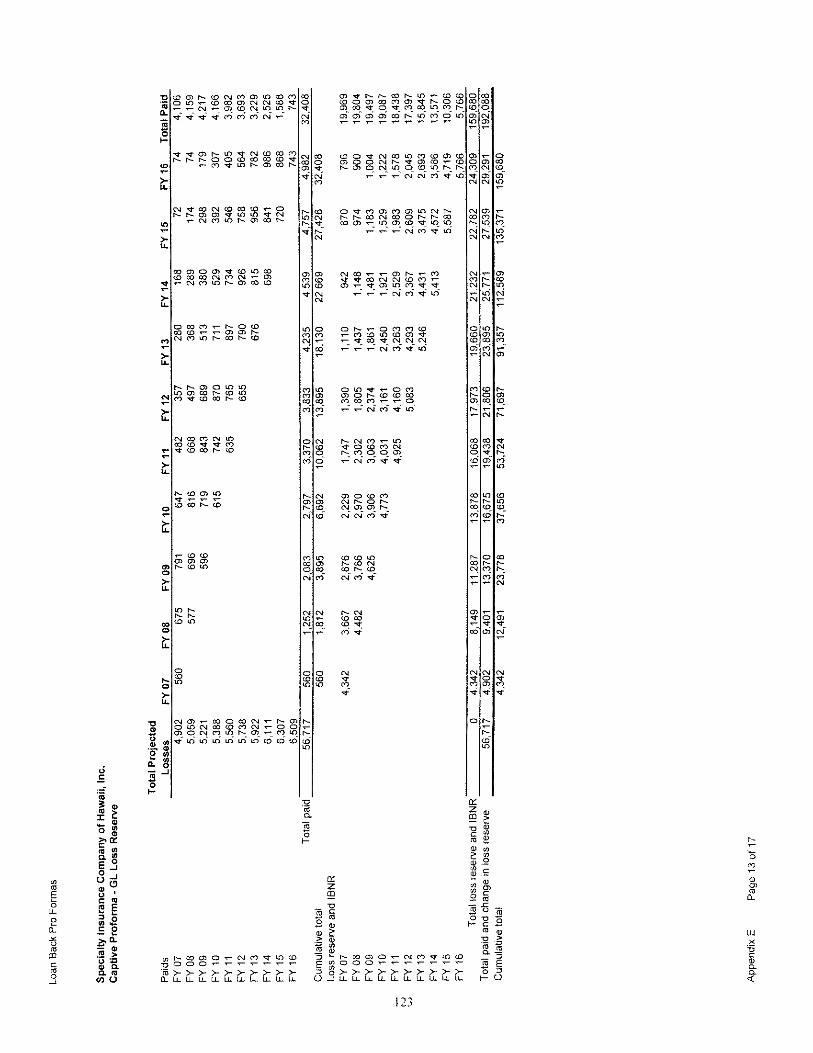
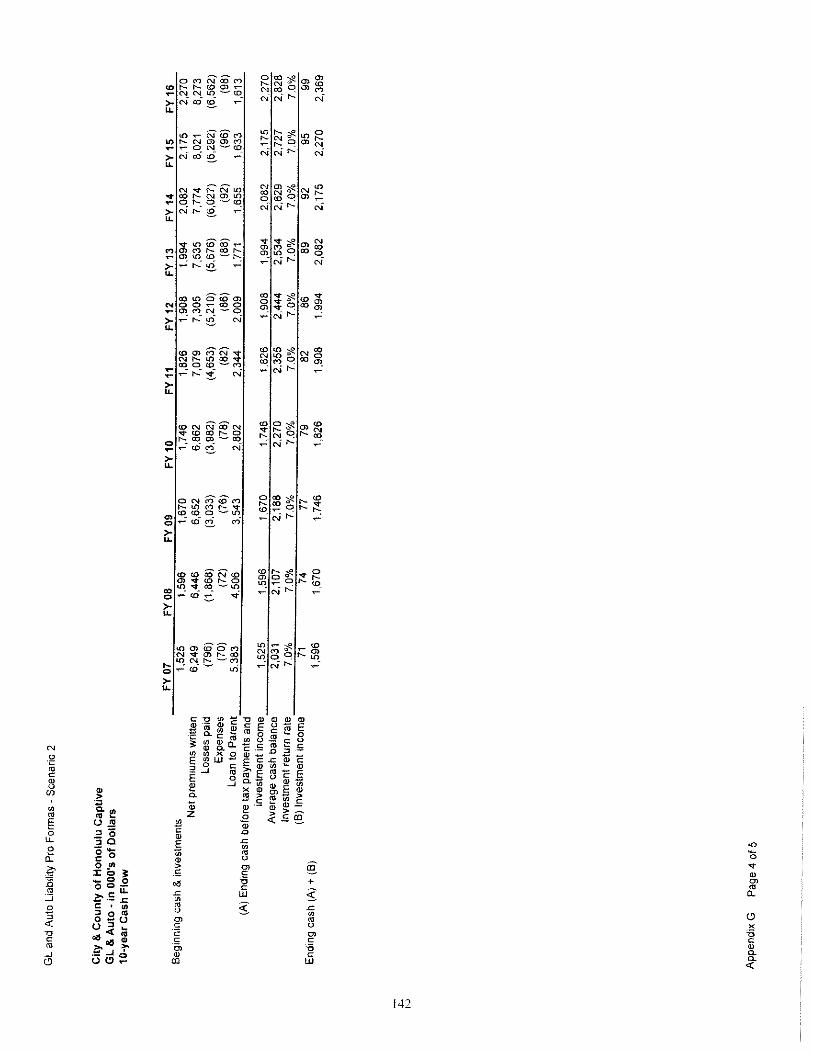
C. LOSS RESERVE FUNDING APPROACHES A captive funds its actuarial reserves to a confidence level determined by the Actuary. Typically a captive will ensure that these reserves are “funded to ultimate”. This terminology means that the full amount of actuarially projected ultimate losses for each line of insurance coverage is deposited into the captive. This is different than the City’s current method of only funding the expected paid losses in the coming fiscal year. We have developed pro forma financials for both scenarios. These can be found in Appendices E and F for workers compensation, general liability and automobile liability. Below are the amounts of funding necessary (see actuarial projections in Appendices B, C and D) for each of the following coverages under the “fund to ultimate” method:
• Workers compensation - $16,090,000 • General liability - $4,902,000 • Automobile liability - $1,277,000
The City currently maintains investments in cash and cash equivalents and obligations of the U.S. Government, primarily in shorter-term securities. Based on this approach, during FY2003-04, the City earned interest income at an average rate of return of 1.76%. Captive funds can be invested in longer-term securities compared to what the City currently invests in. In general, the rates for allowable long-term securities are approximately 2% higher under a normal yield curve than the interest rates for short-term securities. While interest rates may fluctuate over time, the gap between the rates for long-term securities and short-term securities is fairly consistent. Because of the difference in interest rates, the additional investment income earned by forming a captive would exceed the investment income currently earned by the City. This investment income could then be used to offset the cost of setting up and operating a captive for the City. For example, the amount of workers compensation reserves needed during the first year would be around $11.6 million ($16.1 million ultimate funds less expected paid losses during the first year of $4.5 million) and 2% of this amount would net the City in excess of $200,000 in investment income. If cash-flow is an issue, then there is a unique financing feature available to captives, called a “loan back.” A loan back is a Promissory Note from the parent to the captive that will return any unnecessary funds to the parent/owner, upon approval of the
32

Insurance Commissioner. This approval is based on the parent/owners ability to repay the loan back on demand. Under this scenario, the amount funded that is excess of expected paid losses and expected operating expenses for the coming year would be loaned back to the parent/owner. The net effect is that amount of loss reserve funds in the captive for each coverage would be exactly the same amount that the City would set aside for its self-insured losses (excluding those from prior years – the captive would be set up on a “going-forward” basis). The only cost difference on an annual basis would be the ongoing expense. The estimated loss reserve funds needed under this approach would be as follows:
• Workers compensation - $4,482,000 • General liability - $560,000 • Automobile liability - $236,000
33

D. COMPARISON TO SELF-INSURANCE As mentioned above, if the City formed a captive, it has a choice of two different funding methods. Below is a summary of these methods and the cost differences between a captive and self-insurance. This summary also assumes no changes to the current claims administration process. Note that actual results could vary, based on the development of loss reserves. The “Funds Needed” amounts are actuarial estimates of future losses. The amounts for “Investment Income” assume that a captive earns 2% more on investments than the City currently earns.
Table VII-1 Cost of Captive vs. Self-Insurance
Funding Method Funds Needed
Captive Cost
Investment Income
Captive Cost
Difference FUND TO ULTIMATE
Workers Compensation $16,090,000 $130,000 $232,160 ($102,160)
General Liability $4,902,000 $35,000 $86,840 ($51,840)
Automobile Liability $1,277,000 $35,000 $20,820 $14,180
TOTAL $22,269,000 $200,000 $339,820 ($139,820) LOAN BACK
Workers Compensation $4,482,000 $130,000 N/A $130,000
General Liability $560,000 $35,000 N/A $35,000
Automobile Liability $236,000 $35,000 N/A $35,000
TOTAL $5,278,000 $200,000 N/A $200,000
Under the Fund to Ultimate method, the City would have to invest an additional $17 million in funds for all three coverages combined but, depending on actual paid losses and investment income, could earn around $140,000 more than the cost of operating the captive in the current interest rate environment.
Under the Loan Back method, the City would not have to invest any
additional funds compared to self-insurance. There would be no additional investment income earned compared to the current investment strategy of the City. Under this method, it would cost the City an additional $200,000 in operating expense for all three coverages combined.
34

The comparisons in the chart above do not include potential investment income that the City could earn if it placed its long-term liabilities in a captive. These would include environmental liabilities from its closed landfill sites, commitments for effluent reuse and sludge reuse under the Clean Water Act and citizen lawsuits alleging repeated spills and other violations under the same Act. The City could also include its Sewer Fund in the captive. This would allow it to earn a greater rate of return, until the funds were needed, than the City receives now. Below is a listing of the funds that would be eligible to be invested in a captive: Waipahu incinerator landfill $11,950,000 Kapaa sanitary landfill $14,237,000 Effluent reuse $20,000,000 Sludge reuse $10,000,000 Kailua & Kaneohe trust fund $2,100,000 Citizen lawsuit $0* TOTAL $58,287,000 *No reserve has been established If the eventual reserve for the citizen lawsuit is greater than $1.8 million, then the total amount of liabilities that could be placed in the captive would exceed $60 million. If the above amounts were currently invested by the City, then the additional investment income earned by the captive would be $1.2 million (2% of $60 million), as long as the fund balance remained at $60 million. If the liabilities are not currently invested, then the income earned by the captive could be as much as $3.0 million (5% of $60 million).
35

This page intentionally left blank.
36

VIII. FEASIBILTY OF CAPTIVE A. CONCEPTUAL When reviewing the potential for the City to form a captive insurance subsidiary, it is prudent to review other public entities that have formed captives either in Hawaii or in other domiciles. There have been a number of captive insurance companies formed by various types of public entities. These include public utilities, school districts, pools and joint-power authorities. Some of the ones that have formed captives in Hawaii include a group of independent colleges, a school district, and a joint-power authority. Utilization of captives for public entities is not a new concept. Approximately 80% of U.S. states have passed legislation to allow public entities to form pools. These pools provide the opportunity for a group of public entities to come together and form a group or pool for the purpose of purchasing insurance. The pool gives the group additional buying power, which in turn reduces the total cost of commercial insurance. For states like Hawaii that have not enacted this type of legislation, a captive insurance company is a viable option. A captive would enable a single public entity or a group of public entities to join together and have the ability to purchase insurance through a captive insurance company. The ability to add other public entities into the captive program would provide for a better spread of risk. This diversification can help mitigate adverse loss development in the captive insurance company and provide more options for excess insurance coverage in the marketplace. Ultimately, this should reduce the COR. Large non-profit organizations have also formed captive insurance companies. We have reviewed and evaluated one such organization for the purpose of this report. The entity has had a Hawaii captive for about 10 years and insures property, liability and workers compensation insurance through its captive. By having a captive insurance company, the parent organization is better able to calculate its “true cost of risk” as all losses under $500,000 are insured through the captive. The captive utilizes a manuscripted policy that gives the parent organization the ability to broaden its coverage and provides it with better control over its risk management program. The captive also provides access to reinsurance and excess insurance markets as well as primary insurance carriers. The parent organization handles the claims for the captive subsidiary. This results in better loss control of the program. The captive also helps to “smooth out” large losses incurred by various business units. Captives domiciled in Hawaii are regulated by the Captive Insurance Branch of the Hawaii Insurance Division (“Division”). The Division is highly respected nationally and internationally in the captive insurance industry for its flexibility and prudent regulation
37

of captive insurance companies. The Division has been regulating captive insurance for twenty years and is the second largest captive domicile in the United States. There are five classes of captive insurance companies that may be formed in Hawaii. These classes are as follows:
• Class 1 - A class 1 captive is a “pure” captive insurance company that is allowed to provide reinsurance.
• Class 2 - A class 2 captive is also a “pure” captive insurance company and is
allowed to provide direct insurance and reinsurance. • Class 3 - A class 3 captive may be formed as a Risk Retention Group or as an
Association captive insurance company. This type of captive is formed for a group or association of like companies with similar risk. A Risk Retention Group is only allowed to provide liability insurance.
• Class 4 - A class 4 captive is also called a “Leased Capital Facility” and is
known as a rent-a-captive in other captive domiciles. • Class 5 - A class 5 captive is allowed to provide excess insurance or reinsurance.
Of the five classes of captive insurance companies allowed in Hawaii, a class 2 captive insurance company would be the most feasible for the City. According to HRS §431:19-101, “A pure captive insurance company is a special purpose entity created to insure the exposures of its parent organization, subsidiaries, affiliates and organizations in which the parent organization maintains a working relationship with, and whose business risks insured by the pure captive insurance company are similar or related to the business risks of, the parent insured by the pure captive insurance company”. This means that the City could potentially insure the risks of the Board of Water Supply and Oahu Transit Services, Inc. It would also enable the City to include in its captive insurance program the risks of other counties and public entities throughout the State of Hawaii. A pure captive insurance company has the ability to provide coverage in a difficult market. It will also allow for market stability and reduce the total cost of insurance since the City will no longer be subject to price swings in the marketplace. The pure captive structure allows for direct access to reinsurance and the excess markets. This strategy also provides the potential for long term cost savings by controlling losses through an effective risk management and loss control program. A pure captive is also allowed to transact multiple lines of insurance or reinsurance, such as workers compensation, general liability, automobile liability and property. Exhibit VIII-1 is the structure of a pure captive insurance company.
38

Exhibit VIII-1
Pure Captive Structure
Parent Company
Insured is parent, subsidiaries , affiliates
or companies that have a business relationship with Parent Company
Class 2 Captive Insurer
Provides direct insurance or reinsurance.
Minimum Capital = $250 ,000
Reinsurer / Retrocessionaire
(Reinsures Class 2 captive)
Excess Insurer
( Insures above Captive
retention )
39

A Class 2 captive requires minimum capital of at least $250,000, but the actual amount will be based on a review of the insurance program by the State Insurance Division.
Below is a discussion of amount of risk to be retained by a captive, the process involved in implementing a captive and ongoing requirements of a captive.
1. Retained Risk The amount of risk to be retained by the captive will be based on the findings of a certified Actuary. In general, the captive is required to retain a portion of the risk of the insurance program for the transaction to be considered insurance. There is no minimum amount of risk to be retained in the captive. With this structure, the level of risk retained by the captive may be at the first-dollar level (e.g., the first $250,000 of each loss) or in an excess layer (e.g., $500,000 excess $500,000 each loss).
2. Implementation Process
It usually takes around 90-120 days for a pure captive insurance company program to be implemented. Below are the implementation steps:
a. Select a captive insurance consultant to prepare a feasibility study. b. Select a certified actuary to prepare projected losses and pro-forma
financial statements for the captive. c. Select a captive insurance manager. d. Prepare licensing documents that include the following:
• Executive summary • Business plan • Specific state application form • Actuarial report • Five-Year pro forma financial statements • Articles of incorporation and by-laws • Biographical affidavits of officers and directors • Names of reinsurers or excess insurers • Draft policy to be issued by the captive • Service provider profiles
An initial meeting with the Captive Insurance Administrator is required prior to completing and filing the captive insurance application for the captive with the State of Hawaii. The first steps of the process will require approximately sixty to ninety days if all of the required information is readily available. The application for licensure is
40

then filed with the Hawaii Insurance Division for review and approval. The licensure process will take up to 30 days for completion. Once approval has been granted, capitalization and formation of the company is completed. The captive will then receive its Certificate of Authority from the Hawaii Insurance Division and can begin transacting business.
3. Ongoing Requirements
The ongoing requirements of the pure captive are as follows:
• Annual Board of Directors meeting in Hawaii • Annual Actuarial report • Annual audited financial statements, GAAP basis • Annual filing of forms and fees • Filing of any changes in the application and business plan
– these are required to be approved by the Division prior to implementation
The pure captive insurance program is dependent on the parent organization’s long-term view of the program. There will be capital requirements set forth by the Division. If the capital falls below the minimum amount, the parent will be required to infuse additional capital. If there are inadequate loss reserves or loss control strategies, additional capital outlay may also be required.
B. FINANCIAL The estimated cost of operating a captive for the City would be $200,000 if its workers compensation, general liability and automobile liability risks were insured through it. We have shown in Chapter VIII how additional investment income would exceed this cost if the City funded the captive with ultimate loss reserves. We have also indicated that the City could place other long-term liabilities in the captive and gain even additional investment income. This additional income could well exceed $1 million annually. The bottom line is that a captive is much more than a risk financing option. It is a powerful investment vehicle that provides the City the ability to realize investment gains that are not otherwise available to them. Potential income from these activities far outweighs the captive's operating costs.
41

C. CONCLUSIONS A captive insurance company is a feasible risk financing option for the City from both a conceptual and financial perspective. A captive will also allow the City to better maintain accountability for its entire insurance and risk management program. Recommendation
We recommend that the City form a captive to address its risk and liability obligations.
Before implementing a captive insurance program, the City should seek the services of a consultant/captive manager to assist in the formation and captive insurance application process. Initially, it is recommended that the City place its general liability and automobile liability risks (both City and subsidized vehicles) into the captive. The following table reflects the estimated costs if the City adopts our recommendation of forming a captive for its general liability and automobile liability risks.
Table VIII-1
Estimated Captive Costs
General Liability & Automobile Liability
Capital Investment $ 1,250,000
Start-Up Costs $ 65,000
Ongoing Expenses $ 70,000
Loss Reserves
Fund to Ultimate $ 6,179,000
Loan Back $ 796,000
Please note that the capital can be in the form of cash, LOC or trust fund. The amount of loss reserves needed would depend on which method the City chose. Pro formas for the above recommendation can be found in Appendices F and G. The City should also consider eventually placing its workers compensation risks in the captive but only after the following activities have taken place:
42
• Centralize the risk management function under the Department of Budget and Fiscal Services, Risk Management Division,
• Have an audit performed of the administration of workers compensation
claims, and
• Purchase excess workers compensation coverage. Once the captive is established, the City will have the ability to tailor its insurance program to include other types of insurance coverages, such as long-term liabilities and excess insurance layers (for both property and liability) in the captive insurance program. The City could also offer to provide insurance protection to other public entities located in the State.
43

This page intentionally left blank.
44