Capstone projects '12
20
Service Learning in Belize: ANRI Seedling House Andrea Love, Tandie Bailey, Jessica House, Douglas Wolf Capstone for Minor in Sustainability Department of Agriculture, Food and Life Sciences Department of Agriculture, Food and Life Sciences ANRI The New Seedling House Sustainability • The Agriculture Natural Resource Institute (ANRI) is a secondary education institution specifically focused around agricultural education. It is located just outside Dangriga, Belize. • Managed System: • This system concentrates on the life cycle assessment of raw materials to finished products. Th h ill h th l t d ti lif l Thi i • Nine students from the University of Arkansas with various backgrounds worked together to plan, design, and build the new seedling house for ANRI. • The location of the seedling house was determined by ANRI staff, which would be located behind their gardens and greenhouse. • The school rests on 240 acres, in the midst of citrus fields and jungle and is about a thirty-minute drive from Dangriga down a bumpy, country road. They raise pigs, chickens, rabbits, and an assortment of vegetable crops, including okra, sweet peppers, hot peppers, tomatoes, and beans, all on just 30 acres of production. • A functioning seedling house is important to ANRI because they use much of what they grow for school lunch They also send • The house will enhance the plant production lifecycle. This is obtained by allowing to seedlings to be grown in an environment independent of pests and extreme weather. With an enhanced chance of survival, the reproduction is possible for many years, providing long term self sufficiency. • The netting used on the house was also UV and pest resistant which will increase the health of the seedlings as well as eliminating negative externalities caused by the use of chemical pesticides. • Four treated lumber posts were placed at the corners of the structure to ensure stability while additional posts and support beams were placed in strategic places to keep the structure sound. • PVC pipe was used to build the concave-shaped roof, which would support the netting that covered the seedling house. The structure was fitted with the netting from roof to floor and secured in a manner so that it could be removed before severe weather, such as hurricanes. • Gravel was placed inside the structure to level the floor and also atop of the netting on the ground to keep it secure from the wind. • A double door was constructed for further protection against insect infiltration. • Four tables were constructed to hold the seedlings off the ground. Each table holds ten seedling trays, totaling forty available trays for plant production. The original seedling structure only supported eleven trays. The Old Seedling House use much of what they grow for school lunch. They also send some of the vegetables home with their students. • Built Systems: • involves the design and construction of buildings, including related infrastructure, in connection with the use of natural resources and environmental health. • The materials used were locally available, relevant goods. • The structure was designed to maximize seedling protection in several ways. For example, double door entrance and treated netting without the use of chemical pesticides. • The floor plan design maximizes usable space in the structure. Results Completed table for the seedling house Brady Long finishing up the seedling house • It took a week to complete the seedling house structure. It’s finished dimensions were fourteen feet wide by twenty-four feet long by eight feet high. They will be able to hold forty seedling trays compared to the eleven from the previous seedling table use from 2008. • The house was constructed in a way that the netting and the seedling trays could be removed and kept from damage in severe weather conditions, thus preserving the usability of the structure for many years to come. First day of work at ANRI constructing the support posts. The Original Seedling House at ANRI Reflections • In no other study abroad program are you as a student able to learn through service or asked to look a global issue in the face and have the opportunity to solve it. Students are given responsibility and asked to step up as leaders. • Sustainability is difficult to fully achieve. Getting everybody to agree on something takes constant communication and the ability Since 2008, the students had been using a temporary structure made of rough lumber supports and a thatched roof. Because there were no walls, their small tray of seedlings were covered loosely in netting, held up by an unsteady piece of PVC pipe. This seedling table was insufficient for the school’s needs in several ways: • The table was small and only held a limited number of seedlings. • The netting was not attached tightly to the structure so the seedlings were still vulnerable to pests. Acknowledgements Sustainability to compromise; however, the end results far outweigh the obstacles and complications. • Dr. Jennie Popp advised the project. • Mr Derick Clare the principal of ANRI requested the seedling The Ministry of Agriculture in Belize provided the basic design for the seedling house. It was our job to identify cost effective materials to build the structure and to create seedling boxes that optimized production of seedlings in the structure. Completed seedling house being inspected by ANRI staff Inside the house with the completed seedling tables Completed house with all participating UA students and ANRI 3 rd form class • Social Systems: • involves the social behaviors, interactions, and dynamics in relationship to environmental sustainability. • Most Dangriga farmers purchase seedlings from the government run Central Farm. Seedlings are costly, varieties are limited and sometimes POSTER TEMPLATE BY: www.PosterPresentations.com • Mr . Derick Clare, the principal of ANRI requested the seedling house and worked diligently with the UA to see the project through. • Mrs. Francelia Linarez, the Vice Principal helped the UA students with any issue they had and was incredibly helpful throughout the entire project. • Jeff Lieberman and Hannah Huntley, the University of Arkansas’ Peacework Village Initiative representatives, arranged for the communication between ANRI and the agriculture team. The Proposed Seedling House from the Ministry of Agriculture Most Dangriga farmers purchase seedlings from the government run Central Farm. Seedlings are costly, varieties are limited and sometimes unavailable when needed. • The seedling structure at ANRI directly serves students and faculty and also has the potential to benefit the surrounding community as well if ANRI chose to have a seedling market. • The seedling structure is an appropriate, reliable space for sustainable agriculture learning to occur. Having such an experience in school could help young graduates of ANRI better manage their own farms, thus leading to better production, and possible social mobility. • There is a community investment across the board, which leads us to believe that the seedling structure will continue to be useful to ANRI and empower the local community for many years to come.
-
Upload
uaocs -
Category
Technology
-
view
547 -
download
10
description
These p
Transcript of Capstone projects '12
Service Learning in Belize: ANRI Seedling HouseAndrea Love, Tandie Bailey, Jessica House, Douglas Wolf
Capstone for Minor in SustainabilityDepartment of Agriculture, Food and Life SciencesDepartment of Agriculture, Food and Life Sciences
ANRI The New Seedling House Sustainability• The Agriculture Natural Resource Institute (ANRI) is a secondary
education institution specifically focused around agricultural education. It is located just outside Dangriga, Belize.
• Managed System:• This system concentrates on the life cycle assessment of raw
materials to finished products.Th h ill h th l t d ti lif l Thi i
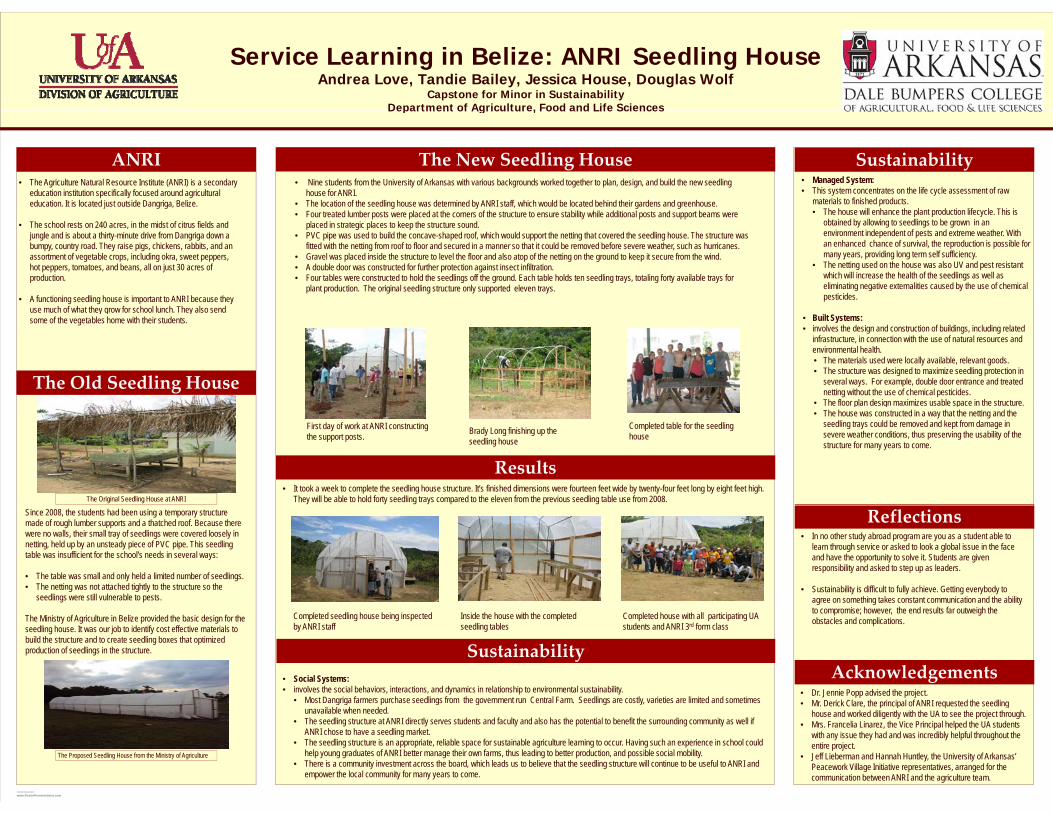
• Nine students from the University of Arkansas with various backgrounds worked together to plan, design, and build the new seedling house for ANRI.
• The location of the seedling house was determined by ANRI staff, which would be located behind their gardens and greenhouse.
• The school rests on 240 acres, in the midst of citrus fields and jungle and is about a thirty-minute drive from Dangriga down a bumpy, country road. They raise pigs, chickens, rabbits, and an assortment of vegetable crops, including okra, sweet peppers, hot peppers, tomatoes, and beans, all on just 30 acres of production.
• A functioning seedling house is important to ANRI because they use much of what they grow for school lunch They also send
• The house will enhance the plant production lifecycle. This is obtained by allowing to seedlings to be grown in an environment independent of pests and extreme weather. With an enhanced chance of survival, the reproduction is possible for many years, providing long term self sufficiency.
• The netting used on the house was also UV and pest resistant which will increase the health of the seedlings as well as eliminating negative externalities caused by the use of chemical pesticides.
• Four treated lumber posts were placed at the corners of the structure to ensure stability while additional posts and support beams were placed in strategic places to keep the structure sound.
• PVC pipe was used to build the concave-shaped roof, which would support the netting that covered the seedling house. The structure was fitted with the netting from roof to floor and secured in a manner so that it could be removed before severe weather, such as hurricanes.
• Gravel was placed inside the structure to level the floor and also atop of the netting on the ground to keep it secure from the wind.• A double door was constructed for further protection against insect infiltration.• Four tables were constructed to hold the seedlings off the ground. Each table holds ten seedling trays, totaling forty available trays for
plant production. The original seedling structure only supported eleven trays.
The Old Seedling House
use much of what they grow for school lunch. They also send some of the vegetables home with their students. • Built Systems:
• involves the design and construction of buildings, including related infrastructure, in connection with the use of natural resources and environmental health.• The materials used were locally available, relevant goods.• The structure was designed to maximize seedling protection in
several ways. For example, double door entrance and treated netting without the use of chemical pesticides.
• The floor plan design maximizes usable space in the structure.
Results
Completed table for the seedling houseBrady Long finishing up the
seedling house
• It took a week to complete the seedling house structure. It’s finished dimensions were fourteen feet wide by twenty-four feet long by eight feet high. They will be able to hold forty seedling trays compared to the eleven from the previous seedling table use from 2008.
p g p• The house was constructed in a way that the netting and the
seedling trays could be removed and kept from damage in severe weather conditions, thus preserving the usability of the structure for many years to come.
First day of work at ANRI constructing the support posts.
The Original Seedling House at ANRI
Reflections• In no other study abroad program are you as a student able to
learn through service or asked to look a global issue in the face and have the opportunity to solve it. Students are given responsibility and asked to step up as leaders.
• Sustainability is difficult to fully achieve. Getting everybody to agree on something takes constant communication and the ability
Since 2008, the students had been using a temporary structure made of rough lumber supports and a thatched roof. Because there were no walls, their small tray of seedlings were covered loosely in netting, held up by an unsteady piece of PVC pipe. This seedling table was insufficient for the school’s needs in several ways:
• The table was small and only held a limited number of seedlings.• The netting was not attached tightly to the structure so the
seedlings were still vulnerable to pests.
AcknowledgementsSustainability
g g yto compromise; however, the end results far outweigh the obstacles and complications.
• Dr. Jennie Popp advised the project.• Mr Derick Clare the principal of ANRI requested the seedling
The Ministry of Agriculture in Belize provided the basic design for the seedling house. It was our job to identify cost effective materials to build the structure and to create seedling boxes that optimized production of seedlings in the structure.
Completed seedling house being inspected by ANRI staff
Inside the house with the completed seedling tables
Completed house with all participating UA students and ANRI 3rd form class
• Social Systems:• involves the social behaviors, interactions, and dynamics in relationship to environmental sustainability.
• Most Dangriga farmers purchase seedlings from the government run Central Farm. Seedlings are costly, varieties are limited and sometimes
POSTER TEMPLATE BY:
www.PosterPresentations.com
• Mr. Derick Clare, the principal of ANRI requested the seedling house and worked diligently with the UA to see the project through.
• Mrs. Francelia Linarez, the Vice Principal helped the UA students with any issue they had and was incredibly helpful throughout the entire project.
• Jeff Lieberman and Hannah Huntley, the University of Arkansas’ Peacework Village Initiative representatives, arranged for the communication between ANRI and the agriculture team.
The Proposed Seedling House from the Ministry of Agriculture
Most Dangriga farmers purchase seedlings from the government run Central Farm. Seedlings are costly, varieties are limited and sometimes unavailable when needed.
• The seedling structure at ANRI directly serves students and faculty and also has the potential to benefit the surrounding community as well if ANRI chose to have a seedling market.
• The seedling structure is an appropriate, reliable space for sustainable agriculture learning to occur. Having such an experience in school could help young graduates of ANRI better manage their own farms, thus leading to better production, and possible social mobility.
• There is a community investment across the board, which leads us to believe that the seedling structure will continue to be useful to ANRI and empower the local community for many years to come.
INTEGRATED PASTURED POULTRY INFRASTRUCTURE
Carolina K. Proudfoot Capstone For Minor Sustainability,
Department of Agriculture, Food and Life Sciences
I
Integrated sustainable agriculture needs experimentation
stations. Infrastructure must be developed and implemented to
execute this much-needed research. The integrated pasture
poultry infrastructure project created the infrastructure needed to
execute a pasture poultry system within an orchard. The
infrastructure and management system that were created will
allow for the long-term study of soil quality and fertility, as well
as the ability to determine whether or not this integrated system
can cut down on the carbon inputs needed in traditional orchard
management.
There are three types of chicken houses needed to conduct
this study a brooder house, for starting all baby chickens or
chicks. Once the birds are old enough to go out to pasture their
housing is determined by the purpose of the bird. Laying hens
and broilers have different housing requirements. The laying
hens will then go into a movable henhouse equipped with roost
and laying boxes. The broilers will go into a finishing house this
house has no floor so that the broilers manure is deposited
directly onto the ground.
Recycled materials were used on 75 to 80% of all of the
construction on the houses. The building materials were
reclaimed from conventional poultry houses that no longer met
industry standards. These recycled materials made the
infrastructure more affordable.
Electric fencing is easily moved around the pasture as well as
being the best defense against predators. The electric fence
charger is powered using solar panels. Solar panels will also
eventually be installed to maintain the 15 hour light
requirements for laying hens to achieve maximum production.
Unfortunately solar lighting is not an option for broilers at this
time the wattage requirements for heat lamps is cost prohibitive
to use solar panels to generate enough power required for the
heat lamps which are needed for the first several weeks of
growth.
Sustainable Agriculture
Freedom Ranger check 3 day old movable brooder house on pasture
Materials
Design and Building
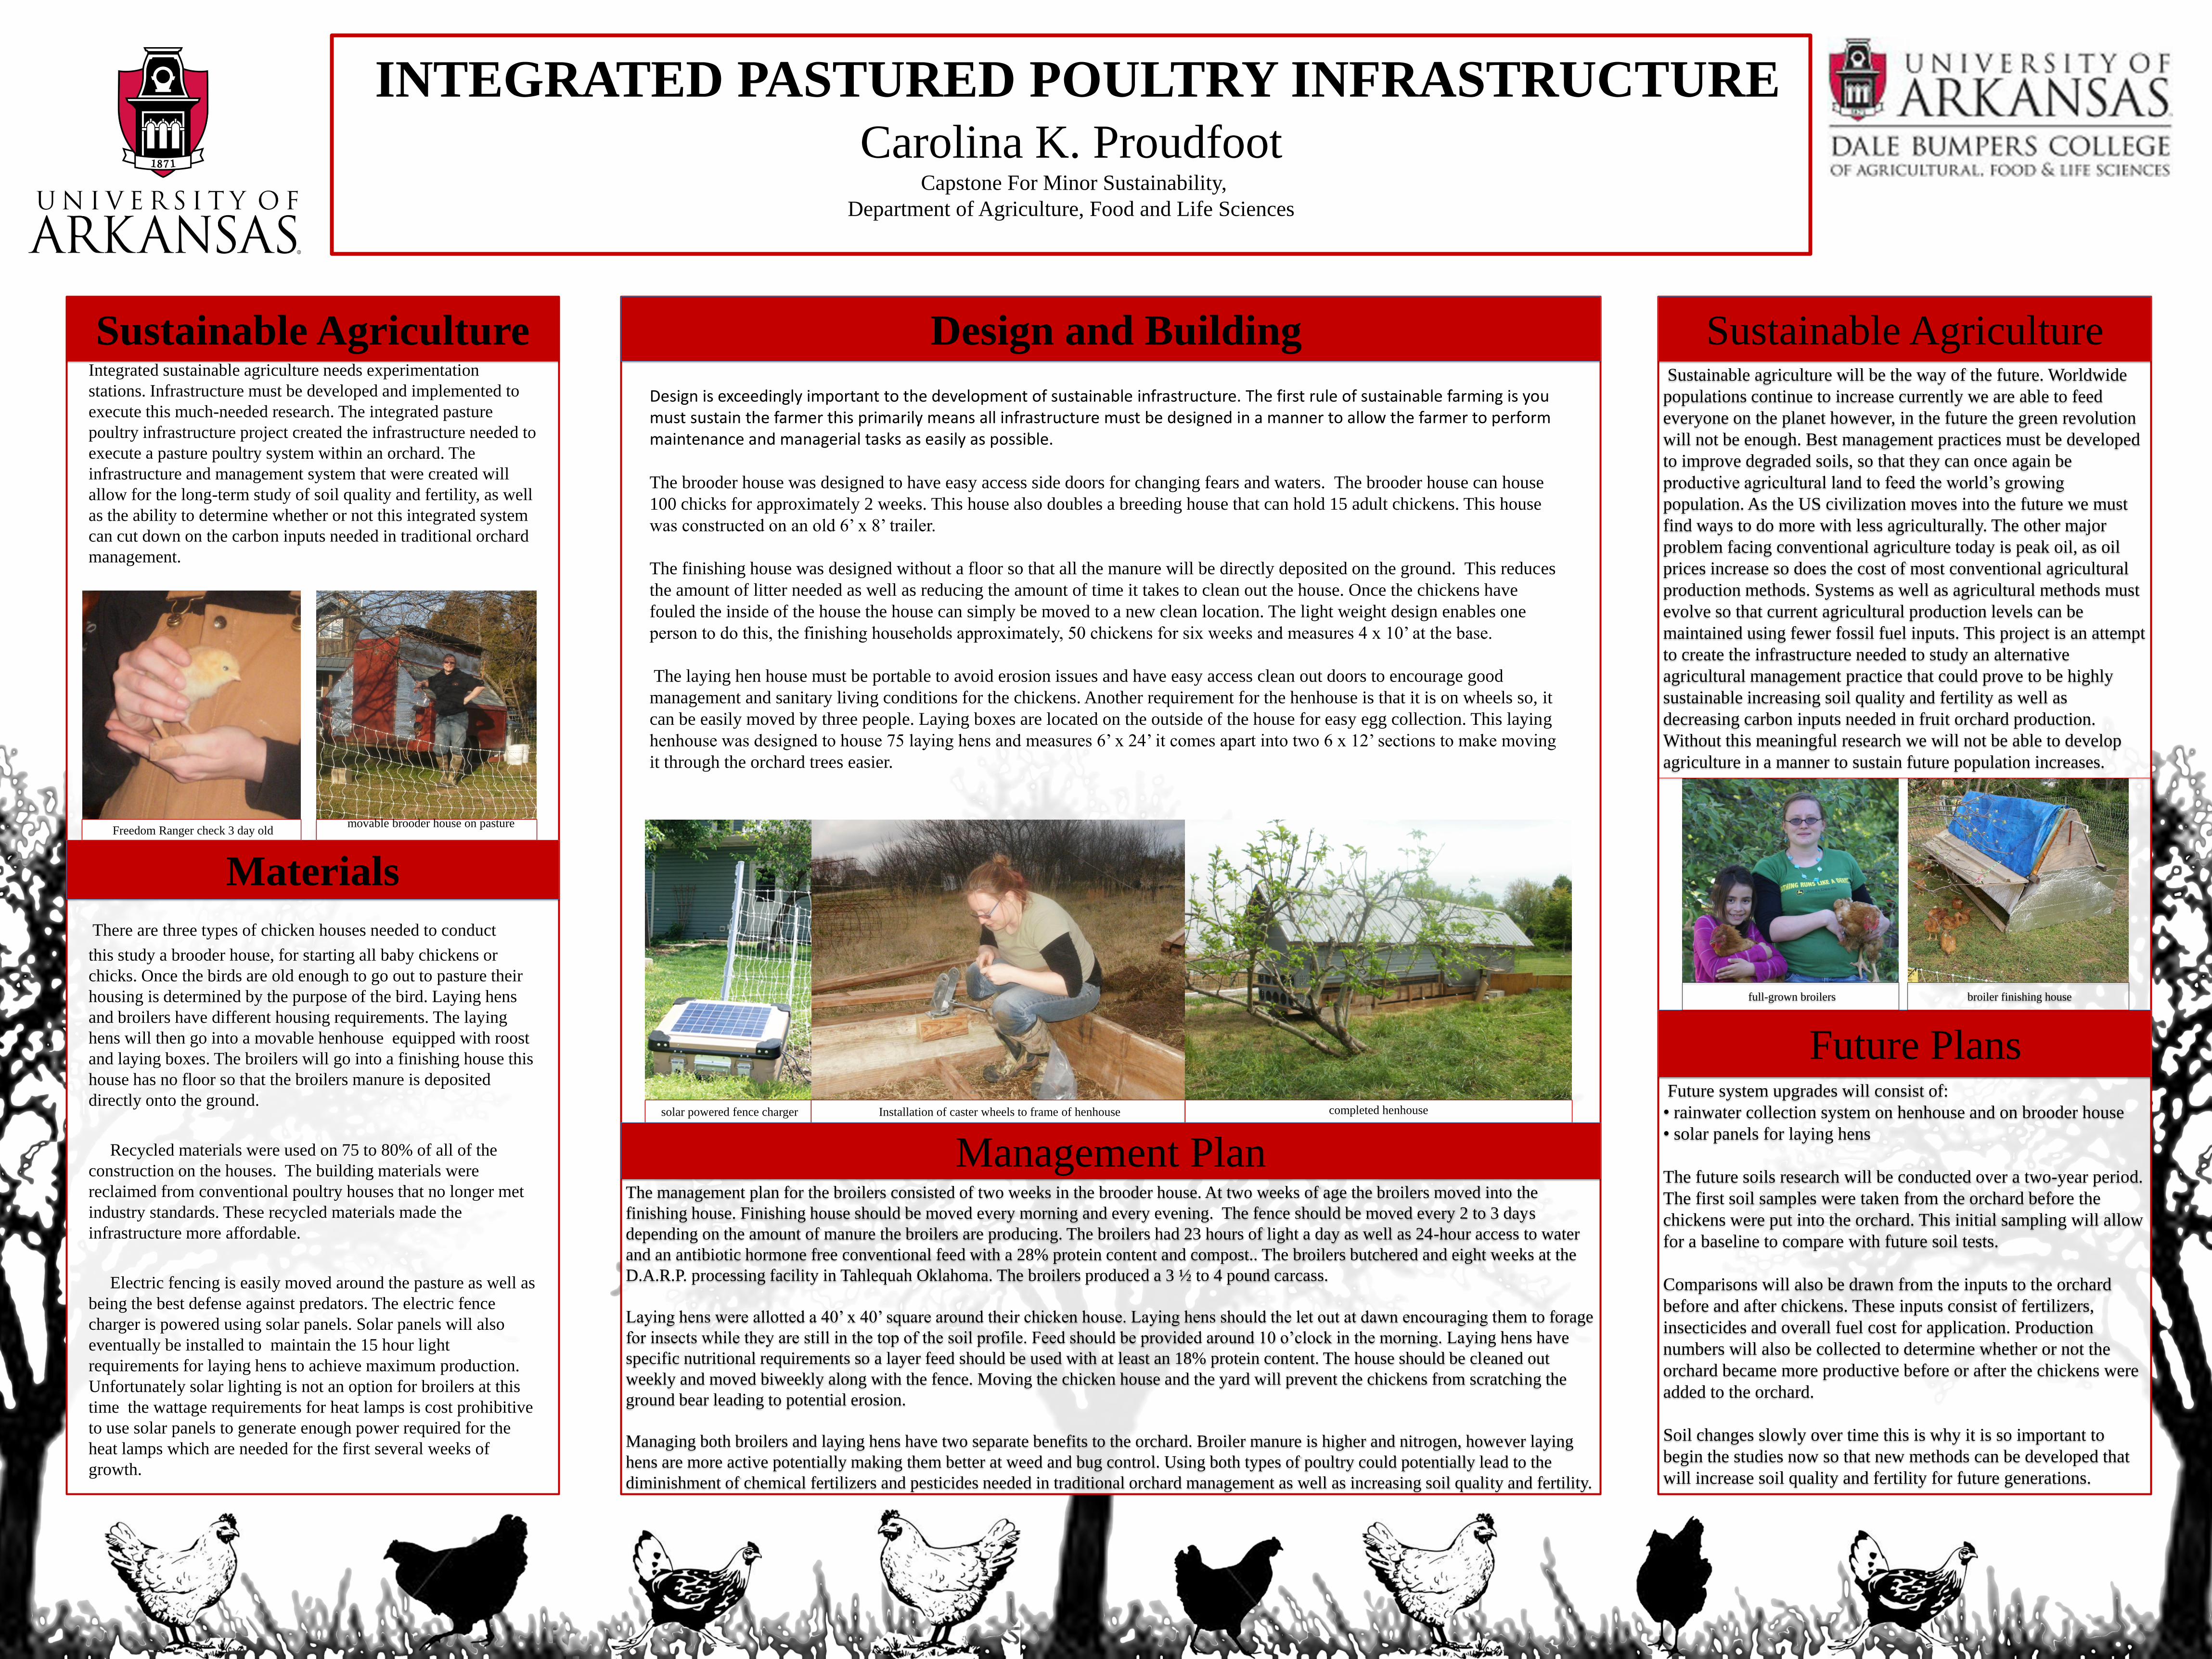
Design is exceedingly important to the development of sustainable infrastructure. The first rule of sustainable farming is you must sustain the farmer this primarily means all infrastructure must be designed in a manner to allow the farmer to perform maintenance and managerial tasks as easily as possible.
The brooder house was designed to have easy access side doors for changing fears and waters. The brooder house can house
100 chicks for approximately 2 weeks. This house also doubles a breeding house that can hold 15 adult chickens. This house
was constructed on an old 6’ x 8’ trailer.
The finishing house was designed without a floor so that all the manure will be directly deposited on the ground. This reduces
the amount of litter needed as well as reducing the amount of time it takes to clean out the house. Once the chickens have
fouled the inside of the house the house can simply be moved to a new clean location. The light weight design enables one
person to do this, the finishing households approximately, 50 chickens for six weeks and measures 4 x 10’ at the base.
The laying hen house must be portable to avoid erosion issues and have easy access clean out doors to encourage good
management and sanitary living conditions for the chickens. Another requirement for the henhouse is that it is on wheels so, it
can be easily moved by three people. Laying boxes are located on the outside of the house for easy egg collection. This laying
henhouse was designed to house 75 laying hens and measures 6’ x 24’ it comes apart into two 6 x 12’ sections to make moving
it through the orchard trees easier.
solar powered fence charger Installation of caster wheels to frame of henhouse completed henhouse
Management Plan The management plan for the broilers consisted of two weeks in the brooder house. At two weeks of age the broilers moved into the
finishing house. Finishing house should be moved every morning and every evening. The fence should be moved every 2 to 3 days
depending on the amount of manure the broilers are producing. The broilers had 23 hours of light a day as well as 24-hour access to water
and an antibiotic hormone free conventional feed with a 28% protein content and compost.. The broilers butchered and eight weeks at the
D.A.R.P. processing facility in Tahlequah Oklahoma. The broilers produced a 3 ½ to 4 pound carcass.
Laying hens were allotted a 40’ x 40’ square around their chicken house. Laying hens should the let out at dawn encouraging them to forage
for insects while they are still in the top of the soil profile. Feed should be provided around 10 o’clock in the morning. Laying hens have
specific nutritional requirements so a layer feed should be used with at least an 18% protein content. The house should be cleaned out
weekly and moved biweekly along with the fence. Moving the chicken house and the yard will prevent the chickens from scratching the
ground bear leading to potential erosion.
Managing both broilers and laying hens have two separate benefits to the orchard. Broiler manure is higher and nitrogen, however laying
hens are more active potentially making them better at weed and bug control. Using both types of poultry could potentially lead to the
diminishment of chemical fertilizers and pesticides needed in traditional orchard management as well as increasing soil quality and fertility.
Sustainable Agriculture Sustainable agriculture will be the way of the future. Worldwide
populations continue to increase currently we are able to feed
everyone on the planet however, in the future the green revolution
will not be enough. Best management practices must be developed
to improve degraded soils, so that they can once again be
productive agricultural land to feed the world’s growing
population. As the US civilization moves into the future we must
find ways to do more with less agriculturally. The other major
problem facing conventional agriculture today is peak oil, as oil
prices increase so does the cost of most conventional agricultural
production methods. Systems as well as agricultural methods must
evolve so that current agricultural production levels can be
maintained using fewer fossil fuel inputs. This project is an attempt
to create the infrastructure needed to study an alternative
agricultural management practice that could prove to be highly
sustainable increasing soil quality and fertility as well as
decreasing carbon inputs needed in fruit orchard production.
Without this meaningful research we will not be able to develop
agriculture in a manner to sustain future population increases.
Future Plans Future system upgrades will consist of:
• rainwater collection system on henhouse and on brooder house
• solar panels for laying hens
The future soils research will be conducted over a two-year period.
The first soil samples were taken from the orchard before the
chickens were put into the orchard. This initial sampling will allow
for a baseline to compare with future soil tests.
Comparisons will also be drawn from the inputs to the orchard
before and after chickens. These inputs consist of fertilizers,
insecticides and overall fuel cost for application. Production
numbers will also be collected to determine whether or not the
orchard became more productive before or after the chickens were
added to the orchard.
Soil changes slowly over time this is why it is so important to
begin the studies now so that new methods can be developed that
will increase soil quality and fertility for future generations.
full-grown broilers broiler finishing house
University of Arkansas Vehicle Research Project
Clark Rogers
Capstone for Minor in Sustainability
Department of Agriculture, Food and Life Science
• I have gathered information from the UofA parking and
transit facility of all vehicles registered on campus from
the past 3 years.
• You will see that the student enrollment is continuously
growing each year. Which means more traffic and more
vehicles on campus.
• It is important to recognize that if enrollment continues to
grow then we will not have enough space for students to
park on campus.
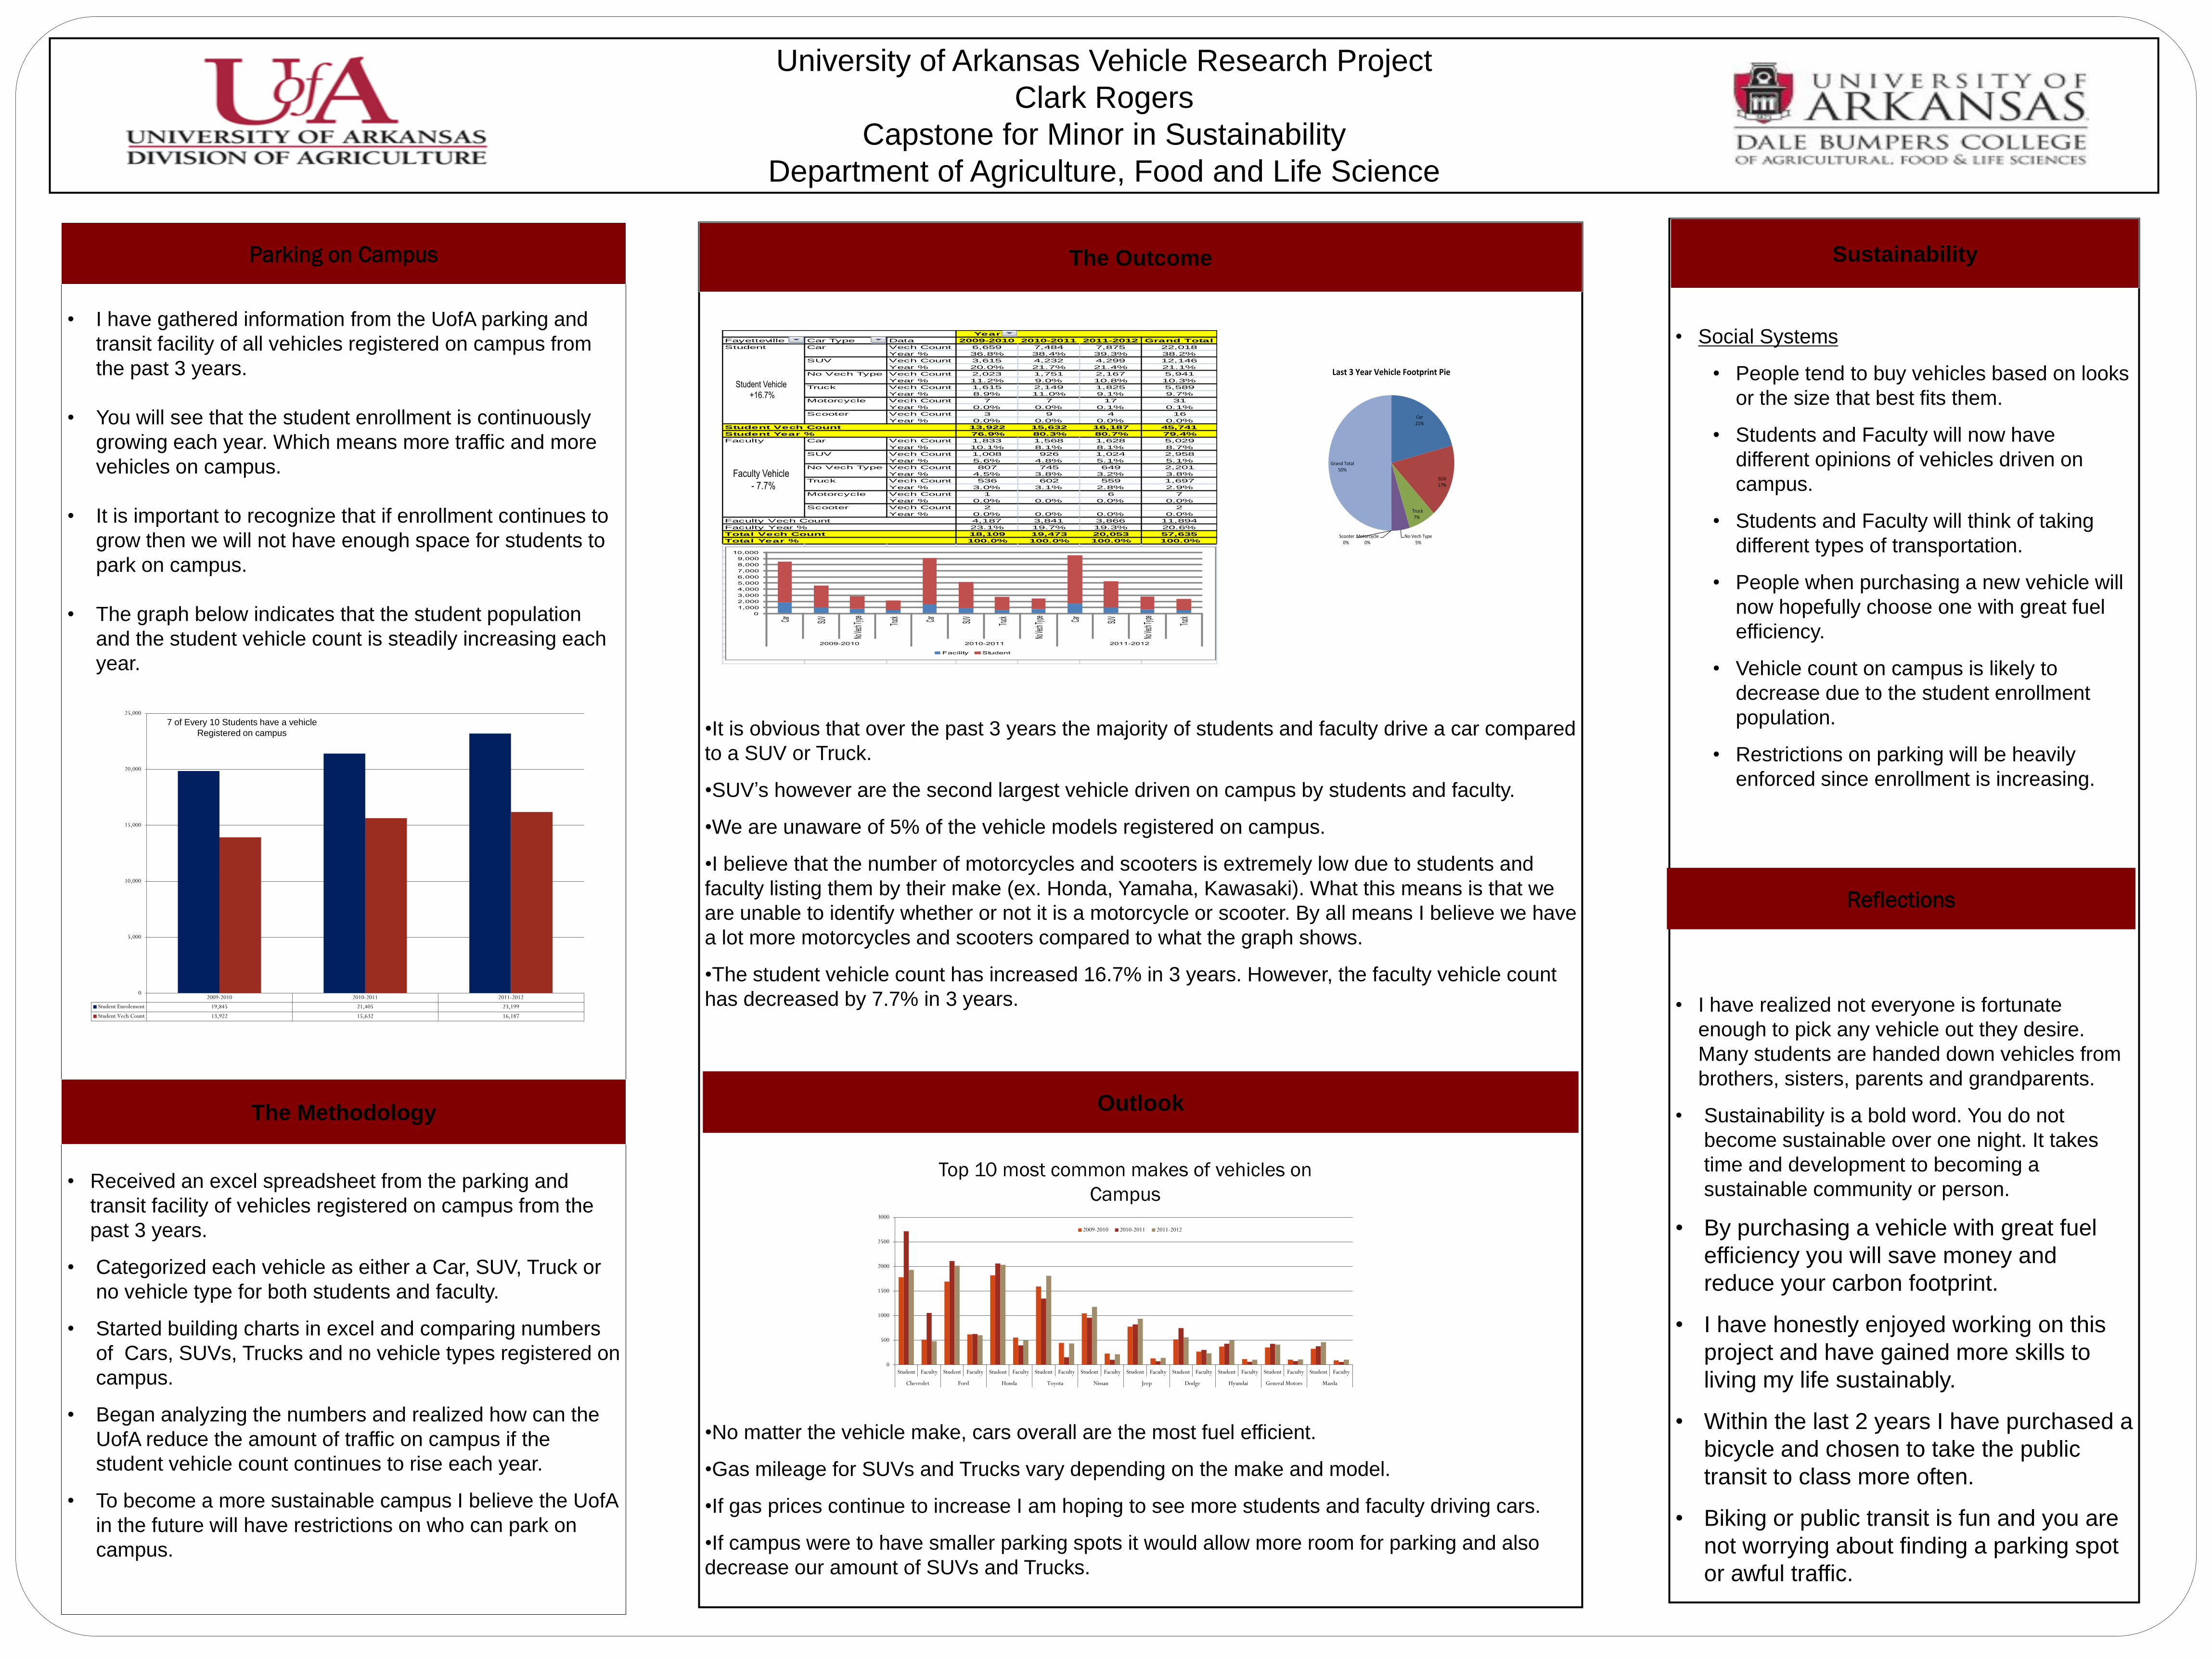
• The graph below indicates that the student population
and the student vehicle count is steadily increasing each
year.
• Received an excel spreadsheet from the parking and
transit facility of vehicles registered on campus from the
past 3 years.
• Categorized each vehicle as either a Car, SUV, Truck or
no vehicle type for both students and faculty.
• Started building charts in excel and comparing numbers
of Cars, SUVs, Trucks and no vehicle types registered on
campus.
• Began analyzing the numbers and realized how can the
UofA reduce the amount of traffic on campus if the
student vehicle count continues to rise each year.
• To become a more sustainable campus I believe the UofA
in the future will have restrictions on who can park on
campus.
• Social Systems
• People tend to buy vehicles based on looks
or the size that best fits them.
• Students and Faculty will now have
different opinions of vehicles driven on
campus.
• Students and Faculty will think of taking
different types of transportation.
• People when purchasing a new vehicle will
now hopefully choose one with great fuel
efficiency.
• Vehicle count on campus is likely to
decrease due to the student enrollment
population.
• Restrictions on parking will be heavily
enforced since enrollment is increasing.
• I have realized not everyone is fortunate
enough to pick any vehicle out they desire.
Many students are handed down vehicles from
brothers, sisters, parents and grandparents.
• Sustainability is a bold word. You do not
become sustainable over one night. It takes
time and development to becoming a
sustainable community or person.
• By purchasing a vehicle with great fuel
efficiency you will save money and
reduce your carbon footprint.
• I have honestly enjoyed working on this
project and have gained more skills to
living my life sustainably.
• Within the last 2 years I have purchased a
bicycle and chosen to take the public
transit to class more often.
• Biking or public transit is fun and you are
not worrying about finding a parking spot
or awful traffic.
•It is obvious that over the past 3 years the majority of students and faculty drive a car compared
to a SUV or Truck.
•SUV’s however are the second largest vehicle driven on campus by students and faculty.
•We are unaware of 5% of the vehicle models registered on campus.
•I believe that the number of motorcycles and scooters is extremely low due to students and
faculty listing them by their make (ex. Honda, Yamaha, Kawasaki). What this means is that we
are unable to identify whether or not it is a motorcycle or scooter. By all means I believe we have
a lot more motorcycles and scooters compared to what the graph shows.
•The student vehicle count has increased 16.7% in 3 years. However, the faculty vehicle count
has decreased by 7.7% in 3 years.
•No matter the vehicle make, cars overall are the most fuel efficient.
•Gas mileage for SUVs and Trucks vary depending on the make and model.
•If gas prices continue to increase I am hoping to see more students and faculty driving cars.
•If campus were to have smaller parking spots it would allow more room for parking and also
decrease our amount of SUVs and Trucks.
Year
Fayetteville CampusCar Type Data 2009-2010 2010-2011 2011-2012 Grand Total
Student Car Vech Count 6,659 7,484 7,875 22,018
Year % 36.8% 38.4% 39.3% 38.2%
SUV Vech Count 3,615 4,232 4,299 12,146
Year % 20.0% 21.7% 21.4% 21.1%
No Vech Type Vech Count 2,023 1,751 2,167 5,941
Year % 11.2% 9.0% 10.8% 10.3%
Truck Vech Count 1,615 2,149 1,825 5,589
Year % 8.9% 11.0% 9.1% 9.7%
Motorcycle Vech Count 7 7 17 31
Year % 0.0% 0.0% 0.1% 0.1%
Scooter Vech Count 3 9 4 16
Year % 0.0% 0.0% 0.0% 0.0%
Student Vech Count 13,922 15,632 16,187 45,741
Student Year % 76.9% 80.3% 80.7% 79.4%
Faculty Car Vech Count 1,833 1,568 1,628 5,029
Year % 10.1% 8.1% 8.1% 8.7%
SUV Vech Count 1,008 926 1,024 2,958
Year % 5.6% 4.8% 5.1% 5.1%
No Vech Type Vech Count 807 745 649 2,201
Year % 4.5% 3.8% 3.2% 3.8%
Truck Vech Count 536 602 559 1,697
Year % 3.0% 3.1% 2.8% 2.9%
Motorcycle Vech Count 1 6 7
Year % 0.0% 0.0% 0.0% 0.0%
Scooter Vech Count 2 2
Year % 0.0% 0.0% 0.0% 0.0%
Faculty Vech Count 4,187 3,841 3,866 11,894
Faculty Year % 23.1% 19.7% 19.3% 20.6%
Total Vech Count 18,109 19,473 20,053 57,635
Total Year % 100.0% 100.0% 100.0% 100.0%
0
1,000
2,000
3,000
4,000
5,000
6,000
7,000
8,000
9,000
10,000
Car SUV
No Vec
h Type Truck Car SUV
Truck
No Vec
h Type Car SU
V
No Vec
h Type Truck
2009-2010 2010-2011 2011-2012
Facility Student
Faculty Vehicle
- 7.7%
Student Vehicle
+16.7%
0
500
1000
1500
2000
2500
3000
Student Faculty Student Faculty Student Faculty Student Faculty Student Faculty Student Faculty Student Faculty Student Faculty Student Faculty Student Faculty
Chevrolet Ford Honda Toyota Nissan Jeep Dodge Hyundai General Motors Mazda
2009-2010 2010-2011 2011-2012
2009-2010 2010-2011 2011-2012
Student Enrolement 19,845 21,405 23,199
Student Vech Count 13,922 15,632 16,187
0
5,000
10,000
15,000
20,000
25,000
7 of Every 10 Students have a vehicle
Registered on campus
Parking on Campus
The Methodology
The Outcome Sustainability
Outlook
Top 10 most common makes of vehicles on
Campus
Reflections
DESIGN
The structure is designed built as a large room
with 4 identical compartments. Each one of these
compartments hold a Green Concrete slab each
with a different percentage of fly-ash in ratio with
Ordinary Portland Concrete aggregate.
Panel 1: 0%FA-
100%OPC
Panel 2: 25%FA-
75%OPC
Panel 3: 50%FA-
50%OPC
Panel 4: 75%FA-
25%OPC
The Compartments are designed to separate
each panel into its own thermal zone. Since the
entire inside will provide a control temperature
that will effect each compartment the same way,
the only surface that will be influenced individually
will be the concrete panel. The main room will be
kept at a constant temperature using a window
AC unit. It is constructed with a door and two
typical windows in order to imitate a typical
dwelling.
The structure is outfitted with thermocouples.
Thermocouples are a wired pair of different
metals that, due to the difference of resistance in
each metal, the temperature can be calculated.
Thermal Performance and Environmental Impact of Sustainable Concrete
Kyle Rookstool UA Sustainability Programs
THE PROBLEM Sustainable development involves maintaining our
current rate of development while leaving suitable
resources for later generations to continue developing.
The production of ordinary Portland cement (OPC) is a
resource- and energy-intensive process consuming
approximately 1.5 ton of raw materials and
producing approximately 1 ton of carbon dioxide
(CO2) for each ton of OPC produced.
Globally, the production of OPC accounts for
approximately between 5 to 7% of CO2 emissions
into the atmosphere.
There are three main reasons to use fly ash as a
substitute ingredient in concrete:
• First, the reduction of disposal into landfills of the
coal combustion products such as fly ash.
• Second, it creates significant environmental benefits
• Third, it improves the quality of the finished product
in terms of its properties.
THE PROJECT
The purpose of this project is to evaluate the thermal
performance of green concrete based on benchmark
developments related to this material. By measuring
the thermal resistance of concrete panels with different
percentages of fly ash, gathering, and analyzing the
data, we will be able to determine the thermal efficiency
of each panel and the contribution of this ingredient.
With that data, specifications can be made to better
inform the use of fly-ash in concrete. The project is
comprised of 3 stages:
1. Retrofit an existing structure for testing the panels.
2. Assemble and configure data-logging equipment for
structure.
3. Develop the structure into a pleasing design,
suitable for the public eye.
SUSTAINABILITY
This investigation and its product has significant
relevance to sustainability. The information,
design, and lessons learned will be disseminated
to a broad ranging audience.
The experimental building itself as an interface
with the public will stand as a demonstration and
example for the appreciation of fly ash as a waste
by-product.
• The building is designed and built in a cost
effective, sustainable, and appealing way in
emphasizing the sustainable built environment
• The data gathered will demonstrate the
reduced impact on the natural systems.
• The results obtained from this research will
indicate the recommendation guidelines
related to best practice of mix and application
of green concrete for lesser environmental
impact and preserved structural integrity.
THE FUTURE
This Project provides an environment to cater to
similar future investigations. Now, any sample
panel may be placed in and data gathered. Future
investigations may include:
• Fiber-reinforced fly-ash concrete
• Aerated fly-ash Concrete
• Insulated Panel with fly-ash concrete
The information from these experiments can
make headway in implementing fly-ash in
concrete for the future. With the thermal data on
fly-ash concrete the restraints of structure vs.
thermal can be refined. By narrowing those
restraints we can eliminate waste. It takes being
informed about a product to make the most
accurate decision. By providing this information
we may increase the implementation and use of
fly-ash therefore resulting in less waste, less
pollution due OPC production, and a better
environment.
This poster was prepared in partial fulfillment of SUST 4103 Sustainability Capstone
BUILT ENVIRONMENT
Fly-Ash Landfill
1 2 3 4
1 2 3 4
Type T: Thermocouple
(copper–constantan)
These thermocouples will
be wired into a
multiplexer, this allows for
many thermocouples to be
run. The multiplexer is run
to the data logger which
gathers the information
produced from the
thermocouples and sends
it back to the computer.
Once the data is gathered
in the computer it is
calculated and put into
graphs that make it easier
to read as well as
organize.
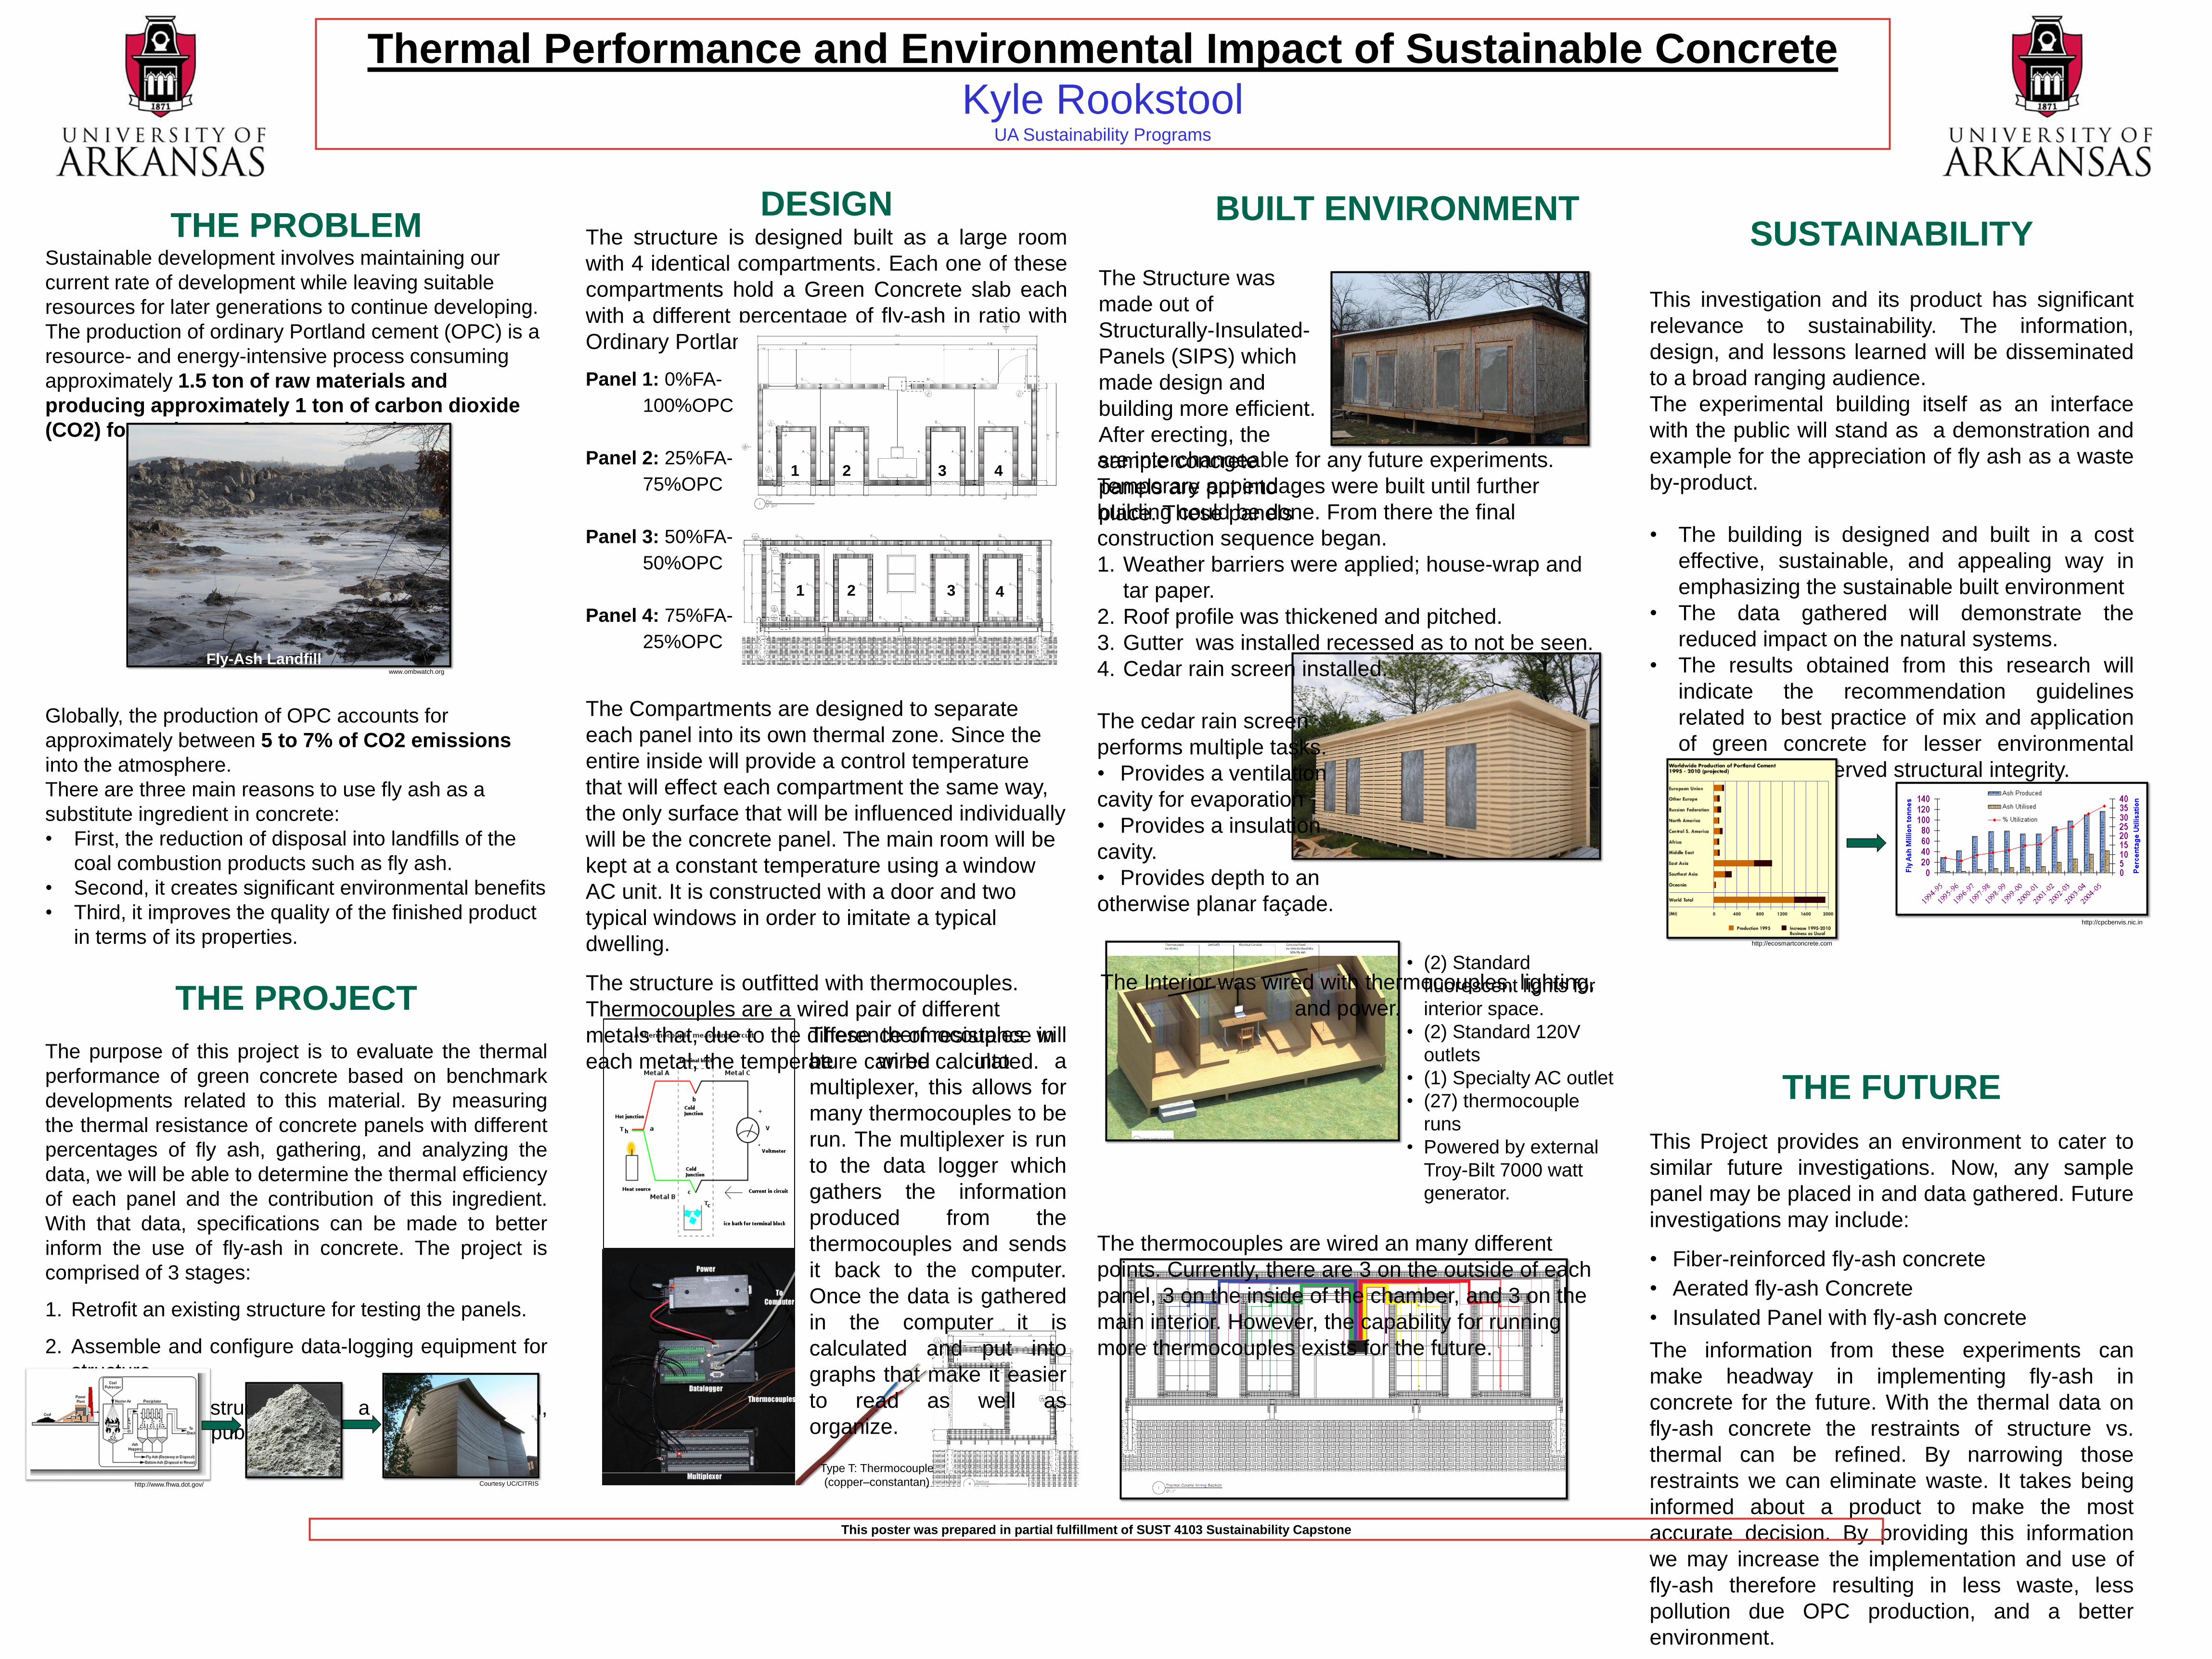
The Structure was
made out of
Structurally-Insulated-
Panels (SIPS) which
made design and
building more efficient.
After erecting, the
sample concrete
panels are put into
place. These panels
are interchangeable for any future experiments.
Temporary appendages were built until further
building could be done. From there the final
construction sequence began.
1. Weather barriers were applied; house-wrap and
tar paper.
2. Roof profile was thickened and pitched.
3. Gutter was installed recessed as to not be seen.
4. Cedar rain screen installed.
The cedar rain screen
performs multiple tasks.
• Provides a ventilation
cavity for evaporation
• Provides a insulation
cavity.
• Provides depth to an
otherwise planar façade.
The Interior was wired with thermocouples, lighting,
and power.
The thermocouples are wired an many different
points. Currently, there are 3 on the outside of each
panel, 3 on the inside of the chamber, and 3 on the
main interior. However, the capability for running
more thermocouples exists for the future.
• (2) Standard
fluorescent lights for
interior space.
• (2) Standard 120V
outlets
• (1) Specialty AC outlet
• (27) thermocouple
runs
• Powered by external
Troy-Bilt 7000 watt
generator.
Courtesy UC/CITRIS http://www.fhwa.dot.gov/
http://cpcbenvis.nic.in
http://ecosmartconcrete.com
www.ombwatch.org
Longevity and Recycling:
The Effect of Existence Bias on Recycling Participation
Jordan Schanda Department of Psychology
PREVIOUS RESEARCH
Psychology can offer insight into the
mechanisms that drive environmental
consciousness, as well as provide techniques
for increasing participation in proenvironmental
behaviors, such as recycling. Research on
existence bias has demonstrated an increased
tendency for people to choose or prefer
something merely as a function of its existence
or longevity; I believe this could serve as an
effective way to drive environmentally
conscious behavior. Previous research
demonstrates that gender plays a significant
role in environmentalism, and specifically, that
women report higher levels of participation in
proenvironmental behavior compared to men.
Other research shows that behavior can be
predicted from issue-specific attitudes. For
example, if trying to influence or predict
recycling behavior, attitudinal measures must
target recycling specifically.
METHODS
Seventy-seven U of A students (57% female,
43% male) self-selected themselves into this
experiment, which was disguised as a study on
“advertisement techniques.” Participants were
presented with an ad for the University of
Arkansas’ recycling program and informed that
it had been around for either three years or
three decades. Participants received a
recyclable cup near the end of the study and
subsequently had the opportunity to recycle it.
Recycling behavior was recorded and
calculated in the form of percentages for each
group.
HYPOTHESES
I hypothesized that participants in the long
time in existence condition (three decades)
would exhibit a higher recycling rate compared
to those in the short time in existence condition
(three years). I also predicted that attitudes
toward recycling would be stronger among
women, and that these attitudes, regardless of
gender and condition, would correspond closely
with behavior.
SUSTAINABILITY
Everyday habits and decisions are having
a large impact on climate change; however,
it seems that these routine behaviors are the
most difficult to challenge. Recycling is a
fairly simple behavior that has the potential
to reduce greenhouse gas emissions from
many sources including methane from
landfills and emissions produced by waste
incinerators.
Based on my research, existence bias
cannot be added to the list of techniques for
encouraging proenvironmental behavior.
However, contingent on further research,
informing men of a recycling program’s
“newness,” as conveyed by a short time in
existence, could lead to increased
participation in recycling by men.
FUTURE RESEARCH AND
IMPLICATIONS
The possible explanations for my findings
should be examined through further
research by gathering information regarding
attitudes toward recycling before and after
the manipulation of longevity. Use of a
control group would also offer a better
comparison between attitudes and behavior,
irrespective of longevity. Furthermore, a
control group would determine a baseline
recycling rate that would allow me to make
comparisons between groups and to draw
conclusions about whether recycling rates
increased or decreased due to the
manipulation of longevity.
However, I can make some theoretical
comparisons based on the recycling rate at
the University of Arkansas. According to the
recycling coordinator, the current recycling
rate on campus is 36 percent. Men in the
short time in existence condition exhibited a
recycling rate of over 62 percent, suggesting
that their knowledge of the recycling
program’s “newness” led to increased
recycling.
This poster was prepared in partial fulfillment of SUST 4103 Sustainability Capstone
THE RECYCLING AD
Above is the ad used in the short time in
existence condition. Participants in the long
condition saw the same ad, but it claimed
that “the university’s well-established
recycling program is in its third decade of
operation.”
FINDINGS
Overall, the correlation between attitudes
toward recycling and recycling behavior was
not significant, r(73) = .07, p = .53. This
means that attitudes toward recycling, as
measured by a demographic questionnaire,
did not predict recycling behavior.
This supports the existence of an attitude-
behavior gap, despite the use of issue-
specific attitude measures. It is possible that
participants’ attitudes following their
exposure to time in existence could have
matched up with their recycling behavior,
and differed from their initial attitudes toward
recycling. In addition, time in existence could
have had an effect on participants’ opinions
without the increased favorability being
converted into action.
FINDINGS
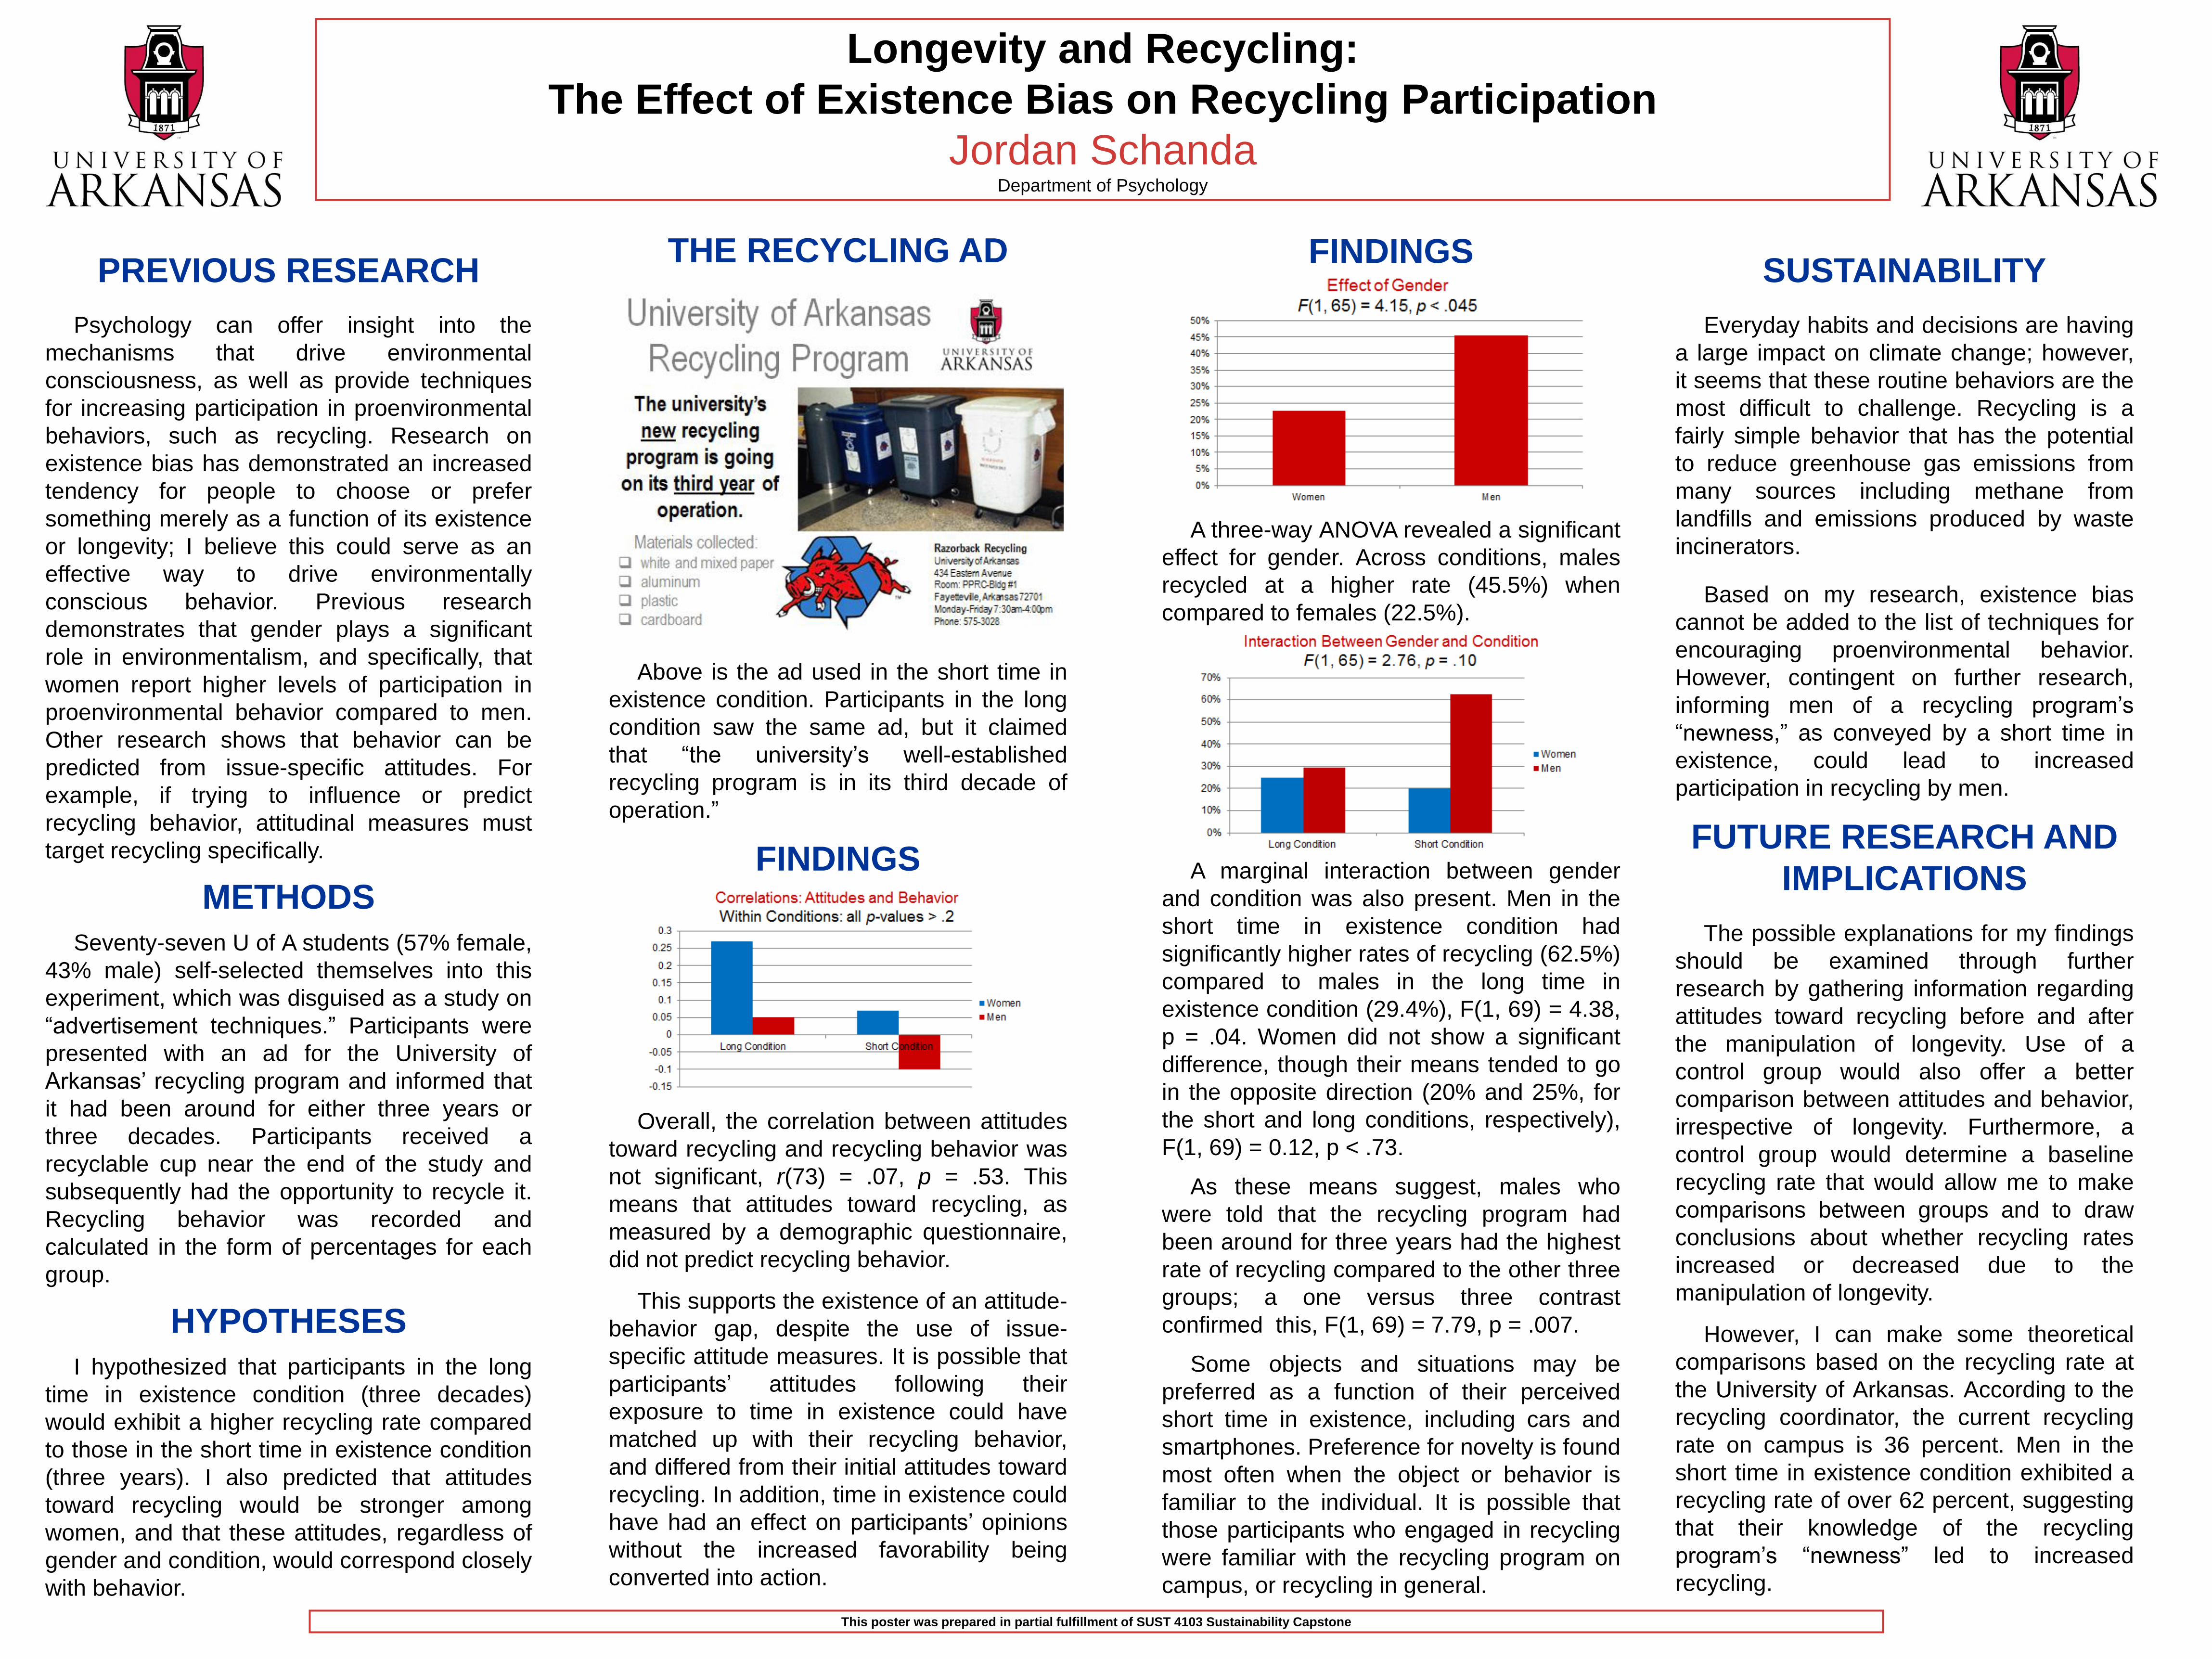
A three-way ANOVA revealed a significant
effect for gender. Across conditions, males
recycled at a higher rate (45.5%) when
compared to females (22.5%).
A marginal interaction between gender
and condition was also present. Men in the
short time in existence condition had
significantly higher rates of recycling (62.5%)
compared to males in the long time in
existence condition (29.4%), F(1, 69) = 4.38,
p = .04. Women did not show a significant
difference, though their means tended to go
in the opposite direction (20% and 25%, for
the short and long conditions, respectively),
F(1, 69) = 0.12, p < .73.
As these means suggest, males who
were told that the recycling program had
been around for three years had the highest
rate of recycling compared to the other three
groups; a one versus three contrast
confirmed this, F(1, 69) = 7.79, p = .007.
Some objects and situations may be
preferred as a function of their perceived
short time in existence, including cars and
smartphones. Preference for novelty is found
most often when the object or behavior is
familiar to the individual. It is possible that
those participants who engaged in recycling
were familiar with the recycling program on
campus, or recycling in general.
DESIGN OF AN EDUCATIONAL WATER FEATURE FOR THE BOTANICAL GARDENS OF THE OZARKS Jason Corral, Dawn Shoemaker, Lauren Tessaro, Vanessa VanWilpe Senior Design Team 2012, Department of Biological and Agricultural Engineering, University of Arkansas, Fayetteville
The Botanical Gardens of the Ozarks was created by the
Botanical Garden Society of the Ozarks (BGSO), a self
described homegrown, grassroots organization
established in 1994. The Botanical Gardens are located
on 100 acres of property at the south east edge of Lake
Fayetteville.
The Botanical Gardens provides lifelong learning with
workshops, lectures, and classes. The local school
children are offered programs at school and at the
Garden including a broad array of garden-related topics,
with wild plants, animals in the garden, health and
wellness, sustainability, and garden and floral design.
The Little Sprouts is offered for younger children.
The successful completion of this project will benefit the
Botanical Gardens, and it’s visitors by enhancing the
overall aesthetic and educational values of the Botanical
Gardens which are important aspects of the Botanical
Gardens’ mission statement. Learning centers and
community gathering places are essential to the social
aspects of sustainability.
The educational value of this water feature can have
ecological benefits to the managed systems by giving
people a greater understanding of the amount of work
required to generate even a small amount of energy. This
understanding could lead to energy conservation
decisions being consciously made by people who use this
educational water feature.
Engineers are taught to address the sustainability of built
systems while evaluating the life of their designs, and the
most efficient and friendly use of the materials available.
This poster was prepared in partial fulfillment of SUST 4103 Sustainability Capstone
The first part of the system employs three power
components:
1) Human
Power in → kilocalories=813 kcal/day
Power out → Joules per second (watts)=63.01 Watts of
energy available as calculated.
From the estimated energy available* - 813 kcals/day,
with 20% usable for 2 minutes at a time, we get:
162.6kcal
day
day
3 hr
hr
60 min2 min = 1.8066 kcal
1.806 𝑘𝑐𝑎𝑙4.185𝐾𝐽
𝑘𝑐𝑎𝑙
min
60 sec
1000J
KJ=
315J
sec= 63.01 W
2) Bicycle
The human energy is converted to mechanical energy
losing 5% efficiency, when the child pedals the bike.
Power in → 63.01Watts
Power out → 63.01Watts x 95% eff. = 59.86Watts
The low estimate for revolutions per minute (RPM) input
to the pedals is 40 RPM from the child, with a gear ration
of 34:39 so, the RPM of the tire, as equal to the rear gear,
calculates as,
(40 RPM) (39/34) = 45.88 RPM
Using the power equation P=Tω, where P=power;
T=torque, ω=angular momentum, and T=Force x
distance, the force between the tire and the pump is
found as:
P = Tω = F ∗ d ∗ 2π RPM
60
Insert substitutions and rearrange,
F =P
d ∗ 2πRPM
60
Substitute values,
F =59.86W
(0.305m)(2π)45.8860𝑠
= 40.85N
The second portion of the system employs three
components also:
1) Reservoir
The water is pumped to the reservoir, and is considered
potential energy. This can be estimated by;
PE = mass x gravity x head
We have not calculated this yet as our final location is yet
undecided.
Introduction
The Project The goal for our senior design team on this project was to involve kids in learning about the production of energy. We introduce the basics of hydroelectric power, and propose alternative energy sources. In pursuing this goal, we must keep in tune with the aesthetic values of the Botanical Gardens where it is to be displayed.
In the United States, the primary source of fuel for electricity generation is fossil fuel. However, alternative forms of energy generation are gaining ground as a legitimate alternative to fossil fuel energy generation. If fossil fuel is to be largely replaced by alternative energy, the public must be aware of and support the efforts made towards that change. One method of accomplishing this is with an interactive, educational, alternative energy generator. With the input of Gerald Kilngaman at the Botanical Gardens of the Ozarks and Dr. Costello and Steve Green of the University of Arkansas, an alternative energy display was developed that uses human power as the initial input, and finally produces electricity.
In the final design, a child will ride a stationary bicycle that is directly connected to a positive displacement pump. Pedaling the bicycle will cause the pump to deliver water through a system of pipes that releases the water into a reservoir above a wooden water wheel.
When the water is released, the force of the water contacting the water wheel will cause the wheel to turn which will turn a generator. This generator will then power a series of lights to allow the children to see their muscle power manifest as electricity.
Entrance to the Botanical Gardens
Artistic rendition of proposed water wheel design for the Botanical Gardens.
System Components
0
20
40
60
80
100
120
140
160
0 500 1000 1500
Power (Watts)
RPM
Power vs. RPM at Variable Heads
Head=1.244m
Head=1.816m
Head=2.235m
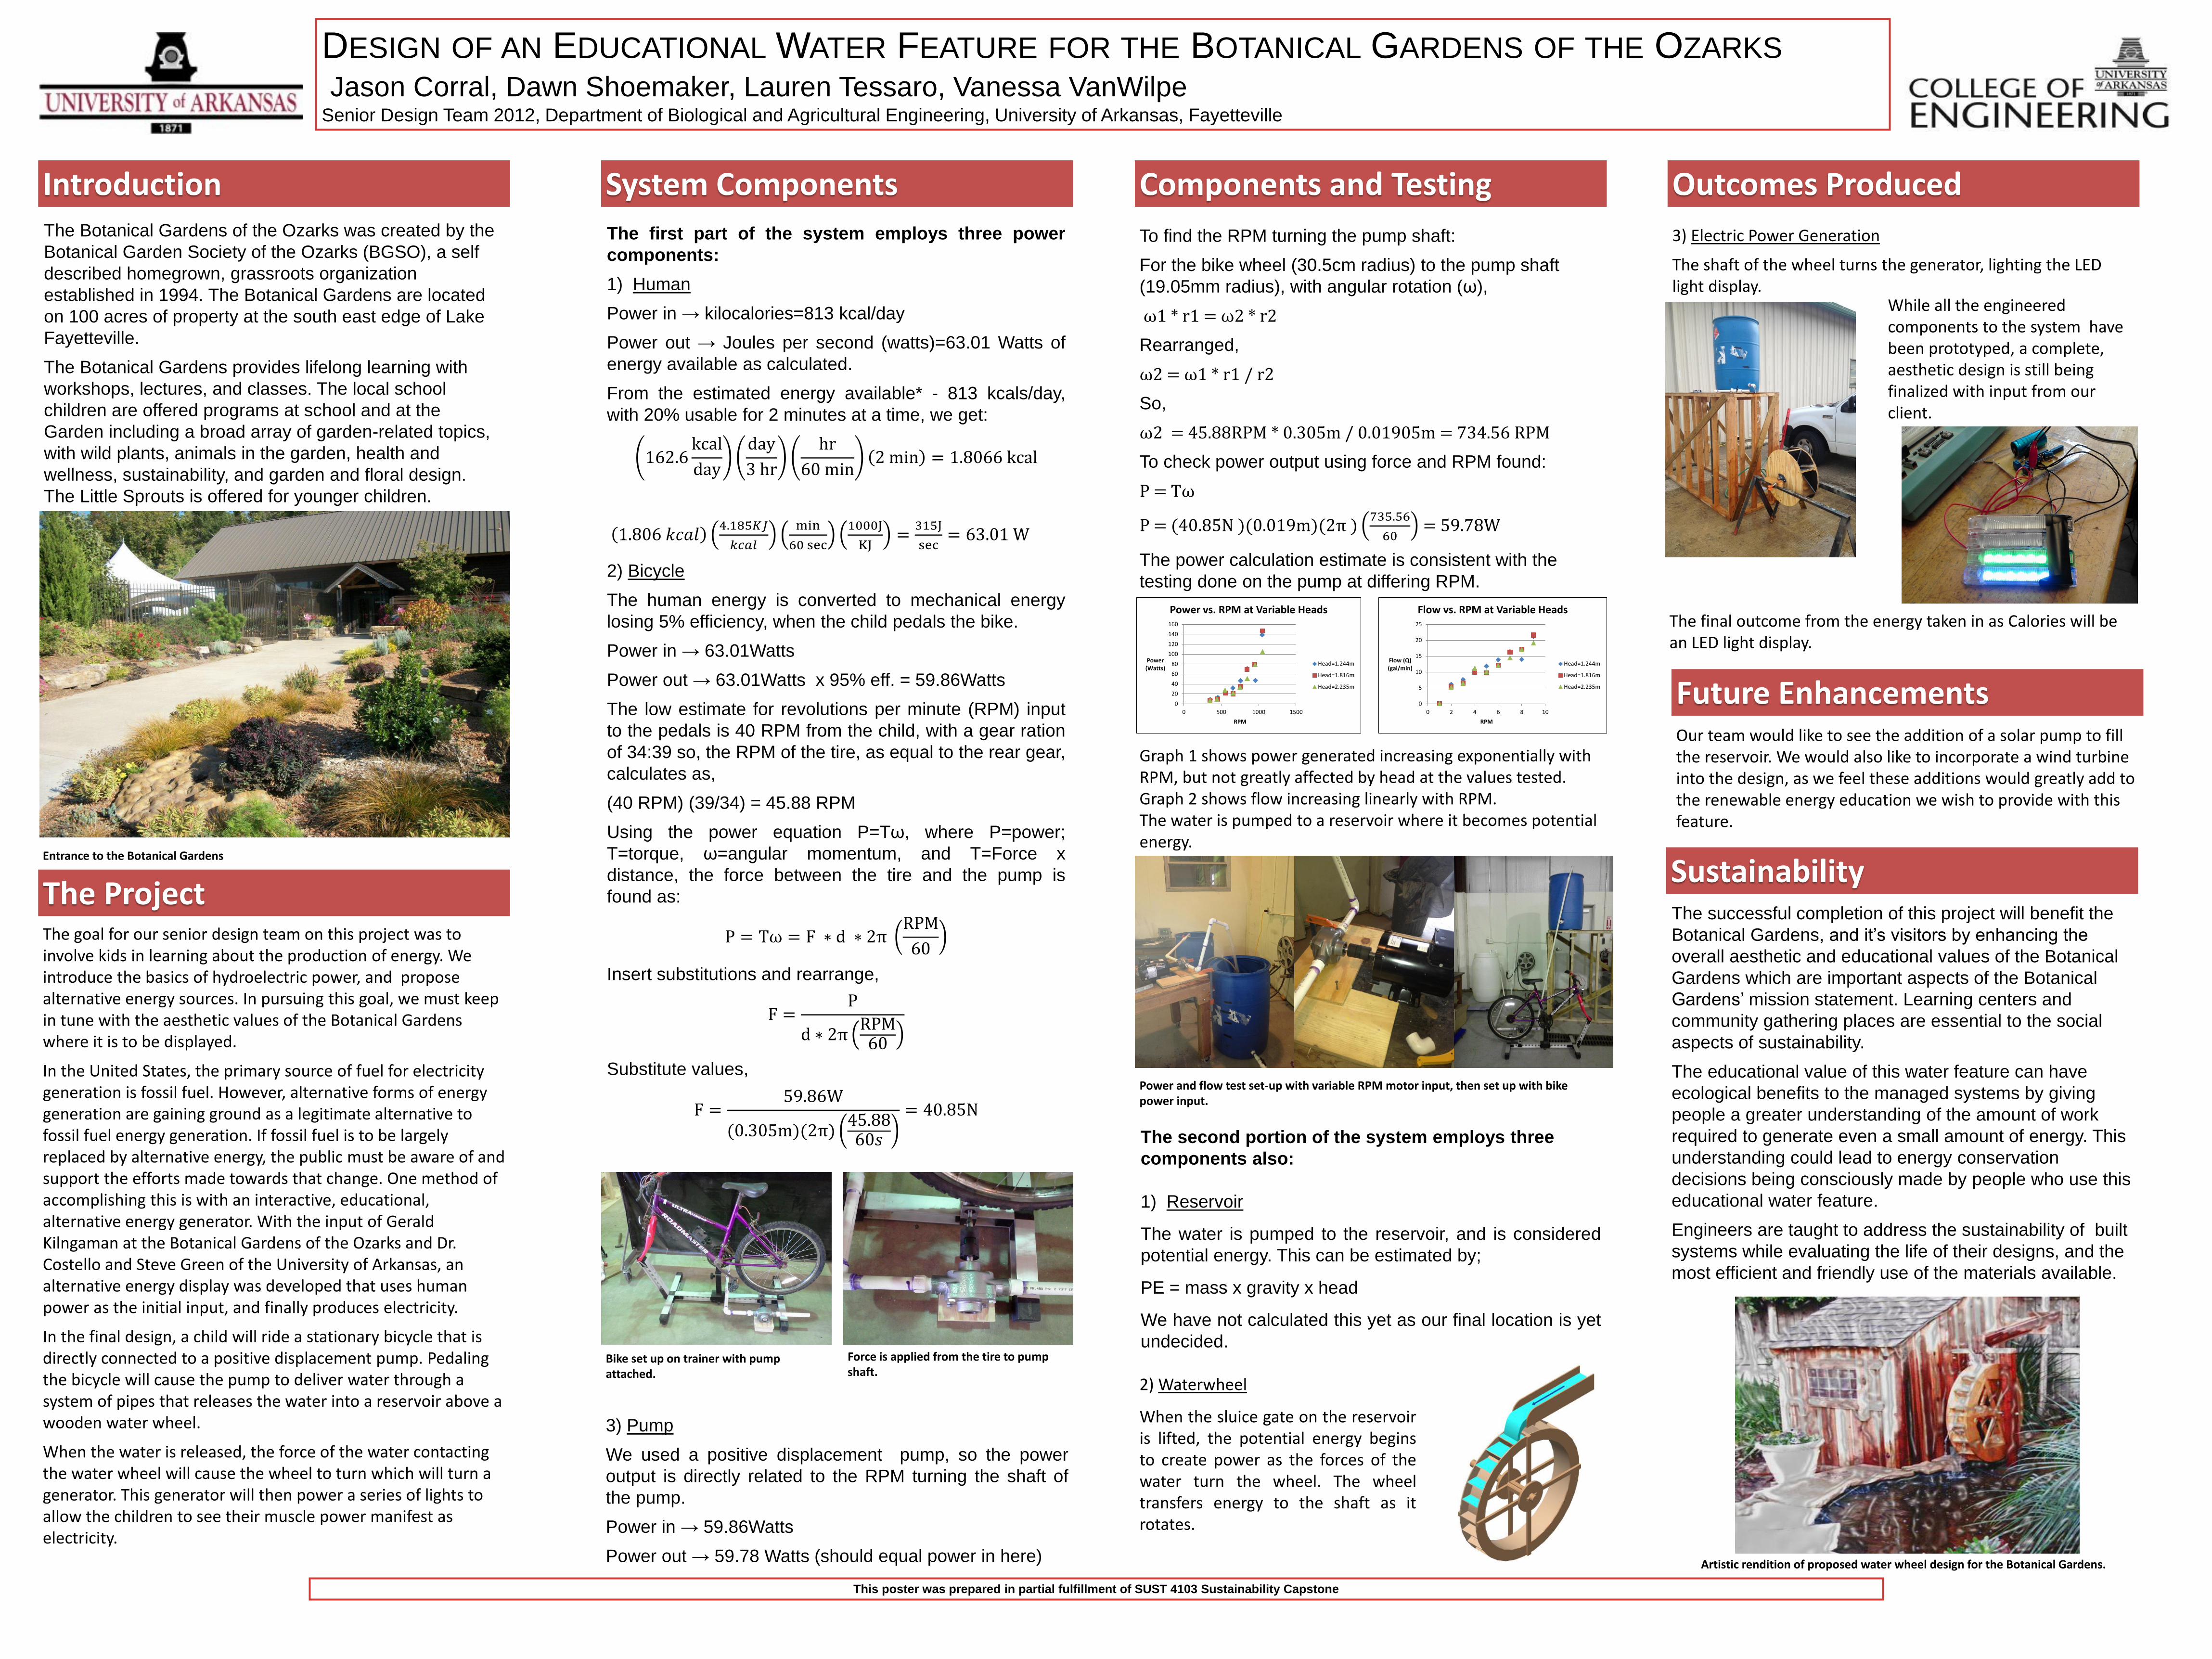
To find the RPM turning the pump shaft:
For the bike wheel (30.5cm radius) to the pump shaft
(19.05mm radius), with angular rotation (ω),
ω1 * r1 = ω2 * r2
Rearranged,
ω2 = ω1 * r1 / r2
So,
ω2 = 45.88RPM * 0.305m / 0.01905m = 734.56 RPM
To check power output using force and RPM found:
P = Tω
P = (40.85N )(0.019m)(2π )735.56
60 = 59.78W
The power calculation estimate is consistent with the
testing done on the pump at differing RPM.
Components and Testing
Force is applied from the tire to pump shaft.
Bike set up on trainer with pump attached.
Graph 1 shows power generated increasing exponentially with RPM, but not greatly affected by head at the values tested. Graph 2 shows flow increasing linearly with RPM. The water is pumped to a reservoir where it becomes potential energy.
3) Pump
We used a positive displacement pump, so the power
output is directly related to the RPM turning the shaft of
the pump.
Power in → 59.86Watts
Power out → 59.78 Watts (should equal power in here)
Power and flow test set-up with variable RPM motor input, then set up with bike power input.
0
5
10
15
20
25
0 2 4 6 8 10
Flow (Q) (gal/min)
RPM
Flow vs. RPM at Variable Heads
Head=1.244m
Head=1.816m
Head=2.235m
2) Waterwheel
When the sluice gate on the reservoir is lifted, the potential energy begins to create power as the forces of the water turn the wheel. The wheel transfers energy to the shaft as it rotates.
Outcomes Produced
3) Electric Power Generation
The shaft of the wheel turns the generator, lighting the LED light display.
Sustainability
While all the engineered components to the system have been prototyped, a complete, aesthetic design is still being finalized with input from our client.
The final outcome from the energy taken in as Calories will be an LED light display.
Future Enhancements Our team would like to see the addition of a solar pump to fill the reservoir. We would also like to incorporate a wind turbine into the design, as we feel these additions would greatly add to the renewable energy education we wish to provide with this feature.
Radio Conversations about Sustainability
Gavin Smith Civil Engineering Student
Why do a Radio Show? Sustainability is as vague as vague can be. It is an overused and often misapplied term. In the grocery store or really any commercial setting we are inundated by claims about the sustainability of different products. To understand the impacts of our choices we have to go far out of our everyday routines. Sustainability is a smart thing to choose, but how do we choose which dish soap is sustainable and which is not? Can something be more sustainable than another thing? What does it mean to be unsustainable? What happens when things collapse? Will it hurt? Questions are at the heart of the discussion. Anyone who's tells you definitively what sustainability means is either a time traveler, selling something, or both. A radio show is the perfect place to parse this subject ad infinitum. If you want to do something for the good of the planet and your fellow beings, as hard and as frustrating as it is, there is still a world of things to be done just by listening, asking questions, and talking.
What did I do?
The first episode of the show aired the
first week of the spring semester. The show
then aired once a week until week nine,
when scheduling problems moved in. At the
writing of this poster the tenth show is done
and there are four more shows planned and
scheduled. It is hoped another student will
continue producing the show in Fall 2012,
but even if no one picks it up the show will
be there and can always be picked up at a
later date.
There were several lessons learned while
producing the show. The main lesson was
that productive value is a function of
experience plus the time put into
preproduction planning and editing. The
show was a disaster several times from a
production perspective. There were times
when I froze up mid question, and times
when I gaffed the mixing board. All in all I am
proud of the mistakes I’ve made. How else
could I have learned?
UNIVERSITY
LOGO HERE
Need University
Logo here
How was this project
relative to the university
wide conversation about
sustainability?
This project addressed all four major
areas of sustainability studies as outlined by
the sustainability minor here at the University
of Arkansas. The show was produced from a
generalist point of view and as such we
dipped into the built environment with Dr.
Braham, Dan Coody, and Gary Kahanak,
into the managed environment with John
Sampiers and Sarah Dayringer, into the
economic with Sarah Dayringer, and into the
environmental with Dr. Boss, Dr. Alverson,
and Dr. Smith, and into the social with Dr.
Brubaker, Sarah Dayringer, and Dan Coody.
The project was effective and all my goals
were met, that being said my biggest goal
was just to show up and do it. Radio is, like
all public media, an invitation to vulnerability.
Losing your train of thought while
broadcasting live is a different experience
from doing the same in a private
conversation. Offending your guest goes
from a small bump in the conversation to a
public humiliation. I wanted to earn my spurs
for this seemingly perilous experience.
Whether or not the show was an effective
medium for advocating for sustainability or
impacting others in any way is up for
discussion.
The biology series was another small
segment that was produced on the
sustainability show. Only two segments were
produced. The series asked the question:
what can Biologist teach us about design. It
turns out that enthusiasm for the natural
world is what they have to teach us. In the
first Segment Dr. Andy Alverson shared his
love of diatoms and enumerated some of the
amazing facts surrounding this ubiquitous,
obscure, and highly important branch of the
tree of life. Dr Smith shared the story of the
reintroduction of the black bear to the
Ozarks. This poster was prepared in partial fulfillment of SUST 4103 Sustainability Capstone
GRAPHS
IT WOULD BE GOOD TO USE THIS
SPACE TO PROVIDE GRAPHICS THAT
MAY INCLUDE
TABLES
FIGURES
MAYBE YOU WANT TO PUT IN QUOTES
FROM STUDENTS AND OR PARTNERS IN
THE PROJECT
Sustainability Show #1
Dr. Edmund Harriss, UA Math Dept.
Direction and inspiration for the show
Sustainability Show #2
Dr. Steve Boss, UA Geology Dept.
Human environmental impacts.
Sustainability Show #3
John Sampier, NACA director
Waste water treatment
Sustainability Show #4
Dr. Robert Brubaker, UA History Dept.
What does Collapse feel like?
Sustainability Show #5
Sarah Dayringer, Policy expert
Rio+20 UN conference
GRAPHS
IT WOULD BE GOOD TO USE THIS
SPACE TO PROVIDE GRAPHICS THAT
MAY INCLUDE
PICTURES
TABLES
FIGURES
MAYBE YOU WANT TO PUT IN QUOTES
FROM STUDENTS AND OR PARTNERS IN
THE PROJECT
Sustainability Show #6
Dan Coody, former mayor
Sustainable building
Sustainability Show #7
Gary Kahanak, energy auditor
Home energy efficiency
Sustainability Show #8
Dr. Edmund Harriss, UA Math Faculty
Current state of the literature
Sustainability Show #9
Dan Dean, Architect, Farmer, and Activist
Dan Dean Did His Thing
Sustainability Show #10
Dr. Andrew Braham, UA Civil Engineering
Sustainability and Transportation
Podcasts for each episode can be found on the web at kxua.uark.edu, search the site for “sustainability”
This poster was prepared in partial fulfillment of SUST 4103 Sustainability Capstone
WHAT IS THE ISSUE? Did you know the University of Arkansas has an office devoted to sustainable development? Did you know the University of Arkansas has led the SEC for 3 non-consecutive years in RecycleMania for waste reduction & increased recycling? Did you know you can opt-out of your physical junk mail from your residence at sustainability.uark.edu? I did not know any of these facts until I became an intern at the Office for Campus Sustainability (OCS). This office organizes great events, coordinates important projects, & the university as a whole has been recognized several times for its achievements in sustainability. However, much of this goes unnoticed. This is why I focused my project on helping the OCS leverage their social media to help effectively communicate all their efforts & the school’s efforts to the campus. This not only means furthering the reach of each message, but also building relationships with the members of this university & beyond. This would be represented by an increase in online presence overall.
THE PROJECT 1. Amendments & Additions Facebook, Twitter, & the blog had been established, but not used effectively. Google+ was added because of the growing amount of users on Google+. Then, an email campaign, or newsletter, was needed to help promote the office’s growing number of events, projects, & more. 2. General Strategy A general strategy had to be created to learn the foundation for using any type of social media. Online marketing is a new type of communication where traditional marketing methods usually do not apply. 3. Best Practices Guide & Detailed Plan Each outlet is unique & requires its own set of rules, thus a detailed action plan was created for each of the five web brands.
SUSTAINABILITY Social media is a free tool that can be used to promote the Office for Campus Sustainability & all the efforts of the university. By incorporating this guide into their program, there is potential to develop a greater online presence & campus presence. It is about shining a brighter light on what the students & faculty do here every year to help move towards a more socially, economically, and environmentally sustainable institution. It is about using social media for social good.
Join the Conversation!
Text to like our Facebook Page!
Text “like uaocs” to 32665
BEST PRACTICES Each social media tool has its own unique ability to engage an online user as long as it is used correctly & consistently. Social media is also ever changing; therefore, preparation is key. For example, Facebook made a complete overhaul of their page layout on March 30, 2012 with the new Timeline. Users with a Facebook Page were notified in advance & provided an option to test it out. This gave the users time to learn about the new features and how to use them effectively before the official public launch.
The image on the right from social media expert Mari Smith attempts to explain every aspect of the new timeline.
Examples included in the OCS Social Media Best Practices: •Number of posts needed each day to actively engage readers on Twitter is much higher than Facebook •Optimize blog & website to mobile theme for easy viewing on cell phones •Consistently post blogs each week to keep reader’s interested. •Give people a reason to like the page, not demanding people to “Like now!” •Listen carefully, be transparent, be responsive, be authentic, & tell great stories
Promoting a Sustainable Campus Using Social Media
Office for Campus Sustainability
Sylvia Tran
WHY SOCIAL MEDIA? Americans’ spend 22.5% of their time on social networks & blogs, more than any other online site. People no longer surf the web for information, but they surf Facebook, Twitter, & Blogger. These web brands are now the center for information. The OCS can take advantage of this popular medium to engage people in conversations about sustainability. This is where we can provide information about our efforts & involve the campus in sustainable development.
GENERAL SOCIAL MEDIA STRATEGY
1 Listen 2 Identify Goals The ultimate surveying tool is social listening.
•Find out what your audience is talking about. •Listen to their opinions, needs, & issues. •Determine how to best contribute to the conversation. •Tools: Google alerts, Twitter search, Facebook search
Form goals around the organization’s mission & what the audience wants.
•Define the organization’s objectives •Define success
o Increased online presence •Identify required resources, training required, & any barriers
3 Create Content 4 Content Delivery Plan What would the audience find intriguing?
•After listening to the audience, find content that would spark their interest. •Be innovative. For instance, a Google+ Hangout could be hosted about climate change attended by influential researchers. •Examples: Share facts, tips, promotions, ask for an opinion
When is the best time to send content & how often?
•Develop a timeline months in advance to effectively promote events. •Schedule out messages in advance using social media dashboards for efficient use of time & to consistently post content. •Find out what time of the day & what days of the week is content most viewed. •Tools: Google+ Timing, Hootsuite, Tweetdeck, Seesmic
5 Engage Users 6 Measure Effectiveness Focus on genuine interaction, not just largest reach.
•Traditional marketing’s main focused is broadcast media. •Social media is better utilized as an ‘engagement network.’ •It’s not just about reaching the most people, but listening, engaging, & empowering the audience with the quality & transparency of the content.
How is success measured? •Various tools for all social media is available to ensure efforts are moving towards achieving those previously set goals. •Measurements allows you to assess progress, revise or eliminate content, change timing of posts, & more. •Tools: Email campaign analysis on MailChimp or Constant Contact, Google Analytics, Facebook Insights, website traffic counter, Klout
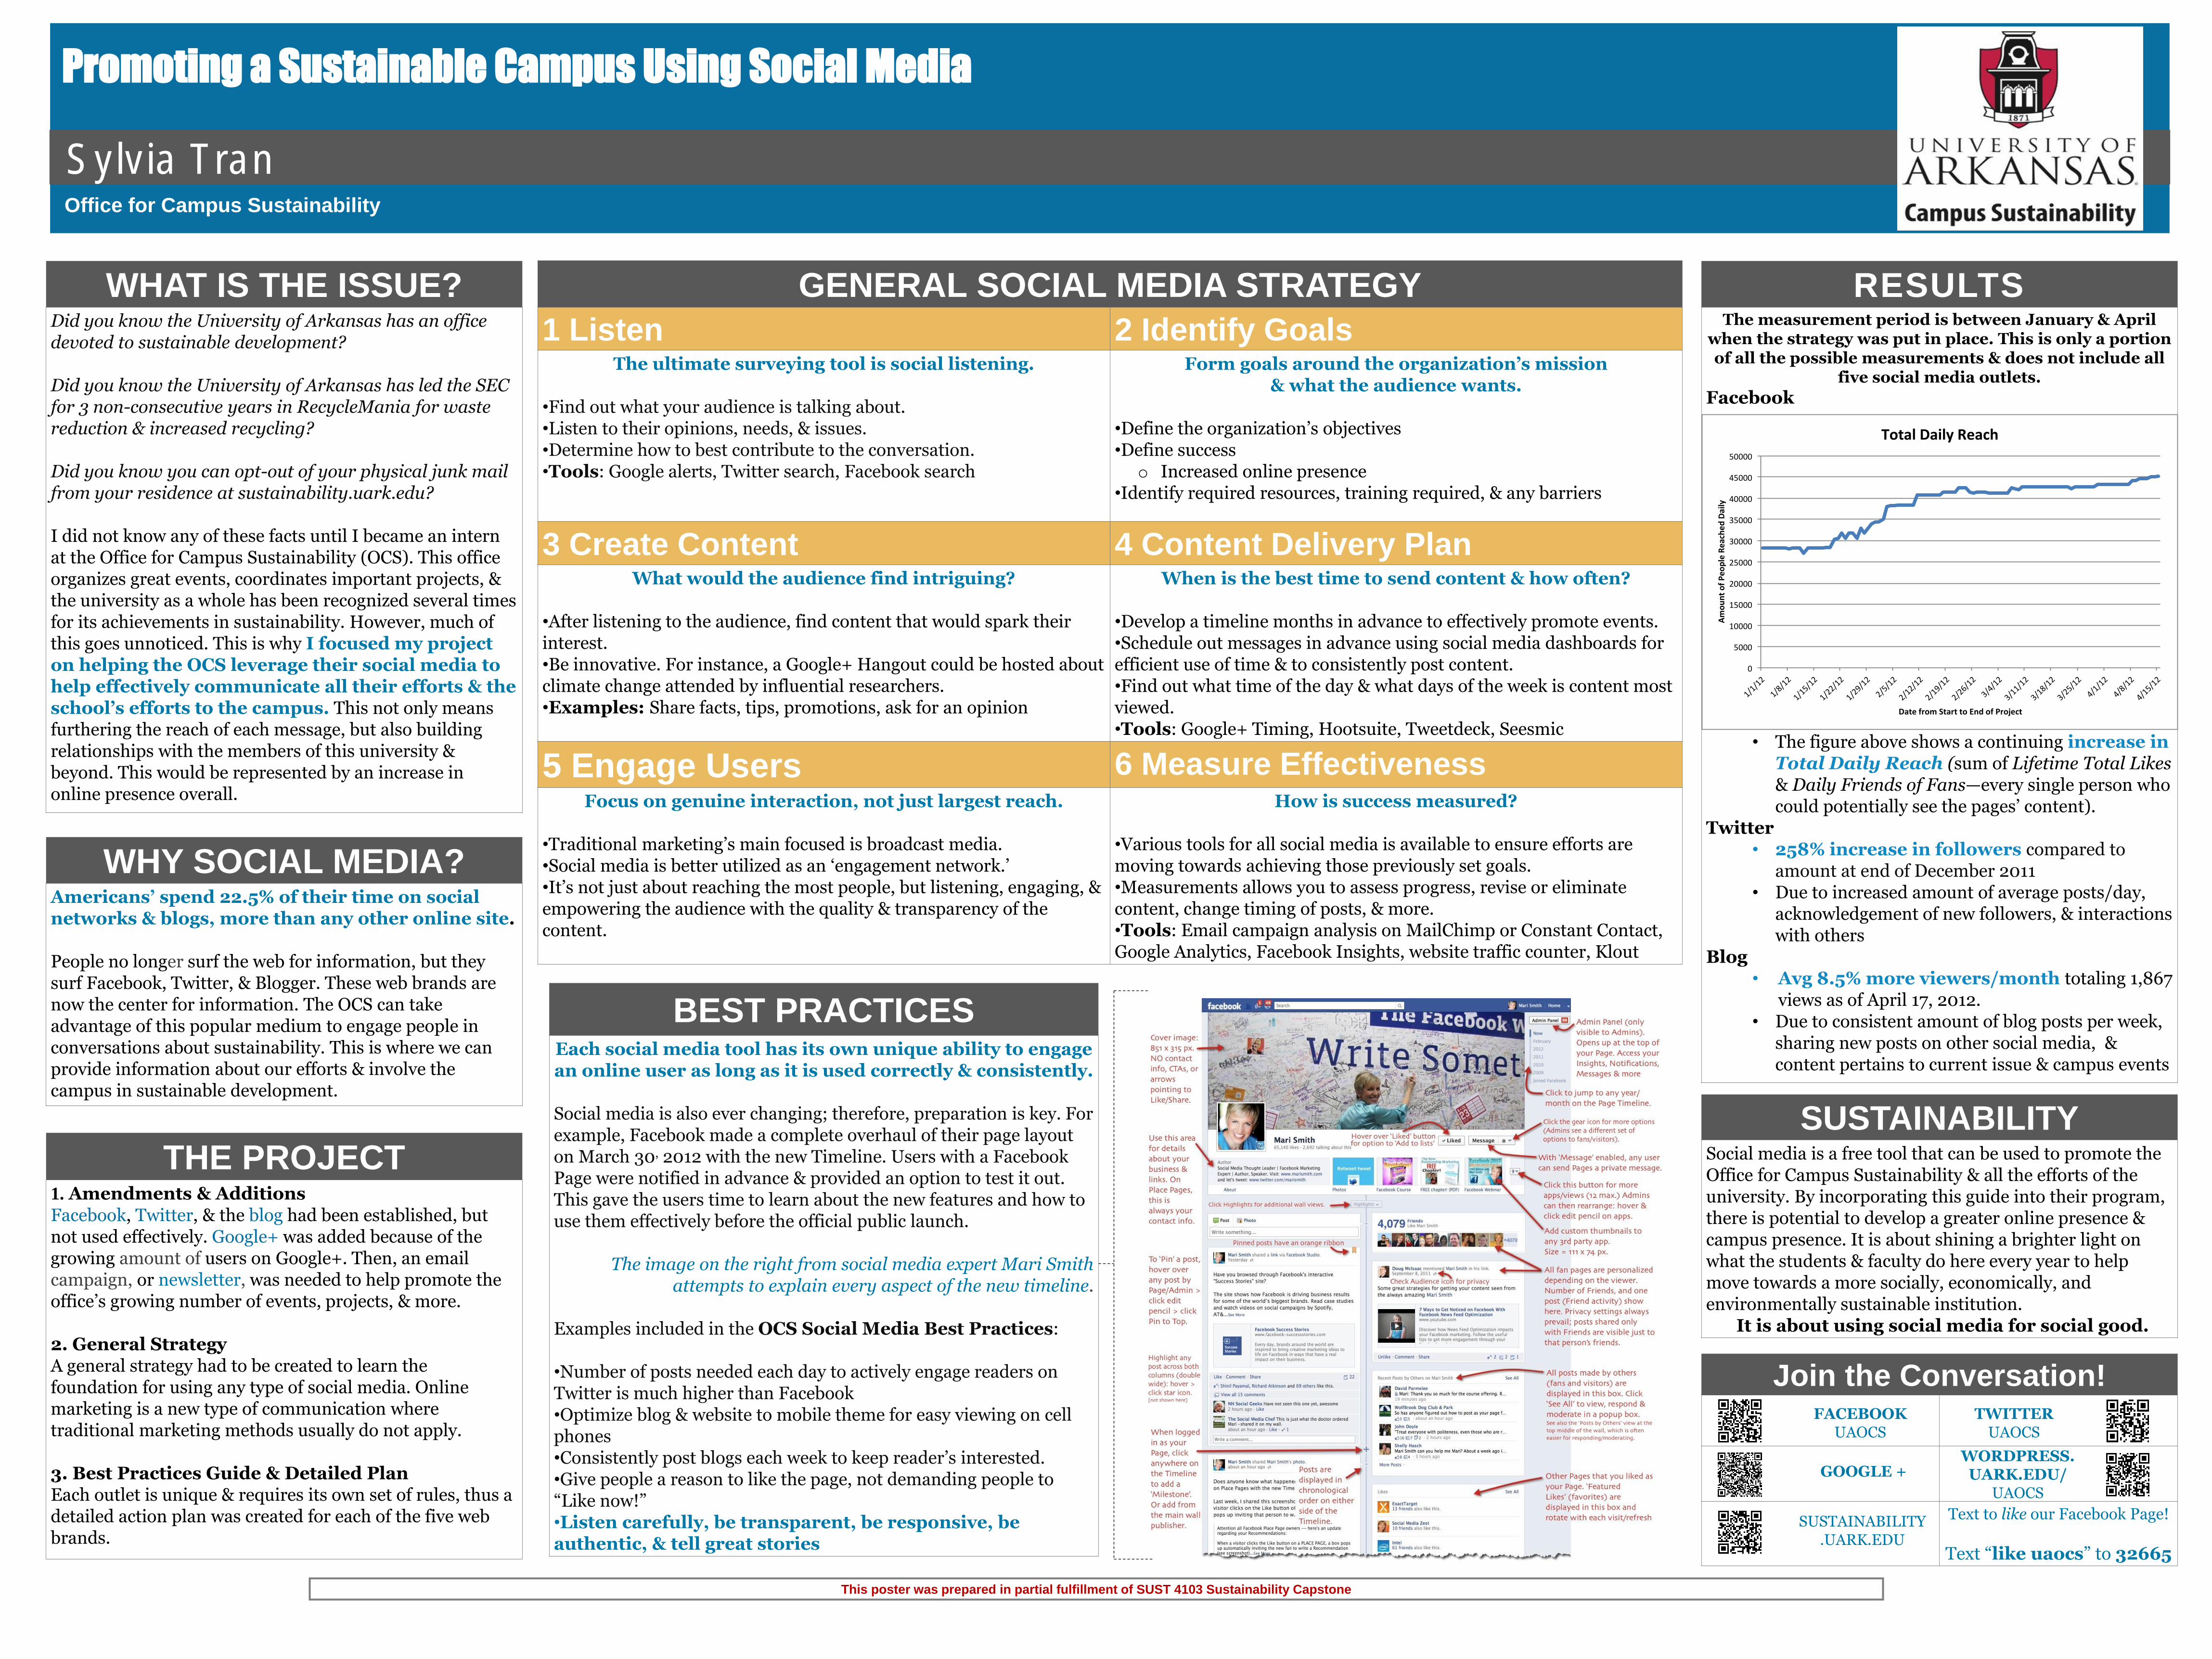
RESULTS The measurement period is between January & April
when the strategy was put in place. This is only a portion of all the possible measurements & does not include all
five social media outlets.
• The figure above shows a continuing increase in Total Daily Reach (sum of Lifetime Total Likes & Daily Friends of Fans—every single person who could potentially see the pages’ content).
Twitter • 258% increase in followers compared to
amount at end of December 2011 • Due to increased amount of average posts/day,
acknowledgement of new followers, & interactions with others
Blog • Avg 8.5% more viewers/month totaling 1,867
views as of April 17, 2012. • Due to consistent amount of blog posts per week,
sharing new posts on other social media, & content pertains to current issue & campus events
FACEBOOK UAOCS
GOOGLE +
SUSTAINABILITY.UARK.EDU
WORDPRESS.UARK.EDU/
UAOCS
TWITTER UAOCS
0
5000
10000
15000
20000
25000
30000
35000
40000
45000
50000
1/1/12
1/8/12
1/15/12
1/22/12
1/29/12
2/5/12
2/12/12
2/19/12
2/26/12
3/4/12
3/11/12
3/18/12
3/25/12
4/1/12
4/8/12
4/15/12
AmountofPeo
pleReachedDaily
DatefromStarttoEndofProject
TotalDailyReach
Girls Gone Green: Reducing Sorority Styrofoam Usage
Architectural Studies Student: Sara Turner SUST 4103: Capstone Project for Sustainability Minor
Faculty: Dr. S. Boss and Dr. T. Messadi
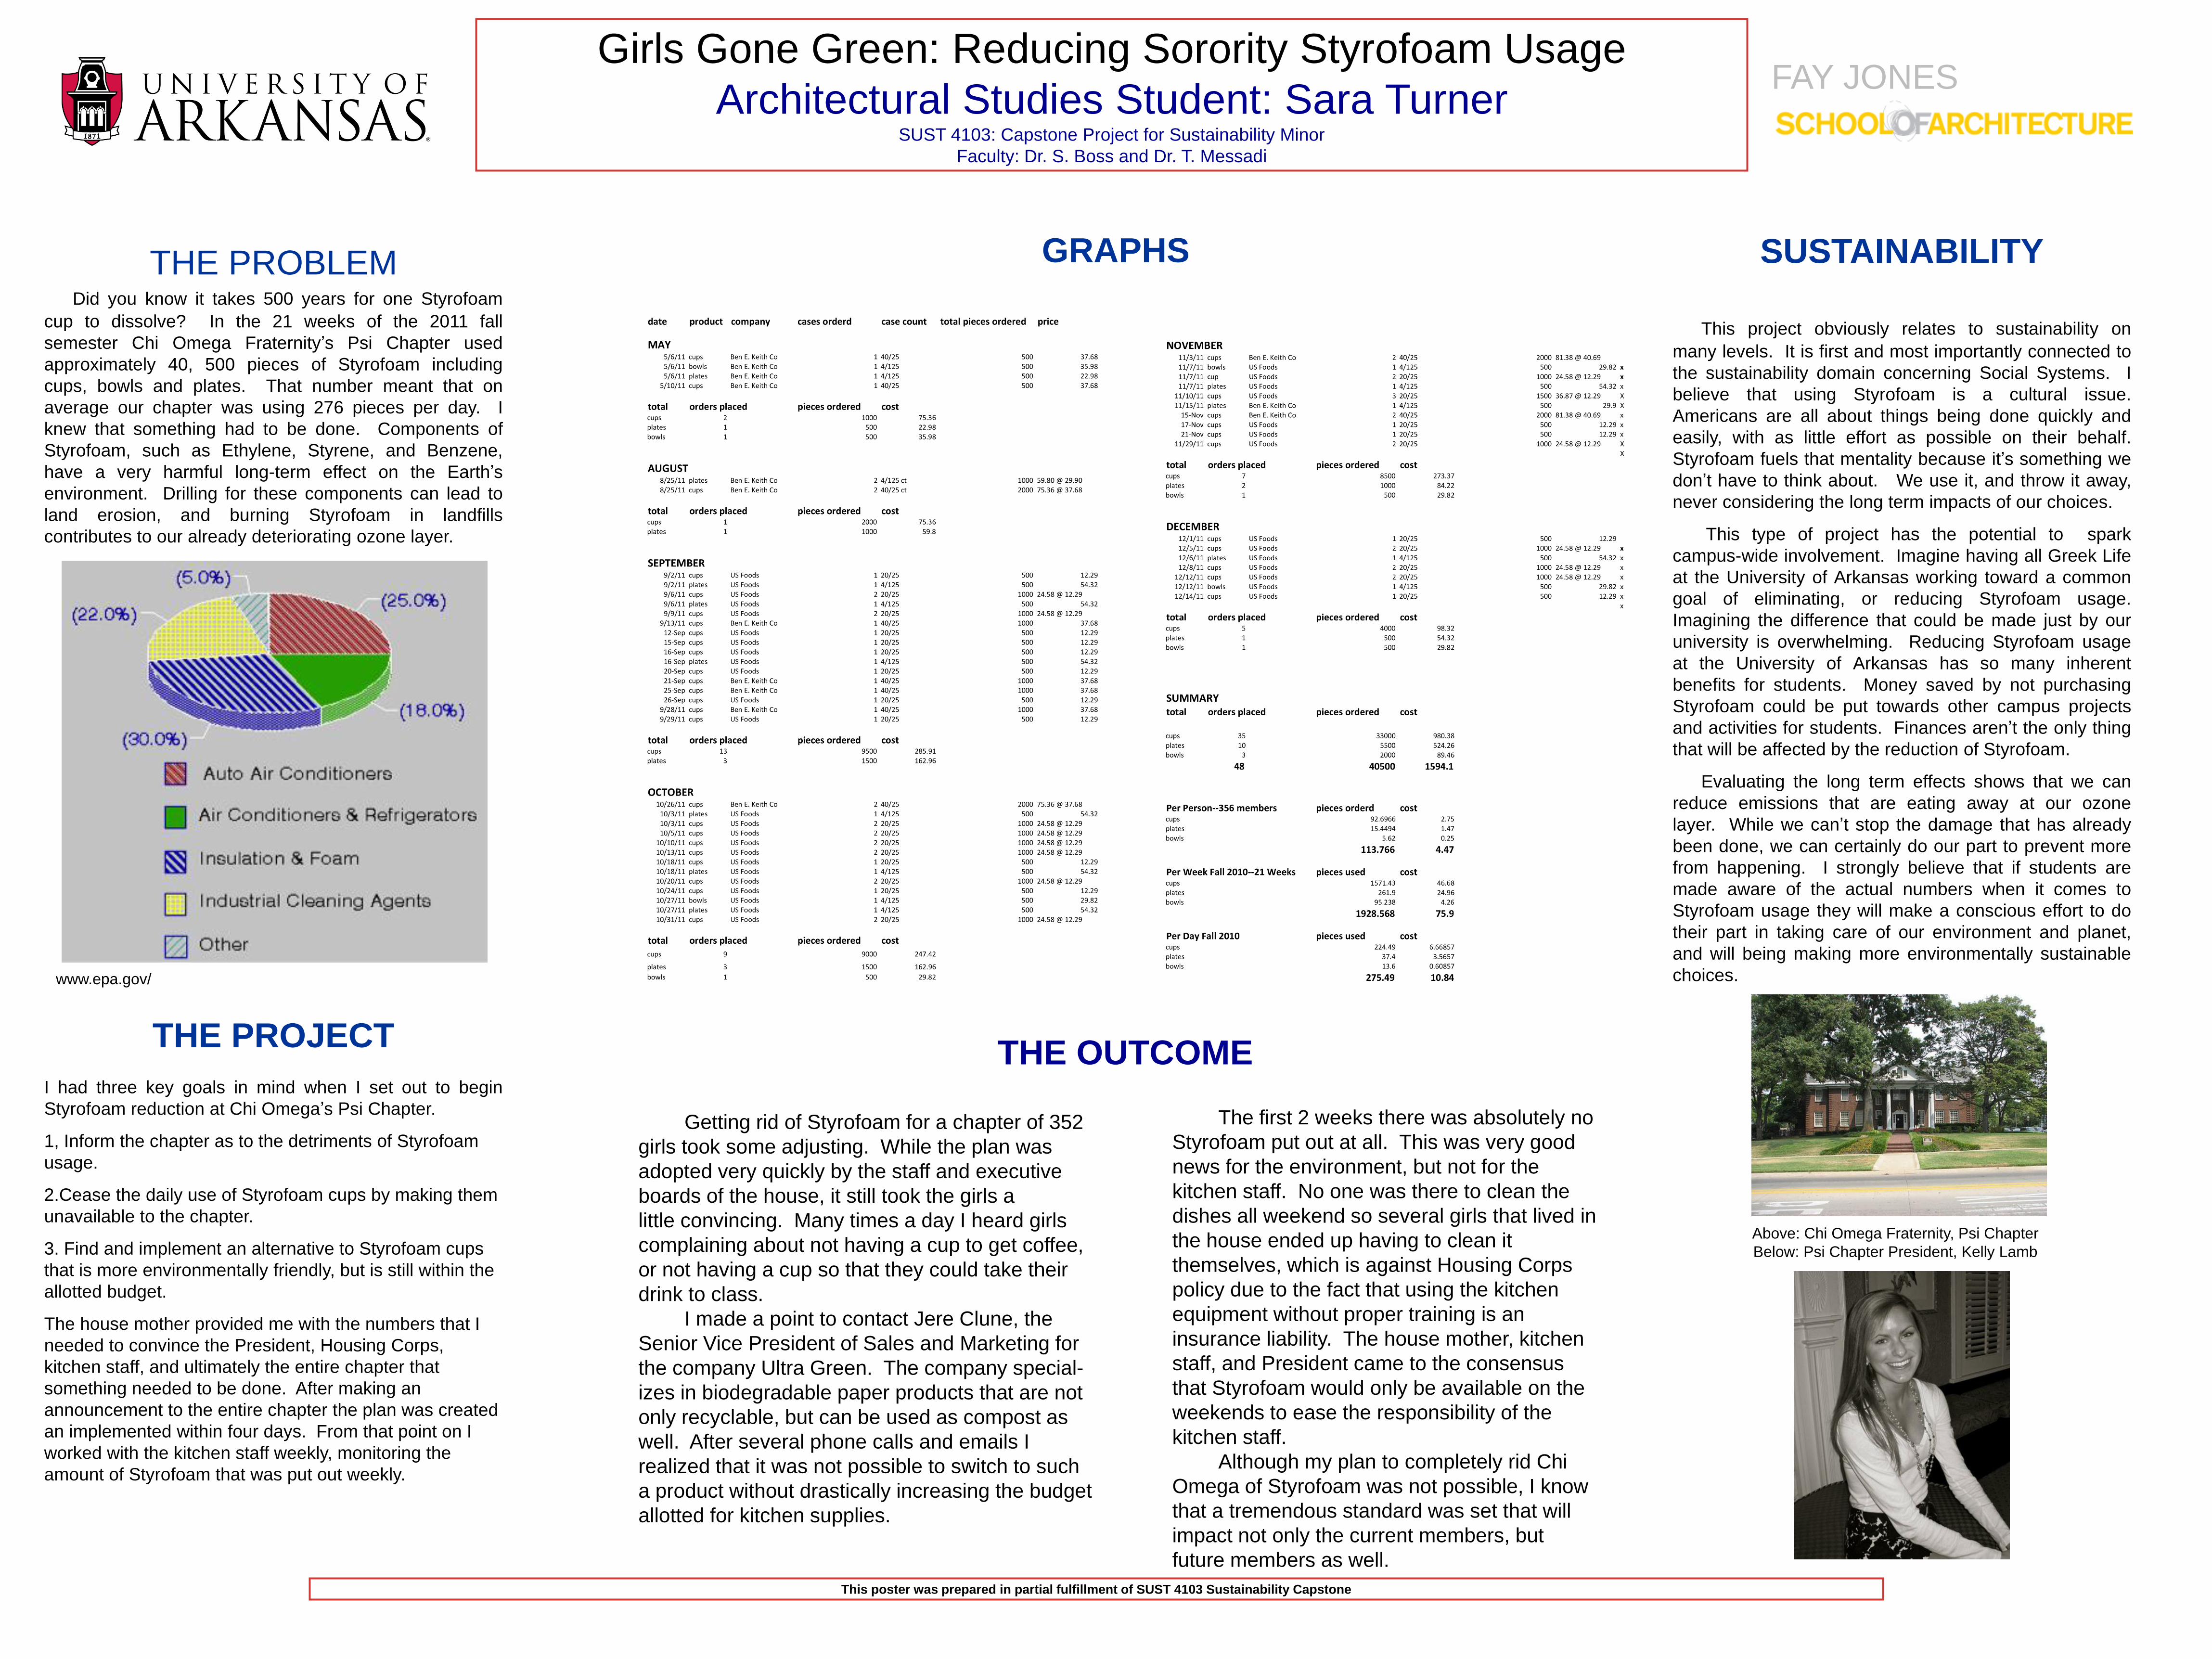
THE PROBLEM Did you know it takes 500 years for one Styrofoam
cup to dissolve? In the 21 weeks of the 2011 fall
semester Chi Omega Fraternity’s Psi Chapter used
approximately 40, 500 pieces of Styrofoam including
cups, bowls and plates. That number meant that on
average our chapter was using 276 pieces per day. I
knew that something had to be done. Components of
Styrofoam, such as Ethylene, Styrene, and Benzene,
have a very harmful long-term effect on the Earth’s
environment. Drilling for these components can lead to
land erosion, and burning Styrofoam in landfills
contributes to our already deteriorating ozone layer.
THE PROJECT
I had three key goals in mind when I set out to begin
Styrofoam reduction at Chi Omega’s Psi Chapter.
1, Inform the chapter as to the detriments of Styrofoam
usage.
2.Cease the daily use of Styrofoam cups by making them
unavailable to the chapter.
3. Find and implement an alternative to Styrofoam cups
that is more environmentally friendly, but is still within the
allotted budget.
The house mother provided me with the numbers that I
needed to convince the President, Housing Corps,
kitchen staff, and ultimately the entire chapter that
something needed to be done. After making an
announcement to the entire chapter the plan was created
an implemented within four days. From that point on I
worked with the kitchen staff weekly, monitoring the
amount of Styrofoam that was put out weekly.
SUSTAINABILITY
This project obviously relates to sustainability on
many levels. It is first and most importantly connected to
the sustainability domain concerning Social Systems. I
believe that using Styrofoam is a cultural issue.
Americans are all about things being done quickly and
easily, with as little effort as possible on their behalf.
Styrofoam fuels that mentality because it’s something we
don’t have to think about. We use it, and throw it away,
never considering the long term impacts of our choices.
This type of project has the potential to spark
campus-wide involvement. Imagine having all Greek Life
at the University of Arkansas working toward a common
goal of eliminating, or reducing Styrofoam usage.
Imagining the difference that could be made just by our
university is overwhelming. Reducing Styrofoam usage
at the University of Arkansas has so many inherent
benefits for students. Money saved by not purchasing
Styrofoam could be put towards other campus projects
and activities for students. Finances aren’t the only thing
that will be affected by the reduction of Styrofoam.
Evaluating the long term effects shows that we can
reduce emissions that are eating away at our ozone
layer. While we can’t stop the damage that has already
been done, we can certainly do our part to prevent more
from happening. I strongly believe that if students are
made aware of the actual numbers when it comes to
Styrofoam usage they will make a conscious effort to do
their part in taking care of our environment and planet,
and will being making more environmentally sustainable
choices.
This poster was prepared in partial fulfillment of SUST 4103 Sustainability Capstone
GRAPHS
THE OUTCOME
Getting rid of Styrofoam for a chapter of 352
girls took some adjusting. While the plan was
adopted very quickly by the staff and executive
boards of the house, it still took the girls a
little convincing. Many times a day I heard girls
complaining about not having a cup to get coffee,
or not having a cup so that they could take their
drink to class.
I made a point to contact Jere Clune, the
Senior Vice President of Sales and Marketing for
the company Ultra Green. The company special-
izes in biodegradable paper products that are not
only recyclable, but can be used as compost as
well. After several phone calls and emails I
realized that it was not possible to switch to such
a product without drastically increasing the budget
allotted for kitchen supplies.
The first 2 weeks there was absolutely no
Styrofoam put out at all. This was very good
news for the environment, but not for the
kitchen staff. No one was there to clean the
dishes all weekend so several girls that lived in
the house ended up having to clean it
themselves, which is against Housing Corps
policy due to the fact that using the kitchen
equipment without proper training is an
insurance liability. The house mother, kitchen
staff, and President came to the consensus
that Styrofoam would only be available on the
weekends to ease the responsibility of the
kitchen staff.
Although my plan to completely rid Chi
Omega of Styrofoam was not possible, I know
that a tremendous standard was set that will
impact not only the current members, but
future members as well.
FAY JONES
www.epa.gov/
Above: Chi Omega Fraternity, Psi Chapter
Below: Psi Chapter President, Kelly Lamb
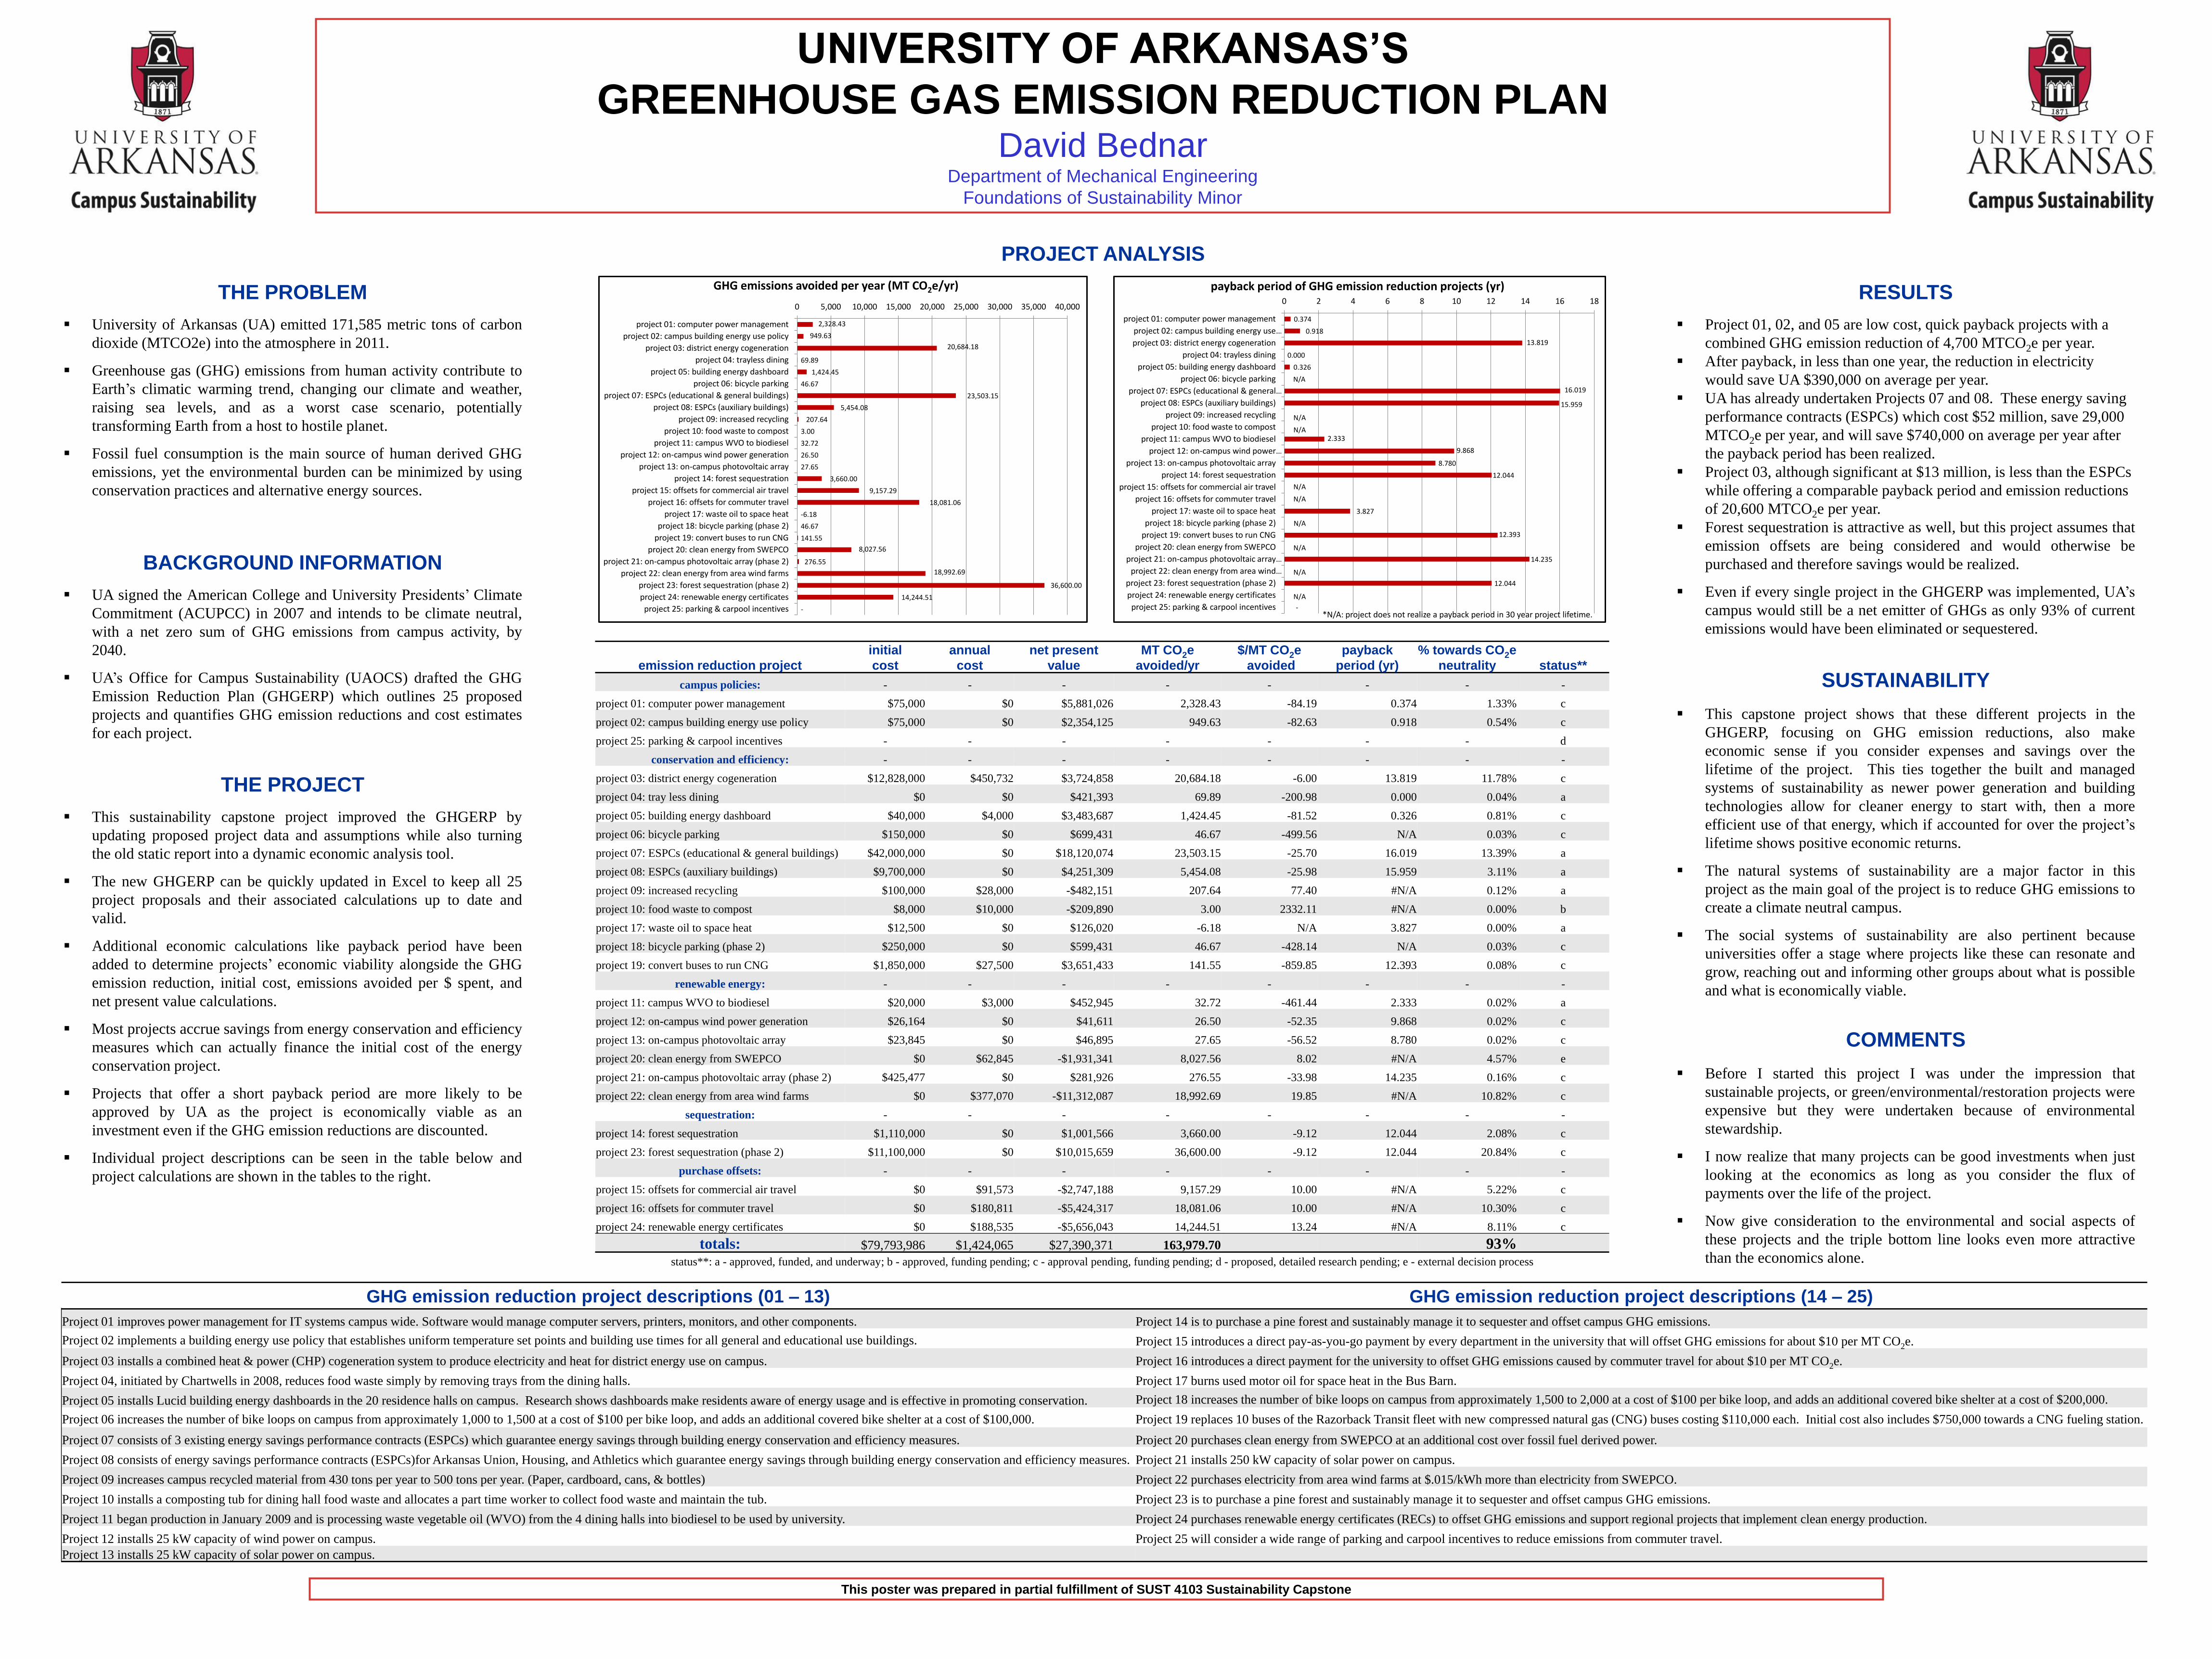
PROJECT ANALYSIS
0.374
0.918
13.819
0.000
0.326
N/A
16.019
15.959
2.333
9.868
8.780
12.044
3.827
N/A
12.393
14.235
12.044
-
0 2 4 6 8 10 12 14 16 18
project 01: computer power management
project 02: campus building energy use …
project 03: district energy cogeneration
project 04: trayless dining
project 05: building energy dashboard
project 06: bicycle parking
project 07: ESPCs (educational & general …
project 08: ESPCs (auxiliary buildings)
project 09: increased recycling
project 10: food waste to compost
project 11: campus WVO to biodiesel
project 12: on-campus wind power …
project 13: on-campus photovoltaic array
project 14: forest sequestration
project 15: offsets for commercial air travel
project 16: offsets for commuter travel
project 17: waste oil to space heat
project 18: bicycle parking (phase 2)
project 19: convert buses to run CNG
project 20: clean energy from SWEPCO
project 21: on-campus photovoltaic array …
project 22: clean energy from area wind …
project 23: forest sequestration (phase 2)
project 24: renewable energy certificates
project 25: parking & carpool incentives
payback period of GHG emission reduction projects (yr)
N/A
N/A
N/A
N/A
N/A
N/A
N/A
UNIVERSITY OF ARKANSAS’S
GREENHOUSE GAS EMISSION REDUCTION PLAN David Bednar
Department of Mechanical Engineering
Foundations of Sustainability Minor
THE PROBLEM
University of Arkansas (UA) emitted 171,585 metric tons of carbon
dioxide (MTCO2e) into the atmosphere in 2011.
Greenhouse gas (GHG) emissions from human activity contribute to
Earth’s climatic warming trend, changing our climate and weather,
raising sea levels, and as a worst case scenario, potentially
transforming Earth from a host to hostile planet.
Fossil fuel consumption is the main source of human derived GHG
emissions, yet the environmental burden can be minimized by using
conservation practices and alternative energy sources.
BACKGROUND INFORMATION
UA signed the American College and University Presidents’ Climate
Commitment (ACUPCC) in 2007 and intends to be climate neutral,
with a net zero sum of GHG emissions from campus activity, by
2040.
UA’s Office for Campus Sustainability (UAOCS) drafted the GHG
Emission Reduction Plan (GHGERP) which outlines 25 proposed
projects and quantifies GHG emission reductions and cost estimates
for each project.
THE PROJECT
This sustainability capstone project improved the GHGERP by
updating proposed project data and assumptions while also turning
the old static report into a dynamic economic analysis tool.
The new GHGERP can be quickly updated in Excel to keep all 25
project proposals and their associated calculations up to date and
valid.
Additional economic calculations like payback period have been
added to determine projects’ economic viability alongside the GHG
emission reduction, initial cost, emissions avoided per $ spent, and
net present value calculations.
Most projects accrue savings from energy conservation and efficiency
measures which can actually finance the initial cost of the energy
conservation project.
Projects that offer a short payback period are more likely to be
approved by UA as the project is economically viable as an
investment even if the GHG emission reductions are discounted.
Individual project descriptions can be seen in the table below and
project calculations are shown in the tables to the right.
RESULTS
Project 01, 02, and 05 are low cost, quick payback projects with a
combined GHG emission reduction of 4,700 MTCO2e per year.
After payback, in less than one year, the reduction in electricity
would save UA $390,000 on average per year.
UA has already undertaken Projects 07 and 08. These energy saving
performance contracts (ESPCs) which cost $52 million, save 29,000
MTCO2e per year, and will save $740,000 on average per year after
the payback period has been realized.
Project 03, although significant at $13 million, is less than the ESPCs
while offering a comparable payback period and emission reductions
of 20,600 MTCO2e per year.
Forest sequestration is attractive as well, but this project assumes that
emission offsets are being considered and would otherwise be
purchased and therefore savings would be realized.
Even if every single project in the GHGERP was implemented, UA’s
campus would still be a net emitter of GHGs as only 93% of current
emissions would have been eliminated or sequestered.
SUSTAINABILITY
This capstone project shows that these different projects in the
GHGERP, focusing on GHG emission reductions, also make
economic sense if you consider expenses and savings over the
lifetime of the project. This ties together the built and managed
systems of sustainability as newer power generation and building
technologies allow for cleaner energy to start with, then a more
efficient use of that energy, which if accounted for over the project’s
lifetime shows positive economic returns.
The natural systems of sustainability are a major factor in this
project as the main goal of the project is to reduce GHG emissions to
create a climate neutral campus.
The social systems of sustainability are also pertinent because
universities offer a stage where projects like these can resonate and
grow, reaching out and informing other groups about what is possible
and what is economically viable.
COMMENTS
Before I started this project I was under the impression that
sustainable projects, or green/environmental/restoration projects were
expensive but they were undertaken because of environmental
stewardship.
I now realize that many projects can be good investments when just
looking at the economics as long as you consider the flux of
payments over the life of the project.
Now give consideration to the environmental and social aspects of
these projects and the triple bottom line looks even more attractive
than the economics alone.
This poster was prepared in partial fulfillment of SUST 4103 Sustainability Capstone
2,328.43
949.63
20,684.18
69.89
1,424.45
46.67
23,503.15
5,454.08
207.64
3.00
32.72
26.50
27.65
3,660.00
9,157.29
18,081.06
-6.18
46.67
141.55
8,027.56
276.55
18,992.69
36,600.00
14,244.51
-
0 5,000 10,000 15,000 20,000 25,000 30,000 35,000 40,000
project 01: computer power management
project 02: campus building energy use policy
project 03: district energy cogeneration
project 04: trayless dining
project 05: building energy dashboard
project 06: bicycle parking
project 07: ESPCs (educational & general buildings)
project 08: ESPCs (auxiliary buildings)
project 09: increased recycling
project 10: food waste to compost
project 11: campus WVO to biodiesel
project 12: on-campus wind power generation
project 13: on-campus photovoltaic array
project 14: forest sequestration
project 15: offsets for commercial air travel
project 16: offsets for commuter travel
project 17: waste oil to space heat
project 18: bicycle parking (phase 2)
project 19: convert buses to run CNG
project 20: clean energy from SWEPCO
project 21: on-campus photovoltaic array (phase 2)
project 22: clean energy from area wind farms
project 23: forest sequestration (phase 2)
project 24: renewable energy certificates
project 25: parking & carpool incentives
GHG emissions avoided per year (MT CO2e/yr)
emission reduction project
initial
cost
annual
cost
net present
value
MT CO2e
avoided/yr
$/MT CO2e
avoided
payback
period (yr)
% towards CO2e
neutrality status**
campus policies: - - - - - - - -
project 01: computer power management $75,000 $0 $5,881,026 2,328.43 -84.19 0.374 1.33% c
project 02: campus building energy use policy $75,000 $0 $2,354,125 949.63 -82.63 0.918 0.54% c
project 25: parking & carpool incentives - - - - - - - d
conservation and efficiency: - - - - - - - -
project 03: district energy cogeneration $12,828,000 $450,732 $3,724,858 20,684.18 -6.00 13.819 11.78% c
project 04: tray less dining $0 $0 $421,393 69.89 -200.98 0.000 0.04% a
project 05: building energy dashboard $40,000 $4,000 $3,483,687 1,424.45 -81.52 0.326 0.81% c
project 06: bicycle parking $150,000 $0 $699,431 46.67 -499.56 N/A 0.03% c
project 07: ESPCs (educational & general buildings) $42,000,000 $0 $18,120,074 23,503.15 -25.70 16.019 13.39% a
project 08: ESPCs (auxiliary buildings) $9,700,000 $0 $4,251,309 5,454.08 -25.98 15.959 3.11% a
project 09: increased recycling $100,000 $28,000 -$482,151 207.64 77.40 #N/A 0.12% a
project 10: food waste to compost $8,000 $10,000 -$209,890 3.00 2332.11 #N/A 0.00% b
project 17: waste oil to space heat $12,500 $0 $126,020 -6.18 N/A 3.827 0.00% a
project 18: bicycle parking (phase 2) $250,000 $0 $599,431 46.67 -428.14 N/A 0.03% c
project 19: convert buses to run CNG $1,850,000 $27,500 $3,651,433 141.55 -859.85 12.393 0.08% c
renewable energy: - - - - - - - -
project 11: campus WVO to biodiesel $20,000 $3,000 $452,945 32.72 -461.44 2.333 0.02% a
project 12: on-campus wind power generation $26,164 $0 $41,611 26.50 -52.35 9.868 0.02% c
project 13: on-campus photovoltaic array $23,845 $0 $46,895 27.65 -56.52 8.780 0.02% c
project 20: clean energy from SWEPCO $0 $62,845 -$1,931,341 8,027.56 8.02 #N/A 4.57% e
project 21: on-campus photovoltaic array (phase 2) $425,477 $0 $281,926 276.55 -33.98 14.235 0.16% c
project 22: clean energy from area wind farms $0 $377,070 -$11,312,087 18,992.69 19.85 #N/A 10.82% c
sequestration: - - - - - - - -
project 14: forest sequestration $1,110,000 $0 $1,001,566 3,660.00 -9.12 12.044 2.08% c
project 23: forest sequestration (phase 2) $11,100,000 $0 $10,015,659 36,600.00 -9.12 12.044 20.84% c
purchase offsets: - - - - - - - -
project 15: offsets for commercial air travel $0 $91,573 -$2,747,188 9,157.29 10.00 #N/A 5.22% c
project 16: offsets for commuter travel $0 $180,811 -$5,424,317 18,081.06 10.00 #N/A 10.30% c
project 24: renewable energy certificates $0 $188,535 -$5,656,043 14,244.51 13.24 #N/A 8.11% c
totals: $79,793,986 $1,424,065 $27,390,371 163,979.70 93%
GHG emission reduction project descriptions (01 – 13) GHG emission reduction project descriptions (14 – 25)
Project 01 improves power management for IT systems campus wide. Software would manage computer servers, printers, monitors, and other components. Project 14 is to purchase a pine forest and sustainably manage it to sequester and offset campus GHG emissions.
Project 02 implements a building energy use policy that establishes uniform temperature set points and building use times for all general and educational use buildings. Project 15 introduces a direct pay-as-you-go payment by every department in the university that will offset GHG emissions for about $10 per MT CO2e.
Project 03 installs a combined heat & power (CHP) cogeneration system to produce electricity and heat for district energy use on campus. Project 16 introduces a direct payment for the university to offset GHG emissions caused by commuter travel for about $10 per MT CO2e.
Project 04, initiated by Chartwells in 2008, reduces food waste simply by removing trays from the dining halls. Project 17 burns used motor oil for space heat in the Bus Barn.
Project 05 installs Lucid building energy dashboards in the 20 residence halls on campus. Research shows dashboards make residents aware of energy usage and is effective in promoting conservation. Project 18 increases the number of bike loops on campus from approximately 1,500 to 2,000 at a cost of $100 per bike loop, and adds an additional covered bike shelter at a cost of $200,000.
Project 06 increases the number of bike loops on campus from approximately 1,000 to 1,500 at a cost of $100 per bike loop, and adds an additional covered bike shelter at a cost of $100,000. Project 19 replaces 10 buses of the Razorback Transit fleet with new compressed natural gas (CNG) buses costing $110,000 each. Initial cost also includes $750,000 towards a CNG fueling station.
Project 07 consists of 3 existing energy savings performance contracts (ESPCs) which guarantee energy savings through building energy conservation and efficiency measures. Project 20 purchases clean energy from SWEPCO at an additional cost over fossil fuel derived power.
Project 08 consists of energy savings performance contracts (ESPCs)for Arkansas Union, Housing, and Athletics which guarantee energy savings through building energy conservation and efficiency measures. Project 21 installs 250 kW capacity of solar power on campus.
Project 09 increases campus recycled material from 430 tons per year to 500 tons per year. (Paper, cardboard, cans, & bottles) Project 22 purchases electricity from area wind farms at $.015/kWh more than electricity from SWEPCO.
Project 10 installs a composting tub for dining hall food waste and allocates a part time worker to collect food waste and maintain the tub. Project 23 is to purchase a pine forest and sustainably manage it to sequester and offset campus GHG emissions.
Project 11 began production in January 2009 and is processing waste vegetable oil (WVO) from the 4 dining halls into biodiesel to be used by university. Project 24 purchases renewable energy certificates (RECs) to offset GHG emissions and support regional projects that implement clean energy production.
Project 12 installs 25 kW capacity of wind power on campus. Project 25 will consider a wide range of parking and carpool incentives to reduce emissions from commuter travel.
Project 13 installs 25 kW capacity of solar power on campus.
*N/A: project does not realize a payback period in 30 year project lifetime.
status**: a - approved, funded, and underway; b - approved, funding pending; c - approval pending, funding pending; d - proposed, detailed research pending; e - external decision process
POSTER TEMPLATE BY:
www.PosterPresentations.com
Service Learning in Belize: Christ the King Water Fountain Megan Peters
Capstone for Minor in Sustainability Department of Industrial Engineering
Christ the King The New Fountain
Results
Sustainability
Reflections/Future Work
Acknowledgements
Megan Peters, putting together
the door to the box with help of
a student
Pumping station at
Dangriga’s water facility in
North Stann Creek Civil engineering student,
Chase Henrichs, filling the
first jug of water
A group of
engineering
students at
the school’s
dedication
of the
fountain
• The school had previously installed two water fountains located
outside the bathrooms in an area of the campus that could not be
seen from any classrooms or the principal’s office. The pipes
running underground were considered to be too close to the
septic system. School staff and parents considered it unsafe and
unsanitary, two aspects that violated the fountain’s social
sustainability.
• The fountain was vandalized on a regular basis and unauthorized
use became a problem. Christ the King is not located in a
residential area and is adjacent to a basketball court that is
frequented in the evenings. Because there was no protective
structure built to enclose the fountains, they were unsustainable
in the built system.
Old fountains
The Old Fountains
• Christ the King Primary School is situated on the coast of
Dangriga, Belize, next to the Caribbean Sea. Dangriga is the
largest urban area in southern Belize and is the capital of Stann
Creek District.
• About 210 students attend school at Christ the King in Infant one
and two and Standards one through six, corresponding to grades
one through eight in the United States.
• A group of six students, representing industrial, civil and mechanical engineering disciplines, built a new fountain in two days.
• The decided location was visible from most classrooms and the principal’s office. After the length for pipe was measured and the least amount of
pipe elbows needed was determined, the protective structure was designed.
• It was decided that a wood box would be constructed flush with the side of the building to enclose the fountain. The length and width of the box
would be two feet, while the height would be three feet, allowing for a vertical staff that would be two feet tall, so that a bucket could be filled. The
front of the box would open like a door and be locked in the evenings.
• A teacher at Ecumenical High School donated most of the tools and Peacework donated wood. Twenty-seven two-feet planks and four four-feet
posts were cut from the wood.
• Fifty feet of three-fourths inch PVC pipe was purchased at $1 BZ per foot. Four hinges, sixty-eight screws, a bottle of glue, a pipe cutter,
connectors, two valves, a spout and a lock were purchased at a total of $40 BZ, totaling $90 BZ for the entire project.
• A trench was dug alongside the building and around two corners from the water line connection to the fountain. The pipe was connected and glued
in the trench. Pressure was tested after the glue dried, and the trench was then filled.
• For the box, the four posts were placed in four holes that had been dug with a posthole digger and the top and sides were constructed. The door
was constructed and attached last.
• The project was implemented in a manner that solved the school’s financial boundary. It addresses all of the problems with the old fountains and
kitchen use.
• The principal expects the new fountain to last up to three years. She held a fountain dedication for the school.
Managed Sustainability
• The managed system of sustainability considers economic and
legal constraints to maximize return on projects.
• Vandalism and water theft should no longer be a problem for the
fountain. These activities are illegal in Dangriga, but remain an
issue.
• The project was constructed under a narrow budget. It was less
expensive for the group to execute the project than it would have
been for the school because labor was free to them and the wood
and tools were donated.
• The school will only pay for the water being used during school
hours and repair costs will be negligible.
• Materials were purchased locally, which supported Dangriga’s local
economic activity.
Social Sustainability
• The social system of sustainability focuses on people.
• The new fountain will be students’ only source of hydration during
school hours, an alternative to sugary juices.
• Students who attend Christ the King, but live outside of Dangriga in
rural areas, may not have access to clean water all year. Most
people living in Dangriga have piped water to their homes; however,
those living in the surrounding villages may have other methods of
obtaining drinking water.
Christ the King
Campus, taken
from the center of
the outdoor
courtyard,
showing the
fountain
Sustainability Built Sustainability
• The built system of sustainability includes the design and construction of structures in a manner that poses little impact on the environment and
takes into account location and surroundings.
• The fountain was built with minimal material waste. The donated wood was left over from another project. Only the necessary amount of pipe
materials and screws were purchased. The tools were loaned to the group so they would not need to be purchased.
• The protective wood box enclosing the fountain will discourage vandalism, and the lock on the door will prevent unauthorized use. It will also
protect the fountain from children playing around it and severe weather, which could cause damage.
• The trench was dug eighteen inches in the ground so that rain, severe weather and children playing could not damage the pipe.
• The pipe stands two feet tall so that a bucket could be filled for a classroom. This way, children will not have to continually disrupt class to fill their
cups and may drink more water.
• The fountain is not in an inconvenient location for anyone and is not near anything that could cause harm to the water quality.
Old fountains outside bathrooms
• The project provided first-hand experience in using knowledge and
skills learned in the classroom to implement a sustainable small-
scale project in a developing country in another region of the
world. The sustainability of projects such as this one is very
important to end-users, in this case, Christ the King.
• An interdisciplinary team of engineers worked together in the
design and construction of the fountain.
• Communication with local partners was vital in understanding their
needs and addressing those needs with the project.
• This project began interest in water situations in developing
countries, which has further developed into research in water
management and efficiency.
• Dr. Tom Soerens advised the project.
• Megan Peters, Courtney Hill and Ryan Hagedorn led the project.
• Mr. Derrick Jones, a teacher at Ecumenical High School in
Dangriga, loaned most tools.
• Mrs. Young, the principal at Christ the King, requested the fountain
project.
• Jeff Lieberman, the University of Arkansas’ Peacework Village
Initiative representative, coordinated initial communication between
Mrs. Young and the engineering team.
Diagram of old fountains with respect to campus and basketball court
• The school would have to pay to repair the damages regularly
and for unauthorized use of the water. For these reasons, the
fountain was not economically sustainable, violating the managed
system.
• The fountains were used for only two months. When the group
arrived, they were no longer functioning.
• In the time between use of the old fountains and the completion
of the new fountain, students brought cups to school and
accessed the only sink in the small kitchen for water. Children
would make messes in the kitchen because they were
unsupervised. This was an inconvenience to ladies working in
the kitchen. This method proved to be unsustainable in the social
system because it was disruptive and students were discouraged
from filling their cups more than once a day. It was unsustainable
in the managed system because the children were unsupervised.
Principal’s Office Classrooms
Classroom
Bldg.
Bathrooms
Basketball
Court
Principal’s Office Classrooms
Classroom
Bldg.
New fountain
Diagram of
new fountain
location
Data obtained from
2010 Belize
Population and
Housing Census
Capstone Internship Experience
Cabot Shores Tanner Freeman
Sustainability Minor Requirement
THE EXPERIENCE
My internship experience for
Sustainability Capstone was with the Cabot
Shores Wilderness Resort on Cape Breton
Island, Nova Scotia, Canada. My major in
Recreation Management with an
International concentration and the
Capstone requirement is what led me to
work at Cabot Shores last summer from
June 14, 2011 to August 11, 2011. My work
included a series of multidisciplinary projects
and jobs, although working in every part of
the Resort operation; I focused on
sustainable building projects, property
maintenance and upkeep of systems, and
the team leader for the implementation of
short-term and long-term plans and projects
for me and the current staff as well as
developing forecast plans and project
concepts for future staff to complete.
PROJECTS
Projects
The new additions to the lodge near the
beginning of my attendance at the resort
were recent which called for me to learn
about and maintain different projects like
examining the 32 sq ft solar hot water heater
with a clear day rating in ‘Category C’ at
about 8.9 kWh/day and 30kBtu/day made by
Thermo Dynamics Ltd.
addition and of two Cansolair solar hot air
panels on the exterior of the lodge was the
next project completed. When the sun is out
it provides a warm flow of air to heat the
main lodge Cansolair Solar Max 240
consists of a four by seven solar collector. It
has 15 vertical columns of cylindrical shape
which makes the surface exposed to the sun
greater. The same cylindrical shape allows
the Solar Max to receive solar radiation for a
longer period due to the angle of incidence
of the sun hitting the solar panel.
THE OUTCOME
WHAT WAS THE OUTCOME OF YOUR
WORK
UNIVERSITY
LOGO HERE
Need University
Logo here
SUSTAINABILITY
The Cabot Shores Vision of “Green
Resort”
The Cabot Shores Vision of being more
sustainable starts with acknowledging the
responsibility to be good stewards of the
land which Cabot Shores sits. The 55 acres
at the main Indian Brook location, 180 acres
at Breton Cove, and 6 acres at the Wreck
Cove property that all have fragile ecological
biodiversity issues. The two of the
properties that have buildings and
infrastructure are clearly not yet energy
efficient, but slowly getting there. The
properties have huge populations of moose
and a diverse amount of other delicate plant
and animal species. Respect and continued
stewardship and attendance to air quality
and water quality in the outstanding land and
pathways of Cabot Shores is very important,
as I learned quickly in my first week. For
example, while developing wilderness trails
that safely allow the guests and other visitors
to view wildlife and the magnificence of the
wilderness; we worked to mitigate the
degradation of the flora and disturbance of
fauna.
The benefits of learning a myriad of
multidisciplinary dimensions of sustainability
has had a profound impact on my view and
perspectives on the sustainability paradigm.
The take away skill sets, research abilities,
and systems understanding in which I now
hold due to my involvement with the
Sustainability minor curriculum at the
University of Arkansas and my invaluable
experience during my capstone internships
has been a positive stepping stone to my
future in my sustainability focused future
endeavors.
This poster was prepared in partial fulfillment of SUST 4103 Sustainability Capstone
GOALs So the goal of the owners and all the staff is to foster a wilderness destination that provides “comfort” to its guests, staff and visitors, while being in ecological harmony with this special place Cabot Shores along Indian Brook, Church Pond, and the Atlantic. The goal is to retrofit the current buildings, structures and exemplify human activities to a more sustainable level. As well as to add additional recreation areas, more gardens, and better equipped building to make the experience more healthy and enjoyable to all. The future planned advancement toward the vision of a “Green Resort”
SKILLS
My entire project set that I was project leader
and was participant succeeded. The
multiple systems of sustainability that all the
projects were based on provided for
consideration of all planning and
considerations. I have the set plans for the
existing project initiatives and future projects.
I hope that future employees will tweak and
research more ideas and concepts to
improve upon the systems to further
increase the level of sustainability.
VISUALS
THE OUTCOME
I had little carpentry or structural building
experience prior to my internship. I had zero
experience with building foundations, laying
pavers, or planning and constructing natural stone
stairways. I had no prior knowledge to with
chickens or what needed to be considered when
building a chicken coop in Nova Scotia. I did not
know how to build an earthen plastered cob oven
or what was required of such a difficult
undertaking. I did not know anything about solar
panels, solar hot water heaters, or passive heating
systems in application or practice. I was clueless
to electricity values or concerns and did not
understand residential circuitry systems. Now I
know the foundation of all these concepts and
practices.
Internship Learning at The Sustainability Consortium Michelle Beckmann
Capstone Experience for Minor in Sustainability
What is Being Done to
Address Sustainability
within the Global Supply
Chain Network?
• The Sustainability Consortium was
established in 2009 with the goal of creating a
standardized measurement and reporting
system that will help quantify and
communicate the sustainability of consumer
products.
• The Sustainability Consortium is dually
administered by the University of Arkansas’
Applied Sustainability Center (Walton College
of Business) and the University of Arizona’s
Global Institute of Sustainability but consists
of over 75 members including suppliers,
manufacturers and retailers as well as
Government and Non-government agencies,
including Wal-Mart, Disney, Cargill, Tyson,
Dell and many more.
• The ongoing collaborative effort of TSC will
provide accountability, transparency, and more
informed decisions makers when dealing with
the supply chain system and consumer goods.
Capstone Experience
My time spent as a Research Assistant and
Editor to TSC’s Sustainability Measurement
and Reporting System database allowed direct
access to the dossiers of the Life Cycle
Analysis of the top 100 consumer products
currently being researched by the Consortium.
This gave me the opportunity to contribute to
this ambitious movement towards
sustainability within our supply chain
networks.
Sustainability Managed Systems:
The Consortium concentrates on promoting Life
Cycle Management throughout the Supply Chain
system with intent to reduce the Carbon footprint
of doing business, promote Sustainable
Consumption, Conserve Resources, Promote
Resource Efficiency and Cleaner Production and
lay the foundation for Innovation.
Natural Systems:
The Consortium addresses Life Cycle Inputs
such as energy, water, herbicides, pesticides,
manure, and equipment as well as Outputs such
as GHG emissions, runoff, land occupation,
waste, solid waste, waste water, and fossil fuel
combustion. Also, addressed is how individual
consumer products or categories are contributing
to Climate Change, Eutrophication, Acidity and
Toxicity when it comes to Pollutants of the
Environment.
Social Systems:
The Consortium is addressing Social Issues
throughout the supply chain network by reporting
issues such as Worker’s Health and Safety, Safe
and Healthy Living Conditions, Social Benefits,
Social Security and Contribution to the
Economic Development of communities. Other
social issues that may be reported/addressed
include Child Labor, Suicide Tendencies, Fair
treatment, and Education and Training.
Reflections
Working with The Sustainability Consortium gave
me real insight into what it is going to take to
address Sustainability within the Supply Chain.
There is a real opportunity to make an impact on
the world if we continue to move forward with
sustainable practices from farm, factory, logistics,
distribution, retail and consumer.
I am unbelievably thankful for the opportunity to
have experience, knowledge and understanding in
the field of Sustainability thanks to this program!
Images courtesy of thesustainabilityconsortium.com
This poster was prepared in partial fulfillment of SUST 4103 Sustainability Capstone
“Our vision is to advance science to drive a new
generation of innovative products and supply networks that address environmental, social,
and economic imperatives.”~ TSC
Sustainability Measurement
and Reporting System
•SMRS was launched in July 2011
•SMRS is the framework used to research
and report empirical data for consumer
goods. Within SMRS is a collaborative style
database that houses Life Cycle Analysis for
individual consumer goods.
•Each consumer product is given a page
within the Knowledge Base (SMRS database)
entitled Category Dossier which further leads
to Category Sustainability Profile.
• In the present time The Sustainability
Consortium is diligently working on the
Level 1 agenda which will lay the foundation
for the Level 2 goals in development (see
diagram above) .
•Each Category Dossier (SMRS) includes the
following:
•Introduction
•Category Descriptions (definition,
variations, exclusions, functions, units
measured).
•Tables of Life Cycle Inputs and Outputs
•Environmental and Social Hotspots
•Potential Improvement Opportunities
(Performance indicators)
•Discussion
Life Cycle Analysis
Contributions
Research Assistant and Knowledge Base Editor
Personal Research & Contributions to SMRS:
•Product Category Dossiers with most emphasis
on Food, Beverage and Agriculture Categories
•Introduction Narratives
•Product Category Supply Chain Descriptions
and/or Edits
Bananas
Beans (Legumes)
Beef
Sweet Corn
Citrus
Coffee
Cotton
Fish
Soybeans
Field Corn
Sorghum
Canned Soup
Baby Formula
Pet Food
Frozen Meals
Potatoes
Rice
Seed Oil
And more!
Camp War Eagle’s Organic Gardening Project Mary Beth Farrish
Sustainability Department
THE PROBLEM Camp War Eagle is a non-profit camp in Rogers, Arkansas
that reaches out to the children of Northwest Arkansas that
come from low-socioeconomic backgrounds. Part of the
mission of camp is to “foster an appreciation for nature and
the environment”, yet they had no established outlet to do
this that would be fun and engaging to kids while still
educational.
During the summer of 2011, the Director of camp, Scott
Richards, Matt Morton, who was in charge of the Nature
Center, and I, embarked on a project to implement a
conventional garden and an organic garden on camp
property. The goal was to build these two gardens in hopes
that the produce could be used for cooking classes, and the
gardens could be used as an educational tool to teach kids
how to grow a garden at home, or manage the ones they
have.
Sustainable agriculture methods are gaining popularity with
the new emphasis on organic foods today. The
establishment of both a conventional garden and organic
garden would give us a good comparison of how the
different agricultural practices work, and which one would be
more suitable for our mission at camp. More importantly,
the organic garden would give us the opportunity to teach
the kids sustainable practices and why sustainability is
important.
THE PROJECT
1) Allocating a spot by the settler’s barn based on 1) the
proximity to the Nature Center, 2) the proximity to the
animals (for compost), and 3) exposure to sunlight.
2) Dimensions of garden: 4 feet by 22 feet so that each
garden would have 88 sq feet per bed. We built them next to
each other with a walking path in between.
3) Soil testing by the University of Arkansas’s Soil Testing
and Research Laboratory. Soil texture was a sandy loam
with nutrients P, K and Zn below optimum.. In the organic
garden we added a compost mix of cow manure, humus,
hardwood fines, mushroom and lime to increase the soil’s
nutrients. In the conventional garden we sprayed the soil
with a chemical fertilizer that helps to build the soil back up
with nutrients.
4) We built the garden’s perimeters with cinder blocks, tilled
the soil, added the compost, tilled the soil again to mix it,
and then planted the seeds which varied according to each
garden. A list is located to the right of what plants grew in
each garden.
5) We used a sprinkler system that watered the plants in the
morning and we would water it with a hose for 30 minutes
daily due to the hot summer we experienced. During two
weeks of the summer, when temperatures were extremely
hot, we watered them twice a day for 30 minutes. (As seen
in red in the weather forecast graph)
(Location of the
Settlers Barn and
Gardens)
SUSTAINABILITY How does organic gardening contribute to the different
domains of sustainability?
Managed Systems: It focuses on agriculture and developing
foods that help satisfy a community. Organics are really
important today in developing new techniques within the
agricultural realm that are sustainable for our future, and they
also help produce healthier soil and food.
Social Systems: Our organic garden at camp involves and
teaches children of low-socio economic families on ways to
produce food, and be more self-sufficient in making their own
food which also teaches them a higher level of responsibility.
It’s an educational tool used to help develop their skills and
knowledge of nutrition and will hopefully open new doors for
them within the food realm and their accessibility to it.
Natural Systems: Large scale agriculture has a huge impact
on the climate change occurring today and the availability of
resources, and organic gardening is one of the many
alternatives that helps to cut back on that problem. Organics
will hopefully have a lesser impact on the Earth, and provide
more sustainable land and higher quality produce for our
future generations.
PERSONAL OUTLOOK
After completing my project at the University of Arkansas, I felt
like I had a better understanding of the steps it takes to
manage a garden. I learned both conventional methods and
organic methods and what each one contributes to the
garden, yet what a gardener needs to be aware of in both
gardening methods. Before this project I never would have
thought about having my own garden, but now that I’ve spent
a whole summer working with one it makes me want to start
my own garden at my house.
More importantly through the research I had to conduct before
we initiated the gardening project, I learned a lot about
agricultural and its effect on the environment and humans. My
perspective on the types of food I eat and where they come
from have completely changed. I have new respect and desire
to buy organic foods. I hope through the Nature Center’s
classes at camp, the children will have learned to appreciate
sustainable gardening as much as I did.
Regardless if I do end up making my own garden or not, this
project has really been a conversation starter with the people I
work with at Wal-Mart. I’ve been able to talk to three different
people about the organic gardens they have, and we have
traded different techniques and stories with one another. The
connection this project has given to me to other people who
share the same mindset as me has given me cultural capital I
did not expect the project to produce.
I’m excited to see if what I learned this past summer will
progress through out the rest of my lifestyle. Through my
courses for my minor and the project at Camp War Eagle, I
have really learned the importance of sustainability and how
important it is for our future. I sincerely want to be able to pass
that underlying importance on towards others through my
actions and conversation. I’m excited to see what I can do to
better make our practices and our earth more sustainable.
This poster was prepared in partial fulfillment of SUST 4103 Sustainability Capstone
PICTURES Conventional Gardening: Uses synthetic fertilizers and pesticides to
enhance and control the growing environment of the garden
Organic Gardening: Organic is a label that indicates that the food has
been produced through methods that integrate cultural, biological, and
mechanical practices that foster cycling or resources, promote
ecological balance, and conserve biodiversity. Synthetic fertilizers,
sewage, sludge, irradiation, and genetic engineering may not be used.
(National Organic Program)
THE OPPOSITION
About mid-July our gardens took a turn for the worse. Rogers, Arkansas
was said to have above average temperatures at 97 degrees
Fahrenheit, with a maximum of 103 degrees Fahrenheit. Our plants in
both gardens felt the effects of the heat. We tried watering the plants
twice a day for 30 minutes with a hose instead of the usual one 30
minute session to help keep them more hydrated, but a large amount of
our plants still withered up and died.
Another big opposition to our garden were aphids, or plant lice. With our
conventional garden we used pesticides to help protect the crops, which
had a significant difference on the plants on keeping them alive from
insect invasion. On the organic garden we chose not to use any
chemical compounds on it which left it pretty open to insects.
Between the bugs and the heat we lost our cucumbers, zucchinis, basil
and some of our squash within the organic garden. Within our
conventional garden we experienced minimal damage to our garden
with jalapenos, the cantaloupe plant, and some of our tomatoes plants
dying.
GRAPHS
THE OUTCOME
We planted the gardens May 1st, 2011 and around June 13th our
plants started producing. We were producing enough zucchinis and
tomatoes for our educational program in the Nature Center to have
enough successful produce to cook with, and also our gardens were
in a good enough state we could have the kids come help in watering
it, picking produce, and pulling weeds and such. The kids got to make
different meals like salsa, zucchini bread, and omelets out of the
process which really taught the kids how to approach making small
amounts of food at home. As far as the educational program goes our
gardens were a success in teaching the children aspects of
sustainability, gardening, and cooking.
Camp War Eagle has decided to continue the project of maintaining
both a conventional and organic garden for the summer 2012. A
change in methods of maintaining the garden have yet to be
discussed, but we are more aware of what we need to fix, what we
need to fix, and what threats that gardens face and how to protect our
produce through both conventional and organic management.
Conventional Garden Plants Organic Garden Plants
4 50 Days Tomatoes 1 Basil
1 Lemon Tomato 2 Cucumbers
1 Husky Cherry Tomato 2 Zucchinis
1 Rosemary 1 Baby Grape Tomatoes
2 Red Bell Peppers 2 Common Green Bell Peppers
3 Jalapenos 2 Serrano
1 German Thyme 2 Squash
1 Common Sage 4 50 Days Tomatoes
1 Greek Oregano
1 Flat Italian Parsley
1 Cantaloupe
1 Cilantro
National Weather Service Weather Forecast
Data for Rogers, Arkansas
Month of July
Day 1:
98
Day 2:
100
Day 3:
100
Day 4:
92
Day 5:
97
Day 6:
94
Day 7:
100
Day 8:
91
Day 9:
100
Day 10:
103
Day 11:
101
Day 12:
101
Day 13:
86
Day 14:
95
Day 15:
97
Day 16:
97
Day
17: 96
Day 18:
97
Day 19:
98
Day 20:
98
Day 21:
100
Day 22:
101
Day 23:
100
Day 24:
103
Day
25: 95
Day 26:
102
Day 27:
102
Day 28:
101
Day 29:
100
Day 30:
100
Day 31:
101
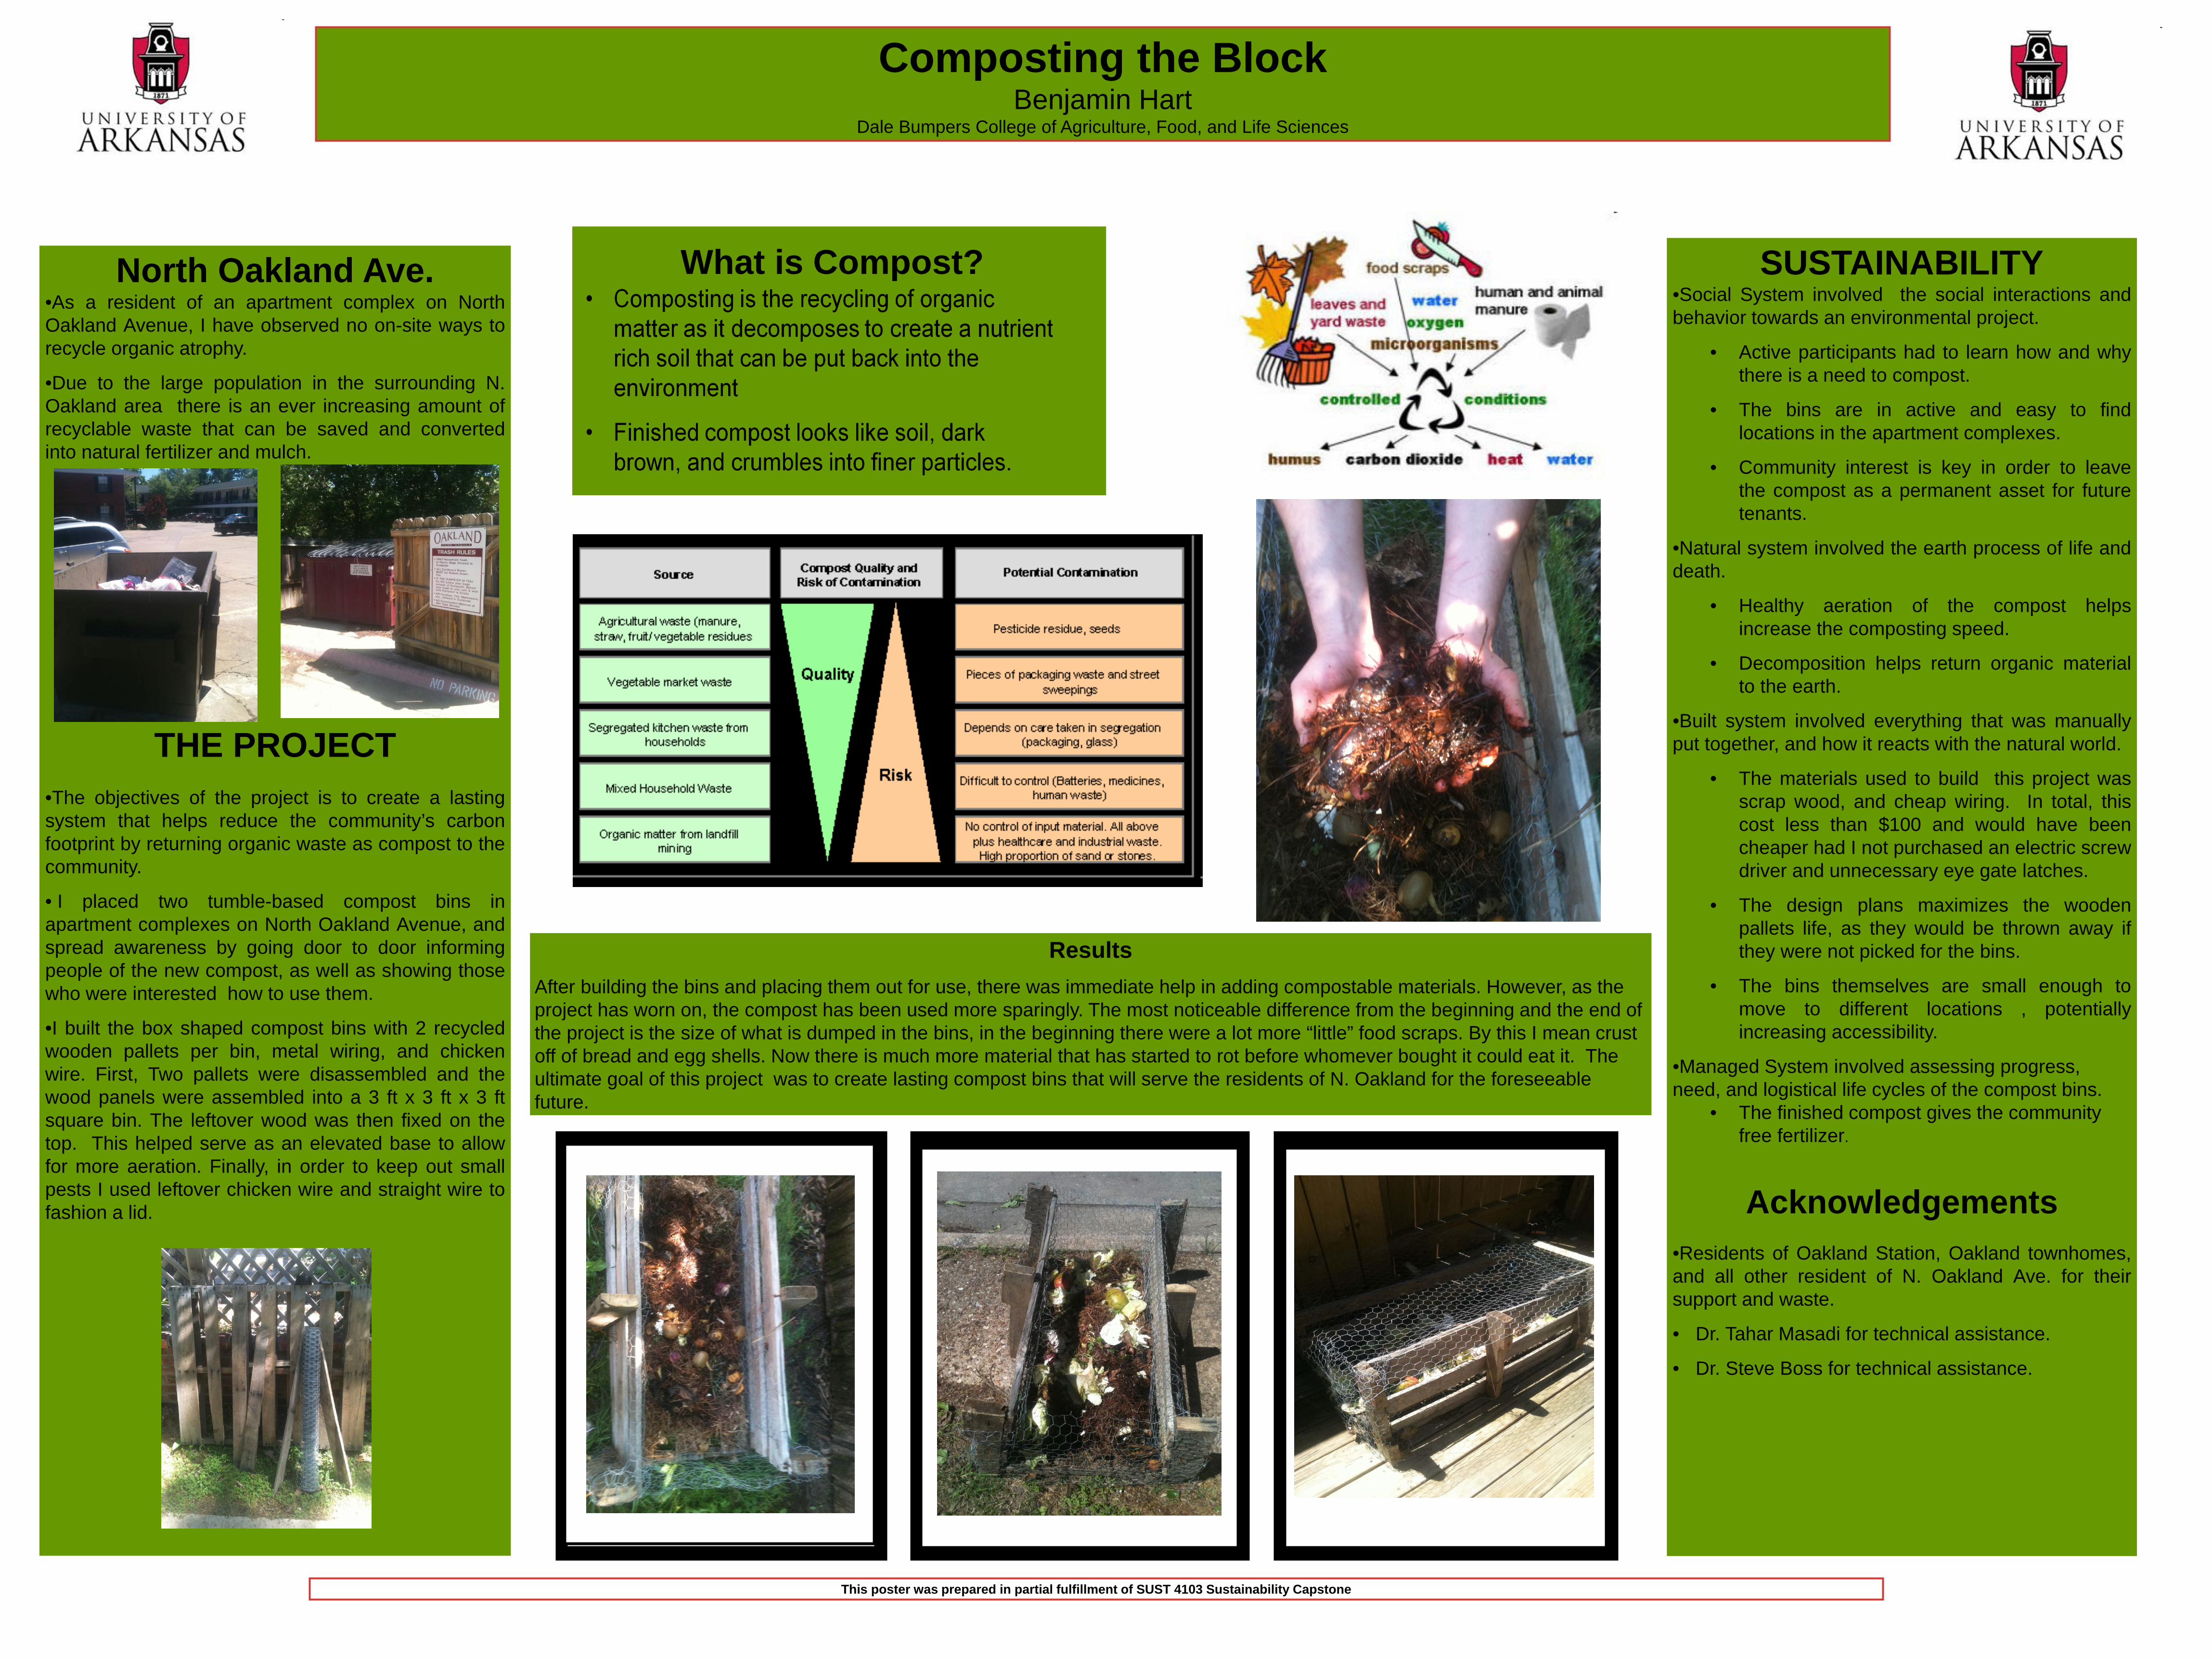
Composting the Block Benjamin Hart
Dale Bumpers College of Agriculture, Food, and Life Sciences
North Oakland Ave. •As a resident of an apartment complex on North Oakland Avenue, I have observed no on-site ways to recycle organic atrophy.
•Due to the large population in the surrounding N. Oakland area there is an ever increasing amount of recyclable waste that can be saved and converted into natural fertilizer and mulch.
THE PROJECT •The objectives of the project is to create a lasting system that helps reduce the community’s carbon footprint by returning organic waste as compost to the community.
• I placed two tumble-based compost bins in apartment complexes on North Oakland Avenue, and spread awareness by going door to door informing people of the new compost, as well as showing those who were interested how to use them.
•I built the box shaped compost bins with 2 recycled wooden pallets per bin, metal wiring, and chicken wire. First, Two pallets were disassembled and the wood panels were assembled into a 3 ft x 3 ft x 3 ft square bin. The leftover wood was then fixed on the top. This helped serve as an elevated base to allow for more aeration. Finally, in order to keep out small pests I used leftover chicken wire and straight wire to fashion a lid.
SUSTAINABILITY •Social System involved the social interactions and behavior towards an environmental project.
• Active participants had to learn how and why there is a need to compost.
• The bins are in active and easy to find locations in the apartment complexes.
• Community interest is key in order to leave the compost as a permanent asset for future tenants.
•Natural system involved the earth process of life and death.
• Healthy aeration of the compost helps increase the composting speed.
• Decomposition helps return organic material to the earth.
•Built system involved everything that was manually put together, and how it reacts with the natural world.
• The materials used to build this project was scrap wood, and cheap wiring. In total, this cost less than $100 and would have been cheaper had I not purchased an electric screw driver and unnecessary eye gate latches.
• The design plans maximizes the wooden pallets life, as they would be thrown away if they were not picked for the bins.
• The bins themselves are small enough to move to different locations , potentially increasing accessibility.
•Managed System involved assessing progress, need, and logistical life cycles of the compost bins.
• The finished compost gives the community free fertilizer.
Acknowledgements •Residents of Oakland Station, Oakland townhomes, and all other resident of N. Oakland Ave. for their support and waste.
• Dr. Tahar Masadi for technical assistance.
• Dr. Steve Boss for technical assistance.
This poster was prepared in partial fulfillment of SUST 4103 Sustainability Capstone
Results After building the bins and placing them out for use, there was immediate help in adding compostable materials. However, as the project has worn on, the compost has been used more sparingly. The most noticeable difference from the beginning and the end of the project is the size of what is dumped in the bins, in the beginning there were a lot more “little” food scraps. By this I mean crust off of bread and egg shells. Now there is much more material that has started to rot before whomever bought it could eat it. The ultimate goal of this project was to create lasting compost bins that will serve the residents of N. Oakland for the foreseeable future.
What is Compost?
Comparing Apples to Oranges
Taylor McBride Walton College of Business
THE PROBLEM In today’s ever evolving marketplace
business are doing what they can to
capitalize on the changing wants and needs
of their consumers. An attribute that many
consumers are now demanding is that the
products be made in a more sustainable
fashion. But when you are bombarded with
claims of being more sustainable than the
competition how can you make a conscious
and informed decision?
This is the problem that the Sustainability
Consortium is trying to address. They are
working on a universal grading scale, similar
to a nutrition information chart, by which
consumers can compare different products.
This is necessary so that consumers can
find their way through the green washing
and determine if it is the “recyclable
packaging” or the “low-carbon production”
that make the product they choose more
sustainable.
THE PROJECT
During the Spring Semester of 2012 I
worked as an intern at the Sustainability
Consortium’s Fayetteville office in the
University of Arkansas Research Center. I
updated and edited the floating documents
they have on different product categories
ranging from beef to toilet tissue.
THE OUTCOME
The work I did and am continuing to do at
the Sustainability Consortium is to keep the
documents they constructed on the different
product categories updated, formatted, and
edited correctly. Since I am a business
student and do not have a technical degree I
was not working on the research and Life
Cycle Analysis of the different product
categories but rather helping organize and
edit the information the researchers brought
forward.
SUSTAINABILITY
The work that the Sustainability Consortium
is doing helps bring all three systems of
sustainability together.
They start by completing a Life Cycle
Analysis on a product category that identifies
the hot spots and describes the different
environmental impacts throughout its
production. All this information is crucial to
fully understand the environmental system
and how it is effected by the products’
production.
Next they compose a document for the
product category that highlights the hot spots
and discusses how these might affect
society. This document is made available to
all members of the Sustainability
Consortium. The availability of this
information is a huge step in aligning the
social systems with the environmental and
economic systems.
The economic system is the system that
the Sustainability Consortium has the least
direct impact on. They do not provide
economic differences on the different
production means but rather outline them
and provide the information needed to
determine what the costs might be.
This poster was prepared in partial fulfillment of SUST 4103 Sustainability Capstone
Major Consortium Members
Major Consortium Members
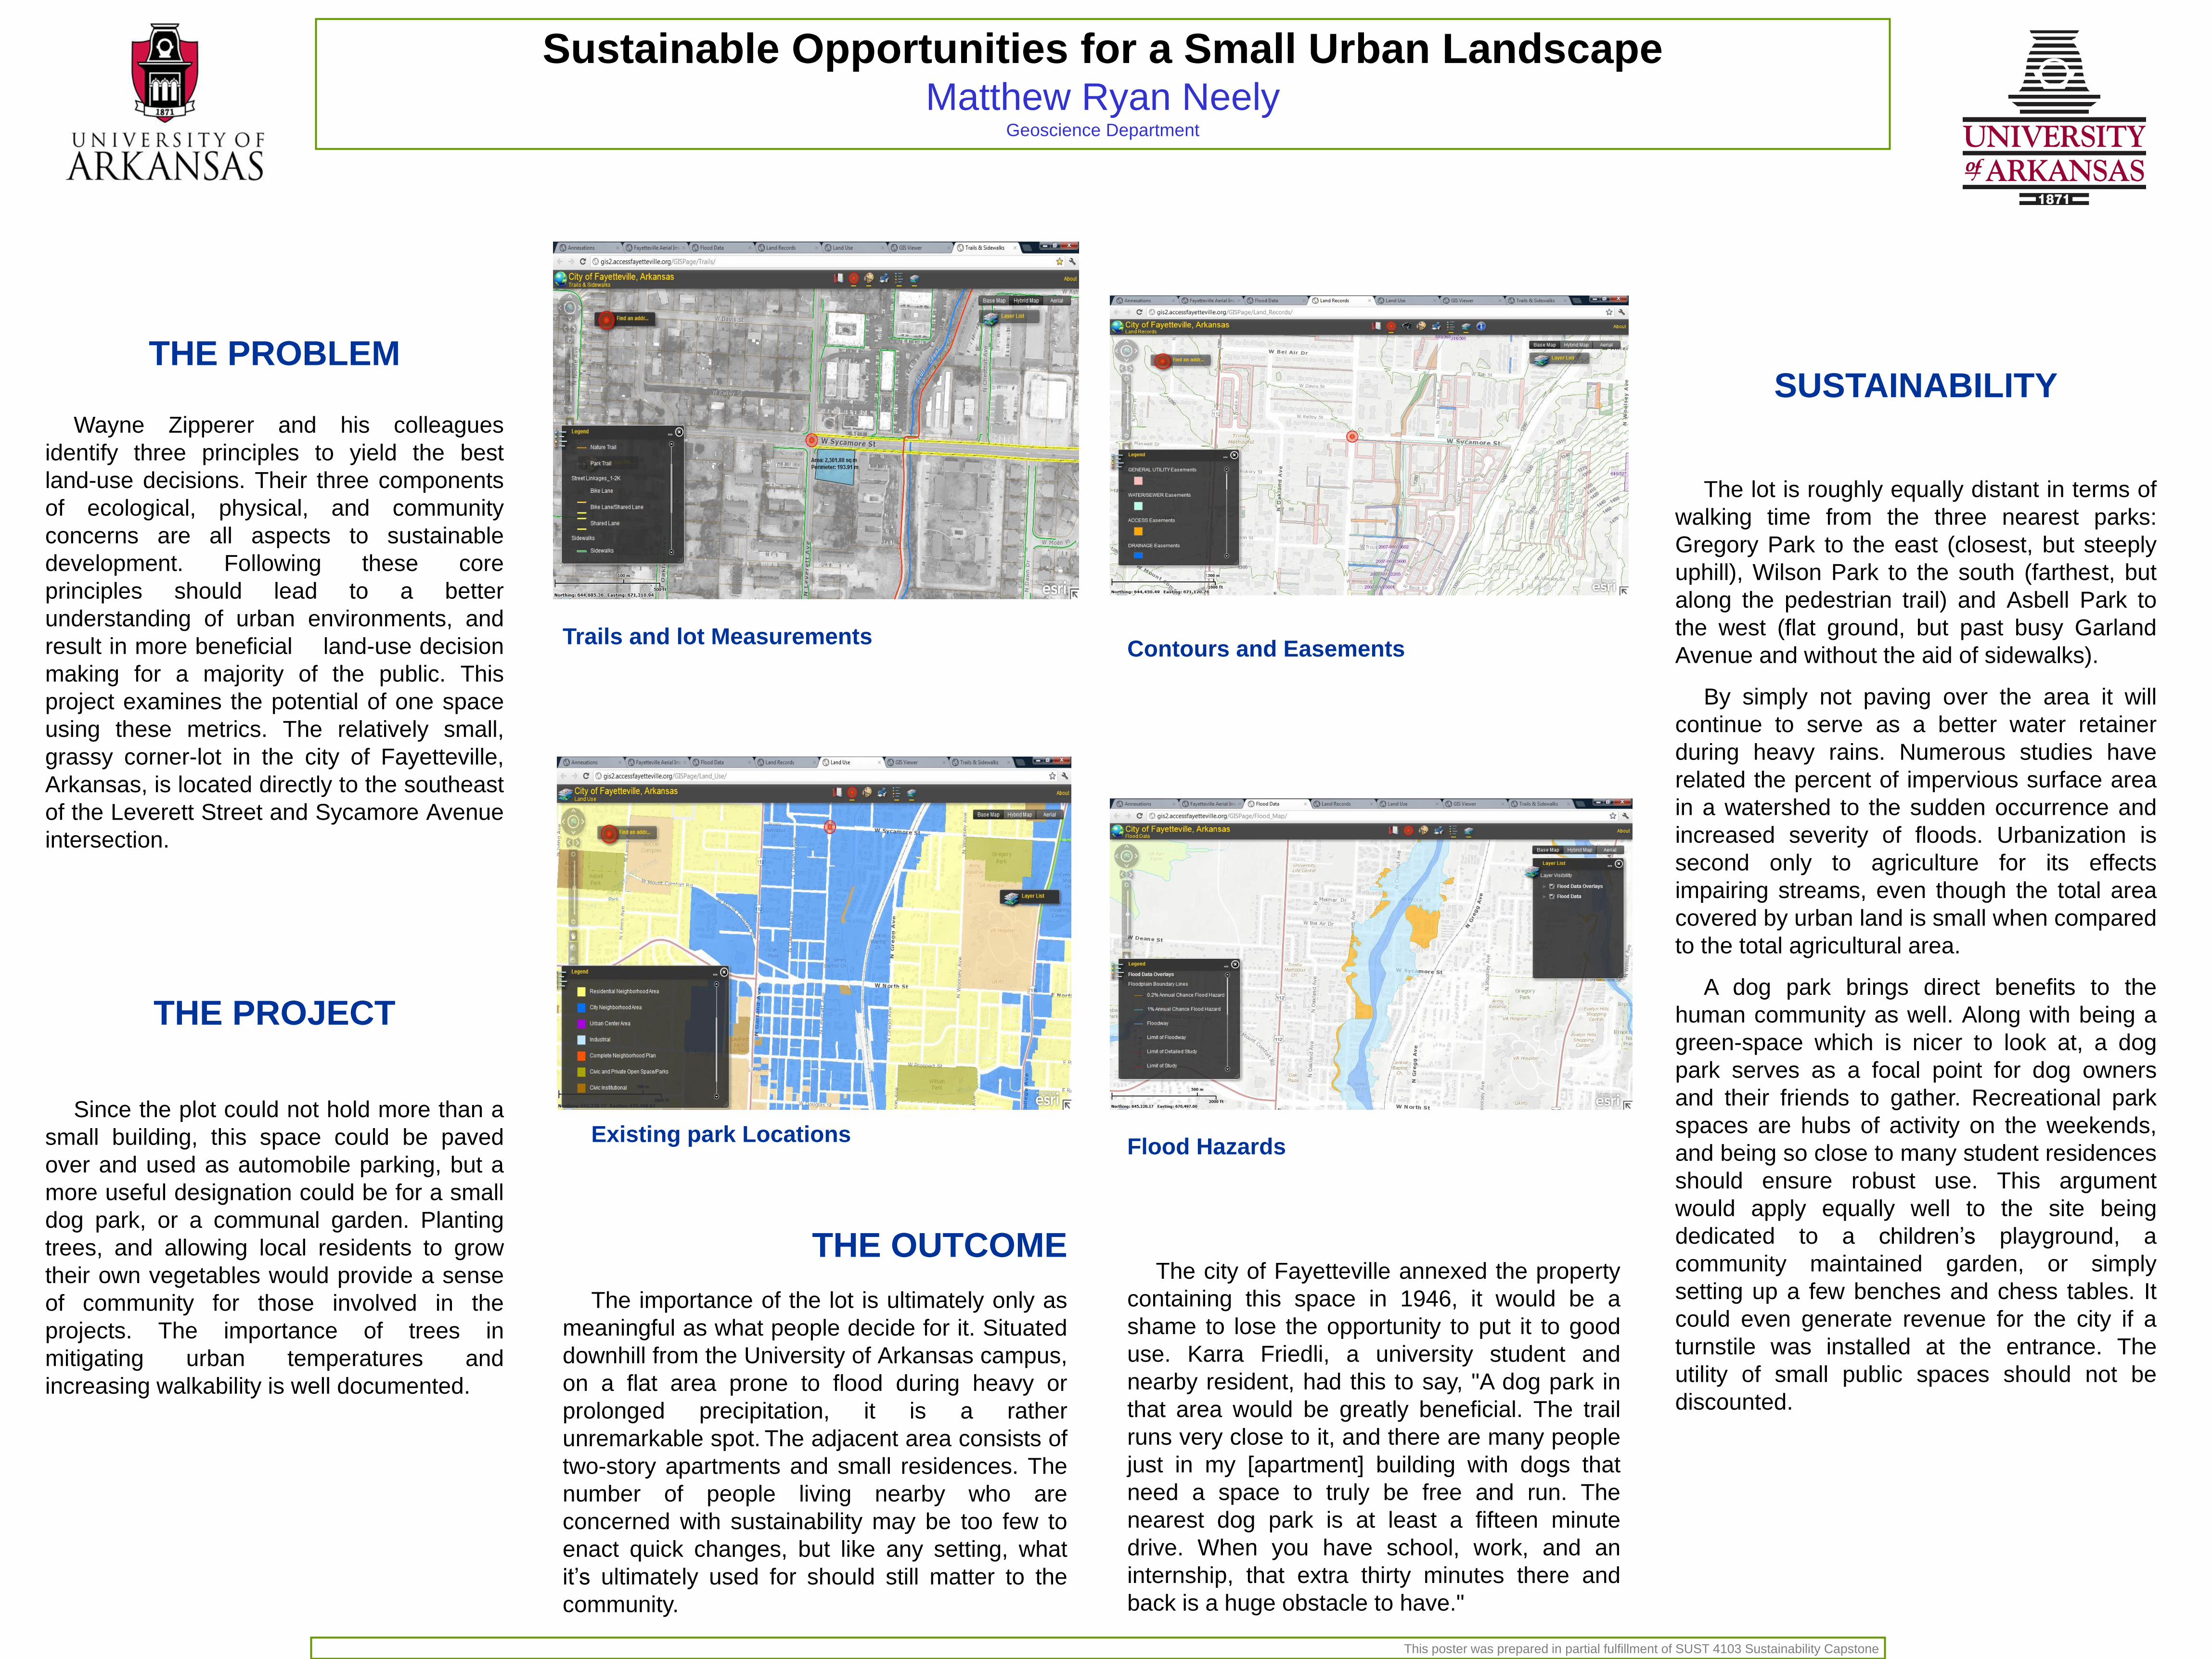
Sustainable Opportunities for a Small Urban Landscape Matthew Ryan Neely
Geoscience Department
THE PROBLEM Wayne Zipperer and his colleagues
identify three principles to yield the best
land-use decisions. Their three components
of ecological, physical, and community
concerns are all aspects to sustainable
development. Following these core
principles should lead to a better
understanding of urban environments, and
result in more beneficial land-use decision
making for a majority of the public. This
project examines the potential of one space
using these metrics. The relatively small,
grassy corner-lot in the city of Fayetteville,
Arkansas, is located directly to the southeast
of the Leverett Street and Sycamore Avenue
intersection.
THE PROJECT
Since the plot could not hold more than a
small building, this space could be paved
over and used as automobile parking, but a
more useful designation could be for a small
dog park, or a communal garden. Planting
trees, and allowing local residents to grow
their own vegetables would provide a sense
of community for those involved in the
projects. The importance of trees in
mitigating urban temperatures and
increasing walkability is well documented.
SUSTAINABILITY
The lot is roughly equally distant in terms of
walking time from the three nearest parks:
Gregory Park to the east (closest, but steeply
uphill), Wilson Park to the south (farthest, but
along the pedestrian trail) and Asbell Park to
the west (flat ground, but past busy Garland
Avenue and without the aid of sidewalks).
By simply not paving over the area it will
continue to serve as a better water retainer
during heavy rains. Numerous studies have
related the percent of impervious surface area
in a watershed to the sudden occurrence and
increased severity of floods. Urbanization is
second only to agriculture for its effects
impairing streams, even though the total area
covered by urban land is small when compared
to the total agricultural area.
A dog park brings direct benefits to the
human community as well. Along with being a
green-space which is nicer to look at, a dog
park serves as a focal point for dog owners
and their friends to gather. Recreational park
spaces are hubs of activity on the weekends,
and being so close to many student residences
should ensure robust use. This argument
would apply equally well to the site being
dedicated to a children’s playground, a
community maintained garden, or simply
setting up a few benches and chess tables. It
could even generate revenue for the city if a
turnstile was installed at the entrance. The
utility of small public spaces should not be
discounted.
This poster was prepared in partial fulfillment of SUST 4103 Sustainability Capstone
Contours and Easements
Flood Hazards
The city of Fayetteville annexed the property
containing this space in 1946, it would be a
shame to lose the opportunity to put it to good
use. Karra Friedli, a university student and
nearby resident, had this to say, "A dog park in
that area would be greatly beneficial. The trail
runs very close to it, and there are many people
just in my [apartment] building with dogs that
need a space to truly be free and run. The
nearest dog park is at least a fifteen minute
drive. When you have school, work, and an
internship, that extra thirty minutes there and
back is a huge obstacle to have."
Trails and lot Measurements
Existing park Locations
THE OUTCOME
The importance of the lot is ultimately only as
meaningful as what people decide for it. Situated
downhill from the University of Arkansas campus,
on a flat area prone to flood during heavy or
prolonged precipitation, it is a rather
unremarkable spot. The adjacent area consists of
two-story apartments and small residences. The
number of people living nearby who are
concerned with sustainability may be too few to
enact quick changes, but like any setting, what
it’s ultimately used for should still matter to the
community.
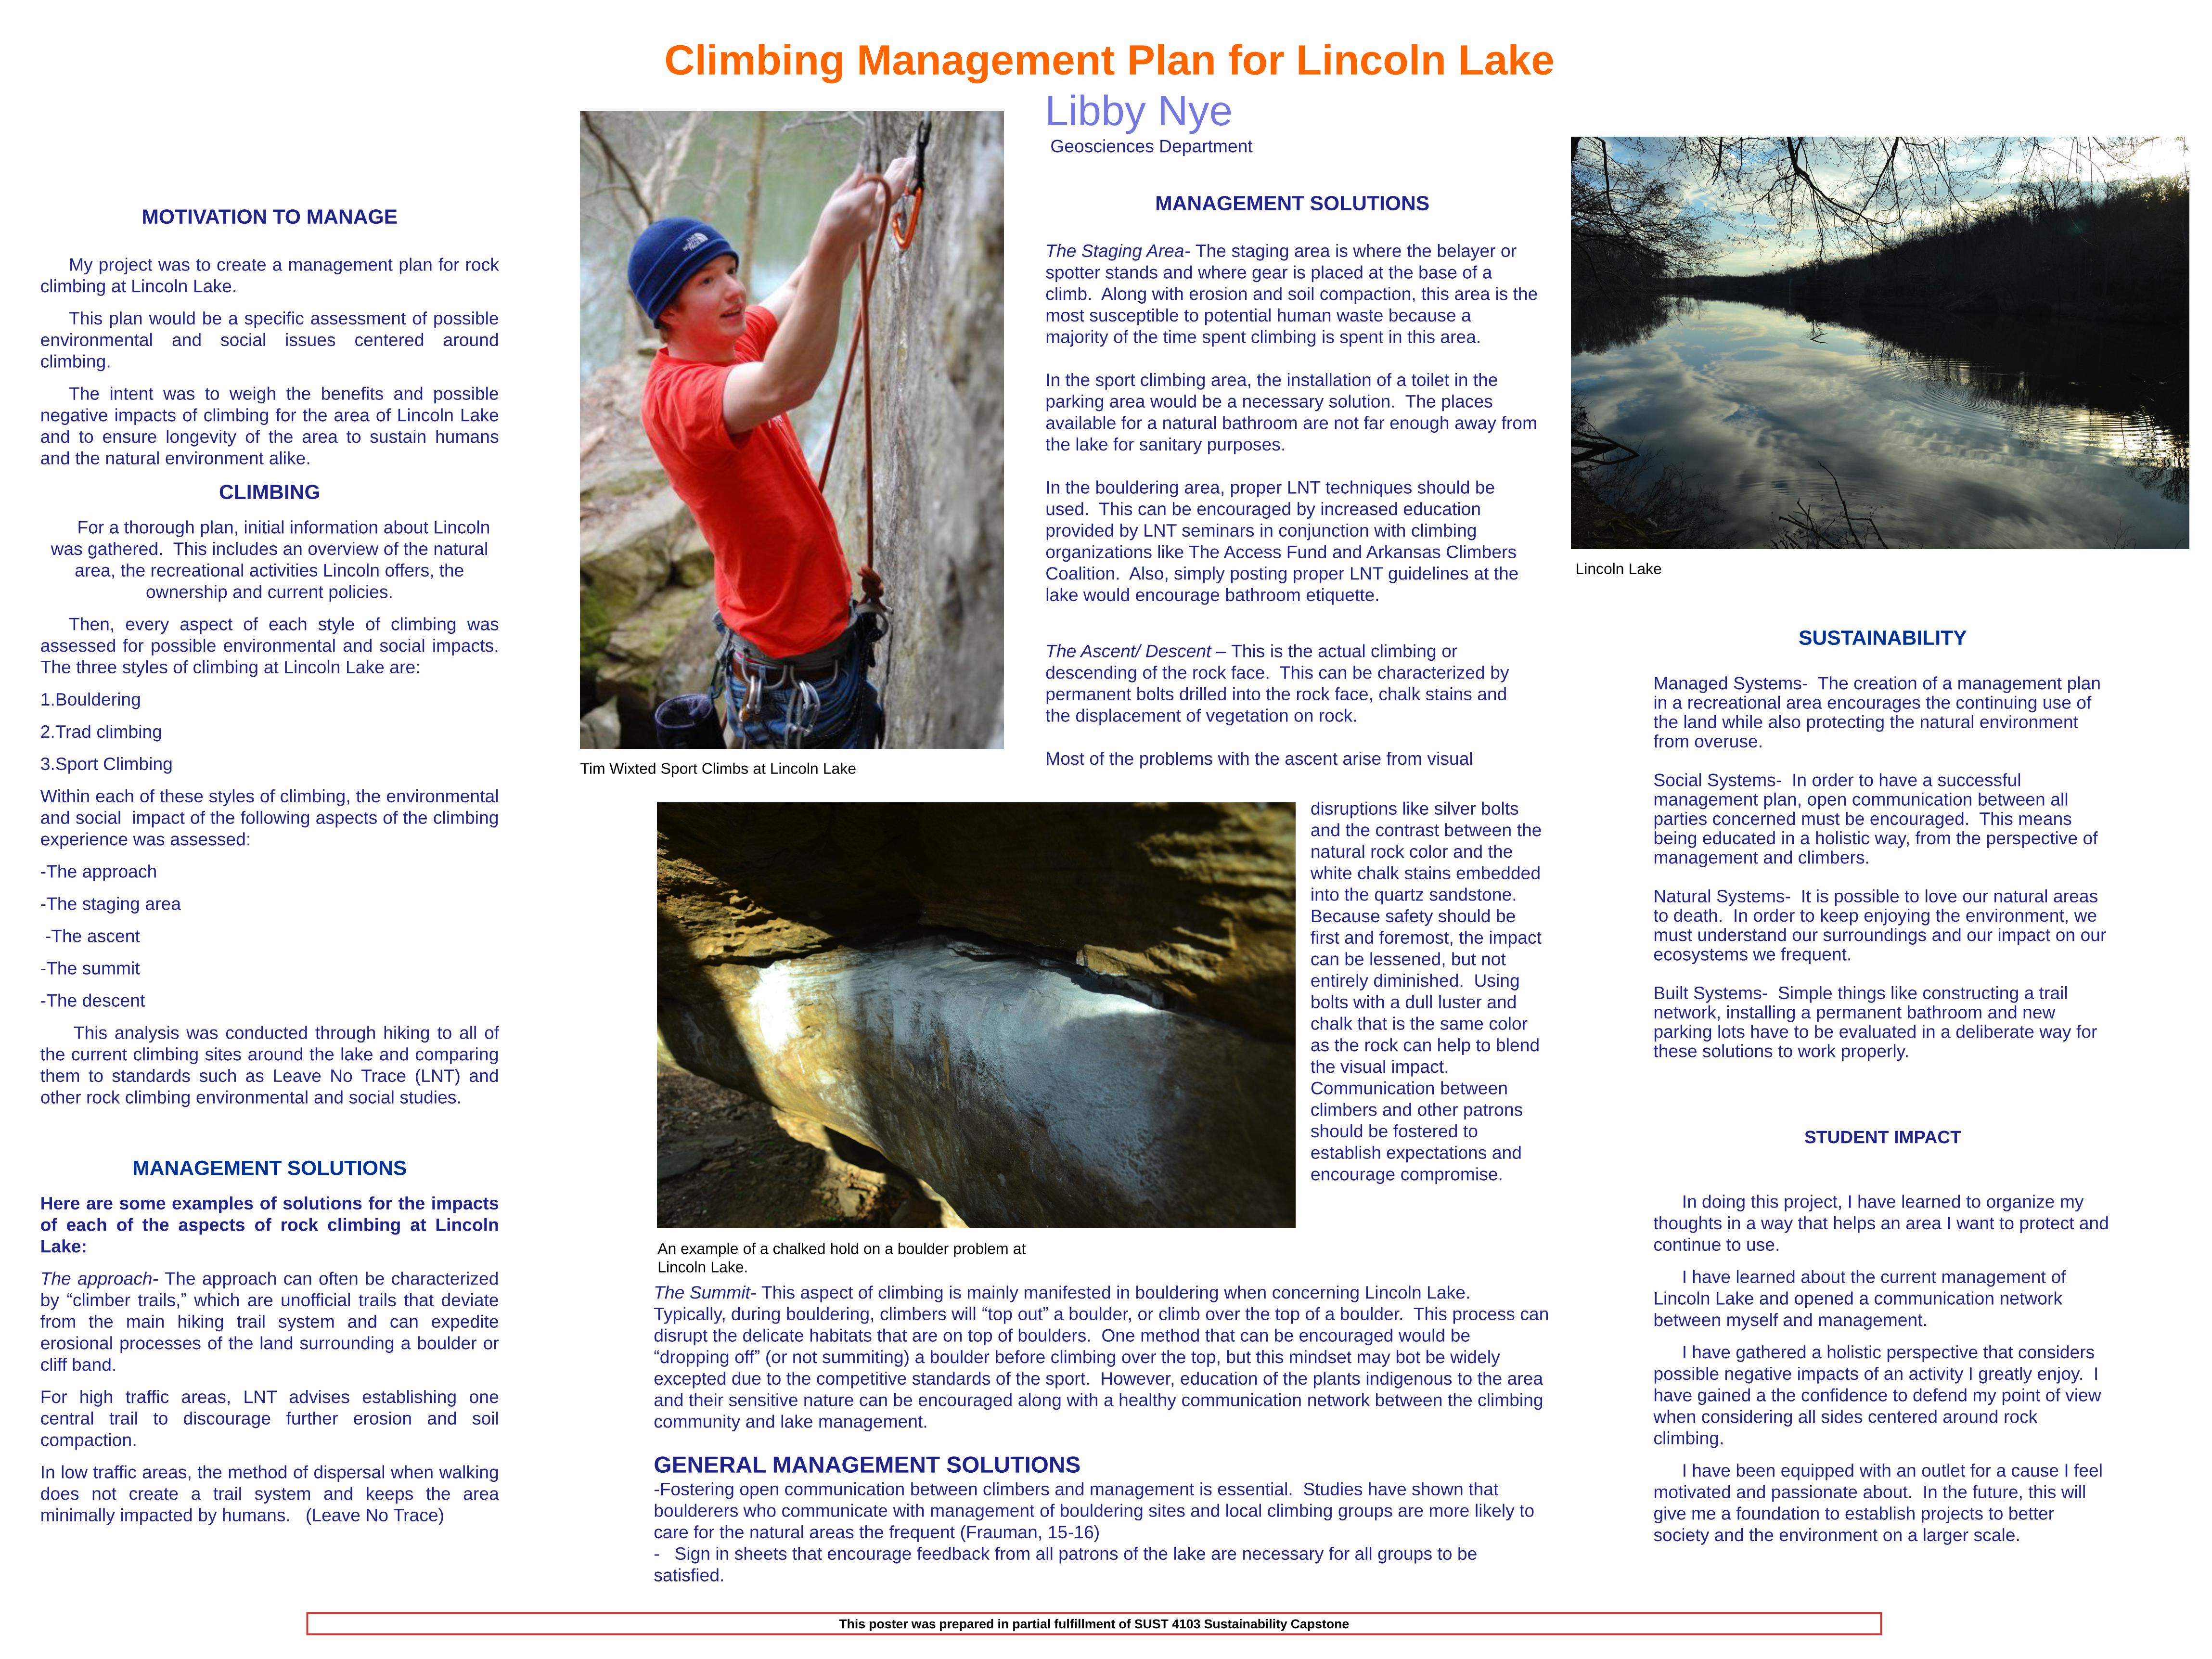
Climbing Management Plan for Lincoln Lake
Libby Nye Geosciences Department
MOTIVATION TO MANAGE
My project was to create a management plan for rock
climbing at Lincoln Lake.
This plan would be a specific assessment of possible
environmental and social issues centered around
climbing.
The intent was to weigh the benefits and possible
negative impacts of climbing for the area of Lincoln Lake
and to ensure longevity of the area to sustain humans
and the natural environment alike.
CLIMBING
For a thorough plan, initial information about Lincoln
was gathered. This includes an overview of the natural
area, the recreational activities Lincoln offers, the
ownership and current policies.
Then, every aspect of each style of climbing was
assessed for possible environmental and social impacts.
The three styles of climbing at Lincoln Lake are:
1.Bouldering
2.Trad climbing
3.Sport Climbing
Within each of these styles of climbing, the environmental
and social impact of the following aspects of the climbing
experience was assessed:
-The approach
-The staging area
-The ascent
-The summit
-The descent
This analysis was conducted through hiking to all of
the current climbing sites around the lake and comparing
them to standards such as Leave No Trace (LNT) and
other rock climbing environmental and social studies.
MANAGEMENT SOLUTIONS
Here are some examples of solutions for the impacts
of each of the aspects of rock climbing at Lincoln
Lake:
The approach- The approach can often be characterized
by “climber trails,” which are unofficial trails that deviate
from the main hiking trail system and can expedite
erosional processes of the land surrounding a boulder or
cliff band.
For high traffic areas, LNT advises establishing one
central trail to discourage further erosion and soil
compaction.
In low traffic areas, the method of dispersal when walking
does not create a trail system and keeps the area
minimally impacted by humans. (Leave No Trace)
Lincoln Lake
SUSTAINABILITY
Managed Systems- The creation of a management plan in a recreational area encourages the continuing use of the land while also protecting the natural environment from overuse. Social Systems- In order to have a successful management plan, open communication between all parties concerned must be encouraged. This means being educated in a holistic way, from the perspective of management and climbers. Natural Systems- It is possible to love our natural areas to death. In order to keep enjoying the environment, we must understand our surroundings and our impact on our ecosystems we frequent. Built Systems- Simple things like constructing a trail network, installing a permanent bathroom and new parking lots have to be evaluated in a deliberate way for these solutions to work properly.
STUDENT IMPACT
In doing this project, I have learned to organize my
thoughts in a way that helps an area I want to protect and
continue to use.
I have learned about the current management of
Lincoln Lake and opened a communication network
between myself and management.
I have gathered a holistic perspective that considers
possible negative impacts of an activity I greatly enjoy. I
have gained a the confidence to defend my point of view
when considering all sides centered around rock
climbing.
I have been equipped with an outlet for a cause I feel
motivated and passionate about. In the future, this will
give me a foundation to establish projects to better
society and the environment on a larger scale.
This poster was prepared in partial fulfillment of SUST 4103 Sustainability Capstone
Tim Wixted Sport Climbs at Lincoln Lake
MANAGEMENT SOLUTIONS
The Staging Area- The staging area is where the belayer or
spotter stands and where gear is placed at the base of a
climb. Along with erosion and soil compaction, this area is the
most susceptible to potential human waste because a
majority of the time spent climbing is spent in this area.
In the sport climbing area, the installation of a toilet in the
parking area would be a necessary solution. The places
available for a natural bathroom are not far enough away from
the lake for sanitary purposes.
In the bouldering area, proper LNT techniques should be
used. This can be encouraged by increased education
provided by LNT seminars in conjunction with climbing
organizations like The Access Fund and Arkansas Climbers
Coalition. Also, simply posting proper LNT guidelines at the
lake would encourage bathroom etiquette.
The Ascent/ Descent – This is the actual climbing or
descending of the rock face. This can be characterized by
permanent bolts drilled into the rock face, chalk stains and
the displacement of vegetation on rock.
Most of the problems with the ascent arise from visual
disruptions like silver bolts
and the contrast between the
natural rock color and the
white chalk stains embedded
into the quartz sandstone.
Because safety should be
first and foremost, the impact
can be lessened, but not
entirely diminished. Using
bolts with a dull luster and
chalk that is the same color
as the rock can help to blend
the visual impact.
Communication between
climbers and other patrons
should be fostered to
establish expectations and
encourage compromise.
An example of a chalked hold on a boulder problem at
Lincoln Lake.
The Summit- This aspect of climbing is mainly manifested in bouldering when concerning Lincoln Lake.
Typically, during bouldering, climbers will “top out” a boulder, or climb over the top of a boulder. This process can
disrupt the delicate habitats that are on top of boulders. One method that can be encouraged would be
“dropping off” (or not summiting) a boulder before climbing over the top, but this mindset may bot be widely
excepted due to the competitive standards of the sport. However, education of the plants indigenous to the area
and their sensitive nature can be encouraged along with a healthy communication network between the climbing
community and lake management.
GENERAL MANAGEMENT SOLUTIONS -Fostering open communication between climbers and management is essential. Studies have shown that
boulderers who communicate with management of bouldering sites and local climbing groups are more likely to
care for the natural areas the frequent (Frauman, 15-16)
- Sign in sheets that encourage feedback from all patrons of the lake are necessary for all groups to be
satisfied.
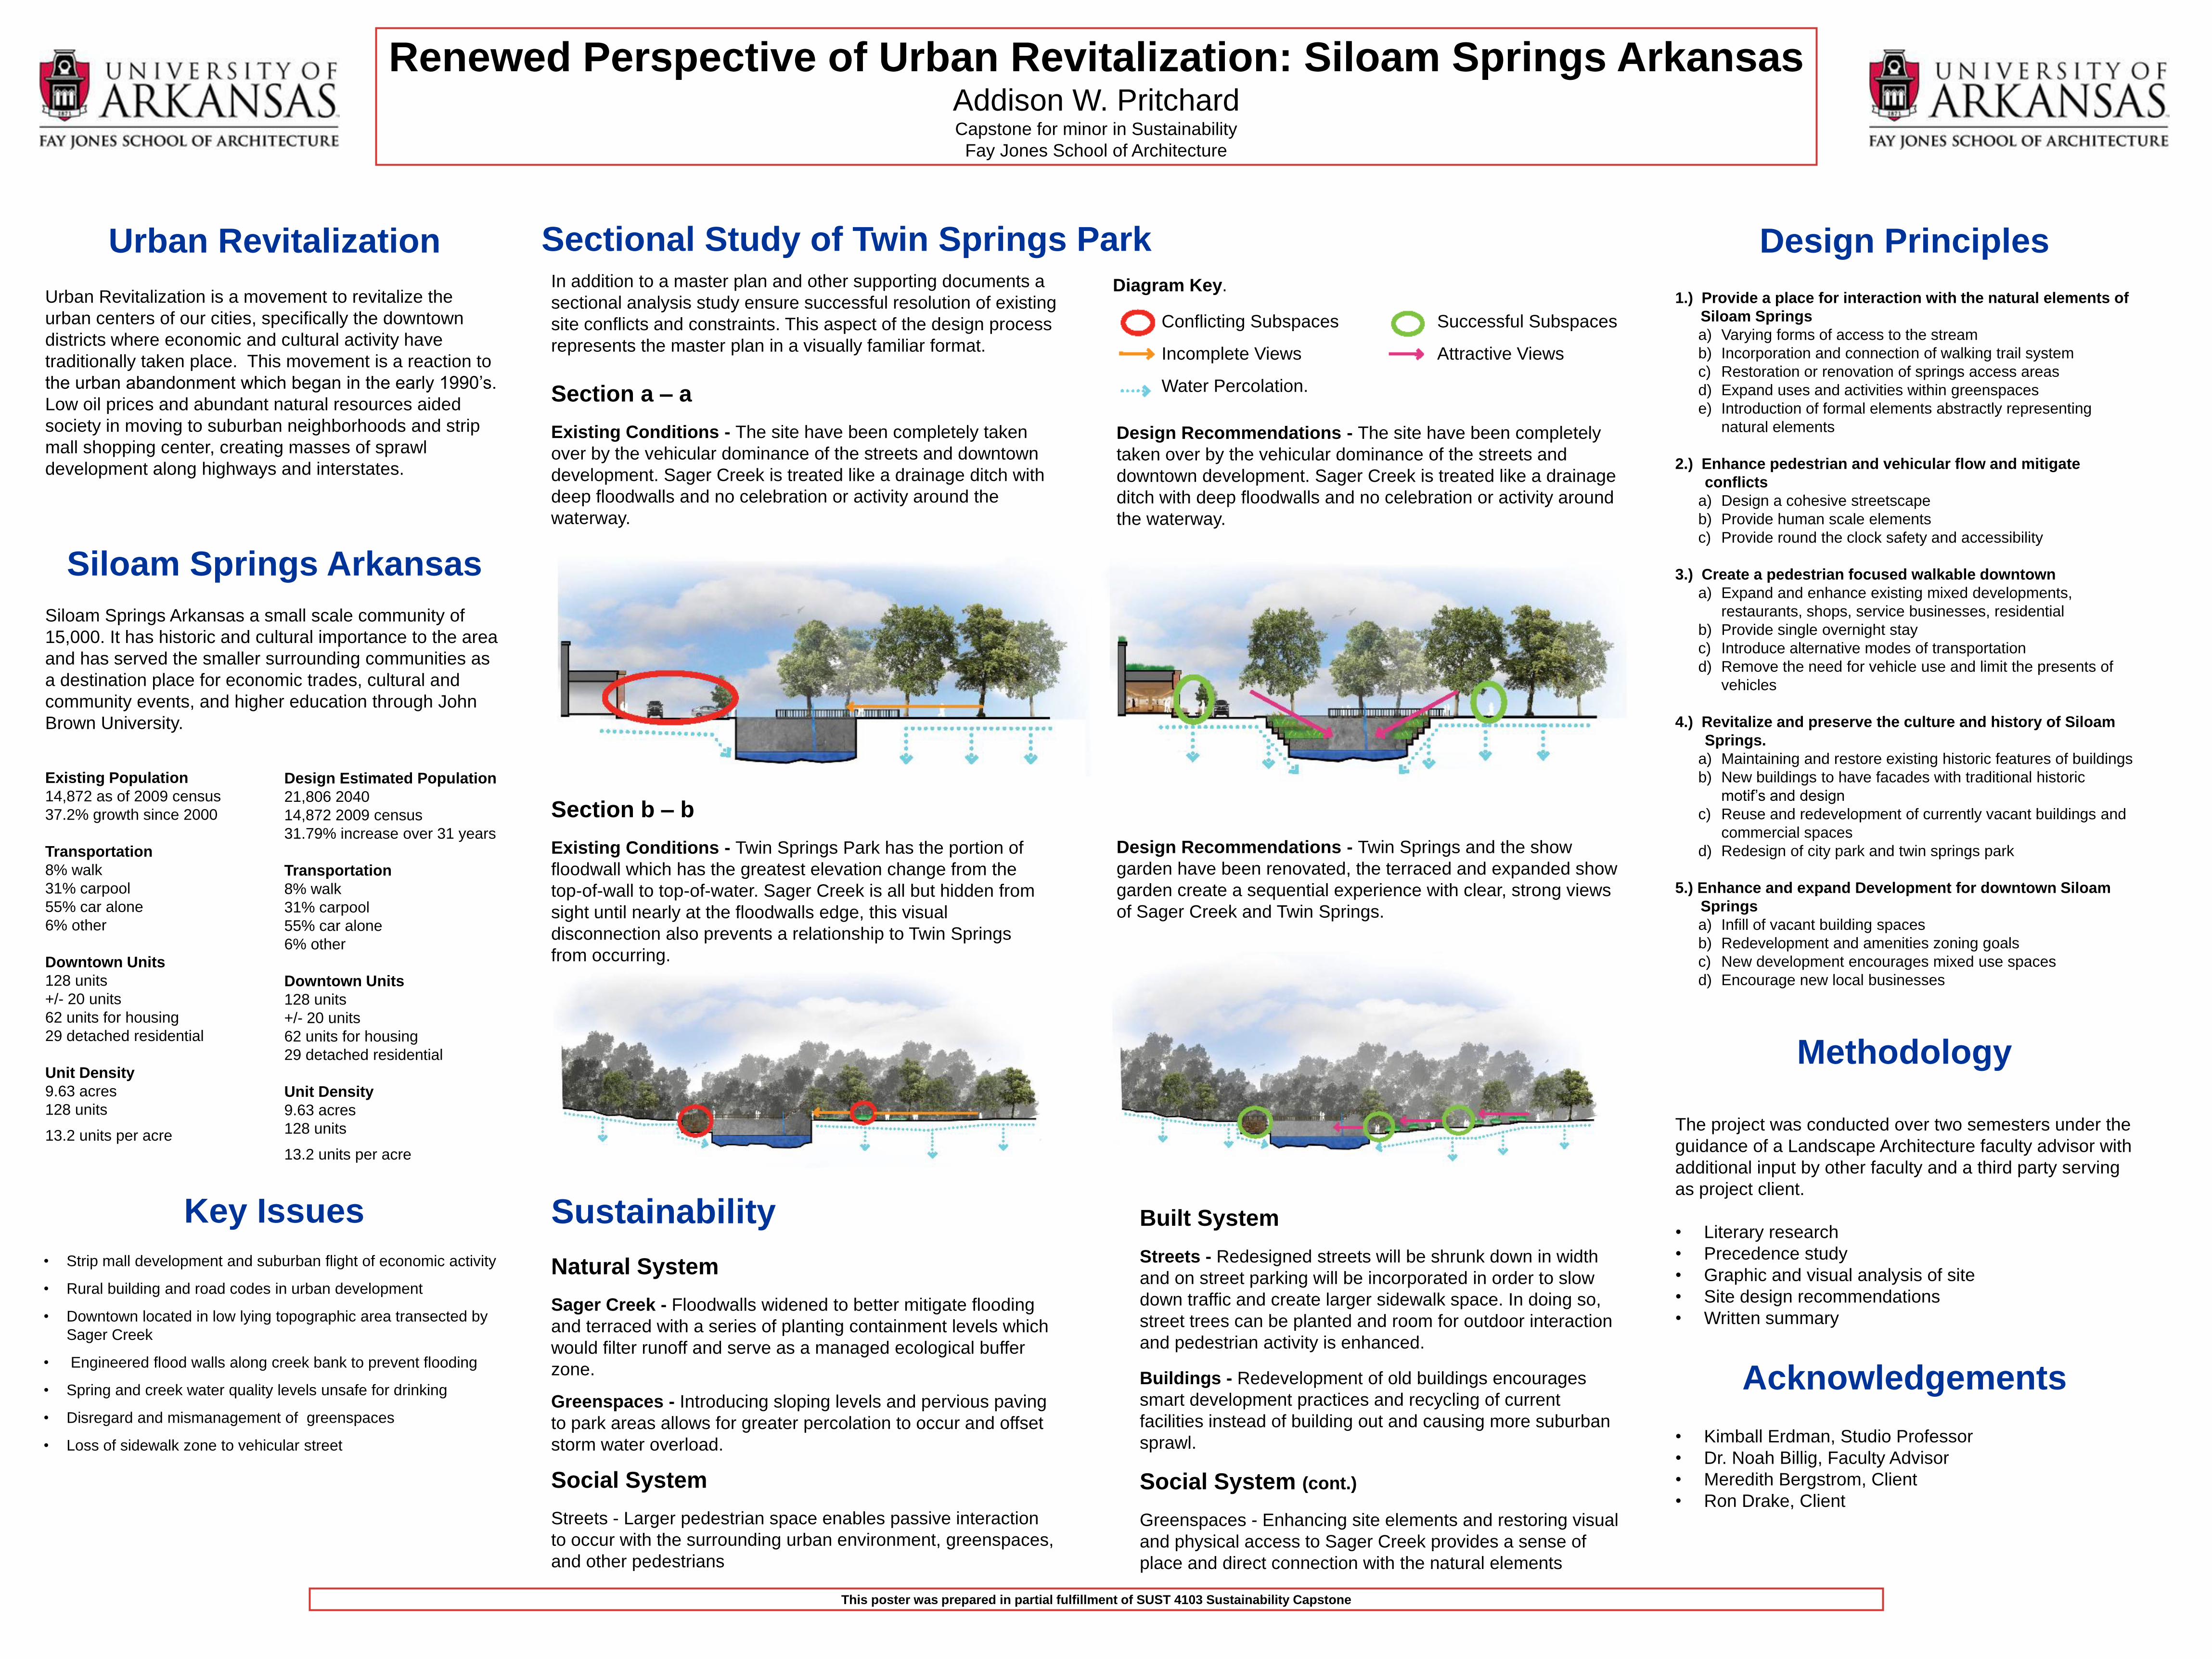
Renewed Perspective of Urban Revitalization: Siloam Springs Arkansas Addison W. Pritchard Capstone for minor in Sustainability
Fay Jones School of Architecture
Urban Revitalization Urban Revitalization is a movement to revitalize the
urban centers of our cities, specifically the downtown
districts where economic and cultural activity have
traditionally taken place. This movement is a reaction to
the urban abandonment which began in the early 1990’s.
Low oil prices and abundant natural resources aided
society in moving to suburban neighborhoods and strip
mall shopping center, creating masses of sprawl
development along highways and interstates.
Siloam Springs Arkansas
Siloam Springs Arkansas a small scale community of
15,000. It has historic and cultural importance to the area
and has served the smaller surrounding communities as
a destination place for economic trades, cultural and
community events, and higher education through John
Brown University.
Design Principles
1.) Provide a place for interaction with the natural elements of
Siloam Springs
a) Varying forms of access to the stream
b) Incorporation and connection of walking trail system
c) Restoration or renovation of springs access areas
d) Expand uses and activities within greenspaces
e) Introduction of formal elements abstractly representing
natural elements
2.) Enhance pedestrian and vehicular flow and mitigate
conflicts
a) Design a cohesive streetscape
b) Provide human scale elements
c) Provide round the clock safety and accessibility
3.) Create a pedestrian focused walkable downtown
a) Expand and enhance existing mixed developments,
restaurants, shops, service businesses, residential
b) Provide single overnight stay
c) Introduce alternative modes of transportation
d) Remove the need for vehicle use and limit the presents of
vehicles
4.) Revitalize and preserve the culture and history of Siloam
Springs.
a) Maintaining and restore existing historic features of buildings
b) New buildings to have facades with traditional historic
motif’s and design
c) Reuse and redevelopment of currently vacant buildings and
commercial spaces
d) Redesign of city park and twin springs park
5.) Enhance and expand Development for downtown Siloam
Springs
a) Infill of vacant building spaces
b) Redevelopment and amenities zoning goals
c) New development encourages mixed use spaces
d) Encourage new local businesses
Methodology
The project was conducted over two semesters under the
guidance of a Landscape Architecture faculty advisor with
additional input by other faculty and a third party serving
as project client.
• Literary research
• Precedence study
• Graphic and visual analysis of site
• Site design recommendations
• Written summary
Acknowledgements
• Kimball Erdman, Studio Professor
• Dr. Noah Billig, Faculty Advisor
• Meredith Bergstrom, Client
• Ron Drake, Client
This poster was prepared in partial fulfillment of SUST 4103 Sustainability Capstone
Design Recommendations - The site have been completely
taken over by the vehicular dominance of the streets and
downtown development. Sager Creek is treated like a drainage
ditch with deep floodwalls and no celebration or activity around
the waterway.
Design Estimated Population
21,806 2040
14,872 2009 census
31.79% increase over 31 years
Transportation
8% walk
31% carpool
55% car alone
6% other
Downtown Units
128 units
+/- 20 units
62 units for housing
29 detached residential
Unit Density
9.63 acres
128 units
13.2 units per acre
Existing Population
14,872 as of 2009 census
37.2% growth since 2000
Transportation
8% walk
31% carpool
55% car alone
6% other
Downtown Units
128 units
+/- 20 units
62 units for housing
29 detached residential
Unit Density
9.63 acres
128 units
13.2 units per acre
Key Issues
• Strip mall development and suburban flight of economic activity
• Rural building and road codes in urban development
• Downtown located in low lying topographic area transected by
Sager Creek
• Engineered flood walls along creek bank to prevent flooding
• Spring and creek water quality levels unsafe for drinking
• Disregard and mismanagement of greenspaces
• Loss of sidewalk zone to vehicular street
Sustainability
Natural System
Sager Creek - Floodwalls widened to better mitigate flooding
and terraced with a series of planting containment levels which
would filter runoff and serve as a managed ecological buffer
zone.
Greenspaces - Introducing sloping levels and pervious paving
to park areas allows for greater percolation to occur and offset
storm water overload.
Social System
Streets - Larger pedestrian space enables passive interaction
to occur with the surrounding urban environment, greenspaces,
and other pedestrians
Built System
Streets - Redesigned streets will be shrunk down in width
and on street parking will be incorporated in order to slow
down traffic and create larger sidewalk space. In doing so,
street trees can be planted and room for outdoor interaction
and pedestrian activity is enhanced.
Buildings - Redevelopment of old buildings encourages
smart development practices and recycling of current
facilities instead of building out and causing more suburban
sprawl.
Social System (cont.)
Greenspaces - Enhancing site elements and restoring visual
and physical access to Sager Creek provides a sense of
place and direct connection with the natural elements
Section a – a
Existing Conditions - The site have been completely taken
over by the vehicular dominance of the streets and downtown
development. Sager Creek is treated like a drainage ditch with
deep floodwalls and no celebration or activity around the
waterway.
Design Recommendations - Twin Springs and the show
garden have been renovated, the terraced and expanded show
garden create a sequential experience with clear, strong views
of Sager Creek and Twin Springs.
Section b – b
Existing Conditions - Twin Springs Park has the portion of
floodwall which has the greatest elevation change from the
top-of-wall to top-of-water. Sager Creek is all but hidden from
sight until nearly at the floodwalls edge, this visual
disconnection also prevents a relationship to Twin Springs
from occurring.
Sectional Study of Twin Springs Park In addition to a master plan and other supporting documents a
sectional analysis study ensure successful resolution of existing
site conflicts and constraints. This aspect of the design process
represents the master plan in a visually familiar format.
Diagram Key.
Conflicting Subspaces
Incomplete Views
Water Percolation.
Successful Subspaces
Attractive Views
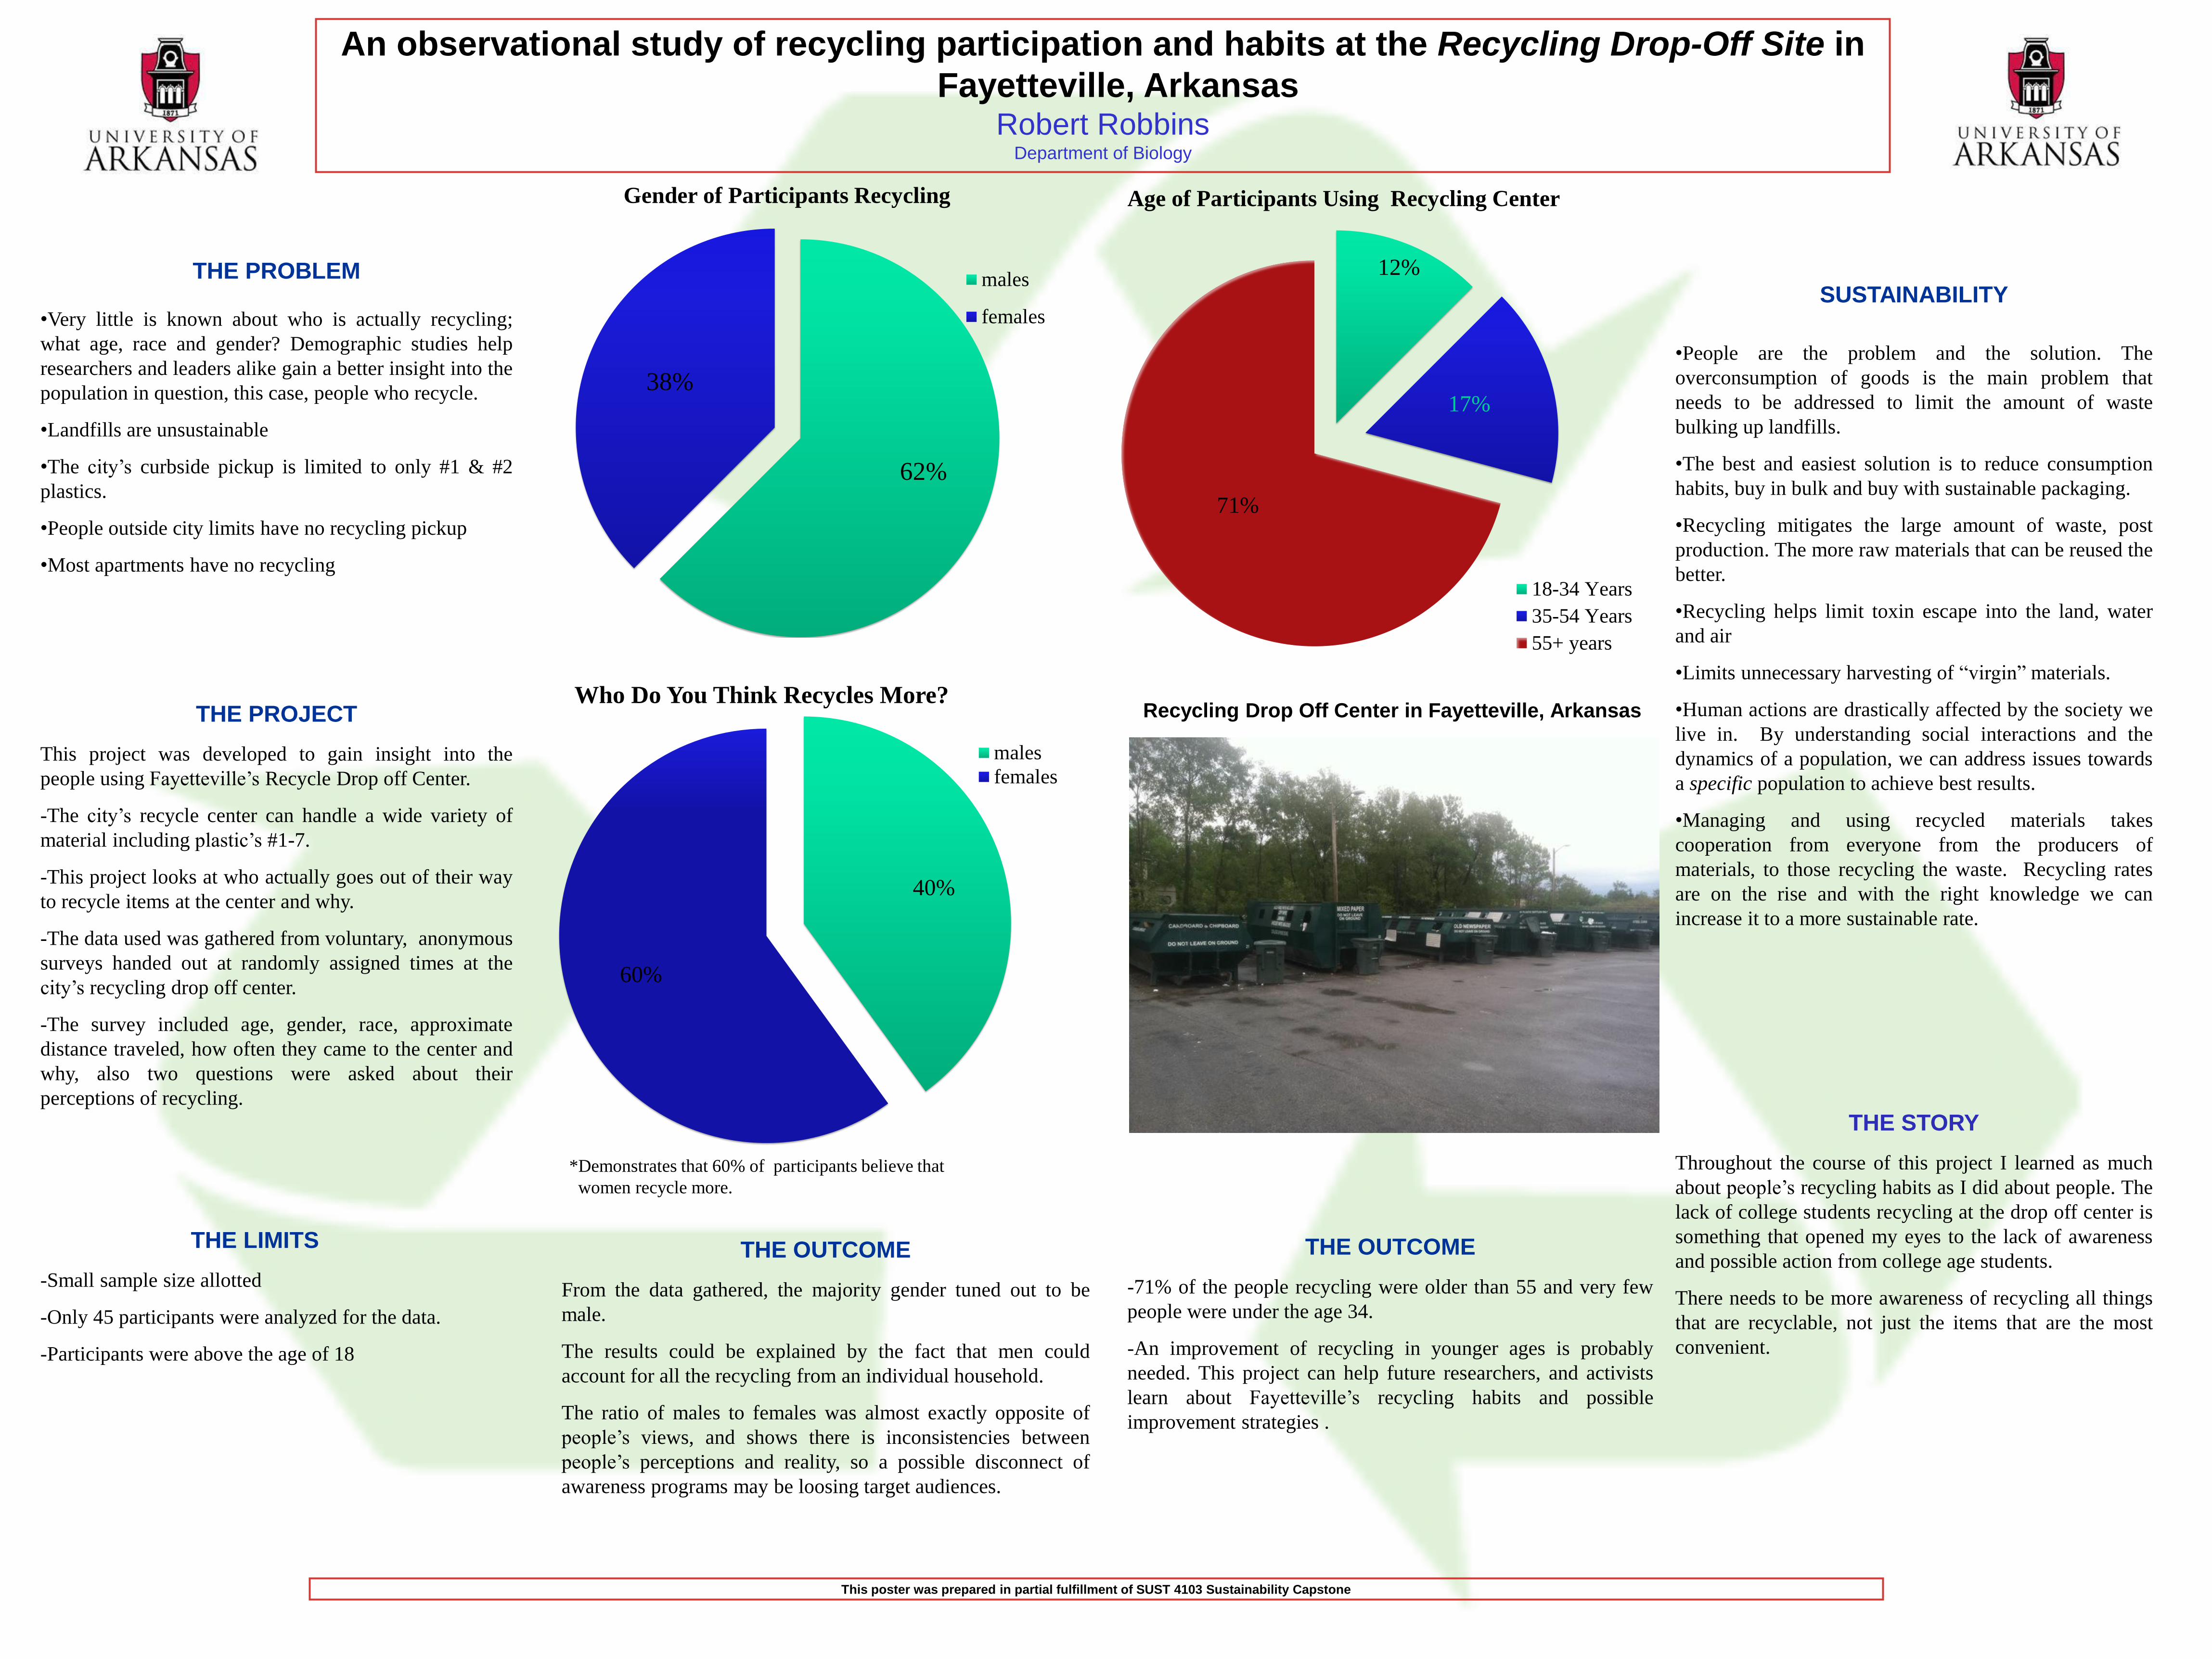
An observational study of recycling participation and habits at the Recycling Drop-Off Site in
Fayetteville, Arkansas Robert Robbins
Department of Biology
THE PROBLEM
•Very little is known about who is actually recycling;
what age, race and gender? Demographic studies help
researchers and leaders alike gain a better insight into the
population in question, this case, people who recycle.
•Landfills are unsustainable
•The city’s curbside pickup is limited to only #1 & #2
plastics.
•People outside city limits have no recycling pickup
•Most apartments have no recycling
THE PROJECT
This project was developed to gain insight into the
people using Fayetteville’s Recycle Drop off Center.
-The city’s recycle center can handle a wide variety of
material including plastic’s #1-7.
-This project looks at who actually goes out of their way
to recycle items at the center and why.
-The data used was gathered from voluntary, anonymous
surveys handed out at randomly assigned times at the
city’s recycling drop off center.
-The survey included age, gender, race, approximate
distance traveled, how often they came to the center and
why, also two questions were asked about their
perceptions of recycling.
THE LIMITS
-Small sample size allotted
-Only 45 participants were analyzed for the data.
-Participants were above the age of 18
SUSTAINABILITY
•People are the problem and the solution. The
overconsumption of goods is the main problem that
needs to be addressed to limit the amount of waste
bulking up landfills.
•The best and easiest solution is to reduce consumption
habits, buy in bulk and buy with sustainable packaging.
•Recycling mitigates the large amount of waste, post
production. The more raw materials that can be reused the
better.
•Recycling helps limit toxin escape into the land, water
and air
•Limits unnecessary harvesting of “virgin” materials.
•Human actions are drastically affected by the society we
live in. By understanding social interactions and the
dynamics of a population, we can address issues towards
a specific population to achieve best results.
•Managing and using recycled materials takes
cooperation from everyone from the producers of
materials, to those recycling the waste. Recycling rates
are on the rise and with the right knowledge we can
increase it to a more sustainable rate.
THE STORY
Throughout the course of this project I learned as much
about people’s recycling habits as I did about people. The
lack of college students recycling at the drop off center is
something that opened my eyes to the lack of awareness
and possible action from college age students.
There needs to be more awareness of recycling all things
that are recyclable, not just the items that are the most
convenient.
This poster was prepared in partial fulfillment of SUST 4103 Sustainability Capstone
THE OUTCOME
-71% of the people recycling were older than 55 and very few
people were under the age 34.
-An improvement of recycling in younger ages is probably
needed. This project can help future researchers, and activists
learn about Fayetteville’s recycling habits and possible
improvement strategies .
62%
38%
Gender of Participants Recycling
males
females
12%
71%
Age of Participants Using Recycling Center
18-34 Years
35-54 Years
55+ years
17%
40%
60%
Who Do You Think Recycles More?
males
females
*Demonstrates that 60% of participants believe that
women recycle more.
THE OUTCOME
From the data gathered, the majority gender tuned out to be
male.
The results could be explained by the fact that men could
account for all the recycling from an individual household.
The ratio of males to females was almost exactly opposite of
people’s views, and shows there is inconsistencies between
people’s perceptions and reality, so a possible disconnect of
awareness programs may be loosing target audiences.
Recycling Drop Off Center in Fayetteville, Arkansas