CapitaLand Retail China Trustinvestor.capitaland.com/newsroom/20151116_175010_C... · 0 thMorgan...
45
0 Morgan Stanley 14 th Annual Asia Pacific Summit *17 November 2015* 17 November 2015 CapitaLand Retail China Trust Morgan Stanley Fourteenth Annual Asia Pacific Summit
Transcript of CapitaLand Retail China Trustinvestor.capitaland.com/newsroom/20151116_175010_C... · 0 thMorgan...

0 Morgan Stanley 14th Annual Asia Pacific Summit *17 November 2015*
17 November 2015
CapitaLand Retail China Trust
Morgan Stanley Fourteenth Annual Asia Pacific Summit

1 Morgan Stanley 14th Annual Asia Pacific Summit *17 November 2015*
Disclaimer This presentation may contain forward-looking statements that involve assumptions, risks and uncertainties. Actual
future performance, outcomes and results may differ materially from those expressed in forward-looking
statements as a result of a number of risks, uncertainties and assumptions. Representative examples of these
factors include (without limitation) general industry and economic conditions, interest rate trends, cost of capital
and capital availability, competition from other developments or companies, shifts in expected levels of
occupancy rate, property rental income, charge out collections, changes in operating expenses (including
employee wages, benefits and training costs), governmental and public policy changes and the continued
availability of financing in the amounts and the terms necessary to support future business. You are cautioned not
to place undue reliance on these forward-looking statements, which are based on the current view of
management on future events.
The information contained in this presentation has not been independently verified. No representation or warranty
expressed or implied is made as to, and no reliance should be placed on, the fairness, accuracy, completeness or
correctness of the information or opinions contained in this presentation. Neither CapitaLand Retail China Trust
Management Limited (the “Manager”) or any of its affiliates, advisers or representatives shall have any liability
whatsoever (in negligence or otherwise) for any loss howsoever arising, whether directly or indirectly, from any use,
reliance or distribution of this presentation or its contents or otherwise arising in connection with this presentation.
The past performance of CapitaLand Retail China Trust (“CRCT”) is not indicative of the future performance of
CRCT. Similarly, the past performance of the Manager is not indicative of the future performance of the Manager.
The value of units in CRCT (“Units”) and the income derived from them may fall as well as rise. Units are not
obligations of, deposits in, or guaranteed by, the Manager or any of its affiliates. An investment in Units is subject to
investment risks, including the possible loss of the principal amount invested.
Investors should note that they will have no right to request that the Manager redeem or purchase their Units for as
long as the Units are listed on the Singapore Exchange Securities Trading Limited (“SGX-ST”). It is intended that
holders of Units (Unitholders) may only deal in their Units through trading on the SGX-ST. Listing of the Units on the
SGX-ST does not guarantee a liquid market for the Units.
This presentation is for information only and does not constitute an invitation or offer to acquire, purchase or
subscribe for Units.

2 Morgan Stanley 14th Annual Asia Pacific Summit *17 November 2015*
• Overview of CRCT
• YTD 2015 Highlights
• Financial Performance & Capital
Management
• Portfolio Update
• Our Growth Drivers
• Moving Forward
• Appendix
Contents
CapitaMall Wangjing, Beijing
CapitaMall Qibao, Shanghai

3 Morgan Stanley 14th Annual Asia Pacific Summit *17 November 2015* CapitaMall Wangjing, Beijing, China
Overview of CRCT
4 Morgan Stanley 14th Annual Asia Pacific Summit *17 November 2015*
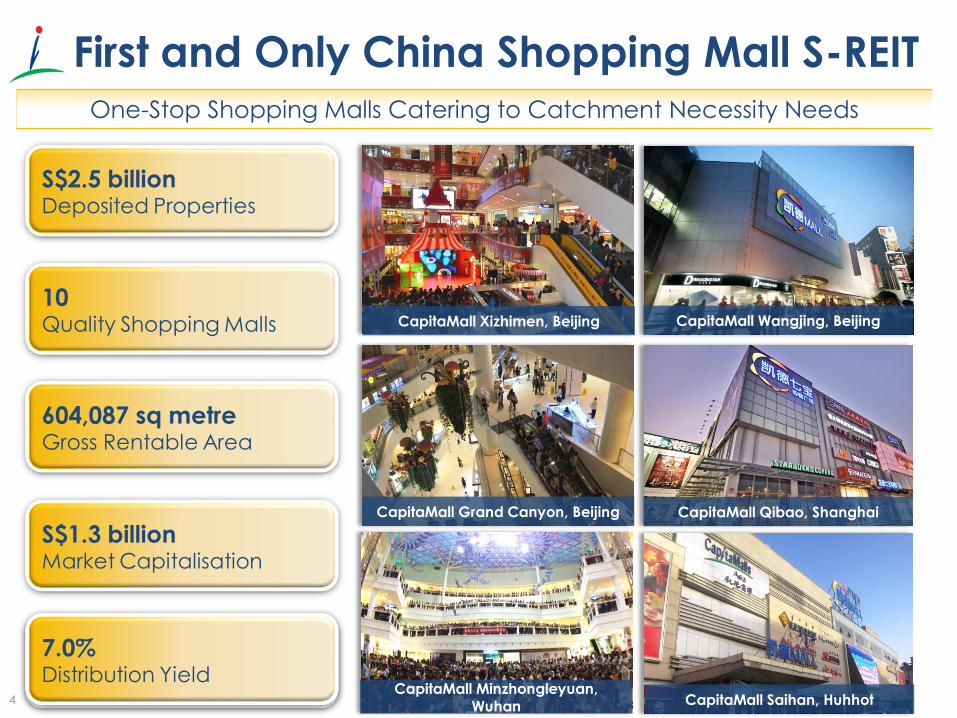
First and Only China Shopping Mall S-REIT
CapitaMall Grand Canyon, Beijing
CapitaMall Wangjing, Beijing CapitaMall Xizhimen, Beijing
CapitaMall Minzhongleyuan, Wuhan
CapitaMall Qibao, Shanghai
CapitaMall Saihan, Huhhot CapitaMall Minzhongleyuan,
Wuhan CapitaMall Saihan, Huhhot
One-Stop Shopping Malls Catering to Catchment Necessity Needs
7.8% Distribution Yield
S$2.5 billion Deposited Properties
10 Quality Shopping Malls
604,087 sq metre Gross Rentable Area
S$1.3 billion Market Capitalisation
7.0% Distribution Yield
5 Morgan Stanley 14th Annual Asia Pacific Summit *17 November 2015*
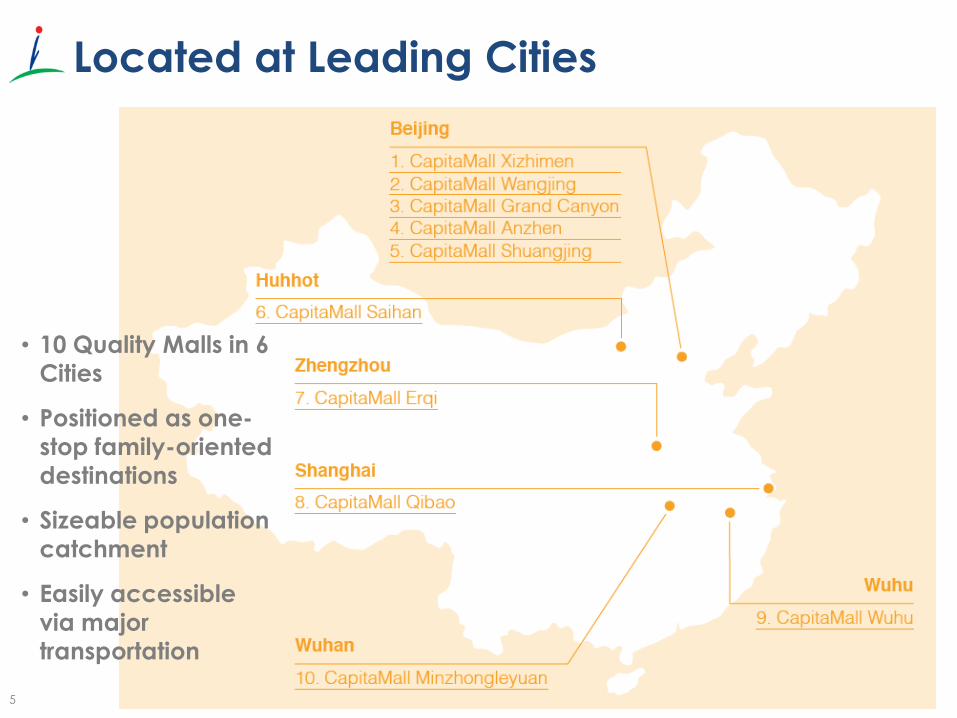
Located at Leading Cities
• 10 Quality Malls in 6
Cities
• Positioned as one-
stop family-oriented
destinations
• Sizeable population
catchment
• Easily accessible
via major
transportation

6 Morgan Stanley 14th Annual Asia Pacific Summit *17 November 2015* CapitaMall Wangjing, Beijing, China
YTD 2015 Highlights

7 Morgan Stanley 14th Annual Asia Pacific Summit *17 November 2015*
7.34
8.01
Distribution Per Unit
(cents)
YTD Sep 2014 YTD Sep 2015
YTD Sep 2015 Highlights
150.6
164.1
Gross Revenue
(S$’mil)
98.8
105.8
Net Property Income
(S$’mil)
9.0% 7.1 %
60.4
67.4
Distributable Income
(S$’mil)
11.6% 9.1 %
CapitaMall Xizhimen, Beijing
CapitaMall Wangjing, Beijing

8 Morgan Stanley 14th Annual Asia Pacific Summit *17 November 2015*
Stable Portfolio Shopper Traffic &
Tenants’ Sales Growth
1. Including only multi-tenanted malls except CapitaMall Minzhongleyuan, which was reopened on 1 May 2014 after the completion of asset enhancement works from 1 July 2013 to 30 April 2014.
Shopper Traffic1
(YTD Sep 2015 vs YTD Sep 2014) Tenants’ Sales1
(YTD Sep 2015 vs YTD Sep 2014)
RMB psm
0
50
100
150
200
250
YTD Sep 2014 YTD Sep 2015
'000 Ave. Daily No. of Shoppers
YoY
2.0%
0
500
1,000
1,500
2,000
YTD Sep 2014 YTD Sep 2015
Ave. Monthly Sales
YoY
14.7%
9 Morgan Stanley 14th Annual Asia Pacific Summit *17 November 2015*
Financial Performance &
Capital
Management
CapitaMall Xizhimen, Beijing, China

10 Morgan Stanley 14th Annual Asia Pacific Summit *17 November 2015*
YTD Sep 2015 Distributable Income
Grew 11.6%
YTD 2015 YTD 2014
Change
Actual Actual
Gross Revenue (RMB’000) 751,767 735,292 2.2%
NPI (RMB’000) 484,659 482,556 0.4%
NPI (S$’000) 105,791 98,818 7.1%
Distributable Income (S$’000) 67,371 60,373 11.6%
DPU (Singapore cents) 8.01 7.34 9.1%
Annualised Distribution Yield 7.8%
(Based on unit price of S$1.365 on 30 Sep 2015)
Annualised Distribution Yield 7.0%
(Based on unit price of S$1.52 on 30 Oct 2015)

11 Morgan Stanley 14th Annual Asia Pacific Summit *17 November 2015*
41.7
71.0
99.1
146.8
194.0
45.0
75.2
106.6
160.1
205.7
CapitaMall Saihan
CapitaMall Qibao
CapitaMall Grand Canyon
CapitaMall Wangjing
CapitaMall Xizhimen
1. CapitaMall Minzhongleyuan is affected by the road closure whereas CapitaMall Wuhu is currently undergoing tenancy adjustments.
Multi-Tenanted Malls
Master-Leased Malls
2.2%
Excluding malls under stabilisation, Gross Revenue increased by 6.0%1 y-o-y
Property Gross Revenue (in RMB’mil):
YTD Sep 2015 vs YTD Sep 2014
YTD 2015: 592.6
YTD 2014: 552.6 7.2%
Malls under Stabilisation
YTD 2015: 726.7
YTD 2014: 685.5 6.0%
34.0
37.8
61.1
34.3
38.2
61.7
CapitaMall Shuangjing
CapitaMall Erqi
CapitaMall Anzhen
26.8
23.1 13.1
11.9
CapitaMall Wuhu
CapitaMall Minzhongleyuan
YTD 2015 YTD 2014
735.3 751.8
CRCT Portfolio

12 Morgan Stanley 14th Annual Asia Pacific Summit *17 November 2015*
27.4
30.5
50.1
27.6
30.3
50.6
CapitaMall Shuangjing
CapitaMall Erqi
CapitaMall Anzhen
23.7
30.9
60.6
106.2
137.7
23.1
34.2
69.0
117.6
146.3
CapitaMall Saihan
CapitaMall Qibao
CapitaMall Grand Canyon
CapitaMall Wangjing
CapitaMall Xizhimen
482.6 484.7
CRCT Portfolio
Multi-Tenanted Malls
Master-Leased Malls
0.4%
Net Property Income (in RMB’mil):
YTD Sep 2015 vs YTD Sep 2014
YTD 2015: 390.3
YTD 2014: 359.0 8.7%
Excluding malls under stabilisation, Net Property Income increased by 6.8 %1 y-o-y
YTD 2015: 498.9
YTD 2014: 467.1 6.8%
Malls under Stabilisation
1. CapitaMall Minzhongleyuan is affected by the road closure whereas CapitaMall Wuhu is currently undergoing tenancy adjustments.
10.5
5.0 -7.3
-6.9
CapitaMall Wuhu
CapitaMall Minzhongleyuan
YTD 2015 YTD 2014

13 Morgan Stanley 14th Annual Asia Pacific Summit *17 November 2015*
Healthy Balance Sheet
As at 30 Sep 2015 S$’000
Investment Properties 2,381,922 Net assets attributable 1,435,379
Other Assets 19,404 to unitholders (S$’000)
Financial Derivatives Assets 6,335
Cash & Cash Equivalents 104,313 Units In Issue (‘000 units) 842,221
Total Assets 2,511,974
Interest-bearing Borrowings 708,607 Net Asset Value (NAV)
1.70 per unit
Deferred Tax Liabilities 230,846
Financial Derivatives Liabilities 17,833 Adjusted NAV per unit 1.68
Other Liabilities 93,137 (net of distribution)
Total Liabilities 1,050,423
Non-controlling Interest 26,172

14 Morgan Stanley 14th Annual Asia Pacific Summit *17 November 2015*
Fixed
Rate
74.0%
100.0 125.5 50.0
175.0 100.0
Variable
Rate
26.0%
77.2
68.3
0
200
400
600
800
Total
Borrowings
4Q 15 2016 2017 2018 2019 2020
CapitaMall Grand
Canyon - Secured
Onshore Term Loan
Trust - Unsecured Money
Market Line
Trust - Unsecured
Offshore Term Loan
S$709.8 mil2
No major refinancing required for remaining FY 2015
S$’million
1
1. Amortisation repayment is S$5.5 mil annually from 2015 to 2017, which will be repaid equally in June and December each year. 2. CRCT hedges its non-RMB loans through Non-Deliverable Forward (NDF). As at 30 September 2015, including RMB denominated loans,
CRCT has hedged 69.3% of its total outstanding loans.
Debt Maturity Profile (30 Sep 2015)
Excluding RMB denominated loans,
fixed rate ~ 83.7%.

15 Morgan Stanley 14th Annual Asia Pacific Summit *17 November 2015*
Key Financial Indicators
1. Negative pledge and non-disposal is allowed subject to a ratio of market value of unencumbered assets of CRCT over unsecured Borrowings of at least 2:1.
2. The higher gearing and net debt/EBITDA were mainly due to higher debt drawn down at trust level for the distribution paid in September 2015 offset by the repayment of the onshore bridge loan.
As at 30 Sep
2015
As at 30 Jun
2015
Unencumbered Assets as % of Total Assets1 96.7% 96.3%
Gearing2 28.5% 27.7%
Net Debt / EBITDA (Times) 5.5 5.2
Interest Coverage (Times) 6.4 6.4
Average Term to Maturity (Years) 2.42 2.80
Average Cost of Debt 2.98% 2.98%

16 Morgan Stanley 14th Annual Asia Pacific Summit *17 November 2015* CapitaMall Xizhimen , Beijing, China
Portfolio Update

17 Morgan Stanley 14th Annual Asia Pacific Summit *17 November 2015*
Strong Portfolio Occupancy Rate
1. Based on committed leases. 2. Reconfiguration of the unit previously occupied by a large F&B tenant. 3. Impacted by road closure to facilitate the construction work of a new subway line. 4. Impacted by the ongoing tenancy adjustments to achieve more optimal tenant trade mix.
30 Sep 141 31 Dec 141 31 Mar 151 30 Jun 151 30 Sep 151
Multi-Tenanted Malls
CapitaMall Xizhimen 97.0% 97.0% 97.8% 97.7% 98.9%
CapitaMall Wangjing 99.9% 99.3% 99.5% 99.3% 99.2%
CapitaMall Grand Canyon 99.7% 99.7% 99.8% 99.3% 99.2%
CapitaMall Qibao 96.1% 96.1% 95.9% 93.6% 94.1%2
CapitaMall Saihan 100.0% 100.0% 99.9% 99.7% 99.7%
Master-Leased Malls
CapitaMall Anzhen 100.0% 100.0% 100.0% 100.0% 100.0%
CapitaMall Shuangjing 100.0% 100.0% 100.0% 100.0% 100.0%
CapitaMall Erqi 100.0% 100.0% 100.0% 100.0% 100.0%
Malls under Stabilisation
CapitaMall Minzhongleyuan 86.9% 73.9% 65.3% 72.4% 73.1%3
CapitaMall Wuhu 87.4% 73.9% 67.9%4 66.5% 62.3%4
CRCT Portfolio 97.6% 95.9% 95.1% 95.0% 94.8%

18 Morgan Stanley 14th Annual Asia Pacific Summit *17 November 2015*
YTD Sep 2015 Rental Reversion of 8.9%
From 1 Jan to 30 Sep 2015
Property No. of new leases/renewals
Area (sq m)
% of Total Net Lettable
Area
Var. over last rental
rate1, 2,3 (%)
CapitaMall Xizhimen 94 10,558 20.9% 9.8%
CapitaMall Wangjing 101 7,355 13.7% 6.3%
CapitaMall Grand Canyon 95 6,621 14.6% 7.9%
CapitaMall Qibao 53 8,488 16.6% 18.4%
CapitaMall Saihan 91 5,314 17.2% 9.8%
CapitaMall Wuhu 6 263 0.7% (55.0%)4
Total 440 38,599 14.3% 8.9%5
1. Excluded gross turnover component, newly created units lease out, short term renewals (< 1 year), units vacant for >=1 year and pre-terminated leases.
2. Included re-configured units. 3. Majority of leases have rental escalation clauses. 4. Negative rental reversion predominantly due to ongoing tenancy adjustments to achieve more optimal tenant trade mix. 5. Excluding CapitaMall Wuhu, portfolio rental reversion would be 9.3%.

19 Morgan Stanley 14th Annual Asia Pacific Summit *17 November 2015*
13.0 15.2 18.2
23.6
14.9 17.3
10.0
17.5
23.0 24.9 22.6
20.6
12.8
4.6
10.9%
97.4
97.1
97.5
97.2
96.5
96.5
98.3
98.2
98.4
98.1
97.6
95.9
95.1
95.0
94.8%
1Q
2012
2Q
2012
3Q
2012
4Q
2012
1Q
2013
2Q
2013
3Q
2013
4Q
2013
1Q
2014
2Q
2014
3Q
2014
4Q
2014
1Q
2015
2Q
2015
3Q
2015
Portfolio Rental Reversion Portfolio Occupancy
Stable Rental Reversion & Occupancy
Average 16.6%
Consistently >90%

20 Morgan Stanley 14th Annual Asia Pacific Summit *17 November 2015*
CapitaMall Wangjing: Façade Upgrading
Renovation works have commenced in Oct 2015; Target to complete by 1H 2016
Artist's Impression of the new facade

21 Morgan Stanley 14th Annual Asia Pacific Summit *17 November 2015*
• Renovation of toilets
L2 completed
L3 renovation works in progress, target to complete by 4Q 2015
L4 & L5 to commence and complete renovation works by 3Q 2016
• Car park flooring upgrading
B3 completed
Target to complete all renovation works by 4Q 2015
CapitaMall Grand Canyon: Enhancement
of Facilities
Renovation of toilets
Car park flooring upgrade

22 Morgan Stanley 14th Annual Asia Pacific Summit *17 November 2015* CapitaMall Xizhimen, Beijing, China
Our Growth
Drivers
22

23 Morgan Stanley 14th Annual Asia Pacific Summit *17 November 2015*
Tapping on Growing Chinese Consumer
Market
6.8 7.9 9.4 11.5
13.3 15.7
18.4 21.0
24.3 27.2
10.5 11.8
13.8 15.8
17.2 19.1
21.8
24.6 26.5
28.8
0
5
10
15
20
25
30
35
0
20
40
60
2005 2006 2007 2008 2009 2010 2011 2012 2013 2014
RMB ‘000 RMB ‘tril
Total Retail Sales (RMB 'tril) Per Capita Annual Urban Disposable Income (RMB'000)
Steady increase in China’s retail sales and disposable income

24 Morgan Stanley 14th Annual Asia Pacific Summit *17 November 2015*
Balanced Property Portfolio
CapitaMall Anzhen,
Beijing CapitaMall Erqi,
Zhengzhou CapitaMall Shuangjing,
Beijing
3 master-leased malls provide STABILITY (22% of portfolio NPI*)
* Based on YTD Sep 2015 NPI.

25 Morgan Stanley 14th Annual Asia Pacific Summit *17 November 2015*
Balanced Property Portfolio
CapitaMall Xizhimen, Beijing
CapitaMall Wuhu2, Wuhu
CapitaMall Wangjing, Beijing
CapitaMall Qibao, Shanghai CapitaMall Minzhongleyuan,
Wuhan CapitaMall Saihan, Huhhot
CapitaMall Grand Canyon, Beijing
1. Based on YTD Sep 2015 NPI 2. CRCT’s only owns 51% stake in CapitaMall Wuhu
7 multi-tenanted malls drive GROWTH (78% of portfolio NPI1)

26 Morgan Stanley 14th Annual Asia Pacific Summit *17 November 2015*
Strong Contribution From Tier-1 Cities
228.4 263
304.5 327.4
456.2
367.1
98.2 98.1
99.1 101.3
103.5
78.2
2010 2011 2012 2013 2014 YTD 2015
Net Property Income from Tier-1 Cities
(RMB’mil)
Multi-Tenanted Master Leased
Tier-12,
91.9%
Non
Tier-1,
8.1%
Net Property Income1
1. Based on YTD Sep 2015 net property income. 2. Includes CapitaMall Xizhimen, CapitaMall Wangjing, CapitaMall Grand Canyon, CapitaMall Qibao, CapitaMall Anzhen and CapitaMall
Shuangjing.
71.4%
Excluding
CapitaMall Grand
Canyon which
was acquired in
Dec 2013, growth
would be 44.9%

27 Morgan Stanley 14th Annual Asia Pacific Summit *17 November 2015*
3-Pronged Growth Strategy – Boosting
Yield Potential
• Enhancing tenant mix
• Exciting marketing activities
• Grow tenants’ sales and etc
1. Generate Organic Growth through Proactive Asset Management
• Reconfiguration/ conversion of space
• Refurbishments of properties
• Create new retail areas
2. Create New Value through Innovative Asset Enhancement
• Right of first refusal to sponsor’s pipeline
• Active pursue of third-party opportunities
3. Yield – Accretive Acquisitions through Selective Acquisition
28 Morgan Stanley 14th Annual Asia Pacific Summit *17 November 2015*
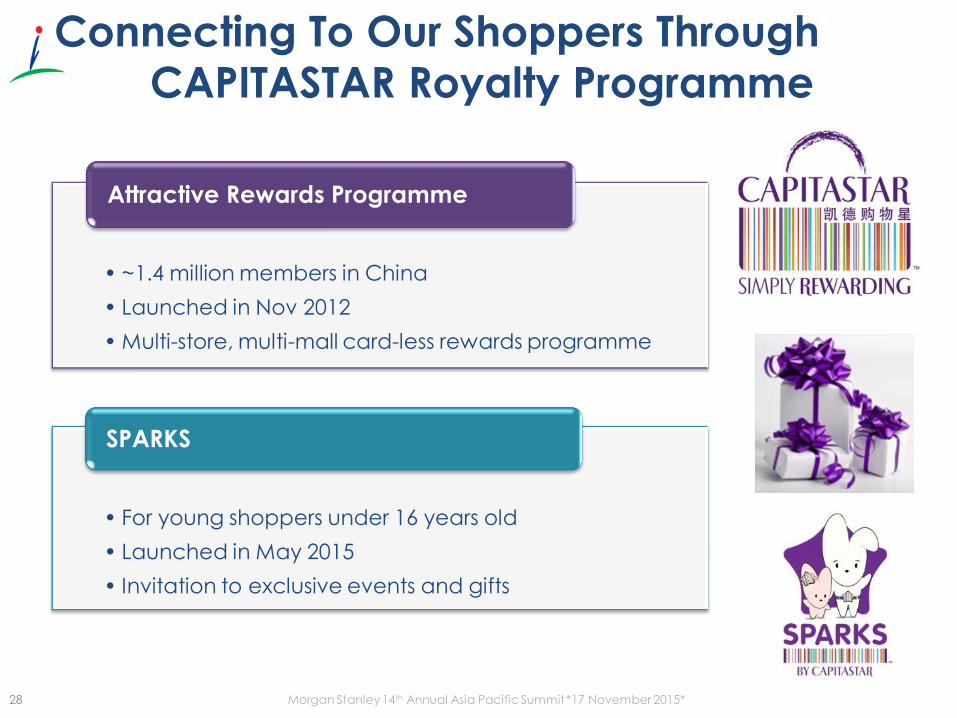
Connecting To Our Shoppers Through
CAPITASTAR Royalty Programme
• ~1.4 million members in China
• Launched in Nov 2012
• Multi-store, multi-mall card-less rewards programme
Attractive Rewards Programme
• For young shoppers under 16 years old
• Launched in May 2015
• Invitation to exclusive events and gifts
SPARKS

29 Morgan Stanley 14th Annual Asia Pacific Summit *17 November 2015*
Selective Expansion & Active Portfolio
Management
Acquired our largest asset, CapitaMall Xizhimen,
Beijing
Converted CapitaMall
Saihan, Huhhot to a multi-tenanted
mall Acquired
CapitaMall Minzhongleyuan,
Wuhan
Acquired our 10th mall,
CapitaMall Grand Canyon,
Beijing
Upgraded CapitaMall Minzhongleyuan
Investment Properties at 30 Sep 15: S$2,381.9 mil
2008
2011
2014
2013
2009
Investment
Properties at
IPO: S$688.9 mil
2006

30 Morgan Stanley 14th Annual Asia Pacific Summit *17 November 2015*
Good Track Record Since IPO
S$ mil SG cents
46.5
69.5 77.1 77.2
85.8 99.7 103.0
132.4
105.8
6.72 7.53
8.14 8.36 8.70 9.54
9.02 9.82
8.01
-
4
8
12
-
50
100
150
200
2007 2008 2009 2010 2011 2012 2013 2014 YTD Sep
2015 Net Property Income (S$ mil) Distribution Per Unit (cents)

31 Morgan Stanley 14th Annual Asia Pacific Summit *17 November 2015*
Attractive Yield
Sources: Bloomberg, CRCT, CPF Board, Monetary Authority of Singapore 1. Based on annualised YTD September 2015 distribution per unit of 10.71¢ and the unit closing price of S$1.520 on 30 October 2015. 2. Singapore Government 10-year and China Government 10-year bond yields as at 30 October 2015. 3. Average 12-month gross dividend yield of Straits Times Index stocks as at 30 October 2015. 4. Average 12-month gross dividend yield of Straits Times Real Estate Index as at 30 October 2015. 5. Average 12-month gross dividend yield of Straits Times REIT Index as at 30 October 2015. 6. Prevailing CPF-Ordinary Account savings rate. 7. Average 12-month S$ fixed deposit savings rate as at October 2015.
1
2
2
3
6 7
Based on historical gross
dividend yield of past 12 months
4 5
7.0%
2.5%
3.1%
4.0% 4.5%
6.4%
2.5%
0.3%
CRCT Yield Singapore
10-year
Govt Bond
Yield
China 10-
year Govt
Bond Yield
FSSTI Yield FSTRE Yield FSTREI Yield CPF
Ordinary
Account
12-month
Fixed (S$)
Deposit

32 Morgan Stanley 14th Annual Asia Pacific Summit *17 November 2015*
Robust Balance Sheet & Proactive
Capital Management
Gearing Ratio
28.5%
Average Cost of
Debt
2.98%
Unencumbered
Assets
96.7%
• Well-spread debt maturity to 2020
• No major refinancing requirement for the rest of FY 2015
• 74.0% of the borrowings is fixed and 69.3% is hedged
• S$500 mil multi-currency Medium Term Notes Programme untapped
• Cash conservation through our Distribution Reinvestment Plan (DRP)

33 Morgan Stanley 14th Annual Asia Pacific Summit *17 November 2015*
CRCT – Sustainable and Resilient Growth
1. Well positioned to grow with expanding China’s consumption
• Resilient portfolio – Located in key cities and well connected to public transport
• Balanced portfolio – provides stability and growth
• One-stop shopping malls – targeting at growing middle-income class
2. Discipline execution of the 3-pronged strategy
• Delivering resilient and strong growth since IPO
• Consistent steady operating performance
• Attractive yield
3. Robust balance sheet and proactive capital management provide financial flexibility
34 Morgan Stanley 14th Annual Asia Pacific Summit *17 November 2015* CapitaMall Grand Canyon, Beijing, China
Moving Forward

35 Morgan Stanley 14th Annual Asia Pacific Summit *17 November 2015*
• China on track to double 2010 GDP by 2020:
YTD 2015 GDP expanded by 6.9%* y-o-y
YTD 2015 retail sales up 10.5%* y-o-y to RMB21.6 trillion*
YTD 2015 urban disposable income per capita grew 6.8%* y-o-y
• China is focus to transform its economy to be more consumption driven by ensuring the rising middle income class has growing wages and stable employment level
• Asset enhancement initiatives (AEI)
Target to complete CapitaMall Grand Canyon’s facilities improvements by end-2015 (car park flooring upgrading) and 3Q 2016 (toilet upgrading)
At CapitaMall Wangjing
Mall façade upgrading works commenced in Oct 2015. Target to complete by 1H 2016
Enhance accessibility – planning for the construction of link way to the new MRT station; pending authorities approvals
Moving Forward
* Source: National Bureau of Statistics of China

36 Morgan Stanley 14th Annual Asia Pacific Summit *17 November 2015* CapitaMall Qibao, Shanghai, China
Appendix

37 Morgan Stanley 14th Annual Asia Pacific Summit *17 November 2015*
Portfolio Lease Expiry (By Year)
1. Based on all committed leases as of 30 September 2015. 2. As percentage of total rental income of each mall for the month of September 2015. 3. Included CapitaMall Grand Canyon and CapitaMall Minzhongleyuan.
As at 30 Sep 2015 No. of Leases1,3
Total Rental Income3
RMB’000 % of total (Sep 15)2
2015 115 1,699 2.0%
2016 575 19,512 23.7%
2017 318 14,784 18.0%
2018 117 11,757 14.3%
Beyond 2018 120 34,527 42.0%
CRCT Portfolio3 Weighted average lease term to expiry
By Total Rent Income 6.3
By Net Lettable Area 8.5

38 Morgan Stanley 14th Annual Asia Pacific Summit *17 November 2015*
Portfolio Lease Expiry Profile for 2015
As at 30 Sep 2015 No. of Leases1
Net Lettable Area Total Rental Income
Sq m % of total
(Sep 2015)2 RMB’000
% of total (Sep 2015)3
CapitaMall Xizhimen 2 231 0.5% 227 1.0%
CapitaMall Wangjing 10 624 1.2% 434 2.5%
CapitaMall Grand Canyon 19 345 0.8% 271 2.4%
CapitaMall Qibao 8 165 0.3% 87 1.1%
CapitaMall Saihan 8 1,209 3.9% 314 6.7%
CapitaMall Minzhongleyuan 52 2,880 12.5% 284 13.5%
CapitaMall Wuhu 16 567 1.5% 81 7.6%
1. Based on all committed leases as of 30 September 2015. 2. As percentage of each mall’s total net lettable area as at 30 September 2015. 3. As percentage of total rental income of each mall for the month of September 2015.

39 Morgan Stanley 14th Annual Asia Pacific Summit *17 November 2015*
Portfolio Lease Expiry Profile for 2016
As at 30 Sep 2015 No. of Leases1
Net Lettable Area Total Rental Income
Sq m % of total
(Sep 2015)2 RMB’000
% of total (Sep 2015)3
CapitaMall Xizhimen 103 8,900 17.6% 6,262 28.7%
CapitaMall Wangjing 119 7,249 13.5% 5,593 32.3%
CapitaMall Grand Canyon 104 7,827 17.3% 3,250 29.2%
CapitaMall Qibao 77 7,829 15.3% 2,118 27.0%
CapitaMall Saihan 104 5,099 16.5% 1,351 29.0%
CapitaMall Minzhongleyuan 50 2,348 10.2% 405 19.3%
CapitaMall Wuhu 14 1,640 4.3% 227 21.3%
CapitaMall Shuangjing 4 633 1.2% 305 7.5%
1. Based on all committed leases as of 30 September 2015. 2. As percentage of each mall’s total net lettable area as at 30 September 2015. 3. As percentage of total rental income of each mall for the month of September 2015.

40 Morgan Stanley 14th Annual Asia Pacific Summit *17 November 2015*
11%
12%
30%
28%
3%
1%
2% 5%
5%
1% 1% 0% 1%
0%
25%
23%
15%
10%
8%
3%
3% 3%
3% 3%
1%
2%
0% 1%
Fashion & Accessories
Food & Beverages
Department Store
Supermarket
Beauty & Healthcare
Shoes & Bags
Education
Houseware & furnishings
Leisure & Entertainment
Sundry & Services
Sporting Goods & Apparel
Jewellery / Watches /Pens
Information & Technology
others
Diversified Trade Mix
By Total Rent1,3 By Net Lettable Area2,3
1. For the month of Sep 2015. 2. Percentage of committed NLA as at 30 Sep 2015. 3. Including CapitaMall Grand Canyon and CapitaMall Minzhongleyuan.

41 Morgan Stanley 14th Annual Asia Pacific Summit *17 November 2015*
Trade Mix by Total Rental Income (%)
25.0 23.0
15.1
9.8 7.9
3.3 2.9 3.0 2.9 2.4 2.0 0.9 0.5 1.3
25.1 23.0
15.1
9.7
7.5
3.5 2.8 3.0 2.7 3.0
1.8 0.9 0.5 1.4
Fa
shio
n &
Ac
ce
sso
rie
s
Fo
od
& B
eve
rag
es
De
pa
rtm
en
t Sto
re
Su
pe
rma
rke
t
Be
au
ty &
He
alth
ca
re
Sh
oe
s &
Ba
gs
Ed
uc
atio
n
Ho
use
wa
re &
fu
rnis
hin
gs
Leis
ure
& E
nte
rta
inm
en
t
Su
nd
ry &
Se
rvic
es
Sp
ort
ing
Go
od
s &
Ap
pa
rel
Je
we
llery
/ W
atc
he
s /P
en
s
Info
rma
tio
n &
Te
ch
no
log
y
Oth
ers
For the Month of September 2015 For the Month of September 2014

42 Morgan Stanley 14th Annual Asia Pacific Summit *17 November 2015*
Trade Mix by Committed Net Lettable Area (%)
11.3 12.5
29.8 28.2
2.8 1.0 1.9
4.4 5.1
0.9 1.0 0.2 0.1 0.8
11.6 12.4
29.4
27.4
3.5 1.2
2.2 3.6 4.7
1.1 1.1 0.3 0.1 1.4
Fa
shio
n &
Ac
ce
sso
rie
s
Fo
od
& B
eve
rag
es
De
pa
rtm
en
t Sto
re
Su
pe
rma
rke
t
Be
au
ty &
He
alth
ca
re
Sh
oe
s &
Ba
gs
Ed
uc
atio
n
Ho
use
wa
re &
fu
rnis
hin
gs
Leis
ure
& E
nte
rta
inm
en
t
Su
nd
ry &
Se
rvic
es
Sp
ort
ing
Go
od
s &
Ap
pa
rel
Je
we
llery
/ W
atc
he
s /P
en
s
Info
rma
tio
n &
Te
ch
no
log
y
oth
ers
As at 30 September 2015 As at 30 September 2014

43 Morgan Stanley 14th Annual Asia Pacific Summit *17 November 2015*
Portfolio at a Glance CapitaMall Xizhimen 凯德MALL•西直门
CapitaMall Wangjing 凯德MALL•
望京
CapitaMall Grand
Canyon 凯德MALL• 大峡谷
CapitaMall Anzhen
凯德MALL•安贞
CapitaMall Erqi
凯德广场• 二七
CapitaMall Shuangjing凯德MALL•
双井
CapitaMall Minzhong
leyuan 新民众乐园
CapitaMall Qibao 凯德七宝 购物广场
CapitaMall Saihan
凯德MALL•赛罕
CapitaMall Wuhu1
凯德广场• 芜湖
Location Beijing Beijing Beijing Beijing Zhengzhou Beijing Wuhan Shanghai Huhhot Wuhu
GFA2 (sq m) 83,075 83,768 92,918 43,443 92,356 49,463 41,717 83,986 41,938 59,624
GRA2 (sq m) 83,075 68,010 69,967 43,443 92,356 49,463 37,472 72,729 41,938 45,634
NLA2 (sq m) 50,536 53,683 45,276 43,443 92,356 51,24410 22,995 51,157 30,944 37,963
Land Use Right Expiry
23 Aug 2044 23 Aug 2054
15 May 2043 15 May 2053
29 Aug 2044 29 Aug 2054
7 Oct 2034 5 Mar 2042 3 Jun 2042
31 May 2042 10 Jul 2042 30 Jun 20448
15 Sep 2045 10 Mar 20439 11 Mar 2041
20 Mar 2041 29 May 2044
Valuation2 (RMB million) 2,825 2,125 1,983 991 609 561 546 495 410 245
NPI Yield on Valuation3 6.9% 7.4% 4.7% 6.8% 6.7% 6.6% N.M.4 9.2% 7.5% N.M.5
Number of Leases2 235 214 197 2 2 10 199 165 176 47
Committed Occupancy2 98.9% 99.2% 99.2% 100.0% 100.0% 100.0% 73.1%6 94.1% 99.7% 62.3%7
Shopper Traffic for YTD 2015 (million)
28.2 8.3 7.8 - - - 3.16 10.9 7.1 3.37
1. CRCT has a 51.0% interest in CapitaMall Wuhu. 2. As at 30 Sep 2015. 3. NPI yield is based on annualised NPI as at 30 Sep 2015 and valuation as at 30 Jun 2015. 4. The NPI yield for MZLY is not meaningful as the mall’s NPI was impacted by the road closure to facilitate the construction work of a new subway line. 5. The NPI yield for Wuhu is not meaningful as the mall’s NPI was affected by the ongoing tenancy adjustment. 6. Impacted by road closure to facilitate the construction work of a new subway line. 7. Undergoing tenancy adjustments to achieve more optimal tenant trade mix. 8. The conserved building is under a lease from the Wuhan Cultural Bureau. 9. CapitaMall Qibao is indirectly held by CRCT under a master lease which expires in Jan 2024, with the right to renew for a further term of 19 years and 2 months. 10. Included the area zoned for civil defense but is certified for commercial use. N.M. – Not meaningful

44 Morgan Stanley 14th Annual Asia Pacific Summit *17 November 2015*
Thank You
For enquiries, please contact:
(Ms) LENG Tong Yan, Investor Relations
Direct: (65) 6713 1649, Email: [email protected]
168 Robinson Road, #30-01 Capital Tower, Singapore 068912
Tel: (65) 6713 2888, Fax: (65) 6713 2999