CapitaLand Receives ETL from SGX-ST to List its Integrated ...
39
CapitaLand Receives ETL from SGX-ST to List its Integrated Shopping Mall Business Transaction to be Tabled at EGM for Shareholders’ Approval NOT FOR DISTRIBUTION, DIRECTLY OR INDIRECTLY, IN OR INTO THE UNITED STATES 5 October 2009
Transcript of CapitaLand Receives ETL from SGX-ST to List its Integrated ...
CapitaLand Receives ETL from SGX-ST to List itsIntegrated Shopping Mall Business
Transaction to be Tabled at EGM for Shareholders’ Approval
NOT FOR DISTRIBUTION, DIRECTLY OR INDIRECTLY, IN OR INTO THE UNITED STATES
5 October 2009
NOT FOR DISTRIBUTION, DIRECTLY OR INDIRECTLY, IN OR INTO THE UNITED STATES
This presentation is for information purposes only and is prepared solely for the purpose of providing shareholders of CapitaLand Limited with information withrespect to the matters for which their approval is being sought at the Extraordinary General Meeting to be convened. This presentation does not constitute orform part of an offer, solicitation or invitation of any offer, to buy or subscribe for any securities, nor should it or any part of it form the basis of, or be relied inany connection with, any contract or commitment whatsoever to purchase or subscribe for shares or other securities in CapitaLand Limited, CapitaMalls AsiaLimited or any entity within or which is managed by the CapitaLand Limited group of companies (the "CapitaLand Group"). This presentation should not berelied upon as the basis of an investment decision in such shares or securities.
The information contained in this presentation has not been independently verified. No representation or warranty expressed or implied is made as to, and noreliance should be placed on, the fairness, accuracy, completeness or correctness of the information or opinions contained in this presentation. NeitherCapitaLand Limited, CapitaMalls Asia Limited or any company within the CapitaLand Group, J.P. Morgan (S.E.A.) Limited, nor DBS Bank Ltd, or any of theirrespective affiliates, advisers or representatives shall have any liability whatsoever (in negligence or otherwise) for any loss howsoever arising, whether directlyor indirectly, from any use, reliance or distribution of this presentation or its contents or otherwise arising in connection with this presentation.
This presentation may contain forward-looking statements that involve risks, uncertainties and other factors. Actual results, performance or achievements of the
Important
11
This presentation may contain forward looking statements that involve risks, uncertainties and other factors. Actual results, performance or achievements of thecompanies described therein may be materially different from any future results, performance or achievements expressed or implied by such forward-lookingstatements. Such forward-looking statements are based on numerous assumptions regarding the present and future business strategies and the environment inwhich the companies described herein will operate in the future, and must be read together with such assumptions. Predictions, projections or forecasts of theeconomy or economic trends of the markets are not necessarily indicative of the future or likely performance of these companies. Past performance is notnecessarily indicative of future performance. The future financial performance of the companies described herein is not guaranteed. You are cautioned not toplace undue reliance on these forward-looking statements.
This presentation is not an offer for sale of the securities in the United States or elsewhere. Shares in CapitaMalls Asia Limited may not be offered or sold in theUnited States absent registration or an exemption from registration under the U.S. Securities Act of 1933, as amended (the Securities Act). Any public offeringof securities of CapitaMalls Asia Limited in the United States would be made by means of a prospectus that would contain detailed information about thecompany and its management, as well as financial statements. CapitaLand Limited does not intend to register any portion of the offering in the United States orto conduct a public offering of securities in the United States.
This presentation may not be forwarded or distributed to any other person and may not be copied or reproduced in any manner whatsoever. Failure to complywith this directive may result in a violation of applicable laws of other jurisdictions.

Transaction Summary
NOT FOR DISTRIBUTION, DIRECTLY OR INDIRECTLY, IN OR INTO THE UNITED STATES
Transaction Summary
NOT FOR DISTRIBUTION, DIRECTLY OR INDIRECTLY, IN OR INTO THE UNITED STATES
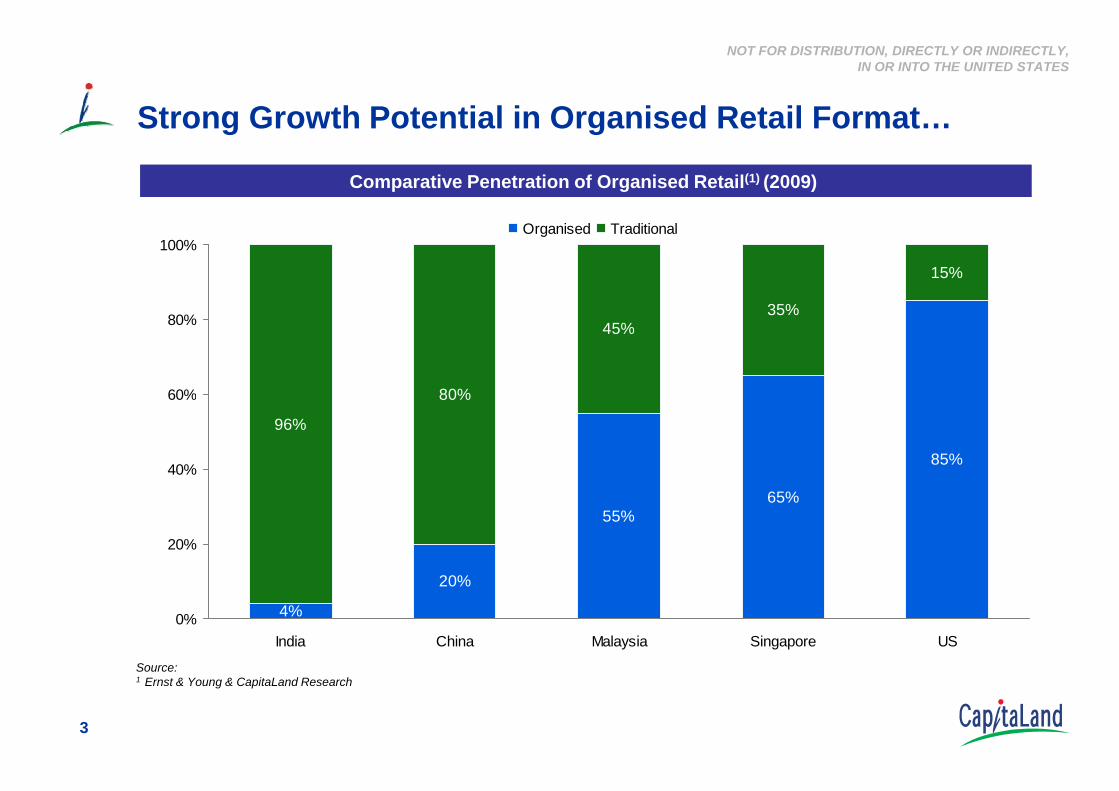
Strong Growth Potential in Organised Retail Format…
80%
45%35%
15%
60%
80%
100%Organised Traditional
Comparative Penetration of Organised Retail(1) (2009)
3
4%
20%
55%65%
85%
96%
80%
0%
20%
40%
60%
India China Malaysia Singapore US
Source:1 Ernst & Young & CapitaLand Research
NOT FOR DISTRIBUTION, DIRECTLY OR INDIRECTLY, IN OR INTO THE UNITED STATES
…and High Growth Potential in Asia Retail Real Estate
Asia represents approximately 57% of the world’s population
Economic growth driving affluence & consumer spending power
4
Asia offers good potential for increase in retail space per capita
Capital appreciation potential for markets like China and India

NOT FOR DISTRIBUTION, DIRECTLY OR INDIRECTLY, IN OR INTO THE UNITED STATES
Proposed Listing of CapitaLand’s Integrated Shopping Mall Business
Real Estate
Australia Residential S’pore China Commercial ILEC
Hospitality Fin. Svcs
Serviced Residences FinancialRetail
29.83% (1)
55
CapitaLand intends to list its integrated shopping mall business(2), including its retail real estate business and its retail real estate fund and REIT management business
CapitaLand will retain majority control in CMA post listing and for the foreseeable future
1
Denotes listed entities
Effective interest 26.98% (1)
Fund & REITManagement
Retail Fund & REIT management
2
1 Stakes in CMT and CRCT as of 30 September 2009 2 Subject to EGM and prevailing market conditions
NOT FOR DISTRIBUTION, DIRECTLY OR INDIRECTLY, IN OR INTO THE UNITED STATES
Overview
66
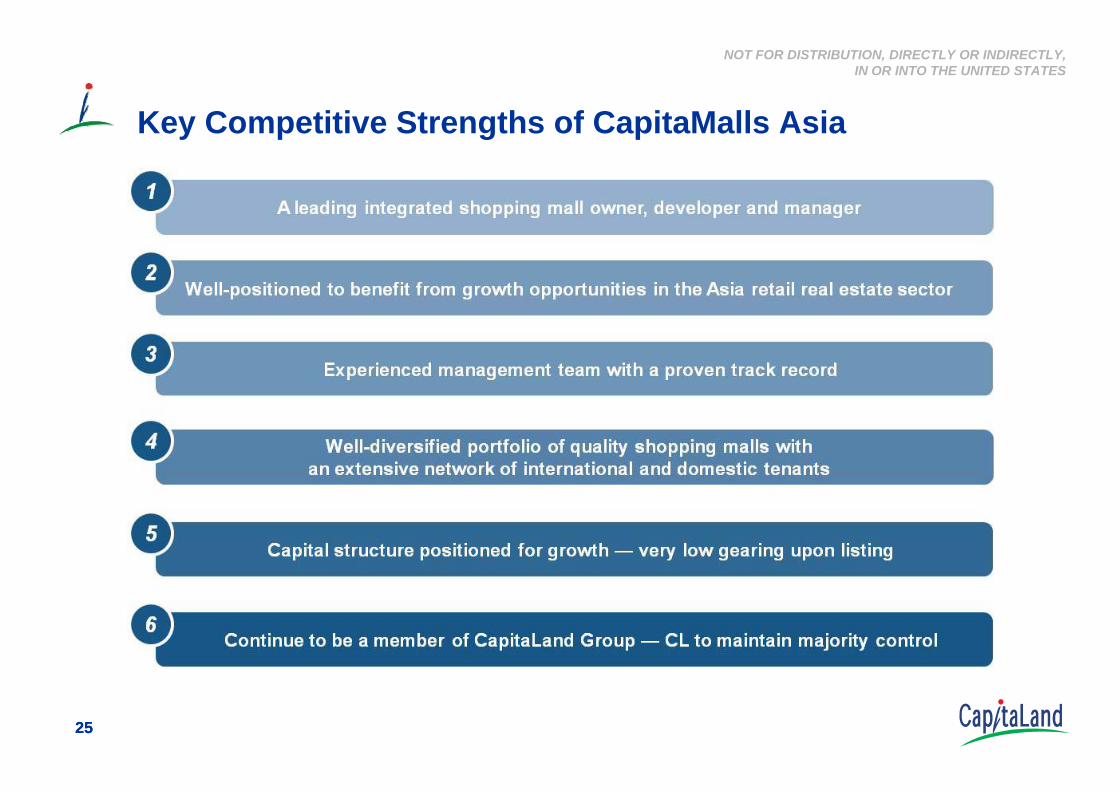
Pan-Asian shopping mall portfolio
Unique integrated shopping mall business model
Direct capture of high growth Asian consumer trends
Proven track record
Balanced portfolio with China developments providing growth
Capital structure positioned to seize growth opportunities
NOT FOR DISTRIBUTION, DIRECTLY OR INDIRECTLY, IN OR INTO THE UNITED STATES
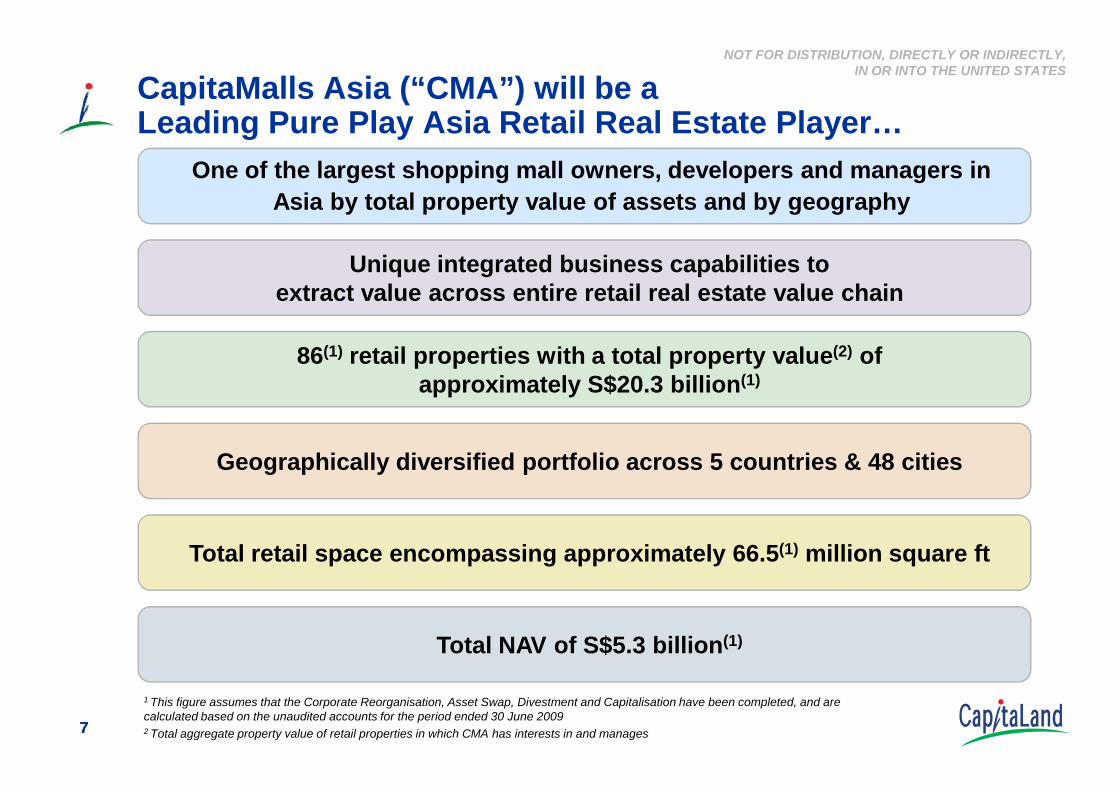
CapitaMalls Asia (“CMA”) will be aLeading Pure Play Asia Retail Real Estate Player…
One of the largest shopping mall owners, developers and managers in Asia by total property value of assets and by geography
86(1) retail properties with a total property value(2) of approximately S$20.3 billion(1)
Unique integrated business capabilities toextract value across entire retail real estate value chain
77
pp y
Geographically diversified portfolio across 5 countries & 48 cities
Total retail space encompassing approximately 66.5(1) million square ft
1 This figure assumes that the Corporate Reorganisation, Asset Swap, Divestment and Capitalisation have been completed, and arecalculated based on the unaudited accounts for the period ended 30 June 20092 Total aggregate property value of retail properties in which CMA has interests in and manages
Total NAV of S$5.3 billion(1)
NOT FOR DISTRIBUTION, DIRECTLY OR INDIRECTLY, IN OR INTO THE UNITED STATES
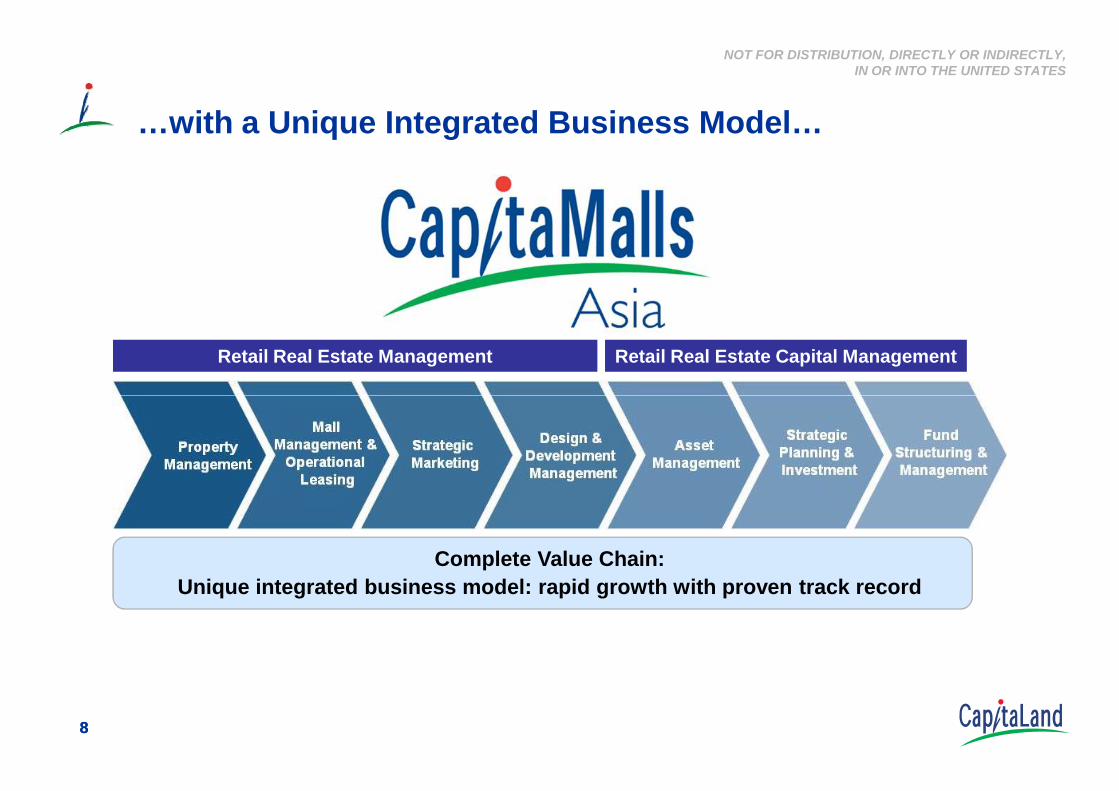
…with a Unique Integrated Business Model…
Retail Real Estate Management Retail Real Estate Capital Management
88
Complete Value Chain:Unique integrated business model: rapid growth with proven track record

NOT FOR DISTRIBUTION, DIRECTLY OR INDIRECTLY, IN OR INTO THE UNITED STATES
…and Established Presence in Asia…
Udaip r
Jalandhar
Osaka
Hokkaido
TokyoKobeAnyang
Beijing
Ch h
Chengdu
Dalian
Deyang
Harbin
Hangzhou
Hohhot
Kunshan
Mianyang
Shanghai
Tianjin
Weifang
Wuhan Wuhu
Xinxiang
Yangzhou
Yibin Yiyang
Zibo
Zhengzhou
Rizhao
Xi’an
99
Singapore
Penang
Kuala Lumpur
Udaipur
Nagpur
Hyderabad
Cochin
Mysore
BangaloreMangalore
ChangshaChongqing
Dongguan
Foshan
Maoming
Nanchang
Quanzhou
ZhangzhouZhanjiang Zhaoqing Singapore
ChinaMalaysia
Japan
India
Pan-Asian Presence

NOT FOR DISTRIBUTION, DIRECTLY OR INDIRECTLY, IN OR INTO THE UNITED STATES
…with a Proven Track Record…
1.2 1.8 3.5 4.9 6.9 7.01.3 1.1
Dec-02 Dec-03 Dec-04 Dec-05 Dec-06 Dec-07 Dec-08 Jun-09
1.8 2.7 3.15.2
11.313.3
19.4 20.3
Effective interest in the
property values of CMA’s portfolio
Aggregate property value in which CMA has interest in and manage
As at
10
As of 31 December 2002 As of 30 June 2009 Number of retail property 5 86(4)(5) Staff 182 people 2,764 people Total property value (100% basis)(1) S$1.8 billion S$20.3 billion(6) Total property value (effective interest)(2) S$1.2 billion S$7.0 billion(6) Location of our asset interest Singapore Singapore, China, Malaysia, Japan, India GFA (square feet)(3 2.4 million 66.5 million(6)
Properties
Employees 182
5 10 10 24
659
55 78 96
2,764
86
Notes: (1) 100% basis refers to the aggregate property values of each property in the portfolio in its entirety.(2) Effective interest refers to the property values proportionate to CMA ownership interest in the properties. (3) The aggregate GFA of each property in the portfolio in its entirety.(4) The decrease from 96 retail properties in 2008 to 86 retail properties as of 30 June 2009 is primarily due to the Asset Swap and Divestment and Corporate Reorganisation . (5) Excludes interest in Horizon Realty Fund, which CMA does not manage, our investment in The Link REIT, and management of VivoCity, Singapore in which CMA do not have any ownership interest.(6) This figure assumes that the Corporate Reorganisation, Asset Swap, Divestment and Capitalisation have been completed, and are calculated based on the unaudited accounts for the period ended 30 June 2009.
NOT FOR DISTRIBUTION, DIRECTLY OR INDIRECTLY, IN OR INTO THE UNITED STATES
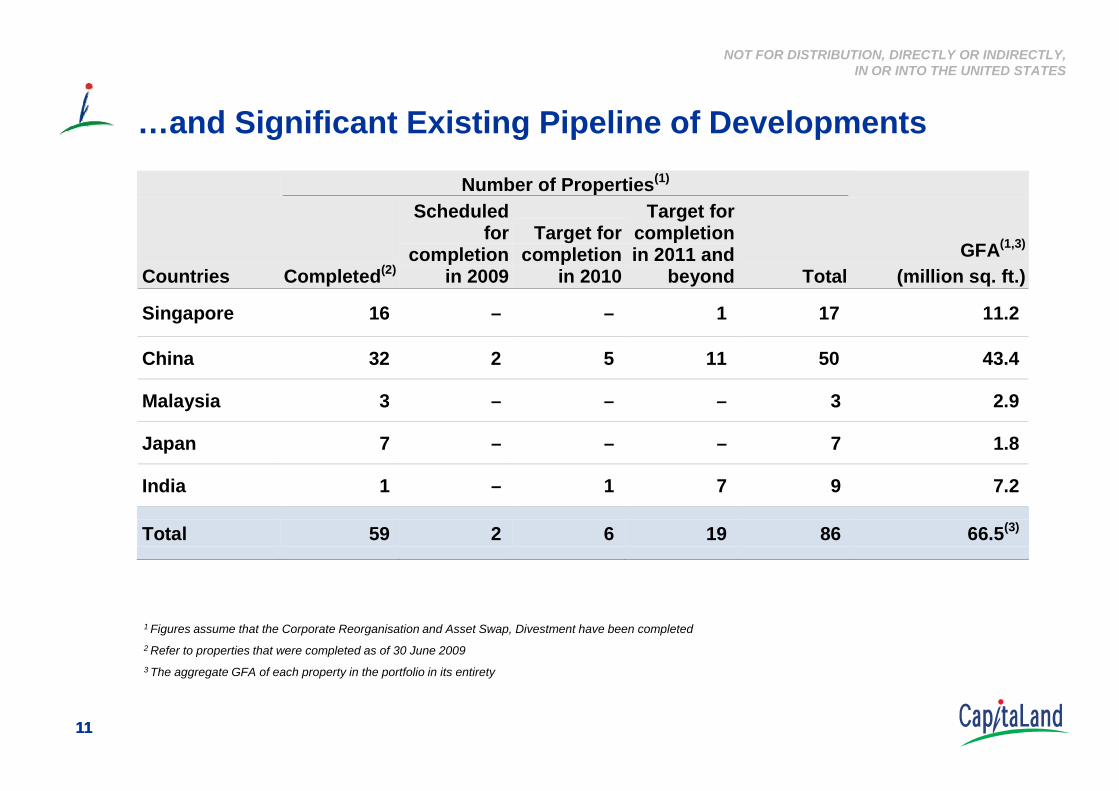
…and Significant Existing Pipeline of Developments
Number of Properties(1)
Countries Completed(2)
Scheduled for
completion in 2009
Target for completion
in 2010
Target for completion in 2011 and
beyond Total GFA(1,3)
(million sq. ft.)
Singapore 16 – – 1 17 11.2
China 32 2 5 11 50 43.4
M l i 3 3 2 9
1111
Malaysia 3 – – – 3 2.9
Japan 7 – – – 7 1.8
India 1 – 1 7 9 7.2
Total 59 2 6 19 86 66.5(3)
1 Figures assume that the Corporate Reorganisation and Asset Swap, Divestment have been completed2 Refer to properties that were completed as of 30 June 2009 3 The aggregate GFA of each property in the portfolio in its entirety
Transaction Rationale
NOT FOR DISTRIBUTION, DIRECTLY OR INDIRECTLY, IN OR INTO THE UNITED STATES
Transaction Rationale
NOT FOR DISTRIBUTION, DIRECTLY OR INDIRECTLY, IN OR INTO THE UNITED STATES
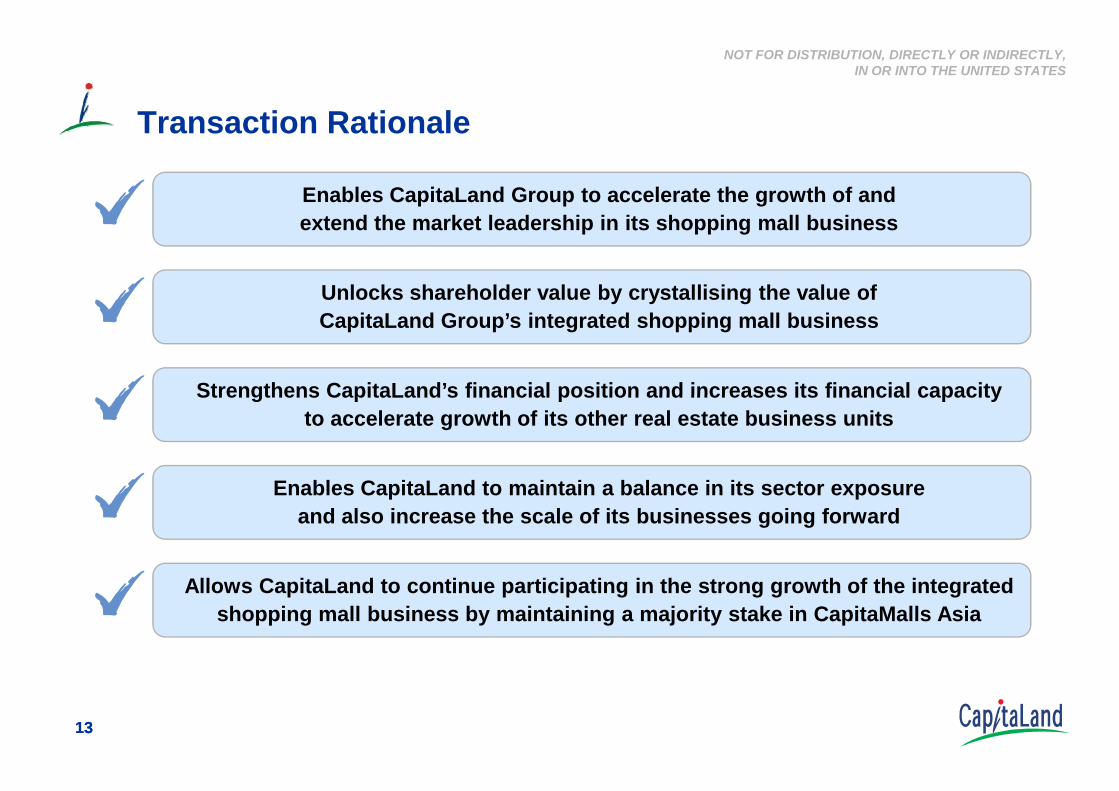
Transaction Rationale
Unlocks shareholder value by crystallising the value ofCapitaLand Group’s integrated shopping mall business
Strengthens CapitaLand’s financial position and increases its financial capacity
Enables CapitaLand Group to accelerate the growth of andextend the market leadership in its shopping mall business
1313
Strengthens CapitaLand s financial position and increases its financial capacity to accelerate growth of its other real estate business units
Allows CapitaLand to continue participating in the strong growth of the integrated shopping mall business by maintaining a majority stake in CapitaMalls Asia
Enables CapitaLand to maintain a balance in its sector exposureand also increase the scale of its businesses going forward

NOT FOR DISTRIBUTION, DIRECTLY OR INDIRECTLY, IN OR INTO THE UNITED STATES
Accelerates Growth of Shopping Mall Business 1
Significant financial capacity to seize opportunities in
Significant debt capacity(1)A
Direct access to the capital markets B
1414
Asia’s retail real estate sector, with primary focus in China
1 Assuming a net debt to equity ratio of 0.3 to 0.5, this will represent a potential debt capacity of approximately S$1.6 billion to S$2.6 billion
Acquisition of land for greenfield projects
Acquisition of completed malls
Asset enhancement initiatives
Asia wide M&A “roll-up” strategy
NOT FOR DISTRIBUTION, DIRECTLY OR INDIRECTLY, IN OR INTO THE UNITED STATES
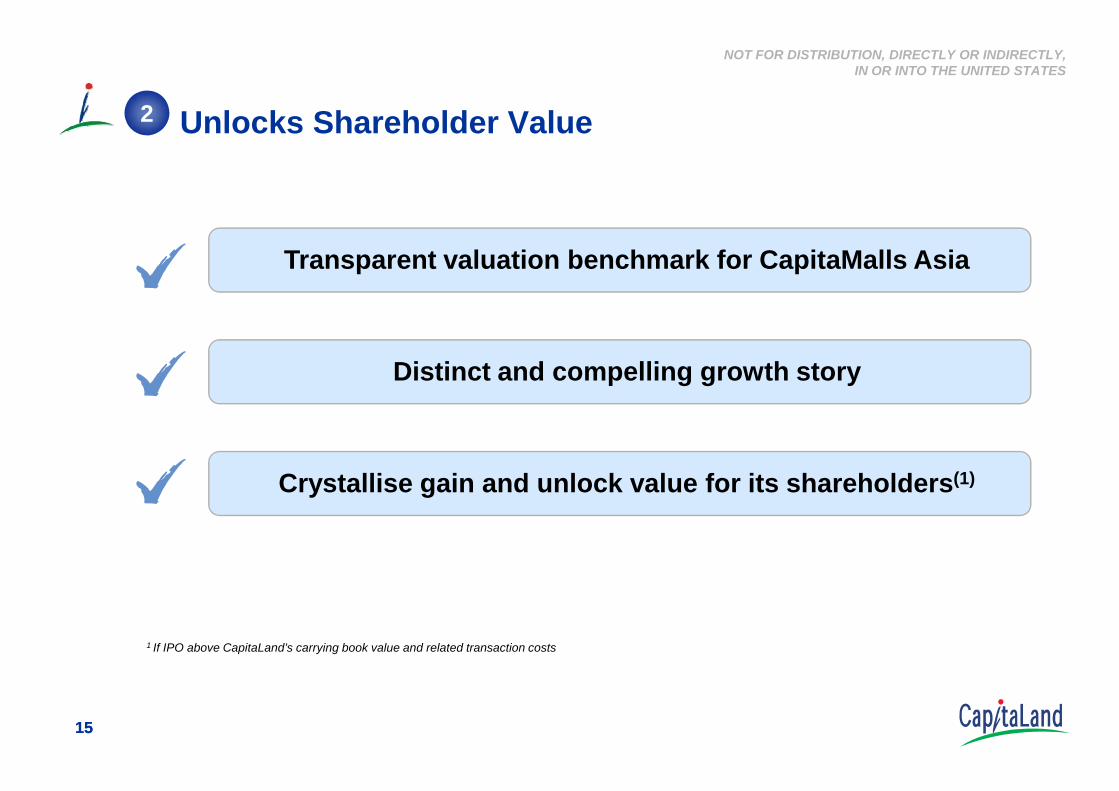
Unlocks Shareholder Value
Transparent valuation benchmark for CapitaMalls Asia
Distinct and compelling growth story
2
1515
Crystallise gain and unlock value for its shareholders(1)
1 If IPO above CapitaLand’s carrying book value and related transaction costs
NOT FOR DISTRIBUTION, DIRECTLY OR INDIRECTLY, IN OR INTO THE UNITED STATES
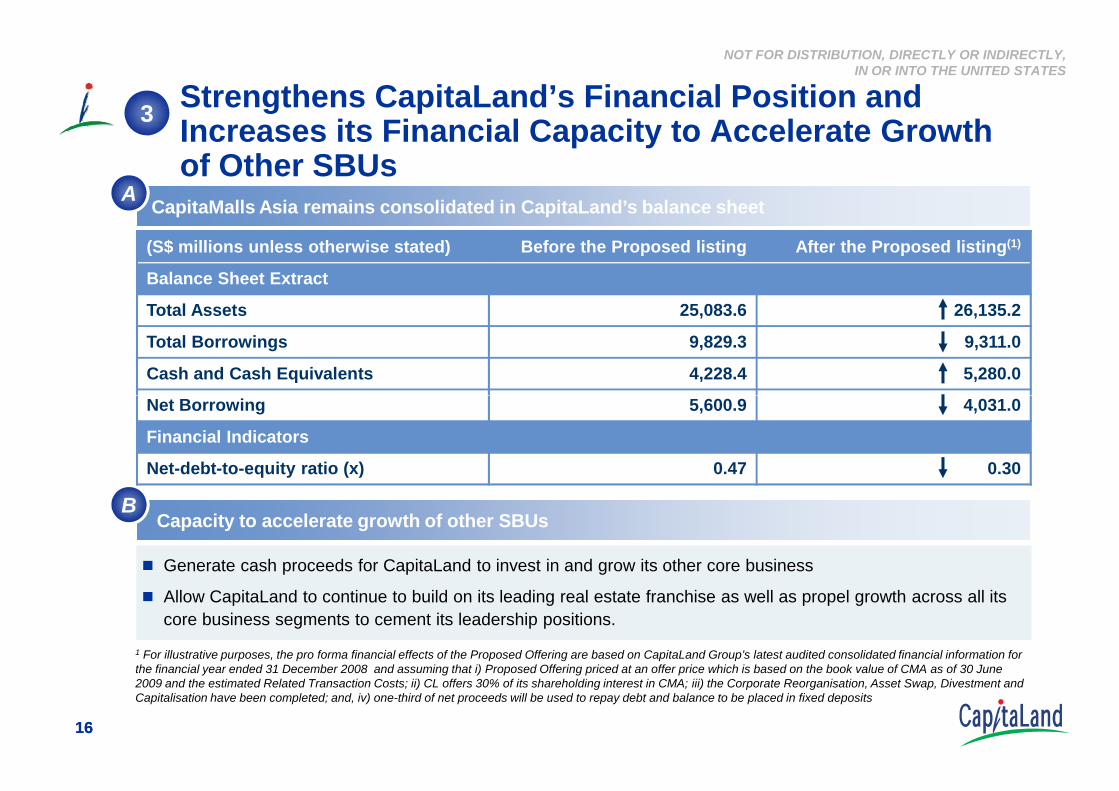
Strengthens CapitaLand’s Financial Position and Increases its Financial Capacity to Accelerate Growth of Other SBUs Cash
CapitaMalls Asia remains consolidated in CapitaLand’s balance sheet
3
A
(S$ millions unless otherwise stated) Before the Proposed listing After the Proposed listing(1)
Balance Sheet Extract
Total Assets 25,083.6 26,135.2
Total Borrowings 9,829.3 9,311.0
Cash and Cash Equivalents 4,228.4 5,280.0
1616
Capacity to accelerate growth of other SBUs
Generate cash proceeds for CapitaLand to invest in and grow its other core business
Allow CapitaLand to continue to build on its leading real estate franchise as well as propel growth across all its core business segments to cement its leadership positions.
B
Net Borrowing 5,600.9 4,031.0
Financial Indicators
Net-debt-to-equity ratio (x) 0.47 0.30
1 For illustrative purposes, the pro forma financial effects of the Proposed Offering are based on CapitaLand Group’s latest audited consolidated financial information for the financial year ended 31 December 2008 and assuming that i) Proposed Offering priced at an offer price which is based on the book value of CMA as of 30 June 2009 and the estimated Related Transaction Costs; ii) CL offers 30% of its shareholding interest in CMA; iii) the Corporate Reorganisation, Asset Swap, Divestment and Capitalisation have been completed; and, iv) one-third of net proceeds will be used to repay debt and balance to be placed in fixed deposits
NOT FOR DISTRIBUTION, DIRECTLY OR INDIRECTLY, IN OR INTO THE UNITED STATES
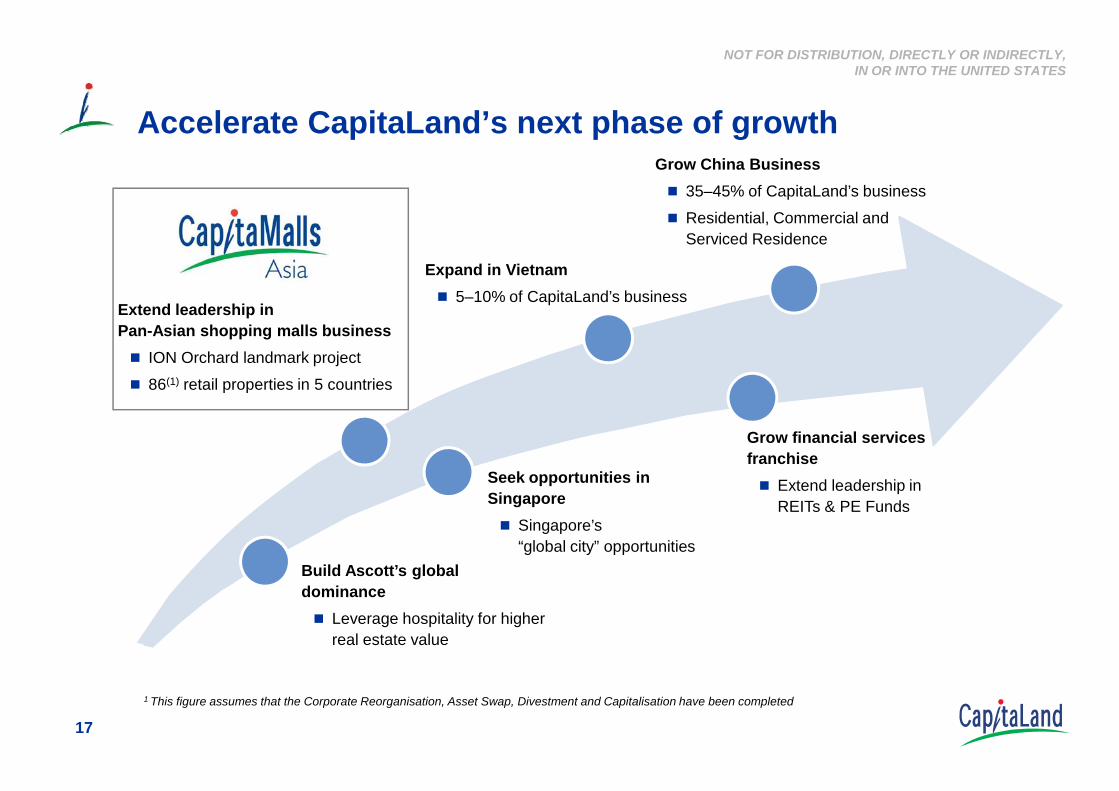
Accelerate CapitaLand’s next phase of growth
Extend leadership in Pan-Asian shopping malls business
ION Orchard landmark project
86(1) retail properties in 5 countries
Expand in Vietnam5–10% of CapitaLand’s business
Grow China Business35–45% of CapitaLand’s business
Residential, Commercial and Serviced Residence
17
Build Ascott’s global dominance
Leverage hospitality for higher real estate value
Seek opportunities in Singapore
Singapore’s “global city” opportunities
Grow financial services franchise
Extend leadership in REITs & PE Funds
1 This figure assumes that the Corporate Reorganisation, Asset Swap, Divestment and Capitalisation have been completed
NOT FOR DISTRIBUTION, DIRECTLY OR INDIRECTLY, IN OR INTO THE UNITED STATES
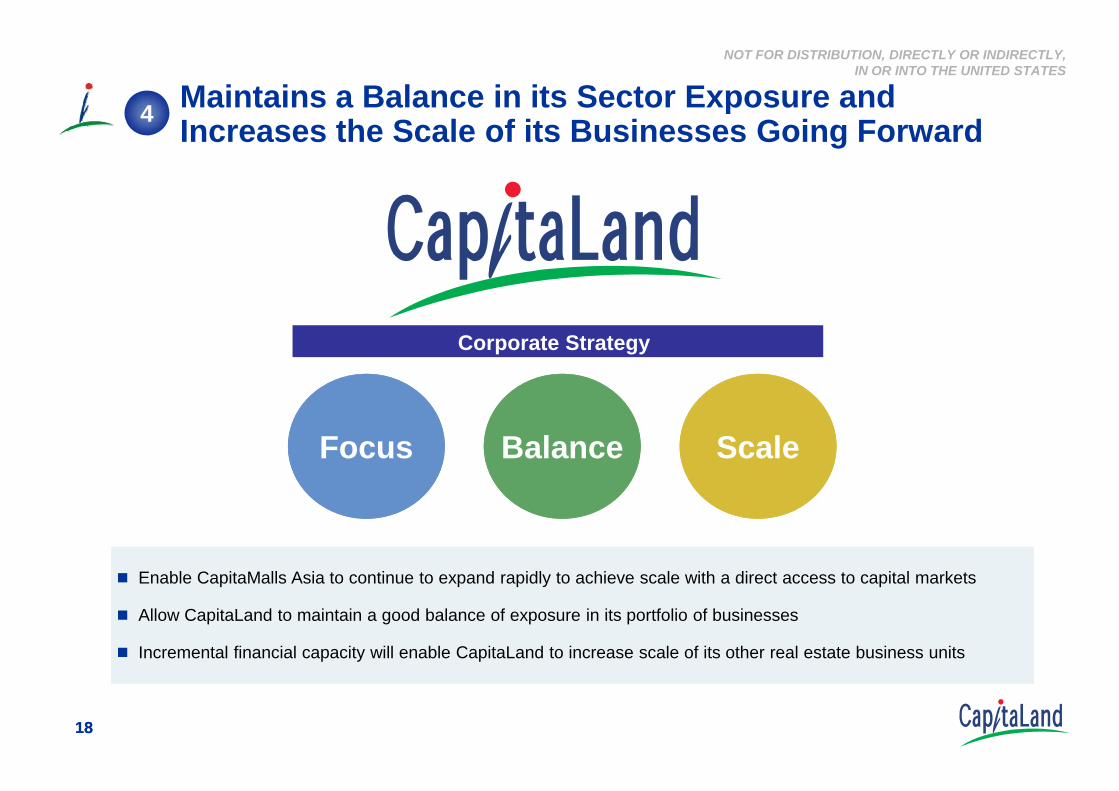
Maintains a Balance in its Sector Exposure and Increases the Scale of its Businesses Going Forward
Corporate Strategy
4
1818
Focus ScaleBalance
Enable CapitaMalls Asia to continue to expand rapidly to achieve scale with a direct access to capital markets
Allow CapitaLand to maintain a good balance of exposure in its portfolio of businesses
Incremental financial capacity will enable CapitaLand to increase scale of its other real estate business units
NOT FOR DISTRIBUTION, DIRECTLY OR INDIRECTLY, IN OR INTO THE UNITED STATES
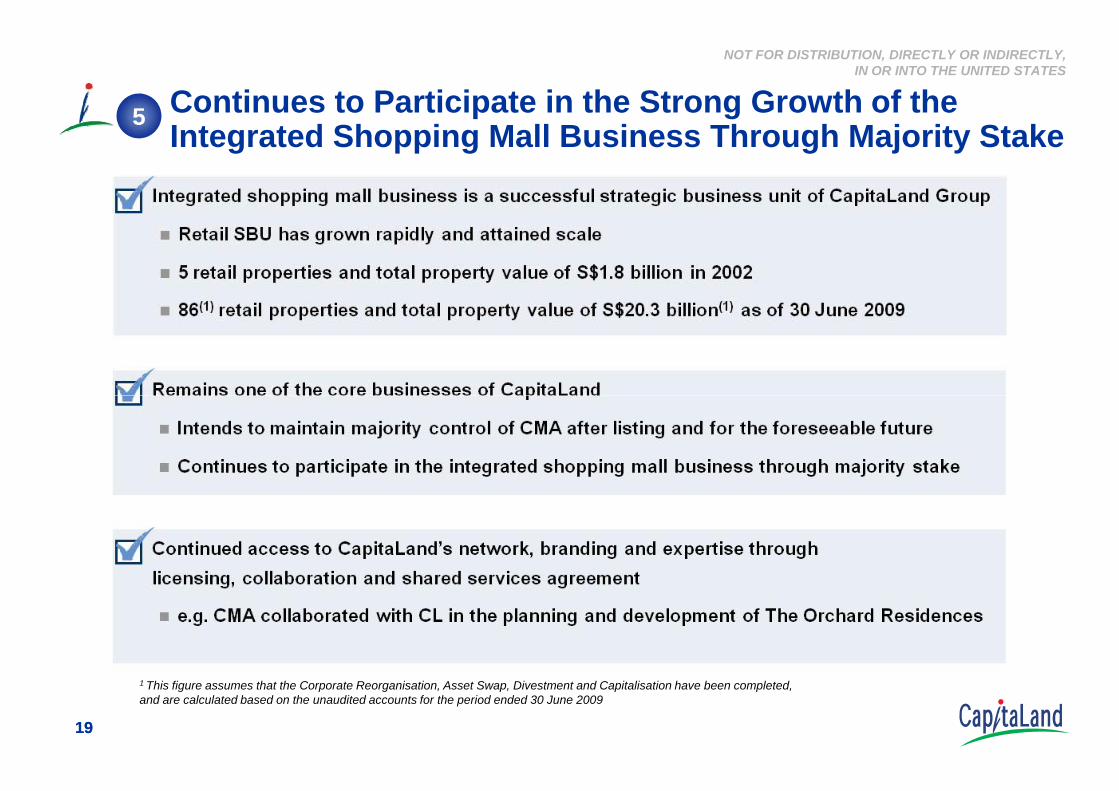
Continues to Participate in the Strong Growth of theIntegrated Shopping Mall Business Through Majority Stake
5
1919
1 This figure assumes that the Corporate Reorganisation, Asset Swap, Divestment and Capitalisation have been completed, and are calculated based on the unaudited accounts for the period ended 30 June 2009
NOT FOR DISTRIBUTION, DIRECTLY OR INDIRECTLY, IN OR INTO THE UNITED STATES
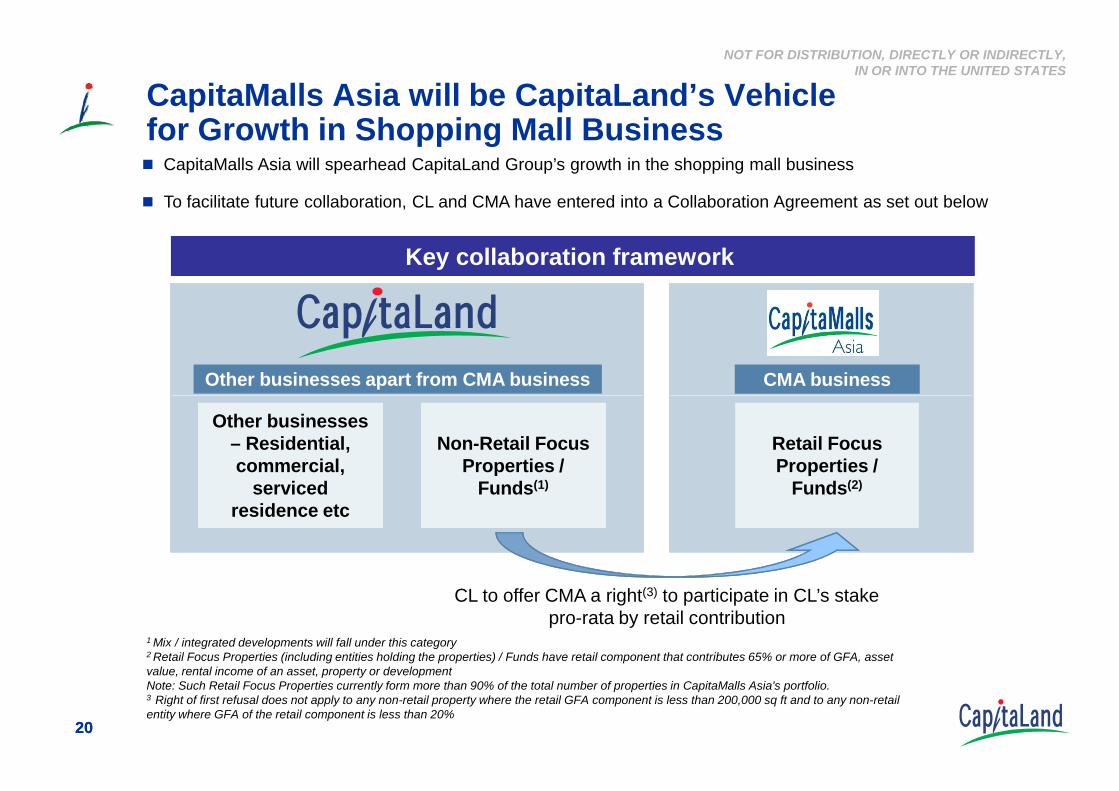
CapitaMalls Asia will be CapitaLand’s Vehiclefor Growth in Shopping Mall Business
CapitaMalls Asia will spearhead CapitaLand Group’s growth in the shopping mall business
To facilitate future collaboration, CL and CMA have entered into a Collaboration Agreement as set out below
Key collaboration framework
Other businesses apart from CMA business CMA business
2020
Retail Focus Properties /
Funds(2)
Other businesses – Residential, commercial,
serviced residence etc
Non-Retail Focus Properties /
Funds(1)
CL to offer CMA a right(3) to participate in CL’s stake pro-rata by retail contribution
1 Mix / integrated developments will fall under this category 2 Retail Focus Properties (including entities holding the properties) / Funds have retail component that contributes 65% or more of GFA, asset value, rental income of an asset, property or development Note: Such Retail Focus Properties currently form more than 90% of the total number of properties in CapitaMalls Asia's portfolio. 3 Right of first refusal does not apply to any non-retail property where the retail GFA component is less than 200,000 sq ft and to any non-retail entity where GFA of the retail component is less than 20%

NOT FOR DISTRIBUTION, DIRECTLY OR INDIRECTLY, IN OR INTO THE UNITED STATES
Potential Special Dividend
Upon the successful listing of CMA, the board of Directors may consider recommending a special dividend to CL shareholders, after taking into account:
The gain arising from the planned listing;
The overall cash position;
The net debt-to-equity ratio; and
2121
The growth strategies of other CapitaLand business units and their capital requirements
CapitaLand’s priority is to continue the growth of its business units
NOT FOR DISTRIBUTION, DIRECTLY OR INDIRECTLY, IN OR INTO THE UNITED STATES
Transaction Summary for CapitaLand
Unlock shareholder value
Increase overall financial capacity and flexibility of CapitaLand Groupto accelerate the growth of its other strategic business units
Accelerate growth of shopping mall business
2222
Achieve a balanced exposure in its business units
Increase scale of its business going forwardwhile still maintaining a conservative capital structure
Consistent with CapitaLand’s approach of optimising business growth with prudent capital management

Key highlights of CMA
NOT FOR DISTRIBUTION, DIRECTLY OR INDIRECTLY, IN OR INTO THE UNITED STATES
Key highlights of CMA
NOT FOR DISTRIBUTION, DIRECTLY OR INDIRECTLY, IN OR INTO THE UNITED STATES
2424
NOT FOR DISTRIBUTION, DIRECTLY OR INDIRECTLY, IN OR INTO THE UNITED STATES
Key Competitive Strengths of CapitaMalls Asia
2525
NOT FOR DISTRIBUTION, DIRECTLY OR INDIRECTLY, IN OR INTO THE UNITED STATES
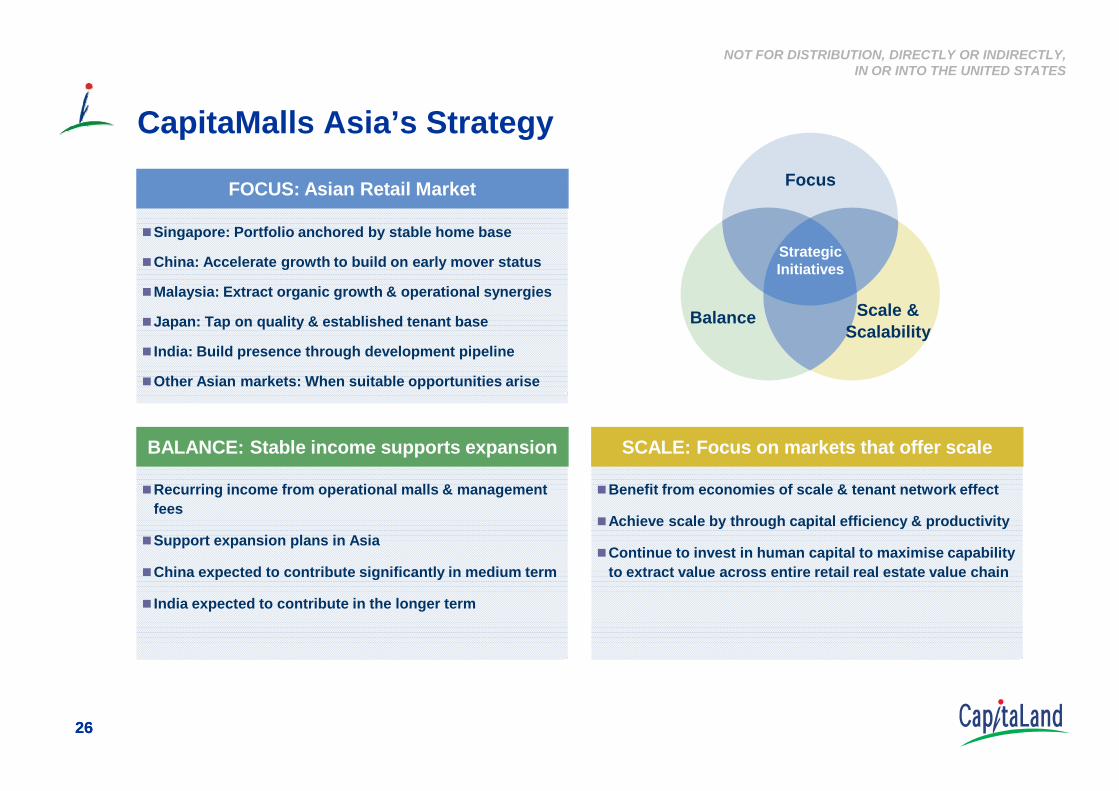
CapitaMalls Asia’s Strategy
Strategic Initiatives
Focus
Balance Scale &Scalability
Singapore: Portfolio anchored by stable home base
China: Accelerate growth to build on early mover status
Malaysia: Extract organic growth & operational synergies
Japan: Tap on quality & established tenant base
India: Build presence through development pipeline
Other Asian markets: When suitable opportunities arise
FOCUS: Asian Retail Market
2626
Recurring income from operational malls & management fees
Support expansion plans in Asia
China expected to contribute significantly in medium term
India expected to contribute in the longer term
Benefit from economies of scale & tenant network effect
Achieve scale by through capital efficiency & productivity
Continue to invest in human capital to maximise capability to extract value across entire retail real estate value chain
BALANCE: Stable income supports expansion SCALE: Focus on markets that offer scale
NOT FOR DISTRIBUTION, DIRECTLY OR INDIRECTLY, IN OR INTO THE UNITED STATES
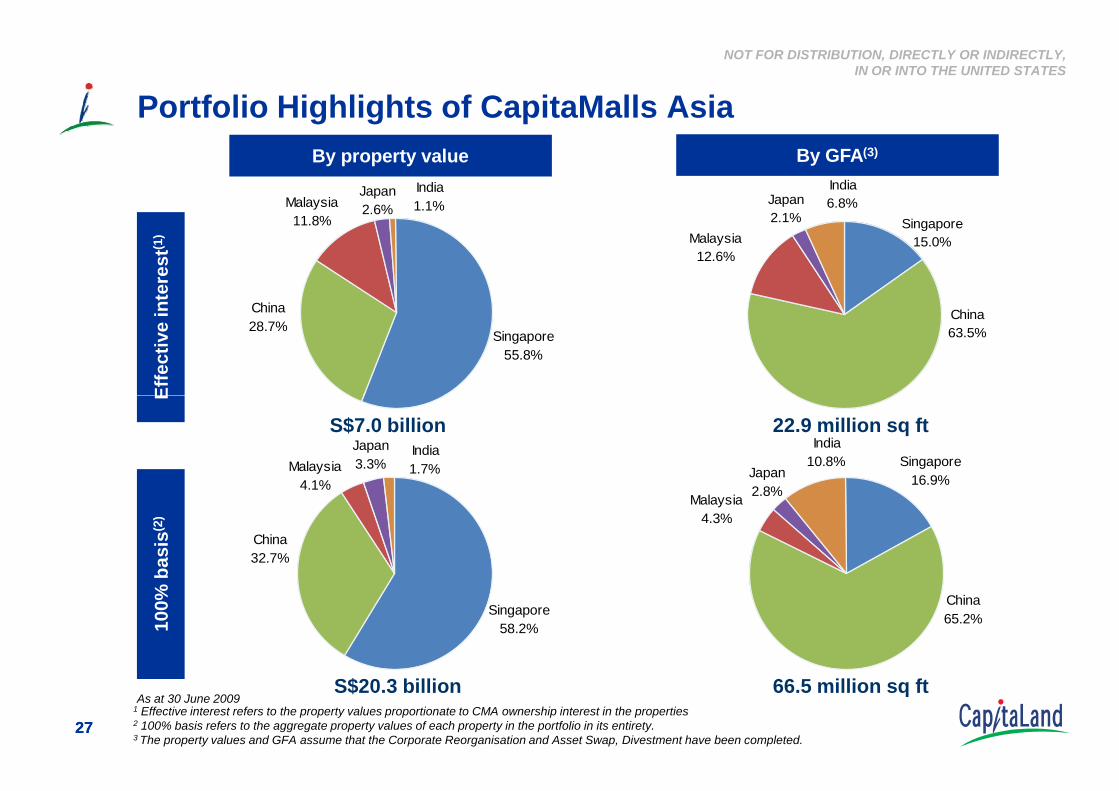
Singapore15.0%Malaysia
12.6%
India6.8%Japan
2.1%
China63.5%
Portfolio Highlights of CapitaMalls AsiaEf
fect
ive
inte
rest
(1)
By property value By GFA(3)
Singapore55.8%
Malaysia11.8%
India1.1%
Japan2.6%
China28.7%
2727
As at 30 June 20091 Effective interest refers to the property values proportionate to CMA ownership interest in the properties2 100% basis refers to the aggregate property values of each property in the portfolio in its entirety.3 The property values and GFA assume that the Corporate Reorganisation and Asset Swap, Divestment have been completed.
E10
0% b
asis
(2)
Singapore58.2%
Malaysia4.1%
India1.7%
Japan3.3%
China32.7%
S$20.3 billion
Singapore16.9%
Malaysia4.3%
India10.8%
Japan2.8%
China65.2%
22.9 million sq ft
66.5 million sq ft
S$7.0 billion
NOT FOR DISTRIBUTION, DIRECTLY OR INDIRECTLY, IN OR INTO THE UNITED STATES
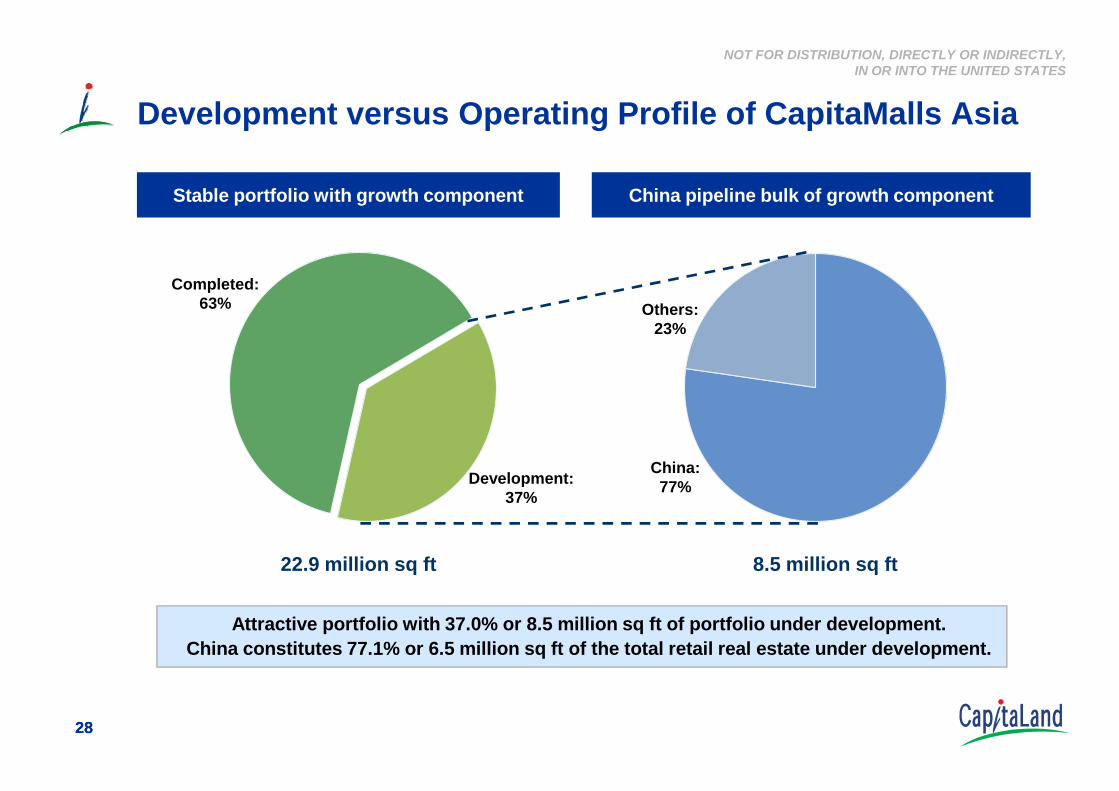
Development versus Operating Profile of CapitaMalls Asia
Stable portfolio with growth component China pipeline bulk of growth component
Completed: 63% Others:
23%
2828
Attractive portfolio with 37.0% or 8.5 million sq ft of portfolio under development.China constitutes 77.1% or 6.5 million sq ft of the total retail real estate under development.
22.9 million sq ft 8.5 million sq ft
Development: 37%
China: 77%
NOT FOR DISTRIBUTION, DIRECTLY OR INDIRECTLY, IN OR INTO THE UNITED STATES
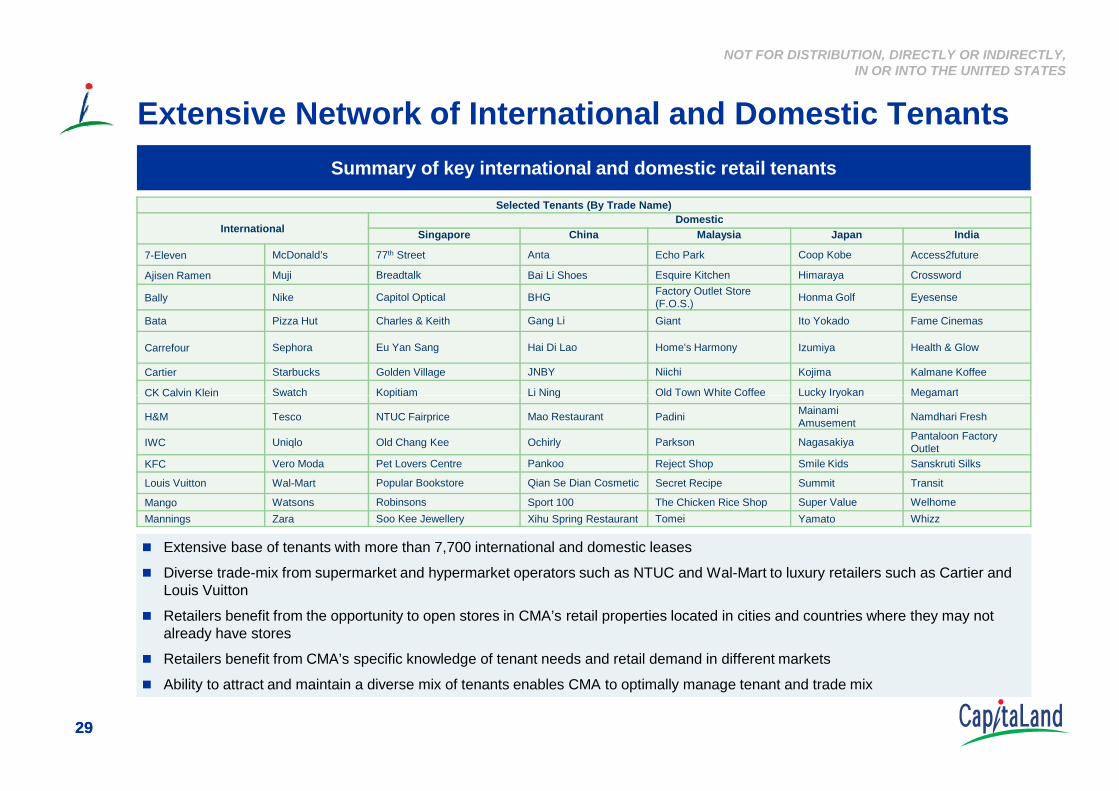
Extensive Network of International and Domestic Tenants Summary of key international and domestic retail tenants
Selected Tenants (By Trade Name)
InternationalDomestic
Singapore China Malaysia Japan India
7-Eleven McDonald’s 77th Street Anta Echo Park Coop Kobe Access2future
Ajisen Ramen Muji Breadtalk Bai Li Shoes Esquire Kitchen Himaraya Crossword
Bally Nike Capitol Optical BHG Factory Outlet Store (F.O.S.) Honma Golf Eyesense
Bata Pizza Hut Charles & Keith Gang Li Giant Ito Yokado Fame Cinemas
Carrefour Sephora Eu Yan Sang Hai Di Lao Home's Harmony Izumiya Health & Glow
Cartier Starbucks Golden Village JNBY Niichi Kojima Kalmane Koffee
CK Calvin Klein Swatch Kopitiam Li Ning Old Town White Coffee Lucky Iryokan Megamart
2929
Extensive base of tenants with more than 7,700 international and domestic leases
Diverse trade-mix from supermarket and hypermarket operators such as NTUC and Wal-Mart to luxury retailers such as Cartier and Louis Vuitton
Retailers benefit from the opportunity to open stores in CMA’s retail properties located in cities and countries where they may not already have stores
Retailers benefit from CMA’s specific knowledge of tenant needs and retail demand in different markets
Ability to attract and maintain a diverse mix of tenants enables CMA to optimally manage tenant and trade mix
CK Calvin Klein Swatch Kopitiam Li Ning Old Town White Coffee Lucky Iryokan Megamart
H&M Tesco NTUC Fairprice Mao Restaurant Padini Mainami Amusement Namdhari Fresh
IWC Uniqlo Old Chang Kee Ochirly Parkson Nagasakiya Pantaloon Factory Outlet
KFC Vero Moda Pet Lovers Centre Pankoo Reject Shop Smile Kids Sanskruti Silks
Louis Vuitton Wal-Mart Popular Bookstore Qian Se Dian Cosmetic Secret Recipe Summit Transit
Mango Watsons Robinsons Sport 100 The Chicken Rice Shop Super Value WelhomeMannings Zara Soo Kee Jewellery Xihu Spring Restaurant Tomei Yamato Whizz
NOT FOR DISTRIBUTION, DIRECTLY OR INDIRECTLY, IN OR INTO THE UNITED STATES
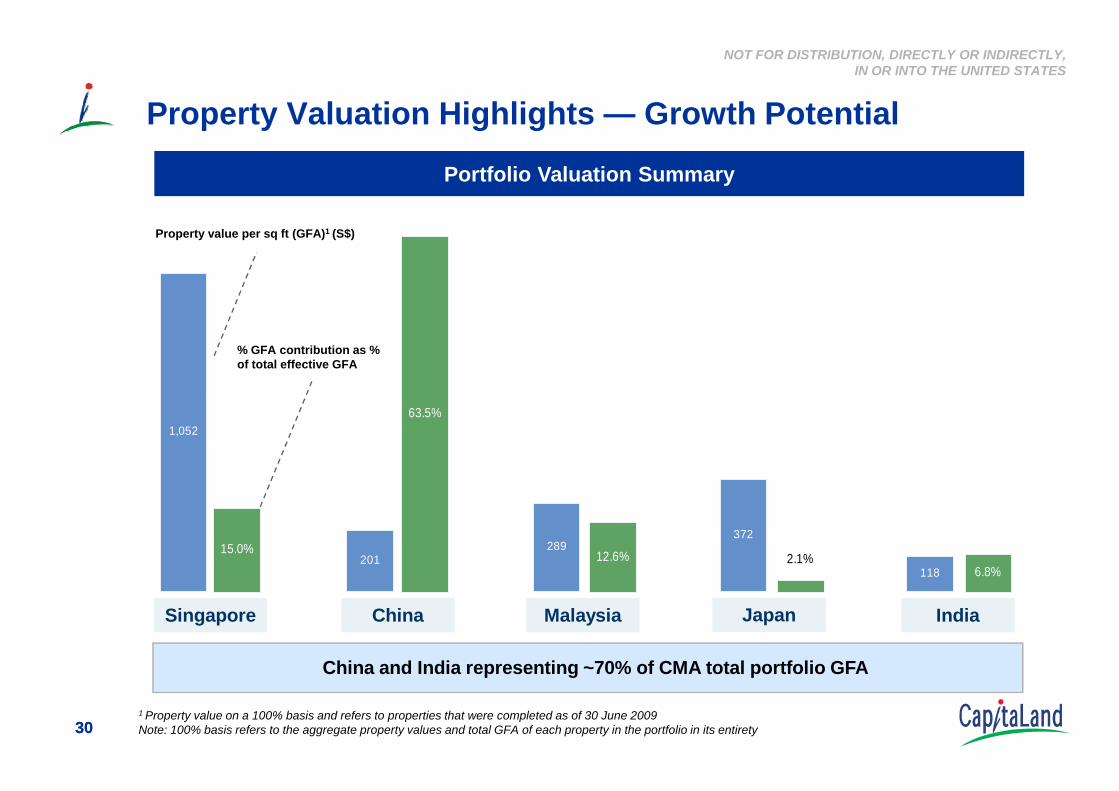
Property Valuation Highlights — Growth Potential
Property value per sq ft (GFA)1 (S$)
% GFA contribution as % of total effective GFA
Portfolio Valuation Summary
3030
China and India representing ~70% of CMA total portfolio GFA
1 Property value on a 100% basis and refers to properties that were completed as of 30 June 2009Note: 100% basis refers to the aggregate property values and total GFA of each property in the portfolio in its entirety
Singapore MalaysiaChina IndiaJapan
1,052
201289
372
118
15.0%
63.5%
12.6%6.8%
2.1%
NOT FOR DISTRIBUTION, DIRECTLY OR INDIRECTLY, IN OR INTO THE UNITED STATES
Transaction Summary for CapitaMalls Asia
Direct access to capital markets & accelerate growth in retail sector
Additional debt capacity to grow business
Seize significant growth opportunity in Asia retail sector
3131
Continued access to CL’s branding, network and expertise
Unique business franchise: Leading shopping mall player in Asia
Accelerate growth strategy in China to further strengthen position

Appendix
NOT FOR DISTRIBUTION, DIRECTLY OR INDIRECTLY, IN OR INTO THE UNITED STATES
pp
NOT FOR DISTRIBUTION, DIRECTLY OR INDIRECTLY, IN OR INTO THE UNITED STATES
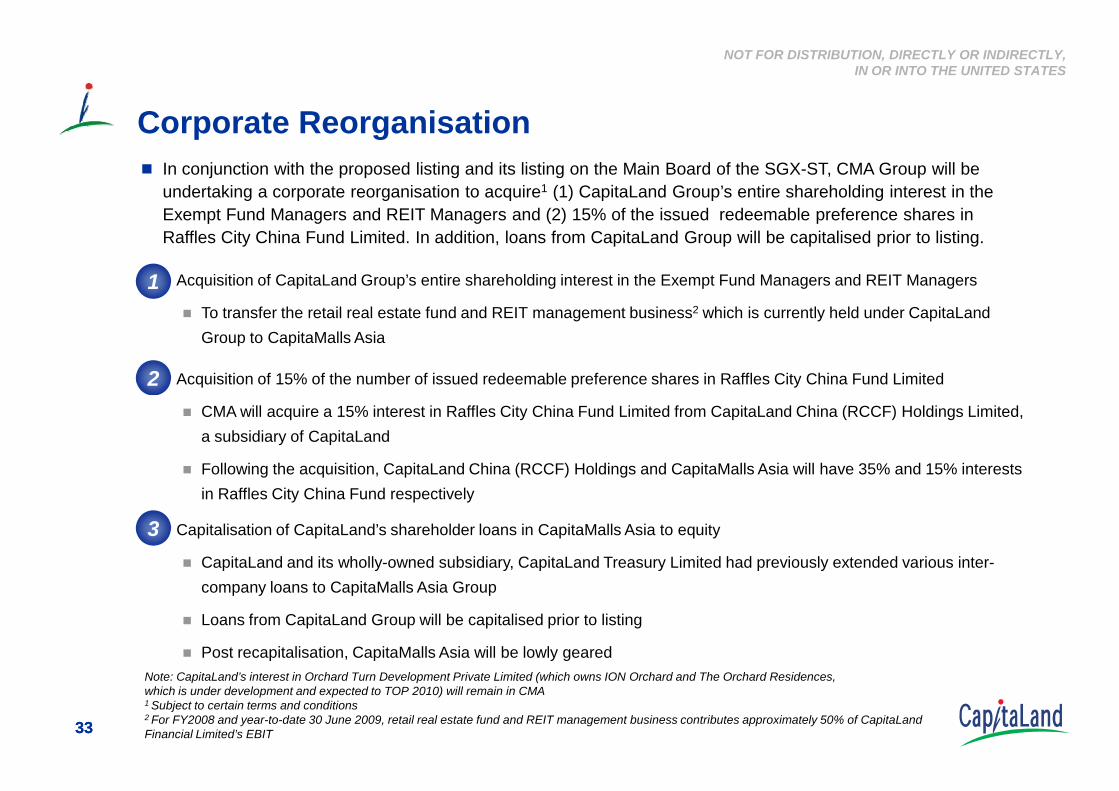
– Acquisition of 15% of the number of issued redeemable preference shares in Raffles City China Fund Limited
– Acquisition of CapitaLand Group’s entire shareholding interest in the Exempt Fund Managers and REIT Managers
To transfer the retail real estate fund and REIT management business2 which is currently held under CapitaLand Group to CapitaMalls Asia
Corporate Reorganisation In conjunction with the proposed listing and its listing on the Main Board of the SGX-ST, CMA Group will be undertaking a corporate reorganisation to acquire1 (1) CapitaLand Group’s entire shareholding interest in the Exempt Fund Managers and REIT Managers and (2) 15% of the issued redeemable preference shares in Raffles City China Fund Limited. In addition, loans from CapitaLand Group will be capitalised prior to listing.
1
2
3333
CMA will acquire a 15% interest in Raffles City China Fund Limited from CapitaLand China (RCCF) Holdings Limited, a subsidiary of CapitaLand
Following the acquisition, CapitaLand China (RCCF) Holdings and CapitaMalls Asia will have 35% and 15% interests in Raffles City China Fund respectively
– Capitalisation of CapitaLand’s shareholder loans in CapitaMalls Asia to equity
CapitaLand and its wholly-owned subsidiary, CapitaLand Treasury Limited had previously extended various inter-company loans to CapitaMalls Asia Group
Loans from CapitaLand Group will be capitalised prior to listing
Post recapitalisation, CapitaMalls Asia will be lowly geared Note: CapitaLand’s interest in Orchard Turn Development Private Limited (which owns ION Orchard and The Orchard Residences, which is under development and expected to TOP 2010) will remain in CMA 1 Subject to certain terms and conditions2 For FY2008 and year-to-date 30 June 2009, retail real estate fund and REIT management business contributes approximately 50% of CapitaLand Financial Limited’s EBIT
3
NOT FOR DISTRIBUTION, DIRECTLY OR INDIRECTLY, IN OR INTO THE UNITED STATES
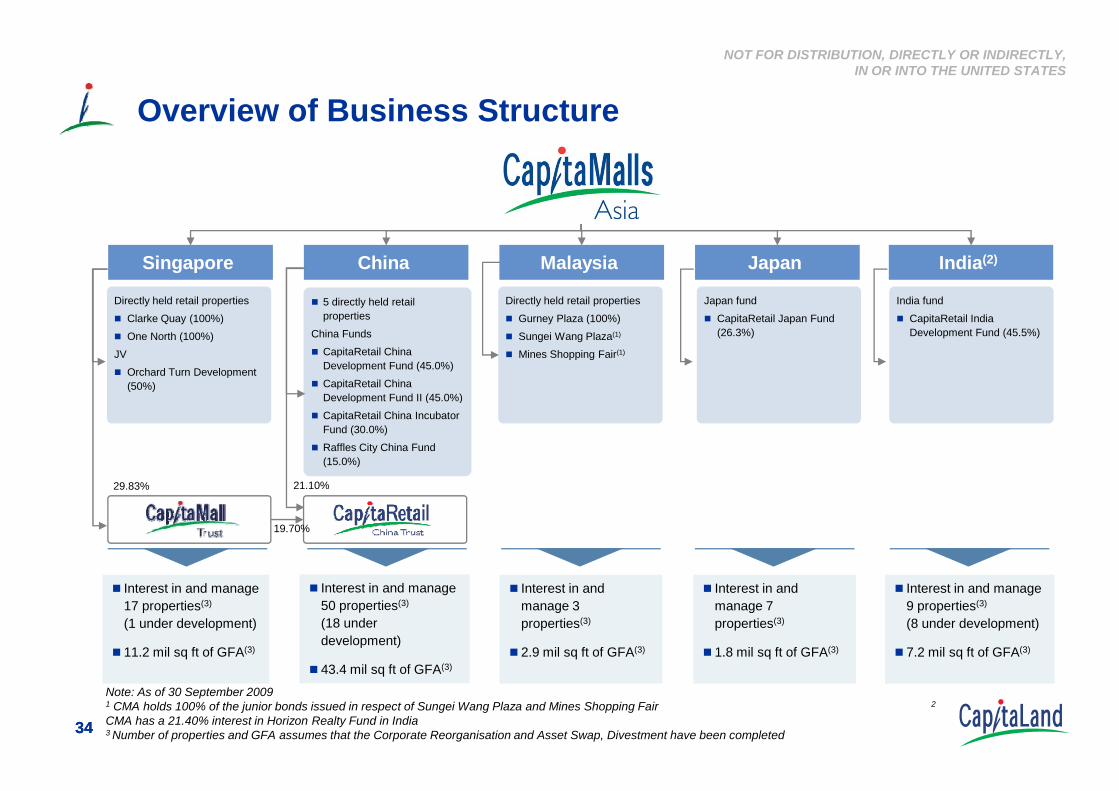
Overview of Business Structure
5 directly held retail properties
China Funds
CapitaRetail China Development Fund (45.0%)
CapitaRetail China De elopment F nd II (45 0%)
Directly held retail properties
Clarke Quay (100%)
One North (100%)
JV
Orchard Turn Development (50%)
China JapanMalaysia India(2)Singapore
Directly held retail properties
Gurney Plaza (100%)
Sungei Wang Plaza(1)
Mines Shopping Fair(1)
Japan fund
CapitaRetail Japan Fund (26.3%)
India fund
CapitaRetail India Development Fund (45.5%)
3434
Interest in and manage 17 properties(3)
(1 under development)
11.2 mil sq ft of GFA(3)
Interest in and manage 50 properties(3)
(18 under development)
43.4 mil sq ft of GFA(3)
Interest in and manage 3 properties(3)
2.9 mil sq ft of GFA(3)
Interest in and manage 9 properties(3)
(8 under development)
7.2 mil sq ft of GFA(3)
Interest in and manage 7 properties(3)
1.8 mil sq ft of GFA(3)
Development Fund II (45.0%)
CapitaRetail China Incubator Fund (30.0%)
Raffles City China Fund (15.0%)
21.10%29.83%
19.70%
Note: As of 30 September 2009 1 CMA holds 100% of the junior bonds issued in respect of Sungei Wang Plaza and Mines Shopping Fair 2
CMA has a 21.40% interest in Horizon Realty Fund in India 3 Number of properties and GFA assumes that the Corporate Reorganisation and Asset Swap, Divestment have been completed
NOT FOR DISTRIBUTION, DIRECTLY OR INDIRECTLY, IN OR INTO THE UNITED STATES
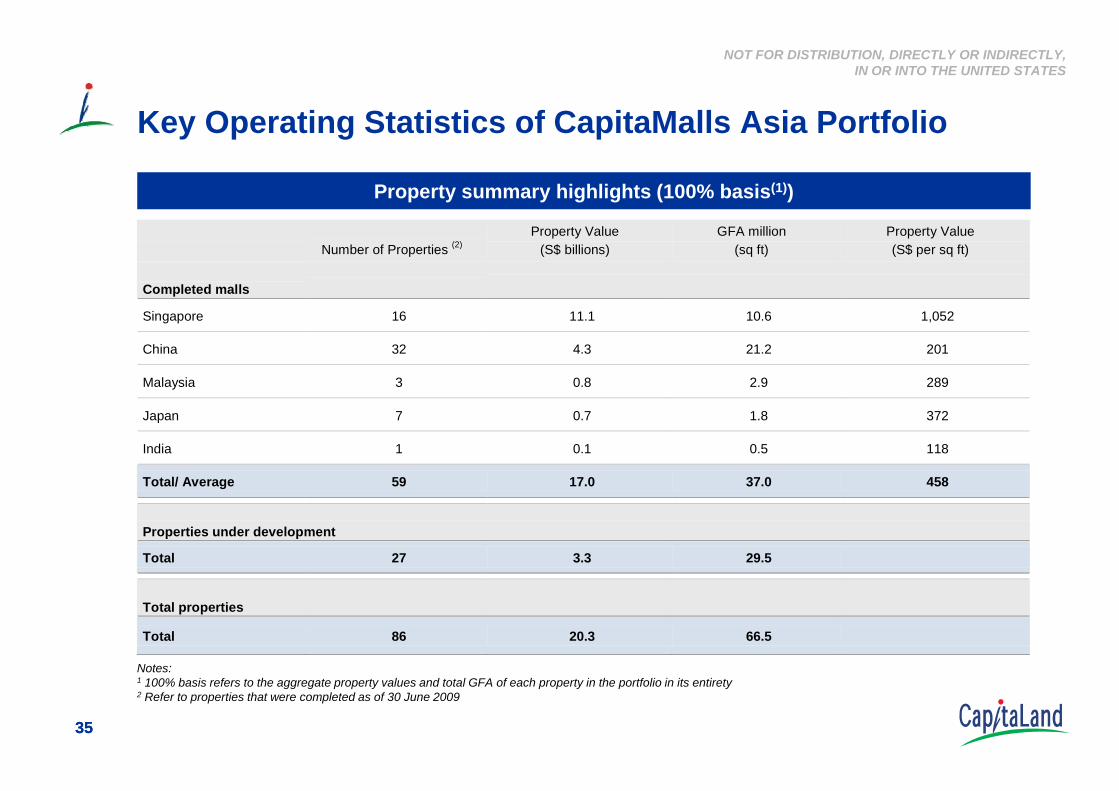
Key Operating Statistics of CapitaMalls Asia Portfolio
Number of Properties (2) Property Value
(S$ billions) GFA million
(sq ft) Property Value (S$ per sq ft)
Completed malls
Singapore 16 11.1 10.6 1,052
China 32 4.3 21.2 201
Malaysia 3 0.8 2.9 289
Property summary highlights (100% basis(1))
3535
Japan 7 0.7 1.8 372
India 1 0.1 0.5 118
Total/ Average 59 17.0 37.0 458
Properties under development
Total 27 3.3 29.5
Total properties
Total 86 20.3 66.5
Notes: 1 100% basis refers to the aggregate property values and total GFA of each property in the portfolio in its entirety2 Refer to properties that were completed as of 30 June 2009
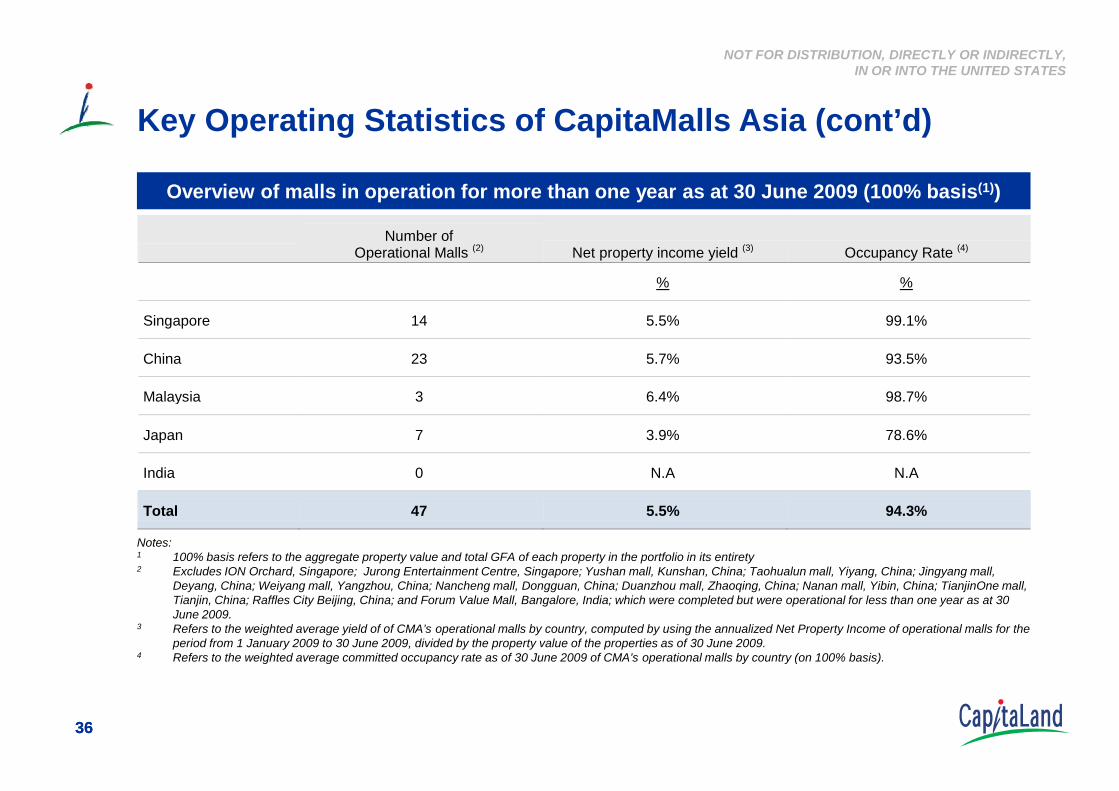
NOT FOR DISTRIBUTION, DIRECTLY OR INDIRECTLY, IN OR INTO THE UNITED STATES
Number of
Operational Malls (2) Net property income yield (3) Occupancy Rate (4) % %
Singapore 14 5.5% 99.1%
China 23 5.7% 93.5%
Malaysia 3 6 4% 98 7%
Overview of malls in operation for more than one year as at 30 June 2009 (100% basis(1))
Key Operating Statistics of CapitaMalls Asia (cont’d)
3636
Malaysia 3 6.4% 98.7%
Japan 7 3.9% 78.6%
India 0 N.A N.A
Total 47 5.5% 94.3%
Notes: 1 100% basis refers to the aggregate property value and total GFA of each property in the portfolio in its entirety2 Excludes ION Orchard, Singapore; Jurong Entertainment Centre, Singapore; Yushan mall, Kunshan, China; Taohualun mall, Yiyang, China; Jingyang mall,
Deyang, China; Weiyang mall, Yangzhou, China; Nancheng mall, Dongguan, China; Duanzhou mall, Zhaoqing, China; Nanan mall, Yibin, China; TianjinOne mall, Tianjin, China; Raffles City Beijing, China; and Forum Value Mall, Bangalore, India; which were completed but were operational for less than one year as at 30 June 2009.
3 Refers to the weighted average yield of of CMA’s operational malls by country, computed by using the annualized Net Property Income of operational malls for the period from 1 January 2009 to 30 June 2009, divided by the property value of the properties as of 30 June 2009.
4 Refers to the weighted average committed occupancy rate as of 30 June 2009 of CMA’s operational malls by country (on 100% basis).

NOT FOR DISTRIBUTION, DIRECTLY OR INDIRECTLY, IN OR INTO THE UNITED STATES
CMA’s EBIT ContributionFY2008 EBIT contribution by segments (unaudited)
EBIT (S$’Mil) Singapore China Malaysia Japan India Total
Property Business
Income from Property 66 71 27 4 (5) 163
Revaluation 96 19 43 (23) - 135
Management Business 37 14 (1) 1 - 51
Total 199 104 69 (18) (5) 349
1H09 EBIT contribution by segments (unaudited)
3737
1H09 EBIT contribution by segments (unaudited)
EBIT (S$’Mil) Singapore China Malaysia Japan India Total
Property Business
Income from property 44 15 26 6 (2) 89
Revaluation 161 (10) 0 (18) - 133
Management Business 15 8 (1) 1 - 23
Total 220 13 25 (11) (2) 245 Note: The Earnings Before Interests and Tax (EBIT) information presented above is derived from the combined financial information of the Group for the year ended 31 December 2008 and 6-month period ended 30 June 2009. The combined financial information presents CMA’s financial position and results of operations as if the Corporate Reorganisation (including the transfer of Exempt Funds and REIT managers and interests in Raffles City China Fund), had occurred as of the beginning of the earliest period presented. The combined financial information are prepared on a historical basis and does not take into account the intended capitalisation of shareholders' or related corporations loans.
EBIT presented may not be comparable to similarly titled measures presented by other companies and should not be compared against EBIT presented by other companies because not all companies use the same definition.
NOT FOR DISTRIBUTION, DIRECTLY OR INDIRECTLY, IN OR INTO THE UNITED STATES
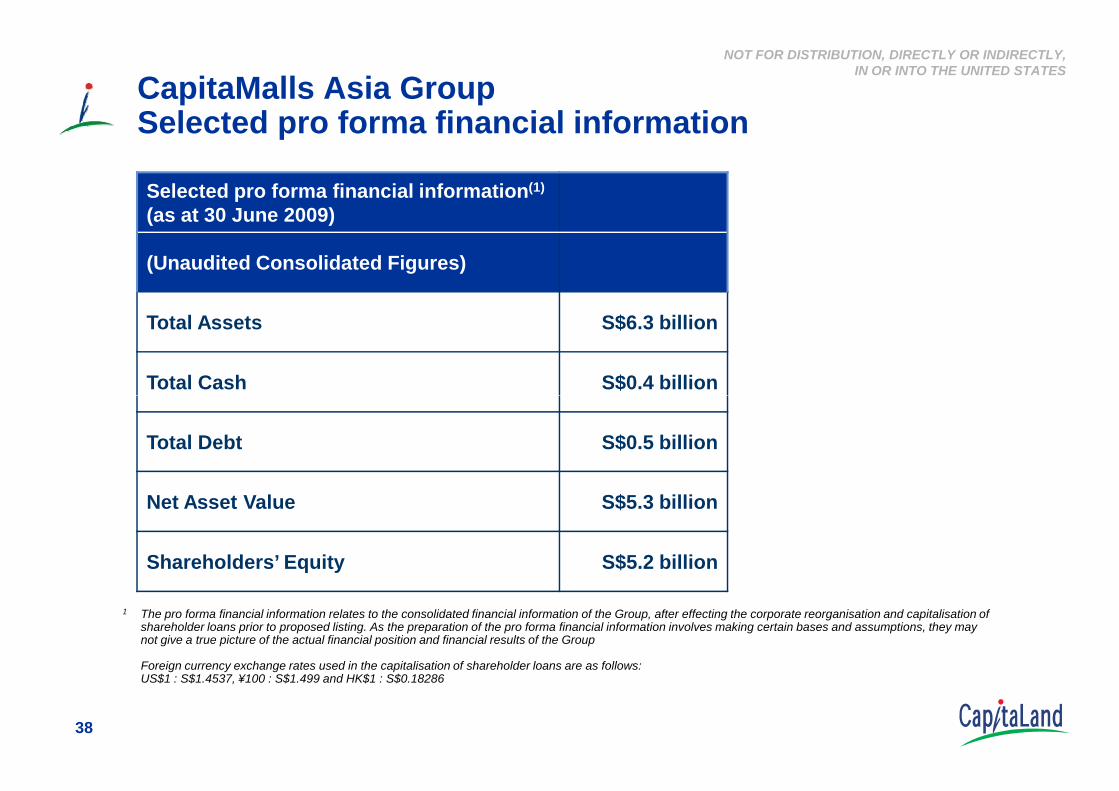
Selected pro forma financial information(1)
(as at 30 June 2009)
(Unaudited Consolidated Figures)
Total Assets S$6.3 billion
Total Cash S$0.4 billion
CapitaMalls Asia Group Selected pro forma financial information
38
Total Debt S$0.5 billion
Net Asset Value S$5.3 billion
Shareholders’ Equity S$5.2 billion
1 The pro forma financial information relates to the consolidated financial information of the Group, after effecting the corporate reorganisation and capitalisation of shareholder loans prior to proposed listing. As the preparation of the pro forma financial information involves making certain bases and assumptions, they may not give a true picture of the actual financial position and financial results of the Group
Foreign currency exchange rates used in the capitalisation of shareholder loans are as follows: US$1 : S$1.4537, ¥100 : S$1.499 and HK$1 : S$0.18286