Reordering Ranganathan: Shifting User Behaviors, Shifting Priorities

WP/07/39
Capital Structure and International Debt-Shifting
Harry Huizinga, Luc Laeven,
and Gaëtan Nicodème

© 2007 International Monetary Fund WP/07/39 IMF Working Paper Research Department
Capital Structure and International Debt-Shifting
Prepared by Harry Huizinga, Luc Laeven, and Gaëtan Nicodème1
Authorized for distribution by Stijn Claessens
February 2007
Abstract
This Working Paper should not be reported as representing the views of the IMF. The views expressed in this Working Paper are those of the author(s) and do not necessarily represent those of the IMF or IMF policy. Working Papers describe research in progress by the author(s) and are published to elicit comments and to further debate.
This paper presents a model of a multinational firm’s optimal debt policy that incorporates international taxation factors. The model yields the prediction that a multinational firm’s indebtedness in a country depends on a weighted average of national tax rates and differences between national and foreign tax rates. These differences matter because multinationals have an incentive to shift debt to high-tax countries. The predictions of the model are tested using a novel firm-level dataset for European multinationals and their subsidiaries, combined with newly collected data on the international tax treatment of dividend and interest streams. Our empirical results show that corporate debt policy indeed not only reflects domestic corporate tax rates but also differences in international tax systems. These findings contribute to our understanding of how corporate debt policy is set in an international context. JEL Classification Numbers: F23, G32, H25 Keywords: corporate taxation, financial structure, debt-shifting Authors’ E-Mail Addresses: [email protected], [email protected], and
[email protected] 1 Harry Huizinga is affiliated with Tilburg University and the Center for Economic Policy Research (CEPR), Luc Laeven is affiliated with the International Monetary Fund (IMF) and the Center for Economic Policy Research (CEPR), and Gaëtan Nicodème is affiliated with the European Commission and Solvay Business School (ULB). The authors thank Julian Alworth, Michael Devereux, James Hines, Matthias Mors, Johannes Voget, Alfons Wiechenrieder, and seminar participants at the Institute for Fiscal Studies in London, Tilburg University, the University of Cologne, The University of Leuven, and the General Directorate of Taxation and Customs Union of the European Commission for their valuable comments.
2
Contents Page I. Introduction......................................................................................................................3 II. The International Tax System..........................................................................................5 III. The Model........................................................................................................................8 IV. The Data.........................................................................................................................11 V. Empirical Results ...........................................................................................................13 VI. Conclusions....................................................................................................................16 References................................................................................................................................36 Appendix Table 1. Variable Definitions and Data Sources..........................................................................35 Tables 1. Corporate Taxation and Double-Tax-Relief Systems for Dividend Received in Selected
European Countries in 2003 ..........................................................................................17 2. Bilateral Withholding Tax on Dividend Payments Between Fully Owned Foreign
Subsidiary and Parent on January 1, 2003.....................................................................19 3. Existence of a Bilateral Tax Treaty on January 1, 2003................................................20 4. Bilateral Withholding Tax on Interest Payments Between Fully Owned Foreign
Subsidiary and Parent on January 1, 2003.....................................................................21 5. Double-tax-relief Systems for Interest Payments Received in Selected European
Countries in 2003...........................................................................................................22 6. Expressions for iϕ the Relative Taxation of Equity and Internal Debt of Subsidiaries.23 7. Descriptive Statistics for Subsidiaries of European Multinationals ..............................24 8. The Impact of Domestic and International Taxes on the Financial Leverage of
Subsidiaries of Multinational Firms ..............................................................................28 9. The Impact of Taxes on the Financial Leverage of Subsidiaries of Multinational Firms:
Robustness Checks ........................................................................................................30 10. The Impact of Taxes on the Financial Leverage of Subsidiaries of Multinational Firms:
Additional Robustness Checks ......................................................................................32
3
I. INTRODUCTION
In most countries, interest expenses are deductible for corporate tax purposes, while dividends have to be paid out of net-of-tax corporate income. Most tax systems thus favor debt finance over equity finance, but to different degrees given the dispersion in top corporate tax rates. In determining their financial structure, purely domestic firms have to deal only with the domestic tax system. Multinational firms, however, face the more complicated choice of determining their overall indebtedness and the allocation of their debts to the parent firm and the subsidiaries across all countries in which the multinational operates. As a consequence, the financial structure of a multinational firm is expected to reflect the tax systems of all the countries where it operates.
In an international setting, the tax costs of debt and equity finance depend on the combined tax systems of the subsidiary and parent countries of the multinational firm. Dividends, as indicated, have to be paid out of the subsidiary’s income after subsidiary-country corporate tax and in addition may be subject to a nonresident dividend withholding tax in the subsidiary country. In the parent country, the dividend income may again be subject to corporate income tax. If so, double tax relief may or may not be provided for the previously paid corporate income and nonresident withholding tax. The tax costs of equity finance thus reflect tax rates as well as the double-tax-relief convention used by the parent country. This paper collects detailed information on all of these aspects of the international tax system for European multinationals.
A firm’s financial policies are affected by tax as well as nontax considerations. A nontax consideration is that indebtedness of the overall multinational firm should not be too high to keep the probability of costly bankruptcy low. In contrast, an advantage of debt finance is that it reduces the free cash flow within the firm and hence can act as a disciplining device for otherwise overspending managers. The disciplining properties of debt finance can explain generally positive debt levels at each of a multinational’s individual establishments (i.e., its parent company and its foreign subsidiaries). These various considerations give rise to an optimal overall capital structure for the overall multinational firm for nontax reasons.
This paper first presents a model of the optimal overall capital structure of the multinational firm reflecting tax and nontax factors. Generally, the tax advantages of debt finance lead the firm to choose a higher leverage than would be desirable for purely nontax reasons. At the same time, a change in tax policy optimally causes the firm to rebalance its capital structure in all the countries where it operates. Specifically, stronger incentives for debt finance in one country encourage debt finance in that country but at the same time discourage debt finance in other countries to keep the overall indebtedness of the multinational in check. The model yields the result that the optimal debt-to-assets ratio at any establishment of the multinational is positively related to the national tax rate and to differences between the national and foreign tax rates. The relevant tax rates in this regard are the effective tax rates that take into account any double taxation and double taxation relief. International tax rate differences matter, since they determine the incentives to shift debt internationally within a multinational firm.
Next, the paper presents evidence on the impact of taxation on firm indebtedness for a sample of 33 European countries over the 1994–2003 period using a unique firm-level database on the financial structure of domestic and multinational firms, including their parent companies and
4
their subsidiaries. For stand-alone domestic firms, we estimate that a 10 percent increase in the overall tax rate (reflecting corporate income taxes and nonresident dividend withholding taxes) increases the ratio of liabilities to assets by 1.84 percent. For multinational firms, the leverage ratio is found to be more sensitive to taxation on account of international debt-shifting. As an example, we can consider a multinational with two equal-sized establishments in two separate countries. A 10 percent overall tax increase in one country is found to increase the leverage ratio in that country by 2.44 percent, while the leverage ratio in the other country decreases by 0.6 percent. Corporate debt policy appears to reflect local, source-level taxes rather than residence-level taxes levied on a multinational’s worldwide income, perhaps because these latter taxes can often be deferred. Similarly, debt policy appears to reflect corporate income taxation rather than bilateral nonresident dividend withholding. In practice, multinationals may be able to avoid bilateral withholding taxes through triangular arbitrage involving a conduit company in a third country.
Several authors consider the relationship between firm leverage and taxation with U.S. data. Among these, MacKie-Mason (1990) and Gordon and Lee (2001) identify a tax effect by exploiting the different effective taxation faced by previously loss-making firms and firms of different sizes, respectively. Graham (2000) calculates the value of the tax benefits of debt finance for the U.S. case. Studies that use cross-country data have the advantage that they allow for international variation in tax rates. Examples are Rajan and Zingales (1995) and Booth, Aivazian, Demirgüc-Kunt, and Maksimovic (2001). The latter set of authors finds a weak effect on leverage for a tax variable that measures the tax shield of debt finance. Next, there is a set of papers that consider the debt finance of multinationals with either parent companies or subsidiaries in the United States. Specifically, Hines and Hubbard (1990), Collins and Shackelford (1992), Froot and Hines (1992), and Grubert (1998) provide evidence that U.S. multinational financial structure and the pattern of intrafirm interest and other income flows are consistent with tax minimization objectives. Newberry and Dhaliwal (2001) find that the debt issuance location of U.S. multinationals is affected by these firms’ jurisdiction-specific tax-loss carry-forwards and binding foreign tax credit limitations on the value of debt tax shields. Desai, Foley, and Hines (2004) find that both the internal and external financing of outward U.S. Foreign Direct Investment (FDI) is sensitive to foreign tax rates. Mills and Newberry (2004) analogously find that non-U.S. multinationals from countries with relatively low tax rates use relatively intensive debt finance of their foreign-controlled corporations in the United States.
Jog and Tang (2001) consider the leverage of firms in Canada that may or may not be part of U.S.-based or Canada-based multinationals. The debt-to-assets ratios of Canadian corporations without foreign affiliates are found to be more sensitive to Canadian tax rates than the debt-to-assets ratios of U.S.-controlled corporations located in Canada. Using data for member countries of the European Union, Moore and Ruane (2005) examine the leverage of 8,500 foreign subsidiaries. They find that leverage ratios of these subsidiaries are sensitive to the local corporate tax rate, unless the parent country operates a foreign tax credit system. This paper nests the approaches of the latter two papers by considering how both multinational firm structure and the international tax system affect leverage in Europe. Hence, we take into account whether a firm is a parent or a subsidiary of a multinational or a domestic firm. At the same time, we account for the tax systems of all the countries where the multinational operates. Thus, unlike previous research, our modeling and our empirical work take a fully
5
multilateral approach. The main contribution of our paper is to explore in an international context the possibility that multinationals set the capital structure of individual subsidiaries by taking into account the tax rate faced by all other subsidiaries of the firm. Our finding that subsidiary leverage within a multinational firm responds to bilateral tax rate differences vis-à-vis both the parent firm and other foreign subsidiaries provides direct support for this multilateral approach.
In the remainder, Section II describes the international tax treatment of the debt and equity finance of multinational firms. Section III presents the model. Section IV discusses the company-level data. Section V presents the empirical results, and Section VI offers conclusions.
II. THE INTERNATIONAL TAX SYSTEM
This section describes the main features of the corporate income tax system applicable to a multinational firm with subsidiaries in one or more foreign countries.2 To fix ideas, let us consider a multinational firm that operates a foreign subsidiary in country i and has the parent firm in country p. The deductibility of interest from corporate income implies that there is no corporate taxation of interest to external debt holders. Dividends paid by the subsidiary to the parent firm, in contrast, are generally subject to corporate taxation in at least one country.
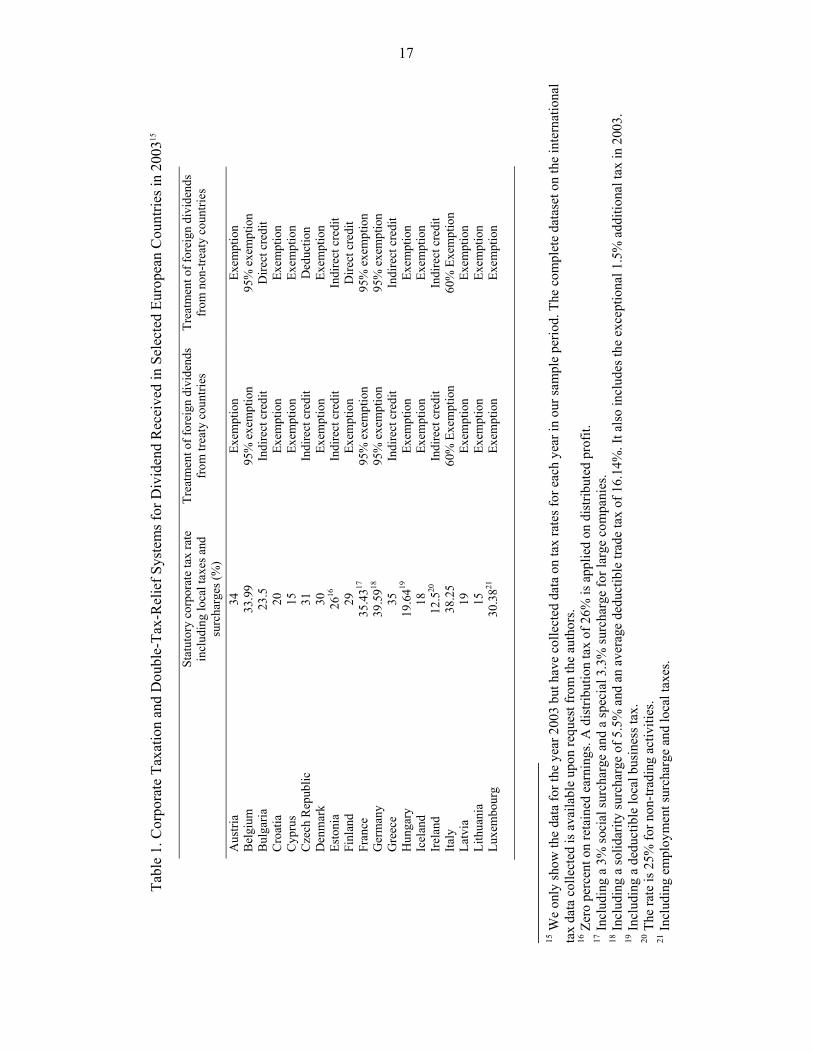
The subsidiary’s income in county i is first subject to the corporate income tax it in this country. The first column of Table 1, indicates the statutory corporate tax rate on corporate profit for a sample of 33 European countries in 2003. These tax rates include regional and local taxes as well as specific surcharges. Germany has the highest tax rate at 39.6 percent, while Ireland is at the bottom with a tax rate of 12.5 percent. This and all other tax system information in this paper has been collected from the International Bureau of Fiscal Documentation and various websites of national ministries of finance. We have collected the tax system data reported in Tables 1–5 for all years in our sample period but only report the figures for the year 2003 due to space constraints.3
The subsidiary pays out its after-tax corporate income as a dividend to the parent company. The subsidiary country may levy on nonresidents a withholding tax e
iw on this outgoing dividend income. Bilateral dividend withholding taxes in Europe for 2003 are presented in Table 2. These rates are zero in the majority of cases. Specifically, they are zero among long-standing EU member states on account of the parent-subsidiary directive. New EU member states such as the Czech Republic, Hungary, Poland, and Slovenia still maintain nonzero dividend withholding taxes vis-à-vis considerable numbers of European countries. Non-EU member states such as Bulgaria, Romania, Russia, and Turkey similarly maintain nonzero 2 It is reasonable to assume that multinationals do not take into account the taxation of dividend, interest, and capital gains at the investor level. First, important institutional investors such as pension funds may not be subject to taxation of the investor level. Second, private investors generally are subject to such taxation, but the internationally dispersed ownership of the shares of a multinational firm makes it difficult for these firms to take taxation at the personal level into account when deciding on their financing. 3 The complete dataset is available upon request from the authors.
6
dividend withholding taxes in a considerable number of cases. The combined corporate and withholding tax rate in the subsidiary country is seen to be )1)(1(1 e
ii wt −−− or it + eiw - it
eiw .
The parent country subsequently may or may not use its right to tax the income generated abroad. In case the parent country operates a territorial or source-based tax system, it effectively exempts foreign-source income from taxation. The effective marginal tax on income reported in country i, denoted τi, in this instance, equals combined corporate and withholding tax it + e
iw - iteiw in country i. 4 Alternatively, the parent country operates a
worldwide or residence-based tax system. In this instance, the parent country subjects income reported in country i to taxation, but it generally provides a foreign tax credit for taxes already paid in country i to reduce the potential for double taxation. The OECD model treaty, which summarizes recommended practice, in fact gives countries an option between an exemption and a foreign tax credit as the only two ways to relieve double taxation (see OECD, 1997). The foreign tax credit reduces domestic taxes on foreign source income one-for-one with the taxes already paid abroad. The foreign tax credit can be indirect in the sense that it applies to both the dividend withholding tax and the underlying subsidiary country corporate income tax. Alternatively, the foreign tax credit is direct and applies only to the withholding tax. In either case, foreign tax credits in practice are limited to prevent the domestic tax liability on foreign source income from becoming negative.
In the indirect credit regime, the multinational will effectively pay no additional tax in the parent country, if the parent tax rate tp is less than .e
iieii wtwt −+ The multinational then has
unused foreign tax credits and is said to be in an excess credit position. Alternatively, tp exceeds .e
iieii wtwt −+ In that instance, the firm pays tax in the parent country at a rate equal
to the difference between tp and .eii
eii wtwt −+ The effective, combined tax rate on the
dividend income, τi, then equals the parent country tax rate, tp. To summarize, with the indirect credit system the effective rate on income generated in country i, τi, is given by max [ e
iieiip wtwtt −+, ]. In case of a direct foreign tax credit, the multinational analogously pays no
additional tax in the parent country, if the parent tax rate tp is less than .eiw In the more
common case where tp exceeds eiw , the firm instead pays tax in the parent country at a rate
equal to ))(1( eipi wtt −− . The effective, two-country tax rate, τi, with the direct credit system is
now given by ],max[)1( eipii wttt −+ . A few countries with worldwide taxation do not provide
foreign tax credits, but instead allow foreign taxes to be deducted from the multinational’s taxable income. Under this deduction method, foreign taxes are essentially seen as a tax-deductible cost of seeing business at par with other business costs. In the scenario, the effective rate of taxation on dividends, iτ , is given by ( )( )( )p
eii twt −−−− 1111 .
4 Note that for the parent firm we have that the effective tax rate on corporate income equals the statutory rate, or pp t=τ .
7
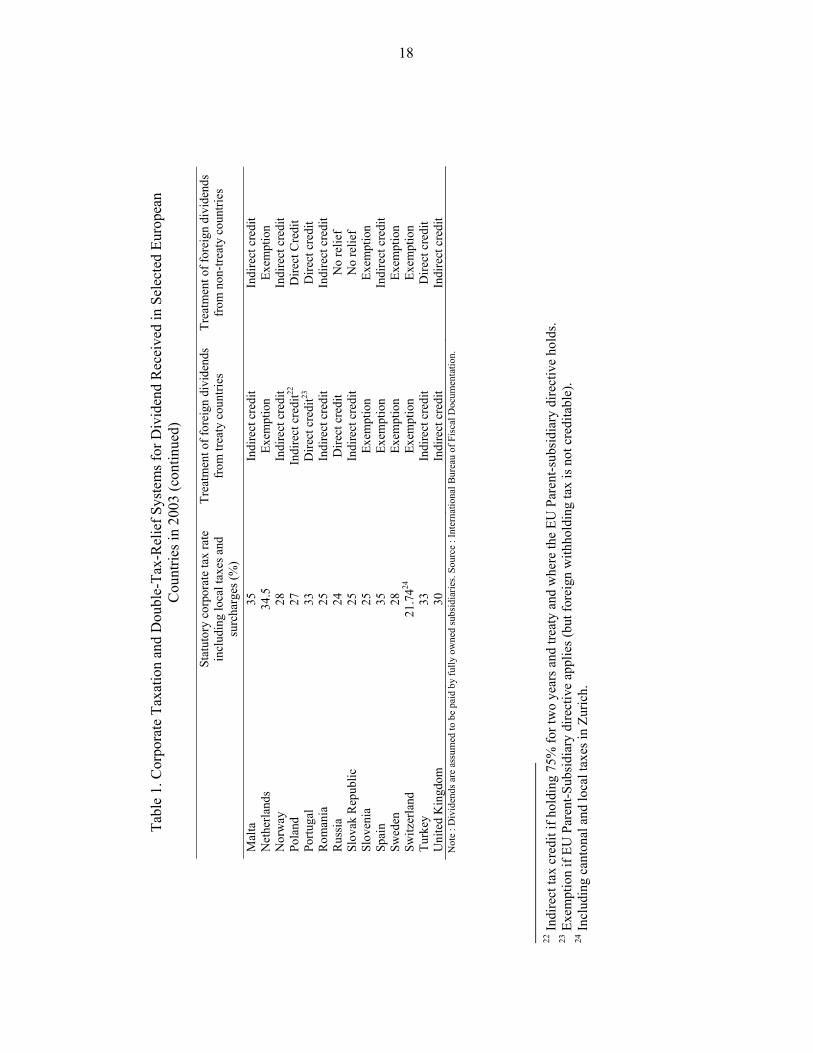
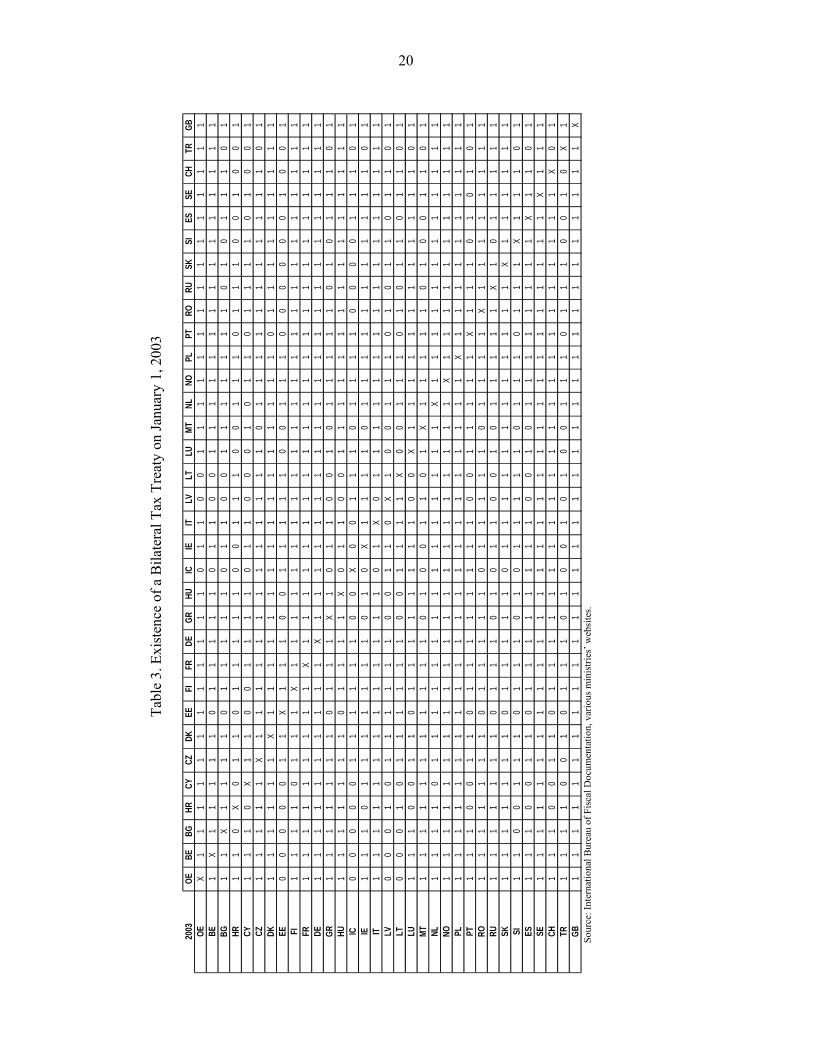
The second and third columns of Table 1 provide information on the double taxation rules applied to incoming dividend. As reflected in the table, several countries are seen to discriminate between international tax treaty partners and nontreaty countries. Finland and Spain, for instance, exempt dividend income from treaty partners, while they provide a direct and indirect foreign tax credit in case of nontreaty counties, respectively. Note that signing a tax treaty makes the granted double tax relief more generous in these instances. The tendency to discriminate double tax relief on the basis of the existence of a tax treaty makes it necessary to know whether a bilateral tax treaty is indeed effective. Table 3 indicates with a binary variable whether any two countries had a taxtreaty in force by 2003.5 Across the categories of treaty and nontreaty countries, the exemption system is seen to be the most common method of double tax relief, followed by foreign tax credits. At the same time, indirect foreign tax credits regimes are somewhat more common than direct foreign tax credits. As an exceptional case, the Czech Republic is seen to apply the deduction method to foreign dividends from non-treaty countries, while Russia and the Slovak Republic provide no double tax relief at all to such income.
In practice, multinationals use equity as well as internal debt to provide own resources to their foreign subsidiaries. Thus, leverage is likely to be affected by the taxation of dividends, as considered so far, and by the taxation of interest on internal debt. To reflect this in our empirical work, we use a variable ϕi to denote the effective tax rate on cross-border dividends, i.e. iτ , minus an analogous effective rate of tax on interest. Interest on internal debt is generally deductible from taxable corporate income in the subsidiary country. Such interest income thus escapes corporate income tax in the subsidiary country. As in the case of dividends, cross-border interest flows within the multinational firm may generally be subject to a nonresident withholding tax in the subsidiary country. Let d
iw denote the bilateral nonresident interest withholding tax. As seen in Table 4, these tax rates are mostly zero on a bilateral basis for the countries in our sample, even if Belgium, Estonia, Latvia, Portugal, and Romania continue to impose positive interest withholding taxes vis-à-vis almost all countries in our sample. As applied to internal interest flows, the parent country has three main options regarding double tax relief: (i) an exemption, (ii) a foreign tax credit, or (iii) a deduction. Table 5 provides information on the double taxation rules applicable to incoming interest from treaty and nontreaty signatory countries, respectively. The signing of a tax treaty, if anything, makes the double tax relief in case of interest flows more generous. Foreign-source interest flows are seen to benefit from a foreign tax credit in most countries, particularly in the case of interest payments originating from treaty partners. Clearly, the taxation of dividend income relative to interest income, ϕi, depends on the possibly different tax relief granted for dividends and for interest. Expressions for ϕi in the various possible combinations of double tax relief granted for dividend and interest income are provided in Table 6.
5 Most of the 33 countries in our sample had such treaties with each other. However, the treaty network of some countries—in particular some of the new EU member states and some non-EU countries—are far from complete. In contrast, France, Germany, Norway, Poland, Sweden, and the United Kingdom have a double-tax treaty in force with all other countries. Note that the table is not exactly symmetric because the entry into force may slightly differ in each of the two treaty partners.

8
III. THE MODEL
The model considers a multinational firm that generally operates in n countries. The multinational is domiciled in country p, while it has foreign subsidiaries in one or more countries i with assets A i.. The subsidiary is financed with debt Li, which for now we take to be external debt, and equity Ei. Hence, the balance sheet identity of a subsidiary implies Ai = Li + Ei. The parent firm fully owns each subsidiary’s equity Ei. In addition, the parent firm owns “outside” assets Ap. The parent firm in turn can be financed through either debt Lp or
equity Ep. Thus, the balance sheet identity for the parent can be stated as pp
n
piip ELEA +=+∑
≠
.
Let iλ be the ratio of debt-to-assets for each establishment of the multinational—i.e., i
ii A
L=λ .
Analogously, let fλ be the debt-to-assets ratio for the entire firm, i.e. ∑
∑
=
== n
ii
n
ii
f
A
L
1
1λ .
Alternatively, we can write fλ as the asset-weighted average of the establishment-specific debt
ratios iλ as∑=
n
iii
1ρλ , where
∑=
= n
ii
ii
A
A
1
ρ are the assets of establishment i as a share of the firm’s
total assets. Throughout, we will assume that the assets Ai of subsidiary i and the parent firm’s
outside assets Ap are given.6
In deciding its financial structure, the multinational firm takes taxation as well as nontax factors into account.7 To start with the latter, the multinational recognizes that higher leverage increases the chance of bankruptcy. We will assume that the parent firm provides credit guarantees for the debts of all its subsidiaries. This implies that the chance of bankruptcy of the overall multinational firm depends on the firm-wide leverage ratio fλ . Specifically, we will assume that expected bankruptcy costs, fC , of the firm are quadratic in the overall leverage ratio fλ and proportional to the firm’s overall outside assets as follows8
6 In response to a change in Ei, the parent firm thus will change either Lp or Ep rather than Ap. 7 See Hovakimian, Hovakimian, and Tehranian (2004) for a recent discussion of the theoretical and empirical literature on target capital structures reflecting various costs and benefits of debt and equity. 8 Bankruptcy costs are incurred by loss-making firms and hence are assumed not to be deductible from taxable corporate income.

9
)()(2 1
2 ∑=
=n
iiff AC λγ . ( 1 )
Next, it is recognized that leverage may bring benefits in that it disciplines local managers and aligns their incentives more closely to those of the firm. High leverage at a subsidiary may, for instance, serve to prevent local managers from overspending on perks for themselves to prevent de jure bankruptcy of the subsidiary. On the other hand, high leverage may have the disadvantage of making local managers too risk-averse, to the point where they do not make appropriate local investment decisions. In either case, the incentive effects of leverage are assumed to stem from the local leverage ratio iλ for establishment i. 9 On the basis of these incentive considerations alone, let λ* be the optimal leverage ratio at each of the multinational’s establishments. Deviations of the leverage ratio at any establishment from the level λ* are assumed to imply incentive-related costs to the firm. These costs are assumed to be quadratic in iλ ,and now they are proportional to the outside assets iA at establishment i as follows:
iiii AAC 2*2*
2)-(
2λμλλμ
= i=1,…, n ( 2 )
Note that these cost functions are scaled to equal zero if the debt ratios iλ are zero, which implies that Ci can be of either sign. Next, let Vl and Vu be the values of the leveraged and completely unleveraged multinational firm, respectively. The two are different on account of the tax benefits of debt finance and of the (net) nontax costs associated with debt finance. Specifically, VL and Vu are related as follows
∑∑==
−−+=n
iif
n
iiiuL CCLVV
11
τ , ( 3 )
where iτ again is the rate of taxation of dividend income relative to interest income in locale i taking into account the overall international tax system.
9 Higher local leverage may be disadvantageous if it increases the probability of losses that cannot be credited against profits made elsewhere in the firm. Losses that are not creditable per definition reduce the after-corporate-tax income of the firm one-for-one. For this reason, we assume that the costs associated with higher leverage at the establishment level are not deductible from taxable corporate income.

10
The multinational firm’s objective is to maximize its overall firm value LV in the leveraged state. Its instruments are the debt levels Li at each establishment.10 The first-order conditions w.r.t. Li—written in terms of leverage ratios—are given by
0)( * =−−− λλμγλτ ifi i=1,…, n . ( 4 )
The first-order conditions jointly allow us to solve for the optimal value of iλ as follows:
ii τβλβλ 1*
0 += + ⎥⎦
⎤⎢⎣
⎡−∑
≠
n
ijjji ρττβ )(2 i=1,…,n , ( 5 )
where )(0 μγμβ+
= , μγ
β+
=1
1 , and ))(
(2 μγμγβ+
= .
In expression (5), the term *0λβ is the optimal leverage ratio at all establishments on the basis
of all nontax considerations, or equivalently if all theτ ’s are equal to zero. The term *0λβ can
be seen to balance the expected costs of bankruptcy (with a value of λ above zero) against the costs of deviating from the optimal value of the leverage ratio *λ on the basis of incentive considerations. Expression (5) further contains two tax-related terms. First, the term
iτβ1 reflects the impact of taxation on the optimal leverage ratio that would obtain for a purely domestic firm located in country i. For this reason, this term is dubbed the “domestic” effect of
taxation on leverage. Second, the term ⎥⎦
⎤⎢⎣
⎡−∑
≠
n
ijjji ρττβ )(2 reflects the impact of international
tax rate differences on the optimal leverage in country i on account of international debt-shifting. Interestingly, this term weight the international tax differences ji ττ − by the asset shares jρ . This reflects that the cost function iC implies that it is relatively painless to shift (absolute) debt into or out of country j, if the assets in this country are relatively large. This second effect of taxation on leverage in country i is named the “international” or “debt-shifting” effect. Note that leverage iλ in country i is negatively related to jτ on account of the debt-shifting effect.
The theoretical equation (5) gives rise to the following regression equation
10 The firm recognizes all subsidiary and parent firm balance sheet identities, which means that the Ei are co-determined.
11
i
n
ijjjiiii ερττβτβαλ +⎥⎦
⎤⎢⎣
⎡−++= ∑
≠
)(21 i=1,…,n (6)
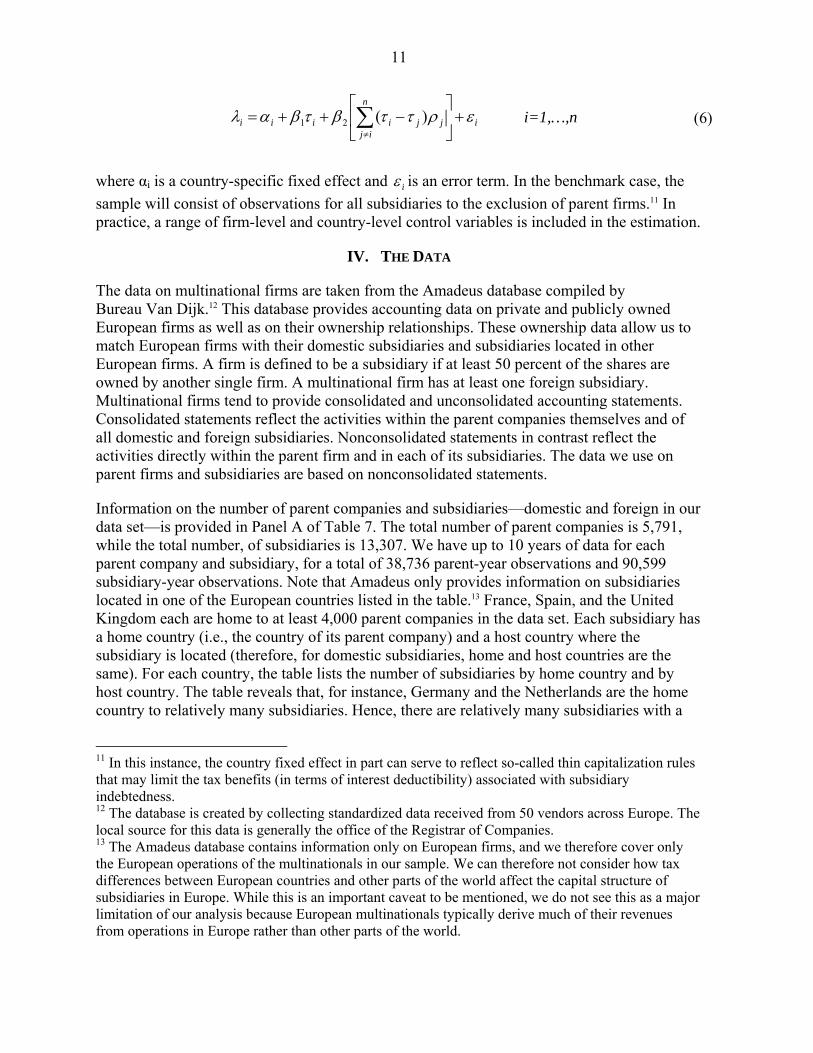
where αi is a country-specific fixed effect and iε is an error term. In the benchmark case, the sample will consist of observations for all subsidiaries to the exclusion of parent firms.11 In practice, a range of firm-level and country-level control variables is included in the estimation.
IV. THE DATA
The data on multinational firms are taken from the Amadeus database compiled by Bureau Van Dijk.12 This database provides accounting data on private and publicly owned European firms as well as on their ownership relationships. These ownership data allow us to match European firms with their domestic subsidiaries and subsidiaries located in other European firms. A firm is defined to be a subsidiary if at least 50 percent of the shares are owned by another single firm. A multinational firm has at least one foreign subsidiary. Multinational firms tend to provide consolidated and unconsolidated accounting statements. Consolidated statements reflect the activities within the parent companies themselves and of all domestic and foreign subsidiaries. Nonconsolidated statements in contrast reflect the activities directly within the parent firm and in each of its subsidiaries. The data we use on parent firms and subsidiaries are based on nonconsolidated statements.
Information on the number of parent companies and subsidiaries—domestic and foreign in our data set—is provided in Panel A of Table 7. The total number of parent companies is 5,791, while the total number, of subsidiaries is 13,307. We have up to 10 years of data for each parent company and subsidiary, for a total of 38,736 parent-year observations and 90,599 subsidiary-year observations. Note that Amadeus only provides information on subsidiaries located in one of the European countries listed in the table.13 France, Spain, and the United Kingdom each are home to at least 4,000 parent companies in the data set. Each subsidiary has a home country (i.e., the country of its parent company) and a host country where the subsidiary is located (therefore, for domestic subsidiaries, home and host countries are the same). For each country, the table lists the number of subsidiaries by home country and by host country. The table reveals that, for instance, Germany and the Netherlands are the home country to relatively many subsidiaries. Hence, there are relatively many subsidiaries with a
11 In this instance, the country fixed effect in part can serve to reflect so-called thin capitalization rules that may limit the tax benefits (in terms of interest deductibility) associated with subsidiary indebtedness. 12 The database is created by collecting standardized data received from 50 vendors across Europe. The local source for this data is generally the office of the Registrar of Companies. 13 The Amadeus database contains information only on European firms, and we therefore cover only the European operations of the multinationals in our sample. We can therefore not consider how tax differences between European countries and other parts of the world affect the capital structure of subsidiaries in Europe. While this is an important caveat to be mentioned, we do not see this as a major limitation of our analysis because European multinationals typically derive much of their revenues from operations in Europe rather than other parts of the world.
12
parent firm in one of these countries. Croatia, the Czech Republic, and Romania instead are host countries to relatively many subsidiaries.
Panel B of Table 7 provides information on financial leverage and applicable tax rates. First, financial leverage is defined as the ratio of total liabilities to total assets (see the Appendix for variable definitions and data sources). Adjusted financial leverage, instead, is the ratio of, in the numerator, total liabilities minus accounts payable minus cash to, in the denominator, total assets minus accounts payable minus cash. These adjustments reflect that accounts payable are liabilities that reflect current operations rather than efforts to optimize the firm’s capital structure. Similarly, the subtraction of cash reflects that cash may be on hand to pay off existing debts. In Panel B of Table 7, we see that the average parent company financial leverage of 0.62 indeed exceeds the average adjusted financial leverage of 0.49. Average financial leverage ranges from 0.36 for Russia and Slovenia to 0.80 for Romania. Interestingly, subsidiaries by host country have average financial leverage and adjusted financial leverage of 0.62 and 0.49, respectively—exactly equal to the averages for parent firms. Hence, there is no tendency for subsidiaries to be either more or less leveraged than parent firms. Next, the effective tax rate for subsidiaries by host country is seen to be highest for Germany at 0.49, and lowest for Estonia at 0.14. As discussed before, the effective tax reflects the taxation of dividends in the host country itself as well as the tax treatment of this income in any foreign parent country. The tax incentive to shift debt for subsidiaries by host country is the asset-weighted difference of the effective tax rate in the host country and the effective tax rates applicable to other establishments of the same multinational firm. A positive value of this variable indicates that multinationals on average have an incentive to shift debt out of a particular host country. By this measure, subsidiaries hosted in Iceland and Germany have the largest incentive to attract debt, while subsidiaries located in Estonia and Hungary have the largest incentive to shift debt away.
Panel C of Table 7 provides summary statistics of our leverage and tax variables as well as of control variables included in the subsequent estimation. The control variables are several firm-level variables derived from the firm’s balance sheet or income statement as well as some country variables. Among the firm-level variables, tangibility is defined as the ratio of fixed assets to total assets. This variable captures that it may be relatively easy to borrow against fixed assets. In addition, depreciable assets may act as a nondebt tax shield and is therefore a substitute for debt in taxable profit minimization strategies. Next, log of sales is the logarithm of sales. This is a scaling variable to reflect that larger firms may have easier access to credit. Next, profitability is the ratio of earnings before interest, taxes, depreciation, and amortization to total assets. Profitability may affect leverage in several ways. Profitable firms may be perceived to be relatively riskless, which would facilitate their access to credit. On the other hand, profitable firms may use their profits to pay down their debts or, alternatively, to finance investments through retained earnings. In either way, high profitability may lead to low leverage. Among the country variables, creditor rights is an annual index of creditor rights in a country. Well-protected creditor rights are expected to encourage leverage. Next, political risk is an annual index of political risks. High political risks may encourage borrowing from local creditors, since this is a way to reduce a multinational’s value at risk in a country. Inflation is the annual percentage change in the consumer price index. High inflation increases the value of the tax deductibility of interest to the extent that inflation leads to higher nominal interest rates. At the same time, an inflationary environment may also lead to a higher risk premium as
13
part of the nominal interest rate, which discourages debt finance. Finally, the growth opportunities variable measures the median annual growth rate of sales in an industry in a particular country. Growth opportunities signal future profitability and possibly an ability to borrow.
V. EMPIRICAL RESULTS
Table 8 presents our basic regressions. The sample consists of all European subsidiaries in Amadeus. For each observation, an effective tax rate and a debt-shifting incentive variable can be constructed. All regressions in the table provide for parent, industry, and year fixed effects. Regression (1) includes the effective tax rate to the exclusion of the international debt-shifting incentive variable. The pertinent coefficient is estimated to be 0.259 and statistically significant.14 The tangibility variable has a negative coefficient, which suggests that debt and tangible, depreciable assets are substitutes. The log of sales enters positively. Profitability, in turn, obtains a negative coefficient, which suggests that the overall effect of higher profitability is to reduce leverage. Note that the 71,355 observations in the sample are associated with a total of 5,566 parent companies. Yearly observations of the same subsidiary are counted separately.
Regression (2) includes the debt-shifting incentive variable. The estimated coefficient for this variable is positive and statistically significant, which confirms that leverage at any subsidiary of a multinational reflects the overall international tax system faced by the multinational. Next, regression (3) includes a set of additional, country-level controls. The creditor rights variable enters the regression positively and significantly. The political risk variable is equally positively and significantly related to leverage. As indicated, this may reflect that political risks lead a multinational to increase local borrowing in order to reduce its own capital at risk. Next, inflation has a negative and significant impact on leverage. This could reflect that in an inflationary environment there is more uncertainty about the ex post real interest rate to be paid on nominal debt denominated in the local currency. Finally, the growth opportunities variable enters the regression positively and significantly. High growth at the industry and country level may facilitate debt finance of the affected subsidiaries. Finally, in regression (4) adjusted financial leverage is taken to be the dependent variable. In other respects, regression (4) mimics regression (3). The effective tax rate and debt-shifting incentive variables continue to obtain positive and significant coefficients, albeit somewhat larger than before. Hence the adjustment of financial leverage for accounts payable and cash has little impact on the estimated impact of taxation on leverage. In regression (4), however, the tangibility variable enters with a positive coefficient to suggest that debt and tangible assets are complements (since firms can relatively easily borrow against tangible assets), while the political risk and growth opportunities variables cease to obtain significant coefficients.
The estimated coefficients of regression (3) can serve to evaluate the size of the effect of taxation on leverage. First, the estimated size of β1, 0.18, indicates the full effect of domestic taxation on the leverage of firms. Specifically, the “domestic” effect of an increase in the effective tax rate by 0.06 (or one standard deviation) on leverage is 1.1 percent. Next, the 14 Desai, Foley, and Hines (2004) similarly find a coefficient of 0.2624 in their regression (1) in Table II, where they regress leverage ratios of U.S. outward FDI on the source country tax rate.
14
estimated size of β2, 0.12, captures the “international debt-shifting” effect of taxation on leverage. As an example, we can take a hypothetical multinational firm that has a single foreign subsidiary with assets of equal size to those of the parent firm. In this instance, an increase of the effective tax rate by 0.06 in the subsidiary country has a positive “international” effect on leverage in the subsidiary country of 0.4 percent. The total effect of an increase of the effective tax rate by 0.06 on subsidiary leverage is now calculated to be 1.5 percent. In contrast, an increase in the effective tax in the parent country of 0.06 has a negative “international” effect on leverage in the subsidiary of -1.5 percent.
Next, Table 9 presents some robustness checks, taking regression (3) in Table 8 as a starting point. In regression (1), we correct standard errors for clustering across country-industry observations. The estimated coefficients for the two tax variables are virtually unchanged from those of the benchmark regression. Regression (2) in turn limits the sample to subsidiaries in the manufacturing sector. In this regression, the estimated sizes of β1 and β2 are somewhat smaller, and much larger, respectively. The relatively large size of β2 in regression (2) may reflect that manufacturing firms are relatively transparent. Hence, for these firms it may be relatively easy to borrow in one country against the assets located in other countries to explain that leverage in one country is relatively sensitive to international tax rate differences. Next, regression (3) limits the sample to foreign subsidiaries. This reduces the sample size to 23,296 subsidiaries rather than 49,248 in regression (3) in Table 8. Relative to the benchmark regression, the value of β2 is very similar in magnitude at 0.138. In regression (4) we restrict the sample to subsidiaries of multinationals, i.e. of firms that have at least one foreign subsidiary. The estimated size of β1 and β2 are very similar to the benchmark results. In regression (5) we exclude loss-making subsidiaries by dropping firms that have negative earnings before interest, taxes, depreciation and amortization. The reason for excluding loss-making firms is that these firms may be close to financial distress, which could alter their debt policy. The results are not qualitatively affected. In regression (6), we exclude Eastern European countries from the sample, as the coverage of subsidiaries in Eastern Europe is quite poor. This reduces the sample size to 48,444 subsidiaries, but does not alter our main results. Financial leverage can also be affected by firm-specific risk. In particular, riskier firms tend to be higher leveraged. In regression (7), we use the standard deviation of the firm’s ratio of earnings before interest, taxes, depreciation, and amortization (EBITDA) to total assets over the period 1994–2003 as a proxy for the riskiness of the firm. Consistent with capital structure theory, we find that financial leverage is positively correlated with risk. Controlling for risk, however, does not much alter the effect of our tax variables on leverage. We continue to find positive and statistically significant coefficients for β1 and β2, of about equal size as before. In regression (8), we control for financial development using the ratio of private credit to GDP rather than the index of creditor rights. While private credit to GDP does not enter significantly, unlike creditor rights did in previous regressions, our main results are not affected.
Finally, Table 10 reports several robustness checks where we alter the taxation variables. In regression (1) of Table 10, we control for the relative taxation of equity and internal debt of subsidiaries, or iϕ . We construct iϕ using information on corporate tax rates in the parent and subsidiary countries, withholding taxes on dividend and interest payments in the subsidiary country, and double tax relief conventions applied by the parent country to incoming dividend and interest payments. We find that iϕ does not enter significantly, and that our main results
15
are not affected after controlling for the relative taxation of equity and internal debt of subsidiaries.
In regression (2), we include “intermediate” companies, i.e., subsidiaries that are also parent companies of other subsidiaries, in the sample. This increases the sample from 49,248 to 57,409 observations. Our main results on the effect of taxation on financial leverage are unaffected, but we no longer find an effect of political risk on financial leverage.
In regression (3), we assess whether there is a differential effect of our tax variables on leverage for intermediate companies and pure subsidiaries (i.e., subsidiaries that are not themselves parent companies). We find a negative coefficient for an included intermediate firm dummy variable, while the leverage of intermediate firms tends to respond relatively strongly to changes in the effective marginal tax rate. A heightened role for taxation to affect the leverage of intermediate firms is to be expected, if these firms are important in the overall tax planning of the firm. The tax incentive to shift debt abroad, however, is found to affect the leverage of intermediate and pure subsidiaries similarly.
In regression (4), we split the tax incentive to shift debt variable in one component that captures the incentive to shift debt to the parent country and another component that captures the incentive to shift debt to subsidiaries in other countries than the host and parent countries. Interestingly, we find that on average the incentives to shift debt to the parent country and to other countries both matter, although leverage appears to be more sensitive to the tax incentive to shift debt to other countries. These results imply that multinational firms not only consider tax-motivated debt-shifting opportunities between a foreign subsidiary and the parent country, but also among the various foreign subsidiaries. This finding supports our thesis that multilateral—rather than bilateral—differences in tax rates determine the financial structure of multinational firms.
In regression (5), we split the effective tax rate variable into one part that captures the taxation in the source country (to be found by setting the tax rate of the parent country to zero) and the complement that captures the taxation in the resident country. Parent country taxes should matter relatively little to the extent that multinationals are able to defer parent country taxes on foreign-source income unless this income is repatriated to the parent country. We find that the source-country part of the effective tax rate has a positive and statistically significant impact on leverage, while the parent-country part obtains a negative and insignificant coefficient, perhaps reflecting the option of deferral.
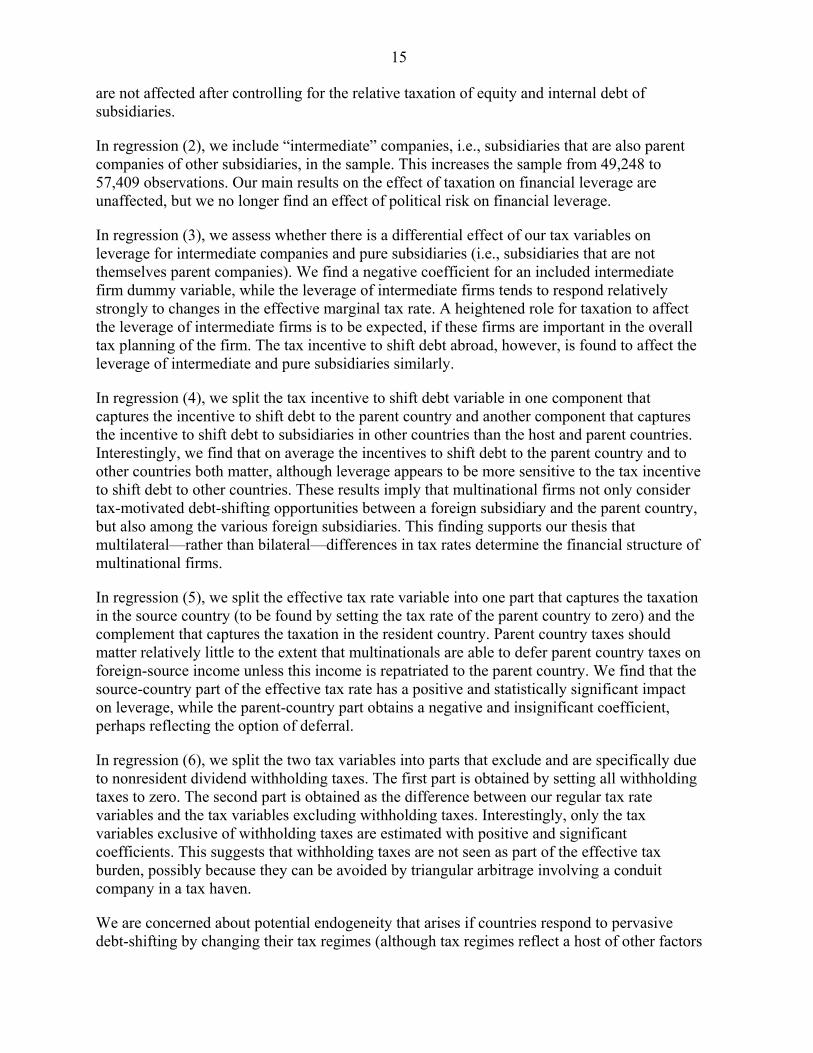
In regression (6), we split the two tax variables into parts that exclude and are specifically due to nonresident dividend withholding taxes. The first part is obtained by setting all withholding taxes to zero. The second part is obtained as the difference between our regular tax rate variables and the tax variables excluding withholding taxes. Interestingly, only the tax variables exclusive of withholding taxes are estimated with positive and significant coefficients. This suggests that withholding taxes are not seen as part of the effective tax burden, possibly because they can be avoided by triangular arbitrage involving a conduit company in a tax haven.
We are concerned about potential endogeneity that arises if countries respond to pervasive debt-shifting by changing their tax regimes (although tax regimes reflect a host of other factors
16
as well). Since larger countries tend to have higher tax rates, we use the populations of the subsidiary and parent countries as instruments in the construction of the effective tax rate variable. Specifically, we recompute the effective tax rate using the populations of the subsidiary and the parent countries instead of these countries’ tax rates, taking into account possible double tax relief and assuming withholding taxes are zero. Because we do not have separate instruments for the tax incentive to shift debt variable, we only include the effective tax rate in this robustness check. The results for this instrumental variables regression are very similar. The coefficient on the effective tax rate variable is statistically significant and of similar magnitude as in previous regressions. A F-test of the excluded instruments supports the choice of our instruments. The first-stage results (nor reported) indicate that effective tax rates tend to be higher in more populous countries.
VI. CONCLUSIONS
This paper has considered the sensitivity of the capital structure of multinational firms to taxation. Generally this capital structure depends on the national or international structure of the firm and on the tax systems of all the countries where a firm operates. On the basis of a large sample of European firms over the 1994–2003 period, we find that a firm’s leverage depends on national tax rates as well as international tax rate differences. The relationship between leverage and international tax rate differences reflects the presence of international debt-shifting. While statistically highly significant, both the “domestic” and “international” effects of taxation on leverage are rather small.
International debt-shifting is shown to reflect a subsidiary’s tax rate differences vis-à-vis the parent firm as well as vis-à-vis other foreign-subsidiaries. This finding confirms our premise that international debt-shifting reflects the tax regimes of all the countries where the multinational operates rather then just bilateral tax rate differences vis-à-vis the parent firm. In practice, source-level taxation appears to be more important in affecting leverage than the residence-level taxation levied by a multinational’s parent country. This finding may reflect that parent-country taxes on a multinational’s foreign-source income in practice can be deferred, in some cases indefinitely. At the same time, corporate tax rates rather than nonresident dividend withholding tax rates appear to matter for leverage. This could reflect that multinationals are able to avoid bilateral nonresident dividend withholding taxes by using conduit companies in third countries.
International debt-shifting serves to lower average levels of corporate income taxation in high-tax countries. Countries with relatively low rates of taxation may benefit from international debt-shifting, as local establishments of multinational firms will be less highly leveraged than they would otherwise be—resulting in a higher corporate income tax revenues. Overall, international debt-shifting may introduce some dead-weight losses in the form of implementation costs for the multinational firms and also costs inherent in deviations from the firm’s optimal financial structure on the basis of nontax considerations. An obvious way to eliminate international debt-shifting is to harmonize top corporate income tax rates internationally. Alternatively, international debt-shifting is moot in case countries introduce a common, consolidated tax base for multinational firms. Tax coordination of either kind is not very likely in the near future so that international debt-shifting will remain an important policy for multinationals worldwide.
17
Tabl
e 1.
Cor
pora
te T
axat
ion
and
Dou
ble-
Tax-
Rel
ief S
yste
ms f
or D
ivid
end
Rec
eive
d in
Sel
ecte
d Eu
rope
an C
ount
ries i
n 20
0315
St
atut
ory
corp
orat
e ta
x ra
te
incl
udin
g lo
cal t
axes
and
su
rcha
rges
(%)
Trea
tmen
t of f
orei
gn d
ivid
ends
fr
om tr
eaty
cou
ntrie
s Tr
eatm
ent o
f for
eign
div
iden
ds
from
non
-trea
ty c
ount
ries
Aus
tria
34
Exem
ptio
n Ex
empt
ion
Bel
gium
33
.99
95%
exe
mpt
ion
95%
exe
mpt
ion
Bul
garia
23
.5
Indi
rect
cre
dit
Dire
ct c
redi
t C
roat
ia
20
Exem
ptio
n Ex
empt
ion
Cyp
rus
15
Exem
ptio
n Ex
empt
ion
Cze
ch R
epub
lic
31
Indi
rect
cre
dit
Ded
uctio
n D
enm
ark
30
Exem
ptio
n Ex
empt
ion
Esto
nia
2616
In
dire
ct c
redi
t In
dire
ct c
redi
t Fi
nlan
d 29
Ex
empt
ion
Dire
ct c
redi
t Fr
ance
35
.4317
95
% e
xem
ptio
n 95
% e
xem
ptio
n G
erm
any
39.5
918
95%
exe
mpt
ion
95%
exe
mpt
ion
Gre
ece
35
Indi
rect
cre
dit
Indi
rect
cre
dit
Hun
gary
19
.6419
Ex
empt
ion
Exem
ptio
n Ic
elan
d 18
Ex
empt
ion
Exem
ptio
n Ire
land
12
.520
In
dire
ct c
redi
t In
dire
ct c
redi
t Ita
ly
38.2
5 60
% E
xem
ptio
n 60
% E
xem
ptio
n La
tvia
19
Ex
empt
ion
Exem
ptio
n Li
thua
nia
15
Exem
ptio
n Ex
empt
ion
Luxe
mbo
urg
30.3
821
Exem
ptio
n Ex
empt
ion
15
We
only
show
the
data
for t
he y
ear 2
003
but h
ave
colle
cted
dat
a on
tax
rate
s for
eac
h ye
ar in
our
sam
ple
perio
d. T
he c
ompl
ete
data
set o
n th
e in
tern
atio
nal
tax
data
col
lect
ed is
ava
ilabl
e up
on re
ques
t fro
m th
e au
thor
s. 16
Zer
o pe
rcen
t on
reta
ined
ear
ning
s. A
dis
tribu
tion
tax
of 2
6% is
app
lied
on d
istri
bute
d pr
ofit.
17
Incl
udin
g a
3% so
cial
surc
harg
e an
d a
spec
ial 3
.3%
surc
harg
e fo
r lar
ge c
ompa
nies
. 18
Incl
udin
g a
solid
arity
surc
harg
e of
5.5
% a
nd a
n av
erag
e de
duct
ible
trad
e ta
x of
16.
14%
. It a
lso
incl
udes
the
exce
ptio
nal 1
.5%
add
ition
al ta
x in
200
3.
19 In
clud
ing
a de
duct
ible
loca
l bus
ines
s tax
. 20
The
rate
is 2
5% fo
r non
-trad
ing
activ
ities
. 21
Incl
udin
g em
ploy
men
t sur
char
ge a
nd lo
cal t
axes
.
18
Tabl
e 1.
Cor
pora
te T
axat
ion
and
Dou
ble-
Tax-
Rel
ief S
yste
ms f
or D
ivid
end
Rec
eive
d in
Sel
ecte
d Eu
rope
an
Cou
ntrie
s in
2003
(con
tinue
d)
St
atut
ory
corp
orat
e ta
x ra
te
incl
udin
g lo
cal t
axes
and
su
rcha
rges
(%)
Trea
tmen
t of f
orei
gn d
ivid
ends
fr
om tr
eaty
cou
ntrie
s Tr
eatm
ent o
f for
eign
div
iden
ds
from
non
-trea
ty c
ount
ries
Mal
ta
35
Indi
rect
cre
dit
Indi
rect
cre
dit
Net
herla
nds
34.5
Ex
empt
ion
Exem
ptio
n N
orw
ay
28
Indi
rect
cre
dit
Indi
rect
cre
dit
Pola
nd
27
Indi
rect
cre
dit22
D
irect
Cre
dit
Portu
gal
33
Dire
ct c
redi
t23
Dire
ct c
redi
t R
oman
ia
25
Indi
rect
cre
dit
Indi
rect
cre
dit
Rus
sia
24
Dire
ct c
redi
t N
o re
lief
Slov
ak R
epub
lic
25
Indi
rect
cre
dit
No
relie
f Sl
oven
ia
25
Exem
ptio
n Ex
empt
ion
Spai
n 35
Ex
empt
ion
Indi
rect
cre
dit
Swed
en
28
Exem
ptio
n Ex
empt
ion
Switz
erla
nd
21.7
424
Exem
ptio
n Ex
empt
ion
Turk
ey
33
Indi
rect
cre
dit
Dire
ct c
redi
t U
nite
d K
ingd
om
30
Indi
rect
cre
dit
Indi
rect
cre
dit
Not
e : D
ivid
ends
are
ass
umed
to b
e pa
id b
y fu
lly o
wne
d su
bsid
iarie
s. So
urce
: In
tern
atio
nal B
urea
u of
Fis
cal D
ocum
enta
tion.
22
Indi
rect
tax
cred
it if
hold
ing
75%
for t
wo
year
s and
trea
ty a
nd w
here
the
EU P
aren
t-sub
sidi
ary
dire
ctiv
e ho
lds.
23 E
xem
ptio
n if
EU P
aren
t-Sub
sidi
ary
dire
ctiv
e ap
plie
s (bu
t for
eign
with
hold
ing
tax
is n
ot c
redi
tabl
e).
24 In
clud
ing
cant
onal
and
loca
l tax
es in
Zur
ich.

19
Tabl
e 2.
Bila
tera
l With
hold
ing
Tax
on D
ivid
end
Paym
ents
Bet
wee
n Fu
lly O
wne
d Fo
reig
n Su
bsid
iary
and
Par
ent o
n Ja
nuar
y 1,
200
3
2003
OEBE
BGHR
CYCZ
DKEE
FIFR
DEGR
HUIC
IEIT
LVLT
LUMT
NLNO
PLPT
RORU
SKSI
ESSE
CHTR
GBAu
stria
X0
00
1010
05
00
00
1025
00
2525
015
05
100
155
105
00
025
0Be
lgium
0X
1010
105
025
00
00
1025
00
2525
015
05
100
510
55
00
1015
0Bu
lgaria
010
X5
510
515
105
1510
1015
510
1515
50
515
1010
1015
1015
510
510
10Cr
oatia
010
5X
105
515
55
05
515
1510
515
155
515
515
55
515
515
510
5Cy
prus
00
00
X0
00
00
00
00
00
00
00
00
00
00
00
00
00
0Cz
ech R
ep.
105
105
10X
155
510
515
55
515
55
55
05
510
1010
55
50
515
5De
nmar
k0
05
510
15X
50
00
05
00
05
50
00
00
010
1015
50
00
150
Esto
nia0
00
00
00
X0
00
00
00
00
00
00
00
00
00
00
00
00
Finlan
d0
010
529
00
0X
00
05
00
00
00
00
00
00
00
50
00
150
Fran
ce0
05
510
100
50
X0
05
50
05
50
50
05
010
1010
50
05
150
Germ
any
00
1515
105
05
00
X0
55
00
55
05
00
50
105
515
00
015
0Gr
eece
00
00
00
00
00
0X
00
00
00
00
00
00
00
00
00
00
0Hu
ngary
1010
1010
55
520
55
510
X20
510
2020
55
510
1010
510
510
55
1010
5Ice
land
1515
1515
155
05
05
515
15X
1515
55
515
00
510
1515
1515
50
515
5Ire
land
00
020
00
00
00
020
020
X0
00
020
00
00
00
00
00
020
0Ita
ly0
010
1015
150
50
00
010
270
027
50
150
1510
010
515
100
015
150
Latvi
a10
1010
510
55
55
55
1010
55
10X
010
55
55
1010
1010
510
55
105
Lithu
ania
1515
155
155
50
55
515
155
55
0X
1515
55
515
1015
105
55
510
5Lu
xemb
ourg
00
020
200
020
00
00
00
00
2020
X0
00
00
00
00
00
020
0Ma
lta0
00
00
00
00
00
00
00
00
00
X0
00
00
00
00
00
00
Neth
erlan
ds0
05
025
00
50
00
05
00
05
50
5X
00
00
50
50
00
50
Norw
ay5
1515
150
50
50
00
2010
00
155
55
150
X5
1010
105
1510
05
205
Polan
d10
1010
510
55
55
55
1510
50
105
55
50
5X
105
105
55
55
105
Portu
gal
00
1530
3015
030
00
00
1515
00
3030
015
015
15X
1515
3030
00
1530
0Ro
mania
105
105
1010
1010
510
1010
510
310
1010
55
510
510
X10
105
1010
1010
10Ru
ssia
515
155
010
1015
55
515
1015
105
1515
1015
510
1010
15X
1010
55
510
10Sl
ovak
Rep
.10
510
510
515
155
105
155
150
1510
105
50
55
1510
10X
55
05
55
Slove
nia5
515
1510
55
155
515
1510
155
105
55
155
155
1515
105
X5
55
155
Spain
00
515
155
015
00
00
55
00
1515
015
010
50
55
55
X0
1015
0Sw
eden
00
00
00
00
00
00
00
00
00
00
00
00
00
00
0X
00
0Sw
itzer
land
510
535
355
035
55
55
105
1015
55
035
05
510
105
515
100
X35
5Tu
rkey
16,5
16,5
16,5
1116
,516
,516
,516
,516
,516
,516
,516
,511
16,5
16,5
16,5
16,5
1116
,516
,516
,516
,511
16,5
16,5
115,5
16,5
16,5
16,5
16,5
X16
,5Un
ited K
ingdo
m0
00
00
00
00
00
00
00
00
00
00
00
00
00
00
00
0X
N
otes
: (a
) The
Par
ent-S
ubsi
diar
y di
rect
ive
is b
indi
ng b
etw
een
EU M
embe
r Sta
tes
and
prov
ides
exe
mpt
ion
from
with
hold
ing
tax
whe
n ho
ldin
g is
at l
east
25%
. (b)
Irel
and:
com
pani
es lo
cate
d in
EU
or t
reat
y co
untri
es a
re e
xem
pt f
rom
with
hold
ing
tax
prov
ided
that
they
are
not
und
er th
e co
ntro
l of p
erso
ns n
ot r
esid
ent i
n su
ch c
ount
ries.
(c)
Esto
nia:
gen
eral
exe
mpt
ion
from
with
hold
ing
tax
if ho
ldin
g in
for
eign
co
mpa
ny is
at l
east
25%
. (d)
Ita
ly: i
f th
e re
cipi
ent c
an p
rove
a ta
x is
pai
d in
its
coun
try o
n th
e di
vide
nd, t
he I
talia
n au
thor
ities
can
pro
vide
a r
efun
d eq
ual t
o th
e ta
x cl
aim
ed li
mite
d to
4/9
of
the
Italia
n w
ithho
ldin
g ta
x. (e
) Lith
uani
a: g
ener
al e
xem
ptio
n fr
om w
ithho
ldin
g ta
x if
hold
ing
in fo
reig
n co
mpa
ny is
at l
east
25%
. (f)
Lux
embo
urg:
exe
mpt
ion
from
with
hold
ing
tax
for E
U a
nd tr
eaty
par
tner
s if
hold
ing
in f
orei
gn c
ompa
ny is
at l
east
10%
. (g)
Sw
eden
: no
with
hold
ing
tax
if ho
ldin
g is
25%
and
ther
e is
nor
mal
cor
pora
te ta
xatio
n in
the
fore
ign
coun
try a
nd if
the
shar
es a
re h
eld
for
busi
ness
-rel
ated
rea
sons
. So
urce
: Int
erna
tiona
l Bur
eau
of F
isca
l Doc
umen
tatio
n.
20
Tabl
e 3.
Exi
sten
ce o
f a B
ilate
ral T
ax T
reat
y on
Janu
ary
1, 2
003
Sour
ce: I
nter
natio
nal B
urea
u of
Fis
cal D
ocum
enta
tion,
var
ious
min
istri
es’ w
ebsi
tes.
2003
OEBE
BGHR
CYCZ
DKEE
FIFR
DEGR
HUIC
IEIT
LVLT
LUMT
NLNO
PLPT
RORU
SKSI
ESSE
CHTR
GBOE
X1
11
11
11
11
11
10
11
00
11
11
11
11
11
11
11
1BE
1X
11
11
10
11
11
10
11
00
11
11
11
11
11
11
11
1BG
11
X1
11
10
11
11
10
11
00
11
11
11
10
10
11
10
1HR
11
0X
01
10
11
11
10
01
11
00
11
10
11
10
01
00
1CY
11
10
X1
10
01
11
10
11
00
01
01
10
11
11
01
00
1CZ
11
11
1X
11
11
11
11
11
11
10
11
11
11
11
11
10
1DK
11
11
11
X1
11
11
11
11
11
11
11
10
11
11
11
11
1EE
00
00
01
1X
11
10
01
11
11
00
11
10
00
00
01
00
1FI
11
11
01
11
X1
11
11
11
11
11
11
11
11
11
11
11
1FR
11
11
11
11
1X
11
11
11
11
11
11
11
11
11
11
11
1DE
11
11
11
11
11
X1
11
11
11
11
11
11
11
11
11
11
1GR
11
11
11
10
11
1X
10
11
00
10
11
11
10
10
11
10
1HU
11
11
11
10
11
11
X0
11
00
11
11
11
11
11
11
11
1IC
00
00
01
11
11
10
0X
00
11
10
11
11
00
00
11
10
1IE
11
10
11
11
11
10
10
X1
11
10
11
11
11
11
11
10
1IT
11
11
11
11
11
11
10
1X
01
11
11
11
11
11
11
11
1LV
00
01
01
11
11
10
01
10
X1
00
11
10
10
11
01
10
1LT
00
01
01
11
11
10
01
11
1X
00
11
10
10
11
01
10
1LU
11
10
01
10
11
11
11
11
00
X1
11
11
11
11
11
10
1MT
11
11
11
11
11
10
10
01
10
1X
11
11
10
10
01
10
1NL
11
11
01
11
11
11
11
11
11
11
X1
11
11
11
11
11
1NO
11
11
11
11
11
11
11
11
11
11
1X
11
11
11
11
11
1PL
11
11
11
11
11
11
11
11
11
11
11
X1
11
11
11
11
1PT
11
10
01
10
11
11
11
11
00
11
11
1X
11
10
10
10
1RO
11
11
11
10
11
11
10
11
11
10
11
11
X1
11
11
11
1RU
11
11
11
10
11
10
10
11
00
10
11
11
1X
10
11
11
1SK
11
11
11
10
11
11
10
11
11
11
11
11
11
X1
11
11
1SI
11
00
11
10
11
10
10
11
11
10
11
10
11
1X
11
10
1ES
11
10
01
10
11
11
11
11
00
10
11
11
11
11
X1
10
1SE
11
11
11
11
11
11
11
11
11
11
11
11
11
11
1X
11
1CH
11
10
01
10
11
11
11
11
11
11
11
11
11
11
11
X0
1TR
11
11
00
10
11
10
10
01
01
00
11
10
11
10
01
0X
1GB
11
11
11
11
11
11
11
11
11
11
11
11
11
11
11
11
X

21
Tabl
e 4.
Bila
tera
l With
hold
ing
Tax
on In
tere
st P
aym
ents
Bet
wee
n Fu
lly O
wne
d Fo
reig
n Su
bsid
iary
and
Par
ent o
n Ja
nuar
y 1,
200
3
Not
es :
(a) I
rela
nd: i
nter
est p
aid
to a
75%
non
resi
dent
par
ent i
s dee
med
to b
e a
divi
dend
. (b)
Spa
in: i
nter
est i
s gen
eral
ly e
xem
pt fr
om ta
x in
Spa
in p
rovi
ded
the
dire
ct b
enef
icia
ry is
a re
side
nt in
ano
ther
EU
Mem
ber
Stat
e. (c
) Est
onia
: 0%
if ra
te in
reci
pien
t cou
ntry
is n
ot lo
wer
than
2/3
of t
he E
ston
ia ta
x ra
te o
n in
tere
st o
f 26%
. (d)
Sw
itzer
land
: no
with
hold
ing
tax
on o
rdin
ary
loan
s, 35
% o
n bo
nds a
nd d
epos
its. (
e)Tu
rkey
: ex
empt
ion
for g
over
nmen
t bon
ds a
nd d
eben
ture
s, as
wel
l as l
oans
obt
aine
d fr
om fo
reig
n co
mpa
nies
and
inst
itutio
ns, (
f) It
aly:
zer
o w
ithho
ldin
g ta
x w
ith tr
eaty
cou
ntrie
s for
pub
lic b
onds
, priv
ate
bond
s, an
d de
posi
ts;
27%
with
non
-trea
ty c
ount
ries f
or d
epos
its a
nd p
rivat
e bo
nds o
f mat
urity
of l
ess t
han
18 m
onth
s; 1
2.5%
oth
erw
ise.
Sou
rce:
Inte
rnat
iona
l Bur
eau
of F
isca
l Doc
umen
tatio
n.
2003
OEBE
BGHR
CYCZ
DKEE
FIFR
DEGR
HUIC
IEIT
LVLT
LUMT
NLNO
PLPT
RORU
SKSI
ESSE
CHTR
GBAu
stria
X0
00
00
00
00
00
00
00
00
00
00
00
00
00
00
00
0Be
lgium
15X
1015
1010
1515
1015
1510
1515
1515
1515
1510
1015
1015
1010
1010
1510
1015
15Bu
lgaria
010
X5
710
015
00
015
1015
50
1515
100
00
1010
1515
1015
00
1010
0Cr
oatia
515
5X
100
015
00
010
015
1510
1010
150
00
1015
1010
1015
150
510
10Cy
prus
00
00
x0
00
00
00
00
00
00
00
00
00
00
00
00
00
0Cz
ech R
ep.
010
100
10X
010
00
010
00
00
1010
00
00
1010
70
05
00
015
0De
nmar
k0
00
00
0X
00
00
00
00
00
00
00
00
00
00
00
00
00
Esto
nia10
2626
2626
1010
X10
1010
2626
1010
1010
026
1010
1010
2626
2626
2626
1026
2610
Finlan
d0
00
00
00
0X
00
00
00
00
00
00
00
00
00
00
00
00
Fran
ce0
00
00
00
00
X0
00
00
00
00
00
00
00
00
00
00
00
Germ
any
00
00
00
00
00
X0
00
00
00
00
00
00
00
00
00
00
0Gr
eece
00
00
00
00
00
0X
00
00
00
00
00
00
00
00
00
00
0Hu
ngar
y0
1510
010
00
180
00
10X
180
018
180
100
010
1015
00
00
010
100
Icelan
d0
00
00
00
00
00
00
X0
00
00
00
00
00
00
00
00
00
Irelan
d0
00
200
00
00
00
00
20X
00
00
200
00
00
00
00
00
200
Italy
00
00
00
00
00
00
012
,50
X12
,50
00
00
00
00
00
00
00
0La
tvia
1010
1010
1010
1010
1010
1010
1010
1010
X0
1010
1010
1010
1010
1010
1010
1010
10Lit
huan
ian.a
.n.a
.n.a
.n.a
.n.a
.n.a
.n.a
.n.a
.n.a
.n.a
.n.a
.n.a
.n.a
.n.a
.n.a
.n.a
.n.a
.n.a
.n.a
.n.a
.n.a
.n.a
.n.a
.n.a
.n.a
.n.a
.n.a
.n.a
.n.a
.n.a
.n.a
.n.a
.n.a
.Lu
xemb
ourg
00
00
00
00
00
00
00
00
00
X0
00
00
00
00
00
00
0Ma
lta0
00
00
00
00
00
00
00
00
00
X0
00
00
00
00
00
00
Neth
erlan
ds0
00
00
00
00
00
00
00
00
00
0X
00
00
00
00
00
00
Norw
ay0
00
00
00
00
00
00
00
00
00
00
X0
00
00
00
00
00
Polan
d0
1010
1010
105
100
00
1010
1010
1010
1010
100
0X
1010
1010
100
010
100
Portu
gal
1015
1020
2010
1020
1512
1515
1010
1515
2020
1510
1015
10X
1010
2020
1520
1020
10Ro
mania
1010
107,5
107
1010
510
1010
1010
310
1010
105
010
1010
X10
107,5
1010
1010
10Ru
ssia
015
2010
00
020
00
020
020
010
2020
020
010
1010
20X
010
50
1010
0Sl
ovak
Rep
.0
1010
1010
00
250
00
100
250
010
100
00
010
2510
0X
00
010
100
Slov
enia
00
00
00
00
00
00
00
00
00
00
00
00
00
0X
00
00
0Sp
ain0
00
1515
00
150
00
00
50
015
150
150
100
010
50
5X
010
150
Swed
en0
00
00
00
00
00
00
00
00
00
00
00
00
00
00
X0
00
Switz
erlan
d0
00
00
00
00
00
00
00
00
00
00
00
00
00
00
0X
00
Turk
ey0
00
00
00
00
00
00
00
00
00
00
00
00
00
00
00
X0
Unite
d King
dom
015
010
100
010
00
030
00
010
1010
010
00
010
100
010
120
015
X
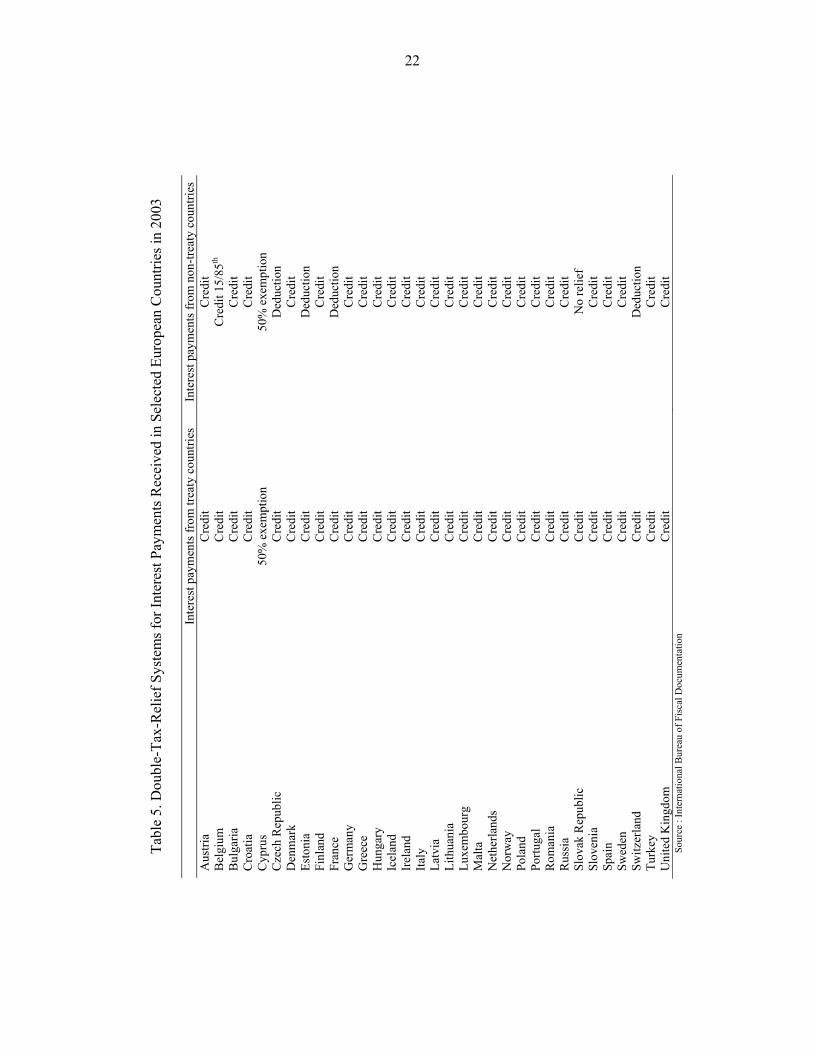
22
Tabl
e 5.
Dou
ble-
Tax-
Rel
ief S
yste
ms f
or In
tere
st P
aym
ents
Rec
eive
d in
Sel
ecte
d Eu
rope
an C
ount
ries i
n 20
03
Inte
rest
pay
men
ts fr
om tr
eaty
cou
ntrie
s In
tere
st p
aym
ents
from
non
-trea
ty c
ount
ries
Aus
tria
Cre
dit
Cre
dit
Bel
gium
C
redi
t C
redi
t 15/
85th
B
ulga
ria
Cre
dit
Cre
dit
Cro
atia
C
redi
t C
redi
t C
ypru
s 50
% e
xem
ptio
n 50
% e
xem
ptio
n C
zech
Rep
ublic
C
redi
t D
educ
tion
Den
mar
k C
redi
t C
redi
t Es
toni
a C
redi
t D
educ
tion
Finl
and
Cre
dit
Cre
dit
Fran
ce
Cre
dit
Ded
uctio
n G
erm
any
Cre
dit
Cre
dit
Gre
ece
Cre
dit
Cre
dit
Hun
gary
C
redi
t C
redi
t Ic
elan
d C
redi
t C
redi
t Ire
land
C
redi
t C
redi
t Ita
ly
Cre
dit
Cre
dit
Latv
ia
Cre
dit
Cre
dit
Lith
uani
a C
redi
t C
redi
t Lu
xem
bour
g C
redi
t C
redi
t M
alta
C
redi
t C
redi
t N
ethe
rland
s C
redi
t C
redi
t N
orw
ay
Cre
dit
Cre
dit
Pola
nd
Cre
dit
Cre
dit
Portu
gal
Cre
dit
Cre
dit
Rom
ania
C
redi
t C
redi
t R
ussi
a C
redi
t C
redi
t Sl
ovak
Rep
ublic
C
redi
t N
o re
lief
Slov
enia
C
redi
t C
redi
t Sp
ain
Cre
dit
Cre
dit
Swed
en
Cre
dit
Cre
dit
Switz
erla
nd
Cre
dit
Ded
uctio
n Tu
rkey
C
redi
t C
redi
t U
nite
d K
ingd
om
Cre
dit
Cre
dit
Sour
ce :
Inte
rnat
iona
l Bur
eau
of F
isca
l Doc
umen
tatio
n

23
Tabl
e 6.
Exp
ress
ions
for
iϕ
or th
e R
elat
ive
Taxa
tion
of E
quity
and
Inte
rnal
Deb
t of S
ubsi
diar
ies
Trea
tmen
t of
- Deb
t -
- Equ
ity -
Exe
mpt
ion
Cre
dit
Ded
uctio
n
Exe
mpt
ion
d ie i
ie i
iw
wtw
t−
−+
],
max
[p
d ie i
ie i
it
wwt
wt
−−
+
][
d ip
d ip
e ii
e ii
wt
wt
wtw
t−
+−
−+
Indi
rect
cre
dit
[]
d ip
e ii
ii
wt
wtw
t−
+,
max
[]
[]
pd i
pe i
ii
it
wt
wt
wt
,m
ax,
max
−+
[]
][
,m
axp
d id i
pp
e ii
ii
tw
wt
tw
tw
t−
+−
+
D
irec
t cre
dit
d ie i
pi
iw
wt
tt
−−
+]
,m
ax[
)1(
],
max
[)
1(e i
pi
iw
tt
t−
+[
]p
d it
w,
max
−
],
max
[)
1(e i
pi
iw
tt
t−
+]
[p
d id i
pt
ww
t−
+−
Ded
uctio
n (
)()(
)d i
pe i
iw
tw
t−
−−
−−
11
11
()(
)()
],
max
[1
11
1p
d ip
e ii
tw
tw
t−
−−
−−
][
)1)(
1)(1(
1d i
pd i
pp
e ii
wt
wt
tw
t−
+−
−−
−−
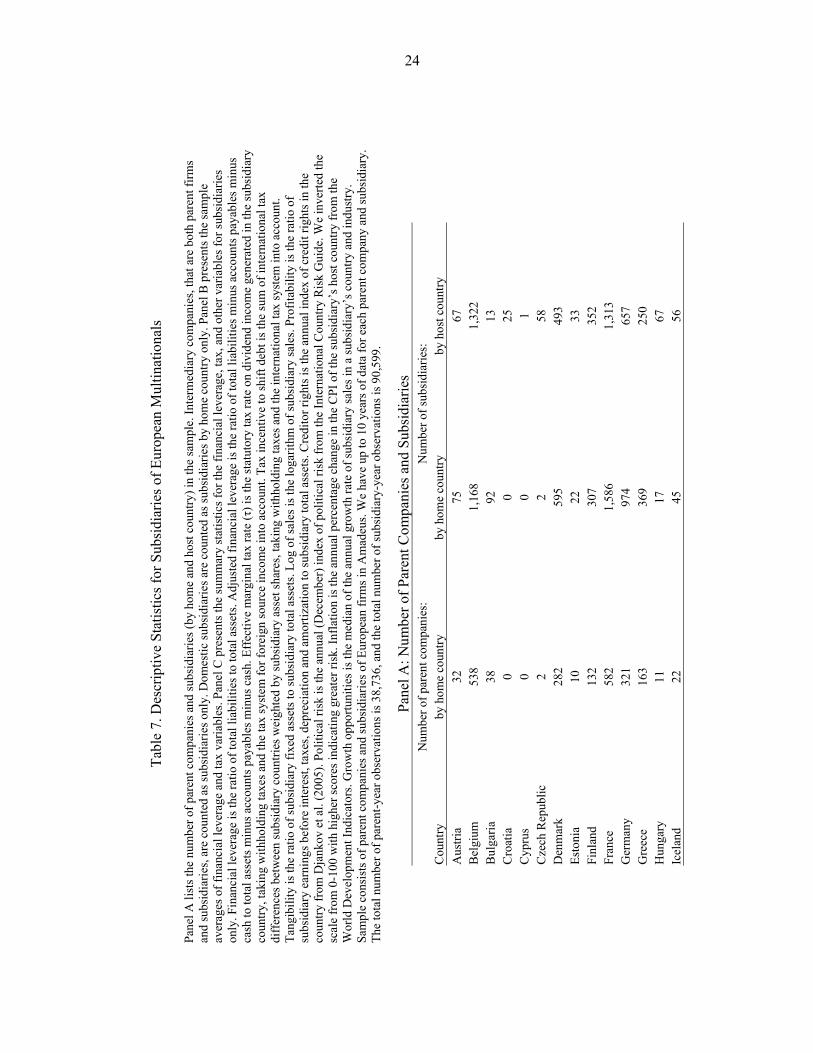
24
Tabl
e 7.
Des
crip
tive
Stat
istic
s for
Sub
sidi
arie
s of E
urop
ean
Mul
tinat
iona
ls
Pane
l A li
sts t
he n
umbe
r of p
aren
t com
pani
es a
nd su
bsid
iarie
s (by
hom
e an
d ho
st c
ount
ry) i
n th
e sa
mpl
e. In
term
edia
ry c
ompa
nies
, tha
t are
bot
h pa
rent
firm
s an
d su
bsid
iarie
s, ar
e co
unte
d as
subs
idia
ries o
nly.
Dom
estic
subs
idia
ries a
re c
ount
ed a
s sub
sidi
arie
s by
hom
e co
untry
onl
y. P
anel
B p
rese
nts t
he sa
mpl
e av
erag
es o
f fin
anci
al le
vera
ge a
nd ta
x va
riabl
es. P
anel
C p
rese
nts t
he su
mm
ary
stat
istic
s for
the
finan
cial
leve
rage
, tax
, and
oth
er v
aria
bles
for s
ubsi
diar
ies
only
. Fin
anci
al le
vera
ge is
the
ratio
of t
otal
liab
ilitie
s to
tota
l ass
ets.
Adj
uste
d fin
anci
al le
vera
ge is
the
ratio
of t
otal
liab
ilitie
s min
us a
ccou
nts p
ayab
les m
inus
ca
sh to
tota
l ass
ets m
inus
acc
ount
s pay
able
s min
us c
ash.
Eff
ectiv
e m
argi
nal t
ax ra
te (τ
) is t
he st
atut
ory
tax
rate
on
divi
dend
inco
me
gene
rate
d in
the
subs
idia
ry
coun
try, t
akin
g w
ithho
ldin
g ta
xes a
nd th
e ta
x sy
stem
for f
orei
gn so
urce
inco
me
into
acc
ount
. Tax
ince
ntiv
e to
shift
deb
t is t
he su
m o
f int
erna
tiona
l tax
di
ffer
ence
s bet
wee
n su
bsid
iary
cou
ntrie
s wei
ghte
d by
subs
idia
ry a
sset
shar
es, t
akin
g w
ithho
ldin
g ta
xes a
nd th
e in
tern
atio
nal t
ax sy
stem
into
acc
ount
. Ta
ngib
ility
is th
e ra
tio o
f sub
sidi
ary
fixed
ass
ets t
o su
bsid
iary
tota
l ass
ets.
Log
of sa
les i
s the
loga
rithm
of s
ubsid
iary
sale
s. Pr
ofita
bilit
y is
the
ratio
of
subs
idia
ry e
arni
ngs b
efor
e in
tere
st, t
axes
, dep
reci
atio
n an
d am
ortiz
atio
n to
subs
idia
ry to
tal a
sset
s. C
redi
tor r
ight
s is t
he a
nnua
l ind
ex o
f cre
dit r
ight
s in
the
coun
try fr
om D
jank
ov e
t al.
(200
5). P
oliti
cal r
isk
is th
e an
nual
(Dec
embe
r) in
dex
of p
oliti
cal r
isk
from
the
Inte
rnat
iona
l Cou
ntry
Ris
k G
uide
. We
inve
rted
the
scal
e fr
om 0
-100
with
hig
her s
core
s ind
icat
ing
grea
ter r
isk.
Infla
tion
is th
e an
nual
per
cent
age
chan
ge in
the
CPI
of t
he su
bsid
iary
’s h
ost c
ount
ry fr
om th
e W
orld
Dev
elop
men
t Ind
icat
ors.
Gro
wth
opp
ortu
nitie
s is t
he m
edia
n of
the
annu
al g
row
th ra
te o
f sub
sidi
ary
sale
s in
a su
bsid
iary
’s c
ount
ry a
nd in
dustr
y.
Sam
ple
cons
ists
of p
aren
t com
pani
es a
nd su
bsid
iarie
s of E
urop
ean
firm
s in
Am
adeu
s. W
e ha
ve u
p to
10
year
s of d
ata
for e
ach
pare
nt c
ompa
ny a
nd su
bsid
iary
. Th
e to
tal n
umbe
r of p
aren
t-yea
r obs
erva
tions
is 3
8,73
6, a
nd th
e to
tal n
umbe
r of s
ubsi
diar
y-ye
ar o
bser
vatio
ns is
90,
599.
Pane
l A: N
umbe
r of P
aren
t Com
pani
es a
nd S
ubsi
diar
ies
N
umbe
r of p
aren
t com
pani
es:
Num
ber o
f sub
sidi
arie
s:
Cou
ntry
by
hom
e co
untry
by
hom
e co
untry
by
hos
t cou
ntry
A
ustri
a 32
75
67
B
elgi
um
538
1,16
8 1,
322
Bul
garia
38
92
13
C
roat
ia
0 0
25
Cyp
rus
0 0
1 C
zech
Rep
ublic
2
2 58
D
enm
ark
282
595
493
Esto
nia
10
22
33
Finl
and
132
307
352
Fran
ce
582
1,58
6 1,
313
Ger
man
y 32
1 97
4 65
7 G
reec
e 16
3 36
9 25
0 H
unga
ry
11
17
67
Icel
and
22
45
56
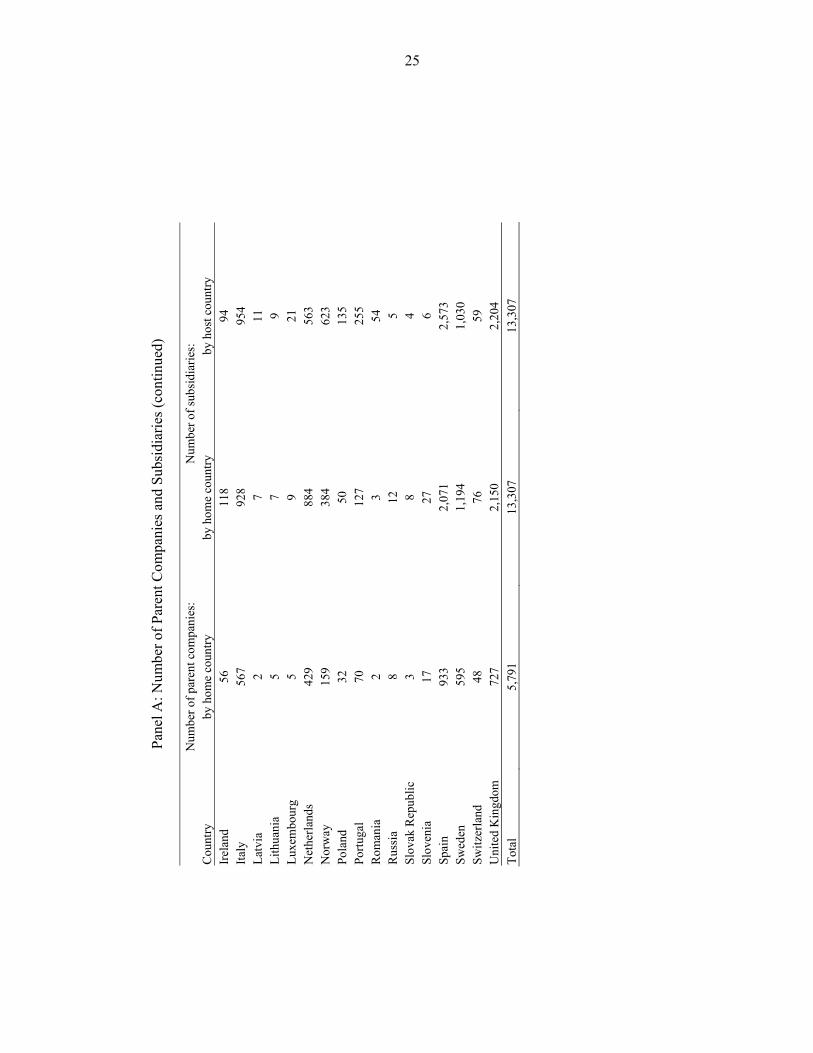
25
Pane
l A: N
umbe
r of P
aren
t Com
pani
es a
nd S
ubsi
diar
ies (
cont
inue
d)
Num
ber o
f par
ent c
ompa
nies
: N
umbe
r of s
ubsi
diar
ies:
C
ount
ry
by h
ome
coun
try
by h
ome
coun
try
by h
ost c
ount
ry
Irela
nd
56
118
94
Italy
56
7 92
8 95
4 La
tvia
2
7 11
Li
thua
nia
5 7
9 Lu
xem
bour
g 5
9 21
N
ethe
rland
s 42
9 88
4 56
3 N
orw
ay
159
384
623
Pola
nd
32
50
135
Portu
gal
70
127
255
Rom
ania
2
3 54
R
ussi
a 8
12
5 Sl
ovak
Rep
ublic
3
8 4
Slov
enia
17
27
6
Spai
n 93
3 2,
071
2,57
3 Sw
eden
59
5 1,
194
1,03
0 Sw
itzer
land
48
76
59
U
nite
d K
ingd
om
727
2,15
0 2,
204
Tota
l 5,
791
13,3
07
13,3
07
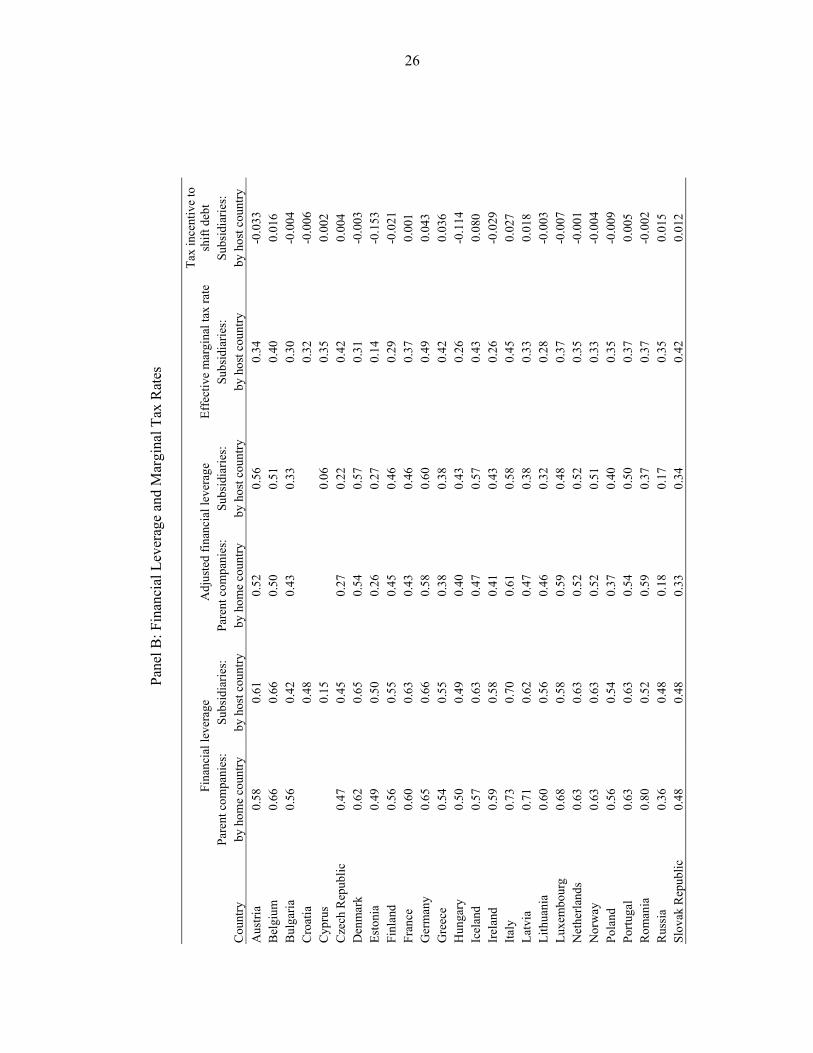
26
Pane
l B: F
inan
cial
Lev
erag
e an
d M
argi
nal T
ax R
ates
Fi
nanc
ial l
ever
age
Adj
uste
d fin
anci
al le
vera
ge
Effe
ctiv
e m
argi
nal t
ax ra
te
Tax
ince
ntiv
e to
sh
ift d
ebt
Pa
rent
com
pani
es:
Subs
idia
ries:
Pa
rent
com
pani
es:
Subs
idia
ries:
Su
bsid
iarie
s:
Subs
idia
ries:
C
ount
ry
by h
ome
coun
try
by h
ost c
ount
ry
by h
ome
coun
try
by h
ost c
ount
ry
by h
ost c
ount
ry
by h
ost c
ount
ry
Aus
tria
0.58
0.
61
0.52
0.
56
0.34
-0
.033
B
elgi
um
0.66
0.
66
0.50
0.
51
0.40
0.
016
Bul
garia
0.
56
0.42
0.
43
0.33
0.
30
-0.0
04
Cro
atia
0.48
0.
32
-0.0
06
Cyp
rus
0.
15
0.
06
0.35
0.
002
Cze
ch R
epub
lic
0.47
0.
45
0.27
0.
22
0.42
0.
004
Den
mar
k 0.
62
0.65
0.
54
0.57
0.
31
-0.0
03
Esto
nia
0.49
0.
50
0.26
0.
27
0.14
-0
.153
Fi
nlan
d 0.
56
0.55
0.
45
0.46
0.
29
-0.0
21
Fran
ce
0.60
0.
63
0.43
0.
46
0.37
0.
001
Ger
man
y 0.
65
0.66
0.
58
0.60
0.
49
0.04
3 G
reec
e 0.
54
0.55
0.
38
0.38
0.
42
0.03
6 H
unga
ry
0.50
0.
49
0.40
0.
43
0.26
-0
.114
Ic
elan
d 0.
57
0.63
0.
47
0.57
0.
43
0.08
0 Ir
elan
d 0.
59
0.58
0.
41
0.43
0.
26
-0.0
29
Italy
0.
73
0.70
0.
61
0.58
0.
45
0.02
7 La
tvia
0.
71
0.62
0.
47
0.38
0.
33
0.01
8 Li
thua
nia
0.60
0.
56
0.46
0.
32
0.28
-0
.003
Lu
xem
bour
g 0.
68
0.58
0.
59
0.48
0.
37
-0.0
07
Net
herla
nds
0.63
0.
63
0.52
0.
52
0.35
-0
.001
N
orw
ay
0.63
0.
63
0.52
0.
51
0.33
-0
.004
Po
land
0.
56
0.54
0.
37
0.40
0.
35
-0.0
09
Portu
gal
0.63
0.
63
0.54
0.
50
0.37
0.
005
Rom
ania
0.
80
0.52
0.
59
0.37
0.
37
-0.0
02
Rus
sia
0.36
0.
48
0.18
0.
17
0.35
0.
015
Slov
ak R
epub
lic
0.48
0.
48
0.33
0.
34
0.42
0.
012
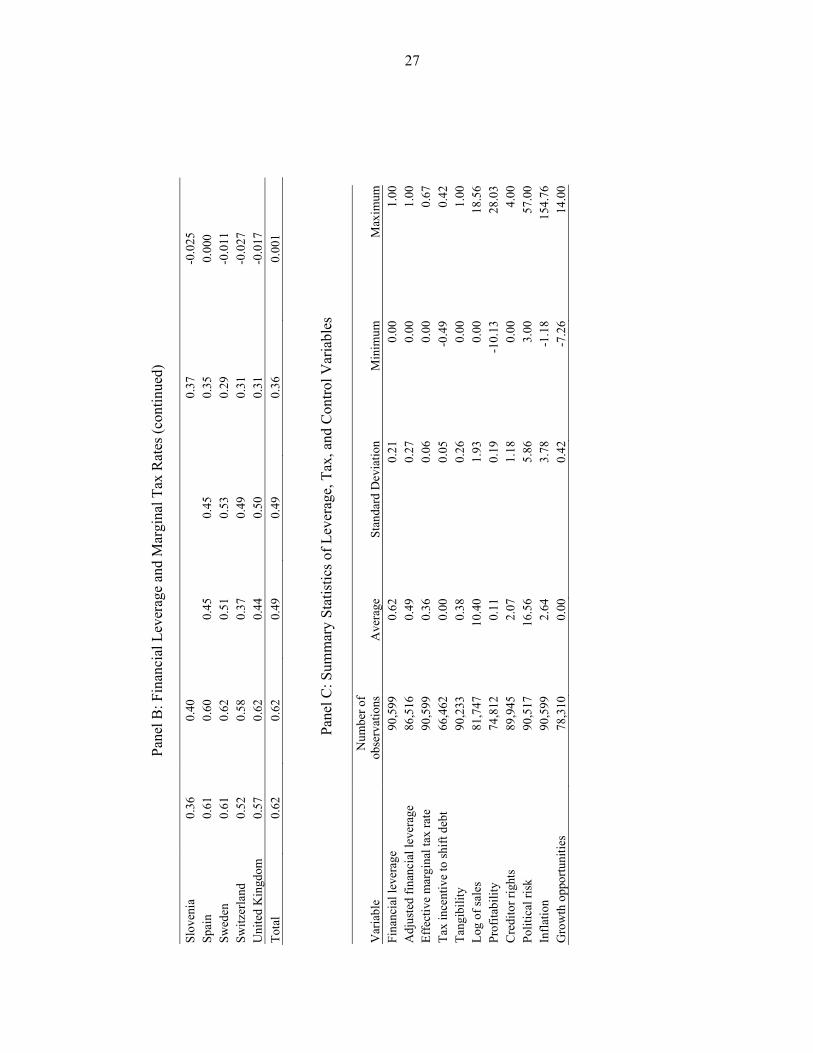
27
Pane
l B: F
inan
cial
Lev
erag
e an
d M
argi
nal T
ax R
ates
(con
tinue
d)
Slov
enia
0.
36
0.40
0.
37
-0.0
25
Spai
n 0.
61
0.60
0.
45
0.45
0.
35
0.00
0 Sw
eden
0.
61
0.62
0.
51
0.53
0.
29
-0.0
11
Switz
erla
nd
0.52
0.
58
0.37
0.
49
0.31
-0
.027
U
nite
d K
ingd
om
0.57
0.
62
0.44
0.
50
0.31
-0
.017
To
tal
0.62
0.
62
0.49
0.
49
0.36
0.
001
Pa
nel C
: Sum
mar
y St
atis
tics o
f Lev
erag
e, T
ax, a
nd C
ontro
l Var
iabl
es
Var
iabl
e N
umbe
rof
obse
rvat
ions
Ave
rage
Stan
dard
Dev
iatio
n M
inim
umM
axim
umFi
nanc
ial l
ever
age
90,5
990.
620.
21
0.00
1.00
Adj
uste
d fin
anci
al le
vera
ge
86,5
160.
490.
27
0.00
1.00
Effe
ctiv
e m
argi
nal t
ax ra
te
90,5
990.
360.
06
0.00
0.67
Tax
ince
ntiv
e to
shift
deb
t 66
,462
0.00
0.05
-0
.49
0.42
Tang
ibili
ty
90,2
330.
380.
26
0.00
1.00
Log
of sa
les
81,7
4710
.40
1.93
0.
0018
.56
Prof
itabi
lity
74,8
120.
110.
19
-10.
1328
.03
Cre
dito
r rig
hts
89,9
452.
071.
18
0.00
4.00
Polit
ical
risk
90
,517
16.5
65.
86
3.00
57.0
0In
flatio
n 90
,599
2.64
3.78
-1
.18
154.
76G
row
th o
ppor
tuni
ties
78,3
100.
000.
42
-7.2
614
.00
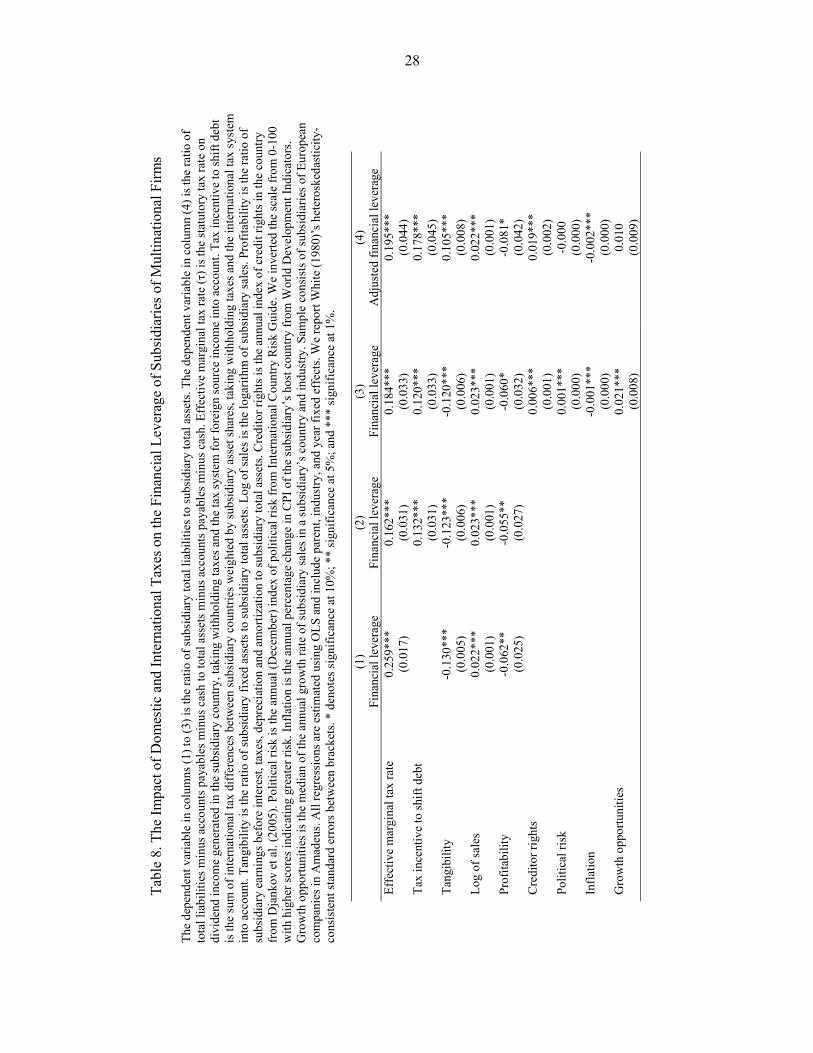
28
Tabl
e 8.
The
Impa
ct o
f Dom
estic
and
Inte
rnat
iona
l Tax
es o
n th
e Fi
nanc
ial L
ever
age
of S
ubsi
diar
ies o
f Mul
tinat
iona
l Firm
s Th
e de
pend
ent v
aria
ble
in c
olum
ns (1
) to
(3) i
s the
ratio
of s
ubsi
diar
y to
tal l
iabi
litie
s to
subs
idia
ry to
tal a
sset
s. Th
e de
pend
ent v
aria
ble
in c
olum
n (4
) is t
he ra
tio o
f to
tal l
iabi
litie
s min
us a
ccou
nts p
ayab
les m
inus
cas
h to
tota
l ass
ets m
inus
acc
ount
s pay
able
s min
us c
ash.
Eff
ectiv
e m
argi
nal t
ax ra
te (τ
) is t
he st
atut
ory
tax
rate
on
divi
dend
inco
me
gene
rate
d in
the
subs
idia
ry c
ount
ry, t
akin
g w
ithho
ldin
g ta
xes a
nd th
e ta
x sy
stem
for f
orei
gn so
urce
inco
me
into
acc
ount
. Tax
ince
ntiv
e to
shift
deb
t is
the
sum
of i
nter
natio
nal t
ax d
iffer
ence
s bet
wee
n su
bsid
iary
cou
ntrie
s wei
ghte
d by
subs
idia
ry a
sset
shar
es, t
akin
g w
ithho
ldin
g ta
xes a
nd th
e in
tern
atio
nal t
ax sy
stem
in
to a
ccou
nt. T
angi
bilit
y is
the
ratio
of s
ubsi
diar
y fix
ed a
sset
s to
subs
idia
ry to
tal a
sset
s. Lo
g of
sale
s is t
he lo
garit
hm o
f sub
sidi
ary
sale
s. Pr
ofita
bilit
y is
the
ratio
of
subs
idia
ry e
arni
ngs b
efor
e in
tere
st, t
axes
, dep
reci
atio
n an
d am
ortiz
atio
n to
subs
idia
ry to
tal a
sset
s. C
redi
tor r
ight
s is t
he a
nnua
l ind
ex o
f cre
dit r
ight
s in
the
coun
try
from
Dja
nkov
et a
l. (2
005)
. Pol
itica
l ris
k is
the
annu
al (D
ecem
ber)
inde
x of
pol
itica
l ris
k fr
om In
tern
atio
nal C
ount
ry R
isk
Gui
de. W
e in
verte
d th
e sc
ale
from
0-1
00
with
hig
her s
core
s ind
icat
ing
grea
ter r
isk.
Infla
tion
is th
e an
nual
per
cent
age
chan
ge in
CPI
of t
he su
bsid
iary
’s h
ost c
ount
ry fr
om W
orld
Dev
elop
men
t Ind
icat
ors.
Gro
wth
opp
ortu
nitie
s is t
he m
edia
n of
the
annu
al g
row
th ra
te o
f sub
sidi
ary
sale
s in
a su
bsid
iary
’s c
ount
ry a
nd in
dust
ry. S
ampl
e co
nsis
ts o
f sub
sidi
arie
s of E
urop
ean
com
pani
es in
Am
adeu
s. A
ll re
gres
sion
s are
est
imat
ed u
sing
OLS
and
incl
ude
pare
nt, i
ndus
try, a
nd y
ear f
ixed
eff
ects
. We
repo
rt W
hite
(198
0)’s
het
eros
keda
stic
ity-
cons
iste
nt st
anda
rd e
rror
s bet
wee
n br
acke
ts. *
den
otes
sign
ifica
nce
at 1
0%; *
* si
gnifi
canc
e at
5%
; and
***
sign
ifica
nce
at 1
%.
(1)
(2)
(3)
(4)
Fi
nanc
ial l
ever
age
Fina
ncia
l lev
erag
e Fi
nanc
ial l
ever
age
Adj
uste
d fin
anci
al le
vera
ge
Effe
ctiv
e m
argi
nal t
ax ra
te
0.25
9***
0.
162*
**
0.18
4***
0.
195*
**
(0
.017
) (0
.031
) (0
.033
) (0
.044
) Ta
x in
cent
ive
to sh
ift d
ebt
0.
132*
**
0.12
0***
0.
178*
**
(0.0
31)
(0.0
33)
(0.0
45)
Tang
ibili
ty
-0.1
30**
* -0
.123
***
-0.1
20**
* 0.
105*
**
(0
.005
) (0
.006
) (0
.006
) (0
.008
) Lo
g of
sale
s 0.
022*
**
0.02
3***
0.
023*
**
0.02
2***
(0.0
01)
(0.0
01)
(0.0
01)
(0.0
01)
Prof
itabi
lity
-0.0
62**
-0
.055
**
-0.0
60*
-0.0
81*
(0
.025
) (0
.027
) (0
.032
) (0
.042
) C
redi
tor r
ight
s
0.
006*
**
0.01
9***
(0.0
01)
(0.0
02)
Polit
ical
risk
0.
001*
**
-0.0
00
(0
.000
) (0
.000
) In
flatio
n
-0
.001
***
-0.0
02**
*
(0.0
00)
(0.0
00)
Gro
wth
opp
ortu
nitie
s
0.
021*
**
0.01
0
(0.0
08)
(0.0
09)
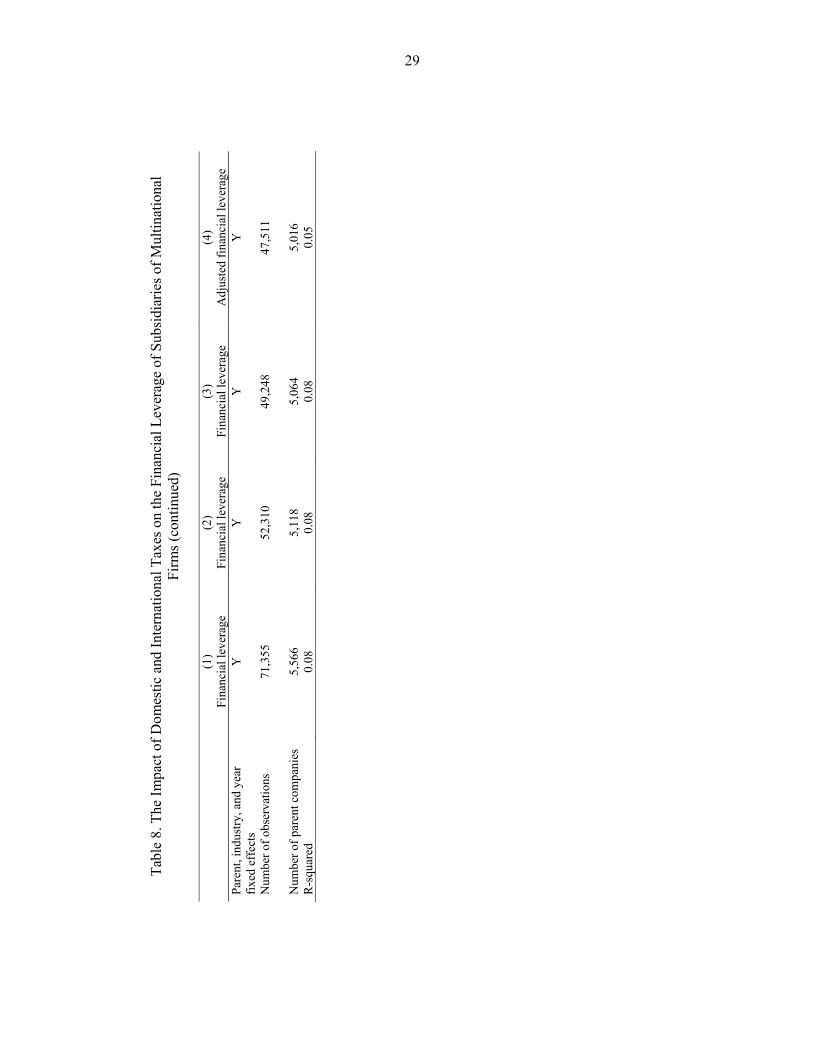
29
Tabl
e 8.
The
Impa
ct o
f Dom
estic
and
Inte
rnat
iona
l Tax
es o
n th
e Fi
nanc
ial L
ever
age
of S
ubsi
diar
ies o
f Mul
tinat
iona
l Fi
rms (
cont
inue
d)
(1)
(2)
(3)
(4)
Fi
nanc
ial l
ever
age
Fina
ncia
l lev
erag
e Fi
nanc
ial l
ever
age
Adj
uste
d fin
anci
al le
vera
ge
Pare
nt, i
ndus
try, a
nd y
ear
fixed
eff
ects
Y
Y
Y
Y
Num
ber o
f obs
erva
tions
71
,355
52
,310
49
,248
47
,511
Num
ber o
f par
ent c
ompa
nies
5,
566
5,11
8 5,
064
5,01
6 R
-squ
ared
0.
08
0.08
0.
08
0.05
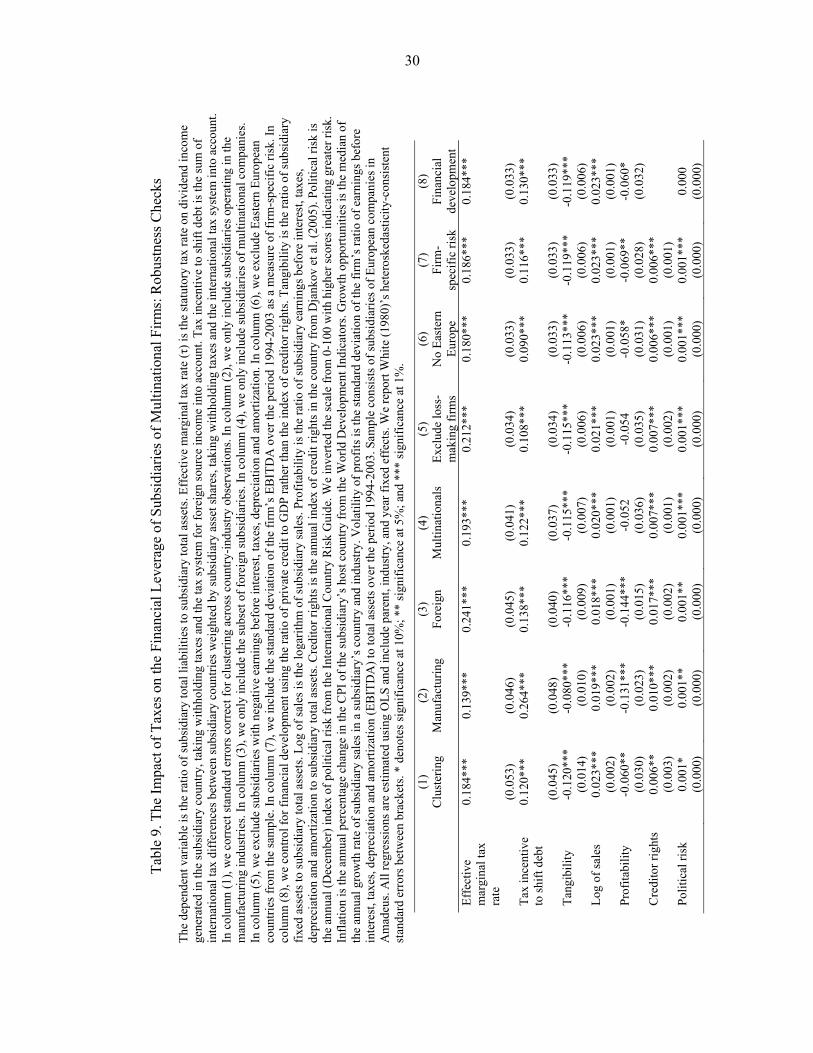
30
Tabl
e 9.
The
Impa
ct o
f Tax
es o
n th
e Fi
nanc
ial L
ever
age
of S
ubsi
diar
ies o
f Mul
tinat
iona
l Firm
s: R
obus
tnes
s Che
cks
The
depe
nden
t var
iabl
e is
the
ratio
of s
ubsi
diar
y to
tal l
iabi
litie
s to
subs
idia
ry to
tal a
sset
s. Ef
fect
ive
mar
gina
l tax
rate
(τ) i
s the
stat
utor
y ta
x ra
te o
n di
vide
nd in
com
e ge
nera
ted
in th
e su
bsid
iary
cou
ntry
, tak
ing
with
hold
ing
taxe
s and
the
tax
syst
em fo
r for
eign
sour
ce in
com
e in
to a
ccou
nt. T
ax in
cent
ive
to sh
ift d
ebt i
s the
sum
of
inte
rnat
iona
l tax
diff
eren
ces b
etw
een
subs
idia
ry c
ount
ries w
eigh
ted
by su
bsid
iary
ass
et sh
ares
, tak
ing
with
hold
ing
taxe
s and
the
inte
rnat
iona
l tax
syst
em in
to a
ccou
nt.
In c
olum
n (1
), w
e co
rrect
stan
dard
err
ors c
orre
ct fo
r clu
ster
ing
acro
ss c
ount
ry-in
dust
ry o
bser
vatio
ns. I
n co
lum
n (2
), w
e on
ly in
clud
e su
bsid
iarie
s ope
ratin
g in
the
man
ufac
turin
g in
dust
ries.
In c
olum
n (3
), w
e on
ly in
clud
e th
e su
bset
of f
orei
gn su
bsid
iarie
s. In
col
umn
(4),
we
only
incl
ude
subs
idia
ries o
f mul
tinat
iona
l com
pani
es.
In c
olum
n (5
), w
e ex
clud
e su
bsid
iarie
s with
neg
ativ
e ea
rnin
gs b
efor
e in
tere
st, t
axes
, dep
reci
atio
n an
d am
ortiz
atio
n. In
col
umn
(6),
we
excl
ude
East
ern
Euro
pean
co
untri
es fr
om th
e sa
mpl
e. In
col
umn
(7),
we
incl
ude
the
stan
dard
dev
iatio
n of
the
firm
’s E
BIT
DA
ove
r the
per
iod
1994
-200
3 as
a m
easu
re o
f firm
-spe
cific
risk
. In
colu
mn
(8),
we
cont
rol f
or fi
nanc
ial d
evel
opm
ent u
sing
the
ratio
of p
rivat
e cr
edit
to G
DP
rath
er th
an th
e in
dex
of c
redi
tor r
ight
s. Ta
ngib
ility
is th
e ra
tio o
f sub
sidi
ary
fixed
ass
ets t
o su
bsid
iary
tota
l ass
ets.
Log
of sa
les i
s the
loga
rithm
of s
ubsid
iary
sale
s. Pr
ofita
bilit
y is
the
ratio
of s
ubsid
iary
ear
ning
s bef
ore
inte
rest
, tax
es,
depr
ecia
tion
and
amor
tizat
ion
to su
bsid
iary
tota
l ass
ets.
Cre
dito
r rig
hts i
s the
ann
ual i
ndex
of c
redi
t rig
hts i
n th
e co
untry
from
Dja
nkov
et a
l. (2
005)
. Pol
itica
l ris
k is
th
e an
nual
(Dec
embe
r) in
dex
of p
oliti
cal r
isk
from
the
Inte
rnat
iona
l Cou
ntry
Ris
k G
uide
. We
inve
rted
the
scal
e fr
om 0
-100
with
hig
her s
core
s ind
icat
ing
grea
ter r
isk.
In
flatio
n is
the
annu
al p
erce
ntag
e ch
ange
in th
e C
PI o
f the
subs
idia
ry’s
hos
t cou
ntry
from
the
Wor
ld D
evel
opm
ent I
ndic
ator
s. G
row
th o
ppor
tuni
ties i
s the
med
ian
of
the
annu
al g
row
th ra
te o
f sub
sidi
ary
sale
s in
a su
bsid
iary
’s c
ount
ry a
nd in
dust
ry. V
olat
ility
of p
rofit
s is t
he st
anda
rd d
evia
tion
of th
e fir
m’s
ratio
of e
arni
ngs b
efor
e in
tere
st, t
axes
, dep
reci
atio
n an
d am
ortiz
atio
n (E
BIT
DA
) to
tota
l ass
ets o
ver t
he p
erio
d 19
94-2
003.
Sam
ple
cons
ists
of s
ubsi
diar
ies o
f Eur
opea
n co
mpa
nies
in
Am
adeu
s. A
ll re
gres
sion
s are
est
imat
ed u
sing
OLS
and
incl
ude
pare
nt, i
ndus
try, a
nd y
ear f
ixed
eff
ects
. We
repo
rt W
hite
(198
0)’s
het
eros
keda
stic
ity-c
onsi
sten
t st
anda
rd e
rror
s bet
wee
n br
acke
ts. *
den
otes
sign
ifica
nce
at 1
0%; *
* si
gnifi
canc
e at
5%
; and
***
sign
ifica
nce
at 1
%.
(1
) (2
) (3
) (4
) (5
) (6
) (7
) (8
)
Clu
ster
ing
Man
ufac
turin
g Fo
reig
n M
ultin
atio
nals
Ex
clud
e lo
ss-
mak
ing
firm
s N
o Ea
ster
n Eu
rope
Fi
rm-
spec
ific
risk
Fina
ncia
l de
velo
pmen
t Ef
fect
ive
mar
gina
l tax
ra
te
0.18
4***
0.
139*
**
0.24
1***
0.
193*
**
0.21
2***
0.
180*
**
0.18
6***
0.
184*
**
(0
.053
) (0
.046
) (0
.045
) (0
.041
) (0
.034
) (0
.033
) (0
.033
) (0
.033
) Ta
x in
cent
ive
to sh
ift d
ebt
0.12
0***
0.
264*
**
0.13
8***
0.
122*
**
0.10
8***
0.
090*
**
0.11
6***
0.
130*
**
(0
.045
) (0
.048
) (0
.040
) (0
.037
) (0
.034
) (0
.033
) (0
.033
) (0
.033
) Ta
ngib
ility
-0
.120
***
-0.0
80**
* -0
.116
***
-0.1
15**
* -0
.115
***
-0.1
13**
* -0
.119
***
-0.1
19**
*
(0.0
14)
(0.0
10)
(0.0
09)
(0.0
07)
(0.0
06)
(0.0
06)
(0.0
06)
(0.0
06)
Log
of sa
les
0.02
3***
0.
019*
**
0.01
8***
0.
020*
**
0.02
1***
0.
023*
**
0.02
3***
0.
023*
**
(0
.002
) (0
.002
) (0
.001
) (0
.001
) (0
.001
) (0
.001
) (0
.001
) (0
.001
) Pr
ofita
bilit
y -0
.060
**
-0.1
31**
* -0
.144
***
-0.0
52
-0.0
54
-0.0
58*
-0.0
69**
-0
.060
*
(0.0
30)
(0.0
23)
(0.0
15)
(0.0
36)
(0.0
35)
(0.0
31)
(0.0
28)
(0.0
32)
Cre
dito
r rig
hts
0.00
6**
0.01
0***
0.
017*
**
0.00
7***
0.
007*
**
0.00
6***
0.
006*
**
(0.0
03)
(0.0
02)
(0.0
02)
(0.0
01)
(0.0
02)
(0.0
01)
(0.0
01)
Po
litic
al ri
sk
0.00
1*
0.00
1**
0.00
1**
0.00
1***
0.
001*
**
0.00
1***
0.
001*
**
0.00
0
(0.0
00)
(0.0
00)
(0.0
00)
(0.0
00)
(0.0
00)
(0.0
00)
(0.0
00)
(0.0
00)
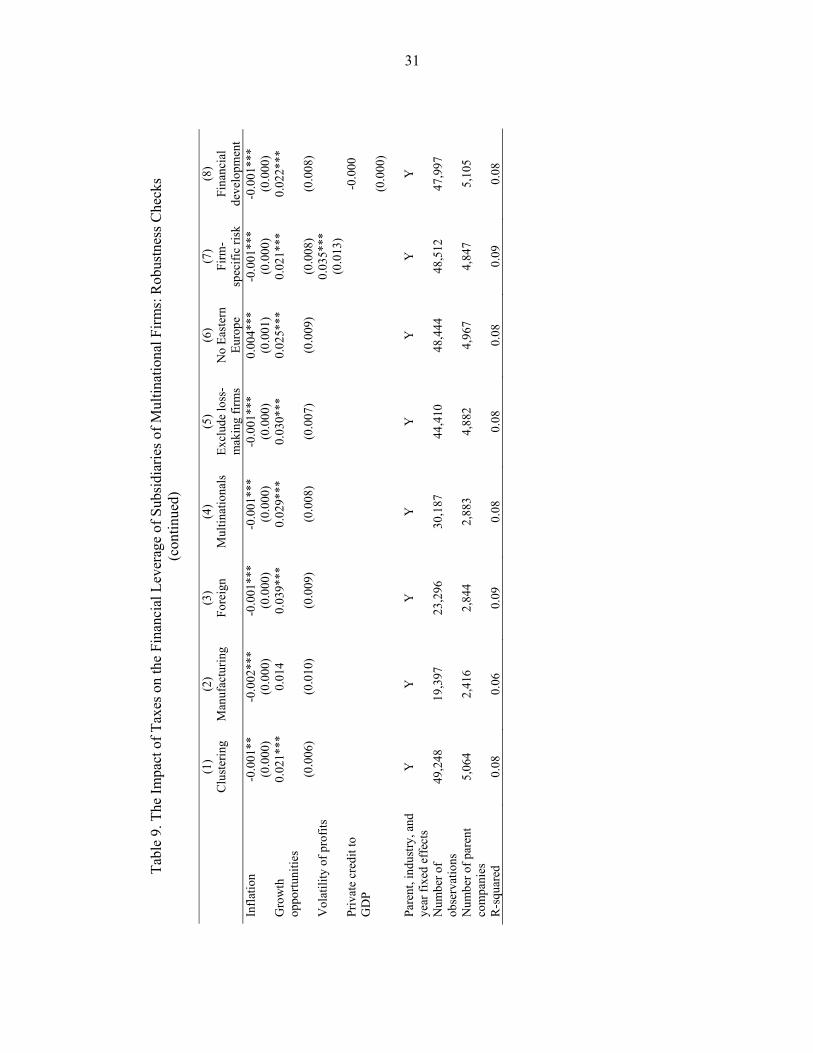
31
Tabl
e 9.
The
Impa
ct o
f Tax
es o
n th
e Fi
nanc
ial L
ever
age
of S
ubsi
diar
ies o
f Mul
tinat
iona
l Firm
s: R
obus
tnes
s Che
cks
(con
tinue
d)
(1)
(2)
(3)
(4)
(5)
(6)
(7)
(8)
C
lust
erin
g M
anuf
actu
ring
Fore
ign
Mul
tinat
iona
ls
Excl
ude
loss
-m
akin
g fir
ms
No
East
ern
Euro
pe
Firm
-sp
ecifi
c ris
k Fi
nanc
ial
deve
lopm
ent
Infla
tion
-0.0
01**
-0
.002
***
-0.0
01**
* -0
.001
***
-0.0
01**
* 0.
004*
**
-0.0
01**
* -0
.001
***
(0
.000
) (0
.000
) (0
.000
) (0
.000
) (0
.000
) (0
.001
) (0
.000
) (0
.000
) G
row
th
oppo
rtuni
ties
0.02
1***
0.
014
0.03
9***
0.
029*
**
0.03
0***
0.
025*
**
0.02
1***
0.
022*
**
(0
.006
) (0
.010
) (0
.009
) (0
.008
) (0
.007
) (0
.009
) (0
.008
) (0
.008
) V
olat
ility
of p
rofit
s
0.
035*
**
(0.0
13)
Pr
ivat
e cr
edit
to
GD
P
-0.0
00
(0.0
00)
Pa
rent
, ind
ustry
, and
ye
ar fi
xed
effe
cts
Y
Y
Y
Y
Y
Y
Y
Y
Num
ber o
f ob
serv
atio
ns
49,2
48
19,3
97
23,2
96
30,1
87
44,4
10
48,4
44
48,5
12
47,9
97
Num
ber o
f par
ent
com
pani
es
5,06
4 2,
416
2,84
4 2,
883
4,88
2 4,
967
4,84
7 5,
105
R-s
quar
ed
0.08
0.
06
0.09
0.
08
0.08
0.
08
0.09
0.
08

32
Tabl
e 10
. The
Impa
ct o
f Tax
es o
n th
e Fi
nanc
ial L
ever
age
of S
ubsi
diar
ies o
f Mul
tinat
iona
l Firm
s: A
dditi
onal
Rob
ustn
ess C
heck
s Th
e de
pend
ent v
aria
ble
is th
e ra
tio o
f sub
sidi
ary
tota
l lia
bilit
ies t
o su
bsid
iary
tota
l ass
ets.
Effe
ctiv
e m
argi
nal t
ax ra
te (τ
) is t
he st
atut
ory
tax
rate
on
divi
dend
inco
me
gene
rate
d in
the
subs
idia
ry c
ount
ry, t
akin
g w
ithho
ldin
g ta
xes a
nd th
e ta
x sy
stem
for f
orei
gn so
urce
inco
me
into
acc
ount
. Tax
ince
ntiv
e to
shift
deb
t is t
he su
m o
f in
tern
atio
nal t
ax d
iffer
ence
s bet
wee
n su
bsid
iary
cou
ntrie
s wei
ghte
d by
subs
idia
ry a
sset
shar
es, t
akin
g w
ithho
ldin
g ta
xes a
nd th
e in
tern
atio
nal t
ax sy
stem
into
acc
ount
. In
col
umn
(1),
we
cont
rol f
or th
e re
lativ
e ta
xatio
n of
equ
ity a
nd in
tern
al d
ebt o
f sub
sidi
arie
s (ϕ)
. In
colu
mn
(2),
we
incl
ude
“int
erm
edia
te”
com
pani
es, i
.e.,
subs
idia
ries t
hat a
re a
lso
pare
nt c
ompa
nies
of o
ther
subs
idia
ries,
in th
e sa
mpl
e. In
col
umn
(3),
we
asse
ss w
heth
er th
ere
is a
diff
eren
tial e
ffec
t of o
ur ta
x va
riabl
es o
n le
vera
ge fo
r int
erm
edia
te c
ompa
nies
and
pur
e su
bsid
iarie
s. In
col
umn
(4),
we
split
the
tax
ince
ntiv
e to
shift
deb
t var
iabl
e in
one
com
pone
nt th
at c
aptu
res t
he in
cent
ive
to sh
ift d
ebt t
o th
e pa
rent
cou
ntry
and
ano
ther
com
pone
nt th
at c
aptu
res t
he in
cent
ive
to sh
ift d
ebt t
o su
bsid
iarie
s in
othe
r cou
ntrie
s tha
n th
e ho
st a
nd p
aren
t cou
ntry
. In
colu
mn
(5) w
e sp
lit th
e ef
fect
ive
mar
gina
l tax
rate
var
iabl
e in
one
com
pone
nt th
at c
aptu
res t
he ta
xatio
n in
the
sour
ce c
ount
ry (i
.e.,
by se
tting
the
tax
rate
of t
he p
aren
t to
zer
o) a
nd o
ne c
ompo
nent
that
cap
ture
s the
taxa
tion
in th
e re
side
nt c
ount
ry. I
n co
lum
n (6
), w
e sp
lit b
oth
tax
varia
bles
in o
ne c
ompo
nent
that
doe
s not
dep
end
on
with
hold
ing
taxe
s and
ano
ther
com
pone
nt th
at d
epen
ds o
n w
ithho
ldin
g ta
xes.
In c
olum
n (7
), w
e us
e th
e po
pula
tion
of th
e su
bsid
iary
cou
ntry
and
the
popu
latio
n of
the
pare
nt c
ount
ry a
s ins
trum
ents
for t
he e
ffec
tive
mar
gina
l tax
rate
. Tak
ing
the
tax
syst
em in
to a
ccou
nt a
nd a
ssum
ing
that
with
hold
ing
taxe
s are
zer
o. T
angi
bilit
y is
the
ratio
of s
ubsi
diar
y fix
ed a
sset
s to
subs
idia
ry to
tal a
sset
s. Lo
g of
sale
s is t
he lo
garit
hm o
f sub
sidi
ary
sale
s. Pr
ofita
bilit
y is
the
ratio
of s
ubsi
diar
y ea
rnin
gs b
efor
e in
tere
st, t
axes
, dep
reci
atio
n an
d am
ortiz
atio
n to
subs
idia
ry to
tal a
sset
s. C
redi
tor r
ight
s is t
he a
nnua
l ind
ex o
f cre
dit r
ight
s in
the
coun
try fr
om D
jank
ov e
t al.
(200
5).
Polit
ical
risk
is th
e an
nual
(Dec
embe
r) in
dex
of p
oliti
cal r
isk
from
the
Inte
rnat
iona
l Cou
ntry
Ris
k G
uide
. We
inve
rted
the
scal
e fr
om 0
-100
with
hig
her s
core
s in
dica
ting
grea
ter r
isk.
Infla
tion
is th
e an
nual
per
cent
age
chan
ge in
the
CPI
of t
he su
bsid
iary
’s h
ost c
ount
ry fr
om th
e W
orld
Dev
elop
men
t Ind
icat
ors.
Gro
wth
op
portu
nitie
s is t
he m
edia
n of
the
annu
al g
row
th ra
te o
f sub
sidi
ary
sale
s in
a su
bsid
iary
’s c
ount
ry a
nd in
dust
ry. S
ampl
e co
nsis
ts o
f sub
sidi
arie
s of E
urop
ean
com
pani
es in
Am
adeu
s. A
ll re
gres
sion
s are
est
imat
ed u
sing
OLS
and
incl
ude
pare
nt, i
ndus
try, a
nd y
ear f
ixed
eff
ects
. We
repo
rt W
hite
(198
0)’s
het
eros
keda
stic
ity-
cons
iste
nt st
anda
rd e
rror
s bet
wee
n br
acke
ts. *
den
otes
sign
ifica
nce
at 1
0%; *
* si
gnifi
canc
e at
5%
; and
***
sign
ifica
nce
at 1
%.
(1)
(2)
(3)
(4)
(5)
(6)
(7)
R
elat
ive
taxa
tion
of
equi
ty a
nd d
ebt
Incl
ude
inte
rmed
iate
co
mpa
nies
Diff
eren
tial e
ffec
t fo
r int
erm
edia
te
com
pani
es
Shift
ing
to p
aren
t co
untry
ver
sus o
ther
co
untri
es
Sour
ce
vers
us
resi
dent
tax
With
hol
ding
ta
xes
Inst
rum
enta
l va
riabl
es
Effe
ctiv
e m
argi
nal
tax
rate
0.
184*
**
0.16
4***
0.
149*
**
0.17
8***
0.
200*
**
(0
.034
) (0
.030
) (0
.031
) (0
.033
)
(0
.064
) Ta
x in
cent
ive
to
shift
deb
t 0.
120*
**
0.14
9***
0.
154*
**
0.
112*
**
(0
.044
) (0
.030
) (0
.031
)
(0.0
33)
Rel
ativ
e ta
x of
eq
uity
and
deb
t 0.
001
(0
.043
)
In
term
edia
te
-0.0
45**
(0.0
17)
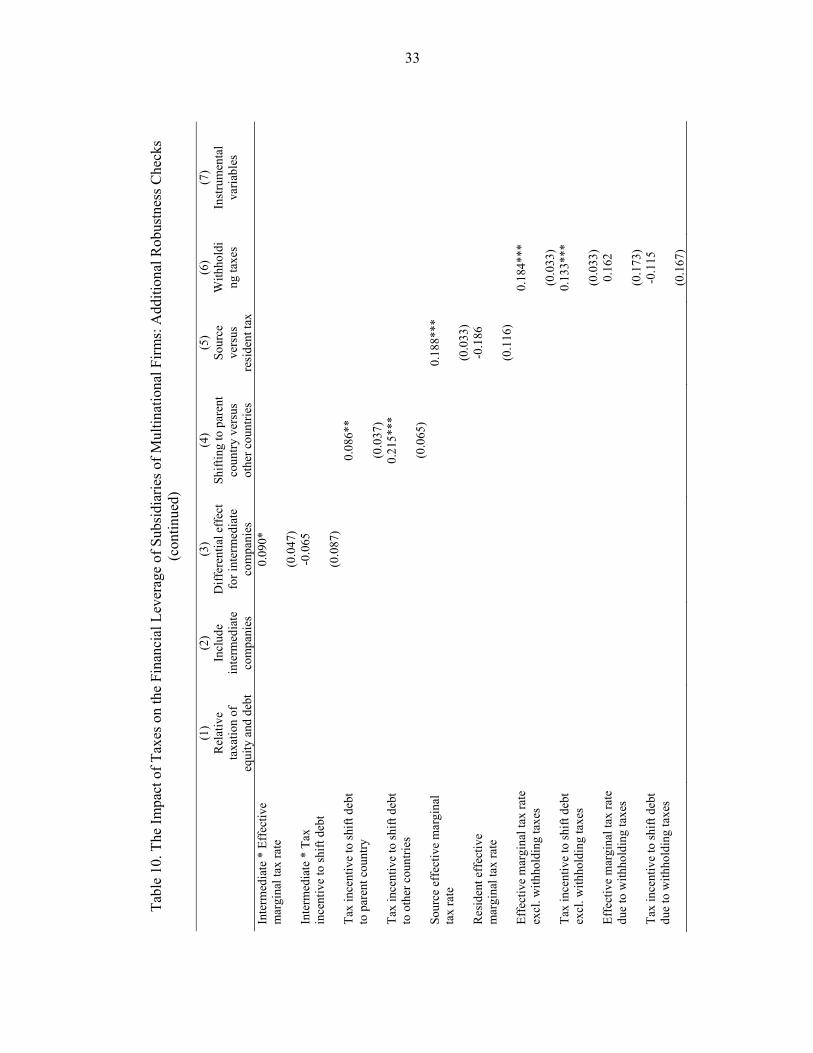
33
Tabl
e 10
. The
Impa
ct o
f Tax
es o
n th
e Fi
nanc
ial L
ever
age
of S
ubsi
diar
ies o
f Mul
tinat
iona
l Firm
s: A
dditi
onal
Rob
ustn
ess C
heck
s (c
ontin
ued)
(1
) (2
) (3
) (4
) (5
) (6
) (7
)
Rel
ativ
e ta
xatio
n of
eq
uity
and
deb
t
Incl
ude
inte
rmed
iate
co
mpa
nies
Diff
eren
tial e
ffec
t fo
r int
erm
edia
te
com
pani
es
Shift
ing
to p
aren
t co
untry
ver
sus
othe
r cou
ntrie
s
Sour
ce
vers
us
resi
dent
tax
With
hold
ing
taxe
s In
stru
men
tal
varia
bles
Inte
rmed
iate
* E
ffec
tive
mar
gina
l tax
rate
0.
090*
(0
.047
)
In
term
edia
te *
Tax
in
cent
ive
to sh
ift d
ebt
-0.0
65
(0
.087
)
Ta
x in
cent
ive
to sh
ift d
ebt
to p
aren
t cou
ntry
0.08
6**
(0.0
37)
Ta
x in
cent
ive
to sh
ift d
ebt
to o
ther
cou
ntrie
s
0.21
5***
(0.0
65)
So
urce
eff
ectiv
e m
argi
nal
tax
rate
0.
188*
**
(0
.033
)
R
esid
ent e
ffec
tive
mar
gina
l tax
rate
-0
.186
(0
.116
)
Ef
fect
ive
mar
gina
l tax
rate
ex
cl. w
ithho
ldin
g ta
xes
0.
184*
**
(0.0
33)
Ta
x in
cent
ive
to sh
ift d
ebt
excl
. with
hold
ing
taxe
s
0.13
3***
(0.0
33)
Ef
fect
ive
mar
gina
l tax
rate
du
e to
with
hold
ing
taxe
s
0.16
2
(0.1
73)
Ta
x in
cent
ive
to sh
ift d
ebt
due
to w
ithho
ldin
g ta
xes
-0
.115
(0.1
67)
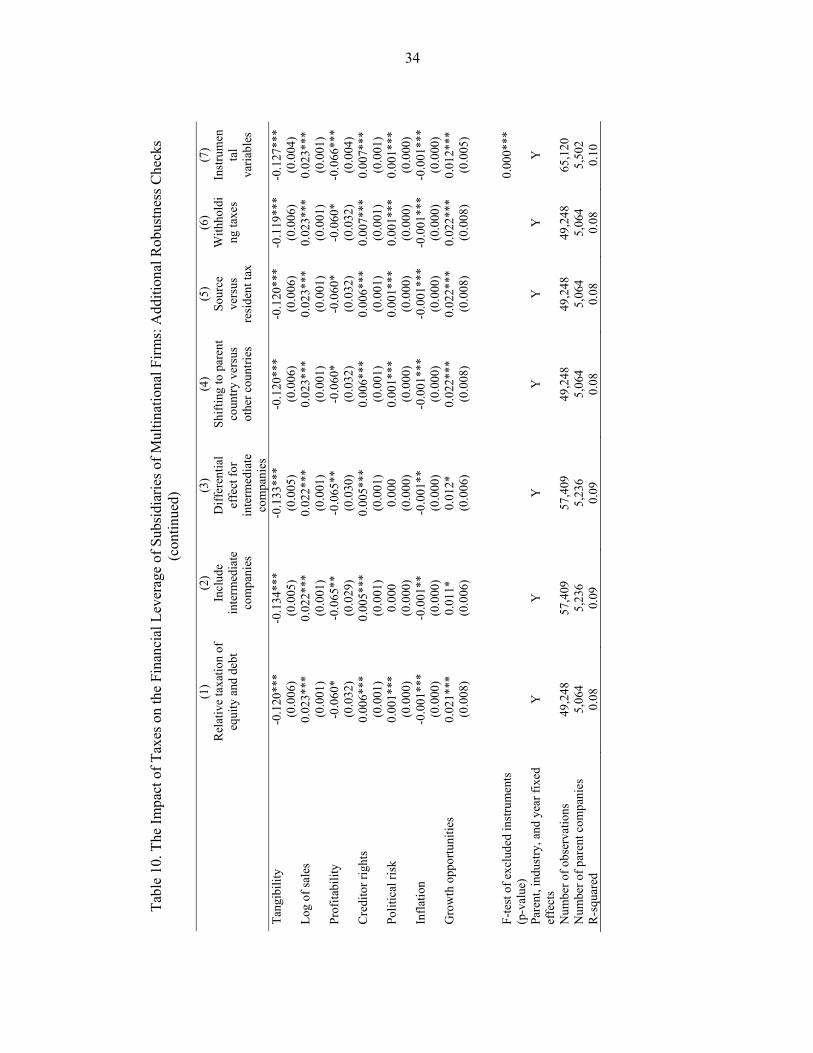
34
Tabl
e 10
. The
Impa
ct o
f Tax
es o
n th
e Fi
nanc
ial L
ever
age
of S
ubsi
diar
ies o
f Mul
tinat
iona
l Firm
s: A
dditi
onal
Rob
ustn
ess C
heck
s (c
ontin
ued)
(1
) (2
) (3
) (4
) (5
) (6
) (7
)
Rel
ativ
e ta
xatio
n of
eq
uity
and
deb
t In
clud
e in
term
edia
te
com
pani
es
Diff
eren
tial
effe
ct fo
r in
term
edia
te
com
pani
es
Shift
ing
to p
aren
t co
untry
ver
sus
othe
r cou
ntrie
s
Sour
ce
vers
us
resi
dent
tax
With
hold
ing
taxe
s In
stru
men
tal
varia
bles
Tang
ibili
ty
-0.1
20**
* -0
.134
***
-0.1
33**
* -0
.120
***
-0.1
20**
* -0
.119
***
-0.1
27**
*
(0.0
06)
(0.0
05)
(0.0
05)
(0.0
06)
(0.0
06)
(0.0
06)
(0.0
04)
Log
of sa
les
0.02
3***
0.
022*
**
0.02
2***
0.
023*
**
0.02
3***
0.
023*
**
0.02
3***
(0.0
01)
(0.0
01)
(0.0
01)
(0.0
01)
(0.0
01)
(0.0
01)
(0.0
01)
Prof
itabi
lity
-0.0
60*
-0.0
65**
-0
.065
**
-0.0
60*
-0.0
60*
-0.0
60*
-0.0
66**
*
(0.0
32)
(0.0
29)
(0.0
30)
(0.0
32)
(0.0
32)
(0.0
32)
(0.0
04)
Cre
dito
r rig
hts
0.00
6***
0.
005*
**
0.00
5***
0.
006*
**
0.00
6***
0.
007*
**
0.00
7***
(0.0
01)
(0.0
01)
(0.0
01)
(0.0
01)
(0.0
01)
(0.0
01)
(0.0
01)
Polit
ical
risk
0.
001*
**
0.00
0 0.
000
0.00
1***
0.
001*
**
0.00
1***
0.
001*
**
(0
.000
) (0
.000
) (0
.000
) (0
.000
) (0
.000
) (0
.000
) (0
.000
) In
flatio
n -0
.001
***
-0.0
01**
-0
.001
**
-0.0
01**
* -0
.001
***
-0.0
01**
* -0
.001
***
(0
.000
) (0
.000
) (0
.000
) (0
.000
) (0
.000
) (0
.000
) (0
.000
) G
row
th o
ppor
tuni
ties
0.02
1***
0.
011*
0.
012*
0.
022*
**
0.02
2***
0.
022*
**
0.01
2***
(0.0
08)
(0.0
06)
(0.0
06)
(0.0
08)
(0.0
08)
(0.0
08)
(0.0
05)
F-te
st o
f exc
lude
d in
stru
men
ts
(p-v
alue
)
0.
000*
**
Pare
nt, i
ndus
try, a
nd y
ear f
ixed
ef
fect
s Y
Y
Y
Y
Y
Y
Y
Num
ber o
f obs
erva
tions
49
,248
57
,409
57
,409
49
,248
49
,248
49
,248
65
,120
N
umbe
r of p
aren
t com
pani
es
5,06
4 5,
236
5,23
6 5,
064
5,06
4 5,
064
5,50
2 R
-squ
ared
0.
08
0.09
0.
09
0.08
0.
08
0.08
0.
10
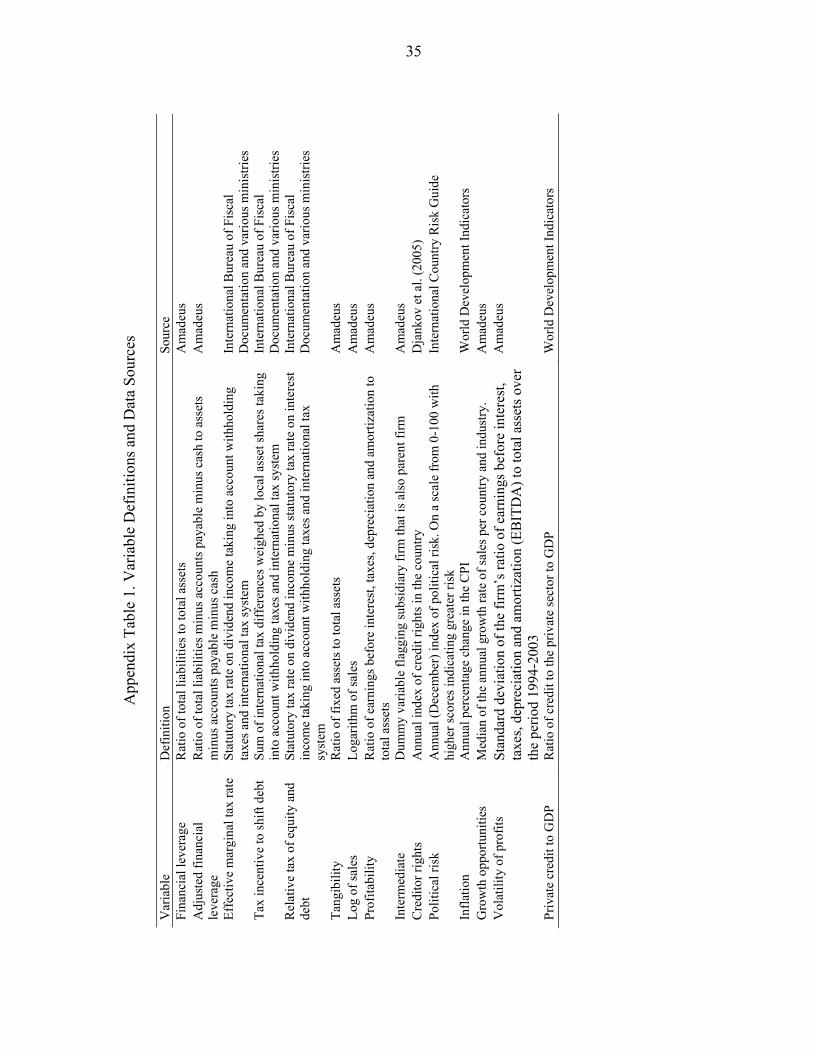
35
App
endi
x Ta
ble
1. V
aria
ble
Def
initi
ons a
nd D
ata
Sour
ces
V
aria
ble
Def
initi
on
Sour
ce
Fina
ncia
l lev
erag
e R
atio
of t
otal
liab
ilitie
s to
tota
l ass
ets
Am
adeu
s A
djus
ted
finan
cial
le
vera
ge
Rat
io o
f tot
al li
abili
ties m
inus
acc
ount
s pay
able
min
us c
ash
to a
sset
s m
inus
acc
ount
s pay
able
min
us c
ash
Am
adeu
s
Effe
ctiv
e m
argi
nal t
ax ra
te
Stat
utor
y ta
x ra
te o
n di
vide
nd in
com
e ta
king
into
acc
ount
with
hold
ing
taxe
s and
inte
rnat
iona
l tax
syst
em
Inte
rnat
iona
l Bur
eau
of F
isca
l D
ocum
enta
tion
and
vario
us m
inis
tries
Ta
x in
cent
ive
to sh
ift d
ebt
Sum
of i
nter
natio
nal t
ax d
iffer
ence
s wei
ghed
by
loca
l ass
et sh
ares
taki
ng
into
acc
ount
with
hold
ing
taxe
s and
inte
rnat
iona
l tax
syst
em
Inte
rnat
iona
l Bur
eau
of F
isca
l D
ocum
enta
tion
and
vario
us m
inis
tries
R
elat
ive
tax
of e
quity
and
de
bt
Stat
utor
y ta
x ra
te o
n di
vide
nd in
com
e m
inus
stat
utor
y ta
x ra
te o
n in
tere
st
inco
me
taki
ng in
to a
ccou
nt w
ithho
ldin
g ta
xes a
nd in
tern
atio
nal t
ax
syst
em
Inte
rnat
iona
l Bur
eau
of F
isca
l D
ocum
enta
tion
and
vario
us m
inis
tries
Tang
ibili
ty
Rat
io o
f fix
ed a
sset
s to
tota
l ass
ets
Am
adeu
s Lo
g of
sale
s Lo
garit
hm o
f sal
es
Am
adeu
s Pr
ofita
bilit
y R
atio
of e
arni
ngs b
efor
e in
tere
st, t
axes
, dep
reci
atio
n an
d am
ortiz
atio
n to
to
tal a
sset
s A
mad
eus
Inte
rmed
iate
D
umm
y va
riabl
e fla
ggin
g su
bsid
iary
firm
that
is a
lso
pare
nt fi
rm
Am
adeu
s C
redi
tor r
ight
s A
nnua
l ind
ex o
f cre
dit r
ight
s in
the
coun
try
Dja
nkov
et a
l. (2
005)
Po
litic
al ri
sk
Ann
ual (
Dec
embe
r) in
dex
of p
oliti
cal r
isk.
On
a sc
ale
from
0-1
00 w
ith
high
er sc
ores
indi
catin
g gr
eate
r ris
k In
tern
atio
nal C
ount
ry R
isk
Gui
de
Infla
tion
Ann
ual p
erce
ntag
e ch
ange
in th
e C
PI
Wor
ld D
evel
opm
ent I
ndic
ator
s G
row
th o
ppor
tuni
ties
Med
ian
of th
e an
nual
gro
wth
rate
of s
ales
per
cou
ntry
and
indu
stry
. A
mad
eus
Vol
atili
ty o
f pro
fits
Stan
dard
dev
iatio
n of
the
firm
’s ra
tio o
f ear
ning
s bef
ore
inte
rest
, ta
xes,
depr
ecia
tion
and
amor
tizat
ion
(EB
ITD
A) t
o to
tal a
sset
s ove
r th
e pe
riod
1994
-200
3
Am
adeu
s
Priv
ate
cred
it to
GD
P R
atio
of c
redi
t to
the
priv
ate
sect
or to
GD
P W
orld
Dev
elop
men
t Ind
icat
ors
36
References
Booth, Laurence, Varouj Aivazian, Asli Demirgüç-Kunt, and Vojislav Maksimovic, 2001, “Capital Structures in Developing Countries,” Journal of Finance, Vol. 54, pp. 87–130.
Chowdry, Bhagwan, and Josh Coval, 1998, “Internal Financing of Multinational Subsidiaries: Debt vs. Equity,” Journal of Corporate Finance, Vol. 4, pp. 87–106.
Collins, J. H., and D. A. Shackelford, 1992, “Foreign Tax Credit Limitations and Preferred Stock Issuances,” Journal of Accounting Research, Vol. 30, pp. 103–24.
Desai, Mihir A., C. Fritz Foley, and James R. Hines Jr., 2004, “A Multinational Perspective on Capital Structure Choice and Internal Capital Markets, Journal of Finance, Vol. 59, pp. 2451–88.
Djankov, Simeon, Caralee McLiesh, and Andrei Shleifer, 2005, “Private Credit in 129 Countries,” Journal of Financial Economics, forthcoming.
Fama, Eugene F., and Kenneth R. French, 1998, “Taxes, Financing Decisions, and Firm Value,” Journal of Finance, Vol. 53, pp. 819–43.
Froot, Kenneth A., and James R. Hines, 1995, “Interest Allocation Rules, Financing Patterns, and the Operation of U.S. Multinationals,” in Martin Feldstein, James R. Hines, and R. Glenn Hubbard, eds., The Effect of Taxation on Multinational Corporations (University of Chicago Press, Chicago) pp. 277–307.
Gordon, Roger H., and Young Lee, 2001, “Do Taxes Affect Corporate Debt Policy? Evidence from U.S. Corporate Tax Return Data,” Journal of Public Economics, Vol. 82, pp. 195–224.
Graham, John R., 1996, “Debt and the Marginal Tax Rate,” Journal of Financial Economics, Vol. 41, pp. 41–73.
———, 2000, “How Big Are the Tax Benefits of Debt?” Journal of Finance, Vol. 55, pp.
1901–41.
Grubert, Harry, 1998, “Taxes and the Division of Foreign Operating Income Among Royalties, Interest, Dividends, and Retained Earnings,” Journal of Public Economics, Vol. 68, pp. 269–90.
Hines, James R., Jr., 1994, “Credit and Deferral as International Investment Incentives,” Journal of Public Economics, Vol. 55, pp. 323–47.
––––––., and R. Glenn Hubbard, 1990, “Coming Home to America: Dividend Repatriations by U.S. Multinationals,” in Assaf Razin and Joel Slemrod, eds., Taxation and the Global Economy (University of Chicago, Chicago), pp. 161–200.

37
Hines, James R., Jr., and Eric M. Rice, 1994, “Fiscal Paradise: Foreign Tax Havens and American Business,” Quarterly Journal of Economics, Vol. 109, pp. 149–82.
Hodder, James, and Lemma Senbet, 1990, “International Capital Structure Equilibrium,” Journal of Finance, Vol. 45, pp. 1495–517
Hovakimian, Armen, Gayane Hovakimian, and Hassan Theranian, 2004, “Determinants of Target Capital Structures: The Case of Dual Debt and Equity Issues,” Journal of Financial Economics, Vol. 71, pp. 517–40.
Job, Vijay, and Jianmin Tang, 2001, “Tax Reforms, Debt-shifting, and Tax Revenues: Multinational Corporations in Canada,” International Tax and Finance, Vol. 8, pp. 5–25.
La Porta, Rafael, Florencio Lopez-de-Silanes, Andrei Shleifer, and Robert Vishny, 1997, “Legal Determinants of External Finance,” Journal of Finance, Vol. 52, pp. 1131–55.
MacKie-Mason, Jeffrey K., 1990, “Do Taxes Affect Corporate Financing Decisions?” Journal of Finance, Vol. 45, pp. 1471–93.
Miller, Merton H., 1977, “Debt and Taxes,” Journal of Finance, Vol. 32, pp. 261–75.
Mills, Lillian F., and Kaye J. Newberry, 2004, “Do Foreign Multinationals’ Tax Incentives Influence their U.S. Income Reporting and Debt Policy?” National Tax Journal, Vol. 57, pp. 89–107.
Moore, Padraig J., and Frances P. Ruane, 2005, “Taxation and the Financial Structure of Foreign Direct Investment,” IIIS Discussion Paper No. 88.
Newberry, Kaye J., and Dan S. Dhaliwal, 2001, “Cross-Jurisdictional Income Shifting by U.S. Multinationals: Evidence from International Bond Offerings,” Journal of Accounting Research, Vol. 39, pp. 643–62.
Organization for Economic Cooperation and Development, 1997, Model Tax Convention on Income and on Capital (Paris).
Rajan, Raghuram G., and Luigi Zingales, 1995, “What Do We Know About Capital Structure? Some Evidence from International Data,” Journal of Finance, Vol. 50, pp. 1421–60.
Titman, Sheridan, and Roberto Wessels, 1998, “The Determinants of Capital Structure Choice,” Journal of Finance, Vol. 43, pp. 1–19.