CAPITAL REGION EV + E-BIKE INFRASTRUCTURE PLANNING …
100
Capital Region Local Government Electric Vehicle (EV) + Electric Bike (E-Bike) Infrastructure Backgrounder Prepared by: WATT Consulting Group Prepared for: Capital Regional District September 2018 APPENDIX A
Transcript of CAPITAL REGION EV + E-BIKE INFRASTRUCTURE PLANNING …

CAPITAL REGION EV + E-BIKE INFRASTRUCTURE PLANNING BEST PRACTICES GUIDE
Capital Region Local Government Electric Vehicle (EV) + Electric Bike (E-Bike) Infrastructure Backgrounder
Prepared by: WATT Consulting Group
Prepared for: Capital Regional District
September 2018
APPENDIX A

Capital Region Local Government EV + E-Bike Infrastructure Backgrounder
Contents 1. Overview ............................................................................................................................................ 1 2. Electric Vehicles + Electric Bikes 101 ................................................................................................ 2
2.1 Electric Vehicles .......................................................................................................................................... 2
2.2 EV Charging Station Types ......................................................................................................................... 4
2.3 Load Management & Load Sharing ........................................................................................................... 6
2.4 EV-Readiness & Retrofits............................................................................................................................ 8
2.5 E-Bikes ........................................................................................................................................................ 8
3.0 EV + E-Bike Trends ......................................................................................................................... 10 3.1 Electric Vehicles in BC .............................................................................................................................. 10
3.2 Electric Vehicles in the Capital Region .................................................................................................... 13
3.2 E-Bikes in the Capital Region Today........................................................................................................ 15
4. Plan + Policy Review ....................................................................................................................... 16 4.1 Official Community Plans in the Capital Region ..................................................................................... 16
4.2 EV Specific Regulations in the Capital Region ........................................................................................ 19
4.3 EV & E-Bike Specific Regulations in Other Parts of British Columbia .................................................... 20
4.4 Regulatory Aspects of Selling Electricity for EV Charging ...................................................................... 21
5.0 Public EV Charging Additional Considerations ............................................................................... 23 5.1 Public Charging Station Networks ........................................................................................................... 23
5.2 Paying a Fee for Public Charging Station Use ........................................................................................ 25
6.0 Barriers to EV & E-Bike Adoption ................................................................................................... 27 6.1 Electric Vehicles ........................................................................................................................................ 27
6.2 E-Bikes ...................................................................................................................................................... 31
6.3 Summary of Barriers to EV & E-Bike Adoption ....................................................................................... 33
7.0 Infrastructure Gap Analysis ............................................................................................................. 34 7.1 Purpose of a Public Charging Station Network ...................................................................................... 34
7.2 Methodology ............................................................................................................................................ 35
7.3 Results....................................................................................................................................................... 39
8.0 Public + Development Industry Engagement ................................................................................. 40 8.1 Public Survey ............................................................................................................................................. 40

Capital Region Local Government EV + E-Bike Infrastructure Backgrounder
8.2 Development / Building Industry Survey ................................................................................................ 49
8.3 Development Industry Meeting ............................................................................................................... 54
References ............................................................................................................................................ 56 Appendix A. Summary of EV Regulations in Metro Vancouver Communities Appendix B. Infrastructure Gap Analysis Mapping Outputs Appendix C. Public Survey Results Appendix D. Developer/Building Industry Survey Results

Capital Region Local Government EV + E-Bike Infrastructure Backgrounder
| 1
1. Overview Working with and on behalf of local governments, the Capital Regional District (CRD) is undertaking the Electric Vehicle (EV) and Electric Bicycle (E-Bike) Infrastructure Planning Project to understand and assess opportunities to advance EV and E-Bike charging infrastructure in public and private locations throughout the region. EV and E-Bike technology is rapidly advancing and this project is focused on the current landscape. The key objectives of this project are to:
• Understand opportunities for local governments to accelerate uptake of EVs and E-bikes;
• Collect feedback from the development community and general public to better understand the barriers and opportunities for EV and E-bike charging;
• Draw on resources and lessons learned from other communities;
• Identify priority locations for new EV charging stations in the Capital Region; and
• Create a best practices guide outlining options for local governments on how to advance EV and E-bike charging infrastructure in the region.
The Backgrounder (this document) is the foundational document for the EV + E-Bike Infrastructure Planning Project. It contains all baseline information that has been collected and analyzed in developing an understanding of issues and opportunities for EV and E-Bike infrastructure in the Capital Region. It is a companion document to the Capital Region Local Government EV + E-Bike Infrastructure Planning Guide, containing the necessary detailed baseline information and allowing the Infrastructure Planning Guide to be succinct and focused on providing direction and strategies.
Specifically, this document contains the following information:
• An overview of existing EVs and E-bikes, charging station technology, trends in EVs and E-bike ownership in the Capital Region and elsewhere, and key barriers to uptake;
• A summary of relevant community plans and policies from the Capital Region that support EV and E-bikes and the deployment of charging infrastructure;
• A synthesis of “lessons learned” from research and interviews with leading municipalities;
• An overview of the approach and results from a mapping exercise undertaken to identify gaps in the existing EV charge station network in the Capital Region; and
• A summary of findings from surveys and working sessions held to gather input and learn from the development industry and the general public.
Capital Region Local Government EV + E-Bike Infrastructure Backgrounder
| 2
2. Electric Vehicles + Electric Bikes 101 2.1 Electric Vehicles Electric vehicles are a class of vehicles that run fully or partially on electricity. They have a battery instead of a gasoline tank, and an electric motor instead of an internal combustion engine. There are five distinct types of electric vehicles: Battery Electric Vehicles (BEVs), Plug-In Hybrid Electric Vehicles (PHEVs), Conventional Hybrids, Fuel Cell Vehicles (FCVs), and Extended Range Electric Vehicles (EREVs). Table 1 presents an overview of the existing EVs available in British Columbia. While conventional hybrid vehicles, FCVs, and EREVs are featured below, they are not discussed elsewhere in this Backgrounder. The focus of this Backgrounder is on BEVs and PHEVs exclusively.
BEVs run exclusively on electricity and need to be plugged into an outlet or charging station to recharge the battery. The typical range (kilometers) varies from 100 kilometres to over 400 kilometers. Examples of BEVs include the Nissan Leaf, Ford Focus Electric and the Tesla Model S.
PHEVs have an electric motor and an internal combustion engine – the electric motor also needs to be charged at an outlet or charging station but PHEVs typically have a smaller electric range than BEVs and use the internal combustion engine once the battery dies. Examples of PHEVs include the Chevrolet Volt, Kia Optima and Mitsubishi Outlander.
Conventional Hybrids are fueled with gasoline only, but are able to recapture some kinetic energy from the braking system which is converted into electricity to charge the battery. The battery helps to power the vehicle.
Fuel Cell Vehicles (FCVs) are a type of electric vehicle that use a fuel cell, instead of a battery. Those cells generate electricity by using oxygen from the air and compressed hydrogen. Their range and refueling processes are comparable to conventional cars. They produce only water and heat as a by-product. Examples of FCVs include the Hyundai Nexo, Honda Clarity Fuel Cell, and Toyota Mirai.
Extended Range Electric Vehicles (EREVs) have an electric motor and include an auxiliary power unit, typically an internal combustion engine. The difference with the PHEVs is that the electric motor is used constantly to move the vehicle, and the internal combustion engine is used as a generator that recharges the battery when it dies.

Capital Region Local Government EV + E-Bike Infrastructure Backgrounder
| 3
Table 1. Electric Vehicles Available in British Columbia (as of May 20181) Vehicle Type Vehicle Name
Range (km) MSRP (CAD$) Electric Range Full Range
BEV
BMW i3 183 183-303 $56,000 Chevrolet Bolt 383 - $43,195 Ford Focus Electric 185 - $34,998 Hyundai IONIQ Electric 200 - $35,649 Kia Soul EV 179 - $35,895 Nissan Leaf 242 - $35,998 Smart fortwo ED 155 - $28,800 Tesla Model S 338-539 - $96,650 – 191,900 Tesla Model X 322-475 - $110,200 – 200,200 Tesla Model 3 350 - $45,600 Volkswagen e-Golf 201 - $36,355
PHEV
Chevrolet Volt 85 676 $38,995 Porsche Panamera S E Hybrid 26 897 $113,400 KIA Optima PHEV 47 982 $42,995 Chrysler Pacifica PHEV 53 911 $53,440 Cadillac CT6 PHEV 50 692 $86,770 Honda Clarity PHEV 77 552 $41,680 Hyundai Sonata 43 944 $43,999 Hyundai IONIQ PHEV 43 TBD $31,999 Toyota Prius Prime 40 1,035 $32,990 Mitsubishi Outlander 35 944 $42,998 Ford Fusion Energi 35 982 $33,588 Volvo S90 PHEV 34 655 $74,950 Volvo XC90 T8 27 547 $86,450 Volvo XC60 T8 27 537 $70,250 Audi A3 e-tron 26 605 $45,900 BMW 530e 25 572 $67,500 BMW i8 24 533 $152,715 BMW 740e 23 548 TBD BMW 330e 23 556 $51,500 BMW X5 xDrive40e 23 886 $74,950 Porsche Cayenne S E Hybrid 23 791 $90,400 Mercedes-Benz S550e 23 725 $117,900 Mercedes-Benz GLC 350e 23 TBD $59,900 Mercedes-Benz GLE 550e 19 738 $83,900 Mini Cooper S E Countryman 19 439 $43,490

Capital Region Local Government EV + E-Bike Infrastructure Backgrounder
| 4
2.2 EV Charging Station Types Charging stations are commonly referred to as electrical vehicle supply equipment (EVSE). Generally there are three types of charging stations: Level 1, Level 2, Level 3.
Type
Level 1 AC, 120V
Level 2 AC, 240V
Level 3 DC fast charging
Level 1 charging stations utilize household outlets that provide 120V of AC power (120V) to the vehicle. This type of charging is cheapest and typically involves little to no infrastructure, but is the slowest of the three charging station types.
Level 2 charging stations provide a higher amount of AC power to the vehicle and require their own circuit (similar to larger household appliances). These are the most common form of public charging station and installation costs are significant less than Level 3 charging stations
Level 3 charging stations provide the fastest charging option, although installation costs are significantly higher than other charging station types. These stations appeal to EVs needing a “top up” during longer distance trips that approach or exceed battery range.
Cost (approx.)
$500 (retrofit)
$2,500 - $15,000+ installation cost
$75,000+ installation cost
Key Stats
3–8 km per hour of charge time
8-12 hrs
for a full charge
18–45 km per hour of charge time
4-6 hrs
for a full charge
90-150 km per hour of charge time
0.5-1 hrs
for a full charge
Common Uses
Charging at home (overnight) or at work (all day)
Charging at home or at work, or for charging “on the go” (parking lots)
Charging “on the go”, commonly longer distance trips
An October 2017 white paper by the International Council on Clean Transportation Electric Vehicle examined the status of charging infrastructure in major electric vehicle markets in North American, Europe, and Asia.2 The white paper reported that the costs of installing EV charging infrastructure

Capital Region Local Government EV + E-Bike Infrastructure Backgrounder
| 5
has been declining over the past couple years. Based on a review of costs for EV charging stations, typical costs for a Level 2 station, which include administrative, installation, and siting, range from $6,500 to $20,000, whereas a Level 3 station varies from $50,000 to $130,000.3 The variation in costs for both charging station types is attributed to factors such as different networking capabilities (e.g., number of connectors), geographical context (e.g., urban vs rural), and type of station (e.g., mounted on the wall vs stand-alone). See Section 2.4 for ‘EV-Ready’ cost considerations. A number of local suppliers offer charging stations from a variety of manufacturers. Refer to Table 2 for a list of charging station manufacturers. PlugIn BC maintains a full database of charging station manufacturers and local suppliers that may be referenced for the most up-to-date list - https://pluginbc.ca/incentives/manuf_list
A Tesla Supercharger is a special Level 3 charger that can only be used to charge Tesla vehicles. These stations are owned and operated as part of Tesla’s world-wide network. They are typically sited to support the long-distance travel needs of Tesla vehicle owners, but are increasingly being installed in cities to facilitate charging for Tesla owners living in multi-unit buildings and others without access to home charging.
Capital Region Local Government EV + E-Bike Infrastructure Backgrounder
| 6
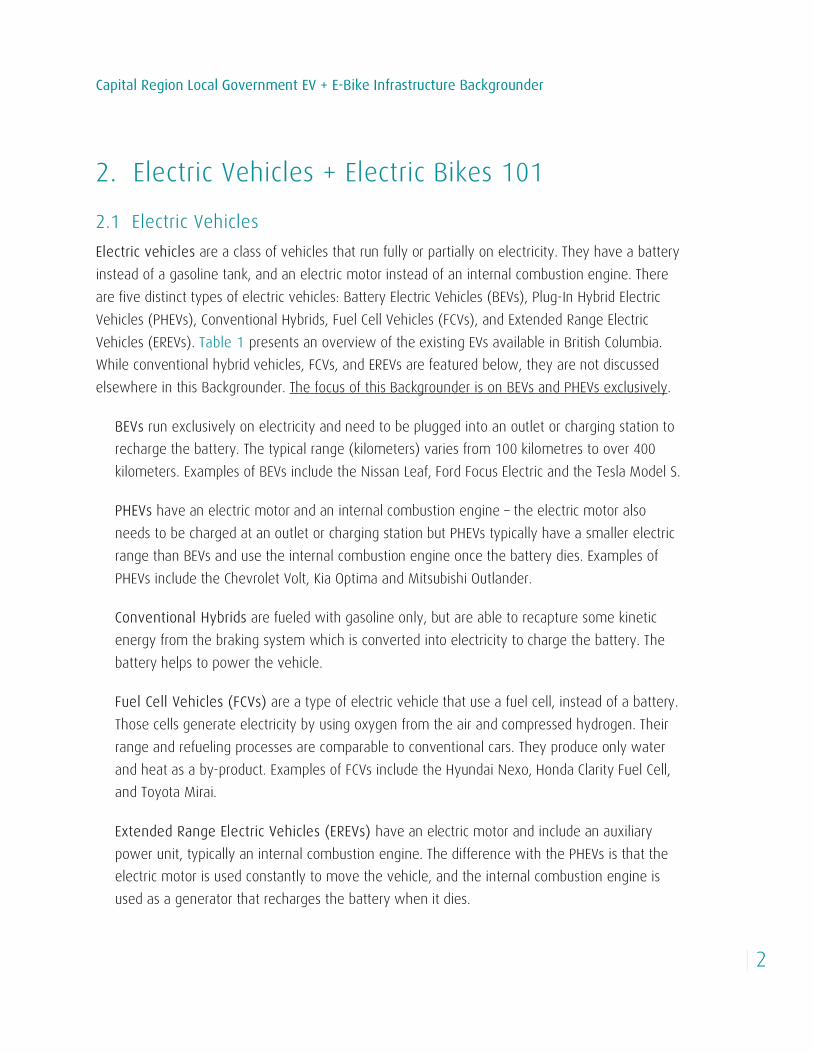
Table 2. EV Charging Station Manufacturers (as of September 20184)
Manufacturer Key Functions
Load Management Data Tracking
AddEnergie/Flo Some units Yes
AeroVironment Some units No
BMW Some units Some units
Bosch No No
ChargePoint Some units Yes
EFACEC Yes Yes
Elmec & EVduty Some units Some units
EV Box Yes Yes
EVoCharge Yes Yes
Hubbell Some units Some units
JuiceBar Some units Some units
JuiceBox Some units Yes
Leviton Some units Some units
Liberty Plugins Yes Yes
PowerPost Yes Yes
SemaConnect Some units Yes
Siemens Some units Some units
Sun Country Highway Some units Some units
Thermolec Yes Yes
WattZilla No No
2.3 Load Management & Load Sharing Load management and load sharing refer to control technologies that reduce peak power demand and improve the overall utilization of EV charging systems.5 The technologies help reduce electric infrastructure costs and provide the capability to control the time of use, which can be utilized to
Capital Region Local Government EV + E-Bike Infrastructure Backgrounder
| 7
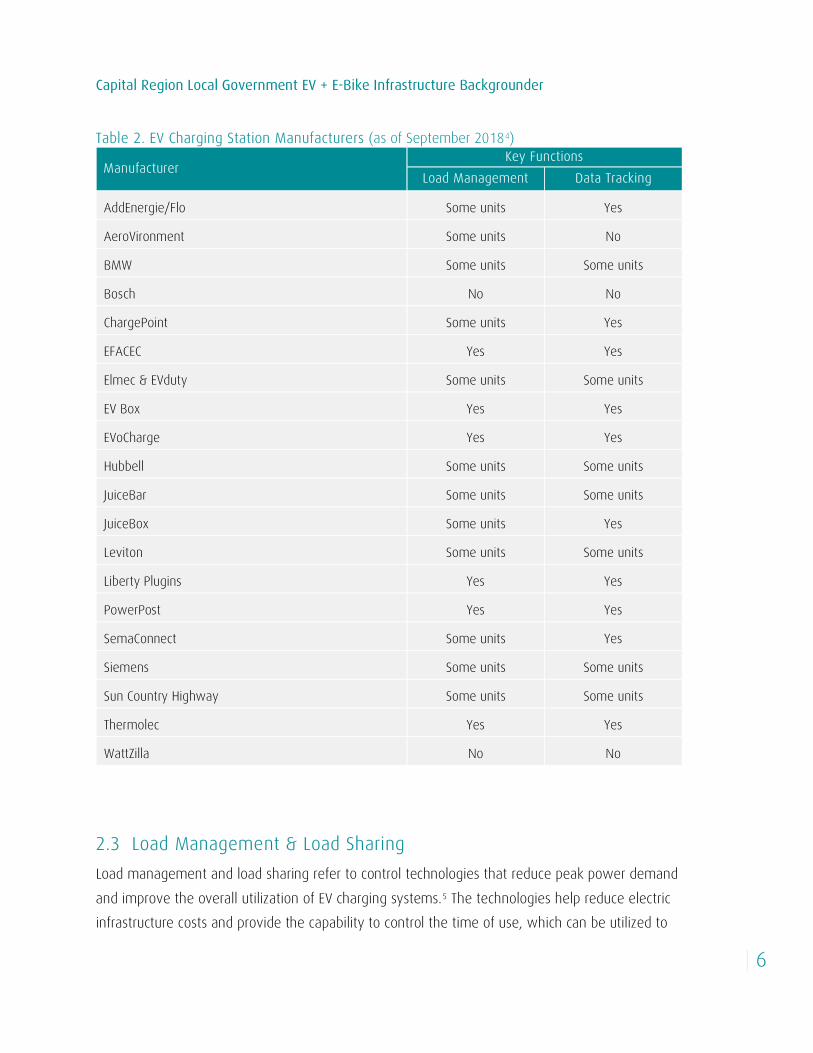
reduce the impact on the utility’s system. Both terms are used interchangeably for the general public but are distinguished by electrical engineers for technical purposes. In general, load management / sharing refers to a method where multiple EV charging stations share the same electrical line. This is commonly used in cases where the electrical capacity is not sufficient for all the required charging stations.6 The ability to distribute the available power of the existing grid connection to all connected charge points is ideal not only for multiple charging points, but in case there is a need for future expansion and increase in the number of EV charging points. In principle, this is a classic example of peak saving, which British Columbia has been doing over the past several years. It is also known as Demand Side Management (DSM), which allows utilities to reduce demand for electricity during peak usage times. New load management technologies are constantly under development by both the public and private sector; examples of organizations / manufacturers that load management technology include BC Hydro, AddEnergie/Flo, AeroVironment, ChargePoint, Leviton, and Siemens, among others.7 Figure 1 provides an illustrative example of how load managements works in practice. Figure 1. Illustrative Example of Load Management8

Capital Region Local Government EV + E-Bike Infrastructure Backgrounder
| 8
2.4 EV-Readiness & Retrofits EV-Ready, is considered a parking stall that is provided with conduit and an energized outlet capable of providing power to an electric vehicle charging station. It is a measure used to future-proofing a development to easily accommodate a future EV charging station. The City of Richmond procured a costing study to better understand installation costs for various architypes of new multi-unit buildings. Costs per charging unit depended on the EV charging technology and ranged from $561 (Level 2, 4-way load shared ‘energized’) to $2,610 (Level 2, dedicated ‘energized’).9 Retrofit costs, especially in multi-unit buildings, are typically much greater (averaged $6,800 per charging unit based on results from a previous provincial incentive program).10 Retrofits to an entire building, requiring additional panel upgrades, retrofits to the electrical room and transformer upgrades would significantly increase the average cost per station. Retrofits to an existing single-family home are typically less onerous and less costly (if home has existing electrical capacity and space).
2.5 E-Bikes E-Bikes are electric bicycles with an electric motor of 500 watts or less and functioning pedals that are limited to a top speed of 32 km/h without pedalling.11 Electric bicycles in British Columbia must comply with all standards outlined in the Motor Assisted Cycle Regulation, BC Reg. 151/2002. In summary, to be considered an electric bicycle it must meet the following characteristics:
• Electric motor of up to 500 watts, • Functional pedals, • Maximum speed of 32 km/h when power assisted, and • The power assist must disengage in any of the following: rider stops pedaling, throttle is
released, brake is applied. If the above mentioned characteristics are met then there is no requirement for driver’s license, vehicle registration, or insurance. However a bicycle helmet must be worn and the rider must be at least 16 years old. E-Bikes have a range of benefits beyond (or in addition to) those provided by a traditional, non-motorized bicycle. E-Bikes make cycling possible for a much wider diversity of people as they can

Capital Region Local Government EV + E-Bike Infrastructure Backgrounder
| 9
increase the length of bicycle trips, minimize the impact of hills and other terrain challenges, and allow people to bike with heavier cargo loads. This increase bicycle accessibility for women, seniors, and people with disabilities. Research has shown that E-Bikes are ridden twice as far and twice as often as traditional bicycles. Though E-Bikes offer riders some assistance, riders are still required to pedal and therefore achieve similar health benefits to that of a traditional bicycle.12 The amount of assistance the motor supplies depends on the size of the motor: smaller motors work to only assist the rider’s pedaling and larger, more powerful, motors can propel the bike forward without the rider needing to pedal. E-Bikes are classified according to their power, and there are three distinct classes. There are three types of E-Bikes, broadly described as follows:
The pedal-assist, also known as pedelecs, enhances the efforts of the rider only when they are pedaling. Two sub-categories exist in pedal-assist: the first provides assistance upon detecting pedal strokes and the second provides assistance when a chosen level of torque is reached. An example of a pedal-assist bike is the OPUS Grid.
The power-on-demand bikes only provide power on demand – this is initiated by the rider using a throttle which is typically located on the handgrip.
The third class is a hybrid of the pedal-assistance and power-on-demand. There is both a pedal-assist sensor and the option to engage the motor by utilizing the throttle on the handgrip. Examples of hybrid bikes are the Spark, Juiced OceanCurrent and CrossCurrent S, and the Interceptor Electric Cruise Bike.
Figure 2 provides an illustration of how pedal-assist differs from power-on-demand.
Figure 2. Pedal-assist (left) vs. Power-on-demand (right)13
Capital Region Local Government EV + E-Bike Infrastructure Backgrounder
| 10
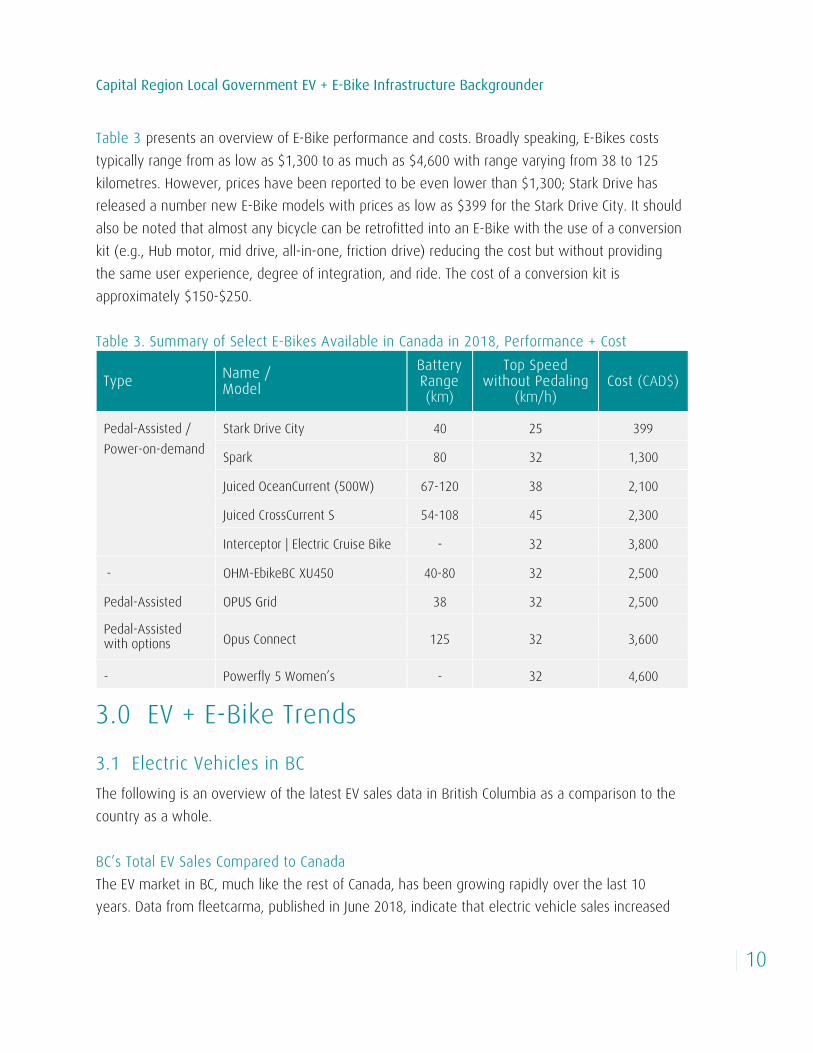
Table 3 presents an overview of E-Bike performance and costs. Broadly speaking, E-Bikes costs typically range from as low as $1,300 to as much as $4,600 with range varying from 38 to 125 kilometres. However, prices have been reported to be even lower than $1,300; Stark Drive has released a number new E-Bike models with prices as low as $399 for the Stark Drive City. It should also be noted that almost any bicycle can be retrofitted into an E-Bike with the use of a conversion kit (e.g., Hub motor, mid drive, all-in-one, friction drive) reducing the cost but without providing the same user experience, degree of integration, and ride. The cost of a conversion kit is approximately $150-$250. Table 3. Summary of Select E-Bikes Available in Canada in 2018, Performance + Cost
Type Name / Model
Battery Range (km)
Top Speed without Pedaling
(km/h) Cost (CAD$)
Pedal-Assisted / Power-on-demand
Stark Drive City 40 25 399
Spark 80 32 1,300
Juiced OceanCurrent (500W) 67-120 38 2,100
Juiced CrossCurrent S 54-108 45 2,300
Interceptor | Electric Cruise Bike - 32 3,800
- OHM-EbikeBC XU450 40-80 32 2,500
Pedal-Assisted OPUS Grid 38 32 2,500
Pedal-Assisted with options Opus Connect 125 32 3,600
- Powerfly 5 Women’s - 32 4,600
3.0 EV + E-Bike Trends 3.1 Electric Vehicles in BC The following is an overview of the latest EV sales data in British Columbia as a comparison to the country as a whole. BC’s Total EV Sales Compared to Canada The EV market in BC, much like the rest of Canada, has been growing rapidly over the last 10 years. Data from fleetcarma, published in June 2018, indicate that electric vehicle sales increased

Capital Region Local Government EV + E-Bike Infrastructure Backgrounder
| 11
by 75% in the first quarter of 2018 compared to the first quarter of 2017.14 There was a total of 6,600 EVs sold in the first quarter of 2018 with 4,000 PHEVs and 2,600 BEVs.
Electric vehicle ownership in BC has continued to climb, especially in the last 5 years. BC saw 1,400 EVs sales for the first quarter, representing an increase of 58% over the previous year. Data show that from 2013-2016, there were approximately 5,000 EVs sold in BC. In 2017 and in the first quarter of 2018 alone, there were 4,670 EVs sold, which is almost equivalent to the number of sales over a four year period (2013-2016).15 Figure 3 shows EV growth across three of Canada’s leading EV provinces. Notably, BC’s population as of 2018 is 4.8 million, which is significantly smaller than both Quebec (8 million) and Ontario (14 million). Therefore, even though there were more absolutely sales of EVs in Quebec and Ontario, BC saw more EV sales on a per capita basis.
Figure 3. Annual EV Sales, 2013-2017, by Province16
BC’s EV Market Share Compared to Canada EV market share—the portion of electric vehicles sold compared to the total automotive market—has also been growing in the last 5 years. The percent of EV sales compared to passenger car sales across the country is 5%, which is slightly higher from the all-time high of 4.6% in December 2017.17 EV sales currently represent 1.4% of all vehicle sales in Canada, which is also higher than the previous high of 1.3% in December 2017.
567 7691546
2132
3270
1438
26793229
4987
7194
10921736 2049
3400
7477
0
1000
2000
3000
4000
5000
6000
7000
8000
2013 2014 2015 2016 2017
British Columbia Quebec Ontario
Capital Region Local Government EV + E-Bike Infrastructure Backgrounder
| 12
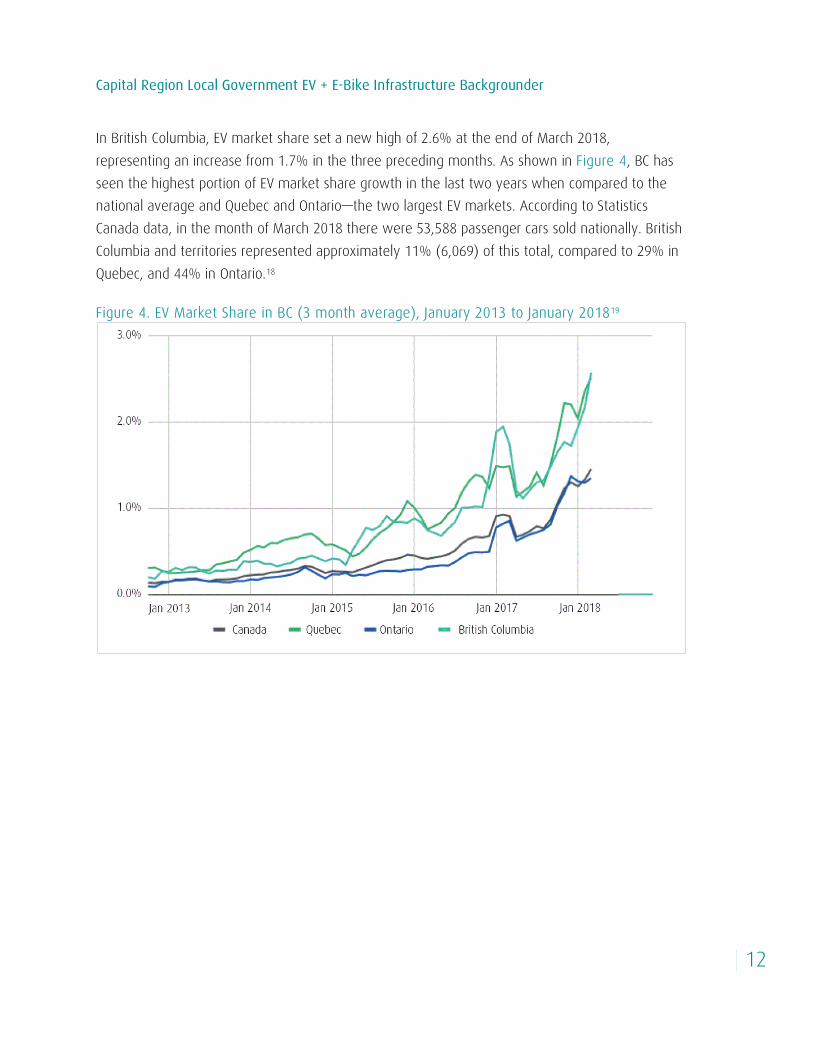
In British Columbia, EV market share set a new high of 2.6% at the end of March 2018, representing an increase from 1.7% in the three preceding months. As shown in Figure 4, BC has seen the highest portion of EV market share growth in the last two years when compared to the national average and Quebec and Ontario—the two largest EV markets. According to Statistics Canada data, in the month of March 2018 there were 53,588 passenger cars sold nationally. British Columbia and territories represented approximately 11% (6,069) of this total, compared to 29% in Quebec, and 44% in Ontario.18
Figure 4. EV Market Share in BC (3 month average), January 2013 to January 201819
Capital Region Local Government EV + E-Bike Infrastructure Backgrounder
| 13
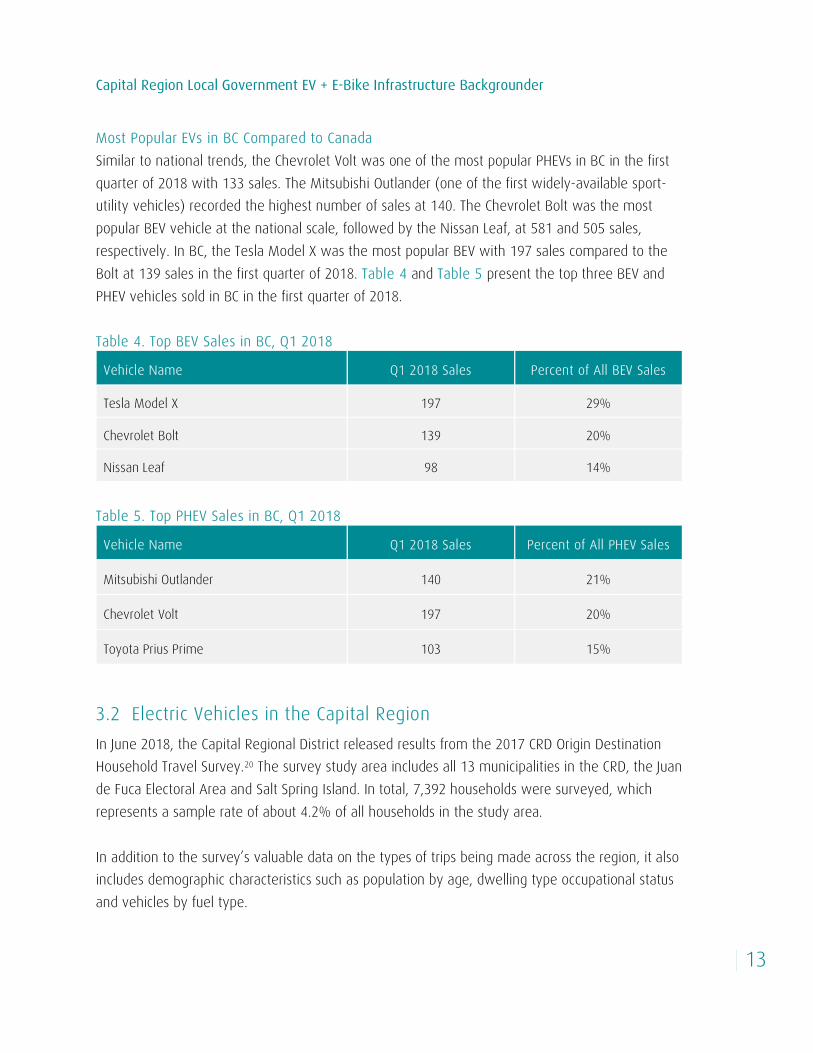
Most Popular EVs in BC Compared to Canada Similar to national trends, the Chevrolet Volt was one of the most popular PHEVs in BC in the first quarter of 2018 with 133 sales. The Mitsubishi Outlander (one of the first widely-available sport-utility vehicles) recorded the highest number of sales at 140. The Chevrolet Bolt was the most popular BEV vehicle at the national scale, followed by the Nissan Leaf, at 581 and 505 sales, respectively. In BC, the Tesla Model X was the most popular BEV with 197 sales compared to the Bolt at 139 sales in the first quarter of 2018. Table 4 and Table 5 present the top three BEV and PHEV vehicles sold in BC in the first quarter of 2018. Table 4. Top BEV Sales in BC, Q1 2018
Vehicle Name Q1 2018 Sales Percent of All BEV Sales
Tesla Model X 197 29%
Chevrolet Bolt 139 20%
Nissan Leaf 98 14%
Table 5. Top PHEV Sales in BC, Q1 2018
Vehicle Name Q1 2018 Sales Percent of All PHEV Sales
Mitsubishi Outlander 140 21%
Chevrolet Volt 197 20%
Toyota Prius Prime 103 15%
3.2 Electric Vehicles in the Capital Region In June 2018, the Capital Regional District released results from the 2017 CRD Origin Destination Household Travel Survey.20 The survey study area includes all 13 municipalities in the CRD, the Juan de Fuca Electoral Area and Salt Spring Island. In total, 7,392 households were surveyed, which represents a sample rate of about 4.2% of all households in the study area. In addition to the survey’s valuable data on the types of trips being made across the region, it also includes demographic characteristics such as population by age, dwelling type occupational status and vehicles by fuel type.

Capital Region Local Government EV + E-Bike Infrastructure Backgrounder
| 14
The summary of vehicles by fuel type identified 255,300 vehicles in the Regional Planning Area with, approximately 1,900 (0.7%) being “electric-only”. This represents an increase from the 2011 survey where only 100 electric-only vehicles were reported (less than 0.001%). Unsurprisingly, single-detached households represented the largest number of dwelling types with an electric vehicle (1,300), followed by apartment / condo (300), and row / townhouses (200). Table 6 shows the percentage of electric-only vehicles by municipality / electoral area. The data show electric vehicles represent 1% (or less) in almost all municipalities / electoral areas. The only exceptions are North Saanich (2%) and the Salt Spring Island Electoral Area (4%). Nevertheless, the survey does indicate that EV ownership has increased significantly since the 2011 survey. Table 6. Percentage of Electric-only Vehicles, by Municipality
Municipality / Electoral Area Percentage of Total Vehicles
Central Saanich <1%
Colwood 1%
Esquimalt 1%
Highlands --
Juan de Fuca Electoral Area 1%
Langford 1%
Metchosin <1%
North Saanich 2%
Oak Bay 1%
Saanich 1%
Salt Spring Island Electoral Area 4%
Sidney 1%
Sooke 1%
Victoria <1%
View Royal 1%

Capital Region Local Government EV + E-Bike Infrastructure Backgrounder
| 15
3.2 E-Bikes in the Capital Region Today With E-Bikes being an emerging mobility phenomenon, there is limited ownership data that is publicly available. To gather an understanding of general E-Bike trends and sales, telephone interviews were held with five bicycle shops in the Capital Region. The purpose of the interviews was to [a] understand the types of E-Bikes available to customers [b] the price range of E-Bikes [c] E-Bikes sales as a proportion of total bike sales and [d] whether the bicycle shops see a growing market for them. Table 7 presents a summary of the findings.
Table 7. Summary of E-Bike Sales at Select Bicycle Shops in the Capital Region
Bicycle Shop Most Popular Models Price Range E-Bike Sales as % of Total Bike Sales
Fairfield Bicycle Shop Electra Townie Go!,
Surface 604 $2,000-$6,000 33%
Fort Street Cycle Cannondale Quick $3,600-$8,000 1-2%
Goldstream Bicycles Devinci e-griffin, OPUS WKND, Del Sol LXI $3,000 to $3,600 Unsure
North Park Bikes Opus Connect,
Electra Townie Go! $2,500-$5,000 5%
Oak Bay Bicycles Cube Touring Hybrid One 500, Trek Verve Plus
$2,800-$6,600 20%
All of the bicycle shops reported that there is a growing market for E-Bikes. Oak Bay Bicycles reported that E-Bike sales are growing at a rate of 20% per year while Goldstream Bicycles stated that the store has sold more E-Bikes in the first few months of 2018 than in the last two years combined. Some of the bicycle shops indicated that sales could increase even further if the price of E-Bikes decreases. Sales in the Capital Region generally follow the trend globally. Worldwide sales of E-Bikes were estimated to be 36 million units in 2015 and 100 million by 2035, with the majority of sales being in Asia.21 In addition to the bike shops above, residents in the Capital Region also have the option of shopping at Pedego and other stores that specialize in E-Bikes. Companies such as Rad Power Bikes are also helping drive E-Bike sales in North America by offering consumers the ability to shop online for an E-Bike model and have it shipped directly to their door.
Capital Region Local Government EV + E-Bike Infrastructure Backgrounder
| 16
4. Plan + Policy Review 4.1 Official Community Plans in the Capital Region To understand local policy priorities with respect to EVs and E-Bikes, a review of all thirteen municipalities’ Official Community Plans (OCPs) and three electoral areas was completed. The results are presented in Table 8.
Notes:
1. No references to E-Bikes were noted in any OCP documents. Accordingly, E-Bikes are not included in the summary table below.
2. The Juan de Fuca electoral area is comprised of seven communities, each of which has an OCP. None of these communities’ OCPs were found to have any policy language on EVs or E-Bikes. The Southern Gulf Islands and Salt Spring Island electoral areas are in the Islands Trust Area, and are therefore all land use planning decisions are under the authority of the Islands Trust. The table only includes a community if policy was identified.

Capital Region Local Government EV + E-Bike Infrastructure Backgrounder
| 17
Table 8. Overview of EV OCP Policies in the Capital Region Municipality / Island Established Policies
Colwood Policy 8.2.6.6, direction to: • Install public charging stations • Review parking standards to include EV charging stations in new development
Esquimalt Multiple policies, as follows: • Encourage installation of EV charging in medium-high density residential
(Section 5.3) • Encourage installation of EV charging infrastructure in commercial/mixed-use
developments (Section 6.1) • Increase capacity for alternative fuelling such as electric (Section 13.3.6) • Pursue installation of EV charging capacity in new buildings during re-zoning
(Section 13.3.6) • Provide fast chargers in commercial areas where there is quick customer
turnover (Section 24.5.4)
Galiano Island Land Transportation Policy A: • The Local Trust Committee may require EV charging stations instead of parking
spaces. Parking standards may be established for EV charging stations in appropriate locations
Highlands Policy 15, Section 5.3.2: • Increasing access to low impact renewable powered vehicle technology such as
EV charging stations
Policy 2, Section 6.4: • Encourage EV charging station installation as part of emission reduction policies
Mayne Island Policy 2.4.1.10 (Section Retail Commercial): • Provision of EV charging stations in lieu of parking spaces for commercial uses
North Pender Island Policy 3.1.3.2 (Section Road Transportation): • Encourage EV charging stations to reduce auto-dependence
Policy 4.7.2 (Section Climate Change and Adaptation): • Provision of EV charging stations in lieu of parking spaces for commercial uses
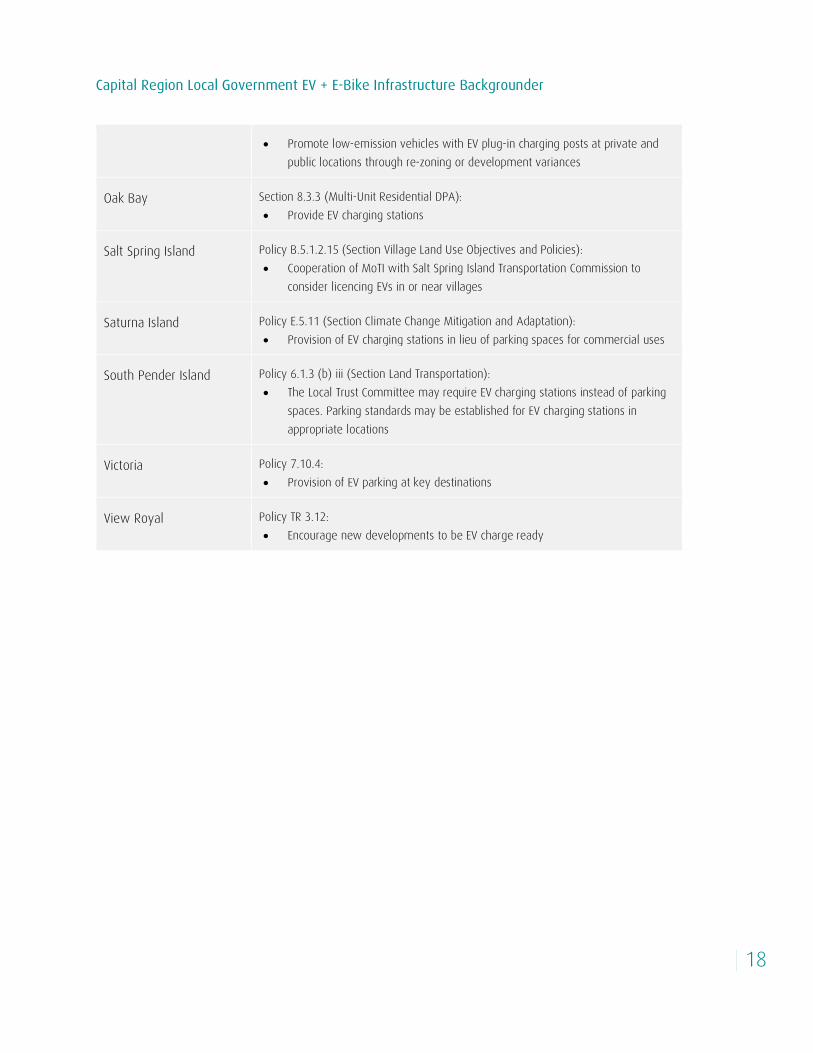
Table 8. Overview of EV OCP Policies in the Capital Region, cont.
Municipality / Island Established Policies
North Saanich Policy 18.7.11e (Section 18.7, Greenhouse Gas Reduction):
Capital Region Local Government EV + E-Bike Infrastructure Backgrounder
| 18
• Promote low-emission vehicles with EV plug-in charging posts at private and public locations through re-zoning or development variances
Oak Bay Section 8.3.3 (Multi-Unit Residential DPA): • Provide EV charging stations
Salt Spring Island Policy B.5.1.2.15 (Section Village Land Use Objectives and Policies): • Cooperation of MoTI with Salt Spring Island Transportation Commission to
consider licencing EVs in or near villages
Saturna Island Policy E.5.11 (Section Climate Change Mitigation and Adaptation): • Provision of EV charging stations in lieu of parking spaces for commercial uses
South Pender Island Policy 6.1.3 (b) iii (Section Land Transportation): • The Local Trust Committee may require EV charging stations instead of parking
spaces. Parking standards may be established for EV charging stations in appropriate locations
Victoria Policy 7.10.4: • Provision of EV parking at key destinations
View Royal Policy TR 3.12: • Encourage new developments to be EV charge ready
Capital Region Local Government EV + E-Bike Infrastructure Backgrounder
| 19
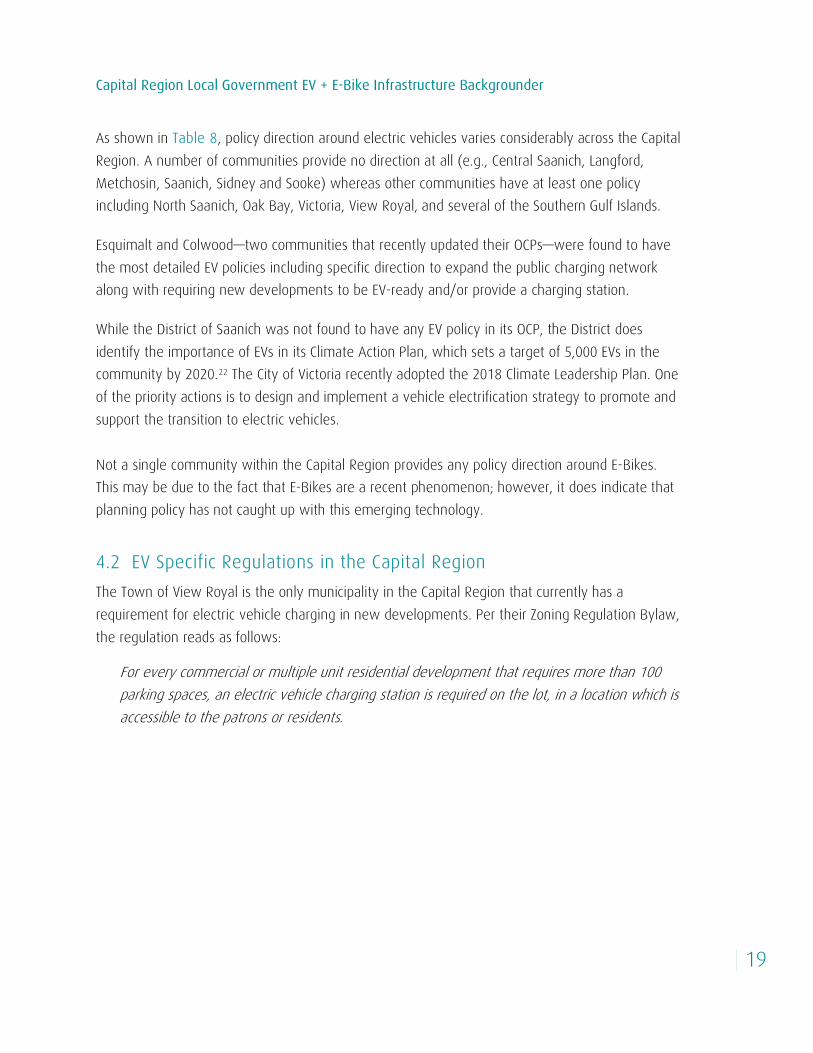
As shown in Table 8, policy direction around electric vehicles varies considerably across the Capital Region. A number of communities provide no direction at all (e.g., Central Saanich, Langford, Metchosin, Saanich, Sidney and Sooke) whereas other communities have at least one policy including North Saanich, Oak Bay, Victoria, View Royal, and several of the Southern Gulf Islands.
Esquimalt and Colwood—two communities that recently updated their OCPs—were found to have the most detailed EV policies including specific direction to expand the public charging network along with requiring new developments to be EV-ready and/or provide a charging station.
While the District of Saanich was not found to have any EV policy in its OCP, the District does identify the importance of EVs in its Climate Action Plan, which sets a target of 5,000 EVs in the community by 2020.22 The City of Victoria recently adopted the 2018 Climate Leadership Plan. One of the priority actions is to design and implement a vehicle electrification strategy to promote and support the transition to electric vehicles. Not a single community within the Capital Region provides any policy direction around E-Bikes. This may be due to the fact that E-Bikes are a recent phenomenon; however, it does indicate that planning policy has not caught up with this emerging technology.
4.2 EV Specific Regulations in the Capital Region The Town of View Royal is the only municipality in the Capital Region that currently has a requirement for electric vehicle charging in new developments. Per their Zoning Regulation Bylaw, the regulation reads as follows:
For every commercial or multiple unit residential development that requires more than 100 parking spaces, an electric vehicle charging station is required on the lot, in a location which is accessible to the patrons or residents.
Capital Region Local Government EV + E-Bike Infrastructure Backgrounder
| 20
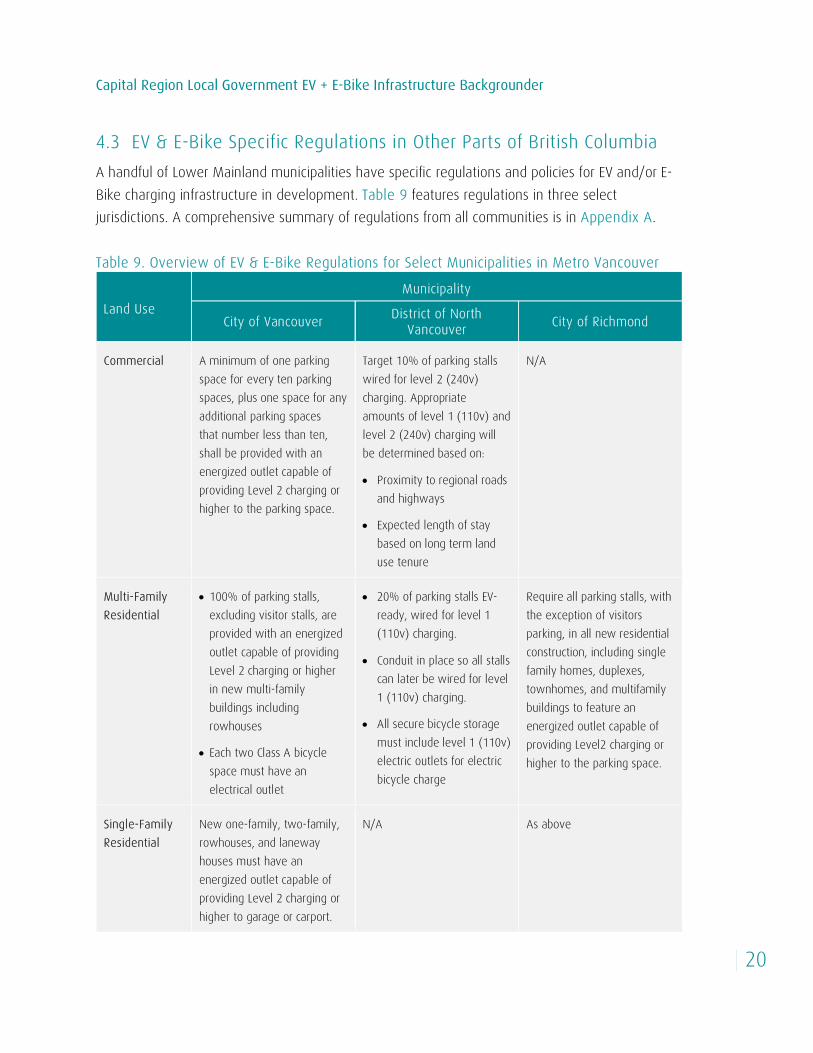
4.3 EV & E-Bike Specific Regulations in Other Parts of British Columbia A handful of Lower Mainland municipalities have specific regulations and policies for EV and/or E-Bike charging infrastructure in development. Table 9 features regulations in three select jurisdictions. A comprehensive summary of regulations from all communities is in Appendix A. Table 9. Overview of EV & E-Bike Regulations for Select Municipalities in Metro Vancouver
Land Use Municipality
City of Vancouver District of North Vancouver City of Richmond
Commercial A minimum of one parking space for every ten parking spaces, plus one space for any additional parking spaces that number less than ten, shall be provided with an energized outlet capable of providing Level 2 charging or higher to the parking space.
Target 10% of parking stalls wired for level 2 (240v) charging. Appropriate amounts of level 1 (110v) and level 2 (240v) charging will be determined based on:
• Proximity to regional roads and highways
• Expected length of stay based on long term land use tenure
N/A
Multi-Family Residential
• 100% of parking stalls, excluding visitor stalls, are provided with an energized outlet capable of providing Level 2 charging or higher in new multi-family buildings including rowhouses
• Each two Class A bicycle space must have an electrical outlet
• 20% of parking stalls EV-ready, wired for level 1 (110v) charging.
• Conduit in place so all stalls can later be wired for level 1 (110v) charging.
• All secure bicycle storage must include level 1 (110v) electric outlets for electric bicycle charge
Require all parking stalls, with the exception of visitors parking, in all new residential construction, including single family homes, duplexes, townhomes, and multifamily buildings to feature an energized outlet capable of providing Level2 charging or higher to the parking space.
Single-Family Residential
New one-family, two-family, rowhouses, and laneway houses must have an energized outlet capable of providing Level 2 charging or higher to garage or carport.
N/A As above

Capital Region Local Government EV + E-Bike Infrastructure Backgrounder
| 21
Other municipalities in Metro Vancouver are in the process of developing their EV regulations. A telephone interview with the City of Surrey confirmed that the City is in the “policy development” stage at this time.23 They are planning to adopt similar EV regulations to Richmond, which would require 100% of parking stalls in residential developments to be EV-ready. The City of Surrey is also planning to adopt a requirement for commercial buildings but the exact percentage is unknown at this time.
City of Burnaby Council recently approved bylaw requirements to make all new residential parking spaces EV-ready by providing an energized outlet for Level 2 charging, including in single-family homes and multi-family buildings of all sizes.24 The official bylaw language is not yet in place, however, amendments to the Zoning Bylaw to reflect these changes are forthcoming. The City is also reviewing options for EV charging requirements for new commercial and institutional development, investigating opportunities for providing public charging, and exploring the use of electric vehicles in municipal fleets.25
The City of Vancouver and District of North Vancouver are the only local governments that were found to have specific regulatory language on E-Bikes. The City of Vancouver’s bicycle parking requirements require 50% of off-street long-term bicycle parking spaces to have access to an electric outlet.26 The District of North Vancouver requires that all secure bicycle storage include level 1 (110v) electric outlets for electric bicycle charging.
4.4 Regulatory Aspects of Selling Electricity for EV Charging The BC Utilities Commission (BCUC) regulates the sale and resale of electricity in BC. Municipalities who sell electricity to its residents are exempt from the BCUC. BCUC is undertaking an inquiry to explore the potential regulatory issues and opportunities in the EV charging stations market. As indicated in the inquiry FAQ, the services, rates, and rate design associated with EV charging are currently in an early development stage in BC. But, with the growing popularity of EVs and increasing availability of public charging stations—currently over 1,000 in the province—there is a need to assess the regulatory needs, or lack thereof, that would “be associated with EV charging service, and can also include the setting of rates for EV charging service and any other matters that are of concern or interest to stakeholders”.27 The results of this inquiry will have direct implications

Capital Region Local Government EV + E-Bike Infrastructure Backgrounder
| 22
for how municipalities establish a fee and set rates for their municipally owned EV charging stations. More information about the inquiry is found online.1 A related regulatory issue pertains to the Strata Property Act, where regulations were amended in March 2018 to “include user fees for services or costs of service that only apply to common property and common assets”. This effectively allows a strata corporation to adopt a bylaw or rule that determines a cost for electric vehicle charging at a fixed rate per hour of charging, which would include the cost of electricity and the cost of any upgrades or maintenance requirements of the strata corporation.28 Even though these amendments have been made to the Strata Property Act, strata corporations are still not legally permitted to sell electricity according to BCUC laws. Section 21 of the Utilities Commission Act requires any entity selling electricity to register as a public utility, which makes it difficult for a strata to sell electricity to EV owners.29 The issue facing the Strata Property Act will also need to be considered in the BCUC inquiry.
1 More information about the BCUC Inquiry is available here: http://www.bcuc.com/Documents/Proceedings/2018/DOC_50755_02-08-2018_BCUC-EV-Charging-FAQ.pdf
Capital Region Local Government EV + E-Bike Infrastructure Backgrounder
| 23
5.0 Public EV Charging Additional Considerations Municipal policy and regulation may be one of the most effective ways to provide opportunities for EV charging, and thereby help increase EV adoption rates. However, there are a number of other practices and actions that municipalities have pursued to site and manage EV charging infrastructure. This section presents a summary of some of those practices, touching on the Capital Region, Metro Vancouver, and the cities of Portland and Montreal.
5.1 Public Charging Station Networks A 2015 report by the International Council on Clean Transportation (ICCT) analyzed the actions that are impacting electric vehicle deployment in the 25 most populated US metropolitan areas. One of the study’s most relevant findings is that the number of public chargers per capita is a significant factor in a city’s EV share. Public charging infrastructure can help alleviate range anxiety, extend the functional range of an EV, offer an economic incentive when the electricity is provided for free, and demonstrate support from municipalities and businesses.30 With 120 charging stations in the Capital Region, there are approximately 31 stations per 100,000 people.
In the Capital Region, almost all municipalities provide publicly accessible EV charging stations. According to ChargeHub, in July 2018 there were approximately 120 EV charging stations within the region, 116 of which are Level 2, and 4 of which are Level 3 (fast charger).31 Common locations for municipally / regionally managed stations include:
• Libraries • Municipal Halls • Community or Recreation Centres • Park and Ride Facilities • Public Parkades
The City of Montreal has taken a different approach to siting its City-owned charging stations. Many EV owners who live in the core part of the city do not have access to a home charging station. As such, the City has strategically sited 400 of its 475 public charging stations on-street to provide viable charging opportunities for the “garage orphans” that is, households that do not have access to a carport or garage, and therefore do not have the ability to charge an EV. It was reported that having access to a public charging network in Montreal has been valuable for increasing EV uptake among prospective EV owners.32 The City is planning to provide another 200 public EV stations by the end of this year, which would bring its total to 675.33
Capital Region Local Government EV + E-Bike Infrastructure Backgrounder
| 24
Both the City of Portland and City of Vancouver explained how Level 2 charging stations in their respective cities are found in locations that are highly visible and where dwelling times are typically longer than an hour. These locations include park and rides, community centres, grocery stores, malls, and coffee shops and parks. The City of Vancouver specifically sites charging stations34 based on the following criteria:
• Level 2 chargers | where people typically spend 1–2 hours such as community centres and malls
• DC Fast chargers | where people typically spend 45 minutes to an hour including restaurants, coffee shops, downtown hubs, and grocery stores
• Neighbourhood site specific DC fast chargers | sites with higher density, older housing stock, and higher rates of rental properties
The City of Portland has an initiative called “Electric Avenue”, which is a research project between Portland State University, Portland General Electric, and the City of Portland that allows EV owners and E-Bike users to park and charge their vehicle. One of the main objectives of Electric Avenue is to raise awareness among the general public of a parking and charging “oasis” in downtown Portland. Electric Avenue offers four Level 2 stations and 1 Level 3 fast charger.35,36 An important part of the project’s success has been its visibility and the convenience it has provided to EV users.37 Plug In BC also reported that “clustering” of stations is becoming a best practice. In addition to the convenience benefits identified in Portland’s Electric Avenue initiative, clustering stations also gives EV users more confidence that they will receive a charge due to the larger number of stations that could be available.38
The City of the Montreal was the only interviewed municipality that reported how clustering Level 2 charging stations in one location was not successful, such as the 16 stations around City Hall. They have found that it is more useful and strategic to site the stations in areas where they are visible.39

Capital Region Local Government EV + E-Bike Infrastructure Backgrounder
| 25
A 2018 Nissan Leaf parked in the EV only parking stall at the Oak Bay Municipal Hall. Municipal Halls are a common location for municipally-owned EV charging stations.
5.2 Paying a Fee for Public Charging Station Use Almost all municipalities in the Capital Region do not currently charge a user fee for utilization of a public charging station. The only exception is the Township of Esquimalt. The Township only has one publicly accessible charging station. Due to the increasing demand for the EV charging station, a user fee of $1.00 per hour came into effect on July 4, 2017. Since 2014, station use has increased by more than 50% each year. The revenues collected will be used to fund sustainability initiatives through the Township’s Sustainability Reserve Fund.40
The rationale41 for introducing the fee is five-fold, as follows: 1. Manage increasing demand 2. Limit the length of charging sessions 3. Provide neighbourhood charging for EV drivers without access to an at-home charger 4. Avoid conflict between station users 5. Reduce range anxiety for current and prospective EV drivers

Capital Region Local Government EV + E-Bike Infrastructure Backgrounder
| 26
While charging a user fee for public use is not a common practice in Canada, some leading EV municipalities such as Montreal and Vancouver do have established fees in place. In Montreal, the rates are set by the province through the Electric Circuit initiative, which is the largest public charging station network in the province. Rates for a Level 2 station are $2.50 per charge or $1 per hour, which is billed per minute while the vehicle is connected to the station. This rate structure allows for flexibility in the charging time needed by drivers. Level 3 stations are $10 per hour and are billed per minute while the vehicle is connected to the station.42
As of spring 2017, the City of Vancouver started charging a user fee for public charging stations at City-owned locations. The reasons for introducing the fee are similar to Esquimalt, especially for helping encourage turnover. The City found that on average, users were connected to the charging stations for about 3 hours each session, which was approximately double the amount of time required to receive a full charge.43 The rates are as follows:
• Level 2 station – $2 per hour ($0.033 per minute) • Level 3 station – $16 per hour ($0.267 per minute)
Other municipalities that the project team spoke with including the City of Surrey, City of North Vancouver, City of Port Coquitlam, City of Richmond, and City Burnaby all confirmed that they have plans in the immediate future to introduce a fee for their public charging stations, which indicates that there is trend toward this practice in the Metro Vancouver region.
Capital Region Local Government EV + E-Bike Infrastructure Backgrounder
| 27
6.0 Barriers to EV & E-Bike Adoption 6.1 Electric Vehicles Research has identified a number of barriers to electric vehicle adoption. Understanding the key barriers are critical for determining the most appropriate suite of policies, strategies, and incentives that could be implemented to alleviate barriers and increase EV adoption rates. Based on a review of the literature and experience from other jurisdictions, a summary of the most common barriers to EV adoption are summarized as follows. This section also includes results from the online public survey that was open to residents in the Capital Region from June to July 2018. More information about the survey is presented in Section 8.0. “Range Anxiety” – Real Vs. Perceived Widely reported as one of the most commonly reported barriers, potential EV buyers cite range anxiety as one of main reasons why they do not purchase a vehicle.44,45 Range anxiety refers to the fear of running out of battery power before the next opportunity is available to charge a vehicle. Battery range is generally improving in newer vehicles with some vehicles capable of travelling over 500+ km on a single charge. However, the perception of range anxiety is still a key barrier to adoption. Studies have shown that a large gap exists between perceived and real-word range anxiety which can be alleviated by driving experience.46 Research has also found that as the range of an EV increases, so does the willingness to purchase of vehicle.47 A recent survey by BC Hydro found that more than six in 10 British Columbians reported that there is not enough charging infrastructure in BC to make them feel comfortable about purchasing or leasing an EV. This issue though, is more related to perceived range anxiety as BC Hydro reported that approximately 95% of car trips in BC are less than 30 kilometres. In addition, the study also reported that the availability of EV models is improving in the province with newer vehicles offering greater range.48
The issue of perceived range anxiety was also identified in the Capital Region public survey, where 11 of 58 respondents indicated that it is a barrier affecting their decision to purchase an EV. However, perceived range anxiety appears to be less significant of an issue for residents in the Capital Region compared to other geographies.
While perceived range anxiety is less of an issue for residents in the Capital Region, survey respondents were also asked to state challenges with EV ownership. This question was directed to

Capital Region Local Government EV + E-Bike Infrastructure Backgrounder
| 28
those who own an EV or plan to purchase one. Specifically, 111 of 540 respondents identified range anxiety as a challenge. Responses to this question largely fit into two themes, as follows:
• Limited range for long-distance travel
• Lack of public charging facilities to alleviate range anxiety, specifically, the lack of level 3 (DCFC) stations
Purchase Price The price of an electric vehicle, which is strongly influenced by battery costs, have been identified as being one of the most significant obstacles to widespread EV adoption.49 Research and consumer surveys have consistently found that price is a major barrier to EV sales. The 2017 survey by Plug’n Drive confirmed that the top reason gasoline-powered car owners choose not to purchase an EV is price.50
Plug’n Drive’s final report highlighted the importance of communicating the “total cost of ownership” of a gasoline-powered car versus an EV. An understanding of the total cost of ownership can increase the likelihood that drivers of small and mid-size cars making a decision to purchase a plug-in hybrid or a battery electric vehicle.51 The BC Hydro study reported that the total costs of ownership for three 2018 EV models was less expensive than three comparable gas-powered cars. For example, it reported that a Nissan Leaf is $1,465 cheaper than a Honda Civic over an annual basis, which is mostly due to fuel costs ($449 for electricity vs. the Civic’s $1,705 in gas at 20,000 kilometres per year).52 Purchase price was identified as the most significant barrier in the Capital Region public survey. Specifically, 30 percent of the respondents selected “EVs are too expensive” as the main factor for why they do not own or plan to purchase an EV. Qualitative responses confirmed that the existing price of an EV is not yet financially competitive with an internal combustion engine.
Capital Region Local Government EV + E-Bike Infrastructure Backgrounder
| 29
Lack of Knowledge + Experience with EV Technology Most potential EV buyers have little knowledge of electric vehicles and almost no experience with them. Public consumer surveys have shown that many consumers do not even know someone with practical experience driving or charging EVs.53 A 2017 Canadian survey found that more than 40% of interviewed EV owners were introduced to EVs by a friend, a relative or a colleague before owning one. Gasoline-powered car owners had never been exposed to an EV before buying their car.54 In sum, lack of experience and familiarity with EVs can act as a major barrier to widespread adoption and perpetuate myths about the technology itself. Charging Time On average, a gasoline-powered vehicle can refuel in approximately 4 minutes, whereas an EV requires approximately 30 minutes at a DC fast charger station and up to several hours from a 110 or 220 V outlet, depending on the battery size. Lack of Variety in Model Types Various studies and consumer experiences have identified the lack of variety of EVs at the dealership as a barrier to EV adoption. One study indicated that EVs will need to become available in a broader set of vehicle types, or consumers will need to shift their interests in EV vehicle types if EVs are to achieve high percentages of vehicles purchases.55 This appeared to be less of a barrier / issue in the Capital Region public survey where only 10% of respondents indicated that the lack of model or vehicle types is a significant factor.
A recent article published in Business Insider identified 30 distinct electric vehicle models that are slated to come to the market by 2025. These vehicles, to be offered by several different car manufacturers, will include SUVs (e.g., Tesla Model Y, Audi e-tron, Mercedes-Benz EQC, Volvo XC40), sedans (e.g., Subaru Crossover, Volkswagen I.D.), a pick-up truck offered by Tesla, and luxurious vehicles such as the Porcshe Taycan.56 Greater diversity in model types will appeal to a broader segment of the market.

Capital Region Local Government EV + E-Bike Infrastructure Backgrounder
| 30
Availability of Public Charging Stations This barrier, which is one of the most relevant for this project, confirms that the location of public EV charging stations plays an important role in the personal mobility patterns of EV owners, including the specific travel routes they take and where they shop.57 In BC, the majority (over 90%) of EV owners charge their vehicle at home or work.58 This trend has been observed in other parts of Canada, across the United States59 and around the world.
Even though most EV owners charge their vehicles at home, research has shown that the lack of public charging stations can act as a major impediment to EV adoption. Research has found that the limited availability of rapid-charging stations (i.e., DC Fast Chargers) is the largest barrier to adoption as there are limitations on desired charge time.60
The Capital Region public survey also reported this barrier; about 21% of respondents indicated that the lack of public chargers in the region is a barrier to EV ownership. Part of this barrier might be explained by the lack of opportunity to charge at home, discussed below. Lack of Ability to Charge at Home For households that do not have access to a carport or garage, the ability to access charging overnight can be a major problem.61 In the City of Montreal, for example, many of the EV owners who live in the core part of the city do not have access to a home charging station (referred to as “garage orphans”). It was reported that having access to a public charging network in Montreal has been valuable for increasing EV uptake among prospective EV owners.62 Approximately 20 percent of the respondents in the Capital Region public survey selected “don’t have the ability to charge at home” as a key barrier to EV ownership. Qualitative responses to this barrier included three main themes, as follows:
• The resident lives in an apartment rental building with no ability to charge an EV • The resident lives in a condo building with no ability to charge an EV • The resident does not have a driveway / garage, which limits the ability to charge an EV

Capital Region Local Government EV + E-Bike Infrastructure Backgrounder
| 31
6.2 E-Bikes As a newer mobility trend, many consumers are unfamiliar with E-Bikes and those who own—or have expressed interest in purchasing one—have reported technological, social, environmental, and security barriers. As a new and emerging transportation option, the research has not caught up with all of the consumer attitudes and concerns regarding E-Bikes; however, this section presents the latest research on barriers, which are important for informing policy direction. Relevant results have also been included from the Capital Region public survey.
Price Similar to the price barrier identified for EVs, E-Bikes are generally more expensive than regular bikes; in North America the differences is approximately 25-40% Results from the Capital Region public survey found that; approximately 37 percent of respondents selected “too expensive” as the main factor contributing to their decision to not purchase an E-Bike. This was the most selected barrier.
One study asked respondents about their perceptions of cycling and of E-Bikes as well as their willingness to pay for an E-Bike. It found that price was identified as the largest hindrance to purchasing an E-Bike; however, those who were given access to an E-Bike had much higher willingness to pay for one.63 The researchers concluded that people are largely unaware of the benefits of an E-Bike and showed greater interest once their knowledge of them improved.
The perception of E-Bikes being expensive is also a barrier. One study conducted 27 interviews with E-Bike users to understand why they purchased one and what their overall experiences have been. The perception of E-Bikes being expensive may derive from the assumption that E-Bikes are meant to be used for recreational activities (i.e. as a substitute for road bikes or other forms of recreation) and not for transportation (i.e. as a substitute for cars).64 E-Bikes may be expensive relative to regular bikes, but their true cost depends on what kinds of trips they are used for. For example, when compared to a car, E-Bikes are significantly cheaper; the study’s participants noted that the savings from gas and insurance costs can make E-Bikes even more cost effective.65
A March 2018 report by Portland State University presented results of a North American survey of electric bike owners. The survey did not identify price as a barrier as it was focused on those who own or regular operate an E-Bike; however, the report did report that E-Bikes have the capacity to replace various modes of transportation commonly used for utilitarian and recreational trips including motor vehicles, public transit, and regular bicycles. The majority of the utilitarian trips

Capital Region Local Government EV + E-Bike Infrastructure Backgrounder
| 32
being made by an E-Bike are replacing motor vehicle trips.66 These findings can help put the price of an E-Bike into context, especially when compared to the price of a motor vehicle. Research has shown that people are largely unaware of the benefits of an E-Bike and showed greater interest once their knowledge of them improved.67 Lack of Secure Parking Closely related to the price of an E-Bike is the concern about theft. Multiple studies have found E-Bike owners have concerns and anxiety about the security of their e-bike.68.69 Concerns about theft are partially explained by lack of secure bike parking. One study investigated the motives for e-bike purchases, rider experience and perceived impact on mobility, health and wellbeing through in-depth interviews with e-bike owners. E-Bike owners reported that parking E-Bikes is a challenge at major transportation hubs such as public parking facilities due to a lack of space or issues with design. Participants explained how it can be hard to find bike stands in city centres that can accommodate an E-Bike.70
In addition, parking in public parking facilities was identified as challenging because of the difficulty with maneuvering in and out of bike parking areas and the heaviness of the bike itself, which makes it hard to lift over obstacles. As a solution, participants identified the need for more secure long-stay valet style parking in city centres and transportation hubs with provision to charge batteries. Reported issues with parking specifically include the lack of suitable racks to accommodate an e-bike and the need for more secure long-term parking to avoid leaving the E-Bike outside.71
The Capital Region public survey also found that the lack of secure parking is a barrier facing prospective E-Bike owners. Approximately 27 percent and 15 percent of respondents selected “afraid that it might be stolen” and “lack of places to park an E-Bike”, respectively, as factors for why they have not purchased an E-Bike. Combined, this represents 42 percent of the total responses, which indicates that the lack of secure bike parking is a critical issue that requires policy attention. Social Stigma Studies have shown that there is sometimes a stigma attached to E-Bike use. Some people perceive E-Bikes as “cheating”, as it takes away the physical effort required to pedal a regular bicycle and people are uninformed about how E-Bikes could also be used for utilitarian purposes

Capital Region Local Government EV + E-Bike Infrastructure Backgrounder
| 33
and substitute for car trips.72 E-Bike owners reported being judged by their work colleagues, who deemed an E-Bike as a more suitable form of transportation for those with a disability or for older people. Some E-Bike owners have reported that the perception of E-Bikes as being used for recreational purposes was considered cheating by their peers, who were uninformed about how E-Bikes could also be used for utilitarian purposes and substitute for car trips.73
This issue did not surface as much in the Capital Region public survey; however, some qualitative response in the survey included “they are ridiculous; ride a proper bike”; “I’m a stronger rider, no need for one”; “concerned about looking like a huge dork”. While these sentiments were in the minority, they still indicate a perceived stigma around using electric bikes. General Safety Concerns for Current & Prospective E-Bike Owners Numerous studies have confirmed the issue of safety as a key barrier to E-Bike adoption and a concern for E-Bike owners. Safety can be organized into two categories: [a] the actual safety of the E-Bike itself including its higher operating speed relative to a regular bicycle and [b] safety of riding an E-Bike on the road.
Specifically, the lack of speed restrictions of E-Bikes has been reported as worrisome, especially if the E-Bikes use bike lanes or multi-use paths as the main cycling infrastructure for travel.74 A related safety issue is the challenge of visually distinguishing E-bikes from regular bicycles. Car drivers may underestimate the speed at which an E-Bike is approaching, resulting in a potential conflict.
E-Bike owners, as a subset of cyclists more general, report concerns regarding road safety, particularly around interacting with cars on the road. The Capital Region public survey found that approximately 22 percent of respondents selected “concerned about safety” as barrier to E-Bike ownership. A significant number of the qualitative responses around safety pertained to the need for better cycling infrastructure including protected bike lanes.
6.3 Summary of Barriers to EV & E-Bike Adoption The research presented above confirms that there are a number of barriers—technological, economic, social, and infrastructure—to EV and E-Bike adoption. For this Backgrounder, and the Infrastructure Planning Guide more broadly, the availability of EV charging stations is a key barrier to adoption that require both policy and regulatory attention. While there are several real and perceived barriers with E-Bikes, the importance of secure and safe parking facilities is critical for accommodating the needs of both current and prospective E-Bike users.

Capital Region Local Government EV + E-Bike Infrastructure Backgrounder
| 34
7.0 Infrastructure Gap Analysis 7.1 Purpose of a Public Charging Station Network As described in previous sections, research has shown that the presence of a public EV charging network is a critical consideration for potential EV buyers. In addition, the location of public EV charging stations (i.e., where the stations are physically sited) can influence the personal travel patterns of those electric vehicle users, including the specific travel routes they take and where they shop.75 Results from the Capital Region public survey (see Section 8.0) also confirm the importance of a public charging station network. A majority of the respondents identified the need for more charging public charging stations.
The purpose of the infrastructure gap analysis will be to evaluate where EV charging stations gaps exist in the Capital Region, and to identify the highest priority locations for new charging stations to guide future site selection.
A review of the key objectives for a public charging station network was prepared below to help inform and guide the infrastructure gap analysis. The information draws on the results from the public online survey and summary of best municipal best practices. The objectives of a network are three-fold:
1. Tackling Range Anxiety: To help alleviate range anxiety by providing drivers with the opportunity for “lifeline” charging, which refers to the ability to charge a vehicle when its battery is almost depleted;
2. Increasing the EV Profile: To create public awareness and understanding of electric vehicles and increase exposure and knowledge of EV technology; and
3. Accommodating Garage Orphans: To provide viable charging opportunities for families who do not have access to off-street parking (colloquially known as “garage orphans”).
Capital Region Local Government EV + E-Bike Infrastructure Backgrounder
| 35
In relation to DC Fast Chargers specifically, the BC Ministry of Energy and Mines76 has identified the following four guiding principles for deployment across the province, including:
• Connect priority travel corridors across the province, where “priority travel corridors” are defined as travel corridors that either have a large volume of commuter traffic, support cross jurisdictional travel, or support tourism within BC.
• Ensure infrastructure deployment allows for safe travel in the province. • Support regions with dense plug-in electric vehicle (EV) adoption. • Maximize population areas served.
It is also noted, that while it is unreasonable to expect that every station in BC’s fast-charging network will meet all four principles, these guiding principles should be referenced and balanced whenever new locations are considered, in the context of the network as a whole.
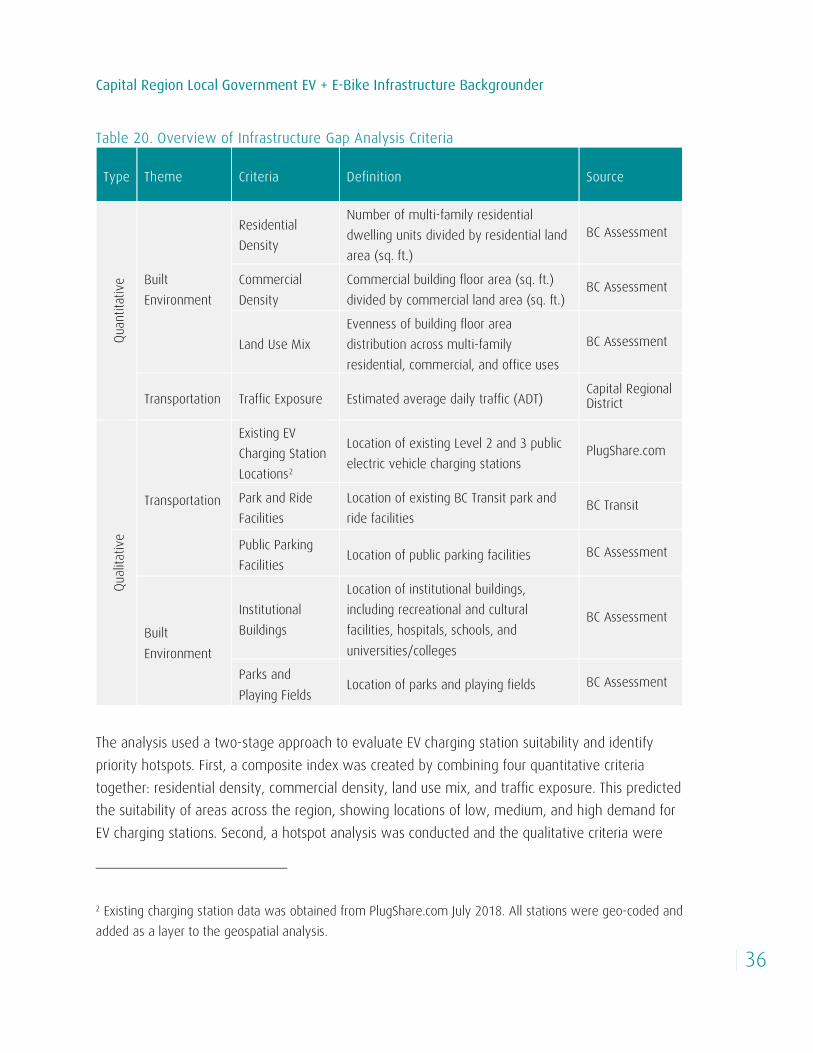
7.2 Methodology A geospatial analysis was conducted using the Esri ArcGIS and R software packages to evaluate where EV charging stations gaps exist in the Capital Region, and to identify the highest priority locations for new charging stations. The infrastructure gap analysis estimates EV charging station suitability using a Geographic Information System (GIS) by quantitatively assessing individual built environment and transportation criteria that approximate demand for EV charging. All the criteria are then integrated together to create a composite index that assesses suitability across the region. An overview of the criteria used is described in Table 10, outlining the criteria, their definition, the data source, and relevance as a proxy for EV charging station demand. The analysis combines parcel-level data from BC Assessment and other objective built environment and transportation data from the Capital Regional District, BC Transit, and PlugShare.com.
Capital Region Local Government EV + E-Bike Infrastructure Backgrounder
| 36
Table 20. Overview of Infrastructure Gap Analysis Criteria
Type Theme Criteria Definition Source
Quan
titati
ve Built
Environment
Residential Density
Number of multi-family residential dwelling units divided by residential land area (sq. ft.)
BC Assessment
Commercial Density
Commercial building floor area (sq. ft.) divided by commercial land area (sq. ft.)
BC Assessment
Land Use Mix Evenness of building floor area distribution across multi-family residential, commercial, and office uses
BC Assessment
Transportation Traffic Exposure Estimated average daily traffic (ADT) Capital Regional District
Quali
tativ
e
Transportation
Existing EV Charging Station Locations2
Location of existing Level 2 and 3 public electric vehicle charging stations
PlugShare.com
Park and Ride Facilities
Location of existing BC Transit park and ride facilities
BC Transit
Public Parking Facilities Location of public parking facilities BC Assessment
Built Environment
Institutional Buildings
Location of institutional buildings, including recreational and cultural facilities, hospitals, schools, and universities/colleges
BC Assessment
Parks and Playing Fields
Location of parks and playing fields BC Assessment
The analysis used a two-stage approach to evaluate EV charging station suitability and identify priority hotspots. First, a composite index was created by combining four quantitative criteria together: residential density, commercial density, land use mix, and traffic exposure. This predicted the suitability of areas across the region, showing locations of low, medium, and high demand for EV charging stations. Second, a hotspot analysis was conducted and the qualitative criteria were
2 Existing charging station data was obtained from PlugShare.com July 2018. All stations were geo-coded and added as a layer to the geospatial analysis.
Capital Region Local Government EV + E-Bike Infrastructure Backgrounder
| 37
overlaid on top of the results to identify existing gaps and priority locations (by comparing against existing EV charging station locations) and ideal opportunity sites to locate a station (by comparing against the presence of institutional buildings, parking facilities, and parks). Note: the intent was to do a technical analysis to guide infrastructure planning and investment at a regional level. While not considered in the analysis, it is assumed that there may be specific municipal and electoral area considerations that are unique to that community (ex. niche tourism and economic development opportunities, local per capital EV ownership rates, etc.) The analysis followed nine major steps:
1. The Capital Regional District was spatially divided into 150-metre grid cells to generate the unit of analysis. These units are small enough to introduce site and localized neighbourhood characteristics, but are manageable from a site suitability, data management, and computer processing perspective.77
2. The Building Information Report, Residential Inventory Extract, and Commercial Inventory Extract from the 2018 property assessment roll from BC Assessment were joined with the Capital Regional District’s property cadastre.
3. For the built environment criteria, gross building floor area and land area at the parcel level were calculated for multi-family residential, commercial, and office properties.
4. For the traffic exposure criteria, arterial and collector links were retrieved from the 2008 CRD Regional Transportation Model. Average daily traffic (ADT) was estimated from PM peak hour volumes to identify an initial threshold of 22,000 vehicles per day (two-way total) for a high-volume roadway, 15,000 vehicles per day for medium-volume, and less than 15,000 for low-volume. Following an initial review of the results, local knowledge of commuter routes and daily traffic patterns were used to finalize the classification.
5. All the criteria were then aggregated and summarized at the grid cell level. a. For the built environment criteria, the average net residential and commercial
density and the land use mix was calculated for each cell. b. For the traffic exposure criteria, a 25-metre buffer was generated for the road
network to operationalize the analysis. The rationale of a 25-meter buffer was to reflect the short driving distance that a vehicle would need to travel to access a Level 3 charging station from the network. Grid cells that fell within the 25-metre buffer were then intersected and joined with the traffic exposure layer and assigned a score. Cells received a score of “0” if there were no roadways; “1” for

Capital Region Local Government EV + E-Bike Infrastructure Backgrounder
| 38
low-volume roadways; “2” for medium-volume roadways; and “3” for high-volume roadways.
6. Each quantitative criteria was normalized from 0 to 1 to create comparable measures before calculating the composite index.
7. Weights were developed to evaluate EV charging station suitability separately for Level 2 and Level 3 charging stations. The weights were informed by the literature and assigned to each criteria based on their relative suitability for a Level 2 versus a Level 3 charging station (see Table 11). A weight of 60% was assigned to high, 30% to medium, and 10% to low for a total of 100%.
8. The composite index was calculated by summing the criteria together. The equations for the Level 2 and 3 composite index took the following forms: Level 2 Suitability = (0.6 · Residential Density) + (0.6 · Commercial Density) + (0.3 · Land Use Mix) · (0.1 · Traffic Exposure)
Level 3 Suitability = (0.1 · Residential Density) + (0.3 · Commercial Density) + (0.3 · Land Use Mix) · (0.6 · Traffic Exposure)
9. Based on the results of the composite index, a hot spot analysis was conducted to
generate the final Level 2 and Level 3 suitability maps. The hot spot analysis identifies statistically significant spatial clusters of high values (hot spots, i.e., areas where EV charging demand would be high) and clusters of low values (cold spots, i.e., areas where EV charging demand would be low).
Qualitative criteria were not included in the composite index as a reliable scoring and weighing system could not be developed for the purposes of the analysis. Instead, they were used to help inform and prioritize one hotspot location over another by identifying “opportunity sites” that were ideal for an EV charging station based on the research and literature.

Capital Region Local Government EV + E-Bike Infrastructure Backgrounder
| 39
Table 11. Summary of Weighting by Criteria
Type Theme Criteria Weighting
Level 2 Level 3
Quan
titati
ve
Built Environment
Residential Density High Low
Commercial Density High Medium
Land Use Mix Medium Medium
Transportation Traffic Exposure Low High
Quali
tativ
e
Transportation
Existing EV Charging Station Locations
N/A Park and Ride Facilities
Public Parking Facilities
Built Environment Institutional Buildings
Parks and Playing Fields
7.3 Results All of the mapping results are presented in Appendix B. The mapping results have been organized by four distinct geographic areas, as follows:
1. Capital Region, which includes all 13 municipalities and three electoral areas;
2. Core Area, which includes the City of Victoria, District of Saanich, District of Oak Bay, Township of Esquimalt, and Town of View Royal;
3. West Shore, which includes the City of Colwood, City of Langford, District of Metchosin, District of Highlands, and District of Sooke; and
4. Peninsula, which includes the District of Central Saanich, District of North Saanich, and Town of Sidney.
At a regional scale, the priority locations were ranked and identified for both Level 2 and Level 3 charging stations across geographic areas, shown in detail in Appendix B. The Infrastructure Planning Guide will provide recommendations for future charging infrastructure across the region.

Capital Region Local Government EV + E-Bike Infrastructure Backgrounder
| 40
8.0 Public + Development Industry Engagement The project team conducted two online surveys over the months of June and July 2018—one directed at the general public and the other to the development / building industry. The public survey was focused on perceived barriers and opportunities around EV and E-Bike ownership as well identifying how best EV charging opportunities could be facilitated in the Capital Region.
The developer / industry survey was focused exclusively on EVs and was intended to [a] understand existing developer uptake in EV charging infrastructure in new buildings, [b] collect feedback on the barriers facing developers / builders to make their buildings EV-ready, and [c] gather feedback and support for municipal policies and actions that could be adopted to advance EV charging infrastructure in new development. All of the survey results are presented in Appendix C and Appendix D.
The follow section provides a discussion of the key findings from the surveys.
8.1 Public Survey High-Level Findings Detailed findings from the survey are presented in the following sections. Below is a high-level summary of the respondents. This survey contained 24 questions. The survey was open from June 12, 2018 to July 8, 2018. Note, the analysis of results includes both completed and partially completed surveys, which, when combined, provide a larger overall sample. Responses in partially completed surveys still represent valid data when analyzed in isolation.
High-level findings are as follows:
• There was a total of 592 completed surveys.
• There was a total of 110 partially completed surveys.
• Survey responses were received from all parts of the Capital Region along with the Southern Gulf Islands, Salt Spring Island and Juan de Fuca Electoral Areas. Those living in the District of Saanich, City of Victoria, and District of Sooke represented the highest number of survey respondents at 28%, 26%, and 8%, respectively.
Capital Region Local Government EV + E-Bike Infrastructure Backgrounder
| 41
• The majority of survey respondents live in a single family home (64%), followed by multi-family building (17%).
• About 40% of the respondents own two vehicles, followed by 37% who own one vehicle. A total of 7% of respondents do not own a vehicle.
• The 30-39 age group represented the largest age cohort (24%), followed by 40-49 (22%) and 60-69 (21%).
• The majority of survey respondents fall in the $100,000-$150,000 household income bracket (24%), followed by $80,000-$100,000 (15%), indicating that survey respondents were generally from higher income households. 11 percent of respondents were in the under $40,000 income bracket, while 26 percent fell between the $40,000-$80,000 range.
Electric Vehicles EV Ownership Trends + Motivations The public survey asked respondents to indicate the type of vehicle they currently own. Of the 702 respondents, 186 indicated battery electric vehicle, representing about 27% of all responses. The majority selected “gasoline” at 76%, with only a few selecting plug-in hybrid electric vehicle (2%). For those who do not own an EV but are interested in buying one, the majority of respondents indicated that they would buy one in the next 5+ years (21%) while 17% were unsure or do not know at this time.
For those who own an EV or are considering one in the future, the vast majority of respondents selected “reduce personal impact on the environment” as the top reason for doing so. This represented 78% of the responses, followed by “realize financial savings” (60%), and “battery range has improved” (56%).
These motivating factors are useful for understanding the EV market and what factors matter most to consumers and prospective EV owners locally. An EV’s ability to reduce one’s impact on the environment was a common theme in the question asking respondents to identify the benefits—or potential benefits—of owning an electric vehicle. Barriers to EV Ownership As discussed in the previous section, there are a number of barriers facing both existing and prospective EV owners. As such, a question was included in the public survey to understand local barriers in the Capital Region and corroborate what was identified in the literature. The close-ended question specifically targeted those who do not own an EV or plan on buying one. However,
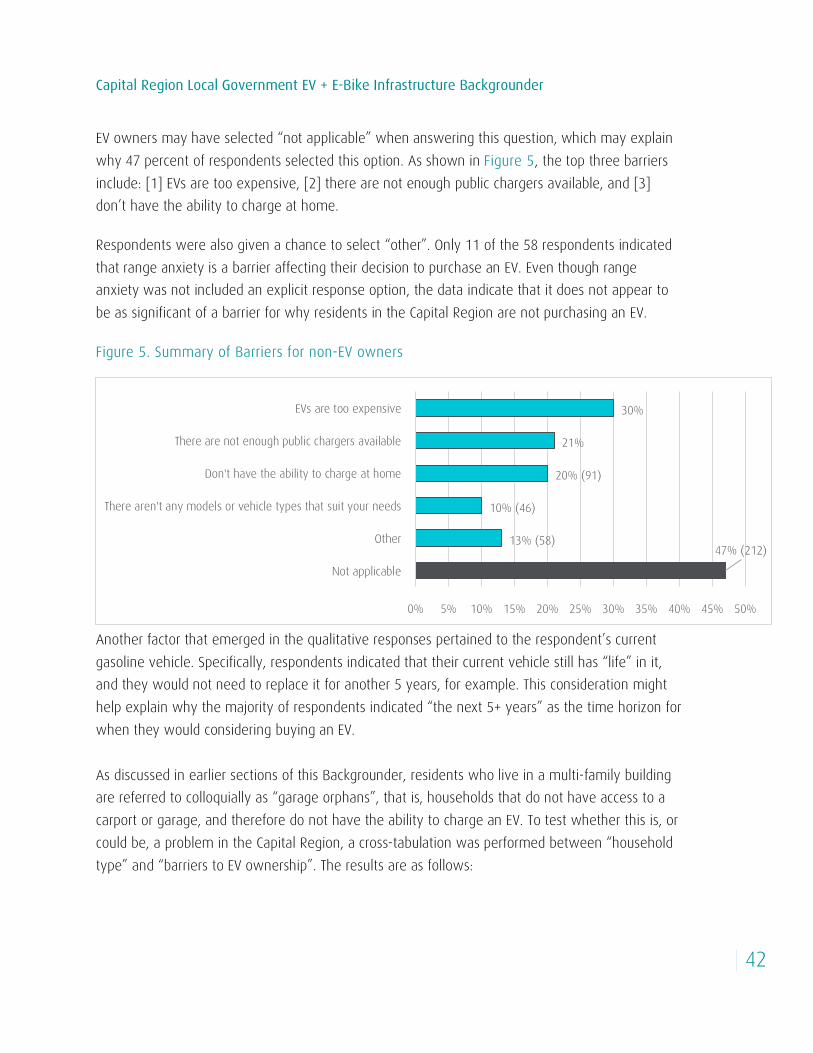
Capital Region Local Government EV + E-Bike Infrastructure Backgrounder
| 42
EV owners may have selected “not applicable” when answering this question, which may explain why 47 percent of respondents selected this option. As shown in Figure 5, the top three barriers include: [1] EVs are too expensive, [2] there are not enough public chargers available, and [3] don’t have the ability to charge at home.
Respondents were also given a chance to select “other”. Only 11 of the 58 respondents indicated that range anxiety is a barrier affecting their decision to purchase an EV. Even though range anxiety was not included an explicit response option, the data indicate that it does not appear to be as significant of a barrier for why residents in the Capital Region are not purchasing an EV.
Figure 5. Summary of Barriers for non-EV owners
Another factor that emerged in the qualitative responses pertained to the respondent’s current gasoline vehicle. Specifically, respondents indicated that their current vehicle still has “life” in it, and they would not need to replace it for another 5 years, for example. This consideration might help explain why the majority of respondents indicated “the next 5+ years” as the time horizon for when they would considering buying an EV. As discussed in earlier sections of this Backgrounder, residents who live in a multi-family building are referred to colloquially as “garage orphans”, that is, households that do not have access to a carport or garage, and therefore do not have the ability to charge an EV. To test whether this is, or could be, a problem in the Capital Region, a cross-tabulation was performed between “household type” and “barriers to EV ownership”. The results are as follows:
47% (212)13% (58)
10% (46)
20% (91)
21%
30%
0% 5% 10% 15% 20% 25% 30% 35% 40% 45% 50%
Not applicable
Other
There aren't any models or vehicle types that suit your needs
Don't have the ability to charge at home
There are not enough public chargers available
EVs are too expensive

Capital Region Local Government EV + E-Bike Infrastructure Backgrounder
| 43
• The results indicate that for those living in a multi-family building, the largest barrier to EV ownership is “don’t have the ability to charge at home”, which represented 40 of 146 responses (27%).
• This was higher than all of the other household types including single detached home, where only 8% selected “don’t have the ability to charge at home”.
• Analyzed differently, the option “don’t have the ability to charge at home” was selected 91 times, of which 40 represented respondents who live in a multi-family home, which represents 43% of the total.
These results, while not causal, generally confirm that those living in multi-family buildings in the Capital Region are at a disadvantage due to the lack of ability to charge an EV at home.
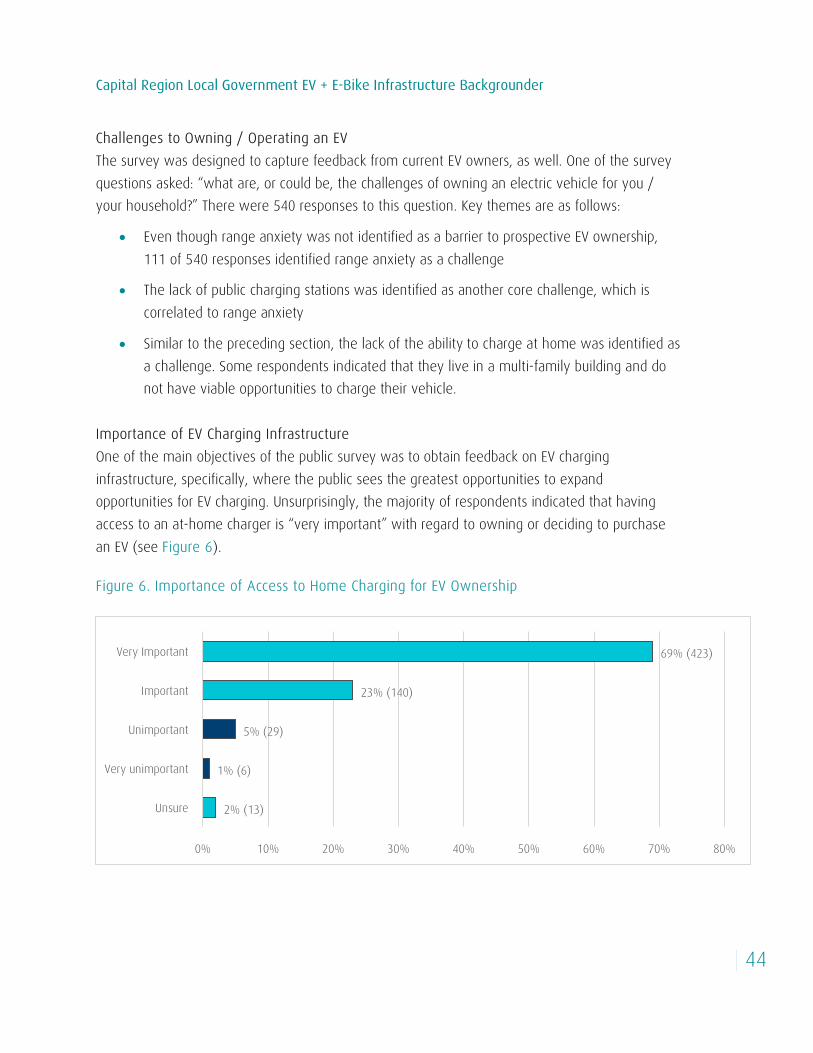
Capital Region Local Government EV + E-Bike Infrastructure Backgrounder
| 44
Challenges to Owning / Operating an EV The survey was designed to capture feedback from current EV owners, as well. One of the survey questions asked: “what are, or could be, the challenges of owning an electric vehicle for you / your household?” There were 540 responses to this question. Key themes are as follows:
• Even though range anxiety was not identified as a barrier to prospective EV ownership, 111 of 540 responses identified range anxiety as a challenge
• The lack of public charging stations was identified as another core challenge, which is correlated to range anxiety
• Similar to the preceding section, the lack of the ability to charge at home was identified as a challenge. Some respondents indicated that they live in a multi-family building and do not have viable opportunities to charge their vehicle.
Importance of EV Charging Infrastructure One of the main objectives of the public survey was to obtain feedback on EV charging infrastructure, specifically, where the public sees the greatest opportunities to expand opportunities for EV charging. Unsurprisingly, the majority of respondents indicated that having access to an at-home charger is “very important” with regard to owning or deciding to purchase an EV (see Figure 6).
Figure 6. Importance of Access to Home Charging for EV Ownership
2% (13)
1% (6)
5% (29)
23% (140)
69% (423)
0% 10% 20% 30% 40% 50% 60% 70% 80%
Unsure
Very unimportant
Unimportant
Important
Very Important
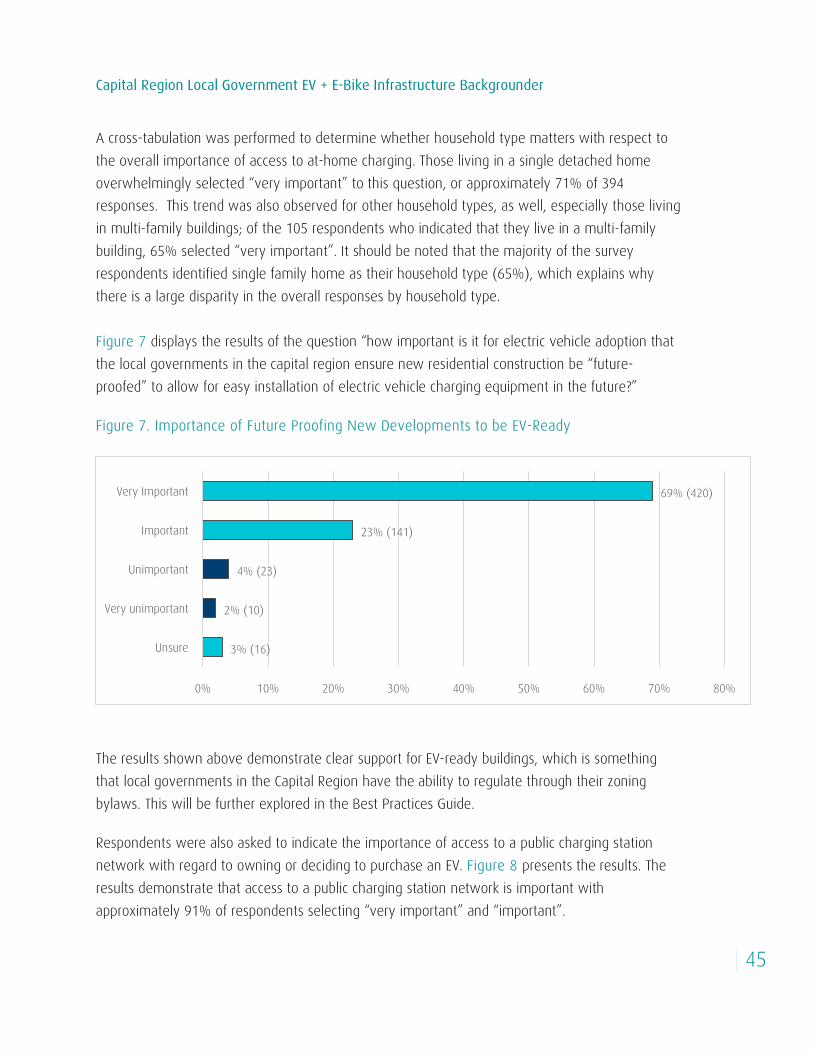
Capital Region Local Government EV + E-Bike Infrastructure Backgrounder
| 45
A cross-tabulation was performed to determine whether household type matters with respect to the overall importance of access to at-home charging. Those living in a single detached home overwhelmingly selected “very important” to this question, or approximately 71% of 394 responses. This trend was also observed for other household types, as well, especially those living in multi-family buildings; of the 105 respondents who indicated that they live in a multi-family building, 65% selected “very important”. It should be noted that the majority of the survey respondents identified single family home as their household type (65%), which explains why there is a large disparity in the overall responses by household type. Figure 7 displays the results of the question “how important is it for electric vehicle adoption that the local governments in the capital region ensure new residential construction be “future-proofed” to allow for easy installation of electric vehicle charging equipment in the future?”
Figure 7. Importance of Future Proofing New Developments to be EV-Ready
The results shown above demonstrate clear support for EV-ready buildings, which is something that local governments in the Capital Region have the ability to regulate through their zoning bylaws. This will be further explored in the Best Practices Guide.
Respondents were also asked to indicate the importance of access to a public charging station network with regard to owning or deciding to purchase an EV. Figure 8 presents the results. The results demonstrate that access to a public charging station network is important with approximately 91% of respondents selecting “very important” and “important”.
3% (16)
2% (10)
4% (23)
23% (141)
69% (420)
0% 10% 20% 30% 40% 50% 60% 70% 80%
Unsure
Very unimportant
Unimportant
Important
Very Important

Capital Region Local Government EV + E-Bike Infrastructure Backgrounder
| 46
Figure 8. Importance of Access to a Public Charging Station Network for EV Ownership
Related to having access to a public charging network is the question of whether there should be a fee in place to charge one’s vehicle. This was included as a survey question and framed as good practice for reducing congestion for other EV users and for helping offset maintenance and operating cost, as discussed in Section 5.2. 21% of respondents selected “$1.00 per hour” as a reasonable fee for public charging, which would represent a logical transition for EV users who do not currently pay a fee for public charging except in Esquimalt.
Other respondents however, indicated that $1.50-$2.50 per hour is reasonable (~25% of respondents). Open-ended responses to this question included everything from public charging stations should be free, to higher willingness to pay for a Level 3 station, to not charging per hour but by time or use. This topic will be further explored in the Infrastructure Planning Guide. Finally, respondents were also asked to indicate the importance of having access to at-work charging. Unlike access to at-home charging or future proofing new developments, results were mixed on the importance of at-work charging:
• 33% selected “very important” • 39% selected “important” • 19% selected “unimportant”
3% (15)
2% (12)
5% (27)
40% (242)
51% (310)
0% 10% 20% 30% 40% 50% 60%
Unsure
Very unimportant
Unimportant
Important
Very Important

Capital Region Local Government EV + E-Bike Infrastructure Backgrounder
| 47
Siting Public EV Charging Stations As part of developing the methodology for the infrastructure gap analysis and informing the siting criteria, questions were included in the survey to provide respondents the opportunity to rank the importance of seven public charging station locations. The following were listed:
• Major roads and highways • Community centres • Libraries • Parks • Downtown areas • On-street • Public parkades
The questions were designed to differentiate between Level 2 and Level 3 (DCFC) charging stations. Results for the Level 2 locations are as follows:
• Public parkades ranked highest with 32% of the total responses ranked “1”, and 23% of the total responses ranked “2”.
• Major roads and highways received 25% of the total responses ranked “1”, but it also received 27% of the responses ranked “7”, indicating that respondents view major roads and highways as both important and unimportant locations for Level 2 chargers.
• Community centres received the 18% of the total responses ranked “2”, which was the highest after public parkades.
• Downtown areas received an almost equal distribution of being ranked 1, 2, and 3, which indicates public support for these locations.
Results for the Level 3 (DCFC) locations are as follows:
• Major roads and highways was overwhelming ranked as “1”, with approximately 65% of the total responses.
• Public parkades was also ranked high, representing 26% of the total responses ranked “2”
• Both on-street and downtown areas received the highest share of second and third rankings. While they were not ranked first, they are clearly important locations for Level 3 chargers in the view of the public.
A follow-up open-ended question asked respondents to list other locations that are or could be important for hosting an EV charging station. A common response was “shopping malls”, which

Capital Region Local Government EV + E-Bike Infrastructure Backgrounder
| 48
was mentioned in 72 responses—or 20% of the total. Results indicate is that public parkades are the most important locations for Level 2 stations whereas major roads / highways are the most important for Level 3 stations. E-Bikes The survey included seven questions on E-Bikes ranging from general ownership, to interest in purchasing an E-Bike, and barriers for existing and prospective E-Bike users. Results of the key findings are presented below.
General findings are summarized as follows:
• Overall, only 16% of 599 respondents own an E-Bike
• About 22% of 586 respondents are planning to purchase an E-Bike in the next two to three years compared to 48% who are not planning to at all
• Respondents are generally familiar with E-Bikes; 54% have seen them on the streets; 35% have spoken to an owner of one; and 30% have done research or looked for information about an E-Bike.
Similar to EVs, both current and prospective E-Bike owners face a number of barriers / challenges. A summary of the main barriers identified in the literature was provided in Section 6.2, which are generally consistent with what was found in the survey. See Figure 9 for a summary of the barriers. Figure 9. Summary of Barriers to E-Bike Ownership
22% (117)
21% (110)
15% (78)
15% (81)
19% (101)
20% (104)
22% (116)
27% (144)
37% (196)
0% 5% 10% 15% 20% 25% 30% 35% 40%
Not applicable
Other
Lack of private places to charge an E-Bike
Lack of places to park an E-Bike
Concerned about achieving less exercise
Lack of public places to charge an E-Bike
Concerned about safety
Afraid that it might be stolen
Too expensive

Capital Region Local Government EV + E-Bike Infrastructure Backgrounder
| 49
Respondents could select all answers that applied, reflected in percentages above The results indicate that price (i.e., too expensive) is the top barrier to E-Bike ownership, followed by “afraid it might be stolen”, and “concerned about safety”. Other barriers such as “lack of places to park an E-Bike” and “concerned about less exercise” were also selected, which have been found in the literature, as well. About 20% of respondents selected “lack of public places to charge an E-Bike” as a barrier, which to the best of the project team’s knowledge, has not been identified in the literature.
For those who selected “other”, common responses included [a] concerns about weather and [b] people’s preference for a regular bicycle.
In response to the open-ended question “would you feel safe riding an E-Bike around the capital region?” the majority of respondents said yes; however, for those who wrote “no”, many indicated that the bike infrastructure is not yet in place for them to feel safe.
The final question in the E-Bike section of the survey asked respondents if they would feel comfortable parking their E-Bike in a publicly accessible location. The responses were mixed on this question; a third of the 509 respondents checked “yes”, a third checked “no”, and the final third checked “don’t know, unsure at this time”. A follow-up open-ended question asked “what would make you feel comfortable parking your E-Bike in a publicly accessible location”; common responses included:
• Locked or supervised area • A secure designated E-Bike parking facility • Surveillance cameras • A paid parking facility for E-Bikers users
8.2 Development / Building Industry Survey This survey contained 13 questions. This section provides a high-level summary of the findings, which included 41 completed submissions and 22 partially completed ones. The survey was open from June 20, 2018 to July 26, 2018. The first few questions of the survey asked the respondents to identify where they work in the region (multiple responses permitted), their role in the industry, and the types of buildings they construct. Findings are as follows:

Capital Region Local Government EV + E-Bike Infrastructure Backgrounder
| 50
• The City of Victoria, District of Saanich, Township of Esquimalt, and City of Langford represented the most popular municipalities where respondents have building projects at 72%, 53%, and 34%, respectively (tied between Esquimalt and Langford)
• The majority of respondents are property owners / developers (50%), followed by design professionals (30%), and “other” (25%)
• The most common types of buildings that are constructed among respondents include large residential (61%) and small residential (52%) with small scale and large scale commercial at 33% and 28%, respectively.
Experience with EVs Survey respondents were asked to indicate if any of their recent developments have been EV-ready (see Figure 10). While 35% selected “no”, 33% selected “yes, conduit in place and wired for Level 2 charger in the future”. About 15% selected “yes, conduit in place and wired for Level 1 charger in the future”. The installation costs per unit ranged from $300 to $5,000. Figure 10. Degree of EV-Readiness
Respondents were also asked if any EV charging stations have been installed in their recent developments; 60% selected “yes” compared to 40% selecting “no”. The reasons for installing an EV charging station ranged from environmental stewardship, obtaining a LEED credit, marketing to prospective tenants / owners, and consumer demand. For those who have installed an EV charging station, the majority (79%) installed a Level 2 charger with costs ranging from $1,000 to $5000 per station.
35% (17)
2% (1)
15% (7)
15% (7)
33% (16)
0% 5% 10% 15% 20% 25% 30% 35% 40%
No
Other
Both
Yes, conduit in place and wired for Level 1 charger in…
Yes, conduit in place and wired for Level 2 charger in…
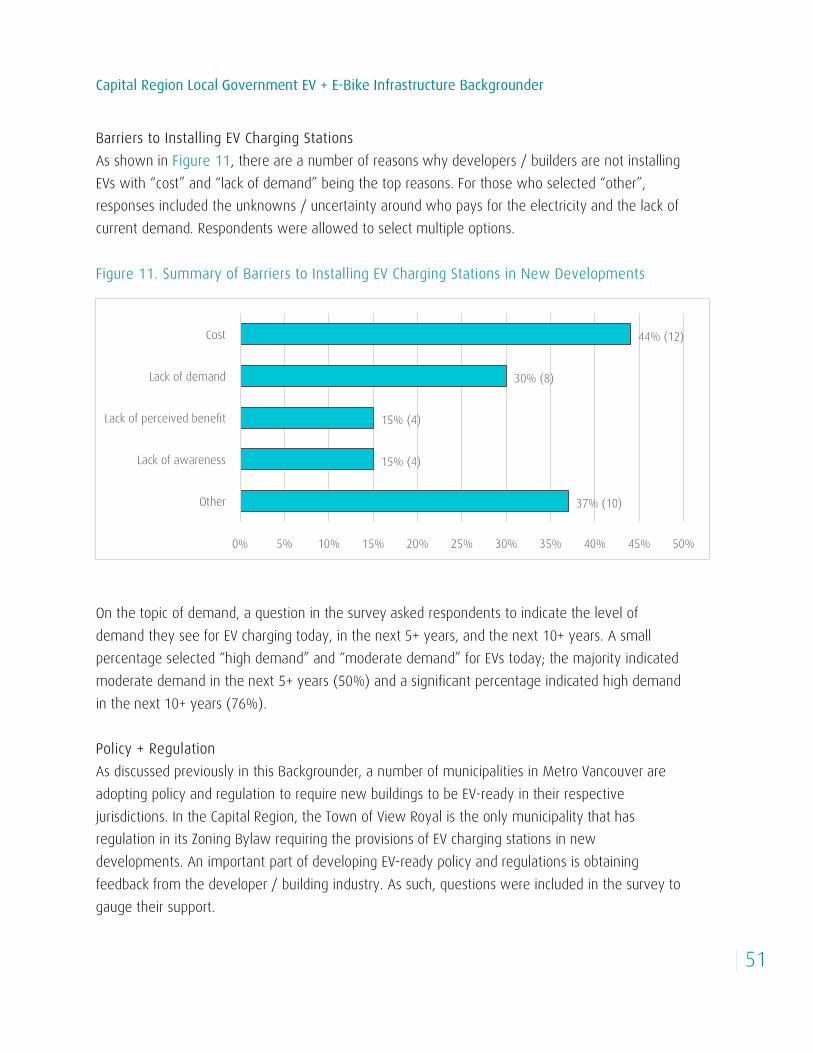
Capital Region Local Government EV + E-Bike Infrastructure Backgrounder
| 51
Barriers to Installing EV Charging Stations As shown in Figure 11, there are a number of reasons why developers / builders are not installing EVs with “cost” and “lack of demand” being the top reasons. For those who selected “other”, responses included the unknowns / uncertainty around who pays for the electricity and the lack of current demand. Respondents were allowed to select multiple options. Figure 11. Summary of Barriers to Installing EV Charging Stations in New Developments
On the topic of demand, a question in the survey asked respondents to indicate the level of demand they see for EV charging today, in the next 5+ years, and the next 10+ years. A small percentage selected “high demand” and “moderate demand” for EVs today; the majority indicated moderate demand in the next 5+ years (50%) and a significant percentage indicated high demand in the next 10+ years (76%). Policy + Regulation As discussed previously in this Backgrounder, a number of municipalities in Metro Vancouver are adopting policy and regulation to require new buildings to be EV-ready in their respective jurisdictions. In the Capital Region, the Town of View Royal is the only municipality that has regulation in its Zoning Bylaw requiring the provisions of EV charging stations in new developments. An important part of developing EV-ready policy and regulations is obtaining feedback from the developer / building industry. As such, questions were included in the survey to gauge their support.
37% (10)
15% (4)
15% (4)
30% (8)
44% (12)
0% 5% 10% 15% 20% 25% 30% 35% 40% 45% 50%
Other
Lack of awareness
Lack of perceived benefit
Lack of demand
Cost

Capital Region Local Government EV + E-Bike Infrastructure Backgrounder
| 52
As shown in Figure 12, most of the survey respondents (41%) strongly support local governments in the Capital Region requiring new developments to be EV-ready. Figure 12. Level of Support for EV-ready Regulations in the Capital Region
hile there is strong support for EV-ready policy and regulation, survey respondents also expressed their opposition and concerns, summarized as follows:
• Concerns over increased costs to developers, leading to increased housing costs • The market should decide based on consumer demand • General opposition to governments regulating this area
Respondents were also asked to comment on EV-ready bylaws, specifically whether they like the approach municipalities are taking in Metro Vancouver with requiring 100% of multi-unit residential parking stalls to be ‘EV-ready’ for Level 2 charging. About half of the 33 respondents indicated that they like the approach but the other half cited concerns ranging from the requirement being too high, to potential complications with strata councils, and how the market should dictate what is appropriate.
Finally, respondents were asked to respond to the question “how can local governments support electric vehicle charging infrastructure in new developments?” Results are shown in Figure 13. As the graph shows, both “development incentives” and “financial incentives” are the top actions that should be adopted to support EV charging in new developments.
7% (3)
12% (5)
12% (5)
27% (11)
41% (17)
0% 5% 10% 15% 20% 25% 30% 35% 40% 45%
Stronglyoppose
Oppose
Neutral
Support
Stronglysupport
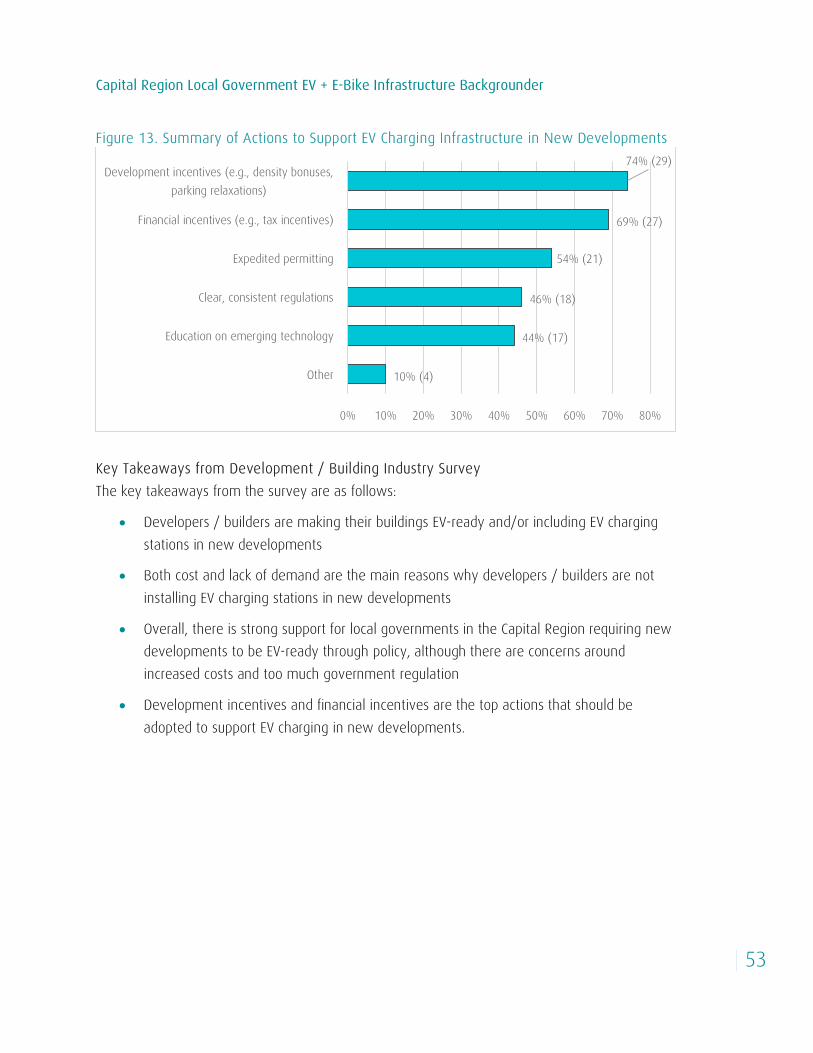
Capital Region Local Government EV + E-Bike Infrastructure Backgrounder
| 53
Figure 13. Summary of Actions to Support EV Charging Infrastructure in New Developments
Key Takeaways from Development / Building Industry Survey The key takeaways from the survey are as follows:
• Developers / builders are making their buildings EV-ready and/or including EV charging stations in new developments
• Both cost and lack of demand are the main reasons why developers / builders are not installing EV charging stations in new developments
• Overall, there is strong support for local governments in the Capital Region requiring new developments to be EV-ready through policy, although there are concerns around increased costs and too much government regulation
• Development incentives and financial incentives are the top actions that should be adopted to support EV charging in new developments.
10% (4)
44% (17)
46% (18)
54% (21)
69% (27)
74% (29)
0% 10% 20% 30% 40% 50% 60% 70% 80%
Other
Education on emerging technology
Clear, consistent regulations
Expedited permitting
Financial incentives (e.g., tax incentives)
Development incentives (e.g., density bonuses,parking relaxations)
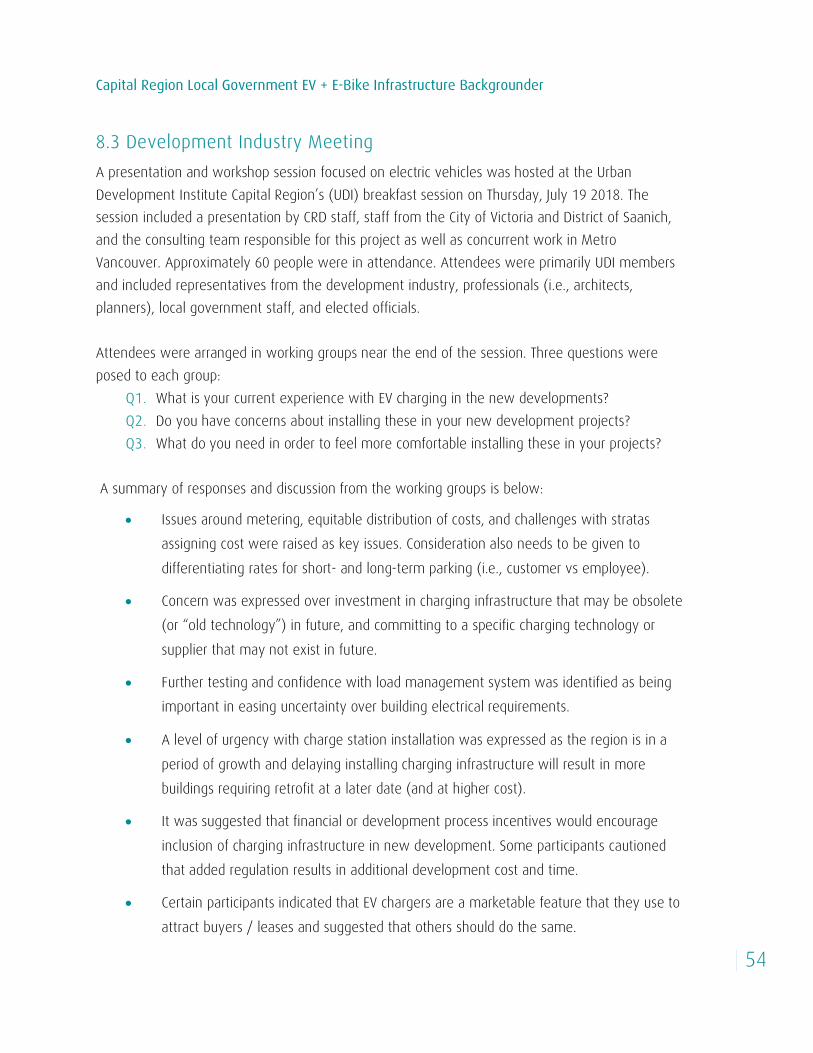
Capital Region Local Government EV + E-Bike Infrastructure Backgrounder
| 54
8.3 Development Industry Meeting A presentation and workshop session focused on electric vehicles was hosted at the Urban Development Institute Capital Region’s (UDI) breakfast session on Thursday, July 19 2018. The session included a presentation by CRD staff, staff from the City of Victoria and District of Saanich, and the consulting team responsible for this project as well as concurrent work in Metro Vancouver. Approximately 60 people were in attendance. Attendees were primarily UDI members and included representatives from the development industry, professionals (i.e., architects, planners), local government staff, and elected officials. Attendees were arranged in working groups near the end of the session. Three questions were posed to each group:
Q1. What is your current experience with EV charging in the new developments? Q2. Do you have concerns about installing these in your new development projects? Q3. What do you need in order to feel more comfortable installing these in your projects?
A summary of responses and discussion from the working groups is below:
• Issues around metering, equitable distribution of costs, and challenges with stratas assigning cost were raised as key issues. Consideration also needs to be given to differentiating rates for short- and long-term parking (i.e., customer vs employee).
• Concern was expressed over investment in charging infrastructure that may be obsolete (or “old technology”) in future, and committing to a specific charging technology or supplier that may not exist in future.
• Further testing and confidence with load management system was identified as being important in easing uncertainty over building electrical requirements.
• A level of urgency with charge station installation was expressed as the region is in a period of growth and delaying installing charging infrastructure will result in more buildings requiring retrofit at a later date (and at higher cost).
• It was suggested that financial or development process incentives would encourage inclusion of charging infrastructure in new development. Some participants cautioned that added regulation results in additional development cost and time.
• Certain participants indicated that EV chargers are a marketable feature that they use to attract buyers / leases and suggested that others should do the same.

Capital Region Local Government EV + E-Bike Infrastructure Backgrounder
| 55
• The group indicated support for this initiative and the guidance / certainty it will provide on concerns such as development cost implications, technology options, and infrastructure suppliers.
• Widespread use of electric vehicles will not address issues of single-occupant vehicle use and suburban “sprawl”-type land development.
• The group reiterated the value of the session and the timeliness of this information being presented as land developers consider install EV chargers and municipalities look to enact bylaws to require them.
• A desire was expressed for the UDI to establish a working group to guide work on this from the development industry.
• A desire was also expressed for a reference guide for the detailed installation of charging stations to streamline electrical design work.

Capital Region Local Government EV + E-Bike Infrastructure Backgrounder
References
1 PlugIn BC. (2018). Electric Vehicles Available in BC. Available online at: https://pluginbc.ca/wp/wp-content/uploads/2018/05/Electric-Car-Handout-8.5x14_180515.pdf
2 Hall, D., & Lutsey, N. (2017). Emerging Best Practices for Electric Vehicle Charging Infrastructure. The International Council on Clean Transportation. Available online at: https://www.theicct.org/sites/default/files/publications/EV-charging-best-practices_ICCT-white-paper_04102017_vF.pdf
3 Ibid.
4 PlugIn BC. (2018). Charging Station Equipment. Available online at: https://pluginbc.ca/incentives/manuf_list/
5 AES Engineering Ltd. (2017). Electric Vehicle Charging Infrastructure in New Multifamily Developments – Requirement Options and Costing Analysis. Available online at: http://udi.bc.ca/wp-content/uploads/2017/06/Final-Report-r004-EV-Requirements-20170404.pdf
6 PlugIn BC. (2016). What is load management? Available online at: https://pluginbc.ca/faq/what-is-load-management/
7 PlugIn BC. (No date). Charging Station Equipment. Available online at: https://pluginbc.ca/incentives/manuf_list/
8 NewMotion. (2018). Dynamic Load Balancing: Get Ready for the Future. Available online at: https://newmotion.com/en/products/services-for-business/dynamic-loading-balancing
9 UDI. (2017). City of Richmond: Electric Vehicle (EV) Charging Infrastructure. Available online at: http://udi.bc.ca/city-richmond-electric-vehicle-ev-charging-infrastructure/
10 Data provided by Plug In BC Program Manager on July 17, 2018.
11 Insurance Corporation of British Columbia. (2018). Electric Bikes. Retrieved from: http://www.icbc.com/vehicle-registration/specialty-vehicles/Low-powered-vehicles/Pages/Electric-bikes.aspx
12 Fyhri, A & N Fearnley. (2015). Effects of e-bikes on bicycle use and mode share. Transportation Research Part D: Transport and Environment. 36, 45-52.
13 Graphic courtesy of Norbert Haller.
14 Schmidt, E. (2018). Electric Vehicle Sales Update Q1 2018, Canada. fleetcarma. Available online at: https://www.fleetcarma.com/electric-vehicles-sales-update-q1-2018-canada/
15 Schmidt, E. (2018). Electric Vehicle Sales in Canada. fleetcarma. Available online at: https://www.fleetcarma.com/electric-vehicle-sales-canada-2017/
16 Schmidt, E. (2018). Electric Vehicle Sales Update Q1 2018, Canada. fleetcarma. Available online at: https://www.fleetcarma.com/electric-vehicles-sales-update-q1-2018-canada/
17 Schmidt, E. (2018). Electric Vehicle Sales Update Q1 2018, Canada. fleetcarma. Available online at: https://www.fleetcarma.com/electric-vehicles-sales-update-q1-2018-canada/

Capital Region Local Government EV + E-Bike Infrastructure Backgrounder
18 Statistics Canada. (2018). New motor vehicle sales. Available online at:
https://www150.statcan.gc.ca/t1/tbl1/en/tv.action?pid=2010000101&pickMembers%5B0%5D=1.7&pickMembers%5B1%5D=2.2&pickMembers%5B2%5D=3.1&pickMembers%5B3%5D=5.1
19 Ibid. 20 Malatest. (2017). 2017 Capital Regional District Origin Destination Household Travel Survey. Available online at:
https://www.crd.bc.ca/docs/default-source/regional-planning-pdf/transportation/crd-2017-od-survey-report-20180622-sm.pdf?sfvrsn=4fcbe7ca_2
21 MacArthur, J., Harpool, M., & D. Scheppke. (2018). A North American Survey of Electric Bicycle Owners. National Institute for Transportation and Communities, NITC-RR-1041.
22 District of Saanich. (2018). Electric Vehicles and Vehicle Charging Stations. Available online at: http://www.saanich.ca/EN/main/community/sustainable-saanich/climate-change-energy/programs-rebates/electric-vehicle-charging-stations.html
23 Phone conversation with City of Surrey Manager of Parking Services on June 15, 2018
24 City of Burnaby. (2018). Electric Vehicles in Burnaby. Available online at: https://www.burnaby.ca/City-Services/Policies--Projects---Initiatives/Environment/Environmental-Sustainability-Strategy/ESS-and-CEEP-In-Action/Electric-Vehicles-in-Burnaby.html
25 Ibid.
26 http://bylaws.vancouver.ca/parking/sec06.pdf
27 BCUC. (No date). Electric Vehicle (EV) Charging Service Inquiry – FAQ. Available online at: http://www.bcuc.com/Documents/Proceedings/2018/DOC_50755_02-08-2018_BCUC-EV-Charging-FAQ.pdf
28 Gioventu, T. (2018). Condo Smarts: Making room for electric vehicles. The Province. Available online at: https://theprovince.com/life/homes/condo-smarts-making-room-for-electric-vehicles
29 BCUC. (2018). Electric Vehicle Charging in Stratas. BCUC Regulation of Electric Vehicle Charging Service Inquiry. Available online at: http://www.bcuc.com/Documents/Proceedings/2018/DOC_51112_C32-2_Mackenzie_Written-Evidence.pdf
30 Lutsey, N., Searle., Chambliss, S., Bandivadekar, A. (2015). Assessment of Leading Electric Vehicle Promotion Activities in United States Cities. Available online at: http://www.theicct.org/leading-us-city-electric-vehicle-activities
31 ChargeHub. (2018). Charge your EV in Victoria. Available online at: https://chargehub.com/en/countries/canada/british-columbia/victoria.html?city_id=377
32 Phone conversation with City of Montreal Director of Urbanism on April 26, 2017
33 Phone conversation with City of Montreal Director of Urbanism on June 20, 2018.
34 Email correspondence with Capital Regional District Climate Action Program Coordinator on July 12, 2018.
35 Portland State University. (No date). Electric Avenue: Plug In. Charge Up. Drive On. Available online at: https://www.pdx.edu/sites/www.pdx.edu.electricavenue/files/electric_avenue_faq.pdf
36 World Trade Center Portland. (2018). Plug in, Charge up, Drive on: Electric Avenue. Available online at: http://wtcportland.com/electricavenue/
37 Phone conversation with City of Portland Policy & Research Analyst on April 17, 2017.

Capital Region Local Government EV + E-Bike Infrastructure Backgrounder
38 Phone conversation with Plug In BC Program Manager on August 28, 2018.
39 Phone conversation with City of Montreal Director of Urbanism on April 26, 2017.
40 Township of Esquimalt. (2018). Electric Vehicle Charging. Available online at: https://www.esquimalt.ca/municipal-hall/sustainability-environment/electric-vehicle-charging
41 Ibid.
42 Government of Quebec. (2018). Public Charging Stations. Available online at: http://vehiculeselectriques.gouv.qc.ca/english/particuliers/recharge-publics.asp
43 Plug in BC. (2017). City of Vancouver Approves Fees at EV Charging Stations. Available online at: https://pluginbc.ca/vancouver-approves-ev-charging/
44 Washington State Department of Transportation. (2015). Washington State Electric Vehicle Action Plan 2015-2020. Available online at: http://www.wsdot.wa.gov/NR/rdonlyres/28559EF4-CD9D-4CFA-9886-105A30FD58C4/0/WAEVActionPlan2014.pdf
45 Needell et al. (2016). Potential for widespread electrification of personal vehicle travel in the United States. Nature Energy, 16112, 1-7.
46 McKinsey & Company. (2017). Electrifying insights: How automakers can drive electrified vehicle sales and profitability. Available online at: https://www.mckinsey.de/files/161223_mckinsey_e-vehicles.pdf.
47 BC Hydro. (2018). Unplugged: Myths block road to the electric car dream. Available online at: https://www.bchydro.com/content/dam/BCHydro/customer-portal/documents/news-and-features/Report-unplugged-myths-block-road-to-EV-dream_April%202018.pdf
49 Sierzchula, W, Bakker, S., Maat, K. and van Wee, B. (2014). The influence of financial incentives and other socio-economic factors on electric vehicle adoption. Energy Policy, 68, 183–194.
50 Plug’N Drive. (2017). Driving EV Uptake in the Greater Toronto and Hamilton Area: How Driver Perceptions Shape Vehicle Ownership in the GTHA. Available online at: http://www.plugndrive.ca/wp-content/uploads/2017/07/EV-Survey-Report.pdf
51 Dumortier, J. et al. (2015). Effects of providing total cost of ownership information on consumers’ intent to purchase a hybrid or plug-in electric vehicle. Transportation Research Part A: Policy and Practice 72: 71-86.
52 BC Hydro. (2018). Unplugged: Myths block road to the electric car dream. Available online at: https://www.bchydro.com/content/dam/BCHydro/customer-portal/documents/news-and-features/Report-unplugged-myths-block-road-to-EV-dream_April%202018.pdf
53 The National Academy of Sciences. (2013). Overcoming Barriers to Electric-Vehicle Deployment: Interim Report. Available online at: http://gabrielse.physics.harvard.edu/gabrielse/papers/2013/OvercomingBarriersToElectricVehicleDeployment.pdf
54 Plug’N Drive. (2017). Driving EV Uptake in the Greater Toronto and Hamilton Area: How Driver Perceptions Shape Vehicle Ownership in the GTHA. Available online at: http://www.plugndrive.ca/wp-content/uploads/2017/07/EV-Survey-Report.pdf
55 Singer, M. (2016). Consumer Views on Plug-in Electric Vehicles – National Benchmark Report. National Renewable Energy Laboratory. Available online at: http://www.afdc.energy.gov/uploads/publication/consumer_views_pev_benchmark.pdf
Capital Region Local Government EV + E-Bike Infrastructure Backgrounder
56 Matousek, M. (2018). 30 electric cars you’ll see on the road by 2025. Available online at:
https://www.businessinsider.com/electric-cars-that-will-be-available-by-2025-2018-1 57 Bruce Power, Plug’n Drive and Pollution Probe. (2016). Policy Submission to Pan Canadian Framework on Clean Growth
and Climate Change: Accelerating the Deployment of EVs. Available online at: http://www.pollutionprobe.org/wp-content/uploads/Accelerating-the-Deployment-of-Electric-Vehicles.pdf
58 Plug In BC. (2018). Home & Work Charging. Available online at: https://pluginbc.ca/charging-stations/charging-at-home/
59 US Department of Energy. (2018). Electric Vehicles: Charging at Home. Available online at: https://www.energy.gov/eere/electricvehicles/charging-home
60 Ipsos MORI. (2017). Speed and availability of charging biggest barriers to electric car adoption by 2040. Available online at: https://www.ipsos.com/ipsos-mori/en-uk/speed-and-availability-charging-biggest-barriers-electric-car-adoption-2040
61 The National Academy of Sciences. (2013). Overcoming Barriers to Electric-Vehicle Deployment: Interim Report. Available online at: http://gabrielse.physics.harvard.edu/gabrielse/papers/2013/OvercomingBarriersToElectricVehicleDeployment.pdf
62 Phone conversation with City of Montreal Director of Urbanism on April 26, 2017.
64 Popovich, N., Gordon, E., Shao, Z., Xing, Y., Wang, Y., & Handy, S. (2014). Experiences of electric bicycle users in the Sacramento, California area. Travel Behaviour and Society, 1(2), 37–44.
65 Ibid.
66 MacArthur, J., Harpool, M., & D. Scheppke. (2018). A North American Survey of Electric Bicycle Owners. National Institute for Transportation and Communities, NITC-RR-1041.
67 Fyhri, A, et al. (2017) A push to cycling—exploring the e-bike's role in overcoming barriers to bicycle use with a survey and an intervention study. International Journal of Sustainable Transportation, 11:9, 681-695.
68 Popovich, N., Gordon, E., Shao, Z., Xing, Y., Wang, Y., & Handy, S. (2014). Experiences of electric bicycle users in the Sacramento, California area. Travel Behaviour and Society, 1(2), 37–44.
69 Dill, J., Rose, G. (2012). Electric bikes and transportation policy. Transport. Res. Rec. 2314, 1–6.
71 Popovich, N., Gordon, E., Shao, Z., Xing, Y., Wang, Y., & Handy, S. (2014). Experiences of electric bicycle users in the Sacramento, California area. Travel Behaviour and Society, 1(2), 37–44.
72 Jones, T, et al. (2016). Motives, perceptions and experiences of electric bicycle owners and implications for health, wellbeing and mobility. Journal of Transport Geography. 53, 41-49.
73 Popovich, N., Gordon, E., Shao, Z., Xing, Y., Wang, Y., & Handy, S. (2014). Experiences of electric bicycle users in the Sacramento, California area. Travel Behaviour and Society, 1(2), 37–44
74 McLeod, K. (2015). Electric Bicycles: Public Perceptions & Policy: Results and analysis of a national survey of American bicyclists. Available online at: https://bikeleague.org/sites/default/files/E_bikes_mini_report.pdf
75 Bruce Power, Plug’n Drive and Pollution Probe. (2016). Policy Submission to Pan Canadian Framework on Clean Growth and Climate Change: Accelerating the Deployment of EVs. Available online at: http://www.pollutionprobe.org/wp-content/uploads/Accelerating-the-Deployment-of-Electric-Vehicles.pdf

Capital Region Local Government EV + E-Bike Infrastructure Backgrounder
76 Fraser Basin Council. (2015). A Gap Analysis for BC’s Electric Vehicle Direct Current Fast Charging Network. Available online at: https://pluginbc.ca/wp/wp-content/uploads/2015/10/BC-DCFC-Gap-Analysis-Report-FBC_Aug-2015.pdf 77 Krizek, K.J. (2003). Operationalizing neighborhood accessibility for land use–travel behavior research and regional modelling. Journal of Planning Education and Research, 22: 270–287.

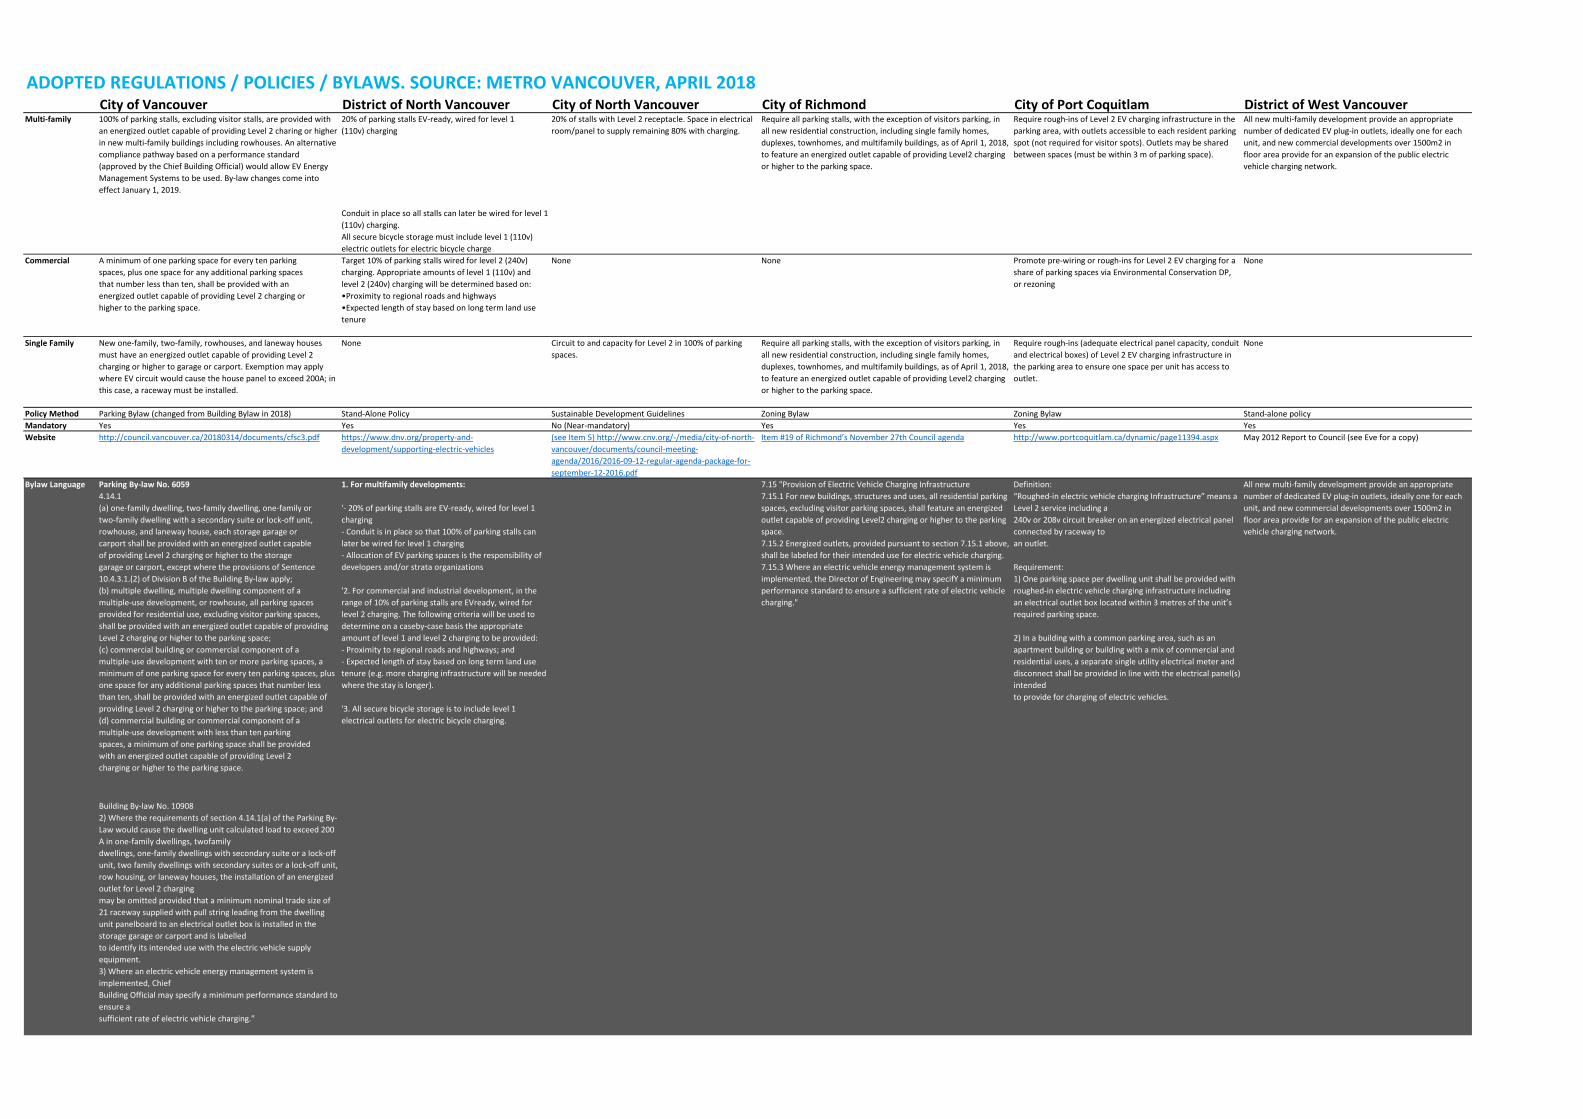
ADOPTED REGULATIONS / POLICIES / BYLAWS. SOURCE: METRO VANCOUVER, APRIL 2018City of Vancouver District of North Vancouver City of North Vancouver City of Richmond City of Port Coquitlam District of West Vancouver
Multi-family 100% of parking stalls, excluding visitor stalls, are provided with an energized outlet capable of providing Level 2 charing or higher in new multi-family buildings including rowhouses. An alternative compliance pathway based on a performance standard (approved by the Chief Building Official) would allow EV Energy Management Systems to be used. By-law changes come into effect January 1, 2019.
20% of parking stalls EV-ready, wired for level 1 (110v) charging
20% of stalls with Level 2 receptacle. Space in electrical room/panel to supply remaining 80% with charging.
Require all parking stalls, with the exception of visitors parking, in all new residential construction, including single family homes, duplexes, townhomes, and multifamily buildings, as of April 1, 2018, to feature an energized outlet capable of providing Level2 charging or higher to the parking space.
All new multi-family development provide an appropriate number of dedicated EV plug-in outlets, ideally one for each unit, and new commercial developments over 1500m2 in floor area provide for an expansion of the public electric vehicle charging network.
Conduit in place so all stalls can later be wired for level 1 (110v) charging.All secure bicycle storage must include level 1 (110v) electric outlets for electric bicycle charge
Commercial A minimum of one parking space for every ten parkingspaces, plus one space for any additional parking spacesthat number less than ten, shall be provided with anenergized outlet capable of providing Level 2 charging orhigher to the parking space.
Target 10% of parking stalls wired for level 2 (240v) charging. Appropriate amounts of level 1 (110v) and level 2 (240v) charging will be determined based on:•Proximity to regional roads and highways•Expected length of stay based on long term land use tenure
None None Promote pre-wiring or rough-ins for Level 2 EV charging for a share of parking spaces via Environmental Conservation DP, or rezoning
None
Single Family New one-family, two-family, rowhouses, and laneway houses must have an energized outlet capable of providing Level 2 charging or higher to garage or carport. Exemption may apply where EV circuit would cause the house panel to exceed 200A; in this case, a raceway must be installed.
None Circuit to and capacity for Level 2 in 100% of parking spaces.
Require all parking stalls, with the exception of visitors parking, in all new residential construction, including single family homes, duplexes, townhomes, and multifamily buildings, as of April 1, 2018, to feature an energized outlet capable of providing Level2 charging or higher to the parking space.
Require rough-ins (adequate electrical panel capacity, conduit and electrical boxes) of Level 2 EV charging infrastructure in the parking area to ensure one space per unit has access to outlet.
None
Policy Method Parking Bylaw (changed from Building Bylaw in 2018) Stand-Alone Policy Sustainable Development Guidelines Zoning Bylaw Zoning Bylaw Stand-alone policyMandatory Yes Yes No (Near-mandatory) Yes Yes YesWebsite http://council.vancouver.ca/20180314/documents/cfsc3.pdf https://www.dnv.org/property-and-
development/supporting-electric-vehicles(see Item 5) http://www.cnv.org/-/media/city-of-north-vancouver/documents/council-meeting-agenda/2016/2016-09-12-regular-agenda-package-for-september-12-2016.pdf
Item #19 of Richmond’s November 27th Council agenda http://www.portcoquitlam.ca/dynamic/page11394.aspx May 2012 Report to Council (see Eve for a copy)
Bylaw Language Parking By-law No. 60594.14.1(a) one-family dwelling, two-family dwelling, one-family ortwo-family dwelling with a secondary suite or lock-off unit,rowhouse, and laneway house, each storage garage orcarport shall be provided with an energized outlet capableof providing Level 2 charging or higher to the storagegarage or carport, except where the provisions of Sentence 10.4.3.1.(2) of Division B of the Building By-law apply;(b) multiple dwelling, multiple dwelling component of amultiple-use development, or rowhouse, all parking spaces provided for residential use, excluding visitor parking spaces, shall be provided with an energized outlet capable of providing Level 2 charging or higher to the parking space;(c) commercial building or commercial component of amultiple-use development with ten or more parking spaces, a minimum of one parking space for every ten parking spaces, plus one space for any additional parking spaces that number less than ten, shall be provided with an energized outlet capable of providing Level 2 charging or higher to the parking space; and(d) commercial building or commercial component of amultiple-use development with less than ten parkingspaces, a minimum of one parking space shall be providedwith an energized outlet capable of providing Level 2charging or higher to the parking space.
1. For multifamily developments:
'- 20% of parking stalls are EV-ready, wired for level 1 charging- Conduit is in place so that 100% of parking stalls can later be wired for level 1 charging- Allocation of EV parking spaces is the responsibility of developers and/or strata organizations
'2. For commercial and industrial development, in the range of 10% of parking stalls are EVready, wired for level 2 charging. The following criteria will be used to determine on a caseby-case basis the appropriate amount of level 1 and level 2 charging to be provided:- Proximity to regional roads and highways; and- Expected length of stay based on long term land use tenure (e.g. more charging infrastructure will be needed where the stay is longer).
'3. All secure bicycle storage is to include level 1 electrical outlets for electric bicycle charging.
7.15 "Provision of Electric Vehicle Charging Infrastructure7.15.1 For new buildings, structures and uses, all residential parking spaces, excluding visitor parking spaces, shall feature an energized outlet capable of providing Level2 charging or higher to the parking space.7.15.2 Energized outlets, provided pursuant to section 7.15.1 above, shall be labeled for their intended use for electric vehicle charging.7.15.3 Where an electric vehicle energy management system is implemented, the Director of Engineering may specifY a minimum performance standard to ensure a sufficient rate of electric vehicle charging."
Definition:“Roughed-in electric vehicle charging Infrastructure” means a Level 2 service including a240v or 208v circuit breaker on an energized electrical panel connected by raceway toan outlet.
Requirement:1) One parking space per dwelling unit shall be provided with roughed-in electric vehicle charging infrastructure including an electrical outlet box located within 3 metres of the unit’s required parking space.
2) In a building with a common parking area, such as an apartment building or building with a mix of commercial and residential uses, a separate single utility electrical meter and disconnect shall be provided in line with the electrical panel(s) intendedto provide for charging of electric vehicles.
All new multi-family development provide an appropriate number of dedicated EV plug-in outlets, ideally one for each unit, and new commercial developments over 1500m2 in floor area provide for an expansion of the public electric vehicle charging network.
Building By-law No. 109082) Where the requirements of section 4.14.1(a) of the Parking By-Law would cause the dwelling unit calculated load to exceed 200 A in one-family dwellings, twofamilydwellings, one-family dwellings with secondary suite or a lock-off unit, two family dwellings with secondary suites or a lock-off unit, row housing, or laneway houses, the installation of an energized outlet for Level 2 chargingmay be omitted provided that a minimum nominal trade size of 21 raceway supplied with pull string leading from the dwelling unit panelboard to an electrical outlet box is installed in the storage garage or carport and is labelledto identify its intended use with the electric vehicle supply equipment.3) Where an electric vehicle energy management system is implemented, ChiefBuilding Official may specify a minimum performance standard to ensure asufficient rate of electric vehicle charging.”
Require rough-ins of Level 2 EV charging infrastructure in the parking area, with outlets accessible to each resident parking spot (not required for visitor spots). Outlets may be shared between spaces (must be within 3 m of parking space).
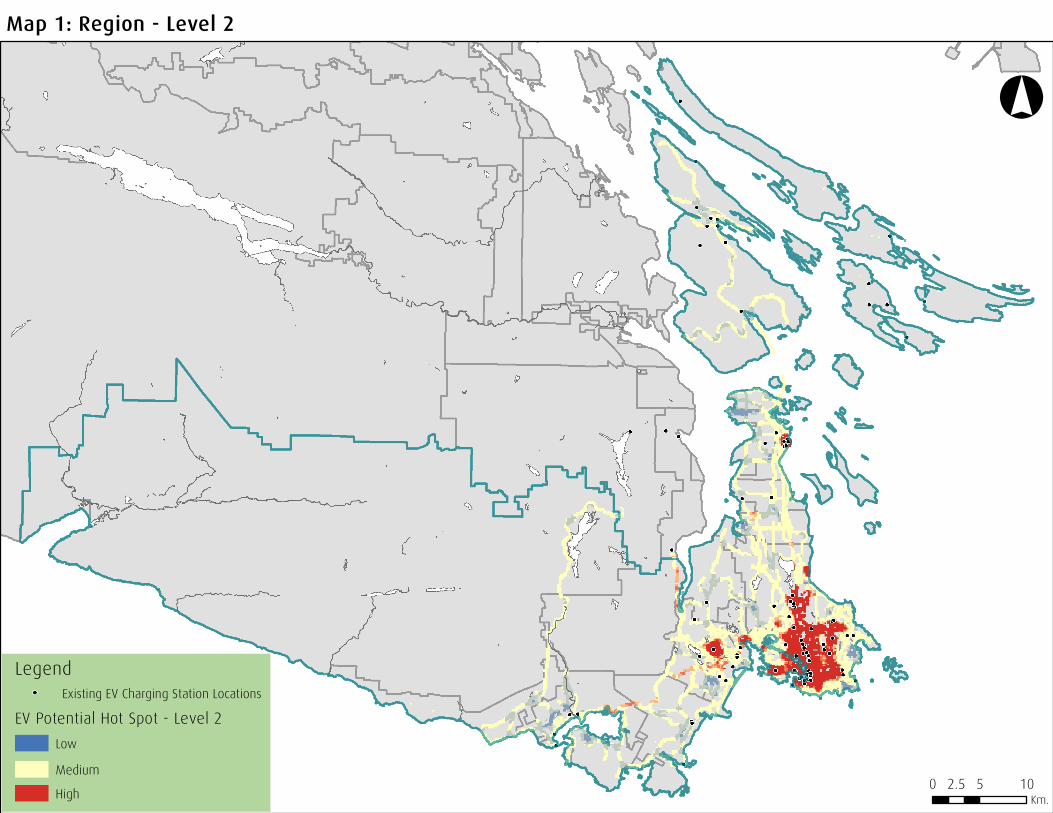
0 5 102.5Km.
°
Map 1: Region - Level 2
Legend
Existing EV Charging Station Locations
EV Potential Hot Spot - Level 2
Low
Medium
High
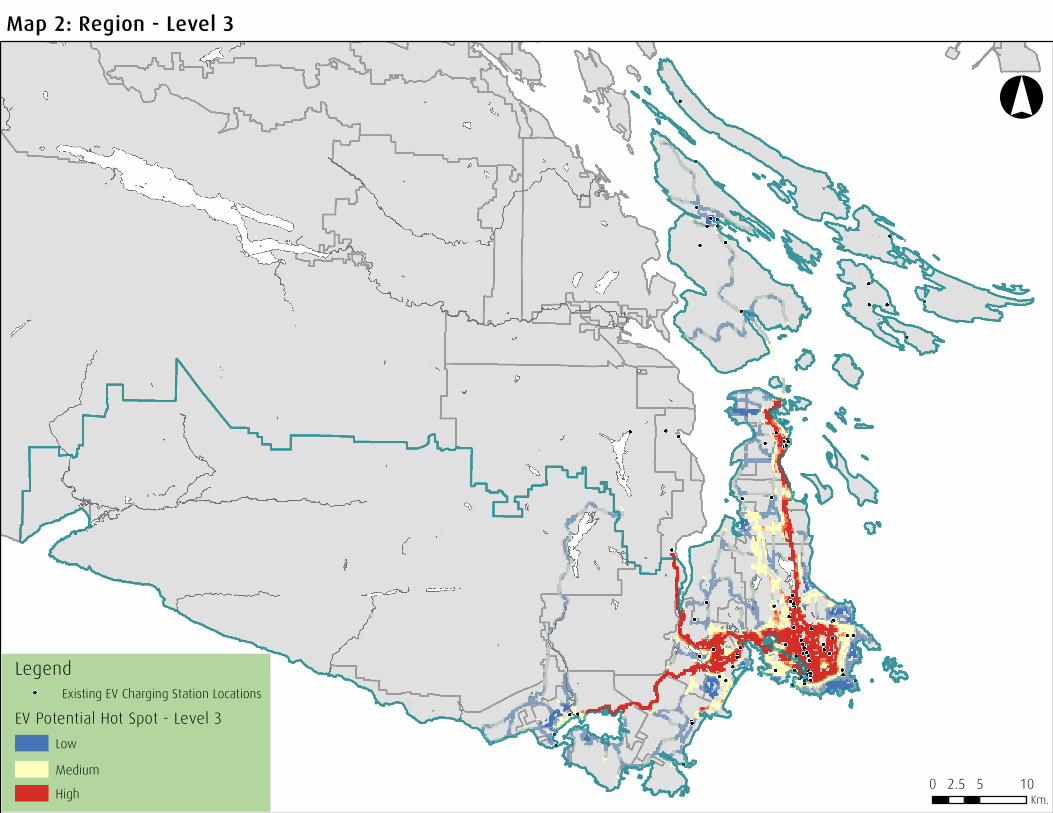
0 5 102.5Km.
°
Map 2: Region - Level 3
Legend
Existing EV Charging Station Locations
EV Potential Hot Spot - Level 3
Low
Medium
High
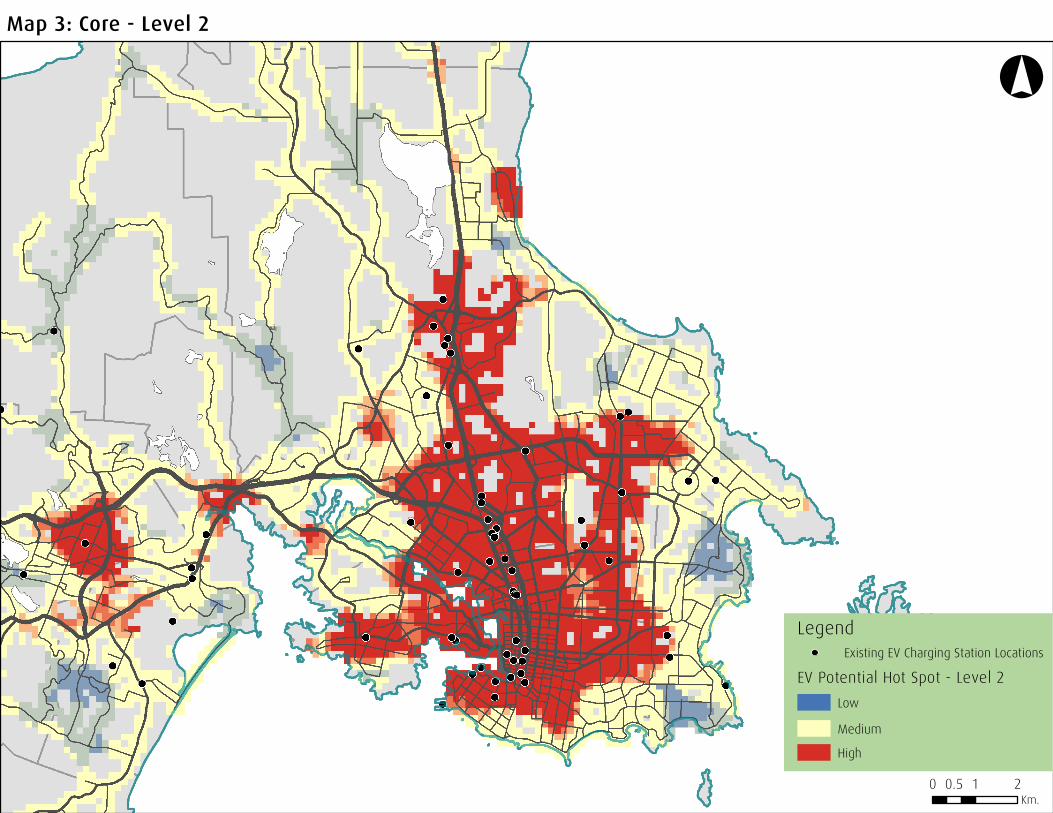
°Map 3: Core - Level 2
Legend
EV Potential Hot Spot - Level 2
Existing EV Charging Station Locations
Low
Medium
High
0 1 20.5Km.

°Map 4: Core - Level 3
0 1 20.5Km.
Legend
EV Potential Hot Spot - Level 3
Existing EV Charging Station Locations
Low
Medium
High
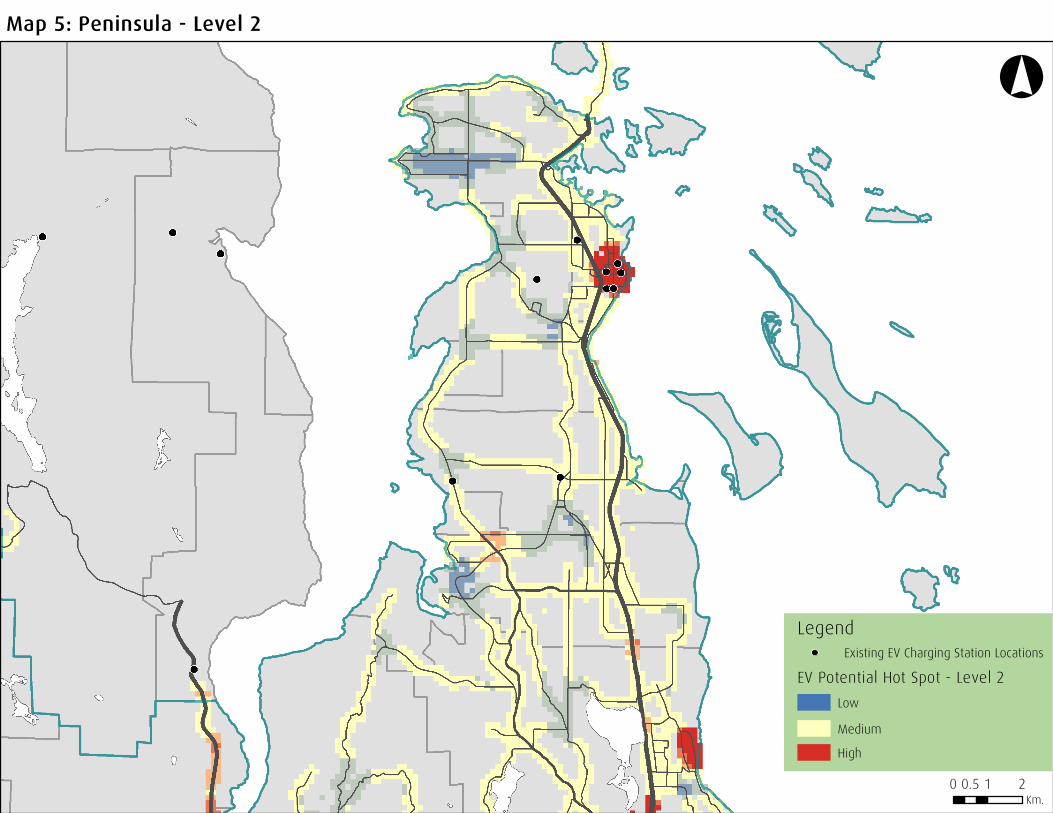
°Map 5: Peninsula - Level 2
0 1 20.5Km.
Legend
EV Potential Hot Spot - Level 2
Existing EV Charging Station Locations
Low
Medium
High

°Map 6: Peninsula - Level 3
0 1 20.5Km.
Legend
EV Potential Hot Spot - Level 3
Existing EV Charging Station Locations
Low
Medium
High
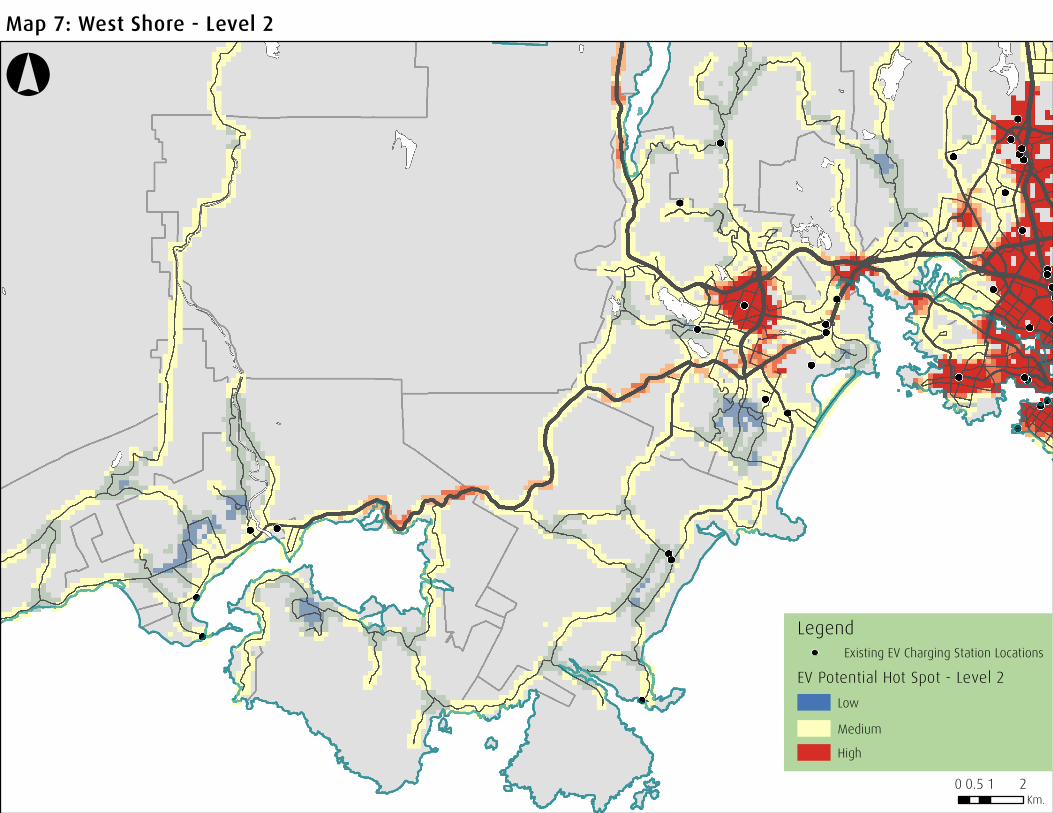
°Map 7: West Shore - Level 2
0 1 20.5Km.
Legend
EV Potential Hot Spot - Level 2
Existing EV Charging Station Locations
Low
Medium
High

°Map 8: West Shore - Level 3
0 1 20.5Km.
Legend
EV Potential Hot Spot - Level 3
Existing EV Charging Station Locations
Low
Medium
High


Public Survey Public Survey quantitative results are shown in the following charts. Qualitative results are summarized in the Backgrounder. General Questions
1) To get a sense of geographic representation, which part of the region do you live in? Responses = 702
1% (6)1% (8)1% (9)1% (10)
2% (12)2% (16)
3% (19)3% (19)3% (20)
4% (29)5% (37)
6% (43)6% (42)
8% (53)26% (181)
28% (198)
0% 5% 10% 15% 20% 25% 30%
District of HighlandsTown of View Royal
Town of SidneyJuan de Fuca Electoral Area
District of MetchosinSouthern Gulf Islands (Please Specify)
Salt Spring IslandCity of Colwood
District of North SaanichDistrict of Oak Bay
District of Central SaanichTownship of Esquimalt
City of LangfordDistrict of Sooke
City of VictoriaDistrict of Saanich

2) Which best describes your home?
Responses = 702
3) How many vehicle(s) does your household currently own or lease? [Please exclude off-road vehicles and RV’s]. Please select one response only. Responses = 702
3% (18)
5% (37)
10% (69)
18% (123)
65% (455)
0% 10% 20% 30% 40% 50% 60% 70%
Other
Secondary suite (e.g. basement suite, garden suite)
Townhouse / duplex
Multi-unit building (e.g., condo, apartment)
Single detached home
4% (29)
7% (49)
12% (85)
40% (279)
37% (260)
0% 5% 10% 15% 20% 25% 30% 35% 40% 45%
None- don't own or lease a vehicle
Three or more
Three vehicles
Two vehicles
One vehicles

4) What is the power source of your vehicle(s)? Responses = 702
General Electric Vehicle Questions
5) Do you plan to purchase an electric vehicle in the future? Responses = 605
6% (45)
2% (13)
5% (32)
6% (39)
27% (186)
76% (532)
0% 10% 20% 30% 40% 50% 60% 70% 80%
Not applicable
Plug-in Hybrid Electric
Diesel
Hybrid
Battery Electric
Gasoline
17% (102)
10% (58)
12% (73)
11% (66)
14% (86)
16% (96)
21% (124)
0% 5% 10% 15% 20% 25%
Don't know/ Unsure at this time
No
Other
In the next year
Next 1-2 years
Next 3-4 years
Next 5 + years

6) If you own an electric vehicle or plan on buying one, what are the factors contributing
to that decision? (Please select all that apply) Responses = 593
7) If you do not own an electric vehicle or do not plan on buying one, what are the factors contributing to that decision? (Please select all that apply) Responses = 450
4% (29)
7% (49)
12% (85)
37% (260)
40% (279)
0% 5% 10% 15% 20% 25% 30% 35% 40% 45%
None- don't own or lease a vehicle
Three or more
Three vehicles
One vehicles
Two vehicles
47% (212)13% (58)
10% (46)
20% (91)
21%
30%
0% 5% 10% 15% 20% 25% 30% 35% 40% 45% 50%
Not applicable
Other
There aren't any models or vehicle types that suit your…
Don't have the ability to charge at home
There are not enough public chargers available
EVs are too expensive

8) What are, or could be, the benefits of owning an electric vehicle for you / your household? Responses = 538
9) What are, or could be, the challenges of owning an electric vehicle for you / your household? Responses = 540
10) What could be done in the capital region to lessen some of the challenges or enhance some of the benefits? (Please be as specific as possible) Responses = 520
Electric Vehicle Infrastructure Questions
11) How important is access to an at-home charger with regard to owning or deciding to purchase an electric vehicle? Responses = 611
2% (13)
1% (6)
5% (29)
23% (140)
69% (423)
0% 10% 20% 30% 40% 50% 60% 70% 80%
Unsure
Very unimportant
Unimportant
Important
Very Important
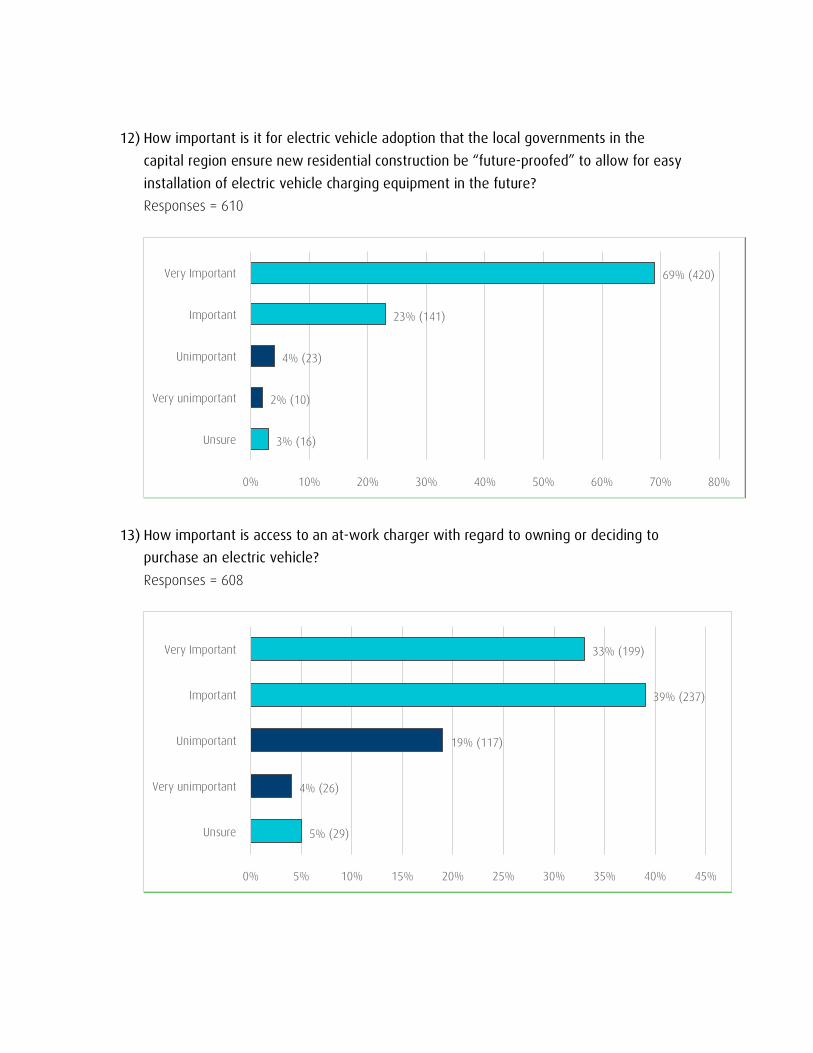
12) How important is it for electric vehicle adoption that the local governments in the capital region ensure new residential construction be “future-proofed” to allow for easy installation of electric vehicle charging equipment in the future? Responses = 610
13) How important is access to an at-work charger with regard to owning or deciding to purchase an electric vehicle? Responses = 608
3% (16)
2% (10)
4% (23)
23% (141)
69% (420)
0% 10% 20% 30% 40% 50% 60% 70% 80%
Unsure
Very unimportant
Unimportant
Important
Very Important
5% (29)
4% (26)
19% (117)
39% (237)
33% (199)
0% 5% 10% 15% 20% 25% 30% 35% 40% 45%
Unsure
Very unimportant
Unimportant
Important
Very Important

14) How important is access to a public charging station network with regard to owning or deciding to purchase an electric vehicle? A public charging station network refers to charging stations that are located in publicly accessible places (e.g., shopping malls, libraries, parks, municipal halls, etc.) Responses = 606
15) In which public locations do you think it is most important to have a Level 2 charger? Please rank the following public places from 1 (most important) to 7 (least important). A Level 2 (Alternating Current) charging unit can fully charge a vehicle in 4-6 hours (depending on the vehicle) and can add 16-25 kilometres of range in an hour of charging. It requires 220 volts or 240 volts and up to 80 amps. Major roads and highways Choice Total % 1 145 2 2 55 10 3 53 10 4 46 9 5 42 8 6 52 10 7 141 26
Community centres Choice Total % 1 61 11 2 101 19 3 88 17 4 82 15 5 91 17 6 91 17 7 19 4
3% (15)
2% (12)
5% (27)
40% (242)
51% (310)
0% 10% 20% 30% 40% 50% 60%
Unsure
Very unimportant
Unimportant
Important
Very Important
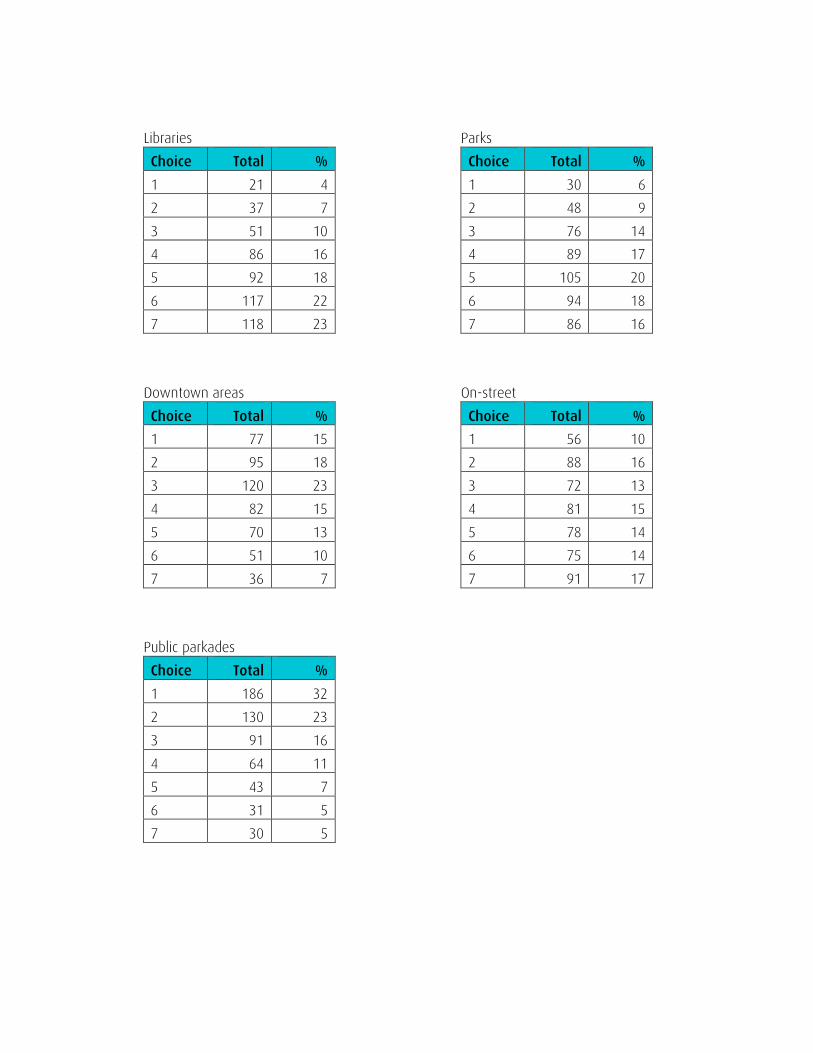
Libraries Choice Total % 1 21 4 2 37 7 3 51 10 4 86 16 5 92 18 6 117 22 7 118 23
Parks Choice Total % 1 30 6 2 48 9 3 76 14 4 89 17 5 105 20 6 94 18 7 86 16
Downtown areas Choice Total % 1 77 15 2 95 18 3 120 23 4 82 15 5 70 13 6 51 10 7 36 7
On-street Choice Total % 1 56 10 2 88 16 3 72 13 4 81 15 5 78 14 6 75 14 7 91 17
Public parkades Choice Total % 1 186 32 2 130 23 3 91 16 4 64 11 5 43 7 6 31 5 7 30 5
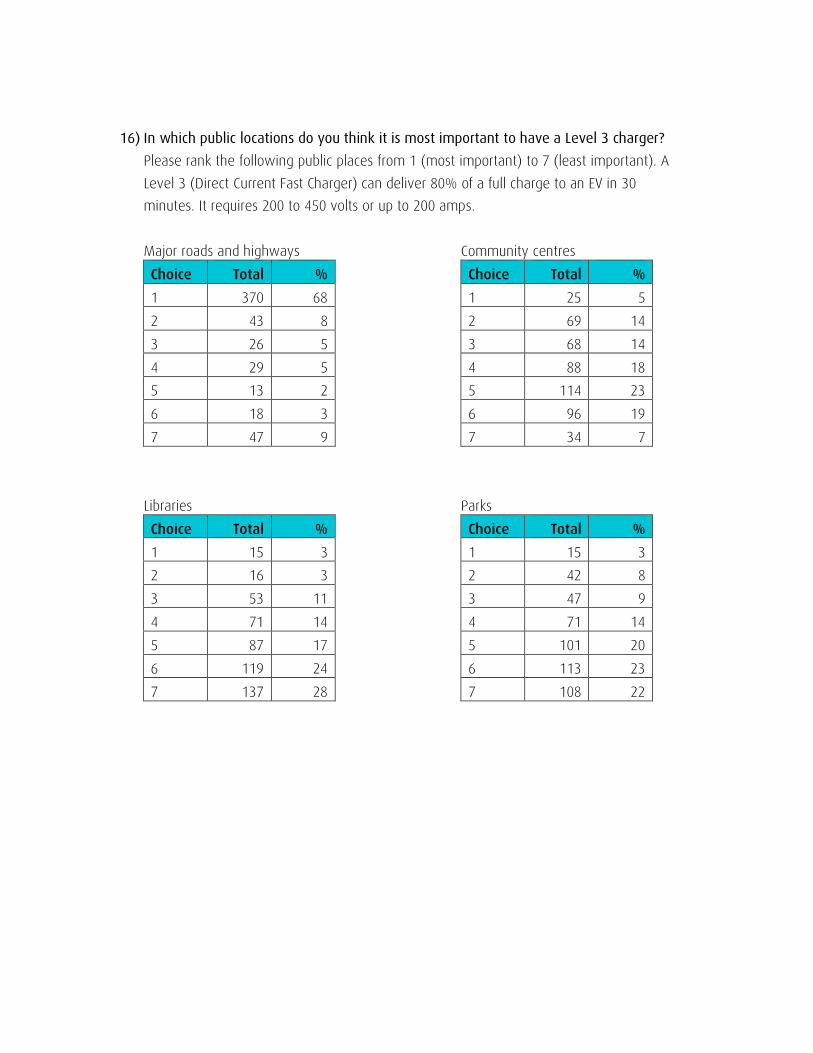
16) In which public locations do you think it is most important to have a Level 3 charger? Please rank the following public places from 1 (most important) to 7 (least important). A Level 3 (Direct Current Fast Charger) can deliver 80% of a full charge to an EV in 30 minutes. It requires 200 to 450 volts or up to 200 amps.
Major roads and highways Choice Total % 1 370 68 2 43 8 3 26 5 4 29 5 5 13 2 6 18 3 7 47 9
Community centres Choice Total % 1 25 5 2 69 14 3 68 14 4 88 18 5 114 23 6 96 19 7 34 7
Libraries Choice Total % 1 15 3 2 16 3 3 53 11 4 71 14 5 87 17 6 119 24 7 137 28
Parks Choice Total % 1 15 3 2 42 8 3 47 9 4 71 14 5 101 20 6 113 23 7 108 22
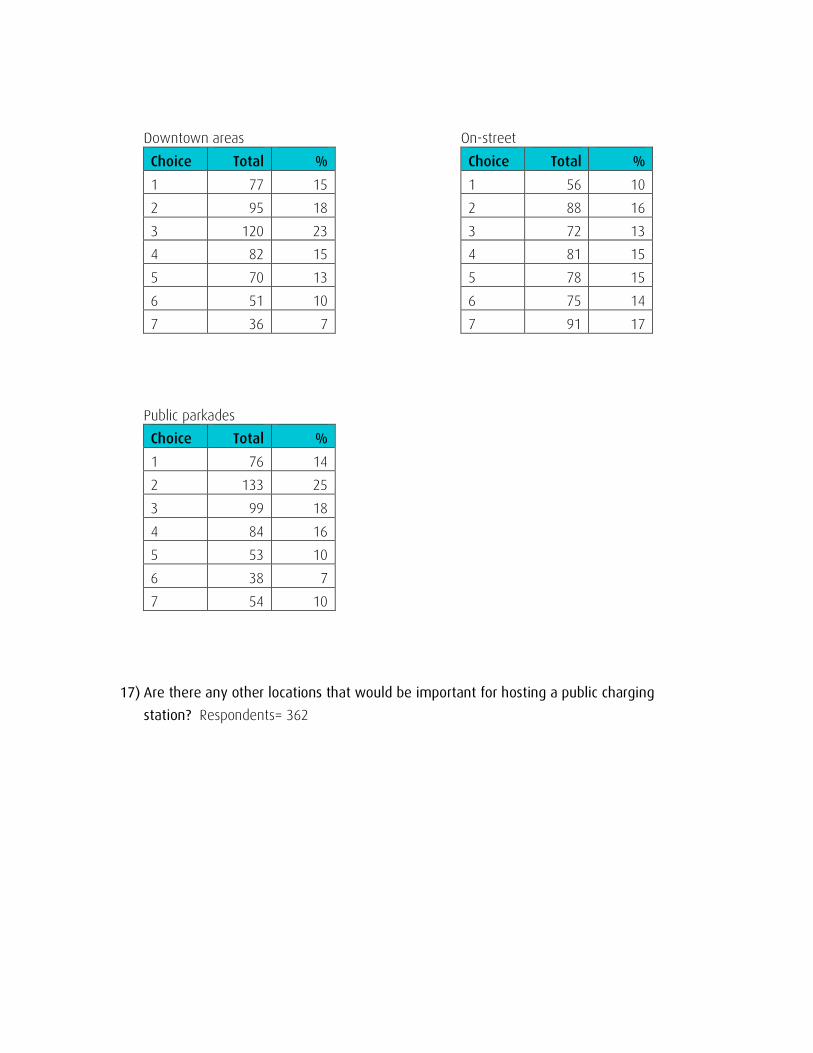
Downtown areas Choice Total % 1 77 15 2 95 18 3 120 23 4 82 15 5 70 13 6 51 10 7 36 7
On-street Choice Total % 1 56 10 2 88 16 3 72 13 4 81 15 5 78 15 6 75 14 7 91 17
Public parkades Choice Total % 1 76 14 2 133 25 3 99 18 4 84 16 5 53 10 6 38 7 7 54 10
17) Are there any other locations that would be important for hosting a public charging
station? Respondents= 362

18) How much would you consider is a reasonable fee per hour for public charging?
Charging a modest fee for use of public charging is considered good practice for reducing congestion for other EV users and for helping offset maintenance and operating costs. Respondents= 603
19) How important is it that your local or regional government take steps to promote the use of EVs in order to reduce your community's greenhouse gas emissions? Responses = 601
16% (98)
18% (107)
21% (124)
11% (68)
11% (68)
14% (86)
9% (52)
0% 5% 10% 15% 20% 25%
Don't know / Unsure at this time
Other
$1.00 per hour
$1.00-$1.50 per hour
$1.50-$2.00 per hour
$2.00 per hour
$2.50 or more per hour
2% (12)
2% (11)
4% (21)
22% (133)
71% (424)
0% 10% 20% 30% 40% 50% 60% 70% 80%
Unsure
Very unimportant
Unimportant
Important
Very Important
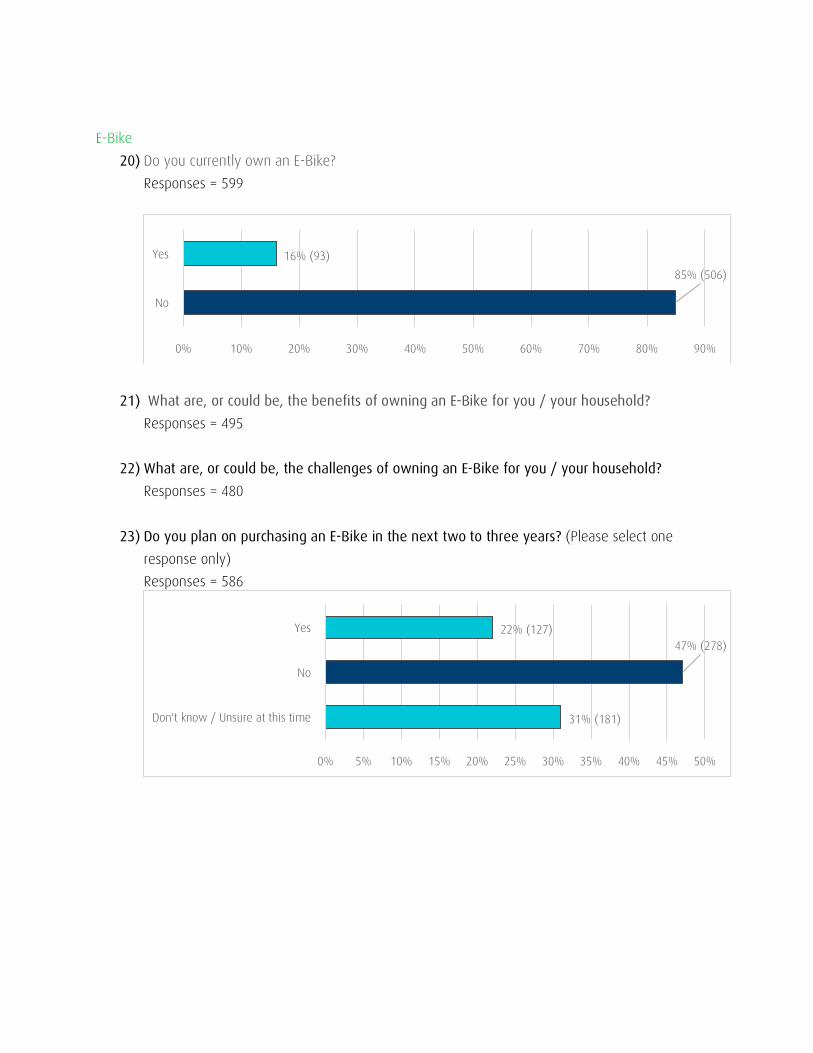
E-Bike 20) Do you currently own an E-Bike?
Responses = 599
21) What are, or could be, the benefits of owning an E-Bike for you / your household? Responses = 495
22) What are, or could be, the challenges of owning an E-Bike for you / your household?
Responses = 480
23) Do you plan on purchasing an E-Bike in the next two to three years? (Please select one response only) Responses = 586
85% (506)16% (93)
0% 10% 20% 30% 40% 50% 60% 70% 80% 90%
No
Yes
31% (181)
47% (278)22% (127)
0% 5% 10% 15% 20% 25% 30% 35% 40% 45% 50%
Don't know / Unsure at this time
No
Yes

24) If you do not own an E-Bike, which of the following statements are true? (Please select
all that apply) Responses = 549
25) If you do not own an E-Bike or do not plan on buying one, what are the factors contributing to that decision? (Please select all that apply) Responses = 531
18% (101)
10% (52)
4% (24)
29% (157)
30% (162)
30% (163)
35% (193)
54% (298)
0% 10% 20% 30% 40% 50% 60%
Not applicable
Other
You are unaware of what an E-Bike is
You would like to buy one
You have no direct experience with E-Bikes
You have researched or looked for information
You have spoken with an owner of one
You have seen them on the streets
22% (117)
21% (110)
15% (78)
15% (81)
19% (101)
20% (104)
22% (116)
27% (144)
37% (196)
0% 5% 10% 15% 20% 25% 30% 35% 40%
Not applicable
Other
Lack of private places to charge an E-Bike
Lack of places to park an E-Bike
Concerned about achieving less exercise
Lack of public places to charge an E-Bike
Concerned about safety
Afraid that it might be stolen
Too expensive
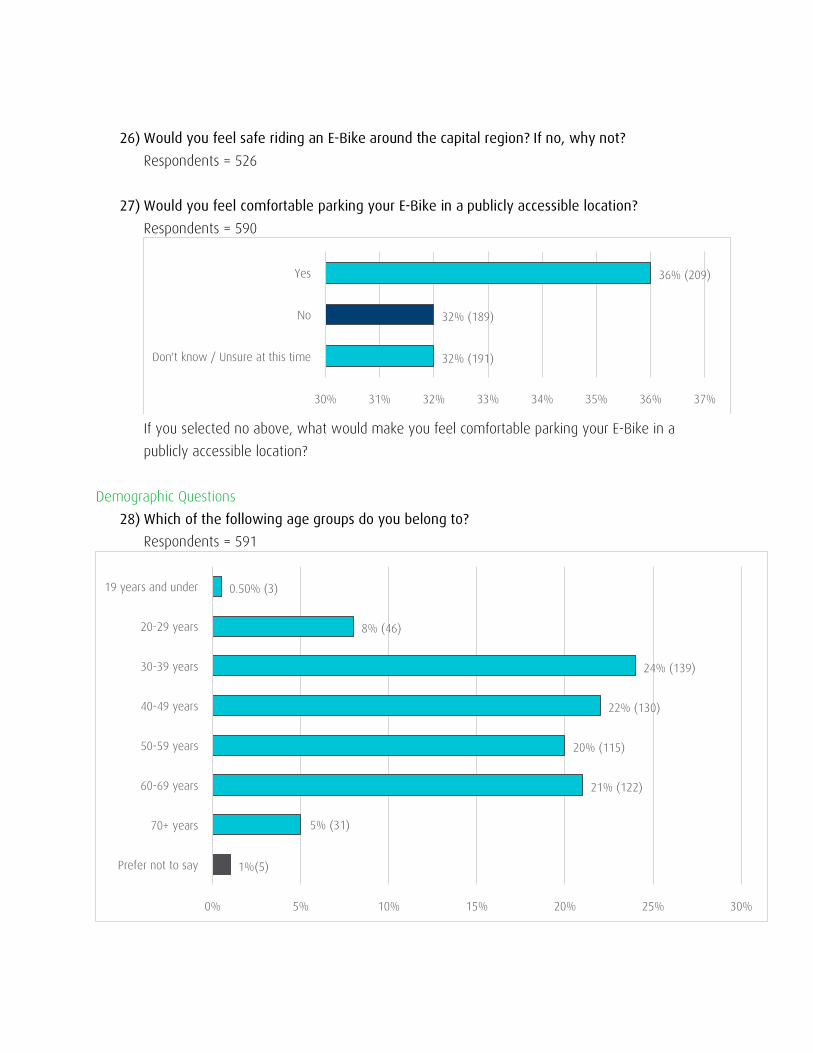
26) Would you feel safe riding an E-Bike around the capital region? If no, why not? Respondents = 526
27) Would you feel comfortable parking your E-Bike in a publicly accessible location? Respondents = 590
If you selected no above, what would make you feel comfortable parking your E-Bike in a publicly accessible location?
Demographic Questions 28) Which of the following age groups do you belong to?
Respondents = 591
32% (191)
32% (189)
36% (209)
30% 31% 32% 33% 34% 35% 36% 37%
Don't know / Unsure at this time
No
Yes
1%(5)
5% (31)
21% (122)
20% (115)
22% (130)
24% (139)
8% (46)
0.50% (3)
0% 5% 10% 15% 20% 25% 30%
Prefer not to say
70+ years
60-69 years
50-59 years
40-49 years
30-39 years
20-29 years
19 years and under

29) Which of the following best describes your household income per year (before taxes)?
Respondents = 591
11% (67)
13% (77)
24% (143)
15% (90)
13% (75)
13% (74)
11% (65)
0% 5% 10% 15% 20% 25% 30%
Prefer not to say
$150,000 and above
$100,000-$150,000
$80,000-$100,000
$60,000-$80,000
$40,000-$60,000
Under $40,000

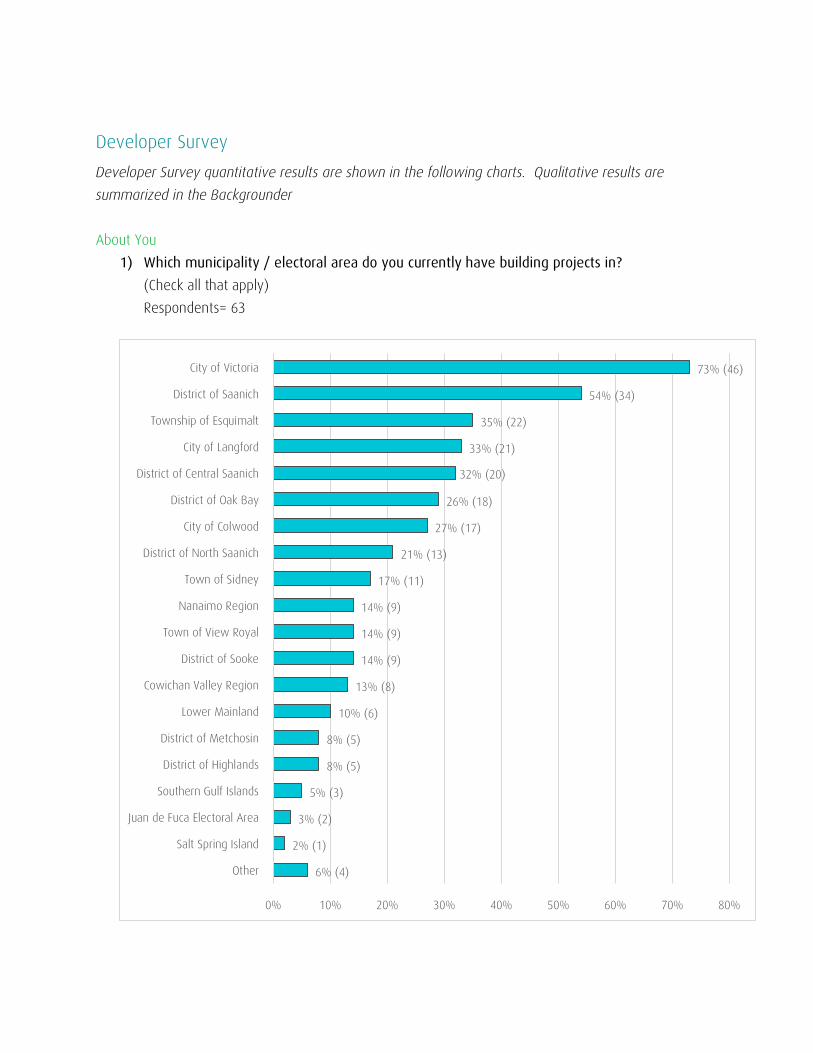
Developer Survey Developer Survey quantitative results are shown in the following charts. Qualitative results are summarized in the Backgrounder About You
1) Which municipality / electoral area do you currently have building projects in? (Check all that apply) Respondents= 63
6% (4)
2% (1)
3% (2)
5% (3)
8% (5)
8% (5)
10% (6)
13% (8)
14% (9)
14% (9)
14% (9)
17% (11)
21% (13)
27% (17)
26% (18)
32% (20)
33% (21)
35% (22)
54% (34)
73% (46)
0% 10% 20% 30% 40% 50% 60% 70% 80%
Other
Salt Spring Island
Juan de Fuca Electoral Area
Southern Gulf Islands
District of Highlands
District of Metchosin
Lower Mainland
Cowichan Valley Region
District of Sooke
Town of View Royal
Nanaimo Region
Town of Sidney
District of North Saanich
City of Colwood
District of Oak Bay
District of Central Saanich
City of Langford
Township of Esquimalt
District of Saanich
City of Victoria
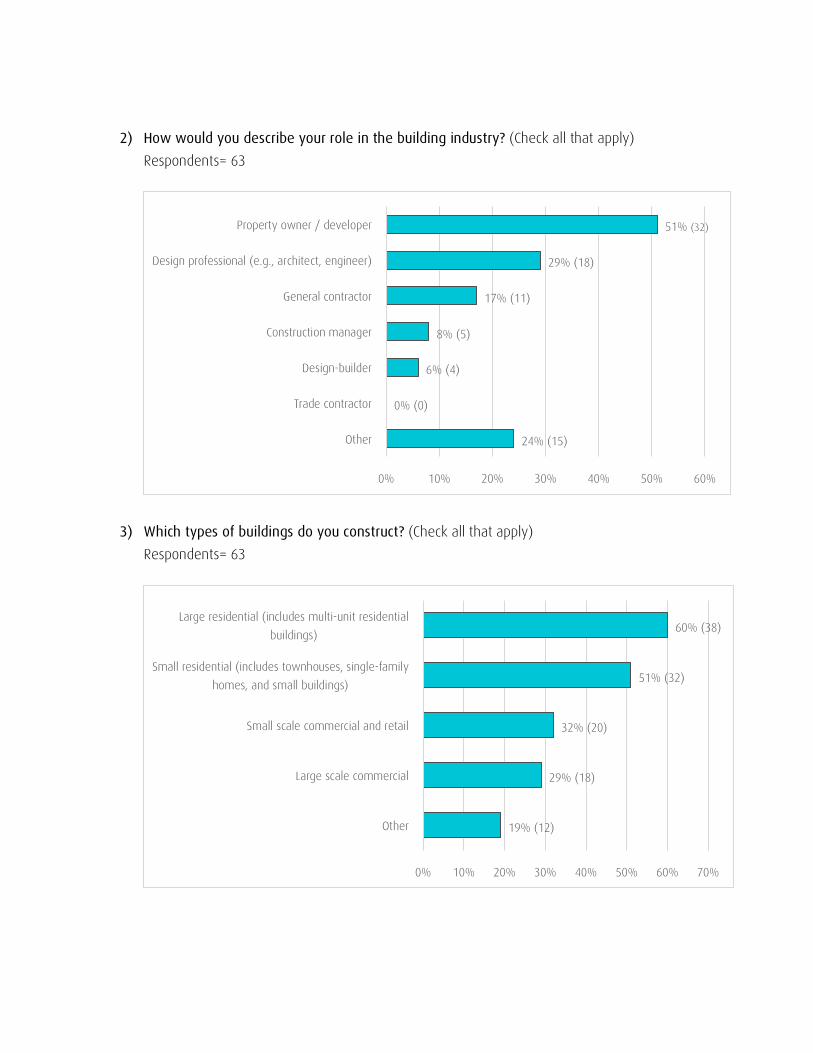
2) How would you describe your role in the building industry? (Check all that apply) Respondents= 63
3) Which types of buildings do you construct? (Check all that apply) Respondents= 63
24% (15)
0% (0)
6% (4)
8% (5)
17% (11)
29% (18)
51% (32)
0% 10% 20% 30% 40% 50% 60%
Other
Trade contractor
Design-builder
Construction manager
General contractor
Design professional (e.g., architect, engineer)
Property owner / developer
19% (12)
29% (18)
32% (20)
51% (32)
60% (38)
0% 10% 20% 30% 40% 50% 60% 70%
Other
Large scale commercial
Small scale commercial and retail
Small residential (includes townhouses, single-familyhomes, and small buildings)
Large residential (includes multi-unit residentialbuildings)

Your Experience with Electric Vehicles 4) Have any of your recent developments been “EV-ready"?
Respondents= 48
If yes, what was the approximate cost per unit?
5) Have electric vehicle charging stations been installed in any of your recent developments? If yes, what were the main reasons for doing so? Respondents= 47
35% (17)
2% (1)
15% (7)
15% (7)
33% (16)
0% 5% 10% 15% 20% 25% 30% 35% 40%
No
Other
Both
Yes, conduit in place and wired for Level 1 charger in thefuture (AC,120)
Yes, conduit in place and wired for Level 2 charger in thefuture (AC, 240)
40% (19)
60% (28)
0% 10% 20% 30% 40% 50% 60% 70%
No
Yes
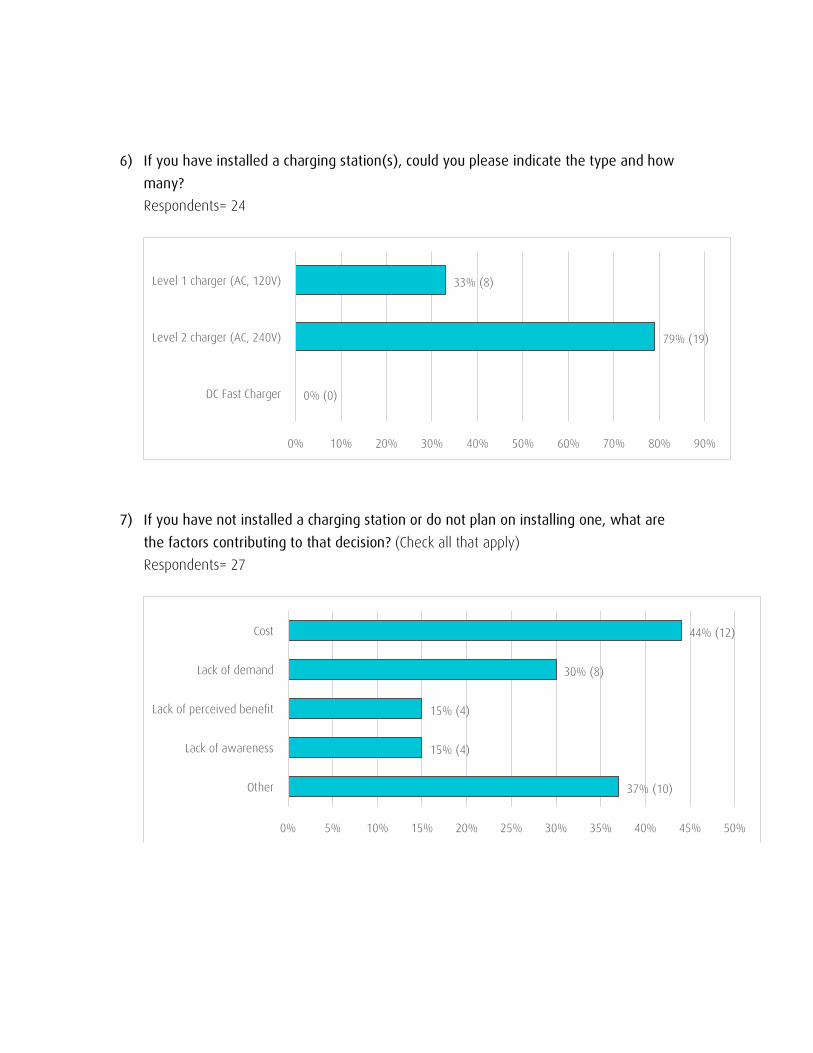
6) If you have installed a charging station(s), could you please indicate the type and how
many? Respondents= 24
7) If you have not installed a charging station or do not plan on installing one, what are the factors contributing to that decision? (Check all that apply) Respondents= 27
0% (0)
79% (19)
33% (8)
0% 10% 20% 30% 40% 50% 60% 70% 80% 90%
DC Fast Charger
Level 2 charger (AC, 240V)
Level 1 charger (AC, 120V)
37% (10)
15% (4)
15% (4)
30% (8)
44% (12)
0% 5% 10% 15% 20% 25% 30% 35% 40% 45% 50%
Other
Lack of awareness
Lack of perceived benefit
Lack of demand
Cost
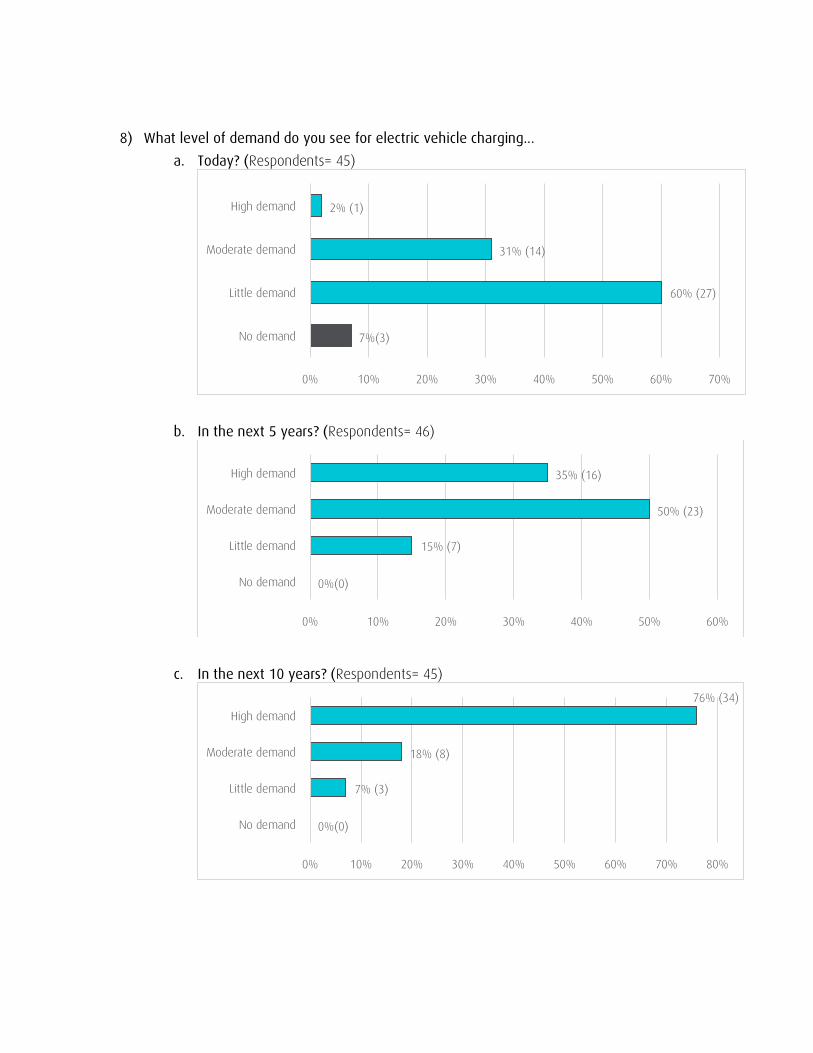
8) What level of demand do you see for electric vehicle charging... a. Today? (Respondents= 45)
b. In the next 5 years? (Respondents= 46)
c. In the next 10 years? (Respondents= 45)
7%(3)
60% (27)
31% (14)
2% (1)
0% 10% 20% 30% 40% 50% 60% 70%
No demand
Little demand
Moderate demand
High demand
0%(0)
15% (7)
50% (23)
35% (16)
0% 10% 20% 30% 40% 50% 60%
No demand
Little demand
Moderate demand
High demand
0%(0)
7% (3)
18% (8)
76% (34)
0% 10% 20% 30% 40% 50% 60% 70% 80%
No demand
Little demand
Moderate demand
High demand
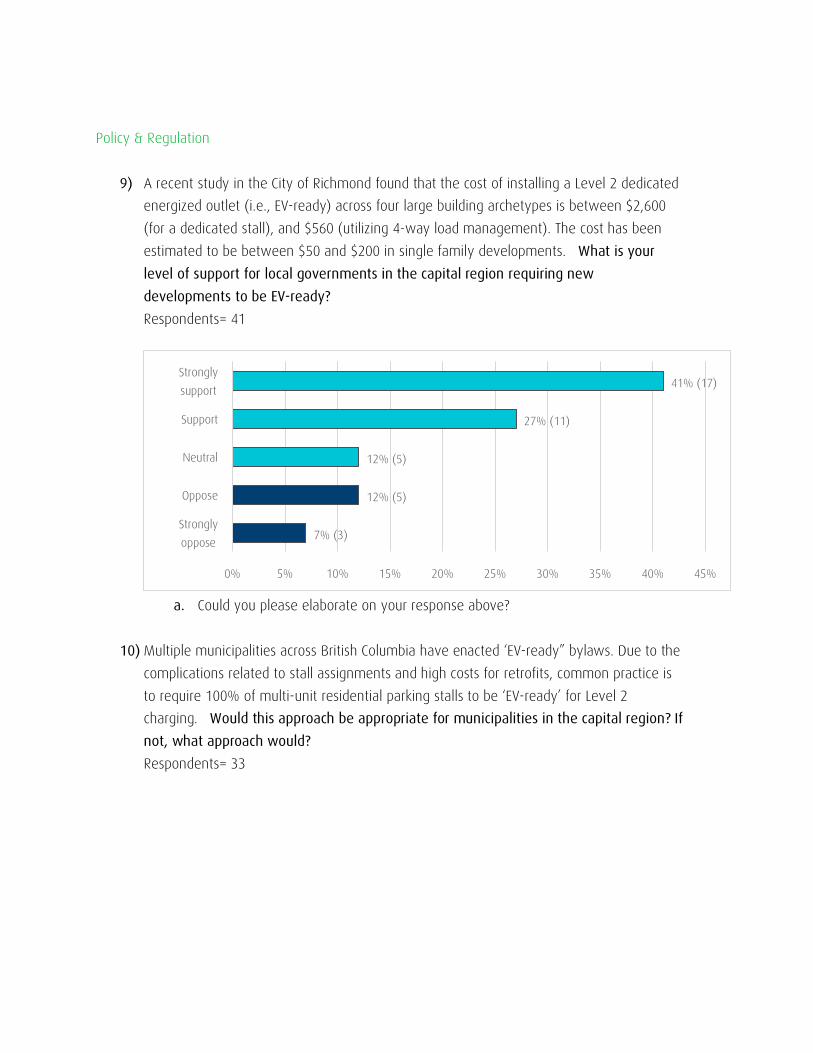
Policy & Regulation
9) A recent study in the City of Richmond found that the cost of installing a Level 2 dedicated energized outlet (i.e., EV-ready) across four large building archetypes is between $2,600 (for a dedicated stall), and $560 (utilizing 4-way load management). The cost has been estimated to be between $50 and $200 in single family developments. What is your level of support for local governments in the capital region requiring new developments to be EV-ready? Respondents= 41
a. Could you please elaborate on your response above?
10) Multiple municipalities across British Columbia have enacted ‘EV-ready” bylaws. Due to the
complications related to stall assignments and high costs for retrofits, common practice is to require 100% of multi-unit residential parking stalls to be ‘EV-ready’ for Level 2 charging. Would this approach be appropriate for municipalities in the capital region? If not, what approach would? Respondents= 33
7% (3)
12% (5)
12% (5)
27% (11)
41% (17)
0% 5% 10% 15% 20% 25% 30% 35% 40% 45%
Stronglyoppose
Oppose
Neutral
Support
Stronglysupport
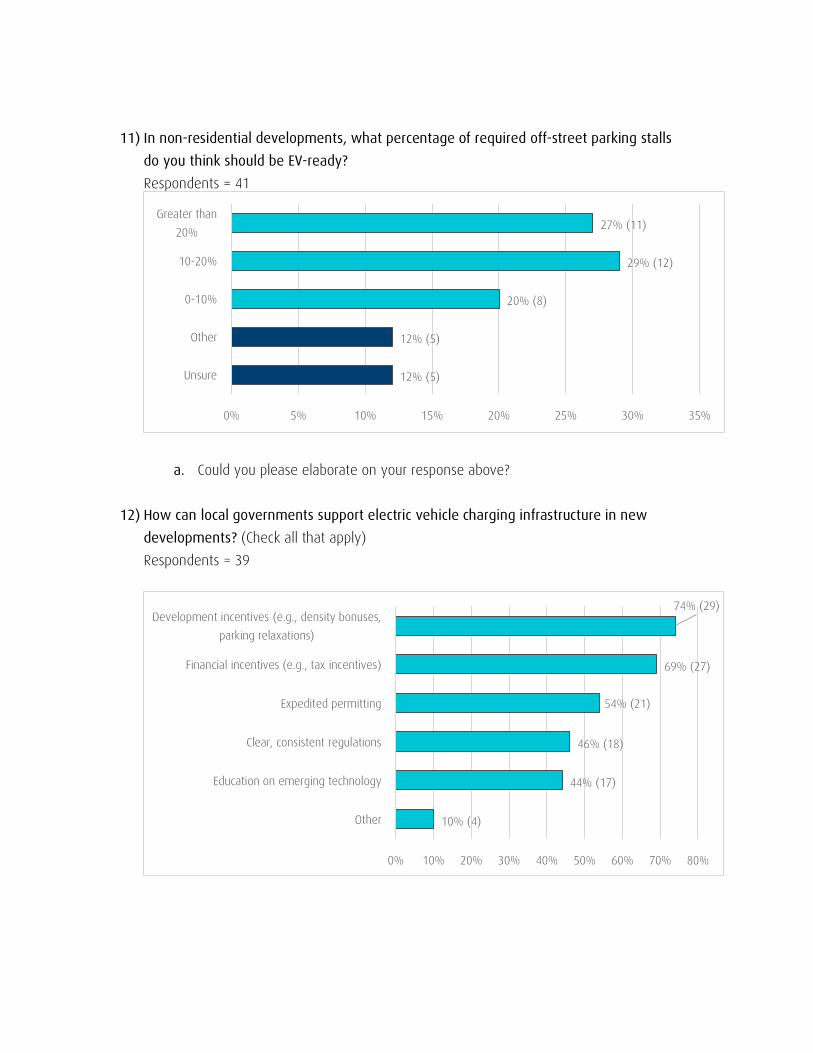
11) In non-residential developments, what percentage of required off-street parking stalls do you think should be EV-ready? Respondents = 41
a. Could you please elaborate on your response above?
12) How can local governments support electric vehicle charging infrastructure in new developments? (Check all that apply) Respondents = 39
12% (5)
12% (5)
20% (8)
29% (12)
27% (11)
0% 5% 10% 15% 20% 25% 30% 35%
Unsure
Other
0-10%
10-20%
Greater than20%
10% (4)
44% (17)
46% (18)
54% (21)
69% (27)
74% (29)
0% 10% 20% 30% 40% 50% 60% 70% 80%
Other
Education on emerging technology
Clear, consistent regulations
Expedited permitting
Financial incentives (e.g., tax incentives)
Development incentives (e.g., density bonuses,parking relaxations)

13) Do you have any final comments you would like to share? Respondents = 16