
CAPITAL PROPERTY FUND - ShareData · 73 Fact sheet contents. 2 CAPITAL ... SA Retail, MICC and...
76
CAPITAL PROPERTY FUND ANNUAL REPORT 2010
Transcript of CAPITAL PROPERTY FUND - ShareData · 73 Fact sheet contents. 2 CAPITAL ... SA Retail, MICC and...

CA
PITA
L P
RO
PE
RT
Y F
UN
D
An
nu
Al RePO
Rt 2
01
0
CAPITAL PROPERTY FUND
AnnuAlRePORt
2010

CAPItAl PROPeRtY FunD AnnuAl RepoRt 2010

AnnuAl RepoRt 2010 CAPITAL PROPERTY FUND 1
3 Definitions
4 Board of directors
7 Analysis of unitholders and unit trading
10 Fund structure
12 Management company’s report to unitholders
16 portfolio statistics
19 Directors’ responsibility statement and declaration by company secretary
20 Independent auditor’s report
21 Report of the trustee
22 Statements of financial position
23 Statements of comprehensive income
24 Statements of changes in unitholders’ interest
25 Statements of cash flow
26 Segmental analysis
28 notes to the annual financial statements
50 Schedule of properties
60 Board charter
61 Corporate governance review
62 Directors’ report
63 Independent auditor’s report
64 Statement of financial position and statement of comprehensive income
65 Statement of changes in equity and statement of cash flow
66 notes to the annual financial statements
71 Administration
72 unitholders’ diary
73 Fact sheet
contents
2 CAPITAL PROPERTY FUND AnnuAl RepoRt 2010 AnnuAl RepoRt 2010 CAPITAL PROPERTY FUND 3 2 CAPITAL PROPERTY FUND AnnuAl RepoRt 2010 AnnuAl RepoRt 2010 CAPITAL PROPERTY FUND 3 2 CAPITAL PROPERTY FUND AnnuAl RepoRt 2010 AnnuAl RepoRt 2010 CAPITAL PROPERTY FUND 3

2 CAPITAL PROPERTY FUND AnnuAl RepoRt 2010 AnnuAl RepoRt 2010 CAPITAL PROPERTY FUND 3 2 CAPITAL PROPERTY FUND AnnuAl RepoRt 2010 AnnuAl RepoRt 2010 CAPITAL PROPERTY FUND 3 2 CAPITAL PROPERTY FUND AnnuAl RepoRt 2010 AnnuAl RepoRt 2010 CAPITAL PROPERTY FUND 3
“Absa” or “Absa Bank” Absa Bank Limited, who act as trustees for Capital.
“Capital” or “Fund” or “Trust” Capital Property Fund, a portfolio in the Capital Property Trust
Scheme, a collective investment scheme in property registered with
the Financial Services Board.
“Companies Act” The Companies Act of South Africa.
“Collective Investment Schemes Control Act” The Collective Investment Schemes Control Act, 45 of 2002, the
current act regulating property and other unit trusts.
“Finlay” Finlay-Stevens Retail (Proprietary) Limited, who act as property
managers on a portion of Capital’s property portfolio.
“Group” Capital Property Fund, its subsidiaries and associates (if applicable).
“JHI” Topeka Trading 4 (Proprietary) Limited, trading as JHI, who act as
property managers on the majority of Capital’s property portfolio.
“Nepi” New Europe Property Investments plc, a property fund listed on the
main board of the JSE and AIM, the alternative market of the London
Stock Exchange.
“Pangbourne” Pangbourne Properties Limited, a property loan stock company.
“Prominent” Promprops cc trading as Prominent Properties, who act as property
managers on a portion of Capital’s property portfolio.
“Property Unit Trust” or “PUT” A property unit trust regulated by the Collective Investment Schemes
Control Act.
“Property Fund Managers” or “PFM” Property Fund Managers Limited, the management company
appointed to manage Capital in terms of the Collective Investment
Schemes Control Act and the trust deed dated 17 December 2003.
“Resilient” Resilient Property Income Fund Limited, a property loan stock
company.
definitions

4 CAPITAL PROPERTY FUND ANNUAL REPORT 2010
BOARD OF DIRECTORS
RUAL BORNMAN (33)FINANCIAL DIRECTORCA(SA)
Rual started his career with KPMG in financial
services auditing. In 2003 he joined Stanlib
where he was involved in management
reporting, accounting and system integration.
He then joined a software development firm
implementing reconciliation systems at Stanlib,
before being employed by Resilient in 2005.
ROWLAND CHUTE (57)INDEPENDENT NON-EXE CUTIVE DIRECTORBCOM, MBL AND A POSTGRADUATE DIPLOMA IN LAW
Rowland spent over 30 years with Old Mutual in
the asset management business as an executive
director, both in South Africa and a number of
other African countries. He was an executive
director of Old Mutual Properties (Proprietary)
Limited and Old Mutual Asset Managers
(Proprietary) Limited.
ANDREW TEIXEIRA (43)MANAGING DIRECTORBSC (QS)
Andrew started his career in his own construction
company. He then joined JHI Real Estate in
1993 in their property management division.
He was appointed as the director responsible
for property management nationally in 2002.
Andrew served as a director of Diversified
Property Fund Limited.
JORGE DA COSTA (55)INDEPENDENT NON-EXE CUTIVE DIRECTOR(PO RTUGUESE CITIZEN)
Jorge has been in the property industry for
the past 29 years and is a founding director of
Improvon Property Group, developers of prime
industrial properties across South Africa.
WILLY ROSS (65)INDEPENDENT NON-EXE CUTIVE CHAIRMANCTA, CA(SA)
Willy commenced his merchant banking career
with the Nedbank Group in 1974 in corporate
finance. He later became involved in project
and structured finance and private equity.
At the time of the delisting of Nedcor Investment
Bank, he was an executive director responsible
for infrastructure, project and structured finance,
private equity and risk and legal. Willy retired
after 30 years’ service with the Nedbank Group
and he now serves on the boards of a number of
listed and unlisted companies.

ANNUAL REPORT 2010 CAPITAL PROPERTY FUND 5
BANUS VAN DER WALT (60)INDEPENDENT NON-EXECUTIVE DIRECTORB ECON, ADVANCED EXECUTIVE PROGRAMME
Banus is a retired property practitioner. He was
previously the managing director of Sanlam
Properties and Gensec Property Services for
16 years. He has 40 years’ property experience
with the Sanlam Group and has travelled
extensively to study the property industry,
both locally and internationally. Banus is a past
president of the South African Property Owners
Association (SAPOA) and has been a non-
executive director of Martprop, Acucap, SA Retail
and iFour. He was also involved in the listing of
Primegro, Acucap, Resilient, iFour, SA Retail, MICC
and Vukile. Banus is currently a non-executive
director of Vukile Property Fund. He is also a non-
executive director of Sanlam Properties and a
member of the Property Committee of Sanlam.
Banus is also a non-executive director of three
non-listed companies.
TRACEY VISSER (50)EXECUTIVE DIRECTOR
Tracey has been involved in the property industry
for over 20 years and has held various positions
at Stocks & Stocks and V&A Waterfront. Tracey
was an asset manager with Old Mutual Properties
(Proprietary) Limited prior to joining PFM.
TSHIAMO VILAKAZI (46)INDEPENDENT NON-EXE CUTIVE DIRECTORBA (S W), LLB, CERTIFICATE IN MININGPROSPECTING (SA)
Tshiamo is a practicing attorney, conveyancer
and notary public. She is a legal consultant
to Gauteng Provincial Government and
Department of Housing. She is also a member
of the Housing Advisory Panel of North West
Provincial Government, Department of Housing
and has been in practice for 17 years.
ANDRIES DE LANGE (37)EXECUTIVE DIRECTORCA(SA), CFA
After completing his articles, Andries joined the
Industrial Development Corporation of South
Africa Limited and then Nedbank Limited where
he gained experience in debt finance, debt
and equity restructurings and private equity.
He joined the Resilient Group in 2004 and is a
director of Resilient.
DES DE BEER (50)EXECUTIVE DIRECTORBPROC, MAP
Des spent most of his career with the Nedbank
Group, initially in property finance and later
in private equity. Des is managing director of
Resilient and a director of Pangbourne, Fortress
Income Fund Limited and Nepi.
PROTAS PHILI (36)INDEPENDENT NON-EXE CUTIVE DIRECTORBCOM, CTA, MCOM (T AXATION), CA(SA)
Protas was previously a director in the corporate
finance and transactions division of the
Department of Public Enterprises, non-executive
director of Rand Merchant Bank and WesBank
and national taxation committee member of the
South African Institute of Chartered Accountants.
Protas is currently a director of April 27 Corporate
Finance (Proprietary) Limited, Veterans Capital
(Proprietary) Limited and also serves on the audit
and risk committees of Aventura Holiday Resorts
Limited, Mogale City Municipality, Safety and
Security Seta and Wholesale and Retail Seta.

6 CAPITAL PROPERTY FUND AnnuAl RepoRt 2010 AnnuAl RepoRt 2010 CAPITAL PROPERTY FUND 7
Board of directors
(continued)
ATTeNdANCe AT BoARd ANd SUB-CoMMITTee MeeTINGS
Attendance at board meetings Scheduled AttendedWilly Ross (chairman) 6 6
Andrew Teixeira 6 6
Rual Bornman 6 5
Rowland Chute 6 6
Jorge da Costa 6 6
Des de Beer 6 6
Andries de Lange 6 5
Protas Phili 6 6
Barry Stuhler* 2 2
Tshiamo Vilakazi 6 6
Tracey Visser 6 6
Banus van der Walt** 4 4
*Barry Stuhler retired from the board with effect from 24 June 2010.**Banus van der Walt was appointed to the board with effect from 24 June 2010.
Attendance at audit and risk committee meetings Scheduled AttendedProtas Phili (chairman) 5 5
Rowland Chute 5 5
Tshiamo Vilakazi 5 5
Attendance at investment committee meetings Scheduled AttendedRowland Chute (chairman) 3 3
Andrew Teixeira 3 3
Jorge da Costa 3 3
Des de Beer 3 3

6 CAPITAL PROPERTY FUND AnnuAl RepoRt 2010 AnnuAl RepoRt 2010 CAPITAL PROPERTY FUND 7
analysis of unitholders and unit trading
UNITHoldeR SPReAd AT 31 deCeMBeR 2010 AS deFINed IN TeRMS oF THe lISTINGS ReQUIReMeNTS oF THe JSe lIMITed
Number of unitholders
Number of units held
Percentage ofissued units
Public 3 935 551 924 775 76,9%
Non-public 1 136 900 000 19,1%
Directors and employees 43 28 753 284 4,0%
3 979 717 578 059 100,0%
Size of holdingNumber of
unitholdersNumber of units held
Percentage of issued units
up to 2 500 units 1 621 927 583 0,1%
2 501 to 10 000 units 1 105 6 462 175 1,0%
10 001 to 100 000 units 943 29 659 746 4,1%
100 001 to 1 000 000 units 217 73 196 285 10,2%
1 000 001 to 3 500 000 units 57 112 182 073 15,6%
More than 3 500 000 units 36 495 150 197 69,0%
3 979 717 578 059 100,0%
Registered unitholders owning 5% or more of issued unitsNumber of units held
Percentage ofissued units
Resilient 136 900 000 19,1%
STANLIB Property Income Fund 35 785 886 5,0%
172 685 886 24,1%
Control of more than 5% of issued unitsNumber of
units controlledPercentage of
issued units
Resilient 136 900 000 19,1%
STANLIB 126 127 382 17,6%
Investec 120 956 840 16,9%
Old Mutual 40 680 042 5,7%
424 664 264 59,3%

8 CAPITAL PROPERTY FUND AnnuAl RepoRt 2010 AnnuAl RepoRt 2010 CAPITAL PROPERTY FUND 9
BeNeFICIAl UNITHoldING oF dIReCToRS ANd oFFICeRS
At 31 december 2010direct
holdingIndirect holding
Total units held
Percentage ofunits issued
Rual Bornman 100 000 – 100 000 –
Stefano Contardo* 8 600 – 8 600 –
Jorge da Costa – 422 765 422 765 0,1%
Des de Beer – 6 488 909 6 488 909 0,9%
Andries de Lange 2 661 363 452 350 3 113 713 0,4%
Protas Phili – 261 510 261 510 –
Andrew Teixeira – 2 016 000 2 016 000 0,3%
Tracey Visser 75 000 – 75 000 –
2 844 963 9 641 534 12 486 497 1,7%
*Alternate to Jorge da Costa.
At 31 december 2009 direct
holding Indirectholding
Total units held
Percentage ofunits issued
Rual Bornman 100 000 – 100 000 –
Jorge da Costa – 422 765 422 765 0,1%
Des de Beer – 5 606 898 5 606 898 0,8%
Andries de Lange 2 661 363 452 350 3 113 713 0,4%
Barry Stuhler 1 624 927 8 071 499 9 696 426 1,4%
Andrew Teixeira – 1 156 000 1 156 000 0,2%
4 386 290 15 709 512 20 095 802 2,9%
The unitholding of directors and officers has not changed between the end of the financial year and the date of this financial report.
analysis of unitholders and unit trading
(continued)

8 CAPITAL PROPERTY FUND AnnuAl RepoRt 2010 AnnuAl RepoRt 2010 CAPITAL PROPERTY FUND 9
CloSING PRICe
Closing price Cents2005 4322006 4792007 6042008 5952009 7102010 821
CPL PUT
Cen
ts
180
170
160
150
140
130
120
110
100
90
80
70
Capital vs PUT Index (indexed to 100 on 3 January 2005)
Jan 06
May 06Sep 06
Jan 07
May 07Sep 07
Jan 08
May 08Sep 08
Jan 09
May 09Sep 09
Jan 10
May 10Sep 10
Dec 10
CPL PUT
Cen
ts
180
170
160
150
140
130
120
110
100
90
80
70
Capital vs PUT Index (indexed to 100 on 3 January 2005)
Jan 06
May 06Sep 06
Jan 07
May 07Sep 07
Jan 08
May 08Sep 08
Jan 09
May 09Sep 09
Jan 10
May 10Sep 10
Dec 10
CAPITAl vS PUT INdex (INdexed To 100 oN 1 JANUARy 2006)
Average daily value traded R’million2005 3,22006 2,72007 5,32008 4,42009 8,62010 6,2
Average daily volume traded (’000)2005 866,12006 596,72007 931,32008 847,62009 1 379,22010 830,1
Cen
ts
890
840
790
740
690
640
590
540
490
440
390
340
290
Dec 05Apr 0
6
Aug 06
Dec 06Apr 0
7
Aug 07
Dec 07Apr 0
8
Aug 08
Dec 08Apr 0
9
Aug 09
Dec 09Apr 1
0
Aug 10
Dec 10

10 CAPITAL PROPERTY FUND ANNUAL REPORT 2010
FUND STRUCTURE
OWNERSHIP
The JSE Limited
Ensures
compliance with
JSE regulations.
Provides market for
trading of units.
Registrar of Collective Investment SchemesEnsures compliance
with the Collective
Investment Schemes
Control Act.
Trustee: Absa Bank Limited
Protects unitholder
interests. Custodian of
assets and securities.
Ensures adherence to
investment policy and
trust deed provisions.
Capital Property Fund717 578 059 units listed on the JSE Limited.
Shareholder of the management company
Resilient Property
Income Fund Limited
Auditors: PKF (Jhb) Inc.Ensures compliance
with legislation and
trust deed. Ensures fair
presentation of financial
results.
REGULATORY BODIES
chartered accountants& business advisers
UNITHOLDERSEffective direct ownership in the property portfolio.
Property Fund Managers Limited
Manages the Fund.
Reports to unitholders.
MANAGEMENT

10 CAPITAL PROPERTY FUND AnnuAl RepoRt 2010 AnnuAl RepoRt 2010 CAPITAL PROPERTY FUND 11

12 CAPITAL PROPERTY FUND AnnuAl RepoRt 2010 AnnuAl RepoRt 2010 CAPITAL PROPERTY FUND 13
management comPany’s rePort to unitholders
dISTRIBUTABle eARNINGS
The distribution of 31,78 cents per unit for the final six months represents an increase of 10,1% over the distribution of 28,86 cents per unit for the
comparable period of the previous financial year.
Total distributions for the year ended 31 December 2010 increased by 10,2% to 60,14 cents per unit.
CoMMeNTARy oN ReSUlTS
Capital’s quality property portfolio has continued to perform well despite the weaker economy. Most of Capital’s properties are located in high
demand nodes in Cape Town, Durban, Johannesburg and Pretoria which, together with the strong corporate tenant profile, has placed it at an
advantage relative to the market. The Fund’s focus remains on the flexibility, general utilisation and functionality of its properties, whilst avoiding
tenant specific or specialised properties.
In a difficult operating environment these combined strategies ensured a resilient portfolio with high levels of tenant retention, above market
growth in rentals and lower vacancies, relative to the market.
The arrears book has decreased marginally and remains firmly under control. Vacancies increased from 4,4% at 31 December 2009 to 5,2% at
31 December 2010 comprising 6,2% industrial, 3,5% commercial and 3,0% retail based on gross lettable area.
Gross income of the property portfolio (excluding sales and acquisitions in 2009 and 2010) increased by 11,4%, whilst expenses increased
by 21,5% resulting in growth in net property income of 8,1%. The sharp increase in expenses is largely due to substantial increases in utilities
and rates and taxes. The growth in distribution was positively impacted on by yield enhancing acquisitions and the benefit of gearing in
the Fund.
PRoPeRTy PoRTFolIo
Capital’s strategy remains the investment in and acquisition of A-grade industrial and commercial properties and the disposal
of the retail assets over time. This will result in a focused industrial and commercial fund, concentrating on the four major commercial nodes and
this is in accordance with international best practice, where specialised funds are favoured by investors.
Acquisitions
In line with its strategy, Capital acquired the following industrial and commercial properties during the financial year:
property name
purchaseprice
(R’000)Initial yield
effectivedate
146 Serenade Road, Rustivia 30 519 9,40% 1 Feb 10
9 Ayshire Avenue, Longmeadow 41 169 9,25% 1 Feb 10
5 - 7 Ayshire Avenue, Longmeadow 21 538 9,25% 1 Feb 10
3 - 4 Drakensberg Drive, Longmeadow 107 666 8,75% 1 Feb 10
10 Drakensberg Drive, Longmeadow 18 196 9,25% 1 Feb 10
87 - 91 Goodwood Road* 33 600 9,00% 13 Oct 10
31 Jeffels Road, Prospecton 94 000 9,75% 22 Dec 10
Westway Office Park** 41 905 10,50% 1 Nov 10
14 Fitzmaurice Avenue, Epping 2** 25 238 10,50% 1 Nov 10
5 Bertie Avenue, Epping 2** 15 000 11,00% 1 Nov 10
total 428 831
*Includes vacant land
**Not yet transferred
disposals
Capital disposed of the following non-core property:
Property name
valuation at31 dec 2009
(R’000)
Salesprice
(R’000)exit
yieldeffective
date
A portion of 4th Street, Wynberg (Portion 1 of erf 473) 5 696 9 000 8,50% 30 Jun 10

12 CAPITAL PROPERTY FUND AnnuAl RepoRt 2010 AnnuAl RepoRt 2010 CAPITAL PROPERTY FUND 13
lISTed eQUITIeS
Capital has retained its holding of 43 169 000 units in Pangbourne Properties Limited (“Pangbourne”) which equates to 9,8% of Pangbourne’s
market capitalisation. The holding in New Europe Property Investments plc (“Nepi”) was reduced from 4 362 837 shares to 3 450 000 shares.
The intention remains to sell the holding over time.
PANGBoURNe MeRGeR
Capital has made an offer to acquire all of the Pangbourne linked units in issue that are not already held by it pursuant to a scheme of arrangement.
The offer is primarily on the basis of an all-unit consideration which would entail Pangbourne unitholders swapping their linked units in Pangbourne
for units in Capital at a swap ratio of 2,38 Capital units for each Pangbourne unit.
Following implementation of the scheme, Capital will be one of the largest property funds in South Africa, by market capitalisation, differentiated
by its industrial and commercial focus. The enlarged Capital may attract interest from a wider group of investors enhancing the liquidity of its units.
Increased market capitalisation and enhanced liquidity may result in Capital’s inclusion in a number of stock exchange and property indices and,
over time, may result in a re-rating of Capital. The potential re-rating and lower yield would position Capital to make further revenue enhancing
acquisitions and its increased size, together with its moderate debt and secure cash flows, should enhance Capital’s access to capital markets.
As part of, and subject to the implementation of the scheme, it has been agreed that, with effect from 1 January 2011, the asset management fee
charged by PFM in respect of Capital will be reduced from 0,5% to 0,4% of the market capitalisation and borrowings of Capital.
Unitholders are referred to the circulars dated and to be posted on or about 3 February 2011, for full details of the transaction.
BoRRowINGS
Capital, through Monyetla which was acquired in 2008, was exposed to Pangbourne’s PROPS 2 securitisation vehicle. On 4 January 2011 this vehicle
was restructured with Monyetla exiting the structure utilising a new R360 million facility provided by Standard Bank.
Capital’s expiring banking facilities, totalling R550 million with Standard Bank, were renewed for a further two years after year end. In addition,
Capital accepted a new facility of R350 million from RMB which was utilised to finance acquisitions.
SUMMARy oF FINANCIAl PeRFoRMANCe
31 Dec 2010 30 Jun 2010 31 Dec 2009 30 Jun 2009
Distribution per unit (cents) 31,78 28,36 28,86 25,72
Units in issue 717 578 059 717 578 059 717 578 059 618 949 027
Net asset value per unit R7,38 R6,57 R6,62 R6,18
Gearing ratio* 18,6% 19,4% 17,1% 23,4%
* The gearing ratio is calculated by dividing interest-bearing borrowings by total assets.

14 CAPITAL PROPERTY FUND AnnuAl RepoRt 2010 AnnuAl RepoRt 2010 CAPITAL PROPERTY FUND 15
HedGed BoRRowINGS
Swap maturity
Nominalamount
R’000Swap
rate
Feb 2011 100 000 7,85%
May 2011 100 000 7,68%
Dec 2011 50 000 8,29%
Feb 2013 100 000 8,18%
Dec 2013 100 000 8,02%
May 2014 50 000 8,67%
May 2014 100 000 8,60%
Aug 2014 100 000 7,15%
Jul 2015 100 000 7,50%
Dec 2015 100 000 7,85%
Dec 2016 200 000 7,50%
Dec 2017 200 000 7,66%
Total hedged borrowings 1 300 000 7,82%
Variable rate borrowings 26 110
Total borrowings 1 326 110
management comPany’s rePort to unitholders
(continued)
PRoSPeCTS
The board expects vacancy levels to increase during the next six
months, followed by an improvement as the economy grows and
excess capacity is taken up. Rentals remain under pressure as a result of
the higher vacancy levels in the property market.
Capital’s growth prospects remain positive and the board anticipates
growth in distributions of between 8% and 10% for the 2011 financial
year, excluding the impact of the proposed merger. The growth is
based on the assumptions that a stable macro-economic environment
will prevail, no major corporate failures will occur and that tenants
will be able to absorb the recovery of rising utility costs. Budgeted
rental income was based on contractual escalations and market
related renewals. This forecast has not been reviewed or reported
on by Capital’s auditors.

14 CAPITAL PROPERTY FUND AnnuAl RepoRt 2010 AnnuAl RepoRt 2010 CAPITAL PROPERTY FUND 15

16 CAPITAL PROPERTY FUND ANNUAL REPORT 2010
PORTFOLIO STATISTICS
LEASE EXPIRY
GLA■ Vacant 5,2%
■ Dec 11 28,4%
■ Dec 12 20,7%
■ Dec 13 17,2%
■ Dec 14 11,0%
■ Dec 15 13,0%
■ > Dec 15 4,5%
2010100%0%
GROSS RENTALS
■ Dec 11 31,7%
■ Dec 12 24,5%
■ Dec 13 16,2%
■ Dec 14 11,9%
■ Dec 15 10,6%
■ > Dec 15 5,1%
2010100%0%
RETAIL – LEASE EXPIRY
GLA■ Vacant 3,0%
■ Dec 11 17,9%
■ Dec 12 17,6%
■ Dec 13 14,5%
■ Dec 14 27,4%
■ Dec 15 7,6%
■ > Dec 15 12,0%
2010100%0%
GROSS RENTALS
■ Dec 11 21,8%
■ Dec 12 22,1%
■ Dec 13 16,8%
■ Dec 14 22,2%
■ Dec 15 8,3%
■ > Dec 15 8,8%
2010100%0%
COMMERCIAL – LEASE EXPIRY
GLA■ Vacant 3,5%
■ Dec 11 41,0%
■ Dec 12 26,3%
■ Dec 13 18,0%
■ Dec 14 6,5%
■ Dec 15 1,9%
■ > Dec 15 2,8%
2010100%0%
GROSS RENTALS
■ Dec 11 42,4%
■ Dec 12 29,9%
■ Dec 13 16,8%
■ Dec 14 6,8%
■ Dec 15 1,6%
■ > Dec 15 2,5%
2010100%0%
INDUSTRIAL – LEASE EXPIRY
GLA■ Vacant 6,2%
■ Dec 11 28,2%
■ Dec 12 15,4%
■ Dec 13 17,9%
■ Dec 14 14,8%
■ Dec 15 13,5%
■ > Dec 15 4,0%
2010100%0%
GROSS RENTALS
■ Dec 11 30,4%
■ Dec 12 16,1%
■ Dec 13 15,5%
■ Dec 14 16,5%
■ Dec 15 15,4%
■ > Dec 15 6,1%
2010100%0%

ANNUAL REPORT 2010 CAPITAL PROPERTY FUND 17
SECTORAL SPLIT
GLA■ Commercial 26%
■ Industrial 68%
■ Retail 6%
2010100%0%
VALUATIONS■ Commercial 44%
■ Industrial 46%
■ Retail 10%
2010100%0%
GEOGRAPHICAL SPLIT
GLA■ Eastern Cape 4%
■ Gauteng 70%
■ KwaZulu-Natal 12%
■ Limpopo 1%
■ Western Cape 13%
2010100%0%
RENTAL■ Eastern Cape 3%
■ Gauteng 68%
■ KwaZulu-Natal 10%
■ Limpopo 2%
■ Western Cape 17%
2010100%0%
TENANT RATING
GLA■ A 56%
■ B 26%
■ C 18%
2010100%0%
RENTAL■ A 56%
■ B 25%
■ C 19%
2010100%0%
A Large national tenants, large listed tenants, government and major franchisees.
B National tenants, listed tenants, franchisees, medium to large professional firms.
C Other, comprising mainly smaller tenants.
WEIGHTED AVERAGE RENTAL
PER SQUARE METRE PER SECTOR■ Commercial R83,62
■ Industrial R35,26
■ Retail R90,32
2010100%0%
ESCALATION PER SECTOR■ Commercial 8,6%
■ Industrial 8,2%
■ Retail 7,1%
2010100%0%
The average annualised property yield is 9,5%.

18 CAPITAL PROPERTY FUND AnnuAl RepoRt 2010 AnnuAl RepoRt 2010 CAPITAL PROPERTY FUND 19
19 Directors’ responsibility statement and declaration by company secretary
20 Independent auditor’s report
21 Report of the trustee
22 Statements of financial position
23 Statements of comprehensive income
24 Statements of changes in unitholders’ interest
25 Statements of cash flow
26 Segmental analysis
28 notes to the annual financial statements
50 Schedule of properties
60 Board charter
61 Corporate governance review
62 Directors’ report
63 Independent auditor’s report
64 Statement of financial position and statement of comprehensive income
65 Statement of changes in equity and statement of cash flow
66 notes to the annual financial statements
71 Administration
72 unitholders’ diary
73 Fact sheet
contents

ANNUAL REPORT 2010 CAPITAL PROPERTY FUND 19
The directors of PFM are responsible for the preparation and fair presentation of the group annual �nancial statements and separate
parent annual �nancial statements of Capital Property Fund (“the Fund”) and annual �nancial statements of Property Fund Managers
Limited (“the Company”), comprising the statements of �nancial position as at 31 December 2010, the statements of comprehensive
income, the statements of changes in unitholders’ interest and statements of cash �ow for the year then ended, and the notes to the
�nancial statements, which include a summary of signi�cant accounting policies and other explanatory notes, and the directors’ report,
in accordance with International Financial Reporting Standards and in the manner required by the Companies Act of South Africa and
Collective Investment Schemes Control Act of South Africa.
The directors’ responsibility includes: designing, implementing and maintaining internal controls relevant to the preparation and fair
presentation of these �nancial statements that are free from material misstatement, whether due to fraud or error; selecting and applying
appropriate accounting policies; and making accounting estimates that are reasonable in the circumstances.
The directors’ responsibility also includes maintaining adequate accounting records and an e�ective system of risk management, as well
as the preparation of the supplementary schedules included in these �nancial statements.
The directors have made an assessment of the group, Fund and Company’s ability to continue as a going concern and there is no reason
to believe the businesses will not be going concerns in the year ahead.
The auditor is responsible for reporting on whether the group annual �nancial statements and separate parent annual �nancial statements
of the Fund and the Company are fairly presented in accordance with the applicable �nancial reporting framework.
Approval of group annual �nancial statements and annual �nancial statements of the Fund and the Company
The group annual �nancial statements and the annual �nancial statements of the Fund and the Company were approved by the board
of directors on 2 February 2011 and signed on its behalf by:
Andrew Teixeira Rual Bornman
Managing director Financial director
2 February 2011
In terms of the Companies Act of South Africa, I certify that the Company has lodged with the Registrar of Companies all such returns as
are required of a public company in terms of this Act and that all such returns are true, correct and up to date.
Rual Bornman
Company secretary
2 February 2011
DECLARATION BY COMPANY SECRETARYfor the year ended 31 D ecemb er 2010
DIRECTORS’ RESPONSIBILITY STATEMENTfor the year ended 31 D ecemb er 2010
20 CAPITAL PROPERTY FUND AnnuAl RepoRt 2010 AnnuAl RepoRt 2010 CAPITAL PROPERTY FUND 21
To THe UNITHoldeRS oF CAPITAl PRoPeRTy FUNd
We have audited the annual financial statements of Capital Property Fund (“the Fund”), which comprise the consolidated and separate
statements of financial position at 31 December 2010, and the consolidated and separate statements of comprehensive income,
statements of changes in unitholders’ interest and statements of cash flow for the year then ended, and the notes to the annual financial
statements, which include a summary of significant accounting policies and other explanatory notes, and the management company’s
report as set out on pages 12 to 14, 19 and 22 to 49.
dIReCToRS oF THe MANAGeMeNT CoMPANy’S ReSPoNSIBIlITy FoR THe FINANCIAl STATeMeNTS
The directors are responsible for the preparation and fair presentation of these financial statements in accordance with International
Financial Reporting Standards and the Collective Investments Schemes Control Act of South Africa. This responsibility includes: designing,
implementing and maintaining internal controls relevant to the preparation and fair presentation of financial statements that are free from
material misstatement, whether due to fraud or error; selecting and applying appropriate accounting policies; and making accounting
estimates that are reasonable in the circumstances.
AUdIToRS’ ReSPoNSIBIlITy
Our responsibility is to express an opinion on these financial statements based on our audit. We conducted our audit in accordance
with International Standards on Auditing. Those standards require that we comply with ethical requirements and plan and perform
the audit to obtain reasonable assurance whether the financial statements are free from material misstatement.
An audit involves performing procedures to obtain audit evidence about the amounts and disclosures in the financial statements.
The procedures selected depend on the auditors’ judgement, including the assessment of the risks of material misstatement of the financial
statements, whether due to fraud or error. In making those risk assessments, the auditors consider internal controls relevant to the entity’s
preparation and fair presentation of the financial statements in order to design audit procedures that are appropriate in the circumstances,
but not for the purpose of expressing an opinion on the effectiveness of the entity’s internal controls. An audit also includes evaluating the
appropriateness of accounting policies used and the reasonableness of accounting estimates made by management, as well as evaluating
the overall presentation of the financial statements.
We believe that the audit evidence we have obtained is sufficient and appropriate to provide a basis for our audit opinion.
oPINIoN
In our opinion, these financial statements present fairly, in all material respects, the consolidated and separate financial position of Capital
Property Fund at 31 December 2010, its consolidated and separate financial performance and consolidated and separate cash flows for
the year then ended in accordance with International Financial Reporting Standards and the Collective Investments Schemes Control Act
of South Africa.
PKF (Jhb) Inc
Registered Auditors
Chartered Accountants (SA)
Registration number 1994/001166/211
Per P Badrick
Johannesburg
2 February 2011
indePendent auditor’s rePortfor the year ended 31 D ecemb er 2010
20 CAPITAL PROPERTY FUND AnnuAl RepoRt 2010 AnnuAl RepoRt 2010 CAPITAL PROPERTY FUND 21
rePort of the trustee
Commercial Property Finance Kommersiële Eiendomsfinansiering
11 Diagonal Street Diagonalstraat 11 Johannesburg 2001 Johannesburg 2001 PO Box 42010 Fordsburg 2033 Posbus 42010 Fordsburg 2033
Docex 342 Johannesburg Docex 342 Johannesburg Tel 011 556 6000 Tel 011 556 6000 Swift Address: ABSA ZA JJ Swift-Adres: ABSA ZA JJ http://www.absa.co.za http://www.absa.co.za
Report of the trustee
For the year ended 31 December 2010
In terms of Section 70(1)(f ) of the Collective Investment Schemes Control Act of 2002
to the unitholders of Capital property Fund
During the period as set out above during which the Collective Investment Schemes Control Act of 2002 has been in effect the Trust
has been administered in accordance with
i) the limitations imposed on the investment and borrowing powers of the Manager by the Act; and
ii) the provisions of the Act and the deed.
ABSA Bank limited
Trustee
Johannesburg
12 January 2011
ABSA Bank Limited/Beperk, Reg No 1986/004794/06
Directors/Direkteure: DC Brink (Chairperson/Voorsitter) * M Ramos (Chief Executive/Uitvoerende Hoof) DC Arnold BP Connellan YZ Cuba BCMM de Vitry d’Avaucourt (French/Frans) SA Fakie G Griffin MW Hlahla MJ Husain AP Jenkins (British/Brits) R Le Blanc (British/Brits) EC Mondlane Jr (Mozambican/Mosambieks) TM Mokgosi-Mwantembe TS Munday SG Pretoriuis *JH Schindehütte *LL von Zeuner BJ Willemse *Executive Directors/Uitvoerende Direkteure Secretary/Sekretaris: S Martin (07/2009)
Authorised Financial Services Provider/Gemagtigde Finansiëlediensteverskaffer – Registered Credit Provider/Geregistreerde Kredietverskaffer, Reg-no NCRCP7
Member of theLid van die
Group Groep

22 CAPITAL PROPERTY FUND AnnuAl RepoRt 2010 AnnuAl RepoRt 2010 CAPITAL PROPERTY FUND 23
statements of financial Positionfor the year ended 31 D ecemb er 2010
audited restated restated audited auditedgrouP grouP grouP fund fund
2010 2009 2008 2010 2009Note R’000 R’000 R’000 R’000 R’000
ASSeTS
Non-current assets 7 122 844 6 090 175 4 850 819 5 639 877 4 925 638
Investment property 3 5 923 042 5 033 139 4 459 286 4 411 117 3 649 089
Straight-lining of rental revenue adjustment 3 88 667 72 319 58 107 70 091 48 968
Investment property under development 3 166 702 126 091 41 703 166 702 126 091
Investment in associate company – – 118 923 – –
Investments 4 944 433 858 626 172 800 944 433 858 626
Interest in subsidiaries 5 – – – 47 534 242 864
Current assets 15 281 60 286 107 249 507 494 582 029
Investment property held for sale – – 50 692 – –
Straight-lining of rental revenue adjustment – – 610 – –
Trade and other receivables 6 15 099 25 497 54 941 10 190 11 959
Loans to subsidiaries 5 – – – 497 133 570 035
Cash and cash equivalents 7 182 34 789 1 006 171 35
Total assets 7 138 125 6 150 461 4 958 068 6 147 371 5 507 667
eQUITy ANd lIABIlITIeS
Capital of Fund 5 298 062 4 753 169 3 800 285 4 763 548 4 388 493
Trust capital 8 2 645 963 2 645 963 1 981 763 2 645 963 2 645 963
Non-distributable reserves 2 652 099 2 107 206 1 818 522 2 117 585 1 742 530
Retained earnings – – – – –
Total liabilities 1 840 063 1 397 292 1 157 783 1 383 823 1 119 174
Non-current liabilities 752 814 1 101 855 771 155 321 052 679 615
Interest-bearing borrowings 9 693 781 1 053 965 731 615 321 052 679 615
Deferred tax 10 59 033 47 890 39 540 – –
Current liabilities 1 087 249 295 437 386 628 1 062 771 439 559
Trade and other payables 11 194 682 78 732 171 371 170 483 56 724
Loans from subsidiaries 5 – – – 166 130
Interest-bearing borrowings 9 632 329 – 53 531 632 329 –
Unitholders for distribution 15.2 228 046 207 093 154 003 228 046 207 093
Bank overdraft 7 32 192 9 612 7 723 31 913 9 612
Total equity and liabilities 7 138 125 6 150 461 4 958 068 6 147 371 5 507 667

22 CAPITAL PROPERTY FUND AnnuAl RepoRt 2010 AnnuAl RepoRt 2010 CAPITAL PROPERTY FUND 23
statements of comPrehensive incomefor the year ended 31 D ecemb er 2010
audited restated audited auditedgrouP grouP fund fund
2010 2009 2010 2009Note R’000 R’000 R’000 R’000
Net rental and related revenue 518 240 447 516 488 498 400 359
Recoveries and contractual rental revenue 704 415 600 059 517 798 389 053
Dividends from fixed property companies – – 94 625 103 925
Straight-lining of rental revenue adjustment 16 348 13 602 21 123 10 342
Rental revenue 720 763 613 661 633 546 503 320
Property operating expenses (202 523) (166 145) (145 048) (102 961)
distributable income from investments 70 926 49 815 70 926 49 815
Fair value gain on investment property
and investments 564 468 293 198 442 518 205 602
Fair value gain on investment property 467 247 144 433 350 072 57 221
Fair value adjustment resulting from straight-
lining of rental revenue (16 348) (13 602) (21 123) (10 342)
Fair value gain on investments 113 569 162 367 113 569 158 723
Administrative expenses (35 545) (28 665) (35 632) (28 999)
Impairment of subsidiary loans (319) – (63 886) –
Share of post acquisition reserves from associate – 8 493 – 8 064
Distributable income from associate – 8 064 – 8 064
Profit from associate – 429 – –
Profit before net finance costs 1 117 770 770 357 902 424 634 841
Net finance costs (130 183) (106 966) (95 818) (55 083)
Finance income 2 484 8 617 407 6 758
Interest on units issued cum distribution – 6 100 – 6 100
Interest received 2 484 2 517 407 658
Finance costs (132 667) (115 583) (96 225) (61 841)
Interest on borrowings (122 678) (112 637) (85 999) (66 547)
Interest capitalised 14 472 7 179 14 472 7 179
Fair value adjustment on interest rate derivatives (24 461) (10 125) (24 698) (2 473)
Profit before income tax 12 987 587 663 391 806 606 579 758
Income tax expense 13 (11 143) (8 420) – –
Profit for the year attributable to equity holders 976 444 654 971 806 606 579 758
Total comprehensive income for the year 976 444 654 971 806 606 579 758
Basic earnings per unit (cents)* 14 136,07 98,01
*The Fund has no dilutionary instruments in issue.

24 CAPITAL PROPERTY FUND AnnuAl RepoRt 2010 AnnuAl RepoRt 2010 CAPITAL PROPERTY FUND pB
statements of changes in unitholders’ interestfor the year ended 31 D ecemb er 2010
Non-Trust distributable Retained
GRoUP capital reserves earnings TotalReSTATed Note R’000 R’000 R’000 R’000
Balance previously reported at
31 december 2008 1 981 763 1 790 975 – 3 772 738
Change in accounting policy for deferred tax 10 27 547 27 547
Restated balance at 31 december 2008 1 981 763 1 818 522 – 3 800 285
Total comprehensive income for the year 654 971 654 971
Issue of units 664 200 664 200
Transfer to non-distributable reserves 261 434 (261 434) –
Change in accounting policy for deferred tax 10 27 250 (27 250) –
Distribution (366 287) (366 287)
Restated balance at 31 december 2009 2 645 963 2 107 206 – 4 753 169
Total comprehensive income for the year 976 444 976 444
Transfer to non-distributable reserves 544 893 (544 893) –
Distribution (431 551) (431 551)
Balance at 31 december 2010 2 645 963 2 652 099 – 5 298 062
Non-Trust distributable Retained
capital reserves earnings TotalFUNd R’000 R’000 R’000 R’000
Balance at 31 december 2008 1 981 763 1 529 059 – 3 510 822
Total comprehensive income for the year 579 758 579 758
Issue of units 664 200 664 200
Transfer to non-distributable reserves 213 471 (213 471) –
Distribution (366 287) (366 287)
Balance at 31 december 2009 2 645 963 1 742 530 – 4 388 493
Total comprehensive income for the year 806 606 806 606
Transfer to non-distributable reserves 375 055 (375 055) –
Distribution (431 551) (431 551)
Balance at 31 december 2010 2 645 963 2 117 585 – 4 763 548

PB CAPITAL PROPERTY FUND AnnuAl RePoRt 2010 AnnuAl RePoRt 2010 CAPITAL PROPERTY FUND 25
statements of cash flowfor the year ended 31 D ecemb er 2010
GROUP FUND
2010 2009 2010 2009Note R’000 R’000 R’000 R’000
Operating activities
Profit for the year 976 444 654 971 806 606 579 758
Adjusted for:
Income tax 11 143 8 420 – –
Straight-lining of rental revenue adjustment (16 348) (13 602) (21 123) (10 342)
Fair value gain on investment property (467 247) (144 433) (350 072) (57 221)
Fair value adjustment resulting from straight-lining
of rental revenue 16 348 13 602 21 123 10 342
Fair value gain on investments (113 569) (162 367) (113 569) (158 723)
Impairment of subsidiary loans 319 – 63 886 –
Profit from associate – (429) – –
Interest received (2 484) (2 517) (407) (658)
Interest on borrowings 122 678 105 458 85 999 59 368
Interest capitalised (14 472) – (14 472) –
Fair value adjustment on interest rate derivatives 24 461 10 125 24 698 2 473
Amortisation of tenant installation 2 871 805
Amortisation of letting commission 3 156 2 318
Cash inflow from operating activities 543 300 469 228 505 792 424 997
Working capital changes
Decrease/(increase) in trade and other receivables 16 745 14 233 8 198 (5 054)
Increase/(decrease) in trade and other payables 2 680 (92 639) 489 (4 699)
Cash inflow/(outflow) from working capital 19 425 (78 406) 8 687 (9 753)
Cash generated from operations 562 725 390 822 514 479 415 244
Interest received 2 484 2 517 407 658
Interest on borrowings (122 678) (105 458) (85 999) (59 368)
Income tax paid 15.1 – (70) – –
Distributions paid 15.2 (410 598) (313 197) (410 598) (313 197)
Net cash inflow/(outflow) from operating activities 31 933 (25 386) 18 289 43 337
Investing activities
Additions to investment property (346 688) (808 610) (346 688) (808 610)
Proceeds on disposal of investment property 9 000 312 744 9 000 92 075
Additions, developments and improvements
to investment property (51 339) (129 310) (42 510) (123 029)
Acquisition of investments (17 040) (443 139) (17 040) (443 139)
Proceeds on disposal of investments 44 802 192 576 44 802 83 178
Repayment of loans advanced to subsidiaries – – 38 216 162 073
Cash outflow from investing activities (361 265) (875 739) (314 220) (1 037 452)
Financing activities
Proceeds from the issue of new units 15.3 – 664 200 – 664 200
Increase in interest-bearing borrowings 272 145 268 819 273 766 327 918
Cash inflow from financing activities 272 145 933 019 273 766 992 118
(Decrease)/increase in cash and cash equivalents (57 187) 31 894 (22 165) (1 997)
Cash and cash equivalents at the beginning of the year 25 177 (6 717) (9 577) (7 580)
Cash and cash equivalents at the end of the year 6 (32 010) 25 177 (31 742) (9 577)

26 CAPITAL PROPERTY FUND AnnuAl RePoRt 2010 AnnuAl RePoRt 2010 CAPITAL PROPERTY FUND 27 26 CAPITAL PROPERTY FUND AnnuAl RePoRt 2010 AnnuAl RePoRt 2010 CAPITAL PROPERTY FUND 27
segmental analysisfor the year ended 31 D ecemb er 2010
InvestmentsRetail Commercial Industrial and other Total
Segmental analysis – 2010 R'000 R'000 R'000 R'000 R'000
Recoveries and contractual income 73 505 311 250 319 660 – 704 415 Straight-lining of rental revenue adjustment 571 7 465 8 312 – 16 348
External segmental revenue 74 076 318 715 327 972 – 720 763
Segment result
Operating profit 52 407 233 744 232 089 (35 545) 482 695
Finance income – – – 2 484 2 484
Finance costs – – – (132 667) (132 667)
Distributable income from investments – – – 70 926 70 926
Fair value gain on investments and
investment property 54 716 228 878 167 305 113 569 564 468
Loss on disposal of subsidiary – – – (319) (319)
Income tax expense – – – (11 143) (11 143)
Profit for the year attributable to
equity holders 107 123 462 622 399 394 7 305 976 444
Other information
Investment property 587 500 2 741 900 2 849 011 – 6 178 411
Investments – – – 944 433 944 433
Trade and other receivables 4 026 2 995 3 663 4 415 15 099
Cash and cash equivalents – – – 182 182
Total assets 591 526 2 744 895 2 852 674 949 030 7 138 125
Interest-bearing borrowings – – – 1 326 110 1 326 110
Deferred tax – – – 59 033 59 033
Trade and other payables 9 474 88 306 88 056 8 846 194 682
Unitholders for distribution – – – 228 046 228 046
Bank overdraft – – – 32 192 32 192
Total liabilities 9 474 88 306 88 056 1 654 227 1 840 063
Additions to investment property – 41 905 386 926 – 428 831

26 CAPITAL PROPERTY FUND AnnuAl RePoRt 2010 AnnuAl RePoRt 2010 CAPITAL PROPERTY FUND 27 26 CAPITAL PROPERTY FUND AnnuAl RePoRt 2010 AnnuAl RePoRt 2010 CAPITAL PROPERTY FUND 27
InvestmentsRetail Commercial Industrial and other Total
Segmental analysis – 2009 R'000 R'000 R'000 R'000 R'000
Recoveries and contractual rental revenue 78 940 284 327 236 792 – 600 059
Straight-lining of rental revenue adjustment (3 298) 10 668 6 232 – 13 602
External segmental revenue 75 642 294 995 243 024 – 613 661
Segment result
Operating profit 51 254 217 173 179 089 (28 665) 418 851
Finance income – – – 8 617 8 617
Finance costs – – – (115 583) (115 583)
Distributable income from investments – – – 49 815 49 815
Fair value gain on investments and
investment property 8 335 47 969 74 527 162 367 293 198
Share of post-acquisition reserves
from associate – – – 8 493 8 493
Income tax expense – – – (8 420) (8 420)
Profit for the year attributable to
equity holders 59 589 265 142 253 616 76 624 654 971
Other information
Investment property 528 000 2 463 648 2 239 901 – 5 231 549
Investments – – – 858 626 858 626
Trade and other receivables 4 184 6 690 7 261 7 362 25 497
Cash and cash equivalents – – – 34 789 34 789
Total assets 532 184 2 470 338 2 247 162 900 777 6 150 461
Interest-bearing borrowings – – – 1 053 965 1 053 965
Deferred tax – – – 47 890 47 890
Trade and other payables 6 594 25 881 26 666 19 591 78 732
Unitholders for distribution – – – 207 093 207 093
Bank overdraft – – – 9 612 9 612
Total liabilities 6 594 25 881 26 666 1 338 151 1 397 292
Additions to investment property – 172 134 636 475 – 808 610

28 CAPITAL PROPERTY FUND AnnuAl RePoRt 2010 AnnuAl RePoRt 2010 CAPITAL PROPERTY FUND 29 28 CAPITAL PROPERTY FUND AnnuAl RePoRt 2010 AnnuAl RePoRt 2010 CAPITAL PROPERTY FUND 29
notes to the annUal financial statementsfor the year ended 31 D ecemb er 2010
1 ACCOUNTING POLICIES
Capital Property Fund (the “Fund”) is a Collective Investment Scheme in property domiciled in South Africa. The consolidated
financial statements of the Fund for the year ended 31 December 2010 comprise the Fund, its subsidiaries and associates (together
referred to as the “Group”). The directors authorised the issue of the financial statements on 2 February 2011.
1.1 Basis of preparation
The financial statements and Group financial statements have been prepared on the historical cost basis modified for the fair
value adjustment to investment property and financial assets and financial liabilities measured in terms of IAS 39. The financial
statements have been prepared on the going concern basis. They are presented in Rand, which is the Group and Fund’s functional
currency, and all values are rounded to the nearest thousand (R’000) except where otherwise indicated. The accounting policies
have remained unchanged from those applied in the prior year other than IAS 12. Refer to note 10 where the changes in accounting
policy have been discussed.
1.2 Statement of compliance
The financial statements and Group financial statements are prepared in accordance with International Financial Reporting
Standards (“IFRS”) and interpretations of these standards as adopted by the International Accounting Standards Board, the
AC 500 standards, the requirements of the South African Companies Act and the Collective Investment Schemes Control Act
(Act 45 of 2002) and the Listings Requirements of the JSE Limited.
The principal accounting policies applied in the preparation of these financial statements are set out below. The accounting policies
have been applied consistently by Group entities.
1.3 Use of estimates and judgements
The preparation of financial statements in conformity with IFRS requires the use of certain critical accounting estimates, judgements
and assumptions that affect reported amounts. It also requires management to exercise its judgement in applying the Group’s
accounting policies. Actual results may vary from these estimates. The areas involving a higher degree of judgement or complexities
or areas where assumptions or estimates are significant are disclosed in note 20. The estimates and underlying assumptions are
reviewed on an ongoing basis. Revisions to accounting estimates are recognised in the period in which the estimate is revised and
in any future periods affected.
1.4 Basis of consolidation
Subsidiaries
The consolidated annual financial statements incorporate the annual financial statements of the Fund and its subsidiaries.
Subsidiaries are all entities, including special purpose entities, over which the Group has the power directly or indirectly, to govern
the financial and operating policies so as to obtain benefits from their activities, generally accompanying a beneficial shareholding
of more than one half of the voting rights. The results of subsidiaries are included from the date control was acquired up to the date
control ceased. The purchase method of accounting has been adopted to account for the cost of the acquisition of the investments.
Cost comprises the fair value of any assets transferred, liabilities or obligations assumed and equity instruments issued and excludes
transaction costs.
Investment in subsidiaries of the Fund are reflected at cost less accumulated impairment losses.
Intercompany transactions, balances and unrealised gains/losses on transactions between Group companies are eliminated in the
preparation of the consolidated annual financial statements.
The accounting policies of the subsidiaries are consistent with those of the Fund.
Associates
Associates are those entities in which the Group has significant influence, but not control, over the financial and operating policies.
Significant influence is presumed to exist when the Group holds between 20 and 50 percent of the voting power of another entity.
Associates are accounted for using the equity method and are initially recognised at cost.
The consolidated financial statements include the Group’s share of the income and expenses and equity movements of equity-
accounted investees, after adjustments to align the accounting policies with those of the Group, from the date that significant

28 CAPITAL PROPERTY FUND AnnuAl RePoRt 2010 AnnuAl RePoRt 2010 CAPITAL PROPERTY FUND 29 28 CAPITAL PROPERTY FUND AnnuAl RePoRt 2010 AnnuAl RePoRt 2010 CAPITAL PROPERTY FUND 29
influence commences until the date that significant influence ceases. When the Group’s share of losses exceeds its interest in an
equity-accounted investee, the carrying amount of that interest (including any long-term investments) is reduced to nil and the
recognition of further losses is discontinued except to the extent that the Group has an obligation or has made payments on behalf
of the investee.
Unrealised gains on transactions between the Group and associates are eliminated to the extent of the Group’s interest in the
associates. Unrealised losses are also eliminated unless the transaction provides evidence of impairment in the investment in the
associates. The investments in associates are accounted for at cost less accumulated impairment in the Fund.
1.5 Investment property
Investment property is property held to earn rental income and for capital appreciation.
The cost of investment property comprises the purchase price and directly attributable expenditure. Subsequent expenditure
relating to investment property is capitalised when it is probable that there will be future economic benefits from the use of the
asset. All other subsequent expenditure is recognised as an expense in the period in which it is incurred.
After initial recognition, investment property is measured at fair value. Fair values are determined annually by external independent
registered valuers on the open market value basis. The valuers use either the discounted cash flow method or the capitalisation
of net income method or a combination of both methods to determine fair value. Gains or losses arising from changes in the fair
values of investment property are included in profit or loss for the year in which they arise. The unrealised gain or loss is transferred
to or from non-distributable reserves.
When the Group begins to redevelop an existing investment property for continued future use as investment property, the
property remains investment property which is measured based on the fair value model, and is not reclassified as property, plant
and equipment during the redevelopment.
All costs directly associated with the purchase and construction of a property, and all subsequent capital expenditure
for development qualifying as acquisition costs, are capitalised.
Property under development comprises the cost of the land and development and is stated at cost as the fair value of the
developments cannot be reliably measured. On completion, property under development is transferred to investment property,
where it is measured at fair value.
Borrowing costs are capitalised to the extent that they are directly attributable to the acquisition, construction or production
of a qualifying asset. Capitalisation of borrowing costs commences when the activities to prepare the asset are in progress and
expenditures and borrowing costs are being incurred. Capitalisation of borrowing costs may continue until the asset is substantially
ready for its intended use. If the resulting carrying amount of the asset exceeds its recoverable amount, an impairment loss is
recognised. The capitalisation rate is arrived at by reference to the actual rate payable on borrowings for development purposes or,
with regard to that part of development cost financed out of general funds, the weighted average cost of borrowings.
1.6 Non-distributable reserves
All unrealised gains/losses arising from the movements in fair value of investment property, fair value adjustments on investments,
interest rate derivatives, post-acquisition reserves from associates, gains and losses on the sale of investment property and
investments, are transferred to non-distributable reserves and are not available for distribution.
1.7 Financial instruments
The Group’s financial instruments consist mainly of investments, trade and other receivables, trade and other payables, cash
and borrowings.
Financial instruments, other than financial instruments classified as fair value through profit and loss, are initially measured at fair
value including transaction costs.
Subsequent to initial recognition these instruments are measured as set out below:
Cash and cash equivalents – Measured at fair value.
Investments – Carried at fair value, being the quoted bid price at the reporting date, through profit and loss.

30 CAPITAL PROPERTY FUND AnnuAl RePoRt 2010 AnnuAl RePoRt 2010 CAPITAL PROPERTY FUND 31 30 CAPITAL PROPERTY FUND AnnuAl RePoRt 2010 AnnuAl RePoRt 2010 CAPITAL PROPERTY FUND 31
1.7 Financial instruments (continued)
Trade and other receivables – Stated at amortised cost using the effective interest rate method less accumulated impairment
losses.
Trade and other payables – Stated at amortised cost using the effective interest rate method.
Related party loans receivable – Stated at amortised cost using the effective interest rate method less accumulated impairment
losses.
Related party loans payable – Stated at amortised cost using the effective interest rate method.
Financial liabilities – Non-derivative financial liabilities, not at fair value through profit and loss, are recognised
at amortised cost using the effective interest rate method.
For all financial instruments carried at amortised cost, where the financial effect of the time value of money is not considered
to be material, discounting is not applied as the fair values of these instruments approximate their carrying values.
1.7.1 Derecognition
Financial assets
A financial asset (or, where applicable, a part of a financial asset or part of a group of similar financial assets) is derecognised
where:
– the contractual rights to receive cash flows from the asset have expired;
– the Group retains the right to receive cash flows from the asset, but has assumed an obligation to pay them in full without material
delay to a third party under a ‘pass-through’ arrangement; or
– the Group has transferred its rights to receive cash flows from the asset and either:
(a) has transferred substantially all the risks and rewards of the asset,
or
(b) has neither transferred nor retained substantially all the risks and rewards of the asset, but has transferred control of the
asset.
Where the Group has transferred its rights to receive cash flow from an asset and has neither transferred nor retained substantially all
the risks and rewards of the asset nor transferred control of the asset, the asset is recognised to the extent of the Group’s continuing
involvement in the asset. Continuing involvement that takes the form of a guarantee over the transferred asset is measured at the
lower of the original carrying amount of the asset and the maximum amount of consideration that the Group could be required
to repay.
Financial liabilities
A financial liability is derecognised when the obligation under the liability is discharged or cancelled or expires. Where an existing
liability is replaced by another from the same lender on substantially different terms, or the terms of an existing liability are
substantially modified, such an exchange or modification is treated as a derecognition of the original liability and the recognition
of a new liability, and the difference in the respective carrying amounts is recognised in profit or loss.
Offset
Financial assets and financial liabilities are offset and the net amount reported in the statement of financial position when the
Group has a legally enforceable right to set off the recognised amounts, and intends either to settle on a net basis, or to realise the
asset and settle the liability simultaneously.
1.7.2 Derivative financial instruments
The Group uses derivative financial instruments to hedge its exposure to interest rate risks arising from financing activities.
In accordance with its treasury policy, the Group does not hold or issue derivative financial instruments for trading purposes.
Derivatives used as hedges which do not qualify as such in terms of hedge accounting rules, are accounted for as trading
instruments.
Derivative financial instruments are recognised initially and subsequently stated at fair value. The gain or loss on remeasurement to
fair value is recognised immediately in profit or loss. However, where derivatives qualify for hedge accounting, recognition of any
resultant gain or loss depends on the nature of the risk being hedged.
notes to the annUal financial statements (continUed)
for the year ended 31 D ecemb er 2010

30 CAPITAL PROPERTY FUND AnnuAl RePoRt 2010 AnnuAl RePoRt 2010 CAPITAL PROPERTY FUND 31 30 CAPITAL PROPERTY FUND AnnuAl RePoRt 2010 AnnuAl RePoRt 2010 CAPITAL PROPERTY FUND 31
The fair value of interest rate derivatives is the estimated amount that the Group would receive or pay to terminate the derivative
at the reporting date, taking into account current interest rates and the current creditworthiness of the swap counterparties.
1.7.3 Cash and cash equivalents
Cash and cash equivalents comprise cash balances and call deposits. Cash equivalents are short-term, highly liquid investments that
are readily convertible to known amounts of cash and which are subject to an insignificant risk of changes in value. Bank overdrafts
that are repayable on demand and that form an integral part of the Group’s cash management are included as a component of cash
and cash equivalents for the purpose of the statements of cash flow.
1.7.4 Interest-bearing borrowings
Interest-bearing borrowings are recognised initially at fair value less attributable transaction costs. Subsequent to initial recognition,
interest-bearing borrowings are stated at amortised cost with any difference between cost and redemption value being recognised
in the statement of comprehensive income over the period of the borrowings on an effective interest basis.
1.8 Assets held for sale
Immediately before classification as held for sale, the measurement of assets is brought up to date in accordance with the applicable
IFRS. Then, on initial classification as held for sale, non-current assets, excluding investment property and financial assets within the
scope of IAS 39, are recognised at the lower of the carrying amount and fair value less costs to sell.
1.9 Impairment
Non-financial assets
The carrying amounts of the Group’s non-financial assets are reviewed at each reporting date to determine whether there is any
indication of impairment.
If any such indication exists, the asset’s recoverable amount is estimated.
An impairment loss is recognised whenever the carrying amount of an asset or its cash-generating unit exceeds its recoverable
amount and is recognised in profit or loss.
Impairment losses recognised are allocated first to reduce the carrying amount of any goodwill allocated to the cash-generating
unit and then to reduce the carrying amounts of the other assets in the unit on a pro rata basis.
The recoverable amount of an asset or a cash-generating unit is the greater of their fair value less cost to sell and their value in
use. In assessing value in use, the estimated future cash flows are discounted to their present value using a pre-tax discount rate
that reflects current market assessments of the time value of money and the risks specific to the asset. For any asset that does
not generate largely independent cash flow, the recoverable amount is determined for the cash-generating unit to which the
asset belongs.
An impairment loss in respect of goodwill is not reversed. In respect of other assets, an impairment loss is reversed if there has
been a change in the estimates used to determine the recoverable amount and there is an indication that the impairment loss
no longer exists.
An impairment loss is reversed only to the extent that the carrying amount of the asset does not exceed the carrying amount
that would have been determined, net of depreciation, if no impairment loss had been recognised.
Financial assets
A financial asset is considered to be impaired if objective evidence indicates that one or more events have had a negative effect
on the estimated future cash flows of that asset. An impairment loss in respect of a financial asset measured at amortised cost is
calculated as the difference between its carrying amount and the present value of the estimated future cash flows discounted at
the pre-tax discount rate that reflects current market assessments of the time value of money and the risks specific to the asset.
An impairment loss in respect of an available for sale financial asset is calculated by reference to its current fair value.
Individually significant financial assets are tested for impairment on an individual basis. The remaining financial assets are assessed
collectively in groups that share similar credit characteristics.

32 CAPITAL PROPERTY FUND AnnuAl RePoRt 2010 AnnuAl RePoRt 2010 CAPITAL PROPERTY FUND 33 32 CAPITAL PROPERTY FUND AnnuAl RePoRt 2010 AnnuAl RePoRt 2010 CAPITAL PROPERTY FUND 33
1.9 Impairment (continued)
Financial assets (continued)
All impairment losses are recognised in profit or loss.
An impairment loss is reversed only to the extent that the carrying amount of the asset does not exceed the carrying amount that
would have been determined had no impairment loss initially been recognised. An impairment loss is reversed if the subsequent
increase in recoverable amount can be related objectively to an event occurring after the impairment loss was recognised.
1.10 Letting commission and tenant installation costs
Letting commission and tenant installation costs are amortised over the period of the lease. Amounts charged to the statement of
comprehensive income in respect of tenant installation costs are recognised as an integral part of total rental income.
1.11 Provisions
Provisions are recognised when the Group has present legal or constructive obligations arising from past events, from which
outflows of economic benefits are probable, and where the amount of the obligations can be reliably estimated. Where the effect
of discounting is material, provisions are discounted. The discount rate is a pre-tax rate that reflects current market assessments of
the time value of money and, where appropriate, the risks specific to the liability.
1.12 Revenue
Revenue comprises gross rental revenue including all recoveries from tenants, excluding VAT. Rental revenue from investment
property is recognised in the statements of comprehensive income on a straight-line basis over the term of the lease.
Lease incentives granted are recognised as an integral part of the total rental income. Turnover rentals are recognised on the
accrual basis.
Distributions are accrued for on a daily basis using the apportionment method.
Dividend income is recognised when the right to receive payment is established.
1.13 Property operating expenses
Service costs for service contracts entered into and property operating expenses are expensed as incurred.
1.14 Net financing costs
Finance costs comprise interest payable on borrowings calculated using the effective interest rate method.
Finance income comprises interest received and is recognised as it accrues, taking into account the effective yield on the asset.
1.15 Income tax
The Fund is not liable for income tax or capital gains tax as the income and capital gains taxes are payable by the unitholders.
The Fund therefore does not provide for current or deferred taxation.
Income tax on subsidiaries’ profit or loss for the year comprises current and deferred tax. Income tax is recognised in profit or loss
except to the extent that it relates to items recognised directly in equity, in which case it is recognised in equity.
Current tax is the expected tax payable on the taxable income for the year, using tax rates enacted or substantively enacted at the
reporting date, and any adjustment to tax payable in respect of previous years.
To the extent that the current tax is due to the tax authorities at year end, it is recognised as a current liability.
Deferred tax is provided by subsidiaries using the comprehensive liability method, providing for temporary differences between
the carrying amounts of assets and liabilities for financial reporting purposes and the amounts used for taxation purposes.
The following temporary differences are not provided for: goodwill not deductible for tax purposes, the initial recognition of assets
or liabilities that affect neither accounting nor taxable profit/loss, and differences relating to investments in subsidiaries to the
extent that they will probably not reverse in the foreseeable future. The amount of deferred tax provided is based on the expected
manner of realisation or settlement of the carrying amount of assets and liabilities, using tax rates enacted or substantively enacted
at the reporting date.
notes to the annUal financial statements (continUed)
for the year ended 31 D ecemb er 2010

32 CAPITAL PROPERTY FUND AnnuAl RePoRt 2010 AnnuAl RePoRt 2010 CAPITAL PROPERTY FUND 33 32 CAPITAL PROPERTY FUND AnnuAl RePoRt 2010 AnnuAl RePoRt 2010 CAPITAL PROPERTY FUND 33
1.16 Segmental reporting
The Group consists of investment property owned by the Fund and its subsidiaries and earns revenue in the form of rentals from
tenants of the investment property. On a primary basis the Group is organised into four major business segments, namely retail
consisting mainly of shopping centres, commercial comprising mainly office parks and buildings, industrial comprising warehouses
and factories, and an investments and other segment comprising all assets, liabilities and expenses not directly attributable to the
other segments.
The Group will from time to time invest in/divest from certain primary segments in which case segmental reporting will be adjusted
to reflect only the relevant operating segments.
No geographical segmentation information is provided as the associated risks of the geographical segments are considered
the same.
1.17 Related parties
Related parties in the case of the Group include any unitholder who is able to exert a significant influence on the operating policies
of the Group. Directors, their close family members and any employee who is able to exert a significant influence on the operating
policies of the Group are also considered to be related parties.
In the case of the Fund, related parties would also include subsidiaries and associates.
1.18 Earnings per unit
The Group presents basic earnings per unit and headline earnings per unit for its units.
Basic earnings per unit is calculated by dividing the profit attributable to equity holders by the weighted average number of units
in issue during the year.
Headline earnings per unit is calculated by dividing the headline earnings attributable to equity holders by the weighted average
number of units in issue during the year.
There are no dilutionary instruments in issue.
2 FINANCIAL RISK MANAGEMENT
The Group has exposure to the following risks from its use of financial instruments:
– credit risk;
– liquidity risk; and
– market risk.
This note presents information about the Group’s exposure to each of the above risks, the Group’s objectives, policies and processes
for measuring and managing risk, as well as the Group’s management of capital. Further quantitative disclosures are included
throughout these consolidated financial statements.
The board of directors has overall responsibility for the establishment and oversight of the Group’s risk management framework.
The board has delegated the responsibility for developing and monitoring the Group’s risk management policies to the audit
committee. The audit committee reports to the board of directors on its activities. The audit committee oversees how management
monitors compliance with the Group’s risk management policies and procedures and reviews the adequacy of the risk management
framework in relation to the risks faced by the Group.
The Group’s risk management policies are established to identify and analyse the risks faced by the Group, to set appropriate risk
limits and controls, and to monitor risks and adherence to limits. Risk management policies and systems are reviewed regularly to
reflect changes in market conditions and the Group’s activities.
2.1 Credit risk
Credit risk is the risk of financial loss to the Group if a tenant or counterparty to a financial instrument fails to meet its contractual
obligations, and arises principally from the Group’s receivables from tenants and investment securities.

34 CAPITAL PROPERTY FUND AnnuAl RePoRt 2010 AnnuAl RePoRt 2010 CAPITAL PROPERTY FUND 35 34 CAPITAL PROPERTY FUND AnnuAl RePoRt 2010 AnnuAl RePoRt 2010 CAPITAL PROPERTY FUND 35
notes to the annUal financial statements (continUed)
for the year ended 31 D ecemb er 2010
2.1 Credit risk (continued)
Trade and other receivables
The Group’s exposure to credit risk is influenced mainly by the individual characteristics of each customer. The demographics of the
Group’s customer base, including its industry and geographical spread, reduces credit risk. The majority of rental income is derived
from Gauteng and the Western Cape, but within these areas, there is no concentration of credit risk.
Management has established a credit policy under which each new customer is analysed individually for creditworthiness before
the Group’s standard payment terms and conditions are offered. When available, the Group’s review includes external ratings.
In monitoring customer credit risk, customers are grouped according to their credit characteristics, including whether they are an
individual or a legal entity, industry, size of business and existence of previous financial difficulties. Trade and other receivables
relate mainly to the Group’s tenants and deposits with municipalities.
Investments
The Group limits its exposure to credit risk by only investing in liquid securities and only with counterparties that are listed on a
recognised stock exchange.
Cash and cash equivalents
The Group limits its exposure to credit risk by investing cash and cash equivalents with reputable financial institutions.
2.2 Liquidity risk
Liquidity risk is the risk that the Group will not be able to meet its financial obligations as they fall due. The Group’s approach to
managing liquidity is to ensure, as far as possible, that it will always have sufficient liquidity to meet its liabilities when due, under
both normal and stressed conditions, without incurring unacceptable losses or risking damage to the Group’s reputation.
The Group receives rental on a monthly basis and uses it to reduce its borrowings. Typically the Group ensures that it has sufficient
cash on demand to meet expected operational expenses, including the servicing of financial obligations; this excludes the potential
impact of extreme circumstances that cannot reasonably be predicted, such as natural disasters.
2.3 Market risk
Market risk is the risk that changes in market prices, such as foreign exchange rates, interest rates and equity prices will affect the
Group’s income or the value of its holdings of financial instruments. The objective of market risk management is to manage and
control market risk exposures within acceptable parameters, while optimising the return.
The Group buys and sells derivatives, and also incurs financial liabilities, in order to manage market risks. All such transactions are
carried out within the guidelines set by the audit committee.
Equity price risk
The Group is exposed to equity risk on its investments in Nepi and Pangbourne. Refer to note 2 with regards to the Group’s risk
management policy.
Interest rate risk
The Group adopts a policy of ensuring that at least 50 percent of its exposure to interest rates on borrowings is hedged. This is
achieved by entering into interest rate derivatives.
2.4 Capital management
The board’s policy is to maintain a strong capital base so as to maintain investor, creditor and market confidence and to sustain
future development of the business.
The board seeks to maintain a balance between the higher returns that might be possible with higher levels of borrowings and
the advantages and security afforded by a sound capital position. There were no changes in the Group’s approach to capital
management during the year. Neither the Fund nor any of its subsidiaries are subject to externally imposed capital requirements.
Refer to note 19.2 detailing the limitation on borrowings.

34 CAPITAL PROPERTY FUND AnnuAl RePoRt 2010 AnnuAl RePoRt 2010 CAPITAL PROPERTY FUND 35 34 CAPITAL PROPERTY FUND AnnuAl RePoRt 2010 AnnuAl RePoRt 2010 CAPITAL PROPERTY FUND 35
GROUP FUND
2010 2009 2010 2009
R’000 R’000 R’000 R’000
3 INVESTMENT PROPERTY
Investment property comprises:
Investment property 5 923 042 5 033 139 4 411 117 3 649 089
Straight-lining of rental revenue adjustment 88 667 72 319 70 091 48 968
6 011 709 5 105 458 4 481 208 3 698 057
Investment property under development 166 702 126 091 166 702 126 091
Total investment property 6 178 411 5 231 549 4 647 910 3 824 148
Movement in investment property is as follows:
Carrying value at the beginning of the year 5 105 458 4 568 695 3 698 057 2 924 720
Additions 428 831 808 610 428 831 808 610
Disposals (9 000) (461 202) (9 000) (131 135)
Capital expenditure 18 328 13 889 12 403 7 608
Transfer from development property 845 31 033 845 31 033
Fair value adjustment 450 899 130 831 328 949 46 879
Straight-lining of rental revenue adjustment 16 348 13 602 21 123 10 342
Carrying value at the end of the year 6 011 709 5 105 458 4 481 208 3 698 057
Movement in investment property under
development is as follows:
Carrying value at the beginning of the year 126 091 41 703 126 091 41 703
Additions – 97 102 – 97 102
Cost capitalised 26 984 11 140 26 984 11 140
Interest capitalised 14 472 7 179 14 472 7 179
Transfer to investment property (845) (31 033) (845) (31 033)
Carrying value at the end of the year 166 702 126 091 166 702 126 091
Total investment property 6 178 411 5 231 549 4 647 910 3 824 148
Investment property with a market value of R4,106 million (Dec 09: R3,608 million) is mortgaged to secure borrowing facilities
(refer note 9).
All investment property is externally valued by Peter Parfitt of Quadrant Properties (Proprietary) Limited, a professional associated
valuer (Dip Val MIV (SA)). The valuations were done on an open market basis and with consideration to the future earnings potential
and an appropriate capitalisation rate for each property. The determined fair value of all investment property is supported by
market evidence. The latest valuation was performed as at 1 January 2011.

36 CAPITAL PROPERTY FUND AnnuAl RePoRt 2010 AnnuAl RePoRt 2010 CAPITAL PROPERTY FUND 37 36 CAPITAL PROPERTY FUND AnnuAl RePoRt 2010 AnnuAl RePoRt 2010 CAPITAL PROPERTY FUND 37
GROUP FUND
2010 2010 2009 2009R’000 R’000 R’000 R’000
GROUP Pangbourne Nepi Pangbourne Nepi4 INVESTMENTS
Holding 9,82% 4,50% 9,82% 10,73%
Price at 31 December 19,50 29,75 17,05 28,10
Cost 534 424 69 294 550 414 89 679
Fair value adjustment 241 892 27 897 138 114 31 636
Accrued distribution 65 479 5 447 47 503 1 280
Total 841 795 102 638 736 031 122 595
Combined total 944 433 858 626
FUND Pangbourne Nepi Pangbourne NepiHolding 9,82% 4,50% 9,82% 10,73%
Price at 31 December 19,50 29,75 17,05 28,10
Cost 534 424 69 294 550 414 89 679
Fair value adjustment 241 892 27 897 138 114 31 636
Accrued distribution 65 479 5 447 47 503 1 280
Total 841 795 102 638 736 031 122 595
Combined total 944 433 858 626
notes to the annUal financial statements (continUed)
for the year ended 31 D ecemb er 2010
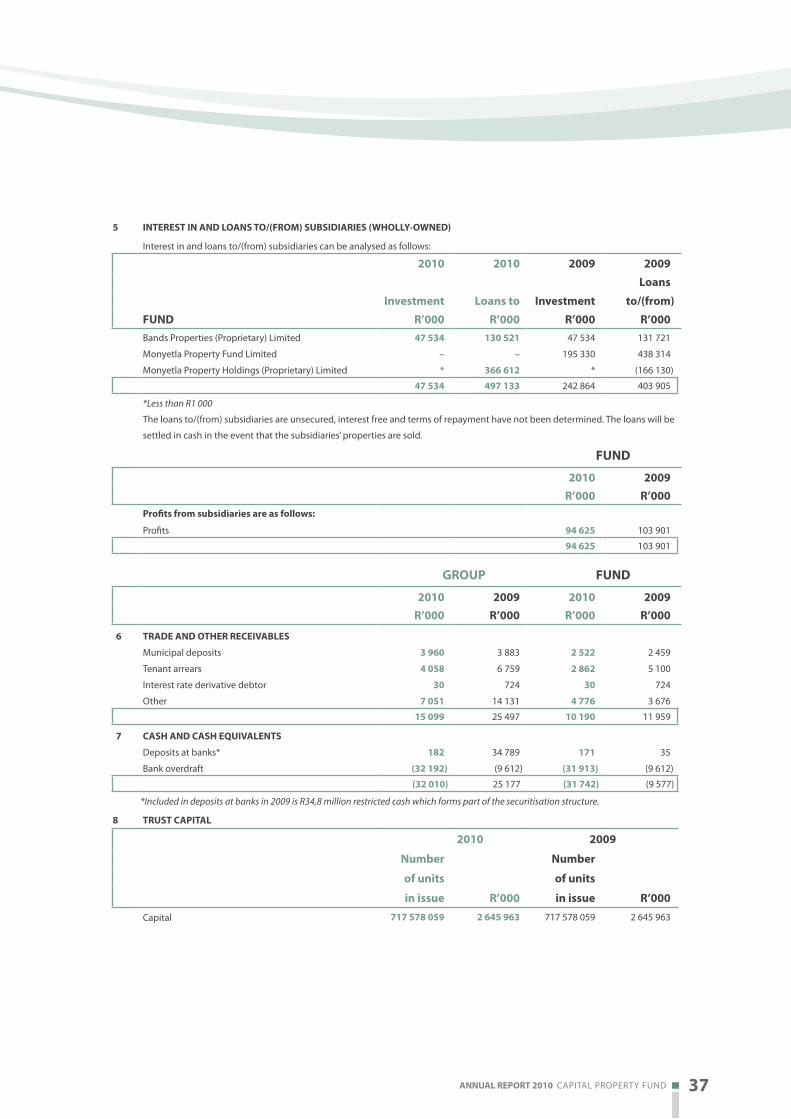
36 CAPITAL PROPERTY FUND AnnuAl RePoRt 2010 AnnuAl RePoRt 2010 CAPITAL PROPERTY FUND 37 36 CAPITAL PROPERTY FUND AnnuAl RePoRt 2010 AnnuAl RePoRt 2010 CAPITAL PROPERTY FUND 37
5 INTEREST IN AND LOANS TO/(FROM) SUBSIDIARIES (WHOLLY-OWNED)
Interest in and loans to/(from) subsidiaries can be analysed as follows:
2010 2010 2009 2009 Loans
Investment Loans to Investment to/(from)FUND R’000 R’000 R’000 R’000Bands Properties (Proprietary) Limited 47 534 130 521 47 534 131 721
Monyetla Property Fund Limited – – 195 330 438 314
Monyetla Property Holdings (Proprietary) Limited * 366 612 * (166 130)
47 534 497 133 242 864 403 905
*Less than R1 000
The loans to/(from) subsidiaries are unsecured, interest free and terms of repayment have not been determined. The loans will be
settled in cash in the event that the subsidiaries’ properties are sold.
FUND
2010 2009 R’000 R’000
Profits from subsidiaries are as follows:
Profits 94 625 103 901
94 625 103 901
GROUP FUND
2010 2009 2010 2009R’000 R’000 R’000 R’000
6 TRADE AND OTHER RECEIVABLES
Municipal deposits 3 960 3 883 2 522 2 459
Tenant arrears 4 058 6 759 2 862 5 100
Interest rate derivative debtor 30 724 30 724
Other 7 051 14 131 4 776 3 676
15 099 25 497 10 190 11 959
7 CASH AND CASH EQUIVALENTS
Deposits at banks* 182 34 789 171 35
Bank overdraft (32 192) (9 612) (31 913) (9 612)
(32 010) 25 177 (31 742) (9 577)
*Included in deposits at banks in 2009 is R34,8 million restricted cash which forms part of the securitisation structure.
8 TRUST CAPITAL
2010 2009
Number Number
of units of units
in issue R’000 in issue R’000
Capital 717 578 059 2 645 963 717 578 059 2 645 963

38 CAPITAL PROPERTY FUND AnnuAl RePoRt 2010 AnnuAl RePoRt 2010 CAPITAL PROPERTY FUND 39 38 CAPITAL PROPERTY FUND AnnuAl RePoRt 2010 AnnuAl RePoRt 2010 CAPITAL PROPERTY FUND 39
9 INTEREST-BEARING BORROWINGS
GROUP FUND
Fair Carrying Fair Carrying
Nominal Date of value amount value amount2010 interest rate maturity R’000 R’000 R’000 R’000Standard Bank 3 month Jibar + 1,55% Mar 11 62 707 62 707 62 707 62 707
Standard Bank 3 month Jibar + 1,85% Mar 11 18 196 18 196 18 196 18 196
Standard Bank 3 month Jibar + 1,75% Mar 11 30 519 30 519 30 519 30 519
Standard Bank 1 month Jibar + 1,94% Feb 11 50 000 50 000 50 000 50 000
Standard Bank 3 month Jibar + 1,75% Feb 11 155 596 155 596 155 596 155 596
ABSA Bank Prime less 1,25% Nov 13 94 836 94 836 94 836 94 836
ABSA Bank 3 month Jibar + 2,05% Nov 13 75 000 75 000 75 000 75 000
Old Mutual 6,50%Repaymenton demand 150 828 150 828 150 828 150 828
Nedbank Prime less 2,30% Oct 11 164 483 164 483 164 483 164 483
Nedbank Prime less 1,00% Sep 14 38 324 38 324 38 324 38 324
Rand Merchant Bank Prime less 1,48% Oct 12 112 892 112 892 112 892 112 892
Securitisation debt 9,98% Jul 12 148 268 148 268 – –
Securitisation debt 9,53% Jul 12 224 461 224 461 – –
1 326 110 1 326 110 953 381 953 381
Less short–term portion (632 329) (632 329) (632 329) (632 329)
693 781 693 781 321 052 321 052
GROUP FUND
Fair Carrying Fair CarryingNominal Date of value amount value amount
2009 interest rate maturity R’000 R’000 R’000 R’000Standard Bank 3 month Jibar + 1,965% Feb 11 26 093 26 093 26 093 26 093
Standard Bank 1 month Jibar + 1,940% Feb 11 100 000 100 000 100 000 100 000
Standard Bank 3 month Jibar + 1,750% Feb 11 155 352 155 352 155 352 155 352
ABSA Bank Prime less 1,25% Nov 13 79 168 79 168 79 168 79 168
ABSA Bank 3 month Jibar + 2,05% Nov 13 75 000 75 000 75 000 75 000
Nedbank Prime less 2,30% Oct 11 145 646 145 646 145 646 145 646
Nedbank Prime less 1,00% Sep 14 38 333 38 333 38 333 38 333
Rand Merchant Bank Prime less 1,50% Apr 10 59 852 59 852 60 023 60 023
Securitisation debt 9,98% Jul 12 148 981 148 981 – –
Securitisation debt 9,53% Jul 12 225 540 225 540 – –
1 053 965 1 053 965 679 615 679 615
Less short–term portion – – – –
1 053 965 1 053 965 679 615 679 615
Interest-bearing borrowings are measured at amortised cost. The Group’s exposure to interest rate and liquidity risk is discussed
in note 19.
The bank loans are secured over investment property with a carrying amount of R4,106 million (Dec 09: R3,608 million).
notes to the annUal financial statements (continUed)
for the year ended 31 D ecemb er 2010

38 CAPITAL PROPERTY FUND AnnuAl RePoRt 2010 AnnuAl RePoRt 2010 CAPITAL PROPERTY FUND 39 38 CAPITAL PROPERTY FUND AnnuAl RePoRt 2010 AnnuAl RePoRt 2010 CAPITAL PROPERTY FUND 39
GROUP FUND
2010 2009 2010 2009 R’000 R’000 R’000 R’000
10 DEFERRED TAX
Deferred tax comprises the following:
– Revaluation of investment property 63 809 47 890 – –
– Other (4 776) – – –
59 033 47 890 – –
Balance previously reported at the beginning of the year 67 087
Change in accounting policy (27 547)
Restated balance at the beginning of the year 47 890 39 540
Charged to the statement of comprehensive income
during the year 11 143 35 600
Change in accounting policy (27 250)
Restated balance at the end of the year 59 033 47 890
Deferred tax is provided at 14% (Dec 09: 14%) on investment property. The deferred tax relates to the fair value movements of
investment property owned by Bands Properties (Proprietary) Limited and Monyetla Property Holdings (Proprietary) Limited,
wholly-owned subsidiaries of Capital Property Fund.
In December 2010 the IASB released amendments to IAS 12 effective from 1 January 2012. These amendments impact on the rate
at which deferred tax is recognised specifically on the fair value movements of the building component of investment property
as it establishes a presumption that it will be recovered through disposal and hence will attract deferred tax at the capital gains
tax rate. Capital has elected the early adoption of these amendments and applied them retrospectively as required by IAS 8.
It is the view of the board that the adoption of this policy results in more accurate and meaningful information. Refer to the
statement of changes in unitholders’ interest.
The effect of the change in accounting policy is a reduction of the deferred tax balance as stated above, with the corresponding
increase in reserves as reflected in the statement of changes in unitholders’ interest. In addition, the 2009 statement of
comprehensive income tax charge was R35 670 000 and is now R8 420 000.
11 TRADE AND OTHER PAYABLES
Tenant deposits 22 032 21 146 14 634 13 737
Amounts owing for buildings acquired 82 143 – 82 143 –
Interest rate derivative creditor 31 127 7 359 31 127 7 122
Accruals and other payables 59 380 50 227 42 579 35 865
194 682 78 732 170 483 56 724
12 PROFIT BEFORE NET FINANCE COSTS
Profit before net finance costs is stated after charging:
– Auditors’ remuneration – audit services 540 510 540 510
– Asset management fee* 33 248 26 223 33 248 26 223
– Other costs 1 757 1 932 1 844 2 266
Administrative expenses 35 545 28 665 35 632 28 999
– Impairment charge 3 774 8 839 4 296 3 467
– Letting commission and tenant installation 8 907 1 622 4 765 153
– Expenditure relating to income producing properties 172 383 139 592 124 041 89 793
– Remuneration for managerial services 17 459 16 092 11 946 9 548
Property expenses relating to income producing
properties 202 523 166 145 145 048 102 961
* The asset management fee is equal to 0.5% per annum of the Fund’s market capitalisation and borrowing facilities and a pro rata portion is payable on a monthly basis. The market capitalisation is based on the closing bid price of the units as quoted on the JSE Limited.

40 CAPITAL PROPERTY FUND AnnuAl RePoRt 2010 AnnuAl RePoRt 2010 CAPITAL PROPERTY FUND 41 40 CAPITAL PROPERTY FUND AnnuAl RePoRt 2010 AnnuAl RePoRt 2010 CAPITAL PROPERTY FUND 41
GROUP FUND
2010 2009 2010 2009 R’000 R’000 R’000 R’000
13 INCOME TAX EXPENSE
South African normal tax
– Income tax – (70) – –
– Deferred tax (11 143) (8 350) – –
(11 143) (8 420) – –
RECONCILIATION OF TAX RATE
Standard tax rate 28,00% 28,00% 28,00% 28,00%
Capital gains tax differential – 0,26% – –
Deferred tax rate differential (5,90%) 1,60% – –
Exempt income and other (20,97%) (28,59%) (28,00%) (28,00%)
Effective tax rate 1,13% 1,27% – –
GROUP
2010 2009 R’000 R’000
14 RECONCILIATION OF PROFIT FOR THE YEAR TO HEADLINE EARNINGS
AND DISTRIBUTABLE INCOME
Profit for the year attributable to equity holders 976 444 654 971
Adjusted for: (433 962) (122 411)
– Fair value gain on investment property (467 247) (144 433)
– Fair value adjustment resulting from straight-lining of rental revenue 16 348 13 602
– Impairment of subsidiary loans 319 –
– Income tax expense 16 618 8 420
Headline earnings 542 482 532 560
Headline earnings per unit (cents)* 75,60 79,69
Reconciliation of profit for the year to amount available for distribution
Profit for the year attributable to equity holders 976 444 654 971
Straight-lining of rental revenue adjustment (16 348) (13 602)
Fair value gain on investment property (467 247) (144 433)
Fair value adjustment resulting from straight-lining of rental revenue 16 348 13 602
Fair value gain on investments (113 569) (162 367)
Impairment of subsidiary loans 319 –
Profit from associate – (429)
Fair value adjustment on interest rate derivatives 24 461 10 125
Income tax expense 11 143 8 420
Distributable income 431 551 366 287
Distribution declared 431 551 366 287
Interim 203 505 159 194
Final 228 046 207 093
Basic earnings per unit is 136,07 cents (2009: 98,01 cents). The calculation of the basic earnings per unit is based on a weighted
average number of units in issue during the year of 717 578 059 (2009: 668 263 543) and earnings of R976,444 million
(2009: R654,971 million).
Headline earnings per unit is 75,60 cents (2009: 79,69 cents). The calculation of headline earnings per unit is based on a weighted
average number of units in issue during the year of 717 578 059 (2009: 668 263 543) and headline earnings of R542,482 million
(2009: R532,560 million).
*The Fund has no dilutionary instruments in issue
notes to the annUal financial statements (continUed)
for the year ended 31 D ecemb er 2010
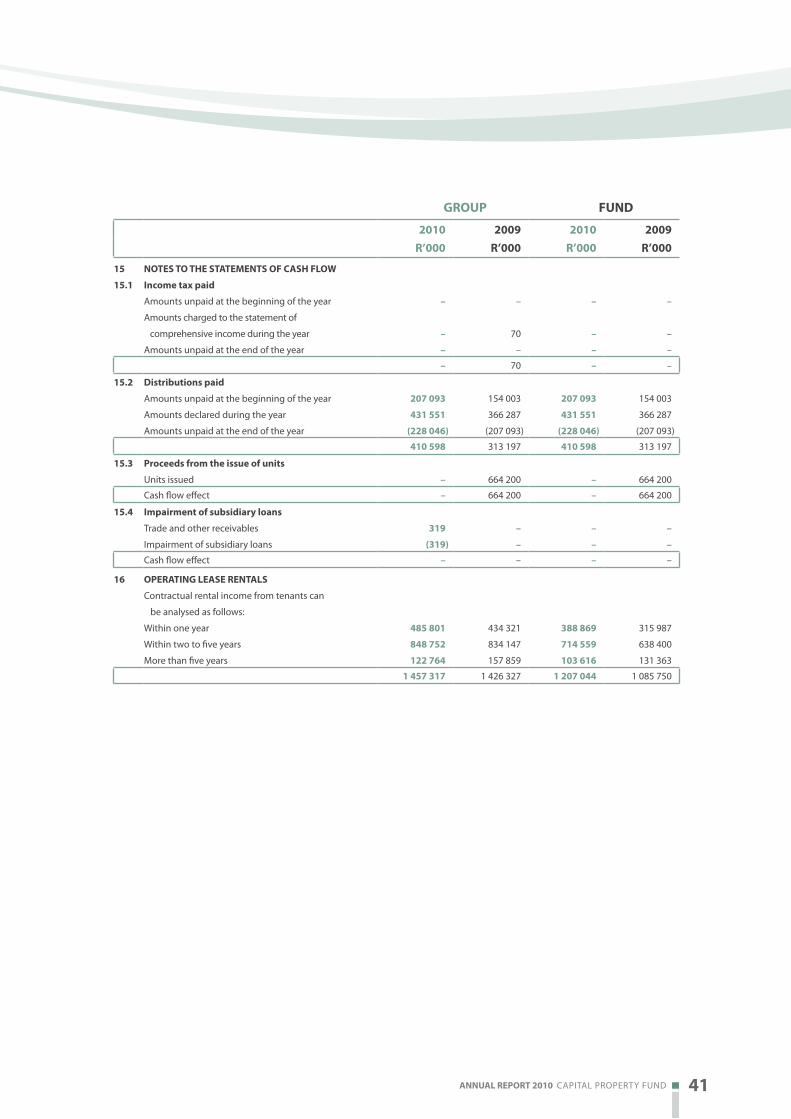
40 CAPITAL PROPERTY FUND AnnuAl RePoRt 2010 AnnuAl RePoRt 2010 CAPITAL PROPERTY FUND 41 40 CAPITAL PROPERTY FUND AnnuAl RePoRt 2010 AnnuAl RePoRt 2010 CAPITAL PROPERTY FUND 41
GROUP FUND
2010 2009 2010 2009 R’000 R’000 R’000 R’000
15 NOTES TO THE STATEMENTS OF CASH FLOW
15.1 Income tax paid
Amounts unpaid at the beginning of the year – – – –
Amounts charged to the statement of
comprehensive income during the year – 70 – –
Amounts unpaid at the end of the year – – – –
– 70 – –
15.2 Distributions paid
Amounts unpaid at the beginning of the year 207 093 154 003 207 093 154 003
Amounts declared during the year 431 551 366 287 431 551 366 287
Amounts unpaid at the end of the year (228 046) (207 093) (228 046) (207 093)
410 598 313 197 410 598 313 197
15.3 Proceeds from the issue of units
Units issued – 664 200 – 664 200
Cash flow effect – 664 200 – 664 200
15.4 Impairment of subsidiary loans
Trade and other receivables 319 – – –
Impairment of subsidiary loans (319) – – –
Cash flow effect – – – –
16 OPERATING LEASE RENTALS
Contractual rental income from tenants can
be analysed as follows:
Within one year 485 801 434 321 388 869 315 987
Within two to five years 848 752 834 147 714 559 638 400
More than five years 122 764 157 859 103 616 131 363
1 457 317 1 426 327 1 207 044 1 085 750
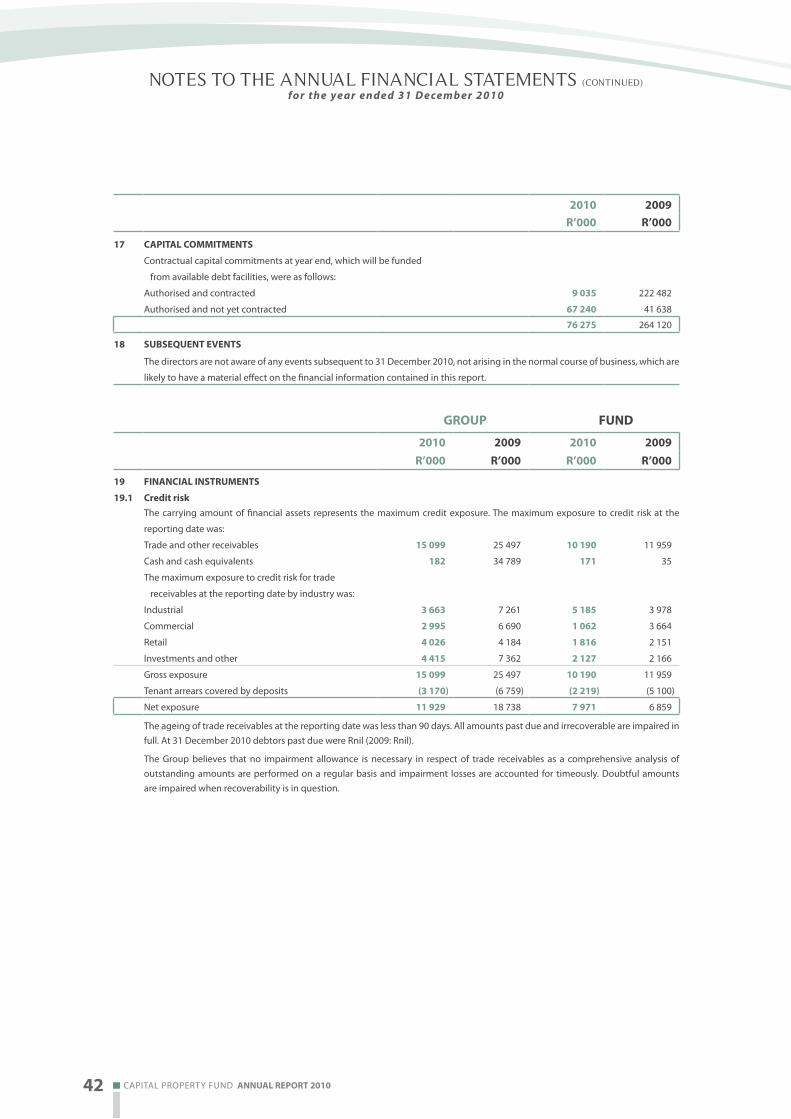
42 CAPITAL PROPERTY FUND AnnuAl RePoRt 2010 AnnuAl RePoRt 2010 CAPITAL PROPERTY FUND 43 42 CAPITAL PROPERTY FUND AnnuAl RePoRt 2010 AnnuAl RePoRt 2010 CAPITAL PROPERTY FUND 43
2010 2009 R’000 R’000
17 CAPITAL COMMITMENTS
Contractual capital commitments at year end, which will be funded
from available debt facilities, were as follows:
Authorised and contracted 9 035 222 482
Authorised and not yet contracted 67 240 41 638
76 275 264 120
18 SUBSEQUENT EVENTS
The directors are not aware of any events subsequent to 31 December 2010, not arising in the normal course of business, which are
likely to have a material effect on the financial information contained in this report.
GROUP FUND
2010 2009 2010 2009 R’000 R’000 R’000 R’000
19 FINANCIAL INSTRUMENTS
19.1 Credit riskThe carrying amount of financial assets represents the maximum credit exposure. The maximum exposure to credit risk at the
reporting date was:
Trade and other receivables 15 099 25 497 10 190 11 959
Cash and cash equivalents 182 34 789 171 35
The maximum exposure to credit risk for trade
receivables at the reporting date by industry was:
Industrial 3 663 7 261 5 185 3 978
Commercial 2 995 6 690 1 062 3 664
Retail 4 026 4 184 1 816 2 151
Investments and other 4 415 7 362 2 127 2 166
Gross exposure 15 099 25 497 10 190 11 959
Tenant arrears covered by deposits (3 170) (6 759) (2 219) (5 100)
Net exposure 11 929 18 738 7 971 6 859
The ageing of trade receivables at the reporting date was less than 90 days. All amounts past due and irrecoverable are impaired in full. At 31 December 2010 debtors past due were Rnil (2009: Rnil).
The Group believes that no impairment allowance is necessary in respect of trade receivables as a comprehensive analysis of outstanding amounts are performed on a regular basis and impairment losses are accounted for timeously. Doubtful amounts are impaired when recoverability is in question.
notes to the annUal financial statements (continUed)
for the year ended 31 D ecemb er 2010

42 CAPITAL PROPERTY FUND AnnuAl RePoRt 2010 AnnuAl RePoRt 2010 CAPITAL PROPERTY FUND 43 42 CAPITAL PROPERTY FUND AnnuAl RePoRt 2010 AnnuAl RePoRt 2010 CAPITAL PROPERTY FUND 43
19.2 Liquidity riskThe maturity of the undiscounted contractual financial liabilities excluding the impact of netting agreements are as follows:
1 – 12 months 1 – 2 years 2 – 5 yearsGROUP R’000 R’000 R’000
2010Non-derivative financial liabilities
Secured bank loans – capital 629 812 484 724 207 324
Secured bank loans – interest 2 517 897 836
Trade and other payables 163 555
Bank overdraft 32 192
Derivative financial liabilities
Interest rate derivative creditor 31 127
2009Secured bank loans – capital 425 602 613 154
Secured bank loans – interest 15 209
Trade and other payables 71 373
Bank overdraft 9 612
Derivative financial liabilities
Interest rate derivative creditor 7 359
FUND
2010Non-derivative financial liabilities
Secured bank loans – capital 629 812 112 112 207 324
Secured bank loans – interest 2 517 780 836
Trade and other payables 139 356
Bank overdraft 31 913
Derivative financial liabilities
Interest rate derivative creditor 31 127
2009Secured bank loans – capital 425 602 251 154
Secured bank loans – interest 2 859
Trade and other payables 49 602
Bank overdraft 9 612
Derivative financial liabilities
Interest rate derivative creditor 7 122
Cash flows are monitored on a regular basis to ensure that cash resources are adequate to meet funding requirements.

44 CAPITAL PROPERTY FUND AnnuAl RePoRt 2010 AnnuAl RePoRt 2010 CAPITAL PROPERTY FUND 45 44 CAPITAL PROPERTY FUND AnnuAl RePoRt 2010 AnnuAl RePoRt 2010 CAPITAL PROPERTY FUND 45
GROUP
2010 2009R’000 R’000
Permitted borrowings for the Group
Value of property portfolio 6 178 411 5 231 549
60% (2009: 30%) of portfolio value 3 707 047 1 569 465
Total borrowings (1 358 120) (1 063 577)
Unutilised borrowing capacity 2 348 927 505 888
19.3 Interest rate risk
The Group adopts a policy of ensuring that at least 50% of its exposure to interest rates on borrowings is hedged.
Details of existing interest rate derivatives are:
Nominal FairSwap amount Swap value
GROUP 2010 maturity R’000 rate R’000Feb 11 100 000 7,85% (316)
May 11 100 000 7,68% (750)
Dec 11 50 000 8,29% (1 292)
Feb 13 100 000 8,18% (4 330)
Dec 13 100 000 8,02% (4 522)
May 14 50 000 8,67% (3 215)
May 14 100 000 8,60% (6 215)
Aug 14 100 000 7,15% (1 670)
Jul 15 100 000 7,50% (2 050)
Dec 15 100 000 7,85% (3 203)
Dec 16 200 000 7,50% (1 705)
Dec 17 200 000 7,66% (1 829)
Nominal FairSwap amount Swap value
FUND 2010 maturity R’000 rate R’000Feb 11 100 000 7,85% (316)
May 11 100 000 7,68% (750)
Dec 11 50 000 8,29% (1 292)
Feb 13 100 000 8,18% (4 330)
Dec 13 100 000 8,02% (4 522)
May 14 50 000 8,67% (3 215)
May 14 100 000 8,60% (6 215)
Aug 14 100 000 7,15% (1 670)
Jul 15 100 000 7,50% (2 050)
Dec 15 100 000 7,85% (3 203)
Dec 16 200 000 7,50% (1 705)
Dec 17 200 000 7,66% (1 829)
notes to the annUal financial statements (continUed)
for the year ended 31 D ecemb er 2010

44 CAPITAL PROPERTY FUND AnnuAl RePoRt 2010 AnnuAl RePoRt 2010 CAPITAL PROPERTY FUND 45 44 CAPITAL PROPERTY FUND AnnuAl RePoRt 2010 AnnuAl RePoRt 2010 CAPITAL PROPERTY FUND 45
Nominal FairSwap amount Swap value
GROUP 2009 maturity R’000 rate R’000May 10 45 600 8,67% (299)
Oct 10 50 000 9,19% (1 012)
Feb 11 100 000 7,85% (773)
May 11 100 000 7,68% (598)
Dec 11 50 000 8,29% (704)
Dec 11 50 000 8,53% (896)
Feb 12 50 000 8,04% (412)
Feb 13 100 000 8,18% (411)
Oct 13 50 000 9,47% (2 097)
May 14 100 000 8,595% (847)
May 14 50 000 8,67% (563)
Aug 15 50 000 8,39% 427
Nominal FairSwap amount Swap value
FUND 2009 maturity R’000 rate R’000Oct 10 50 000 9,19% (1 012)
Feb 11 100 000 7,85% (773)
May 11 100 000 7,68% (598)
Dec 11 50 000 8,29% (704)
Dec 11 50 000 8,53% (896)
Feb 12 50 000 8,04% (412)
Feb 13 100 000 8,18% (411)
Oct 13 50 000 9,47% (2 097)
May 14 100 000 8,595% (847)
May 14 50 000 8,67% (563)
Aug 15 50 000 8,39% 427
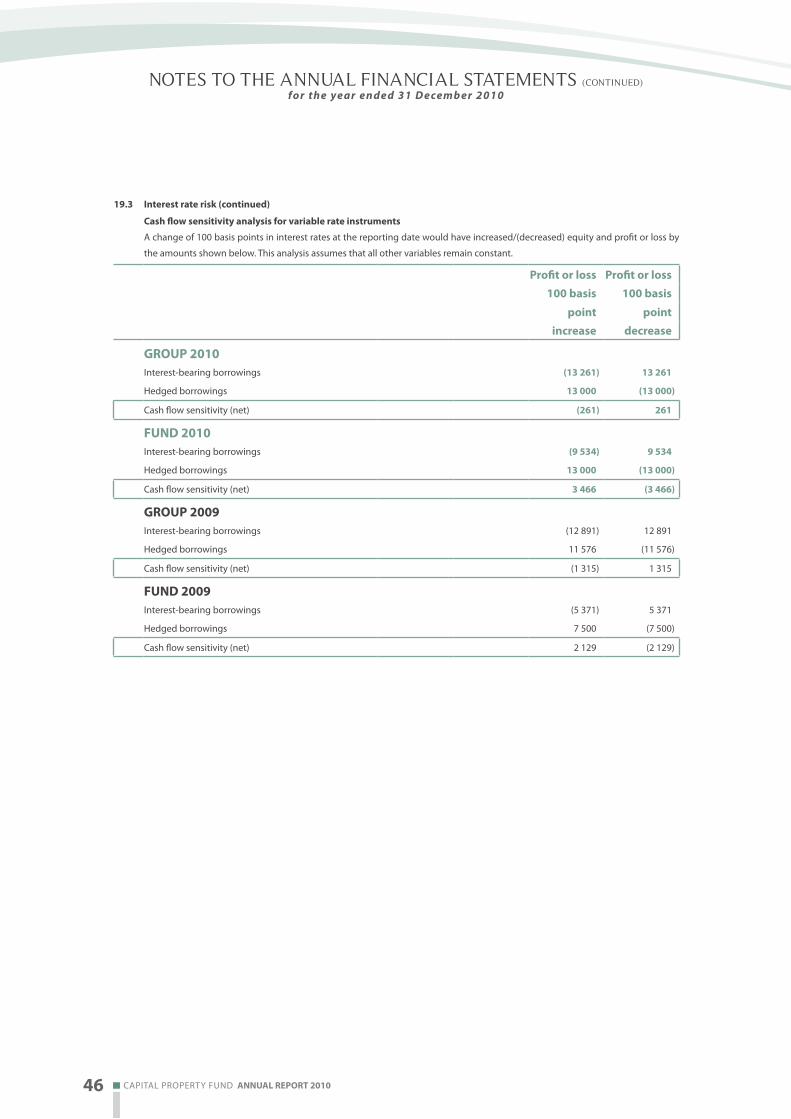
46 CAPITAL PROPERTY FUND AnnuAl RePoRt 2010 AnnuAl RePoRt 2010 CAPITAL PROPERTY FUND 47 46 CAPITAL PROPERTY FUND AnnuAl RePoRt 2010 AnnuAl RePoRt 2010 CAPITAL PROPERTY FUND 47
19.3 Interest rate risk (continued)
Cash flow sensitivity analysis for variable rate instruments
A change of 100 basis points in interest rates at the reporting date would have increased/(decreased) equity and profit or loss by
the amounts shown below. This analysis assumes that all other variables remain constant.
Profit or loss Profit or loss100 basis 100 basis
point pointincrease decrease
GROUP 2010Interest-bearing borrowings (13 261) 13 261
Hedged borrowings 13 000 (13 000)
Cash flow sensitivity (net) (261) 261
FUND 2010Interest-bearing borrowings (9 534) 9 534
Hedged borrowings 13 000 (13 000)
Cash flow sensitivity (net) 3 466 (3 466)
GROUP 2009Interest-bearing borrowings (12 891) 12 891
Hedged borrowings 11 576 (11 576)
Cash flow sensitivity (net) (1 315) 1 315
FUND 2009Interest-bearing borrowings (5 371) 5 371
Hedged borrowings 7 500 (7 500)
Cash flow sensitivity (net) 2 129 (2 129)
notes to the annUal financial statements (continUed)
for the year ended 31 D ecemb er 2010

46 CAPITAL PROPERTY FUND AnnuAl RePoRt 2010 AnnuAl RePoRt 2010 CAPITAL PROPERTY FUND 47 46 CAPITAL PROPERTY FUND AnnuAl RePoRt 2010 AnnuAl RePoRt 2010 CAPITAL PROPERTY FUND 47
19.4 Fair value
The fair value of all financial instruments are substantially the same as the carrying amounts reflected on the statement of
financial position.
At Financialfair value Loans liabilities at Total
through and amortised carrying Fairprofit receivables cost amount value
and loss R’000 R’000 R’000 R’000GROUP 2010Cash and cash equivalents – 182 – 182 182 Bank overdraft – (32 192) – (32 192) (32 192)Interest-bearing borrowings – – (1 326 110) (1 326 110) (1 326 110)Trade and other receivables – 15 069 – 15 069 15 069 Interest rate derivative debtor – level 2 30 – – 30 30 Interest rate derivative creditor – level 2 (31 127) – – (31 127) (31 127)Trade and other payables and unitholders for distribution – – (391 601) (391 601) (391 601)Investments – level 1 944 433 – – 944 433 944 433
913 336 (16 941) (1 717 711) (821 316) (821 316)
FUND 2010Cash and cash equivalents – 171 – 171 171 Bank overdraft – (31 913) – (31 913) (31 913)Interest-bearing borrowings – – (953 381) (953 381) (953 381)Trade and other receivables – 10 160 – 10 160 10 160 Interest rate derivative debtor – level 2 30 – – 30 30 Interest rate derivative creditor – level 2 (31 127) – – (31 127) (31 127)Trade and other payables and unitholders for distribution – – (367 402) (367 402) (367 402)Investments – level 1 944 433 – – 944 433 944 433
913 336 (21 582) (1 320 783) (429 029) (429 029)
GROUP 2009Cash and cash equivalents – 34 789 – 34 789 34 789 Bank overdraft – (9 612) – (9 612) (9 612)Interest-bearing borrowings – – (1 053 965) (1 053 965) (1 053 965)Trade and other receivables – 24 773 – 24 773 24 773 Interest rate derivative debtor – level 2 724 – – 724 724 Interest rate derivative creditor – level 2 (7 359) – – (7 359) (7 359)Trade and other payables and unitholders for distribution – – (278 466) (278 466) (278 466)Investments – level 1 858 626 – – 858 626 858 626
851 991 49 950 (1 332 431) (430 490) (430 490)
FUND 2009Cash and cash equivalents – 35 – 35 35 Bank overdraft – (9 612) – (9 612) (9 612)Interest-bearing borrowings – – (679 615) (679 615) (679 615)Trade and other receivables – 11 235 – 11 235 11 235 Interest rate derivative debtor – level 2 724 – – 724 724 Interest rate derivative creditor – level 2 (7 122) – – (7 122) (7 122)Trade and other payables and unitholders for distribution – – (256 695) (256 695) (256 695)Investments – level 1 858 626 – – 858 626 858 626
852 228 1 658 (936 310) (82 424) (82 424)

48 CAPITAL PROPERTY FUND AnnuAl RePoRt 2010 AnnuAl RePoRt 2010 CAPITAL PROPERTY FUND 49 48 CAPITAL PROPERTY FUND AnnuAl RePoRt 2010 AnnuAl RePoRt 2010 CAPITAL PROPERTY FUND 49
20 ACCOUNTING ESTIMATES AND JUDGEMENTS
Management discusses with the audit committee the development, selection and disclosure of the Group’s critical accounting
policies and estimates, and the application of these policies and estimates. The revaluation of investment property requires
judgement in the determination of an appropriate capitalisation rate. Changes in the capitalisation rate attributable to changes
in market conditions can have a significant impact on property valuations. The impairment of tenant arrears requires judgement
as to the recoverability of the arrears.
21 RELATED PARTY TRANSACTIONS
Parent entity
The holding entity of the subsidiaries is Capital Property Fund.
Identity of related parties with whom material transactions have occurred
The subsidiaries of the Fund are identified in note 5 of these financial statements. These entities are related parties of the Fund.
PFM is the management company of the Fund in terms of the Collective Investment Schemes Control Act.
Resilient, the owner of PFM, owns a significant number of units in the Fund.
The Fund owns 20% of the property known as N1 Business Park and has a joint operations agreement with Imbali Props 7
(Proprietary) Limited, which owns 60% of N1 Business Park, to develop this property. Jorge da Costa, who is an independent non-
executive director of PFM has a 25% interest in Imbali Props 7 (Proprietary) Limited.
The Fund owns 25% of the property known as Montague Business Park and has a joint operations agreement with Imbali Props 7
(Proprietary) Limited, which owns 50% of Montague Business Park, to develop this property. Jorge da Costa, who is an independent
non-executive director of PFM has a 25% interest in Imbali Props 7 (Proprietary) Limited.
GROUP FUND
2010 2009 2010 2009 R’000 R’000 R’000 R’000
Management company
Asset management fee paid to PFM 33 248 26 223 33 248 26 223
Unit creation fee paid to PFM – 295 – 295
Material related party transactions
Subsidiaries
Loans to/from subsidiaries (refer note 5)
notes to the annUal financial statements (continUed)
for the year ended 31 D ecemb er 2010

48 CAPITAL PROPERTY FUND AnnuAl RePoRt 2010 AnnuAl RePoRt 2010 CAPITAL PROPERTY FUND 49 48 CAPITAL PROPERTY FUND AnnuAl RePoRt 2010 AnnuAl RePoRt 2010 CAPITAL PROPERTY FUND 49
22 STANDARDS AND INTERPRETATIONS NOT YET EFFECTIVE
Standard
Details of Amendment
Annual periodsbeginningon or after
IFRS 3: Business Combinations Transition requirements for contingent consideration from a business •combination that occurred before the effective date of the revised IFRS. 1 January 2011
Measurement of non-controlling interests.• 1 January 2011
Un-replaced and voluntarily replaced share-based payment awards.• 1 January 2011
Amendments require additional disclosure on transfer transactions of •financial assets, including the possible effects of any residual risks that the transferring entity retains. The amendments also require additional disclosures if a disproportionate amount of transfer transactions are undertaken around the end of a reporting period. 7 January 2011
IFRS 7: Financial Instruments: Disclosures
Clarification of disclosures.•1 January 2011
Additional disclosure on transfer transactions of financial assets.• 7 January 2011
IFRS 9: Financial Instruments New standard that forms the first part of a three part project to replace •IAS 39 Financial Instruments: Recognition and Measurement. 1 January 2013
IAS 1: Presentation of Financial Statements
Clarification of statement of changes in equity.•1 January 2011
IAS 24: Related Party Disclosure
Simplification of the disclosure requirements for government •related entities. 1 January 2011
IAS 34: Interim Financial Reporting
Clarification of the definition of related party.• 1 January 2011
Significant events and transactions.• 1 January 2011
Interpretations
Annual periods beginning on or after
IFRIC 19: Extinguishing Financial Liabilities with Equity Instruments 4 January 2010
Management estimates that the adoption of these standards and interpretations will not significantly impact the financial statements.

50 CAPITAL PROPERTY FUND AnnuAl RePoRt 2010 AnnuAl RePoRt 2010 CAPITAL PROPERTY FUND 51 50 CAPITAL PROPERTY FUND AnnuAl RePoRt 2010 AnnuAl RePoRt 2010 CAPITAL PROPERTY FUND 51
schedUle of properties
Property name
Address
Province
Sector
GLA
(m2)
Valuation
(R’000)
Purchase price
(R’000)
Effective date of acquisition
Rental per m2
(R)
Vacancy
1 Grand Central Cnr Darling and Plein Streets Cape Town Western Cape Retail/Commercial 33 616 398 000 159 000 Aug 2004 95
2 Long Street Cape Town 2 Long Street Cape Town Western Cape Commercial 23 295 322 000 59 000 Jan 2003 96 14%
3 Isando Business ParkCnr Andre Greyvenstein Avenue and Hulley Road and Vanacht
Street and 14 Skietlood Street Kempton ParkGauteng Industrial 56 606 251 000 256 000 Aug 2009 42 20%
4 Monyetla Office Park Inyanga Close Sunninghill Gauteng Commercial 17 535 243 000 217 000 Dec 2008 103 1%
5 City Deep Industrial Park Cnr Outspan Road and Fortune Street Johannesburg Gauteng Industrial 61 608 237 000 191 000 Aug 2009 34
6 Leeuwkop Road Cnr Simba and Leeuwkop Road Sunninghill Gauteng Commercial 11 747 148 000 120 247 Nov 2006 and Aug 2007 100
7 Cullinan Office Park 2 Cullinan Place Morningside Gauteng Commercial 9 227 140 400 116 000 Oct 2009 96
8 Nokia Siemens Networks Oak Avenue Highveld Business Park Centurion Gauteng Commercial 11 700 138 000 121 000 Oct 2007 92
9 Wedgewood Office Park 3 Muswell Road Bryanston Gauteng Commercial 9 625 131 300 110 500 Dec 2008 105
10 PricewaterhouseCoopers Pretoria Ida Street Menlo Park Gauteng Commercial 6 405 124 300 39 636 Dec 2000 133
11 Mutsindo Mall & Capricorn Plaza Post Office Street Thohoyandou Limpopo Retail 12 330 123 000 65 250 Sep 2005 and Aug 2006 85
12 3 - 4 Drakensberg Drive Longmeadow 3 - 4 Drakensberg Drive Longmeadow Gauteng Industrial 15 614 109 000 107 666 Feb 2010 54
13 Surprise Park Pinetown Surprise Road Pinetown KwaZulu-Natal Industrial 25 333 103 200 13 000 Aug 2004 35
14 Medscheme 37 Conrad Drive Constantia Kloof Gauteng Commercial 6 792 101 000 74 777 Dec 2006 120
15 31 Jeffels Road Prospecton 31 Jeffels Road Prospecton KwaZulu-Natal Industrial 20 045 96 700 94 000 Dec 2010 38
16 11 Fitzmaurice Epping 11 Fitzmaurice Epping Western Cape Industrial 17 631 92 400 23 000 Aug 2004 45
17 11 Naivasha Road 11 Naivasha Road Sunninghill Gauteng Commercial 6 659 88 600 50 323 Nov 2006 96
18 15th Road Midrand 15th Road Midrand Gauteng Industrial 14 308 86 400 24 640 Aug 2004 46
19 Caxton House East London 35 Terminus Street East London Eastern Cape Commercial 10 275 85 700 21 566 Aug 2004 71
20 Mahogany Road 19 – 21 Sugarbush Crescent Mahogany Ridge Pinetown KwaZulu-Natal Industrial 16 209 82 000 65 000 May 2009 43
21 114 Dennis Road Athol Gardens 114 Dennis Road Athol Gardens Gauteng Commercial 5 736 79 000 57 200 Dec 2008 88
22 Chemserve Spartan 3 Johann Birkart Road Kempton Park Gauteng Industrial 14 556 78 400 67 500 Aug 2009 41
23 Parc Nicol 3001 William Nicol Drive Bryanston Gauteng Commercial 5 606 74 600 67 300 Dec 2008 120 13%
24 City Deep Hi-Tech Outspan Road City Deep Gauteng Industrial 18 125 70 800 46 000 Sep 2007 34

50 CAPITAL PROPERTY FUND AnnuAl RePoRt 2010 AnnuAl RePoRt 2010 CAPITAL PROPERTY FUND 51 50 CAPITAL PROPERTY FUND AnnuAl RePoRt 2010 AnnuAl RePoRt 2010 CAPITAL PROPERTY FUND 51
Property name
Address
Province
Sector
GLA
(m2)
Valuation
(R’000)
Purchase price
(R’000)
Effective date of acquisition
Rental per m2
(R)
Vacancy
1 Grand Central Cnr Darling and Plein Streets Cape Town Western Cape Retail/Commercial 33 616 398 000 159 000 Aug 2004 95
2 Long Street Cape Town 2 Long Street Cape Town Western Cape Commercial 23 295 322 000 59 000 Jan 2003 96 14%
3 Isando Business ParkCnr Andre Greyvenstein Avenue and Hulley Road and Vanacht
Street and 14 Skietlood Street Kempton ParkGauteng Industrial 56 606 251 000 256 000 Aug 2009 42 20%
4 Monyetla Office Park Inyanga Close Sunninghill Gauteng Commercial 17 535 243 000 217 000 Dec 2008 103 1%
5 City Deep Industrial Park Cnr Outspan Road and Fortune Street Johannesburg Gauteng Industrial 61 608 237 000 191 000 Aug 2009 34
6 Leeuwkop Road Cnr Simba and Leeuwkop Road Sunninghill Gauteng Commercial 11 747 148 000 120 247 Nov 2006 and Aug 2007 100
7 Cullinan Office Park 2 Cullinan Place Morningside Gauteng Commercial 9 227 140 400 116 000 Oct 2009 96
8 Nokia Siemens Networks Oak Avenue Highveld Business Park Centurion Gauteng Commercial 11 700 138 000 121 000 Oct 2007 92
9 Wedgewood Office Park 3 Muswell Road Bryanston Gauteng Commercial 9 625 131 300 110 500 Dec 2008 105
10 PricewaterhouseCoopers Pretoria Ida Street Menlo Park Gauteng Commercial 6 405 124 300 39 636 Dec 2000 133
11 Mutsindo Mall & Capricorn Plaza Post Office Street Thohoyandou Limpopo Retail 12 330 123 000 65 250 Sep 2005 and Aug 2006 85
12 3 - 4 Drakensberg Drive Longmeadow 3 - 4 Drakensberg Drive Longmeadow Gauteng Industrial 15 614 109 000 107 666 Feb 2010 54
13 Surprise Park Pinetown Surprise Road Pinetown KwaZulu-Natal Industrial 25 333 103 200 13 000 Aug 2004 35
14 Medscheme 37 Conrad Drive Constantia Kloof Gauteng Commercial 6 792 101 000 74 777 Dec 2006 120
15 31 Jeffels Road Prospecton 31 Jeffels Road Prospecton KwaZulu-Natal Industrial 20 045 96 700 94 000 Dec 2010 38
16 11 Fitzmaurice Epping 11 Fitzmaurice Epping Western Cape Industrial 17 631 92 400 23 000 Aug 2004 45
17 11 Naivasha Road 11 Naivasha Road Sunninghill Gauteng Commercial 6 659 88 600 50 323 Nov 2006 96
18 15th Road Midrand 15th Road Midrand Gauteng Industrial 14 308 86 400 24 640 Aug 2004 46
19 Caxton House East London 35 Terminus Street East London Eastern Cape Commercial 10 275 85 700 21 566 Aug 2004 71
20 Mahogany Road 19 – 21 Sugarbush Crescent Mahogany Ridge Pinetown KwaZulu-Natal Industrial 16 209 82 000 65 000 May 2009 43
21 114 Dennis Road Athol Gardens 114 Dennis Road Athol Gardens Gauteng Commercial 5 736 79 000 57 200 Dec 2008 88
22 Chemserve Spartan 3 Johann Birkart Road Kempton Park Gauteng Industrial 14 556 78 400 67 500 Aug 2009 41
23 Parc Nicol 3001 William Nicol Drive Bryanston Gauteng Commercial 5 606 74 600 67 300 Dec 2008 120 13%
24 City Deep Hi-Tech Outspan Road City Deep Gauteng Industrial 18 125 70 800 46 000 Sep 2007 34

52 CAPITAL PROPERTY FUND AnnuAl RePoRt 2010 AnnuAl RePoRt 2010 CAPITAL PROPERTY FUND 53 52 CAPITAL PROPERTY FUND AnnuAl RePoRt 2010 AnnuAl RePoRt 2010 CAPITAL PROPERTY FUND 53
schedUle of properties (continUed)
25 28 On Sloane 28 Sloane Street Bryanston Gauteng Commercial 4 681 69 000 56 000 Oct 2009 117
26 West Street Durban 336 – 342 West Street Durban KwaZulu-Natal Retail 6 202 67 800 18 912 Aug 2004 87
27 Corporate Park North Roan Crescent Corporate Park North Midrand Gauteng Industrial 11 402 65 300 33 466 Mar 2006 42
28 Shoprite Centre Pretoria North Cnr B Viljoen and DF Malan Streets Pretoria North Gauteng Retail 6 442 62 900 29 000 Aug 2004 63
29 Platinum Road Platinum Road Longmeadow Gauteng Industrial 7 386 61 500 50 519 Jun 2007 63
30 Harries Street Germiston Cnr Harries and Sigma Roads Germiston South Gauteng Industrial 17 592 60 400 24 000 Aug 2004 29
31 Otto Volek Road Pinetown 22 Otto Volek Road Pinetown KwaZulu-Natal Industrial 18 296 60 000 16 557 Aug 2004 31 21%
32 19 Girton Road Parktown 19 Girton Road Parktown Gauteng Commercial 7 384 59 800 47 000 Dec 2008 70
33 Culross Court Bryanston 16 Culross Road Bryanston Gauteng Commercial 4 070 58 000 45 000 Dec 2008 104 1%
34 Centurion Office Park Hendrik Verwoerd Drive Centurion Gauteng Commercial 7 660 55 500 23 017 Aug 2004 75 24%
35 Tiger Moth Road Aeroton Cnr Tiger Moth and Guy Gibson Road Aeroton Gauteng Industrial 15 893 55 500 13 887 Jun 1993 28
36 Noursepack Epping II Nourse Avenue Epping Western Cape Industrial 17 486 55 500 6 591 Aug 1984 24
37 45 Angus Crescent 45 Angus Crescent Longmeadow Gauteng Industrial 7 985 52 800 40 068 Mar 2007 54
38 Westway Office Park Spine Road Westville KwaZulu-Natal Commercial 3 794 51 200 41 905 Nov 2010 97
39 Homeworld Centre Malibongwe Drive Randburg Gauteng Retail 6 582 51 000 27 000 Aug 2004 80 9%
40 Cambridge Manor Paulshof Witkoppen Road Paulshof Gauteng Commercial 7 016 50 400 49 000 Dec 2008 72 25%
41 Constantia View Office Park 2 Hogsback Road Quellerina Gauteng Commercial 5 210 49 800 48 500 Dec 2008 75 6%
42 Watt Road Uitenhage Watt Road Uitenhage Eastern Cape Industrial 23 370 49 500 45 300 Dec 2008 22
43 Appleton’s Malibongwe Drive Randburg Gauteng Retail 3 772 49 500 45 700 Dec 2008 138 11%
44 Cape Road Port Elizabeth Cnr Cape Road and Langenhoven Drive Port Elizabeth Eastern Cape Commercial 5 127 48 900 15 000 Aug 2004 80 4%
45 33 Angus Crescent 33 Angus Crescent Longmeadow Gauteng Industrial 7 503 48 100 43 514 Jun 2007 55
46 Blackheath Pavilion 309 Pendoring Road Blackheath Gauteng Retail 6 229 47 600 38 500 Dec 2008 79 4%
47 Howick Close Howick Close Midrand Gauteng Commercial 3 949 46 200 14 841 Aug 2004 88
48 4th Street Wynberg 4th Street Wynberg Gauteng Industrial 13 011 42 500 7 943 Aug 2004 29
Property name
Address
Province
Sector
GLA
(m2)
Valuation
(R’000)
Purchase price
(R’000)
Effective date of acquisition
Rental per m2
(R)
Vacancy

52 CAPITAL PROPERTY FUND AnnuAl RePoRt 2010 AnnuAl RePoRt 2010 CAPITAL PROPERTY FUND 53 52 CAPITAL PROPERTY FUND AnnuAl RePoRt 2010 AnnuAl RePoRt 2010 CAPITAL PROPERTY FUND 53
25 28 On Sloane 28 Sloane Street Bryanston Gauteng Commercial 4 681 69 000 56 000 Oct 2009 117
26 West Street Durban 336 – 342 West Street Durban KwaZulu-Natal Retail 6 202 67 800 18 912 Aug 2004 87
27 Corporate Park North Roan Crescent Corporate Park North Midrand Gauteng Industrial 11 402 65 300 33 466 Mar 2006 42
28 Shoprite Centre Pretoria North Cnr B Viljoen and DF Malan Streets Pretoria North Gauteng Retail 6 442 62 900 29 000 Aug 2004 63
29 Platinum Road Platinum Road Longmeadow Gauteng Industrial 7 386 61 500 50 519 Jun 2007 63
30 Harries Street Germiston Cnr Harries and Sigma Roads Germiston South Gauteng Industrial 17 592 60 400 24 000 Aug 2004 29
31 Otto Volek Road Pinetown 22 Otto Volek Road Pinetown KwaZulu-Natal Industrial 18 296 60 000 16 557 Aug 2004 31 21%
32 19 Girton Road Parktown 19 Girton Road Parktown Gauteng Commercial 7 384 59 800 47 000 Dec 2008 70
33 Culross Court Bryanston 16 Culross Road Bryanston Gauteng Commercial 4 070 58 000 45 000 Dec 2008 104 1%
34 Centurion Office Park Hendrik Verwoerd Drive Centurion Gauteng Commercial 7 660 55 500 23 017 Aug 2004 75 24%
35 Tiger Moth Road Aeroton Cnr Tiger Moth and Guy Gibson Road Aeroton Gauteng Industrial 15 893 55 500 13 887 Jun 1993 28
36 Noursepack Epping II Nourse Avenue Epping Western Cape Industrial 17 486 55 500 6 591 Aug 1984 24
37 45 Angus Crescent 45 Angus Crescent Longmeadow Gauteng Industrial 7 985 52 800 40 068 Mar 2007 54
38 Westway Office Park Spine Road Westville KwaZulu-Natal Commercial 3 794 51 200 41 905 Nov 2010 97
39 Homeworld Centre Malibongwe Drive Randburg Gauteng Retail 6 582 51 000 27 000 Aug 2004 80 9%
40 Cambridge Manor Paulshof Witkoppen Road Paulshof Gauteng Commercial 7 016 50 400 49 000 Dec 2008 72 25%
41 Constantia View Office Park 2 Hogsback Road Quellerina Gauteng Commercial 5 210 49 800 48 500 Dec 2008 75 6%
42 Watt Road Uitenhage Watt Road Uitenhage Eastern Cape Industrial 23 370 49 500 45 300 Dec 2008 22
43 Appleton’s Malibongwe Drive Randburg Gauteng Retail 3 772 49 500 45 700 Dec 2008 138 11%
44 Cape Road Port Elizabeth Cnr Cape Road and Langenhoven Drive Port Elizabeth Eastern Cape Commercial 5 127 48 900 15 000 Aug 2004 80 4%
45 33 Angus Crescent 33 Angus Crescent Longmeadow Gauteng Industrial 7 503 48 100 43 514 Jun 2007 55
46 Blackheath Pavilion 309 Pendoring Road Blackheath Gauteng Retail 6 229 47 600 38 500 Dec 2008 79 4%
47 Howick Close Howick Close Midrand Gauteng Commercial 3 949 46 200 14 841 Aug 2004 88
48 4th Street Wynberg 4th Street Wynberg Gauteng Industrial 13 011 42 500 7 943 Aug 2004 29
Property name
Address
Province
Sector
GLA
(m2)
Valuation
(R’000)
Purchase price
(R’000)
Effective date of acquisition
Rental per m2
(R)
Vacancy

54 CAPITAL PROPERTY FUND AnnuAl RePoRt 2010 AnnuAl RePoRt 2010 CAPITAL PROPERTY FUND 55 54 CAPITAL PROPERTY FUND AnnuAl RePoRt 2010 AnnuAl RePoRt 2010 CAPITAL PROPERTY FUND 55
49 9 Ayshire Avenue Longmeadow 9 Ayshire Avenue Longmeadow Gauteng Industrial 7 090 42 200 41 169 Feb 2010 45
50 N1 Business Park* N1 Highway Midrand Gauteng Industrial 26 488 41 140 16 912 Aug 2006 62 15%
51 Rigger Road Spartan 79 – 83 Rigger Road Spartan Gauteng Industrial 8 229 40 500 8 900 Aug 2004 45
52 Brands Hatch Close Cnr Indianapolis and Brands Hatch Close Kyalami Park Gauteng Industrial 6 597 39 100 26 890 Nov 2006 53
53 189 Monte Carlo Crescent Kyalami 189 Monte Carlo Crescent Kyalami Park Gauteng Commercial 5 212 39 000 28 800 Dec 2008 67
54 87 - 91 Goodwood Road 87 - 91 Goodwood Road Mahogany Ridge Pinetown KwaZulu-Natal Industrial 6 447 38 800 33 600 Oct 2010 45
55 Corporate Place Cape Town 17 Mispel Avenue Bellville Cape Town Western Cape Commercial 4 328 37 400 4 681 Feb 1996 71 18%
56 Westmead Road Pinetown 4 – 10 Westmead Road Westmead Pinetown KwaZulu-Natal Industrial 8 921 36 800 3 186 May 1988 37
57 Covora Road Covora Road Jet Park Gauteng Industrial 9 197 34 400 28 700 Jun 2007 35 7%
58 146 Serenade Road Rustivia 146 Serenade Road Rustivia Gauteng Industrial 4 400 34 400 30 519 Feb 2010 58
59 Standard Bank Crossing 1 Twilight Avenue Fourways Gauteng Commercial 2 194 31 300 13 900 Aug 2004 105
60 14 Fitzmaurice Avenue Epping 2 14 Fitzmaurice Avenue Epping 2 Western Cape Industrial 9 588 31 000 25 238 Nov 2010 26
61 31 Beacon Road Florida North 31 Beacon Road Florida North Gauteng Commercial 4 153 31 000 25 500 Dec 2008 65 24%
62 38 Reedbuck Crescent 38 Reedbuck Crescent Corporate Park Midrand Gauteng Industrial 6 143 30 300 18 103 Nov 2006 42
63 Director and Megawatt Road Cnr Director and Megawatt Road Spartan Gauteng Industrial 5 216 30 200 29 278 Jun 2007 47
64 Robertville Industrial Katrol Avenue Robertville Gauteng Industrial 9 137 29 300 10 137 Dec 2005 28
65 McCarthy Isando Industries Road Isando Gauteng Industrial 5 412 29 000 12 497 Jun 2007 40
66 357 Rivonia Boulevard 357 Rivonia Boulevard Edenburg Gauteng Commercial 3 640 28 400 23 000 Dec 2008 78 13%
67 Rutherfords Cnr Smit Street and Harris Street Industries West Germiston Gauteng Industrial 7 800 28 000 6 670 Aug 2004 26
68 Imperial Motors Strijdom Park Cnr Malibongwe Drive and Tungsten Road Randburg Gauteng Retail 2 104 26 500 12 350 Aug 2004 103
69 Ayshire Avenue Ayshire Avenue Longmeadow Gauteng Industrial 4 912 26 500 21 604 Mar 2007 42
70 Chelsea Office Park Rivonia 57 Wessels Road Rivonia Gauteng Commercial 3 633 26 400 26 000 Dec 2008 71 16%
71 Citrus Street Citrus Street Laser Park Gauteng Industrial 6 833 26 000 24 193 Jun 2007 38
72 Armstrong Road La Lucia 8 Torsvale and Armstrong Roads La Lucia KwaZulu-Natal Commercial 2 033 25 000 17 008 Nov 2006 93 22%
schedUle of properties (continUed)
Property name
Address
Province
Sector
GLA
(m2)
Valuation
(R’000)
Purchase price
(R’000)
Effective date of acquisition
Rental per m2
(R)
Vacancy
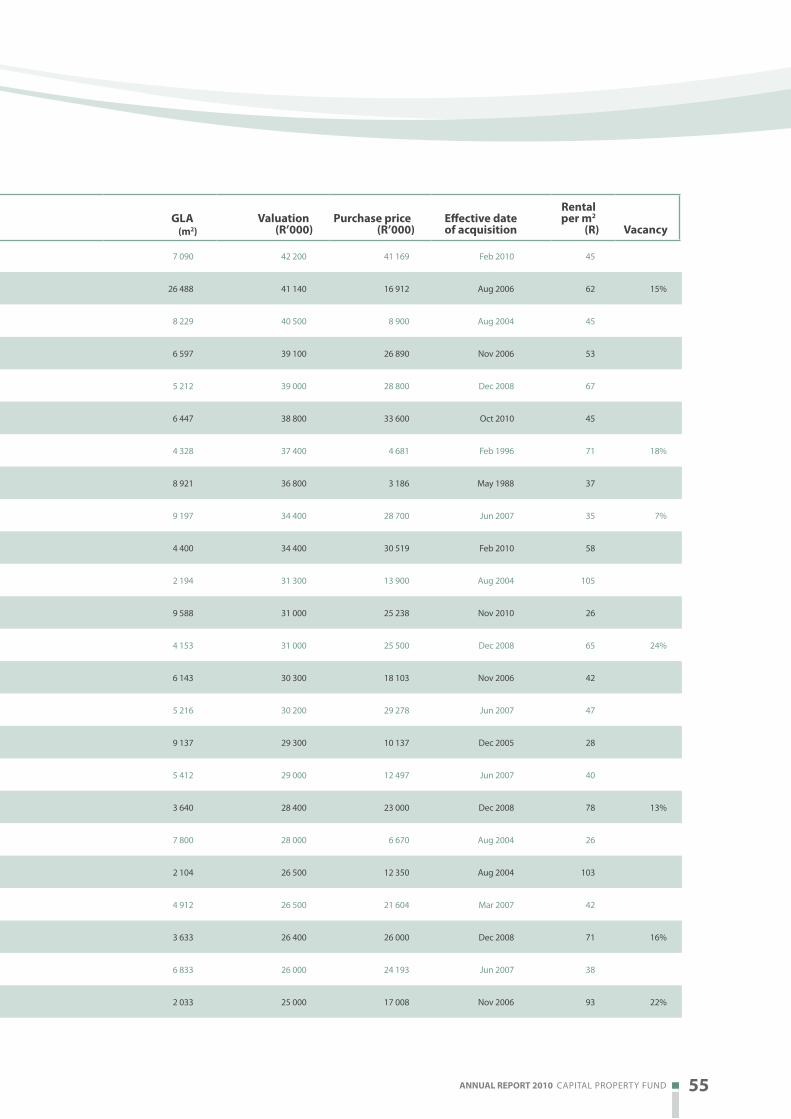
54 CAPITAL PROPERTY FUND AnnuAl RePoRt 2010 AnnuAl RePoRt 2010 CAPITAL PROPERTY FUND 55 54 CAPITAL PROPERTY FUND AnnuAl RePoRt 2010 AnnuAl RePoRt 2010 CAPITAL PROPERTY FUND 55
49 9 Ayshire Avenue Longmeadow 9 Ayshire Avenue Longmeadow Gauteng Industrial 7 090 42 200 41 169 Feb 2010 45
50 N1 Business Park* N1 Highway Midrand Gauteng Industrial 26 488 41 140 16 912 Aug 2006 62 15%
51 Rigger Road Spartan 79 – 83 Rigger Road Spartan Gauteng Industrial 8 229 40 500 8 900 Aug 2004 45
52 Brands Hatch Close Cnr Indianapolis and Brands Hatch Close Kyalami Park Gauteng Industrial 6 597 39 100 26 890 Nov 2006 53
53 189 Monte Carlo Crescent Kyalami 189 Monte Carlo Crescent Kyalami Park Gauteng Commercial 5 212 39 000 28 800 Dec 2008 67
54 87 - 91 Goodwood Road 87 - 91 Goodwood Road Mahogany Ridge Pinetown KwaZulu-Natal Industrial 6 447 38 800 33 600 Oct 2010 45
55 Corporate Place Cape Town 17 Mispel Avenue Bellville Cape Town Western Cape Commercial 4 328 37 400 4 681 Feb 1996 71 18%
56 Westmead Road Pinetown 4 – 10 Westmead Road Westmead Pinetown KwaZulu-Natal Industrial 8 921 36 800 3 186 May 1988 37
57 Covora Road Covora Road Jet Park Gauteng Industrial 9 197 34 400 28 700 Jun 2007 35 7%
58 146 Serenade Road Rustivia 146 Serenade Road Rustivia Gauteng Industrial 4 400 34 400 30 519 Feb 2010 58
59 Standard Bank Crossing 1 Twilight Avenue Fourways Gauteng Commercial 2 194 31 300 13 900 Aug 2004 105
60 14 Fitzmaurice Avenue Epping 2 14 Fitzmaurice Avenue Epping 2 Western Cape Industrial 9 588 31 000 25 238 Nov 2010 26
61 31 Beacon Road Florida North 31 Beacon Road Florida North Gauteng Commercial 4 153 31 000 25 500 Dec 2008 65 24%
62 38 Reedbuck Crescent 38 Reedbuck Crescent Corporate Park Midrand Gauteng Industrial 6 143 30 300 18 103 Nov 2006 42
63 Director and Megawatt Road Cnr Director and Megawatt Road Spartan Gauteng Industrial 5 216 30 200 29 278 Jun 2007 47
64 Robertville Industrial Katrol Avenue Robertville Gauteng Industrial 9 137 29 300 10 137 Dec 2005 28
65 McCarthy Isando Industries Road Isando Gauteng Industrial 5 412 29 000 12 497 Jun 2007 40
66 357 Rivonia Boulevard 357 Rivonia Boulevard Edenburg Gauteng Commercial 3 640 28 400 23 000 Dec 2008 78 13%
67 Rutherfords Cnr Smit Street and Harris Street Industries West Germiston Gauteng Industrial 7 800 28 000 6 670 Aug 2004 26
68 Imperial Motors Strijdom Park Cnr Malibongwe Drive and Tungsten Road Randburg Gauteng Retail 2 104 26 500 12 350 Aug 2004 103
69 Ayshire Avenue Ayshire Avenue Longmeadow Gauteng Industrial 4 912 26 500 21 604 Mar 2007 42
70 Chelsea Office Park Rivonia 57 Wessels Road Rivonia Gauteng Commercial 3 633 26 400 26 000 Dec 2008 71 16%
71 Citrus Street Citrus Street Laser Park Gauteng Industrial 6 833 26 000 24 193 Jun 2007 38
72 Armstrong Road La Lucia 8 Torsvale and Armstrong Roads La Lucia KwaZulu-Natal Commercial 2 033 25 000 17 008 Nov 2006 93 22%
Property name
Address
Province
Sector
GLA
(m2)
Valuation
(R’000)
Purchase price
(R’000)
Effective date of acquisition
Rental per m2
(R)
Vacancy
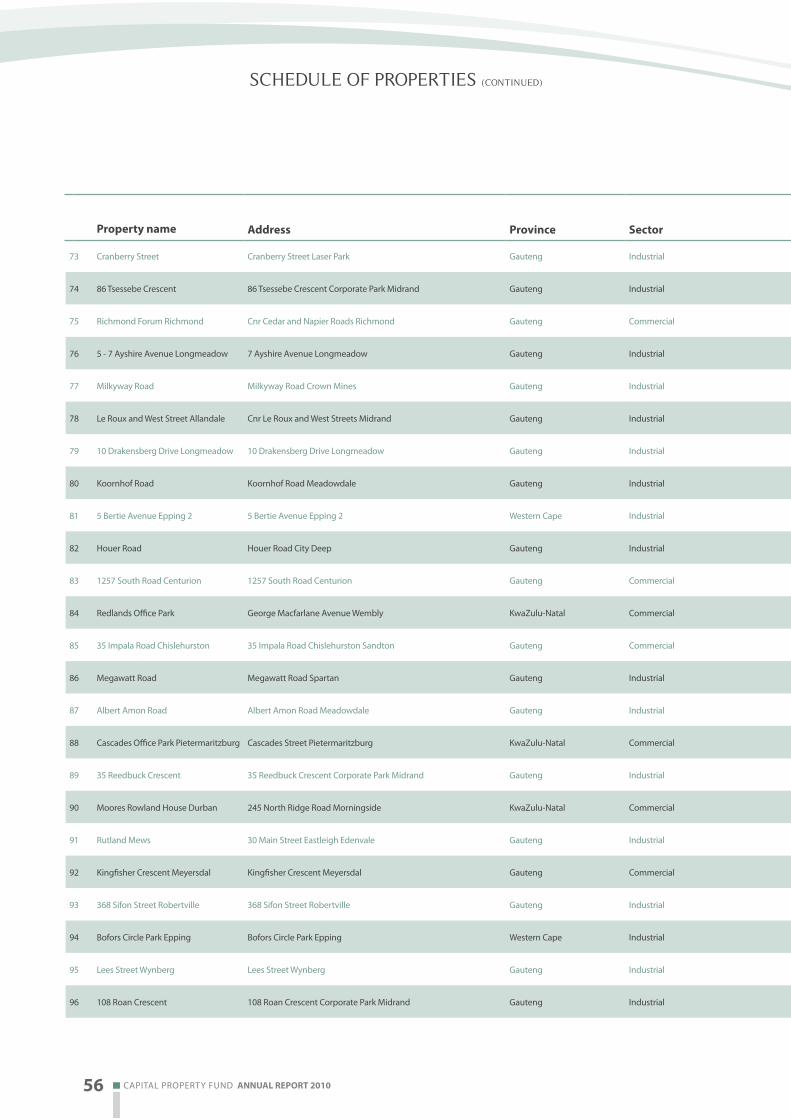
56 CAPITAL PROPERTY FUND AnnuAl RePoRt 2010 AnnuAl RePoRt 2010 CAPITAL PROPERTY FUND 57 56 CAPITAL PROPERTY FUND AnnuAl RePoRt 2010 AnnuAl RePoRt 2010 CAPITAL PROPERTY FUND 57
73 Cranberry Street Cranberry Street Laser Park Gauteng Industrial 5 641 23 400 18 856 Jun 2007 42
74 86 Tsessebe Crescent 86 Tsessebe Crescent Corporate Park Midrand Gauteng Industrial 6 362 23 100 27 661 Jun 2007 41 29%
75 Richmond Forum Richmond Cnr Cedar and Napier Roads Richmond Gauteng Commercial 4 250 23 000 15 000 Dec 2008 65 74%
76 5 - 7 Ayshire Avenue Longmeadow 7 Ayshire Avenue Longmeadow Gauteng Industrial 3 710 22 800 21 538 Feb 2010 46
77 Milkyway Road Milkyway Road Crown Mines Gauteng Industrial 3 865 21 500 19 359 Jun 2007 43
78 Le Roux and West Street Allandale Cnr Le Roux and West Streets Midrand Gauteng Industrial 4 998 20 200 11 150 Oct 1996 42 20%
79 10 Drakensberg Drive Longmeadow 10 Drakensberg Drive Longmeadow Gauteng Industrial 2 999 20 150 18 196 Feb 2010 49
80 Koornhof Road Koornhof Road Meadowdale Gauteng Industrial 3 027 19 100 16 511 Jun 2007 41
81 5 Bertie Avenue Epping 2 5 Bertie Avenue Epping 2 Western Cape Industrial 5 500 18 700 15 000 Nov 2010 30
82 Houer Road Houer Road City Deep Gauteng Industrial 5 584 18 100 14 300 Oct 2007 35
83 1257 South Road Centurion 1257 South Road Centurion Gauteng Commercial 1 805 18 000 12 900 Dec 2008 82
84 Redlands Office Park George Macfarlane Avenue Wembly KwaZulu-Natal Commercial 2 326 17 900 18 900 Dec 2008 68 18%
85 35 Impala Road Chislehurston 35 Impala Road Chislehurston Sandton Gauteng Commercial 1 399 17 800 10 350 Dec 2008 88
86 Megawatt Road Megawatt Road Spartan Gauteng Industrial 2 710 17 700 14 243 Jun 2007 50
87 Albert Amon Road Albert Amon Road Meadowdale Gauteng Industrial 4 064 16 400 7 628 Mar 2007 42
88 Cascades Office Park Pietermaritzburg Cascades Street Pietermaritzburg KwaZulu-Natal Commercial 1 561 16 000 6 517 Aug 2004 72
89 35 Reedbuck Crescent 35 Reedbuck Crescent Corporate Park Midrand Gauteng Industrial 3 202 14 500 8 079 Nov 2006 40
90 Moores Rowland House Durban 245 North Ridge Road Morningside KwaZulu-Natal Commercial 2 342 14 300 16 800 Dec 2008 93 87%
91 Rutland Mews 30 Main Street Eastleigh Edenvale Gauteng Industrial 4 405 14 200 11 648 Nov 2006 38
92 Kingfisher Crescent Meyersdal Kingfisher Crescent Meyersdal Gauteng Commercial 1 445 12 900 12 200 Dec 2008 85
93 368 Sifon Street Robertville 368 Sifon Street Robertville Gauteng Industrial 4 550 12 500 12 300 Dec 2008 – 100%
94 Bofors Circle Park Epping Bofors Circle Park Epping Western Cape Industrial 2 828 12 300 12 226 Jan 1996 40
95 Lees Street Wynberg Lees Street Wynberg Gauteng Industrial 4 105 11 900 2 382 Aug 1984 25
96 108 Roan Crescent 108 Roan Crescent Corporate Park Midrand Gauteng Industrial 2 683 11 500 5 920 Nov 2006 38
schedUle of properties (continUed)
Property name
Address
Province
Sector
GLA
(m2)
Valuation
(R’000)
Purchase price
(R’000)
Effective date of acquisition
Rental per m2
(R)
Vacancy

56 CAPITAL PROPERTY FUND AnnuAl RePoRt 2010 AnnuAl RePoRt 2010 CAPITAL PROPERTY FUND 57 56 CAPITAL PROPERTY FUND AnnuAl RePoRt 2010 AnnuAl RePoRt 2010 CAPITAL PROPERTY FUND 57
73 Cranberry Street Cranberry Street Laser Park Gauteng Industrial 5 641 23 400 18 856 Jun 2007 42
74 86 Tsessebe Crescent 86 Tsessebe Crescent Corporate Park Midrand Gauteng Industrial 6 362 23 100 27 661 Jun 2007 41 29%
75 Richmond Forum Richmond Cnr Cedar and Napier Roads Richmond Gauteng Commercial 4 250 23 000 15 000 Dec 2008 65 74%
76 5 - 7 Ayshire Avenue Longmeadow 7 Ayshire Avenue Longmeadow Gauteng Industrial 3 710 22 800 21 538 Feb 2010 46
77 Milkyway Road Milkyway Road Crown Mines Gauteng Industrial 3 865 21 500 19 359 Jun 2007 43
78 Le Roux and West Street Allandale Cnr Le Roux and West Streets Midrand Gauteng Industrial 4 998 20 200 11 150 Oct 1996 42 20%
79 10 Drakensberg Drive Longmeadow 10 Drakensberg Drive Longmeadow Gauteng Industrial 2 999 20 150 18 196 Feb 2010 49
80 Koornhof Road Koornhof Road Meadowdale Gauteng Industrial 3 027 19 100 16 511 Jun 2007 41
81 5 Bertie Avenue Epping 2 5 Bertie Avenue Epping 2 Western Cape Industrial 5 500 18 700 15 000 Nov 2010 30
82 Houer Road Houer Road City Deep Gauteng Industrial 5 584 18 100 14 300 Oct 2007 35
83 1257 South Road Centurion 1257 South Road Centurion Gauteng Commercial 1 805 18 000 12 900 Dec 2008 82
84 Redlands Office Park George Macfarlane Avenue Wembly KwaZulu-Natal Commercial 2 326 17 900 18 900 Dec 2008 68 18%
85 35 Impala Road Chislehurston 35 Impala Road Chislehurston Sandton Gauteng Commercial 1 399 17 800 10 350 Dec 2008 88
86 Megawatt Road Megawatt Road Spartan Gauteng Industrial 2 710 17 700 14 243 Jun 2007 50
87 Albert Amon Road Albert Amon Road Meadowdale Gauteng Industrial 4 064 16 400 7 628 Mar 2007 42
88 Cascades Office Park Pietermaritzburg Cascades Street Pietermaritzburg KwaZulu-Natal Commercial 1 561 16 000 6 517 Aug 2004 72
89 35 Reedbuck Crescent 35 Reedbuck Crescent Corporate Park Midrand Gauteng Industrial 3 202 14 500 8 079 Nov 2006 40
90 Moores Rowland House Durban 245 North Ridge Road Morningside KwaZulu-Natal Commercial 2 342 14 300 16 800 Dec 2008 93 87%
91 Rutland Mews 30 Main Street Eastleigh Edenvale Gauteng Industrial 4 405 14 200 11 648 Nov 2006 38
92 Kingfisher Crescent Meyersdal Kingfisher Crescent Meyersdal Gauteng Commercial 1 445 12 900 12 200 Dec 2008 85
93 368 Sifon Street Robertville 368 Sifon Street Robertville Gauteng Industrial 4 550 12 500 12 300 Dec 2008 – 100%
94 Bofors Circle Park Epping Bofors Circle Park Epping Western Cape Industrial 2 828 12 300 12 226 Jan 1996 40
95 Lees Street Wynberg Lees Street Wynberg Gauteng Industrial 4 105 11 900 2 382 Aug 1984 25
96 108 Roan Crescent 108 Roan Crescent Corporate Park Midrand Gauteng Industrial 2 683 11 500 5 920 Nov 2006 38
Property name
Address
Province
Sector
GLA
(m2)
Valuation
(R’000)
Purchase price
(R’000)
Effective date of acquisition
Rental per m2
(R)
Vacancy

58 CAPITAL PROPERTY FUND AnnuAl RePoRt 2010 AnnuAl RePoRt 2010 CAPITAL PROPERTY FUND 59 58 CAPITAL PROPERTY FUND AnnuAl RePoRt 2010 AnnuAl RePoRt 2010 CAPITAL PROPERTY FUND 59
97 112 Roan Crescent 112 Roan Crescent Corporate Park Midrand Gauteng Industrial 2 177 10 700 5 925 Nov 2006 40
98 Director Road Spartan Director Road Spartan Gauteng Industrial 1 600 8 400 8 600 Jun 2007 46
99 75 Kyalami Boulevard 75 Kyalami Boulevard Kyalami Park Gauteng Industrial 1 665 8 100 6 784 Nov 2006 49
100 109 Roan Crescent 109 Roan Crescent Corporate Park North Midrand Gauteng Industrial 1 723 8 000 6 845 Nov 2006 40
101 City Deep Mini Units Cnr Heidelberg and Vickers Roads City Deep Gauteng Industrial 1 350 8 000 3 356 Nov 2006 49
102 3 Capital Hill Business Park 3 Capital Hill Business Park Midrand Gauteng Industrial 1 825 7 650 3 898 Nov 2006 43
103 9 Reedbuck Crescent 9 Reedbuck Crescent Corporate Park North Midrand Gauteng Industrial 1 950 7 500 4 007 Nov 2006 40 37%
104 71 Tsessebe Crescent 71 Tsessebe Crescent Corporate Park North Midrand Gauteng Industrial 1 809 7 200 5 945 Nov 2006 40
105 York Road Wynberg Cape Town York Road Wynberg Western Cape Industrial 2 514 6 300 10 500 Dec 2008 35
106 50 Tsessebe Crescent 50 Tsessebe Crescent Corporate Park North Midrand Gauteng Industrial 1 849 6 100 6 765 Nov 2006 – 100%
107 39 Loper Street Spartan 39 Loper Street Spartan Ext 2 Aeroport Gauteng Industrial 953 5 800 1 944 Nov 2006 53
108 62 Gazelle Avenue 62 Gazelle Avenue Corporate Park Midrand Gauteng Industrial 1 318 5 700 4 606 Nov 2006 46
Sub-total 914 426 6 012 540 3 835 499
Developments
109 Montague Gardens** Cnr Plattekloof and Koeberg Road Milnerton Cape Town Western Cape Industrial 130 958 97 000 Aug 2009
110 N1 Business Park* N1 Highway Midrand Gauteng Industrial 34 913 29 590 Aug 2006
Sub-total 165 871 126 590
Total 914 426 6 178 411 3 962 089
*Capital has a 20% interest in the development
**Capital has a 25% interest in the development
schedUle of properties (continUed)
Property name
Address
Province
Sector
GLA
(m2)
Valuation
(R’000)
Purchase price
(R’000)
Effective date of acquisition
Rental per m2
(R)
Vacancy

58 CAPITAL PROPERTY FUND AnnuAl RePoRt 2010 AnnuAl RePoRt 2010 CAPITAL PROPERTY FUND 59 58 CAPITAL PROPERTY FUND AnnuAl RePoRt 2010 AnnuAl RePoRt 2010 CAPITAL PROPERTY FUND 59
97 112 Roan Crescent 112 Roan Crescent Corporate Park Midrand Gauteng Industrial 2 177 10 700 5 925 Nov 2006 40
98 Director Road Spartan Director Road Spartan Gauteng Industrial 1 600 8 400 8 600 Jun 2007 46
99 75 Kyalami Boulevard 75 Kyalami Boulevard Kyalami Park Gauteng Industrial 1 665 8 100 6 784 Nov 2006 49
100 109 Roan Crescent 109 Roan Crescent Corporate Park North Midrand Gauteng Industrial 1 723 8 000 6 845 Nov 2006 40
101 City Deep Mini Units Cnr Heidelberg and Vickers Roads City Deep Gauteng Industrial 1 350 8 000 3 356 Nov 2006 49
102 3 Capital Hill Business Park 3 Capital Hill Business Park Midrand Gauteng Industrial 1 825 7 650 3 898 Nov 2006 43
103 9 Reedbuck Crescent 9 Reedbuck Crescent Corporate Park North Midrand Gauteng Industrial 1 950 7 500 4 007 Nov 2006 40 37%
104 71 Tsessebe Crescent 71 Tsessebe Crescent Corporate Park North Midrand Gauteng Industrial 1 809 7 200 5 945 Nov 2006 40
105 York Road Wynberg Cape Town York Road Wynberg Western Cape Industrial 2 514 6 300 10 500 Dec 2008 35
106 50 Tsessebe Crescent 50 Tsessebe Crescent Corporate Park North Midrand Gauteng Industrial 1 849 6 100 6 765 Nov 2006 – 100%
107 39 Loper Street Spartan 39 Loper Street Spartan Ext 2 Aeroport Gauteng Industrial 953 5 800 1 944 Nov 2006 53
108 62 Gazelle Avenue 62 Gazelle Avenue Corporate Park Midrand Gauteng Industrial 1 318 5 700 4 606 Nov 2006 46
Sub-total 914 426 6 012 540 3 835 499
Developments
109 Montague Gardens** Cnr Plattekloof and Koeberg Road Milnerton Cape Town Western Cape Industrial 130 958 97 000 Aug 2009
110 N1 Business Park* N1 Highway Midrand Gauteng Industrial 34 913 29 590 Aug 2006
Sub-total 165 871 126 590
Total 914 426 6 178 411 3 962 089
*Capital has a 20% interest in the development
**Capital has a 25% interest in the development
Property name
Address
Province
Sector
GLA
(m2)
Valuation
(R’000)
Purchase price
(R’000)
Effective date of acquisition
Rental per m2
(R)
Vacancy

60 CAPITAL PROPERTY FUND AnnuAl RePoRt 2010 AnnuAl RePoRt 2010 CAPITAL PROPERTY FUND 61 60 CAPITAL PROPERTY FUND AnnuAl RePoRt 2010 AnnuAl RePoRt 2010 CAPITAL PROPERTY FUND 61
board charter
FUNCTIONS OF THE BOARD
The board acknowledges that they:
– regard corporate governance as vitally important to the success of the business;
– are responsible to all stakeholders for the group achieving the highest standards of business conduct;
– are unreservedly committed to applying the principles necessary to ensure that good corporate governance, as set out in the King II
report, is practiced in all of the Group’s business dealings; and
– are expected to act with due regard to their fiduciary duties and responsibilities in a professional manner, and to uphold the Group’s
core values.
RESPONSIBILITIES OF THE BOARD
Although certain responsibilities are delegated to committees or management executives, the board acknowledges that it is not discharged
from its obligations in regards to these matters.
The board acknowledges its responsibilities for:
– the adoption of strategic plans and ensuring that these plans are carried out by management;
– the monitoring of the operational performance of the business against predetermined budgets;
– the monitoring of the performance of management at both operational and executive level;
– ensuring that the group complies with all laws, regulations and codes of business practice;
– ensuring a clear division of responsibilities at board level to ensure a balance of power and authority in terms of group policies; and
– timeous, relevant and meaningful reporting to all stakeholders.

60 CAPITAL PROPERTY FUND AnnuAl RePoRt 2010 AnnuAl RePoRt 2010 CAPITAL PROPERTY FUND 61 60 CAPITAL PROPERTY FUND AnnuAl RePoRt 2010 AnnuAl RePoRt 2010 CAPITAL PROPERTY FUND 61
corporate governance review
INTRODUCTIONThe board of directors endorses the Code of Corporate Practices and Conduct as set out in the King II report and confirms that the Group is compliant with the provisions thereof in all material respects, except where specifically discussed in this report. The board has been addressed by independent consultants to ensure that all directors are fully conversant with best practice and current thinking with regard to corporate governance.
COMPOSITION OF THE BOARD OF DIRECTORSThe board is comprised of five executive directors and six independent non-executive directors. Board appointments are made in terms of a formal and transparent policy on nominations and appointments.
There are no fixed term contracts for executive directors and the notice period for termination or resignation is one calendar month. There is no restraint of trade period for executive directors.
ROLE OF THE DIRECTORSUltimate control of the Fund rests with the board of directors while the executive management is responsible for the proper management of the Fund. To achieve this, the board is responsible for establishing the objectives of the Fund and setting a philosophy for investments, performance and ethical standards. Although quarterly board meetings are arranged every year, additional meetings are called should circumstances require it. Six board meetings were called during the 2010 financial year.
INDEPENDENCE OF THE DIRECTORSThe board of directors’ independence from the executive management team is ensured by the following:– separation of the roles of chairman and managing director, with the chairman being independent;– the board being dominated by independent non-executive directors;– the audit and risk and nomination committees having a majority of independent directors;– non-executive directors not holding service contracts;– all directors having access to the advice and services of the company secretary; and– with prior agreement from the chairman, all directors are entitled to seek independent professional advice concerning the affairs
of the Fund at the Fund’s expense.
The audit and risk, nomination and investment committees are chaired by independent non-executive directors.
AUDIT AND RISK COMMITTEEThe audit and risk committee evaluates the group’s exposure and response to significant risks, including sustainability issues.
The committee’s primary objective is to provide the board with additional assurance regarding the efficiency of the operations and reliability of the financial information, and to assist the board in discharging its duties in regard to these matters.
The committee reviews audit plans for external audits and the outcome of the work performed in executing these plans. They further ensure that items identified for action are followed up. The committee recommends the appointment of external auditors, the level of fees payable and the level of non-audit services. The external auditors report annually to the audit committee to confirm that they are and have remained independent from the group during the year. The audit committee is satisfied that the auditors have remained independent. The audit committee is further satisfied that the financial director is sufficiently competent.
It is the function of the committee to review and make recommendations to the board regarding interim financial results and the annual financial statements prior to approval by the board.
The audit committee comprises three non-executive directors, all of whom are independent. The managing director, financial director, external auditors and company secretary attend all meetings of the committee as invitees. Committee members have unlimited access to all information, documents and explanations required in the discharge of their duties, as do the external auditors.
INVESTMENT COMMITTEEAll acquisitions and sales of investments and capital expenditure are considered by the investment committee.
The investment committee consists of two executive directors and two independent non-executive directors. All members of this committee have extensive experience and technical expertise in the commercial, retail and industrial property industry.
INTERNAL FINANCIAL AND OPERATING CONTROLSA framework of financial reporting, internal and operating controls has been established by the board to ensure reasonable assurance as to accurate and timeous reporting of business information, safeguarding of Group assets, compliance with statutory laws and regulations, and general operation.
The board is satisfied that the internal controls are effective. In addition, the audit committee continually examines the appropriateness of utilising independent internal auditors to periodically review activities of the Group and service providers.
ETHICS PERFORMANCEThe board of directors forms the core of the values and ethics subscribed to by the Fund through its various bodies and committees. These values and ethics are sustained by the directors’ standing and reputation in the business community and their belief in free and fair dealings in utmost good faith and respect for the law and regulations.
DEALING IN SECURITIES BY THE DIRECTORSDealing in the Fund’s securities by directors and Fund officials is regulated and monitored as required by the Listings Requirements of the JSE Limited. In addition, Capital maintains a closed period from the end of a financial period to the date of publication of the financial results.
COMMUNICATIONS WITH STAKEHOLDERS AND UNITHOLDERSCapital is committed to ensuring timeous, effective and transparent communication with unitholders and other stakeholders through annual and interim financial reports, presentations to analysts, press releases, etc.

62 PROPERTY FUND mANAgERs LImITED AnnuAl RePoRt 2010 AnnuAl RePoRt 2010 PROPERTY FUND mANAgERs LImITED 63
property fUnd managers limited directors’ report
NATURE OF BUSINESS The company continued with its business as the manager of the Fund in terms of the Collective Investment
Schemes Control Act, 45 of 2002.
GENERAL REVIEW The results for the year are reflected in the accompanying annual financial statements.
SHARE CAPITAL Details of the authorised and issued share capital of the company appear in note 5 to the financial statements.
DIRECTORS The directors of the company appear on pages 4 to 5.
REGISTERED OFFICE 4th Floor Rivonia Village
Rivonia Boulevard
Rivonia 2191
PO Box 2555 Rivonia 2128
AUDITORS PKF (Jhb) Inc. was appointed as the auditor in terms of the Companies Act of South Africa.

62 PROPERTY FUND mANAgERs LImITED AnnuAl RePoRt 2010 AnnuAl RePoRt 2010 PROPERTY FUND mANAgERs LImITED 63
independent aUditor’s report
TO THE SHAREHOLDER OF PROPERTY FUND MANAGERS LIMITED
We have audited the annual financial statements of Property Fund Managers Limited (“the Company”), which comprise the statement of
financial position at 31 December 2010, and the statement of comprehensive income, the statement of changes in equity and statement of
cash flows for the year then ended, and the notes to the financial statements, which include a summary of significant accounting policies
and other explanatory notes, and the Directors’ Report as set out on pages 62 and 64 to 70.
DIRECTORS’ RESPONSIBILITY FOR THE FINANCIAL STATEMENTS
The Company’s directors are responsible for the preparation and fair presentation of these financial statements in accordance with
International Financial Reporting Standards and in the manner required by the Companies Act of South Africa. This responsibility includes:
designing, implementing and maintaining internal controls relevant to the preparation and fair presentation of financial statements that
are free from material misstatement, whether due to fraud or error; selecting and applying appropriate accounting policies; and making
accounting estimates that are reasonable in the circumstances.
AUDITOR’S RESPONSIBILITY
Our responsibility is to express an opinion on these financial statements based on our audit. We conducted our audit in accordance
with International Standards on Auditing. Those standards require that we comply with ethical requirements and plan and perform
the audit to obtain reasonable assurance whether the financial statements are free from material misstatement.
An audit involves performing procedures to obtain audit evidence about the amounts and disclosures in the financial statements.
The procedures selected depend on the auditor’s judgement, including the assessment of the risks of material misstatement of the
financial statements, whether due to fraud or error. In making those risk assessments the auditor considers internal controls relevant to
the entity’s preparation and fair presentation of the financial statements in order to design audit procedures that are appropriate in the
circumstances, but not for the purpose of expressing an opinion on the effectiveness of the entity’s internal controls. An audit also includes
evaluating the appropriateness of accounting policies used and the reasonableness of accounting estimates made by management,
as well as evaluating the overall presentation of the financial statements.
We believe that the audit evidence we have obtained is sufficient and appropriate to provide a basis for our audit opinion.
OPINION
In our opinion, these financial statements present fairly, in all material respects, the financial position of the Company at 31 December 2010,
and its financial performance and cash flows for the year then ended in accordance with International Financial Reporting Standards, and
in the manner required by the Companies Act of South Africa.
Per P Badrick
Registered Auditors
Chartered Accountant (SA)
Registration number: 1994/001166/211
Johannesburg
2 February 2011

statement of financial positionas at 31 D ecemb er 2010
2010 2009Note R’000 R’000
ASSETS
Non-current assets
Investments 2 – –
Current assets 7 119 5 679
Trade and other receivables 3 7 117 5 678
Cash and cash equivalents 4 2 1
Total assets 7 119 5 679
EQUITY AND LIABILITIES
Capital and reserves 3 842 3 842
Share capital 5 100 100
Share premium 5 900 900
Non-distributable reserves 6 632 632
Retained earnings 2 210 2 210
Non-current liabilities
Deferred tax 7 – –
Current liabilities 3 277 1 837
Trade and other payables 8 3 277 1 828
Income tax payable – 9
Total equity and liabilities 7 119 5 679
2010 2009Note R’000 R’000
Revenue 33 248 26 518
Operating expenses (33 248) (26 587)
Operating loss – (69)
Profit on sale of investments – 116
Finance income - interest received – 69
Profit before taxation 9 – 116
Income tax expense 10 – 51
Profit after taxation – 167
Total comprehensive income for the year – 167
statement of comprehensive incomefor the year ended 31 D ecemb er 2010
64 PROPERTY FUND mANAgERs LImITED AnnuAl RePoRt 2010 AnnuAl RePoRt 2010 PROPERTY FUND mANAgERs LImITED 65

statement of changes in eqUityfor the year ended 31 D ecemb er 2010
Share capital
Sharepremium
Non- distributable
reservesRetained
income TotalR’000 R’000 R’000 R’000 R’000
Balance at 31 December 2008 100 900 465 2 210 3 675
Total comprehensive income for the year 167 167
Transfer to non-distributable reserves 167 (167) –
Balance at 31 December 2009 100 900 632 2 210 3 842
Total comprehensive income for the year – –
Balance at 31 December 2010 100 900 632 2 210 3 842
2010 2009Note R’000 R’000
Operating activities
Profit before taxation – 116
Adjusted for:
Profit on sale of investments – (116)
Finance income – interest received – (69)
Cash outflow from operating activities – (69)
(Increase)/decrease in trade and other receivables (1 439) 2 051
Increase/(decrease) in accounts payable 1 449 (3 032)
Cash generated by/(utilised in) operations 10 (1 050)
Income tax paid 10.1 (9) (74)
Interest received – 69
Cash effects of operating activities 1 (1 055)
Investing activities
Proceeds from sale of investments – 916
Net increase/(decrease) in cash and cash equivalents 1 (139)
Cash and cash equivalents at the beginning of the year 1 140
Cash and cash equivalents at the end of the year 2 1
statement of cash flowfor the year ended 31 D ecemb er 2010
64 PROPERTY FUND mANAgERs LImITED AnnuAl RePoRt 2010 AnnuAl RePoRt 2010 PROPERTY FUND mANAgERs LImITED 65

notes to the annUal financial statementsfor the year ended 31 D ecemb er 2010
1 ACCOUNTING POLICIES1.1 Basis of preparation The financial statements have been prepared on the historical cost basis modified for financial assets and financial liabilities
measured at fair value. The financial statements have been prepared on the going concern basis. They are presented in rand and all values are rounded to the nearest thousand (R’000) except where otherwise indicated.
1.2 Statement of compliance The financial statements are prepared in accordance with International Financial Reporting Standards (“IFRS”) and interpretations of
these standards as adopted by the International Accounting Standards Board, the AC 500 standards, the requirements of the South African Companies Act, the Collective Investment Schemes Control Act and the Listings Requirements of the JSE Limited.
The preparation of financial statements in conformity with IFRS requires the use of certain critical accounting estimates, judgements and assumptions that affect reported amounts. It also requires management to exercise its judgement in the company’s process of applying the accounting policies. Actual results may vary from these estimates. The areas involving a higher degree of judgement or complexities or areas where assumptions or estimates are significant are disclosed in note 14. The estimates and underlying assumptions are reviewed on an ongoing basis.
The principal accounting policies applied in the preparation of these financial statements are set out below. The accounting policies have remained unchanged from those applied in the prior year.
1.3 Impairment Financial assets A financial asset is considered to be impaired if objective evidence indicates that one or more events have had a negative effect
on the estimated future cash flow of that asset. An impairment loss in respect of a financial asset measured at amortised cost is calculated as the difference between its carrying amount and the present value of the estimated future cash flows discounted at the pre-tax discount rate that reflects current market assessments of the time value of money and the risks specific to the asset. An impairment loss in respect of an available for sale financial asset is calculated by reference to its current fair value.
Individually significant financial assets are tested for impairment on an individual basis. The remaining financial assets are assessed collectively in groups that share similar credit characteristics.
All impairment losses are recognised in profit and loss.
An impairment loss is reversed if the subsequent increase in recoverable amount can be related objectively to an event occurring after the impairment loss was recognised.
All receivables past due are fully impaired. Amounts are considered past due if they are in excess of payment terms.
No allowance for doubtful debts is recognised.
The recovery of amounts previously written off are recorded in profit and loss.
1.4 Non-distributable reserves All realised gains/losses arising on the fair value adjustments on investments classified as fair value through profit and loss and
all realised profits/losses on the sale of such investments are transferred to non-distributable reserves and are not available for distribution.
1.5 Financial instruments The Company’s financial instruments consist mainly of investments, trade and other receivables, trade and other payables, cash and
borrowings.
Financial instruments, other than financial instruments classified as fair value through profit and loss, are initially measured at fair value including transaction costs.
Subsequent to initial recognition these instruments are measured as set out below: Cash and cash equivalents – Measured at fair value. Investments – Carried at fair value, being the quoted bid price at the reporting date, through profit and loss. Trade and other receivables – Stated at amortised cost using the effective interest rate method less accumulated impairment
losses. Trade and other payables – Stated at amortised cost using the effective interest rate method. Related party loans receivable – Stated at amortised cost using the effective interest rate method less accumulated impairment
losses. Related party loans payable – Stated at amortised cost using the effective interest rate method. Financial liabilities – Non-derivative financial liabilities, not at fair value through profit and loss, are recognised
at amortised cost using the effective interest rate method.
For all financial instruments carried at amortised cost, where the financial effect of the time value of money is not considered to be material, discounting is not applied as the fair values of these instruments approximate their carrying values.
66 PROPERTY FUND mANAgERs LImITED AnnuAl RePoRt 2010 AnnuAl RePoRt 2010 PROPERTY FUND mANAgERs LImITED 67

1.6 Derecognition
Financial assets
A financial asset (or, where applicable, a part of a financial asset or part of a group of similar financial assets) is derecognised where:
– the contractual rights to receive cash flows from the asset have expired;
– the Company retains the right to receive cash flows from the asset, but has assumed an obligation to pay them in full without
material delay to a third party under a ‘pass-through’ arrangement; or
– the Company has transferred its rights to receive cash flows from the asset and either:
(a) has transferred substantially all the risks and rewards of the asset, or
(b) has neither transferred nor retained substantially all the risks and rewards of the asset, but has transferred control of the asset.
Where the Company has transferred its rights to receive cash flow from an asset and has neither transferred nor retained substantially
all the risks and rewards of the asset nor transferred control of the asset, the asset is recognised to the extent of the Company’s
continuing involvement in the asset. Continuing involvement that takes the form of a guarantee over the transferred asset is measured
at the lower of the original carrying amount of the asset and the maximum amount of consideration that the Company could be
required to repay.
Financial liabilities
A financial liability is derecognised when the obligation under the liability is discharged or cancelled or expires. Where an existing
liability is replaced by another from the same lender on substantially different terms, or the terms of an existing liability are substantially
modified, such an exchange or modification is treated as a derecognition of the original liability and the recognition of a new liability,
and the difference in the respective carrying amounts is recognised in profit or loss.
Offset
Financial assets and financial liabilities are offset and the net amount reported in the statement of financial position when the
Company has a legally enforceable right to set off the recognised amounts, and intends either to settle on a net basis, or to realise
the asset and settle the liability simultaneously.
1.7 Cash and cash equivalents
Cash and cash equivalents comprise cash on hand, current account balances and funds held on call with banks.
1.8 Revenue
Revenue represents asset management fees, unit creation fees and distributions received.
The asset management fee represents management fees for the asset management of Capital Property Fund, net of VAT
and are recognised on an accrual basis in accordance with the substance of the relevant agreement.
Unit creation fees are recognised on an accrual basis in accordance with the substance of the relevant agreement.
Distributions are accrued for on a daily basis using the time apportionment method.
Interest received is accrued on a time basis, by reference to the principal outstanding and at the effective interest rate applicable,
which is the rate which exactly discounts estimated future cash receipts through the expected life of the financial asset to that asset’s
carrying value.
1.9 Income tax
Income tax on profit or loss for the year comprises current and deferred tax. Income tax is recognised in profit or loss except to the
extent that it relates to items recognised directly in equity, in which case it is recognised in equity.
Current tax is the expected tax payable on the taxable income for the year, using tax rates enacted or substantively enacted at the
reporting date, and any adjustment to tax payable in respect of previous years.
To the extent that the current tax is due to the tax authorities at year end, it is recognised as a current liability.
Deferred tax is provided by subsidiaries using the comprehensive liability method, providing for temporary differences between the
carrying amounts of assets and liabilities for financial reporting purposes and the amounts used for taxation purposes. The following
temporary differences are not provided for: goodwill not deductible for tax purposes, the initial recognition of assets or liabilities that
affect neither accounting nor taxable profit/loss, and differences relating to investments in subsidiaries to the extent that they will
probably not reverse in the foreseeable future. The amount of deferred tax provided is based on the expected manner of realisation or
settlement of the carrying amount of assets and liabilities, using tax rates enacted or substantively enacted at the reporting date.
66 PROPERTY FUND mANAgERs LImITED AnnuAl RePoRt 2010 AnnuAl RePoRt 2010 PROPERTY FUND mANAgERs LImITED 67

notes to the annUal financial statements (continUed)
for the year ended 31 D ecemb er 2010
2010 2009R’000 R’000
2 LISTED INVESTMENTS
Nil (2009 : Nil) units in Capital Property Fund at fair value – –
Schedule of movement
Carrying value at the beginning of the year – 799
Disposals – (799)
Carrying value at the end of the year – –
3 TRADE AND OTHER RECEIVABLES
Trade receivables 3 443 2 865
Loan to Resilient 3 674 2 813
7 117 5 678
The loan to Resilient is interest free and is payable on demand.
4 CASH AND CASH EQUIVALENTS
Current account 2 1
2 1
5 SHARE CAPITAL
Authorised and issued
100 000 ordinary shares of R1 each 100 100
Share premium 900 900
6 NON-DISTRIBUTABLE RESERVES
Balance at the beginning of the year 632 465
Investments – 167
Balance at the end of the year 632 632
7 DEFERRED TAX
Balance at the beginning of the year – 132
Charged to the statement of comprehensive income during the year – (132)
Balance at the end of the year – –
8 TRADE AND OTHER PAYABLES
Accruals 42 186
Trade payables 3 235 1 642
3 277 1 828
9 PROFIT BEFORE TAXATION
Profit before taxation is stated after:
Distributions received – (69)
Asset management fee received (33 248) (26 223)
Unit creation fee – (295)
Asset management fee paid and administration expenses 33 206 26 410
Auditor’s remuneration – Audit services 42 40
Auditor’s remuneration – Other services 5 –
68 PROPERTY FUND mANAgERs LImITED AnnuAl RePoRt 2010 AnnuAl RePoRt 2010 PROPERTY FUND mANAgERs LImITED 69

2010 2009R’000 R’000
10 INCOME TAX EXPENSE
South African normal tax
Current year
– Income tax – (1)
– Capital gains tax – 82
– Deferred tax – (132)
– (51)
Reconciliation of tax rate % %
Company tax rate 28,00% 28,00%
– Deferred tax differential – –
– Capital gains tax differential – (72,00%)
Effective tax rate 28,00% (44,00%)
10.1 Income tax paid
Balance due at the beginning of the year 9 1
Tax charge in statement of comprehensive income – 82
Balance due at the end of the year – (9)
Tax paid 9 74
11 FINANCIAL INSTRUMENTS
Exposure to credit and liquidity risk arises in the normal course of business.
11.1 Credit riskTrade receivables consist of the asset management and unit creation fees from Capital Property Fund and the loan to Resilient
Property Income Fund Limited and the credit risk relating thereto is considered minimal. At year end management believed there
was no material credit risk exposure and no amounts past due.
Reputable financial institutions are used for cash handling and investing purposes.
11.2 Liquidity riskCash flows are continuously monitored to ensure the company is able to meet its funding requirements. All financial liabilities
comprising trade and other payables, will be settled within 12 months and will not incur interest.
11.3 Fair valuesThe fair values of all financial instruments classified as designated as at fair value through profit or loss are substantially identical
to carrying amounts reflected in the statement of financial position.
68 PROPERTY FUND mANAgERs LImITED AnnuAl RePoRt 2010 AnnuAl RePoRt 2010 PROPERTY FUND mANAgERs LImITED 69

2010 2009R’000 R’000
12 RELATED PARTY TRANSACTIONS
12.1 Identity of related partiesProperty Fund Managers Limited (“PFM”) is the management company of Capital Property Fund in terms of the Collective
Investment Schemes Control Act.
The holding company of PFM is Resilient Property Income Fund Limited, which effectively holds 100% of PFM’s ordinary shares.
An asset management agreement is in place between PFM and Resilient Properties (Proprietary) Limited (“Resilient Properties”),
which is 100% owned by Resilient.
12.2 Material related party transactions
Capital Property Fund
Distributions received – 69
Asset management fee received (33 248) (26 223)
Unit creation fee received – (295)
Directors
Directors’ emoluments (see note 13) 932 810
Asset Management Agreement
Asset management fee to Resilient Properties
Asset management fee to Fortress Asset Managers (Proprietary) Limited
32 183
–
–
25 541
13 DIRECTORS’ REMUNERATION
Fees paid to directors during the year ended 31 December 2010 were as follows:
Non-executive (for services as directors)
WC Ross 150 135
RA Chute 190 170
JJG da Costa 150 135
PT Phili 155 135
BL Stuhler 55 100
TD Vilakazi 155 135
UJ van der Walt 77 –
932 810
The management of Capital Property Fund by PFM has been outsourced to Resilient Properties, a wholly owned subsidiary of
Resilient, and therefore the executive directors are not remunerated by PFM.
14 ACCOUNTING ESTIMATES AND JUDGEMENTSThere were no areas where significant accounting estimates and judgements have been made in the preparation of these financial
statements.
Additional information required in terms of the Collective Investment Schemes Control Act of 2002
In terms of the Collective Investment Schemes Control Act the company is required to have a minimum capital of R1 492 500
(2009: R1 492 500). At 31 December 2010 the capital balance was R2 351 857 (2009: R2 351 857).
notes to the annUal financial statements (continUed)
for the year ended 31 D ecemb er 2010
70 PROPERTY FUND mANAgERs LImITED AnnuAl RePoRt 2010

AnnuAl RePoRt 2010 CAPITAL PROPERTY FUND 71
administration
ASSET MANAGER
Property Fund Managers Limited
4th Floor Rivonia Village
Rivonia Boulevard
Rivonia 2191
PO Box 2555 Rivonia 2128
AUDITOR
PKF (Jhb) Inc.
42 Wierda Road West
Wierda Valley
Sandton 2196
Private Bag X10046 Sandton 2146
BANKER
The Standard Bank of South Africa Limited
Registration number: 1967/00735/06
Corporate and Investment Banking
7th Floor 3 Simmonds Street
Johannesburg 2001
PO Box 61029 Marshalltown 2107
COMPANY SECRETARY
Rual Bornman
4th Floor Rivonia Village
Rivonia Boulevard
Rivonia 2191
PO Box 2555 Rivonia 2128
SPONSOR
Java Capital (Proprietary) Limited
2 Arnold Road
Rosebank 2196
PO Box 2087 Parklands 2121
TRUSTEE
Absa Bank Limited
Commercial Property Finance
18th Floor 11 Diagonal Street
Johannesburg 2001
PO Box 42010 Fordsburg 2033
TRANSFER SECRETARIES
Link Market Services South Africa (Proprietary) Limited
16th Floor 11 Diagonal Street
Johannesburg 2001
PO Box 4844 Johannesburg 2000
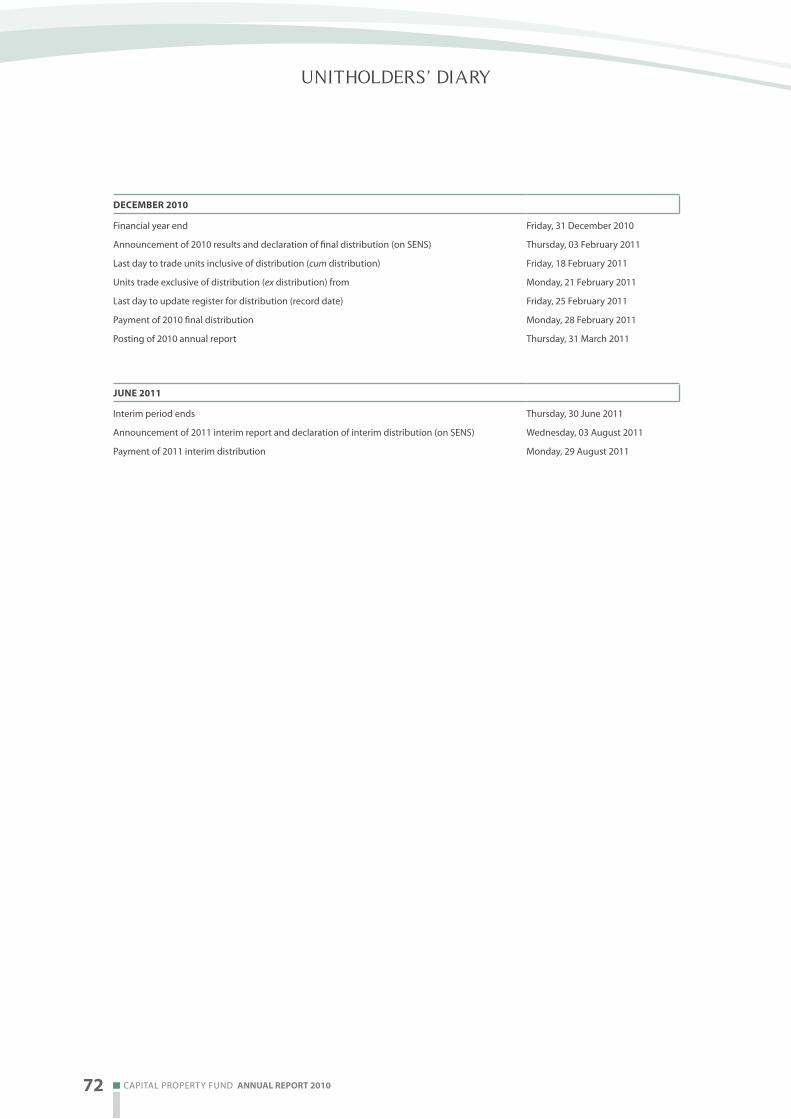
72 CAPITAL PROPERTY FUND AnnuAl RePoRt 2010
Unitholders’ diary
DECEMBER 2010
Financial year end Friday, 31 December 2010
Announcement of 2010 results and declaration of final distribution (on SENS) Thursday, 03 February 2011
Last day to trade units inclusive of distribution (cum distribution) Friday, 18 February 2011
Units trade exclusive of distribution (ex distribution) from Monday, 21 February 2011
Last day to update register for distribution (record date) Friday, 25 February 2011
Payment of 2010 final distribution Monday, 28 February 2011
Posting of 2010 annual report Thursday, 31 March 2011
JUNE 2011
Interim period ends Thursday, 30 June 2011
Announcement of 2011 interim report and declaration of interim distribution (on SENS) Wednesday, 03 August 2011
Payment of 2011 interim distribution Monday, 29 August 2011

3346 visual IGNITION 011 888 5511 AnnuAl RepoRt 2010 CAPItAl PROPeRtY FunD 73
FACT shEET
FUND Name Capital Property Fund
CoNtaCt Tel: +27 (0) 11 612 6870
Fax: +27 (0) 11 612 6869
RegisteReD aDDRess 4th Floor Rivonia Village
Rivonia Boulevard
Rivonia 2191
PO Box 2555 Rivonia 2128
YeaR-eND 31 December
ChaiRmaN oF the boaRD Willy Ross
boaRD oF DiReCtoRs WC Ross (chairman), AE Teixeira (managing director), AA Bornman,
RA Chute, JJG da Costa, D de Beer, A de Lange, PT Phili, UJ van der Walt,
TD Vilakazi, TL Visser
Independent non-executive 6
Executive 5
11
maNagiNg DiReCtoR Andrew Teixeira
CompaNY seCRetaRY Rual Bornman
CoRpoRate aDvisoRs Java Capital
exteRNal aUDitoRs PKF (Jhb) Inc.
UNits iN issUe 717 578 059
geaRiNg Ratio 18,6%
iNvestmeNt poRtFolio Direct property: R6 178,4 million
Listed equity: R944,4 million
UNit pRiCe (CeNt) 2010 year
High 885 cpu
Low 670 cpu
Closing 821 cpu
volUme tRaDeD 207,4 million units
valUe tRaDeD R1 542,3 million
DistRibUtioNs Interim 28,36 cents
Final 31,78 cents
60,14 cents
NUmbeR oF iNvestmeNt pRopeRties 109 (2009: 99)
DistRibUtioN CaleNDaR
(FiNal DistRibUtioN FoR the
2010 FiNaNCial YeaR)
Last day to trade cum distribution 18 February 2011
Record date 25 February 2011
Distribution payment 28 February 2011

CAPITAL PROPERTY FUND
4th Floor Rivonia Village
Rivonia Boulevard Rivonia 2191
PO Box 2555 Rivonia 2128
+27 (0) 11 612 6870
+27 (0) 11 612 6899
CA
PITA
L P
RO
PE
RT
Y F
UN
D
An
nu
Al RePO
Rt 2
01
0


