Capital Market Conditions and the Pricing of Private … 1.pdfCapital Market Conditions and the...
38
Capital Market Conditions and the Pricing of Private Equity Sales by Public Firms * Mark R. Huson University of Alberta Paul H. Malatesta University of Washington Robert Parrino University of Texas at Austin August 19, 2009 Abstract We investigate the impact of capital market conditions on the pricing of private investment in public equity (PIPE) issues. The evidence is consistent with the theory that pricing of PIPE issues reflects the relative bargaining power of issuing firms and investors and that relative bargaining power is affected by conditions in other areas of the capital markets. Capital market conditions affect private placement discounts, returns to original stockholders, and the increase in equity associated with PIPE issues. Measures of capital market conditions markedly increase the explanatory power of models that predict discounts, returns to original stockholders, and equity value-added. * Huson is from the Department of Finance & Management Science, School of Business, University of Alberta, Edmonton, Alberta T6G 2R6, Canada, (780) 492-2803, [email protected]. Malatesta is from the Department of Finance and Business Economics, School of Business Administration, University of Washington, Seattle, Washington, 98195-3200, USA, (206) 685-1987, [email protected]. Parrino is from the Department of Finance, McCombs School of Business, University of Texas at Austin, Austin, Texas, 78712-1179, USA, (512) 471- 5788, [email protected]. We thank participants at the 2006 North American Economics and Finance Association annual meeting and in seminars at George Mason University, Georgia State University, Penn State University, Temple University, and University of Arizona for helpful comments. We are especially grateful to Chris Anderson, Tom Bates, Laura Field, Jean Helwege, Kathy Kahle, Jayant Kale, Michele Lowry, David Reeb, Chip Ryan, and Karen Wruck for suggestions that have helped us improve the paper substantially and to Xi Han for assisting us with the collection of data.
Transcript of Capital Market Conditions and the Pricing of Private … 1.pdfCapital Market Conditions and the...

Capital Market Conditions and the Pricing of Private Equity Sales by Public Firms *
Mark R. Huson University of Alberta
Paul H. Malatesta University of Washington
Robert Parrino University of Texas at Austin
August 19, 2009
Abstract We investigate the impact of capital market conditions on the pricing of private investment in public equity (PIPE) issues. The evidence is consistent with the theory that pricing of PIPE issues reflects the relative bargaining power of issuing firms and investors and that relative bargaining power is affected by conditions in other areas of the capital markets. Capital market conditions affect private placement discounts, returns to original stockholders, and the increase in equity associated with PIPE issues. Measures of capital market conditions markedly increase the explanatory power of models that predict discounts, returns to original stockholders, and equity value-added.
* Huson is from the Department of Finance & Management Science, School of Business, University of Alberta, Edmonton, Alberta T6G 2R6, Canada, (780) 492-2803, [email protected]. Malatesta is from the Department of Finance and Business Economics, School of Business Administration, University of Washington, Seattle, Washington, 98195-3200, USA, (206) 685-1987, [email protected]. Parrino is from the Department of Finance, McCombs School of Business, University of Texas at Austin, Austin, Texas, 78712-1179, USA, (512) 471-5788, [email protected]. We thank participants at the 2006 North American Economics and Finance Association annual meeting and in seminars at George Mason University, Georgia State University, Penn State University, Temple University, and University of Arizona for helpful comments. We are especially grateful to Chris Anderson, Tom Bates, Laura Field, Jean Helwege, Kathy Kahle, Jayant Kale, Michele Lowry, David Reeb, Chip Ryan, and Karen Wruck for suggestions that have helped us improve the paper substantially and to Xi Han for assisting us with the collection of data.

1
Capital Market Conditions and the
Pricing of Private Equity Sales by Public Firms
1. Introduction
Private placements are an important and growing source of equity capital for public
firms. While there has been demand for private placements among public firms for decades, this
demand increased substantially in recent years. For example, during the seven years ending in
December 2001, private investments in public equity (PIPE) issues totaled approximately $62.7
billion, or $9.0 billion per year.1 In contrast, during the seven years ending December 2008, PIPE
issues totaled roughly $295.7 billion, or $42.2 billion per year. During the first six months of
2009 alone, equity-related private placements by public firms totaled over $43.0 billion. The
PIPE market has become a viable alternative to the seasoned equity offering (SEO) market for a
wide range of public firms in recent years.
This study examines how public market conditions affect PIPE issue pricing. It is
important that we understand the pricing of PIPE issues, not only because the aggregate value of
such issues has become quite large, but also because the characteristics of the firms accessing the
PIPE market have changed over time. While the PIPE market has historically served as source of
equity capital for distressed firms (Brophy, Ouimet, and Sialm, 2009), in recent years it has
become common for non-distressed firms to raise equity through PIPE issues (Huson, Malatesta,
and Parrino, 2009). The PIPE market has developed into a legitimate alternative source of equity
capital for a wide range of public firms.
The existing literature assumes that shares sold in PIPE issues are priced so that private
placement investors (PPI) are compensated for the costs of monitoring services they provide or
for information acquisition. A complementary view, which we develop in this paper, is that
discounts result from negotiations between issuing firms and PPI and that the relative bargaining
power of firms and PPI changes with capital market conditions. We call this the Related Markets
Hypothesis.
The idea that capital market conditions influence financing decisions has been studied
extensively, with detailed evidence of such influence being reported at least as far back as 1953
(Hickman, 1953). Bayless and Chaplinsky (1996) suggest that lower levels of asymmetric 1 The figures on the aggregate dollar value of PIPE issues are from Sagient Research Systems, Inc.
2
information during certain periods reduce the cost of public equity sales and thereby increase the
volume of such financings. Lerner, Shane, and Tsai (2003) find that equity financing cycles
affect the likelihood that small biotechnology firms use alliances to fund research and
development expenditures. When public market financing volume is low, small firms are more
likely to use alliances and tend to cede more control rights to larger corporate partners. This
latter evidence is consistent with the notion that public market conditions influence the choice
between public and private sources of capital and the bargaining power of issuing firms.
With regard to direct private investment, Gompers, Kovner, Lerner, and Scharfstein
(2008) report evidence that venture capitalists increase the level of their investments most when
public market signals are positive. These authors find that market signals reflecting industry
attractiveness, such as the industry Tobin’s Q and the frequency of initial public offerings (IPOs)
by firms in the industry, are related to venture capital investment activity, especially among the
most experienced venture capital firms. Gompers et al. (2008) conclude that the volatility of
market fundamentals has an important effect on the volatility of the level of venture capital
investment activity.
The Related Markets Hypothesis predicts that PIPE price discounts received by PPI are
larger when the bargaining power of the PPI is higher relative to that of the issuing firms. The
evidence is consistent with this hypothesis. Specifically, we find that discounts are related to
conditions in the public equity markets and in the credit markets. Discounts are positively related
to IPO underpricing and negatively related to IPO volume. Tightness in the credit markets is
positively related to private placement discounts.
The bargaining theory also provides a different perspective on some of the more well
known cross-sectional patterns in discounts. For example, poorly performing and more opaque
(e.g., financially distressed) firms, which are likely to have relatively low bargaining power, tend
to incur higher PIPE price discounts.
We observe a positive relation between PIPE price discounts and the return on the market
over the 30 days prior to private placements. This relation, which is similar to that reported in
Lowry and Schwert (2004) for IPOs, suggests that the pricing of private placements does not
fully reflect public information and that public market conditions affect the issuing firms’ costs
of funds. It is consistent with firms and PPI setting prices prior to the transaction and not
adjusting for subsequent market movements. Specifically, our evidence is consistent with PIPE

3
prices generally being set 10 or more days in advance of the issue closing date.
In addition to price discounts, we examine the relation between market conditions and
both the gains realized by the original stockholders at the issuing firms (OS) and the increase in
total equity value associated with PIPE issues. We do this for two reasons. First, public market
conditions are likely to affect the total value created by PIPE financings as well as the relative
bargaining power of the firms and PPIs. Second, the increase in equity value arising from PIPE
issues appears to be substantial and yet we know little about what causes this increase. Wruck
(1989) observes an average abnormal return around PIPE issue announcements of 4.4 percent
when she measures this return over days -3 through 0 relative to the announcement days. She
also reports that a significant run up in stock prices occurs before the announcement period. The
cumulative average abnormal return (CAR) over days -59 through -4 equals just less than 6
percent and differs significantly from zero. Hertzel and Smith (1993) report similar findings,
with the four day announcement period CAR of 1.7 percent and the CAR for days -59 through -4
equaling approximately 7.8 percent.2
The paper is organized as follows. Section 2 summarizes previous research on PIPE price
discounts and presents a framework for analyzing the magnitude of gains from PIPE issues and
the gains received by the PPI and OS. Section 3 describes the data and Section 4 the empirical
evidence. Section 5 concludes.
2. Determinants of PIPE Issue Pricing
2.1 Previous Research
The prices of shares sold in PIPE issues are influenced by many of the same factors that
influence the pricing of shares in IPOs and SEOs. Consequently, the literatures on the pricing of
IPOs, SEOs, and PIPE issues have tended to focus on the same microeconomic explanations for
why primary equity sales typically involve discounts. This focus dates back to the early literature
in all three areas, including Rock (1986) and Beatty and Ritter (1986) on IPOs, Mikkelson and
Partch (1985) and Loderer, Sheehan, and Kadlec (1991) on SEOs, and Wruck (1989) and Hertzel
and Smith (1993) on PIPE issues, and continues today. Microeconomic explanations examined in
the literatures include agency considerations, uncertainty and asymmetric information, price
2 This CAR for days -59 through -4 is not given directly by Hertzel and Smith (1993) but may be deduced from the figures that they report in Table III on page 472 of their paper.

4
pressure, pre-offer price moves and manipulative trading, and transaction costs savings, among
others (Wruck, 1989 and Corwin, 2003).
SEOs and PIPE issues are similar in that they both tend to be sold at a discount.
However, the magnitudes of the discounts at which they sell differ considerably. Smith (1977)
was the first to show that SEOs are priced on average at a statistically significant discount to
contemporaneous secondary market prices. His findings have been confirmed in numerous
subsequent studies.3 Wruck (1989), Hertzel and Smith (1993), and Hertzel, Lemmon, Linck, and
Rees (2002) report that PIPE issues are also discounted relative to market prices, but that the size
of the discounts tend to be much larger for PIPE issues than for SEOs. For example, Corwin
(2003) finds that the average discount for his sample of SEOs equals 2.2 percent. Liu and
Malatesta (2007) report an average discount of 3.4 percent. For the sample of PIPE issues
analyzed by Hertzel and Smith (1993), though, the average discount is 20.1 percent and Hertzel
et al. (2002) report an average discount equal to 16.5 percent. Hence, discounts for PIPE issues
tend to be about five to nine times as large as those for SEOs. It is also of interest that discounts
in PIPE issues display much larger large cross-sectional variation than discounts in SEOs. For
this reason PIPE issue data presents an opportunity to conduct relatively powerful tests of
hypotheses about offer price discounts.
The extant literature on the impact of microeconomic factors on the pricing of PIPE
issues has focused on two general theoretical hypotheses. One of these stresses agency conflicts
between firm managers and stockholders. Wruck (1989) points out that PIPE issues tend to
concentrate stock ownership and to create blockholders. She argues that a transaction will
increase firm value if the blockholder uses his or her influence to improve the allocation of
corporate resources, or to promote a value-increasing takeover. Conversely, a transaction that
serves to entrench incumbent management will result in greater shirking and perquisite
consumption by managers and therefore will decrease firm value.
Hertzel and Smith (1993) acknowledge that PIPE issues might affect managerial
monitoring. They emphasize, however, the role that PIPE issues can play in resolving
informational asymmetries. Their model extends the analysis of Myers and Majluf (1984). They
assume that, at some cost, a private investor can observe the intrinsic value of an informationally
3 See, for example, Smith (1986), Loderer, Sheehan, and Kadlec (1991), and Altinkiliç and Hansen (2003) for discussions of this evidence.

5
problematic firm. Private placement price discounts compensate the investor for the cost of
becoming informed and the PIPE transaction itself signals to public investors that the selling firm
is undervalued. Hence, the firm’s stock price increases when news about the PIPE becomes
public.
The agency and asymmetric information hypotheses are complementary and both might
be useful in explaining aspects of PIPE issue pricing. Wruck (1989) finds a significant, nonlinear
relation between PIPE announcement period CARs and changes in stock ownership
concentration. This result tends to support the agency hypothesis. Hertzel and Smith (1993)
report that placement discounts and abnormal returns are both significantly related to proxies for
informational opacity and to the costs of assessing firm value. Wu (2004) also provides evidence
consistent with the asymmetric information hypothesis. In her study of PIPE issues and SEOs by
high-technology firms, Wu finds that several proxies for informational asymmetry are
significantly higher for PIPE issuers.
The extensive literatures on the pricing of IPOs, SEOs, and PIPE issues, reflects the
economic importance of these transactions. The prices at which firms sell their shares directly
affect their costs of capital and thereby the value of their investments. While the evidence
suggests that microeconomic factors help to explain equity prices, much remains unexplained. It
is plausible that prices in the market for private equity placements also depend upon public
equity market conditions and debt market conditions.
2.2. Public Capital Market Conditions and PIPE Issue Pricing
In this section we develop a model of the gains to PPI from PIPE issues and discuss the
implications of this model for the impact of capital market conditions on PIPE issue pricing.
2.2.1. A Model of Stockholder Gains
We begin by assuming that PIPE issues are associated with net gains in equity values.
These gains may be attributable to a variety of underlying sources. For example, the firm may
use the placement proceeds to undertake a positive net present value investment project. An
alternative possibility is that the equity placement facilitates a capital restructuring that mitigates
current or expected future financial distress and bankruptcy costs. Moreover, the gain might arise
from improved monitoring, as in Wruck (1989), or from the resolution of informational
asymmetry, as in Hertzel and Smith (1993). We denote the equity value added associated with a
6
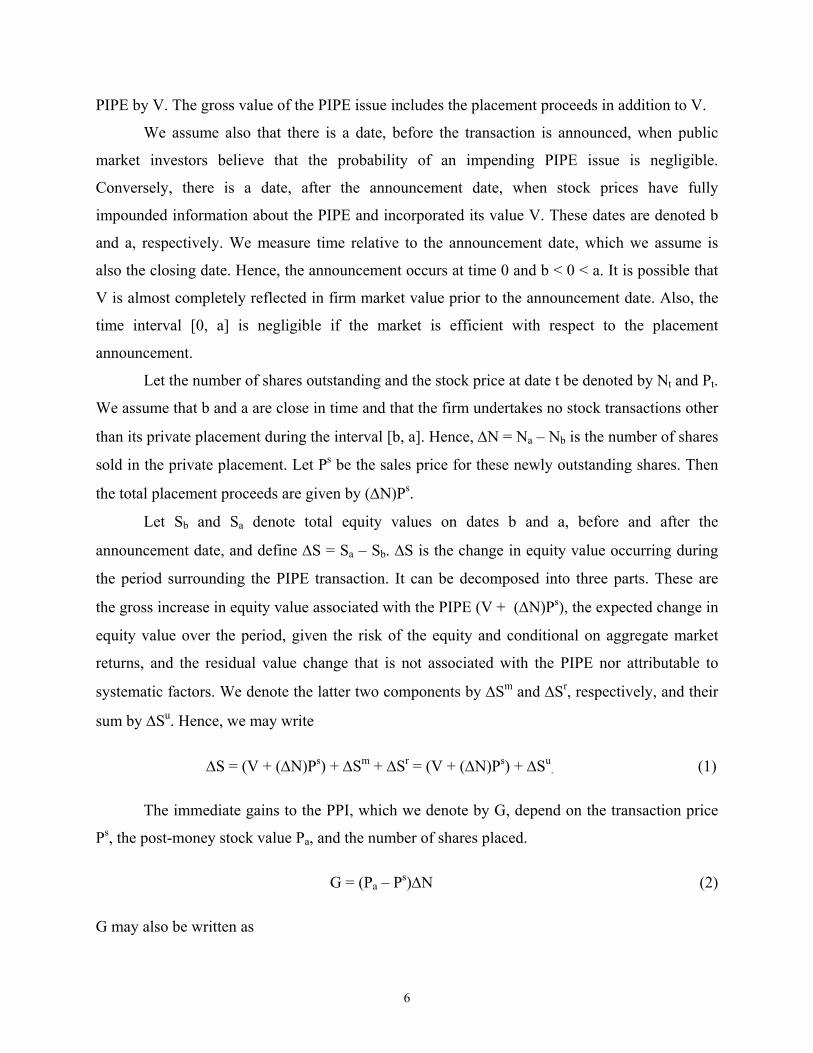
PIPE by V. The gross value of the PIPE issue includes the placement proceeds in addition to V.
We assume also that there is a date, before the transaction is announced, when public
market investors believe that the probability of an impending PIPE issue is negligible.
Conversely, there is a date, after the announcement date, when stock prices have fully
impounded information about the PIPE and incorporated its value V. These dates are denoted b
and a, respectively. We measure time relative to the announcement date, which we assume is
also the closing date. Hence, the announcement occurs at time 0 and b < 0 < a. It is possible that
V is almost completely reflected in firm market value prior to the announcement date. Also, the
time interval [0, a] is negligible if the market is efficient with respect to the placement
announcement.
Let the number of shares outstanding and the stock price at date t be denoted by Nt and Pt.
We assume that b and a are close in time and that the firm undertakes no stock transactions other
than its private placement during the interval [b, a]. Hence, ΔN = Na – Nb is the number of shares
sold in the private placement. Let Ps be the sales price for these newly outstanding shares. Then
the total placement proceeds are given by (ΔN)Ps.
Let Sb and Sa denote total equity values on dates b and a, before and after the
announcement date, and define ΔS = Sa – Sb. ΔS is the change in equity value occurring during
the period surrounding the PIPE transaction. It can be decomposed into three parts. These are
the gross increase in equity value associated with the PIPE (V + (ΔN)Ps), the expected change in
equity value over the period, given the risk of the equity and conditional on aggregate market
returns, and the residual value change that is not associated with the PIPE nor attributable to
systematic factors. We denote the latter two components by ΔSm and ΔSr, respectively, and their
sum by ΔSu. Hence, we may write
ΔS = (V + (ΔN)Ps) + ΔSm + ΔSr = (V + (ΔN)Ps) + ΔSu. (1)
The immediate gains to the PPI, which we denote by G, depend on the transaction price
Ps, the post-money stock value Pa, and the number of shares placed.
G = (Pa – Ps)ΔN (2)
G may also be written as
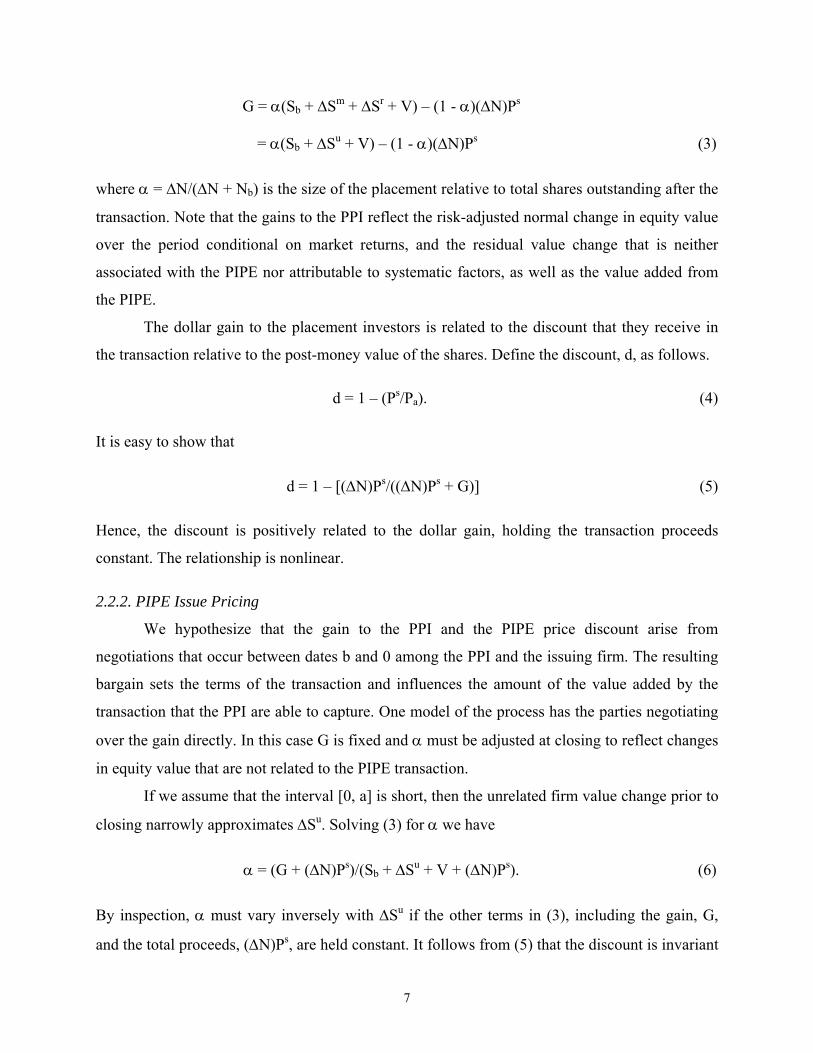
7
G = α(Sb + ΔSm + ΔSr + V) – (1 - α)(ΔN)Ps
= α(Sb + ΔSu + V) – (1 - α)(ΔN)Ps (3)
where α = ΔN/(ΔN + Nb) is the size of the placement relative to total shares outstanding after the
transaction. Note that the gains to the PPI reflect the risk-adjusted normal change in equity value
over the period conditional on market returns, and the residual value change that is neither
associated with the PIPE nor attributable to systematic factors, as well as the value added from
the PIPE.
The dollar gain to the placement investors is related to the discount that they receive in
the transaction relative to the post-money value of the shares. Define the discount, d, as follows.
d = 1 – (Ps/Pa). (4)
It is easy to show that
d = 1 – [(ΔN)Ps/((ΔN)Ps + G)] (5)
Hence, the discount is positively related to the dollar gain, holding the transaction proceeds
constant. The relationship is nonlinear.
2.2.2. PIPE Issue Pricing
We hypothesize that the gain to the PPI and the PIPE price discount arise from
negotiations that occur between dates b and 0 among the PPI and the issuing firm. The resulting
bargain sets the terms of the transaction and influences the amount of the value added by the
transaction that the PPI are able to capture. One model of the process has the parties negotiating
over the gain directly. In this case G is fixed and α must be adjusted at closing to reflect changes
in equity value that are not related to the PIPE transaction.
If we assume that the interval [0, a] is short, then the unrelated firm value change prior to
closing narrowly approximates ΔSu. Solving (3) for α we have
α = (G + (ΔN)Ps)/(Sb + ΔSu + V + (ΔN)Ps). (6)
By inspection, α must vary inversely with ΔSu if the other terms in (3), including the gain, G,
and the total proceeds, (ΔN)Ps, are held constant. It follows from (5) that the discount is invariant

8
with respect to ΔSu as well under these assumptions. Under these conditions the placement price
and quantity efficiently reflect public information regarding firm equity value that arrives before
the closing.
An alternative model supposes that the negotiating parties set ΔN and Ps at date b and do
not adjust them subsequently. Thus, α is fixed. It is obvious from (6) that in this case G must
vary directly with ΔSu. Thus, the PPI will share in equity value gains or losses occurring prior to
closing that are unrelated to the transaction value added. Public information that arrives between
the bargaining date b and closing is not efficiently impounded in the closing price and quantity.
The models of the bargaining process discussed above represent extreme cases. A
continuum of intermediate cases exists, as well. It is easy to imagine that PIPE issue prices and
quantities partially reflect public information regarding firm equity values that arrives before the
closing, but are not completely efficient with respect to that information. In this case, α would
vary inversely with ΔSu, but the PPI would share in equity value gains or losses occurring prior
to closing that are unrelated to the transaction value added. Hence, gains and discounts would be
positively related to ΔSu. The nature of this relation would depend on the relative bargaining
power of the firm and the PPI.
The possibility that the gains to PPI are positively related to ΔSu because prices are not
fully adjusted at closing is one mechanism through which conditions in other capital markets can
affect pricing of a PIPE issue. If ΔSm is not equal to zero, public equity market conditions would
affect gains and, potentially, PIPE price discounts. The impact of ΔSu on a discount is a
mechanical artifact of the initial terms of the bargain which reflect the relative bargaining power
of the PPI and the firm. This is one aspect of the Related Markets Hypothesis.
The Related Markets Hypothesis also suggests that the initial level of the discount is
affected by relative bargaining power. If capital is available to the firm at low cost from
alternative, public equity market or debt sources, then the firm’s bargaining position might be
relatively favorable and its original stockholders might be able to retain more of the value added
in the transaction than otherwise. Conversely, if conditions for raising capital in public equity
markets and debt markets are unfavorable, PPI might be able to capture a greater share of the
value added. Hence, the fraction of value added captured by PPI, G/V, would depend on capital
market factors that affect the availability and costs of alternative sources of capital and,

9
therefore, the relative bargaining positions of the parties. The value added captured by the PPI
will depend on both the initial value of the negotiated discount and the magnitude of any
adjustments for market movements prior to closing.
The effect of observed market conditions on the relative bargaining power of PPI and
firms will depend on the determinants of those conditions. For example, low financing activity
could result from a scarcity of capital or from a scarcity of attractive projects in which to invest
capital. The former would increase the bargaining power of the PPI and thereby increase
discounts. The latter, on the other hand, would put the bargaining power on the side of the issuer
and reduce discounts.
Independent of relative bargaining power, public equity market conditions can affect
PIPE price discounts through their impact on the value of the transaction (V). For any sharing
rule (G/V), changes in V will change the discount. The nature of the relations between conditions
in other capital markets and transaction value added by PIPE issues is not obvious. There are two
opposing hypotheses. The Risk Aversion Hypothesis holds that periods of relatively high capital
costs occur when investors believe that future investment returns are relatively risky. Future
payoffs arising from PIPE issues are discounted at high rates in such periods and their present
value is consequently small. Hence, transaction value added is negatively related to the level of
required returns in the public securities markets.
Alternatively, the Investment Opportunity Set Hypothesis says that high capital costs are
demand driven and occur during periods when the aggregate investment opportunity set is
relatively rich in projects with high expected future payoffs. Future expected payoffs from PIPE
issues are higher than usual under these conditions and their value added is large, despite the
high cost of capital. This hypothesis implies that transaction value added is positively related to
the level of required returns in the public markets.
Since capital market conditions are likely to affect both the bargaining power of PPI and
the value associated with PIPE transactions, their overall impact on discounts is ultimately an
empirical question. If conditions that enhance bargaining power are associated with relatively
poor projects, larger slices of smaller pies will not necessarily increase observed discounts.

10
3. Data
We begin with a sample of 2,341 PIPE transactions that closed between January 1, 1995
and June 11, 2004. This initial sample includes all PIPE issues involving common equity sales
that are included in the Sagient Research Systems database during this period. Following
Hertzel, Lemmon, Linck, and Rees (2002), we exclude transactions where the stock price is less
than $2 (694 issues). We also exclude 533 observations where the transaction is not the issuer’s
first transaction in the database. We do this because the typical second placement occurs only
eight months after the first placement. Hence, the extent of information asymmetries associated
with first and subsequent placements are likely to differ and so, too, would their effects on
transaction characteristics. This leaves a sample of 1,114 initial PIPE transactions involving
shares trading at a price of $2 or more. Two hundred and nine of these 1,114 observations are
lost because the issuing firms are not included in the Standard and Poor’s Compustat or Center
for Research in Security Prices (CRSP) databases (194 observations) or because the gross
proceeds reported in the Sagient Database differ from the product of the reported offer price and
the number of shares issued by more than 2 percent of that product (15 observations). This leaves
us with a final sample of 905 initial PIPEs at 905 distinct firms.
We obtain data on firm financial and governance characteristics around the time of each
private placement from the Compustat, CRSP, and Thompson Financial Disclosure databases.
Data from Compustat are used to compute the ratio of property, plant and equipment to book
assets (PPE/Assets), the ratio of the market value of assets to the book value of assets (Market-
to-Book) as of the end of the fiscal year ending immediately preceding the placement, and the
ratio of operating income in the year of the transaction to assets at the beginning of the year
(OROA). We create an indicator variable that equals one if the unadjusted OROA is negative
during both of the two fiscal years immediately preceding the private placement and zero
otherwise. This indicator, which we use to identify firms that are likely to be financially
distressed, is designated “Distress”.4
Data from CRSP are used to compute abnormal returns around each private placement
announcement, the discount at which shares are sold, the market capitalization of each firm prior
4 This definition is consistent with those used in Hertzel and Smith (1993) and Wu (2004). In both of these papers firms with negative earnings in the two years prior to placement are considered to be financially distressed.

11
to the placement, and the aggregate change in each firm’s market capitalization around the
private placement. The Disclosure database, which contains information from proxy statements
and 10K reports filed by each firm with the Securities Exchange Commission (SEC), is used to
obtain information on officer and director ownership, ownership of blockholders, ownership by
institutional investors, and the fraction of directors who are not officers of the firm in the year of
the private placement.
Transaction characteristics are largely provided by Sagient, but are supplemented with
additional information that we are able to obtain from reviews of the financial press and the SEC
Edgar database. Sagient reports a number of characteristics for each PIPE, including the selling
company name and industry, identities of the investors, number of shares sold, transaction price,
closing date, filing date if the issue was subsequently registered with the SEC, whether a
placement agent was used by the firm, and the exchange on which the shares trade.
We also obtain information on whether insiders participate in each of the 905 placements
by searching the SEC Records on Trading of Securities by Corporate Insiders, 7/11/1978 -
3/12/2001, which is available on the National Archives web site at http://aad.archives.gov/aad/,
and by directly searching the SEC’s Edgar database for Form 4 (Statement of Changes in
Beneficial Ownership) filings. We consider an insider to have participated in the placement if the
transaction date involving the insider is within two trading days of the closing date of the PIPE
transaction listed in the Sagient database and if the transaction price equals the per share
purchase price reported by Sagient.
We obtain monthly data on the number of IPOs and average IPO underpricing from the
web site maintained by Jay Ritter at the University of Florida.5 Similar to Gompers, Kovner,
Lerner, and Scharfstein (2008), we use these data as measures of perceived investment
opportunities.
Monthly credit and term spread data are acquired from the Federal Reserve web site.6
These data are used as proxies for the cost of capital and the general availability of credit. The
yield on 10-year treasury bonds reflects the availability of capital to the extent that Treasury rates
are higher in tight credit markets. We use the difference between the yields on Baa and Aaa rated
corporate debt as a proxy for the cost of credit risk.
5 See http://bear.cba.ufl.edu/ritter/ipodata.htm. 6 See http://research.stlouisfed.org/fred2/.
12
4. Results
4.1. Descriptive Statistics
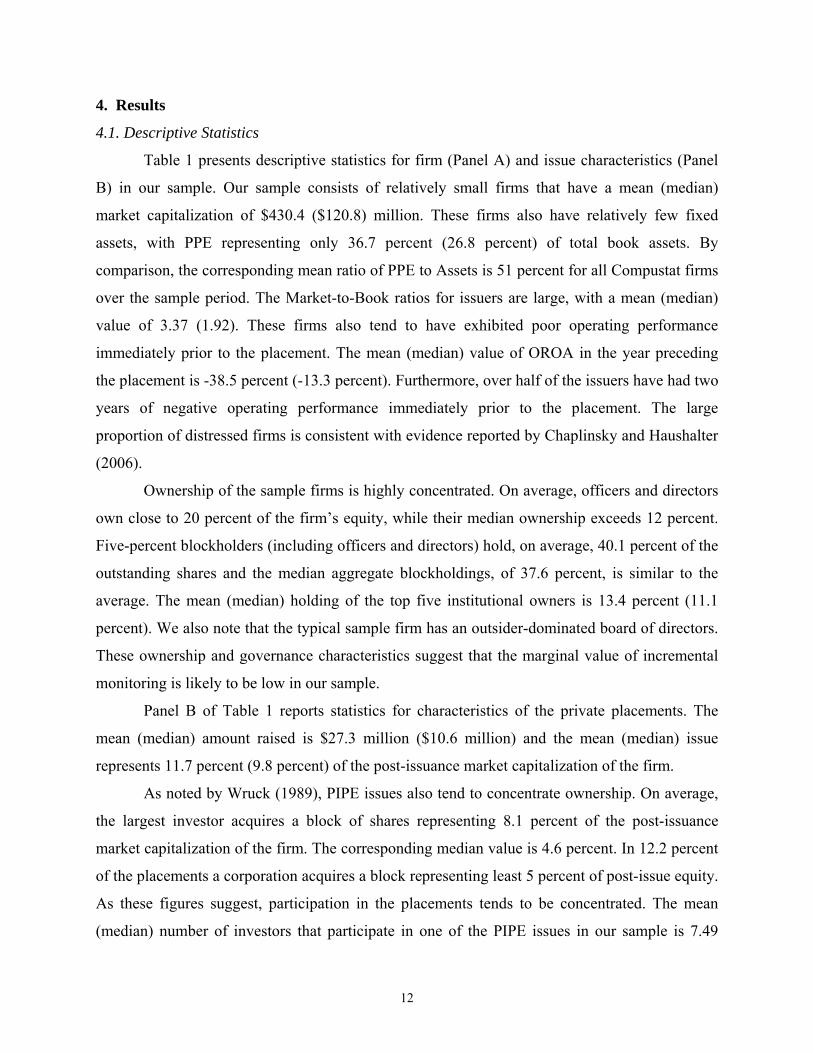
Table 1 presents descriptive statistics for firm (Panel A) and issue characteristics (Panel
B) in our sample. Our sample consists of relatively small firms that have a mean (median)
market capitalization of $430.4 ($120.8) million. These firms also have relatively few fixed
assets, with PPE representing only 36.7 percent (26.8 percent) of total book assets. By
comparison, the corresponding mean ratio of PPE to Assets is 51 percent for all Compustat firms
over the sample period. The Market-to-Book ratios for issuers are large, with a mean (median)
value of 3.37 (1.92). These firms also tend to have exhibited poor operating performance
immediately prior to the placement. The mean (median) value of OROA in the year preceding
the placement is -38.5 percent (-13.3 percent). Furthermore, over half of the issuers have had two
years of negative operating performance immediately prior to the placement. The large
proportion of distressed firms is consistent with evidence reported by Chaplinsky and Haushalter
(2006).
Ownership of the sample firms is highly concentrated. On average, officers and directors
own close to 20 percent of the firm’s equity, while their median ownership exceeds 12 percent.
Five-percent blockholders (including officers and directors) hold, on average, 40.1 percent of the
outstanding shares and the median aggregate blockholdings, of 37.6 percent, is similar to the
average. The mean (median) holding of the top five institutional owners is 13.4 percent (11.1
percent). We also note that the typical sample firm has an outsider-dominated board of directors.
These ownership and governance characteristics suggest that the marginal value of incremental
monitoring is likely to be low in our sample.
Panel B of Table 1 reports statistics for characteristics of the private placements. The
mean (median) amount raised is $27.3 million ($10.6 million) and the mean (median) issue
represents 11.7 percent (9.8 percent) of the post-issuance market capitalization of the firm.
As noted by Wruck (1989), PIPE issues also tend to concentrate ownership. On average,
the largest investor acquires a block of shares representing 8.1 percent of the post-issuance
market capitalization of the firm. The corresponding median value is 4.6 percent. In 12.2 percent
of the placements a corporation acquires a block representing least 5 percent of post-issue equity.
As these figures suggest, participation in the placements tends to be concentrated. The mean
(median) number of investors that participate in one of the PIPE issues in our sample is 7.49
13
(2.00). To further characterize investor concentration we construct a Herfindahl-type index for
each private placement equal to the sum of the squared fractions of the placement purchased by
each of the participating investors. This index is logically bounded between zero and one. In our
sample it has a mean (median) value of 0.61 (0.58).
The other statistics in Panel B indicate that management participated as a buyer in only
7.0 percent of the issues. Placement agents are used in 51.8 percent of the placements and the
issuing firm manages the remaining 48.2 percent. Trading of privately placed shares tends to be
initially restricted in most cases. We examine form S-3 registration statements obtained from the
SEC’s EDGAR database for each firm for a period of six months following the placement date.
Within one week of the placement 12.8 percent of our sample issues are registered and 87.2
percent remain unregistered. However, though we do not report this in Table 2, we find that
within three months of the placement, approximately 41.8 percent of all issues have been
registered. The high frequency of registrations within the first three months suggests that PIPES
are more liquid than is commonly assumed. Registration rights are a common feature in private
placement agreements, especially in recent years. We also note that 6.7 percent of the issues are
placements of shelf-registered securities. This 6.7 percent is included in the 12.8 percent and
41.8 percent figures above.
Table 2 reports measures of the impact of private placements on the wealth of the PPI and
the OS. We present statistics for measures of the discount received by the PPI in Panel A. As in
equation (4), we measure the discount relative to the value of the shares observed after the
placement, on date a. Two measures of the discount are calculated. For one we set date a equal to
1 day after the placement date. For the other we match the procedure in Hertzel and Smith (1993)
and set date a equal to 10 days after the placement date. The two measures are denoted by d(1)
and d(10), respectively. As the table shows, the mean discount d(1) equals 13.52 percent and the
median is 12.79 percent. The mean and median values of d(10) are similar—13.49 percent and
13.27 percent, respectively. These values are similar to those reported elsewhere in the literature.
Panel A of Table 2 also reports statistics for the dollar gains received by the PPI. The
dollar gain, G, is measured by multiplying the number of shares placed by the difference
between the post-placement share price at date a and the placement transaction price, as in
equation (2). Again, we calculate two measures, one with a set equal to day 1, G(1), and the
other with a set equal to day 10, G(10). The mean (median) value of G(1) amounts to $2.86

14
($1.35) million and represents a mean (median) return of 21.03 percent (14.67 percent) to the
PPI. The mean and median dollar gains and returns to PPI are similar when measured relative to
the stock price on day 10.
Panel B of Table 2 presents the abnormal stock returns around the announcement of the
placement. We measure abnormal returns using a Dimson (1979) type of market model that
includes the contemporaneous market return as well as one lead and one lag of the market return.
Our proxy for the market is the equally-weighted CRSP index. We use the equally-weighted
index because our sample firms tend to be small. The equally-weighted index explains the stock
returns of small firms better than the value-weighted index. We include the lagged and leading
market returns in the model to mitigate the effects of nonsynchronous trading on measured
abnormal returns. For the three-day event window from day -3 to day 0, [-3, 0], we observe a
statistically significant (p-value < 0.01) 2.70 percent mean cumulative abnormal return (CAR).
This CAR is larger than the 1.7 percent four-day return reported by Hertzel, Lemmon, Linck, and
Rees (2002), but smaller than the 4.4 percent three-day value reported by Wruck (1989). For the
[-10, 0] window, the mean CAR is 4.70 percent. This ten-day return is consistent with results
reported in Wruck (1989). Her analysis reveals an average CAR over the [-10, 0] window of 5.48
percent. There appears to be significant information leakage prior to the announcement. Because
of this, we measure wealth changes relative to day -10 in the remainder of our analysis.
Panel C presents statistics on the total and market-adjusted returns to the OS, Return to
OS[-10, a]. The mean (median) raw returns to OS are 8.80 percent (3.52 percent) and 11.36
percent (3.82 percent) over the windows ending on days 1 and 10, respectively. The
corresponding mean (median) market-adjusted returns are 6.20 percent (2.45 percent) and 7.40
percent (2.81 percent).
Throughout the rest of Section 4 we report evidence for d(10), RVA[-10, 10], and Return
to OS[-10, 10] because day 10 has generally been used in previous private placement studies as
the terminal valuation date. The evidence relative to day 10 is generally similar to that relative to
day 1. However, we focus our discussion on the evidence relative to day 1 because we find that,
for our sample, the gains around private placements are typically reflected in prices by day 1.
This can be seen in Panel B of Table 2.
Finally, Panel D of Table 2 presents evidence on the equity value-added around PIPE
issues. We compute two measures of value-added, one raw and one market-adjusted measure. If

15
we assume that the systematic component of the equity value change around the placement, ΔSm,
equals zero and note that E(ΔSr) = 0, it follows from equation (1) that E(ΔS - (ΔN)Ps) = E(V +
ΔSm + ΔSr) = E(V). Therefore, if we ignore the market driven component of stock price changes,
the change in total equity capitalization around the placement less the placement proceeds is
unbiased for V, the transaction value-added. It also follows that E(ΔS - (ΔN)Ps) = (Pa – Pb)Nb +
(Pa – Ps)∆N. Hence, the change in total capitalization, net of the placement proceeds, equals the
sum of the dollar gains to the OS and the PPI. We set b equal to day -10 and set a either to day 1
or day 10 to compute this sum, the estimate of value-added. We then divide this estimate by the
sum of the day -10 market capitalization plus the gross proceeds from the issue to obtain a
measure of relative value-added. We denote this measure by RVA[b, a].
We also compute market-adjusted versions of these measures. In these versions we adjust
for market movements by removing the market component of return over the period [b, a]. To do
this we compute an adjusted terminal stock price that removes the systematic component of the
stock price change over the interval. The adjusted terminal price, which we denote by, Paadj,
equals the price before the placement multiplied by (1 + CAR[b, a]). The market-adjusted
relative value-added is computed substituting Paadj for Pa in the procedures described above. This
market-adjusted variable captures the net change in firm value arising from the capital infusion.
Over the [-10, 1] window, the mean (median) for the unadjusted estimator of relative
equity value-added is 10.37 percent (8.07 percent) and the mean (median) for the market-
adjusted estimator is 8.07 percent (3.86 percent). For the period [-10, 10], the corresponding
mean (median) numbers are 12.86 percent (5.43 percent) and 8.88 percent (3.93 percent),
respectively. These numbers are larger than the CARs reported in Panel B because they include
the returns to the PPI. The magnitudes of the differences between the unadjusted and the
corresponding market-adjusted values suggest that private placements tend to take place during
periods when aggregate stock market returns are positive.
The increase in the overall level of PIPE activity from the late 1990s to the early 2000s
was accompanied by changes in some PIPE issue characteristics. Figure 1 provides insights on
these changes over the 1995 to 2004 period. Figure 1a shows that the increase in aggregate PIPE
activity around 2000 is evident in our sample. Despite this increase, Figures 1b and 1c show no
perceptible trends in 3-day stock price reactions to PIPE announcements or average gross
proceeds per issue. The stock market appeared to find PIPE announcements no more or less
16
surprising in the latter part of the sample period. Noteworthy changes in Figure 1 are the declines
in the magnitude of the discount received by the PPI in Figure 1c and in the relative value added,
RVA[-10,1], and returns to the original stockholders, Return to OS[-10, 1], in Figure 1d. Overall,
equity values of issuing firms increase less over the [-10, 1] period in the latter part of the sample
period and this is reflected in returns to the OS.
4.2. Capital Market Conditions and PIPE Activity
Figure 1a shows considerable time series variation in the level of PIPE activity over our
sample period. A question raised by the theory we examine in this paper is whether some of this
variation is attributable to changes in conditions in other parts of the capital markets. The Related
Markets Hypothesis does not explicitly predict that the overall level of PIPE activity should be
related to capital market conditions elsewhere as it is only a statement on the relations between
these conditions and the relative bargaining power of issuing firms and PPI. Nevertheless, if
capital market conditions do affect relative bargaining power, we might also expect to observe
that the overall level of PIPE activity is related to these conditions. In this section we provide
evidence of such a relation.
Table 3 presents descriptive statistics for indicators of capital market conditions around
the time of the PIPE issues in our sample. All of the reported unadjusted measures are
significantly different from zero with p-values of less than 0.01. P-values for the adjusted
measures are reported in the last column.
Panel A reports measures of the return on the equally-weighted CRSP index over the 30
trading-day period preceding the PIPE announcements. The unadjusted value in the first column
is the average return on the equally-weighted index over the indicated measurement window
relative to the announcement date. The adjusted market return is estimated as follows. We first
randomly select 9,050 days during the sample period (10 days for each observation) and
calculate the equally-weighted return for all firms on CRSP over each of the indicated
measurement windows (e.g., day -30 to -21, day -20 to 11 and so on ) relative to the selected
days. The average, across the 9,050 observations, for each of the indicated measurement
windows, is then calculated to obtain a measure of the typical returns that might be expected
over the indicated measurement window during the sample period. The adjusted values reported
in Panel A equal the differences between the unadjusted values and the typical returns calculated
this way.
17
The evidence in Panel A is consistent with the evidence in Table 2. PIPE issues tend to
occur when the stock market is performing well. The mean (median) unadjusted return over the
30 days prior to private placement announcements is 5.02 percent (5.47 percent). This number is
1.11 percent (1.57 percent) larger than the expected 30-day return. Similar differences are
observed over each of the 10-day periods in this window. These differences between the
unadjusted and adjusted values are both economically and statistically significant and suggest
that either firms time private placements or general stock market conditions have a significant
impact on the ability of firms to sell equity privately.
Panel B of Table 3 presents statistics for other capital market conditions. Here the
adjusted values are calculated by subtracting the mean value over the entire sample period of the
indicated variable from the unadjusted number. Panel B reveals that the mean (median)
underpricing across all IPOs in the month prior to a PIPE issue is 33.74 percent (19.20 percent).
This is 8.43 percent (-6.11 percent) higher than mean underpricing over the entire sample period.
The median adjusted value is not significantly different from zero.
The statistics for the No. of IPO Issues show that PIPE issues tend to take place when the
overall level of IPO activity is low. On average, the month preceding a private placement has 4.5
fewer IPOs than an average month during the sample period and 14 fewer IPOs at the median.
The rate on 10-year Treasury bonds is, on average, 13 basis points lower in the month
immediately preceding private placement announcements than during other periods. On the other
hand, the difference between Baa and Aaa yields in the month prior to private placements is, on
average, 7 basis points higher than in other months.
Table 4 reports coefficient estimates from ordinary least squares (OLS) and Poisson
regressions that provide evidence on the relations between capital market conditions and the
overall level of PIPE activity.7 These models are estimated using monthly data over the period
from January 1995 through December 2003. The dependent variable in Models 1 through 4 is the
total capital raised by the firms in our sample in a given month. The dependent variable in
Models 5 through 8 is the number of private placements in our sample in a given month. We
exclude observations from 2004 from this analysis because our sample period ends on June 11,
2004 and observations are most likely to be missing during the last few months of the sample
period. Nevertheless, the evidence is similar if we estimate the regressions using data through
7 See Maddala (1983, p. 51 – 54) for a discussion of Poisson regression models.
18
May 2004.
The evidence in Table 4 is consistent with the theory that capital market conditions are
related to overall activity in the PIPE market. Comparison of the adjusted R2 values in Models 1
through 4 reveals that over 15 percent of the variation in the dollar value of capital raised
through PIPE issues is explained by capital market conditions. In fact, the adjusted R2 in Model
4, of 0.447, is 17.6 percent higher than the corresponding value of 0.271 when the model is
estimated with only the year dummy variables (not reported in the table). Furthermore,
examination of the coefficient estimates in Model 8 reveals that the number of private
placements is greater when the stock market has recently been performing well, when both the
number of IPO issues and IPO underpricing have recently been relatively high, and when the 10
Year Treasury Rate is high. The implications of the evidence for the number of IPO issues and
the Treasury rate from the regressions are different from those in Table 3, reflecting the
importance of controlling for time trends. Overall, the evidence in Table 4 suggests that PIPE
issues occur more frequently when market valuations have been increasing, when equity capital
in the public market is scarce relative to demand, and when alternative sources of capital are
more costly.
4.3. Capital Market Conditions and Discounts, Gains to OS, and Transaction Value-Added
The Related Markets Hypothesis holds that public capital market conditions affect the
relative bargaining power of firms and PPI and, therefore, observed PIPE price discounts. To test
this hypothesis we examine the determinants of PIPE price discounts using multivariate
regression analysis. This analysis provides evidence on the incremental impact of market
conditions on measures of gains to PPI while controlling for firm and issue characteristics that
other studies have found to be related to discounts. Since capital market conditions can affect
price discounts through their affects on the total value of transactions, we also examine the
determinants of the returns to the OS and total gains to investors around PIPE announcements for
evidence on the Investment Opportunity Set and Risk Aversion hypotheses.
4.3.1 Price Discounts
Table 5 presents coefficient estimates from regression models that predict the private
placement discount, d(a). In the first two columns, the discount is measured relative to the stock

19
price on day 1. In the third and fourth columns, the discount is measured relative to the stock
price on day 10.
The model in the first column of Table 5 includes variables representing firm and issue
characteristics that have been examined in previous studies of PIPE price discounts. The
coefficient estimates in this column indicate that d(1) is negatively related to firm size (Natural
Log of Market Capitalization), an indicator that a corporation acquires at least five percent or
more of the firm’s equity in the placement (Corporate Blockholder), investor concentration as
proxied by the Herfindahl index (Investor Concentration), and an indicator of whether an officer
or director participates in the placement (Insider Participation). The evidence that discounts tend
to be larger at smaller firms is consistent with evidence reported elsewhere, such as in Hertzel
and Smith (1993). The negative relation with the Corporate Blockholder variable is consistent
with evidence reported by Wruck and Wu (2009) that the discounts required by corporate
investors tend to be smaller than discounts required by other investors. The relation with Investor
Concentration is consistent with that reported by Hertzel and Smith (1993). Discounts tend to be
greater when there is less concentration among the investors.
The negative relation with Insider Participation suggests that insiders are more likely to
participate when discounts are smaller. This evidence differs from that reported by Hertzel and
Smith (1993), who found no relation between the discount, measured relative to day 10, and
Insider Participation. It also differs from the findings in Wu (2004). Wu reports that managerial
participation is associated with significantly higher discounts. The evidence in Table 5 is
inconsistent with managerial self-dealing. In our sample, managers do not appear to participate
only when they can deal themselves large discounts. The negative relation between d(1) and
Insider Participation might indicate that managers invest in higher quality issues or that investors
require a smaller discount when managers invest alongside of them.
The negative relations with firm and issue characteristics in the first column of Table 5
provide insights concerning the relative bargaining power of the PPI and the issuing firms. For
instance, the negative relation between d(1) and firm size suggests that smaller firms tend to hold
weaker bargaining positions when they seek to place private equity. This is not surprising. Small
firms have more limited access to public capital markets than do large firms.
The evidence for the Corporate Blockholder variable is consistent with the conclusion
drawn by Wruck and Wu (2009) that relational investors tend to invest in higher quality firms. If

20
high quality firms are in a better bargaining position than low quality firms, we would expect to
observe smaller discounts associated with private placements by the high quality firms.
The evidence for the Investor Concentration variable also can be interpreted as telling us
something about relative bargaining power. Discounts are greater where a PIPE issue is sold to a
large number of investors than to a small number. This supports the hypothesis that firms with
weaker bargaining positions not only discount more heavily, but that they also have more
difficulty placing the issue with a small number of investors. In other words, individual PPI are
unwilling to take up large fractions of these risky issues.
The coefficient estimates in the first column of Table 5 also indicate that d(1) is
positively related to our distress indicator variable (Distress). This suggests that distressed firms
find it necessary to discount more heavily in order to attract investors. One possible explanation
for this is that financially distressed firms are in a poor bargaining position.
The model in the second column in Table 5 contains the same variables for firm and issue
characteristics that are included in the first column, along with variables related to capital market
conditions. Adding the capital market condition variables does not qualitatively change the
observed relations for the firm and issue characteristic variables. The evidence indicates,
however, that market conditions influence discounts in private placements. The coefficient
estimates on the three variables for stock market returns immediately preceding the placement
(EW Mkt. Return[-10, -1], EW Mkt. Return[-20, -11], EW Mkt. Return[-30, -21]) are all positive
and significant at the 1 percent level. It follows that the prices set for private placement issues are
sticky in the sense that they do not change as much as stock market prices in general leading up
to the private placement dates. This is consistent with the idea that the placement price is set at
some point in advance of closing and is not changed to reflect recent changes in the stock
market. It is also consistent with evidence reported in Lowry and Schwert (2004) that IPO prices
do not fully reflect public information that becomes available between the date that the offer
price range is set and the offering date.
We also observe in the second column of Table 5 that credit market conditions are related
to the magnitudes of discounts. In particular, the positive relation between the 10 year Treasury
rate and the discount indicates that issuing firms must discount more heavily when interest rates
are high. If Treasury bond rates reflect, at least in part, tightness in the credit markets, this
evidence supports the view that private placement discounts are larger when debt capital is

21
relatively scarce.
Overall, adding the variables for capital market conditions in the second column
increases the explanatory power of the d(1) model substantially. The adjusted R2 increases from
0.126 in the first column to 0.200 in the second. The hypothesis that the coefficient estimates for
all of the capital market condition variables are jointly zero is rejected at the 1 percent level by
an F-test.
The models in the third and fourth columns are similar to those in the first two columns,
except that the dependent variable is the discount measured relative to the market price on day
10. We observe several differences in the coefficient estimates for the firm and issue
characteristics when we change the terminal valuation date. When the discount is measured
relative to day 10, the coefficient estimates on firm size remain negative, but are less significant.
In addition, the impact of insider participation is no longer significant. This result is consistent
with that reported in Hertzel and Smith (1993), who also estimate the discount relative to day 10.
Finally, the measure of financial distress is not significantly related to d(10).
The changes we observe in the coefficient estimates in the third and fourth columns in
Table 5 are interesting in light of the similar average values that are reported in Panel A of Table
2 for d(1) and d(10), 13.52 percent and 13.49 percent, respectively. The evidence in Table 5
indicates that even though the mean values are similar, there are cross-sectional differences in
discounts when they are measured relative to different dates. These changes are driven by
changes in the placement firms’ stock prices over the interval [1, 10]. One possible explanation
for these changes is that the volatility of small firm prices increases more than that of large firm
prices following private placements, that insider participation is greater among small firms, and
that small firms are more likely to be distressed. Consistent with this explanation, examination of
the correlations between the independent variables in Table 5 reveals significant negative
correlations between Insider Participation and Natural Log of Market Capitalization and between
Distress and Natural Log of Market Capitalization.
The evidence for the capital market condition variables in the fourth column is consistent
with that in the second column. The coefficient estimates on the equally-weighted market return
variables are all positive and two are significant at the 5 percent level. It is interesting that the
coefficient estimates on the two IPO variables that have the same signs as the estimates in the
second column, are both significant at the 10 percent level. These coefficient estimates suggest

22
that IPO market conditions are related to the magnitude of private placement discounts relative to
day 10 stock prices. Discounts are larger when IPO underpricing is greater. This supports the
hypothesis that discounts are an increasing function of the costs of alternative sources of funds in
the public equity markets. Discounts are small when the IPO market is hot in the sense that there
are more issues.8 This relation and the positive relation between discounts and aggregate
underpricing are consistent with the notion that reduced public market activity reflects a scarcity
of capital.
The coefficient estimate on the 10-year Treasury rate has the same sign in the fourth
column of Table 5 as in the second, but it is not statistically significant. Similar to the IPO
market coefficient estimates, the estimates for the credit spread have the same signs in both
columns two and four and are significantly different from zero in column four. These negative
coefficient estimates reflect an unusual relation between the Baa rate and the Aaa rate during our
sample period. During this period, the Baa rate remained relatively constant while the Aaa rate
moved up and down according to credit market conditions. The negative coefficient estimates for
the credit spread variables are therefore consistent with the notion that discounts are larger when
credit market conditions are tighter. In other words, during our sample period, the Baa – Aaa
spread variable is highly negatively correlated with the 10 year Treasury yield variable
(correlation coefficient of -0.672).9
4.3.2 Return to the Original Stockholders
In Table 6 we examine returns to the OS using the same firm, issue, and capital market
condition variables that we use as explanatory variables in Table 5. In the first two columns of
Table 6 the return to the OS is measured over the period from day -10 to day 1 (Return to OS[-
10, 1]). The coefficient estimates for the firm and issue characteristic variables in the first and
second columns indicate that returns to OS of small firms are greater than returns to OS of large
firms. This evidence, in conjunction with evidence in Table 7 that we will discuss shortly,
indicates that private placements tend to be relatively more important events at smaller firms.
8 The No. IPO Issues variable in the regression models in Tables 5 through 8 is the standardized number of IPO issues in the month before the month in which the private placement takes place. For example, it has a value of 1 if the number of IPOs is one standard deviation above the monthly average number of IPOs over the sample period. Similarly, it has a value of 2 if the number of IPOs is two standard deviations above the monthly mean, and so on. 9 We also estimated the regression models using the lagged monthly total return on long-term corporate bonds as a measure of changes in corporate bond yields. This variable is negatively and significantly related to both d(1) and d(10). The implied relations in all other analyses were also similar to those for the credit-spread variable.
23
In the first column of Table 6, the Return to OS[-10, 1] is positively related to the market-
to-book ratio, the size of the issue (Natural Log of Proceeds), Corporate Blockholder, and an
indicator variable that equals one if the issue is not registered within one week of the issue (Not
Immediately Registered). The positive coefficient estimate for Market-to-Book is consistent with
the idea that firms with more growth options have better investment opportunities and that
competition between investors for these firms’ projects enhances the issuing firms’ bargaining
position. It is also consistent with the theory that high growth option firms simply have more
valuable projects and that private placements allow them to take advantage of these more
valuable projects.
The positive relation between Return to OS [-10, 1] and Natural Log of Proceeds is
consistent with the theory that raising a large amount of capital sends a positive signal to the
market about a firm’s prospects. On the other hand, it might simply indicate that large positive
NPV projects require more money. The evidence in Table 6 also suggests a positive relation
between Corporate Blockholder and Returns to OS. Recall that the evidence in Table 5 shows a
negative relation between Corporate Blockholder and discounts received by PPI. Taken together,
these results are consistent with the hypothesis that the participation of a corporate investor
serves to reduce information asymmetry and to certify firm value. This evidence also supports
the notion that corporations tend to invest in firms that have relatively strong bargaining
positions. Finally, the positive coefficient estimate for the registration indicator variable tells us
that the returns to OS are greater in placements where liquidity is not of immediate concern to
the PPI.
The negative coefficient estimate on the Placement Agent variable indicates that Return
to OS [-10, 1] tends to be more than three percent less when a placement agent is used than when
the firm manages the offering itself. This result is not surprising. The presence of a placement
agent is indicative of relative bargaining power. Placement agents are more likely to be
employed by firms that are in weak bargaining positions and, therefore, value assistance in
raising capital.
The second column of Table 6 reports coefficient estimates for the capital market
conditions variables. There is a positive and significant relation between the equally-weighted
market return over days [-10, -1] and Return to OS[-10, 1]. Since the returns to the OS are not
market-adjusted, this relation is mechanical and serves to partially market-adjust Return to OS[-

24
10, 1]. The market returns over the windows [-20, -11] and [-30, -21] are not significantly related
to Return to OS[-10, 1]. This is in contrast to the evidence in Table 5 for the discount, d(1),
which is positively and significantly related to the market returns over both of these windows.
This difference is due to the difference in the base prices used to calculate the Return to OS[-10,
1] and d(1). Return to OS[-10, 1] is based on the price on day -10, which appears to reflect
public information up to that day. The basis for d(1) is the offering price set at some unknown
point prior to the issue. The results in Table 5 imply that this offering price does not reflect all of
the information that is publicly available during the period immediately prior to the placement.
The figures in the second column of Table 6 also show that returns to OS are significantly
related to conditions in the IPO market. Return to OS is increasing in IPO underpricing and
decreasing in the number of IPOs. In discussing Table 5 we interpreted high levels IPO
underpricing and low numbers of new issues as indicating a scarcity of capital. The evidence in
Table 6 also supports this interpretation. As capital becomes scarce, the quality of the marginal
project must be higher to attract investment. This would result in high average returns to original
stockholders when funds are expensive and IPO activity is low. We also note that, for a given
level of underpricing, an increase in the number of new issues increases competition for funds.
This, in turn, should reduce the bargaining power of firms raising capital.
The coefficient estimate on the 10-year Treasury rate is positive in the second column of
Table 6. High Treasury rates imply tight capital markets and high costs of capital. We should
observe high returns to OS when credit market conditions tighter if only projects with large
NPVs attract financing in tight credit markets.
The coefficient estimates in the third and fourth columns of Table 6 are qualitatively
similar to those in the first and second columns, although, as is the case in Table 5, some
significance levels have changed. Note again how the adjusted R-squared changes when the
capital market condition variables are included in these models. This measure of the explanatory
power of the model increases from 0.074 in the first column to 0.199 in the second and from
0.036 in the third column to 0.135 in the fourth.
4.3.3 Equity Value-added around Private Placements
Table 7 presents coefficient estimates from regression models where the dependent
variable equals the relative equity value-added from day -10 to day 1 (RVA[-10, 1]) or to day 10
(RVA[-10, 10]). These variables represent relative measures of the change in equity value, ΔS,
25
less the placement proceeds, (ΔN)Ps, that appear in equation (1). By inspection of the equation, it
is clear that, (ΔS - (ΔN)Ps) reflects the sum of the valued added associated with the PIPE, the
expected change in equity value over the period, given the risk of the equity and conditional on
aggregate market returns, and the residual value change that is neither associated with the PIPE
nor attributable to systematic factors. Hence, this measure does include the expected change in
equity value. We do not use the market-adjusted versions of these measures in these regressions
because the independent variables in columns two and four include market returns.
The coefficient estimates in the first column of Table 7 indicate that RVA[-10, 1] is
negatively related to the Natural Log of Market Capitalization and the Placement Agent
indicator. The negative relation with the Natural Log of Market Capitalization simply indicates
that, holding the dollar value of the issue constant (Natural Log of Proceeds), smaller returns are
associated with private placements at larger firms. The coefficient estimate for the Placement
Agent indicator suggests that the announcement of a private placement by a firm which finds it
necessary to use a placement agent conveys negative information to the market.
The relative equity value-added is positively related to Market-to-Book, the residual
standard deviation from a market model regression that is estimated over the period -300 to -51,
relative to the issue date, using the CRSP equally-weighted index, the Natural Log of the
Proceeds, the presence of a Corporate Blockholder, and the Not Immediately Registered
indicator. The relation with Market-to-Book is consistent with the idea that proceeds from
private placements by high growth option firms are expected to be used more productively than
proceeds received by low growth option firms. We interpret the positive relation between the
Natural Log of Proceeds and total gains as we did the positive relation between proceeds and
returns to original stockholders. Raising large amounts of capital sends a strongly positive signal
or projects with large positive NPVs require large investments. The relations with Corporate
Blockholder and the Not Immediately Registered variables indicate that corporate and long-term
investors are associated with more productive uses for the proceeds from the issue. Finally, the
coefficient for the Residual Standard Deviation variable is positive and marginally significant.
This suggests that the value-added by private placements is an increasing function of firm
idiosyncratic risk.
The model in the second column of Table 7 reveals that, controlling for firm and issue
characteristics and for prior stock market returns, equity value-added is significantly related to
26
the measures of capital market conditions. In particular, RVA[10, 1] is greater in periods when
IPO issues tend to exhibit larger first day returns, when there are relatively few IPO issues, and
when credit market conditions are relatively tight. The first of those three relations indicates that
the market reception of private placements is positively correlated with the reception of IPO
issues. The latter two relations are consistent with the idea that the firms that are able to place
equity privately in periods with tight equity and credit markets are those with more profitable
investment opportunities. Overall, the evidence tends to support the Investment Opportunity Set
Hypothesis and to reject the Risk Aversion Hypothesis.
The evidence in columns three and four of Table 7 is qualitatively similar to that in
columns one and two, although the significance levels change in several cases. As in Tables 6
and 7, these changes in the significance levels illustrate the sensitivity of the results in private
placement studies to the selection of the measurement period. Also, similar to the evidence in
Tables 6 and 7, we find that the addition of the capital market condition variables to the
regression models markedly increases their explanatory power.
5. Conclusions
In this study we develop a theory and provide new evidence on how capital market
conditions influence the pricing of PIPE issues. We show that public market conditions influence
PIPE price discounts, returns to original stockholders, and relative equity value-added. Discounts
are significantly positively related to prior stock market returns and returns to original
stockholders are significantly positively related to the average underpricing of recent IPOs and
significantly negatively related to recent IPO volume. These results generally support the Related
Markets Hypothesis. The evidence for equity value-added supports the Investment Opportunity
Set Hypothesis and are inconsistent with the Risk Aversion Hypothesis. Moreover, we find that
the explanatory power associated with the measures of public market conditions that we consider
is comparable to the combined explanatory power of the firm and issue characteristics that have
traditionally been the focus of studies of the determinants of private placement discounts.
We also provide evidence consistent with the theory that the gains to original
stockholders and private placement investors reflect the relative bargaining power of the two
parties as well as agency considerations and informational asymmetry. An issuing firm’s
bargaining power is low when it is small, has few tangible assets, is raising a large amount of

27
capital, or when insiders are not participating in the deal. We find that private placement investor
gains are positively related to these firm and deal characteristics.
28
References
Altinkilic, Oya and Robert S. Hansen. 2003. Discounting and underpricing in seasoned equity
offers. Journal of Financial Economics 69, 285-323. Bayless, Mark and Susan Chaplinsky. 1996. Is there a window of opportunity for seasoned
equity issuance? The Journal of Finance 51, 253-278. Beatty, Randolph P. and Jay R. Ritter. 1986. Investment banking reputation, and the
underpricing of initial public offerings. Journal of Financial Economics 15, 213-232. Brophy, David J., Paige P. Ouimet, and Clemens Sialm. 2009. Hedge funds as investors of last
resort? Review of Financial Studies 22, 541-574. Chaplinsky, Susan, and David Haushalter. 2006. Financing under extreme uncertainty: Contract
terms and returns to private investments in public equity. Unpublished working paper (University of Virginia and Penn State University).
Corwin, Shane A. 2003. The determinants of underpricing for seasoned equity offers. The
Journal of Finance 58, 2249-2279. Dimson, Elroy. 1979. Risk measurement when shares are subject to infrequent trading. The
Journal of Financial Economics 7, 197-226. Gompers, Paul, Anna Kovner, Josh Lerner, and David Scharfstein. 2008. Venture capital
investment cycles. Journal of Financial Economics 87, 1-23. Hertzel, Michael and Richard L. Smith. 1993. Market discounts and shareholder gains for
placing equity privately. The Journal of Finance 48, 459-485. Hertzel, Michael, Michael Lemmon, James S. Linck, and Lynn Rees. 2002. Long-run
performance following private placements of equity. The Journal of Finance 57, 2595-2617. Hickman, B. 1953. The volume of corporate bond financing since 1900. A study by the National
Bureau of Economic Research. Princeton University Press (Princeton, NJ). Huson, Mark R., Paul H. Malatesta, and Robert Parrino. 2009. The decline in the cost of private
placements. Unpublished working paper (University of Alberta) Lerner, Josh, Hilary Shane, and Alexander Tsai. 2003. Do equity financing cycles matter?
Evidence from biotechnology alliances. Journal of Financial Economics 67, 411-446. Liu, Yang and Paul H. Malatesta. 2007. Credit Ratings and the Pricing of Seasoned Equity
Offerings. Unpublished working paper (University of Washington).
29
Loderer, Claudio F., Dennis P. Sheehan, and Gregory B. Kadlec. 1991. The pricing of equity
offerings. Journal of Financial Economics 29, 35-57. Lowry, Michelle and G. William Schwert. 2004. Is the IPO pricing process efficient? Journal of
Financial Economics 71, 3-26. Maddala, G. S. 1983. Limited-dependent and qualitative variables in econometrics. Econometric
Society Monographs No. 3. Cambridge University Press (New York, NY). Mikkelson, Wayne H. and M. Megan Partch. 1986. Stock price effects and costs of secondary
distributions. Journal of Financial Economics 14, 165-194. Myers, S. C. and N. S. Majluf. 1984. Corporate financing and investment decisions when firms
have information investors do not have. Journal of Financial Economics 13, 187-221. Rock, Kevin. 1986. Why new issues are underpriced. Journal of Financial Economics 15, 187-
212. Pagano, Marco, Fabio Panetta, and Luigi Zingales. 1998. Why do companies go public? An empirical analysis. Journal of Finance 53, 27-64. Smith, Clifford W., Jr. 1977. Alternative methods for raising capital: Rights versus underwritten
offerings. Journal of Financial Economics 5, 273-307. Smith, Clifford W., Jr. 1986. Investment banking and the capital acquisition process. Journal of
Financial Economics 15, 3-29. Wruck, Karen H. 1989. Equity ownership concentration and firm value: Evidence from private
equity financings. Journal of Financial Economics 23, 3-28. Wruck, Karen H. and YiLin Wu. 2009. Relationships, corporate governance, and performance:
Evidence from private placements of common stock. Journal of Corporate Finance 15, 30-47. Wu, YiLin. 2004. The choice of equity-selling mechanisms. Journal of Financial Economics 74,
93-119.
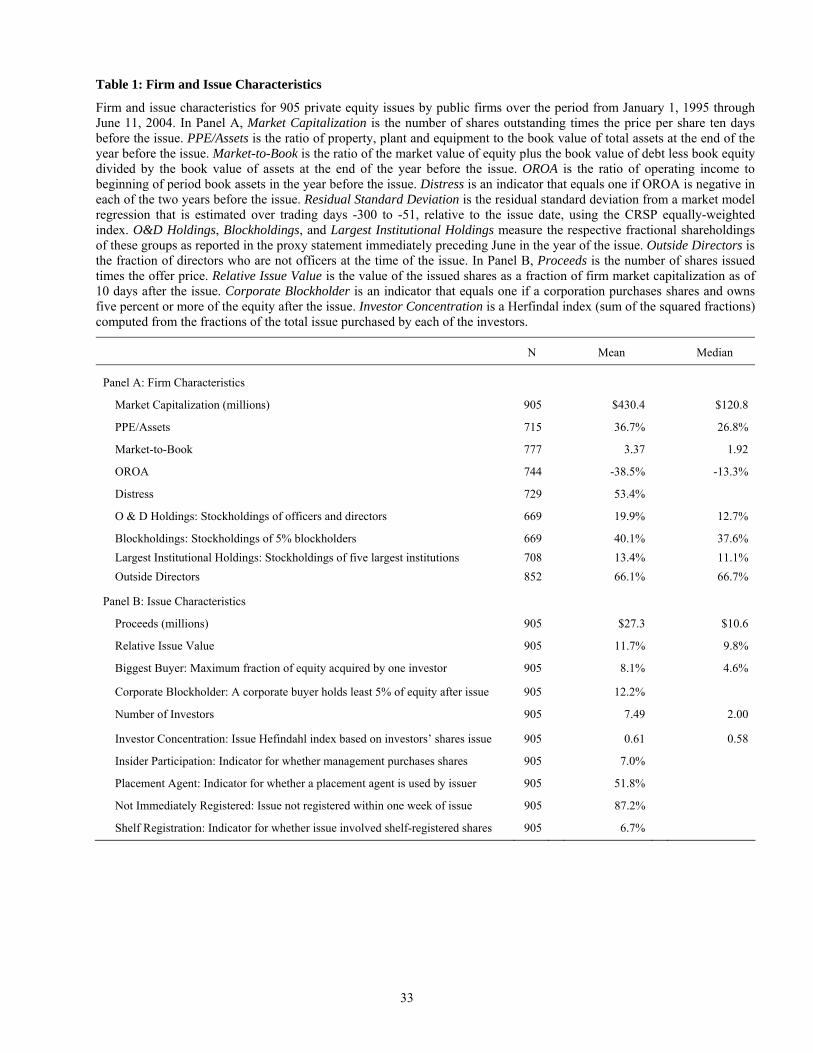
33
Table 1: Firm and Issue Characteristics
Firm and issue characteristics for 905 private equity issues by public firms over the period from January 1, 1995 through June 11, 2004. In Panel A, Market Capitalization is the number of shares outstanding times the price per share ten days before the issue. PPE/Assets is the ratio of property, plant and equipment to the book value of total assets at the end of the year before the issue. Market-to-Book is the ratio of the market value of equity plus the book value of debt less book equity divided by the book value of assets at the end of the year before the issue. OROA is the ratio of operating income to beginning of period book assets in the year before the issue. Distress is an indicator that equals one if OROA is negative in each of the two years before the issue. Residual Standard Deviation is the residual standard deviation from a market model regression that is estimated over trading days -300 to -51, relative to the issue date, using the CRSP equally-weighted index. O&D Holdings, Blockholdings, and Largest Institutional Holdings measure the respective fractional shareholdings of these groups as reported in the proxy statement immediately preceding June in the year of the issue. Outside Directors is the fraction of directors who are not officers at the time of the issue. In Panel B, Proceeds is the number of shares issued times the offer price. Relative Issue Value is the value of the issued shares as a fraction of firm market capitalization as of 10 days after the issue. Corporate Blockholder is an indicator that equals one if a corporation purchases shares and owns five percent or more of the equity after the issue. Investor Concentration is a Herfindal index (sum of the squared fractions) computed from the fractions of the total issue purchased by each of the investors.
N Mean Median
Panel A: Firm Characteristics
Market Capitalization (millions) 905 $430.4 $120.8
PPE/Assets 715 36.7% 26.8%
Market-to-Book 777 3.37 1.92
OROA 744 -38.5% -13.3%
Distress 729 53.4%
O & D Holdings: Stockholdings of officers and directors 669 19.9% 12.7%
Blockholdings: Stockholdings of 5% blockholders 669 40.1% 37.6%
Largest Institutional Holdings: Stockholdings of five largest institutions 708 13.4% 11.1%
Outside Directors 852 66.1% 66.7%
Panel B: Issue Characteristics
Proceeds (millions) 905 $27.3 $10.6
Relative Issue Value 905 11.7% 9.8%
Biggest Buyer: Maximum fraction of equity acquired by one investor 905 8.1% 4.6%
Corporate Blockholder: A corporate buyer holds least 5% of equity after issue 905 12.2%
Number of Investors 905 7.49 2.00
Investor Concentration: Issue Hefindahl index based on investors’ shares issue 905 0.61 0.58
Insider Participation: Indicator for whether management purchases shares 905 7.0%
Placement Agent: Indicator for whether a placement agent is used by issuer 905 51.8%
Not Immediately Registered: Issue not registered within one week of issue 905 87.2%
Shelf Registration: Indicator for whether issue involved shelf-registered shares 905 6.7%

34
Table 2: Discounts to Investors, Market Reactions to Issues, and Distributions of Relative Value-Added
Discounts and dollar gains to investors, market reactions to issues, and distributions of relative value-added for 905 private equity issues by public firms over the period from January 1, 1995 through June 11, 2004. Discounts, d, are calculated as one minus the ratio of the per share price paid by the private placement investors (PPI) divided by the per share market price as of day 1 or 10, relative to the issue date. Dollar gains, G, are calculated as the stock price as of day 1 or 10 minus the per share price paid by the PPI times the number of shares sold in the issue. Return(a) is the dollar gain, G(a), divided by the gross proceeds from the issue, where a is day 1 or 10. CAR[X, Y] is the abnormal return on the stock measured from day X through Y relative to the announcement date of the placement. Return to OS[-10, a] is the rate of return to shares between day -10 and day a. The Mkt. Adj. Return to OS[-10, a] adjusts for market movements over the indicated period. RVA[-10, a] is calculated as the sum of the dollar gains of the original stockholders (OS) and the PPI from day -10 to day a divided by the sum of the day -10 market capitalization plus the gross proceeds from the issue. Mkt. Adj. RVA[-10, a] is calculated the same way except that the dollar gains are adjusted for market movements from day -10 to the indicated day using a market model that is estimated over days -300 to -51 with the CRSP equally-weighted index.
N Mean Median
Panel A: Discounts, Gains, and Returns to PPI
d(1): Discount relative to share price 1 day after issue 811 13.52% 12.79%
G(1): Dollar gain relative to share price 1 day after issue 811 $2,862,281 $1,347,670
Return (1) 811 21.03% 14.67%
d(10): Discount relative to share price 10 days after issue 811 13.49% 13.27%
G(10): Dollar gain relative to share price 10 days after issue 811 $2,930,421 $1,195,137
Return (10) 811 23.56% 15.30%
Panel B: Market Reactions
CAR [-3, 0] 835 2.70% 0.22%
CAR [-10, 0] 835 4.70% 0.56%
CAR [1, 10] 835 1.84% -0.47%
Panel C: Return to original stockholders(OS)
Return to OS[-10, 1] 748 8.80% 3.52%
Mkt. Adj. Return to OS[-10, 1] 744 6.20% 2.45%
Return to OS[-10, 10] 748 11.36% 3.82%
Mkt. Adj. Return to OS[-10, 10] 744 7.40% 2.81%
Panel D: Changes in equity value
RVA[-10, 1] 748 10.37% 8.07%
Mkt. Adj. RVA[-10, 1] 744 8.07% 3.86%
RVA[-10, 10] 748 12.86% 5.43%
Mkt. Adj. RVA[-10, 10] 744 8.88% 3.93%

35
Figure 1: PIPE Issue Characteristics by Year
0%
5%
10%
15%
20%
25%
1995 1996 1997 1998 1999 2000 2001 2002 2003 2004
d(1)
$0
$10
$20
$30
$40
$50
Gro
ss P
roce
eds
0
50
100
150
200
1995 1996 1997 1998 1999 2000 2001 2002 2003 2004
Num
ber o
f Priv
ate
Plac
emen
ts
$0
$2,000
$4,000
$6,000
$8,000
Tota
l Pro
ceed
s
-4%
-2%
0%
2%
4%
6%
8%
10%
12%
1995 1996 1997 1998 1999 2000 2001 2002 2003 2004
CAR [-3,0] for firms with mkt. cap. > $1 billionCAR [-3,0] for firms with mkt. cap. < $1 billionCAR [-3,0] for all observations
-15%
-10%
-5%
0%
5%
10%
15%
20%
25%
1 2 3 4 5 6 7 8 9 10
RVA[-10, 1]
Return to OS[-10, 1]
Fig. 1c: Average percent discount received by private placement investors, relative to the stock price at day 1, and average gross proceeds per private placement by year.
Fig. 1a: Number of private placements and total proceeds from private placements by year. 2004 values are annualized based on private placement activity through June 11, 2004.
Fig. 1b: Average cumulative abnormal stock returns from day -3 through day 0, relative private placement announcements, by year and by market capitalization.
Fig. 1d: Relative value added by private placement (RVA[-10, 1]), return to original stockholders (OS) from day -10 to day 1, relative to private placement announcement (PPI), measured relative to day 1.

42
Table 3: Stock Market Returns and Capital Market Conditions
Stock market returns and capital market conditions around 905 private equity issues by public firms over the period from January 1, 1995 through June 11, 2004. EW Mkt. Return [X,Y] is the return on the equally-weighted CRSP index from day X through day Y relative to the private placement issue date. The Adjusted EW Mkt. Returns are obtained by first randomly selecting 9,050 days during the sample period (10 days for each observation) and calculating the equally-weighted return on the CRSP over each of the indicated periods relative to the selected days. The averages, across the 9,050 observations, for each indicated measurement window, is then calculated to obtain a measure of the typical returns that might be expected over the measurement window during the sample period. The reported Adjusted values are the differences between the Unadjusted values and the values calculated this way. In Panel B, IPO Underpricing is the average underpricing among initial public offerings (IPOs) in the month immediately preceding the private equity issue. No. of IPO Issues is the number of IPO issues in the month immediately preceding the private equity issue. 10 Year Treasury Rate is the yield on 10 year Treasury bonds in the month preceding the private equity issue. Baa – Aaa Yield Spread is the difference between the yield on Baa corporate bonds and the yield on Aaa bonds in the month preceding the equity issue. The Adjusted values in Panel B are the differences between the Unadjusted values and the monthly average over the entire sample period of the indicated variable. All of the reported unadjusted measures are significantly different from zero with p-values less than 0.01.
Unadjusted Adjusted P-value for test that the Adjusted
Value Equals Zero
Panel A: Stock Market Returns
Mean 5.02% 1.11% 0.000 EW Mkt. Return [-30, -1] Median 5.47% 1.57% 0.000
Mean 1.50% 0.30% 0.021 EW Mkt. Return [-10, -1] Median 1.77% 0.57% 0.007
Mean 1.84% 0.65% 0.000 EW Mkt. Return [-20,-11] Median 2.07% 0.88% 0.000
Mean 1.56% 0.37% 0.008 EW Mkt. Return [-30,-21] Median 1.75% 0.56% 0.000
Panel B: Capital Market Conditions
Mean 33.74% 8.43% 0.000 IPO Underpricing Median 19.20% -6.11% 0.978
Mean 26.13 -4.48 0.000 No. of IPO Issues Median 16.00 -14.61 0.000
Mean 5.32% -0.13% 0.000 10 Year Treasury Rate Median 5.28% -0.17% 0.000
Mean 0.87% 0.07% 0.000 Baa – Aaa Yield Spread Median 0.81% 0.01% 0.000
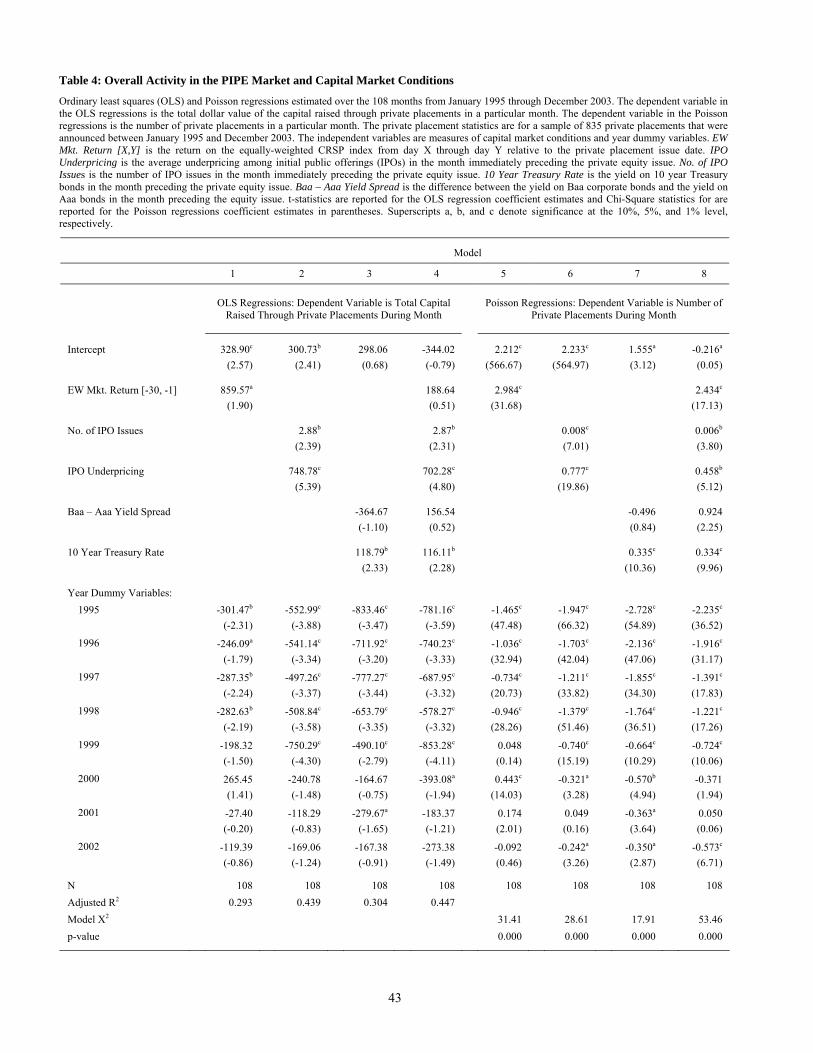
43
Table 4: Overall Activity in the PIPE Market and Capital Market Conditions
Ordinary least squares (OLS) and Poisson regressions estimated over the 108 months from January 1995 through December 2003. The dependent variable in the OLS regressions is the total dollar value of the capital raised through private placements in a particular month. The dependent variable in the Poisson regressions is the number of private placements in a particular month. The private placement statistics are for a sample of 835 private placements that were announced between January 1995 and December 2003. The independent variables are measures of capital market conditions and year dummy variables. EW Mkt. Return [X,Y] is the return on the equally-weighted CRSP index from day X through day Y relative to the private placement issue date. IPO Underpricing is the average underpricing among initial public offerings (IPOs) in the month immediately preceding the private equity issue. No. of IPO Issues is the number of IPO issues in the month immediately preceding the private equity issue. 10 Year Treasury Rate is the yield on 10 year Treasury bonds in the month preceding the private equity issue. Baa – Aaa Yield Spread is the difference between the yield on Baa corporate bonds and the yield on Aaa bonds in the month preceding the equity issue. t-statistics are reported for the OLS regression coefficient estimates and Chi-Square statistics for are reported for the Poisson regressions coefficient estimates in parentheses. Superscripts a, b, and c denote significance at the 10%, 5%, and 1% level, respectively.
Model
1 2 3 4 5 6 7 8
OLS Regressions: Dependent Variable is Total Capital
Raised Through Private Placements During Month Poisson Regressions: Dependent Variable is Number of
Private Placements During Month
Intercept 328.90c 300.73b 298.06 -344.02 2.212c 2.233c 1.555a -0.216a (2.57) (2.41) (0.68) (-0.79) (566.67) (564.97) (3.12) (0.05)
EW Mkt. Return [-30, -1] 859.57a 188.64 2.984c 2.434c (1.90) (0.51) (31.68) (17.13)
No. of IPO Issues 2.88b 2.87b 0.008c 0.006b (2.39) (2.31) (7.01) (3.80)
IPO Underpricing 748.78c 702.28c 0.777c 0.458b (5.39) (4.80) (19.86) (5.12)
Baa – Aaa Yield Spread -364.67 156.54 -0.496 0.924 (-1.10) (0.52) (0.84) (2.25)
10 Year Treasury Rate 118.79b 116.11b 0.335c 0.334c (2.33) (2.28) (10.36) (9.96)
Year Dummy Variables: 1995 -301.47b -552.99c -833.46c -781.16c -1.465c -1.947c -2.728c -2.235c (-2.31) (-3.88) (-3.47) (-3.59) (47.48) (66.32) (54.89) (36.52)
1996 -246.09a -541.14c -711.92c -740.23c -1.036c -1.703c -2.136c -1.916c (-1.79) (-3.34) (-3.20) (-3.33) (32.94) (42.04) (47.06) (31.17)
1997 -287.35b -497.26c -777.27c -687.95c -0.734c -1.211c -1.855c -1.391c (-2.24) (-3.37) (-3.44) (-3.32) (20.73) (33.82) (34.30) (17.83)
1998 -282.63b -508.84c -653.79c -578.27c -0.946c -1.379c -1.764c -1.221c (-2.19) (-3.58) (-3.35) (-3.32) (28.26) (51.46) (36.51) (17.26)
1999 -198.32 -750.29c -490.10c -853.28c 0.048 -0.740c -0.664c -0.724c (-1.50) (-4.30) (-2.79) (-4.11) (0.14) (15.19) (10.29) (10.06)
2000 265.45 -240.78 -164.67 -393.08a 0.443c -0.321a -0.570b -0.371 (1.41) (-1.48) (-0.75) (-1.94) (14.03) (3.28) (4.94) (1.94)
2001 -27.40 -118.29 -279.67a -183.37 0.174 0.049 -0.363a 0.050 (-0.20) (-0.83) (-1.65) (-1.21) (2.01) (0.16) (3.64) (0.06)
2002 -119.39 -169.06 -167.38 -273.38 -0.092 -0.242a -0.350a -0.573c (-0.86) (-1.24) (-0.91) (-1.49) (0.46) (3.26) (2.87) (6.71)
N 108 108 108 108 108 108 108 108 Adjusted R2 0.293 0.439 0.304 0.447 Model Χ2 31.41 28.61 17.91 53.46 p-value 0.000 0.000 0.000 0.000

44
Table 5: Stock Market Returns, Capital Market Conditions, and Private Placement Discounts Ordinary least squares (OLS) regressions estimated with a sample of 905 private equity issues by public firms over the period from January 1, 1995 through June 11, 2004. The dependent variable, d(a), is the discount received by the private placement investors (PPI) relative to the stock price a days, after the issue date. The independent variables are defined in Tables 1 and 3. t-statistics are reported in parentheses. Superscripts a, b, and c denote significance at the 10%, 5%, and 1% level, respectively.
d(1) d(1) d(10) d(10)
Constant 0.623c 0.489c 0.820c 0.913c (5.00) (3.41) (5.46) (5.22)
Natural Log of Market Capitalization -0.019b -0.021b -0.014 -0.018a (-2.08) (-2.31) (-1.38) (-1.72)
PPE/Assets -0.003 -0.011 -0.014 -0.016 (-0.14) (-0.62) (-0.61) (-0.69)
Market-to-Book 0.003 0.001 0.004 0.002 (1.49) (0.40) (1.61) (0.76)
Distress 0.034b 0.029b 0.001 -0.006 (2.37) (1.99) (0.04) (-0.34)
Residual Standard Deviation 0.484 0.429 0.357 0.219 (1.52) (1.39) (0.93) (0.59)
Natural Log of Proceeds -0.009 -0.009 -0.023b -0.024b (-1.01) (-1.01) (-2.26) (-2.31)
Corporate Blockholder -0.043a -0.039 -0.072b -0.073b (-1.71) (-1.51) (-2.29) (-2.29)
Investor Concentration -0.086c -0.069c -0.095c -0.083c (-4.55) (-3.72) (-3.87) (-3.28)
Insider Participation -0.069c -0.054b -0.031 -0.019 (-2.69) (-2.26) (-1.04) (-0.62)
Not Immediately Registered 0.023 0.009 0.000 -0.016 (1.46) (0.52) (0.00) (-0.80)
Placement Agent -0.005 0.005 -0.011 -0.003 (-0.36) (0.33) (-0.63) (-0.15)
EW Mkt. Return [-10, -1] 0.854c 0.667c (4.11) (2.73)
EW Mkt. Return [-20, -11] 0.478c 0.450b (2.58) (1.96)
EW Mkt. Return [-30, -21] 0.463c 0.250 (2.70) (1.04)
IPO Underpricing 0.014 0.067a (0.55) (1.78)
No. IPO Issues -0.010 -0.027a (-0.95) (-1.93)
10 Year Treasury Rate 3.234c 1.018 (2.98) (0.74)
Baa - Aaa Yield Spread -2.345 -8.562a (-0.62) (-1.76)
Adjusted R2 0.126 0.200 0.096 0.135 N 617 590 617 590
P-Values from F-Tests
Coefficients on EW Mkt. Return variables equal zero 0.001 0.002
Coefficients on IPO variables equal zero 0.514 0.016
Coefficients on bond market variables equal zero 0.004 0.076
Coefficients on all market variables equal zero 0.001 0.001
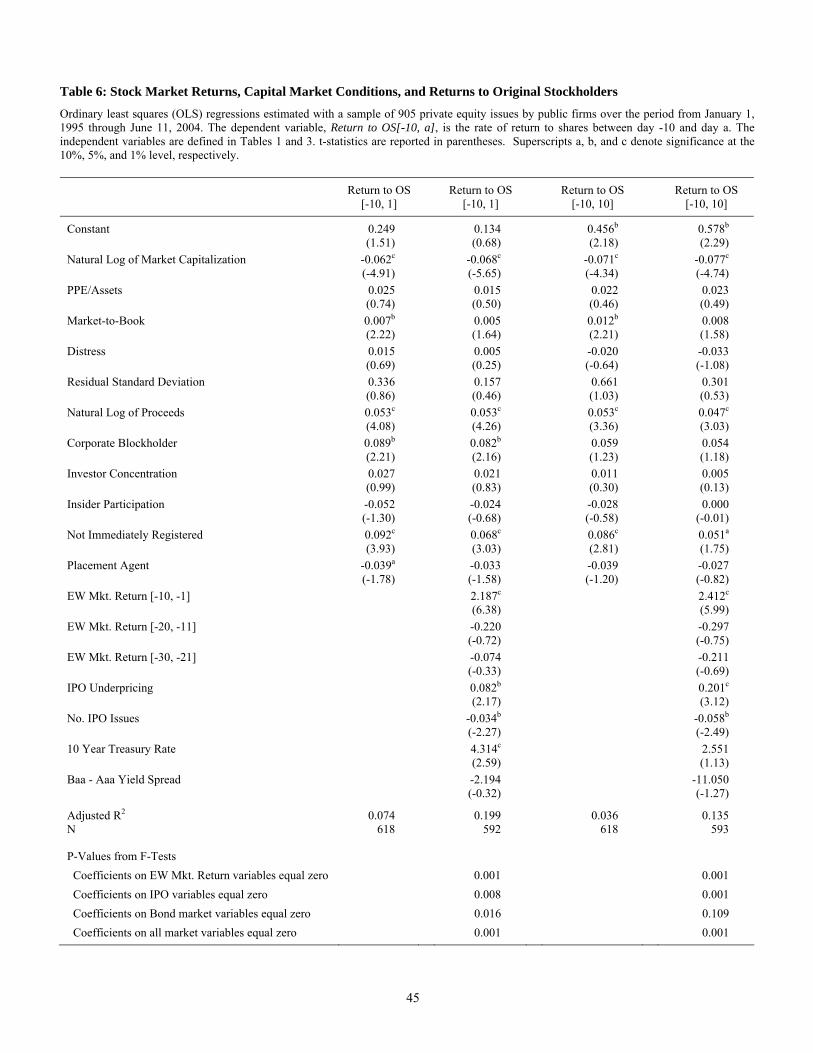
45
Table 6: Stock Market Returns, Capital Market Conditions, and Returns to Original Stockholders Ordinary least squares (OLS) regressions estimated with a sample of 905 private equity issues by public firms over the period from January 1, 1995 through June 11, 2004. The dependent variable, Return to OS[-10, a], is the rate of return to shares between day -10 and day a. The independent variables are defined in Tables 1 and 3. t-statistics are reported in parentheses. Superscripts a, b, and c denote significance at the 10%, 5%, and 1% level, respectively.
Return to OS [-10, 1]
Return to OS [-10, 1]
Return to OS [-10, 10]
Return to OS [-10, 10]
Constant 0.249 0.134 0.456b 0.578b (1.51) (0.68) (2.18) (2.29)
Natural Log of Market Capitalization -0.062c -0.068c -0.071c -0.077c (-4.91) (-5.65) (-4.34) (-4.74)
PPE/Assets 0.025 0.015 0.022 0.023 (0.74) (0.50) (0.46) (0.49)
Market-to-Book 0.007b 0.005 0.012b 0.008 (2.22) (1.64) (2.21) (1.58)
Distress 0.015 0.005 -0.020 -0.033 (0.69) (0.25) (-0.64) (-1.08)
Residual Standard Deviation 0.336 0.157 0.661 0.301 (0.86) (0.46) (1.03) (0.53)
Natural Log of Proceeds 0.053c 0.053c 0.053c 0.047c (4.08) (4.26) (3.36) (3.03)
Corporate Blockholder 0.089b 0.082b 0.059 0.054 (2.21) (2.16) (1.23) (1.18)
Investor Concentration 0.027 0.021 0.011 0.005 (0.99) (0.83) (0.30) (0.13)
Insider Participation -0.052 -0.024 -0.028 0.000 (-1.30) (-0.68) (-0.58) (-0.01)
Not Immediately Registered 0.092c 0.068c 0.086c 0.051a (3.93) (3.03) (2.81) (1.75)
Placement Agent -0.039a -0.033 -0.039 -0.027 (-1.78) (-1.58) (-1.20) (-0.82)
EW Mkt. Return [-10, -1] 2.187c 2.412c (6.38) (5.99)
EW Mkt. Return [-20, -11] -0.220 -0.297 (-0.72) (-0.75)
EW Mkt. Return [-30, -21] -0.074 -0.211 (-0.33) (-0.69)
IPO Underpricing 0.082b 0.201c (2.17) (3.12)
No. IPO Issues -0.034b -0.058b (-2.27) (-2.49)
10 Year Treasury Rate 4.314c 2.551 (2.59) (1.13)
Baa - Aaa Yield Spread -2.194 -11.050 (-0.32) (-1.27)
Adjusted R2 0.074 0.199 0.036 0.135 N 618 592 618 593
P-Values from F-Tests
Coefficients on EW Mkt. Return variables equal zero 0.001 0.001
Coefficients on IPO variables equal zero 0.008 0.001
Coefficients on Bond market variables equal zero 0.016 0.109
Coefficients on all market variables equal zero 0.001 0.001
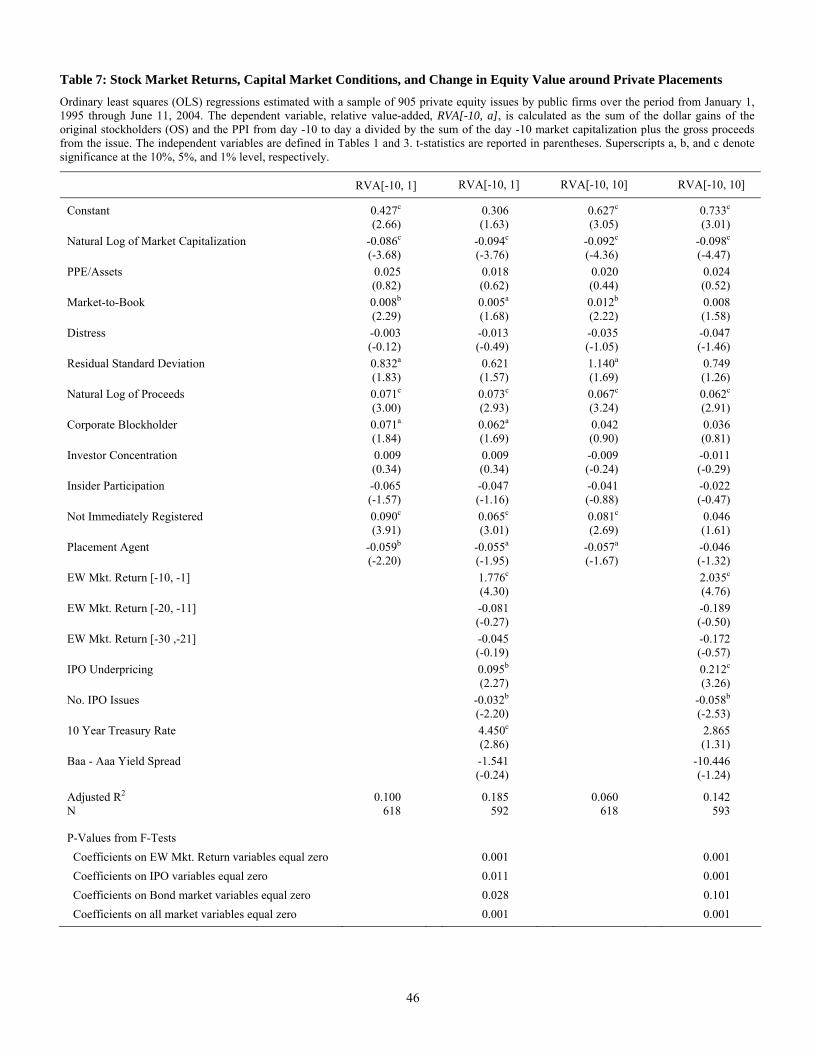
46
Table 7: Stock Market Returns, Capital Market Conditions, and Change in Equity Value around Private Placements Ordinary least squares (OLS) regressions estimated with a sample of 905 private equity issues by public firms over the period from January 1, 1995 through June 11, 2004. The dependent variable, relative value-added, RVA[-10, a], is calculated as the sum of the dollar gains of the original stockholders (OS) and the PPI from day -10 to day a divided by the sum of the day -10 market capitalization plus the gross proceeds from the issue. The independent variables are defined in Tables 1 and 3. t-statistics are reported in parentheses. Superscripts a, b, and c denote significance at the 10%, 5%, and 1% level, respectively.
RVA[-10, 1] RVA[-10, 1] RVA[-10, 10] RVA[-10, 10]
Constant 0.427c 0.306 0.627c 0.733c (2.66) (1.63) (3.05) (3.01)
Natural Log of Market Capitalization -0.086c -0.094c -0.092c -0.098c (-3.68) (-3.76) (-4.36) (-4.47)
PPE/Assets 0.025 0.018 0.020 0.024 (0.82) (0.62) (0.44) (0.52)
Market-to-Book 0.008b 0.005a 0.012b 0.008 (2.29) (1.68) (2.22) (1.58)
Distress -0.003 -0.013 -0.035 -0.047 (-0.12) (-0.49) (-1.05) (-1.46)
Residual Standard Deviation 0.832a 0.621 1.140a 0.749 (1.83) (1.57) (1.69) (1.26)
Natural Log of Proceeds 0.071c 0.073c 0.067c 0.062c (3.00) (2.93) (3.24) (2.91)
Corporate Blockholder 0.071a 0.062a 0.042 0.036 (1.84) (1.69) (0.90) (0.81)
Investor Concentration 0.009 0.009 -0.009 -0.011 (0.34) (0.34) (-0.24) (-0.29)
Insider Participation -0.065 -0.047 -0.041 -0.022 (-1.57) (-1.16) (-0.88) (-0.47)
Not Immediately Registered 0.090c 0.065c 0.081c 0.046 (3.91) (3.01) (2.69) (1.61)
Placement Agent -0.059b -0.055a -0.057a -0.046 (-2.20) (-1.95) (-1.67) (-1.32)
EW Mkt. Return [-10, -1] 1.776c 2.035c (4.30) (4.76)
EW Mkt. Return [-20, -11] -0.081 -0.189 (-0.27) (-0.50)
EW Mkt. Return [-30 ,-21] -0.045 -0.172 (-0.19) (-0.57)
IPO Underpricing 0.095b 0.212c (2.27) (3.26)
No. IPO Issues -0.032b -0.058b (-2.20) (-2.53)
10 Year Treasury Rate 4.450c 2.865 (2.86) (1.31)
Baa - Aaa Yield Spread -1.541 -10.446 (-0.24) (-1.24)
Adjusted R2 0.100 0.185 0.060 0.142 N 618 592 618 593
P-Values from F-Tests
Coefficients on EW Mkt. Return variables equal zero 0.001 0.001
Coefficients on IPO variables equal zero 0.011 0.001
Coefficients on Bond market variables equal zero 0.028 0.101
Coefficients on all market variables equal zero 0.001 0.001