Capital accumulation and growth in Hungary, 1924 … · Capital accumulation and growth in Hungary,...
30
1 Capital accumulation and growth in Hungary, 1924-2006 Peter Földvári and Bas van Leeuwen 1 1. Introduction The transition in Eastern Europe in the 1990s has triggered many studies into the sources of economic growth. Several studies discuss Hungary, most of which focusing on the transition period. The majority of those studies, which ignore human capital, argue that Total Factor Productivity (TFP) growth was small in Hungary between ca. 1960-1989 and increasing afterwards (Roman 1982; Campos and Coricelli 2002; Darvas and Simon 2000; Doyle, Kuijs and Jiang 2001). Indeed, although Pryor (1985, 222) argues that overall TFP growth was equal in Eastern and Western countries during socialism, he also stresses that this is mostly caused by a larger share of agriculture and industry in Eastern Europe. Since TFP growth is usually estimated to be larger in agriculture and industry than in services (the value of the latter sector being often calculated from input costs) the magnitude of TFP growth in Eastern Europe was strongly dependent on structural changes. With investments in fixed capital drying up and the shift from agriculture to industry and services, TFP growth declined only to increase again after transition. Acknowledging that many growth theories see an important role for human capital, a tendency of including human capital in growth regressions has started for Eastern European countries as well. In line with earlier growth accounting studies, Ganev (2005) finds that it is largely TFP, as opposed to human capital, that drives economic growth in the post-transition period. He explains this finding by arguing that much of the 1 Földvári: University of Debrecen, Hungary and Utrecht University, the Netherlands van Leeuwen: Free University, Amsterdam, the Netherlands and University of Warwick, UK
Transcript of Capital accumulation and growth in Hungary, 1924 … · Capital accumulation and growth in Hungary,...

1
Capital accumulation and growth in Hungary, 1924-2006
Peter Földvári and Bas van Leeuwen1
1. Introduction
The transition in Eastern Europe in the 1990s has triggered many studies into the sources
of economic growth. Several studies discuss Hungary, most of which focusing on the
transition period. The majority of those studies, which ignore human capital, argue that
Total Factor Productivity (TFP) growth was small in Hungary between ca. 1960-1989
and increasing afterwards (Roman 1982; Campos and Coricelli 2002; Darvas and Simon
2000; Doyle, Kuijs and Jiang 2001). Indeed, although Pryor (1985, 222) argues that
overall TFP growth was equal in Eastern and Western countries during socialism, he also
stresses that this is mostly caused by a larger share of agriculture and industry in Eastern
Europe. Since TFP growth is usually estimated to be larger in agriculture and industry
than in services (the value of the latter sector being often calculated from input costs) the
magnitude of TFP growth in Eastern Europe was strongly dependent on structural
changes. With investments in fixed capital drying up and the shift from agriculture to
industry and services, TFP growth declined only to increase again after transition.
Acknowledging that many growth theories see an important role for human
capital, a tendency of including human capital in growth regressions has started for
Eastern European countries as well. In line with earlier growth accounting studies, Ganev
(2005) finds that it is largely TFP, as opposed to human capital, that drives economic
growth in the post-transition period. He explains this finding by arguing that much of the
1 Földvári: University of Debrecen, Hungary and Utrecht University, the Netherlands
van Leeuwen: Free University, Amsterdam, the Netherlands and University of Warwick, UK
2
productivity increase after the transition (including technology imports) manifests itself
as TFP growth. However, then he acknowledges that the share of TFP is also artificially
increased by the mismeasurement of human capital as “the employment dynamics is
almost the same as the dynamics of the measure of human capital” (Ganev 2005, 11).
Estimating a long-run series of average years of schooling for Hungary, Földvári and Van
Leeuwen (2009), however, find that contribution of human capital in economic growth
increased considerably after transition. They claim that the value of human capital stock
increased after transition, since the market economy ensured a more efficient allocation
of human capital than the state-socialist planning. This increase in efficiency results in an
improvement of the value of human capital as marked by an increase in the rate of returns
to education (Campos and Jolliffe 2003). In this text we further explore the long-run
changes of human capital and find that the results are sensitive to the choice of human
capital indicator. Since the rate of returns to education fell during socialism, which is
clearly a sign of not only the strict wage control imposed by the plan-economy but also a
less efficient allocation of human capital, measures based on the rate of returns reflect a
drop in per capita human capital stock. As an alternative, we suggest a prospective
(income based) measure, which is comparable to the micro-approach by Dagum and
Slottje (2000). Even though there is a clear difference in the picture reflected by the two
measures, both seem to suggest that the pace of human capital accumulation changed
significantly during the 20th century, which has profound effect on results from growth
accounting exercises, or even regression analysis.
The objective of this paper is to analyse the role of both human- and physical
capital in economic growth in Hungary during the 20th century. This we do with

3
significant extensions, improvements and also a revision of our previous paper (Földvári
and van Leeuwen 2009).
First, we extend our physical capital stock estimates from a PIM methodology
back to the interwar period. Second, we bring back in time the traditional rate of returns
based human capital measure (see Hall and Jones 1999). So far the rate of returns was
available only for the 1980s and 1990s when one can use different surveys for a micro-
estimation with a Mincerian methodology. Prior to the 1970s we have to take a different
approach and use data on skill premium to have some raw estimates of the rate of private
returns to education. The problem is that this frequently used human capital measure will
reflect only the effect of a biased technological development when skill premium/rate of
returns to education to fall or rise, or if the average schooling changes. If the
technological development is neutral, affecting schooled and unschooled labour
productivity proportionally, it will not be observed by this index. Therefore, thirdly, we
use some improved measure of human capital, based on the net present value of future
incomes. Finally, we use these human and physical capital measures to extend the growth
accounting back to the interwar period.
The paper is structured as follows. In the next section we discuss how the series of
physical capital stock were constructed and use alternative methods as tools of cross-
validation. Section 3 briefly discusses our estimates of average years of education, which
we then compare with our human capital measure based on the rate of return and our
income based measure respectively. Section 4 then applies both capital stocks in a TFP
analysis. The paper ends with a brief conclusion.

4
2. Physical capital stock in Hungary
2.1 Some fundamental methodological issues
The physical capital stock is a crucial variable in almost all growth theories and growth
accounting exercises. Since it is only investments we have some reliable statistics on,
most methods employ in one way or the other a perpetual inventory method in which the
following identity is made use of:
( ) ttt IKK +−= −11 δ (1.)
where K is the stock of physical capital, δ is depreciation, and I is the gross fixed capital
investment.
The capital investment data are obtained from the World Development Indicators
of the World Bank (2007), the (KSH, 1969, 1974, 1979, 1980a, 1980b, 1981), and
Mitchell (2007). For the pre-1940 period, we used data from Eckstein (1955). All series
were made comparable, including residential capital. With underlying assumptions about
asset lives and the rate of depreciation, these investment data can be converted in the
stock of physical capital. In Hungary, the official capital formation series start in 1950
and are, directly or indirectly, the source of several physical capital stock estimates
(Darvas and Simon 2000; Pula 2003). Since there are doubts about the quality of the
available data, these stock estimates normally stretch back only to 1980. Yet, for the
period prior to 1980, the Hungarian Statistical Office offers some estimates of the
physical capital stock that start from 1950 (from 1960 annually) in both current and
constant prices (KSH, 1969, 1974, 1979, 1980a, 1980b, 1981). The reliability of these
estimates is also in question.

5
It is a general problem with capital stock estimates that the rate of depreciation,
calculated from asset life assumptions, is rather arbitrary. Pula (2003, 7), for example,
used the average of the service life in 12 OECD countries as a baseline. Assumptions like
that are necessary in case of Eastern Europe since independent estimates are rare, but
there is no direct reason to assume depreciation to be the same as in the West (Pryor
1985, 217). Indeed, some independent estimates for Hungary show that average service
life was higher than in the West (Pula 2003, 7-8). Also, in almost all studies on physical
capital in Eastern Europe some assumptions are made about the decline in the physical
capital stock in the early 1990s as a result of transition. These assumptions are also rather
arbitrary and might be in need of some revision.
2.2 Estimation with a Perpetual Inventory Method
We start by calculating the stock of physical capital using the standard assumptions of a
linear depreciation and an asset life of 20 years. Further, we had to make an estimate of
the one-off physical capital stock decline during the transition in the early 1990s.
In order to arrive to stock estimates without needing to take benchmark form
another work, we assumed a linear depreciation of 20 years for the period 1967-2006.2
This leads to stock estimates 23309 billion HUF at 2000 prices in 2001 (124,572 million
G-K int. USD at 1990 prices). which is roughly 166% of the GDP (K/Y=1.66). This is
higher than the estimate by Pula for the same year which is 18325 billion 2000 HUF that
2
20
0
120t t i
i
iK I −
=
= −
∑ with 20 years chosen this is equivalent with roughly 8.8% geometric
depreciation per annum.
6
is 1.3 times the GDP. The possible reason is that Pula’s series does not contain the
residential stock of capital while our series does.
However, it is unlikely that the physical capital stock of Hungary at that year
could have been significantly lower than our estimates. We know that the share of capital
incomes (we call this α) must have been around 1/3-1/2 of the total income, if we assume
a Cobb-Douglas type production function, and that capital is paid its marginal product, it
is straightforward that the rate of returns to capital should equal Y
Kα . Depending on our
estimate of α, therefore the rate of returns should have been 20-30%, in other words a
payback period of 3.3-5 years, which is high but still feasible. With a K/Y ratio of 1.3
payback period would be much shorter, around 2.6-3.9 years. Such high rate of returns
should have set off a very high capital inflow into the country, even with all additional
risks involved, increasing the K/Y ratio quickly.
This type of cross-check exercise has some consequence on capital stock
estimates in general: if one sticks to the traditional estimate of share of capital incomes
being around 1/3, than the K/Y ratio cannot be much lower than 0.8-1. In all other cases
(except for exogenous shocks like war) having a too low K/Y ratio would imply an
unrealistically high profit rate (above 33%).
For the period between 1960 and 1966 we used a geometric depreciation rate of
8% as in (1). This is close to the finding of Pula (2003) who uses a rate of depreciation of
2% for buildings and 9.2% for machinery. For 1950-59 we used net capital formation as
given in Mitchell (2007)
There are two breaks in the series: the first is during World War II and the first
years of reconstruction, while the second is during the years of transition, when some of

7
the physical capital stock has lost its value or had been completely withdrawn from
production. There are different estimates about the magnitude of capital loss during
transition years. The IMF estimated a 35 percent drop in capital stock for Hungary in
1991, calculated as a sum of a 20 percent loss due to the collapse of CMEA trade and an
additional 15 percent due to the so-called “disorganization” effect (IMF (1999)). This
view is challenged by Pula (2003, 9), who, based on a Cobb-Douglas type production
function, assuming 60% share of labour incomes and 0% TFP growth, estimates that the
observed 15% drop in aggregate income must have been caused by a one-time drop of
25% in physical capital in the early 1990s. Similarly to Pula we use a level accounting (or
development accounting) with no change in TFP assumed to estimate the magnitude of
capital loss. We assume a production function similar to Mankiw, Romer and Weil
(1992):
1t t t t tY A K H Lα β α β− −= (2)
If we assume that the TFP remained constant, and α=β=1/3, we can estimate the ratio of
physical capital stock between any two years as follows:
1 1 1
0 0 0 0 0
t t t t tK Y A L H
K Y A L H
α β β
α α α α
+ −− −
=
(3)
Since we know the necessary data (on the human capital series please see section 3),
using the above equation method, with no TFP change assumed, we can estimate the
probable magnitude of the capital loss during the years of the transition 1989-1992,
which is altogether 54%. This is more than other estimates, but one should bear in mind
that we assumed that this drop occurred over four years and not during a single year as by

8
IMF (1999) and Pula (2003). If we restricted the capital loss to 1991 only, we would
arrive at 25% similarly to Pula.
We apply the same method to estimate the stock of physical capital in 1939. We
use 1950 as reference year, and since there is 11 year difference we assume a TFP growth
of 10%. So we arrive at an estimate of 4,168 billion HUF at 2000 prices (22,248 million
G-K int. USD at 1990 prices), which is 85% of the GDP. We apply here a lower rate of
depreciation, 7%, than after 1950. This is in accordance with the estimate of Prados de la
Escosura and Rosés (2008, table 2) who find that average depreciation is around 2%
smaller in the first half of the twentieth century. We chose a higher rate of depreciation
though, because assuming 6% would have implied extremely low K/Y ratio in the 1920s.
Using 7%, however, leads to 1,620 billion 2000 HUF (8,657 million 1990 G-K USD) in
1924, which is 55% of the GDP. This low ratio can be attributed to the effect of war, and
the following unstable period paired with hyperinflation, hence is a feasible estimate.
Figure 1
Estimated stocks of physical capital in Hungary

9
3. Human capital stock
3.1 Average years of education in Hungary 1860-2006
The data for human capital are obtained from Földvári and Van Leeuwen (2009) on
average years of education 1920-2006. In that paper we used the attainment census
method that is generally considered to give the best results. Yet, since data in censuses
are generally only available every 10th year, they calculated the in-between years based
on modified version of the perpetual inventory method by Barro and Lee (2003) based on
enrolment statistics.
The modification was needed since the unbiasedness of the Barro and Lee
estimates has been questioned by several authors. As Portela et al (2004) argue, the main
source of bias in the Barro and Lee series is that they implicitly assume the mortality rate
to be independent of the level of education, which results in a downward bias when they
forecast from a census year and an overestimation in case of backcasting. In Földvári and
Van Leeuwen (2009) we base our method on the assumption that the two type of bias can

10
offset each other. Hence, we estimate the average years of education series between
census years as an average of the backward and forward estimates.
In the above mentioned 2009 paper we estimated the average years of education
between 1920 and 2006 (see Figure 2).
Figure 2
Average years of education in Hungary 1920-2006
Source: Földvári and van Leeuwen (2009)
3.2 Rate of returns to education
By looking at only average years of education one can have only a partial view on human
capital. The situation is similar as if one wished to estimate the physical capital stock by
the total number of machines or the time requirement to maintain all capital goods. It
surely offers some view on the time spent on forming the capital stock but tells us almost
nothing on the quality of human capital or its productive efficiency (reflected by its
market value).

11
A quite popular way, to improve the ability of the educational attainment variable
to capture the market value of human capital is based on a combination of average years
of education and the rate of returns to education (Hall and Jones 1999; Pritchett 2001).
The rate of returns to education can be defined as the relative impact of an additional year
of education on the individual’s wage, or at a social level, as the average impact of an
additional year of education on wages. Since wages reflect changes in the marginal
product of labour (including human capital) an improvement of the rate of returns should
also reflect an improvement in the productive efficiency of human capital. Of course,
since labour usually exhibits decreasing marginal product, theoretically one can find an
increasing rate of returns to education if the quantity (volume) of human capital stock
reduces.
First, we are going to use the approach suggested by Hall and Jones (1999) and
Pritchett (2001), which is based on a Mincerian approach (Mincer 1974). The per capita
human capital stock is defined as follows:
t tr Sh e= (4)
where r denotes the rate of returns to education, and S is the average years of education.
That is both the quality and the quantity of human capital is captured in (4). The change
of this value therefore reflects changes in the value of human capital and can be
employed in a growth accounting.3
3 We are hesitant to identify h in equation 4 as the value of human capital. Instead we treat it as a proxy.
The reason is that there are methods that lead to estimates of the value of human capital expressed in
monetary units. (see Wössman 2003 or van Leeuwen and Földvári 2008 for some further discussions). At
the moment we interpret h as an index of per capita human capital stock, where the value of 1 equals the
per capita human capital stock in a society where there is no formal education (or at least no returns to
it).

12
For the 1980s and 1990s we have quite certain knowledge on the change in rate of
returns to education. Campos and Jolliffe (2003) estimated the rate of returns to education
in Hungary in 1986, 1989, 1992, 1995, 1998. They find that the r grew considerably after
the Transformation (6.2%, 7.4%, 9.5%, 10.9%, 11.2% respectively). Flabbi et al. (2008)
arrive at a similar conclusion: they find that the rate of returns grew gradually from 5.6%
in 1986 to 11.1% in 2002 (see Figure 3). These findings suggest the productive efficiency
of human capital (its marginal product for example) increased as a result of transition to
market economy.
Figure 3
Rate of returns to education in Hungary in 1986-2002
Note: rate of returns to education is defined here as the relative effect of an additional year of formal
education on wage

13
We have no reason to assume that the rate of returns to education remained constant prior
to 1986, but we do not have microeconomic data (household surveys for example) to
estimate the rate of returns to education for a longer period. Hence, we need to use a less
reliable method to estimate the rate of returns to education in Hungary using skill
premium data.
Theoretically, the rate of returns to education can be estimated in the following
way:
1
1s lt
t u
t
wr
w
= −
(5)
Where r is the rate of returns to education, ws and wu denote the nominal wages of skilled
and unskilled labour and l is the assumed difference in the duration of education between
the two groups in years.
The wage data we use to estimate the rate of returns comes from different
statistical sources. For the period from 1953 we used the ILO October Inquiry (various
issues) data on construction workers and some wage data found in HSO Statistical
Yearbooks. For the interwar years we could rely on industrial wages for clerks and
labourers reported in the Hungarian Statistical Yearbooks (KSH, various issues).
For the interwar period we could assume that the average labourer had 4 years of
education, while the average clerk had a completed secondary education (12 years),
which is supported by the statistical yearbook data on the composition of the clerks. In
Table 1 we report the estimated average years of education under the assumption of 8
years difference in education between the two groups.
Table 1

14
Rate of returns to education in Hungary, industrial wages, 1921-1940
year number
of clerks
number
of
labourers
average
wage
clerks
average
wage
labourers
rate of returns
(8 years difference
assumed)
1921 14797 152591 66 34 8.8%
1922 17873 189299 67 33 9.1%
1923 19620 206445 83 34 11.7%
1924 20162 193470 189 71 13.1%
1925 19695 198509 271 88 15.1%
1926 19647 205524 295 90 16.0%
1927 18357 242147 308 110 13.7%
1928 18748 242875 323 119 13.3%
1929 19091 244120 334 120 13.6%
1930 18800 216842 349 116 14.7%
1931 17492 190696 340 110 15.1%
1932 16200 175551 323 97 16.3%
1933 16032 192435 300 87 16.7%
1934 16981 208254 291 89 16.0%
1935 16279 231538 392 87 20.7%
1936 18112 259531 380 90 19.7%
1937 20190 293431 378 91 19.5%
1938 23119 299603 377 96 18.6%
1939 27735 362630 392 100 18.6%
1940 29746 366560 417 115 17.5%
Note: wages are expressed in golden crown prior to 1926 and pengő afterwards
Source: HSO Hungarian Statistical Yearbook, various issues
For the interwar period we find relatively high rate of returns to education, but they are
still of acceptable magnitude, at least when compared to rate of returns to education in
some developing countries by Psacharopulos and Patrinos (2002).4
For the socialist periods, we do not have a comparable intact wage series. For
1953-1961 we have data on the average earnings of certain skilled workers but only two
of the reported jobs have an apparent difference in educational requirements (hewer and
team-carman). We assumed three years difference in their education (the carmen are
4 Columbia 1965: 17.3%, Venezuela 1975: 13.7%, Mexico 1991: 16.1%
15
assumed to have only primary education, while the hewers have an additional vocational
education). For 1962-85 we used the ILO October Inquiry data on bricklayers and
unskilled workers. Here, theoretically, we should opt for 3 year difference in education as
well, but using 4 years brings these series much closer to the more reliable estimated
from 1986 by Flabbi et al. (2008), and also seems to fit better with the series estimated
from the mineworkers’ wages.
Table 2 has our estimates (period averages):
Table 2
Rate of returns to education estimated from skill premium data (period averages)
Period Rate of returns to education 1921-1930 12.9% 1931-1940 17.9% 1957-1960 6.7% 1961-1970 5.0% 1971-1980 6.8% 1981-1989 6.3% 1991-2000* 8.7%
*Flabbi et al. (2008)
As Table 2 suggests the rate of returns to education were generally lower during
socialism than in the 1990s and the interwar period, and the interwar period saw rate of
returns comparable with that of the late 1990s.
Using our rate of returns to education data, we can calculate the change of human
capital stock using equation 4 (Figure 4). This confirms our conclusion drawn from the
rate of returns series: the per capita human capital stock (if calculated as defined in
equation 4) reduced during the Socialism. In Figure 4 we also report the smoothed series,
since quite significant changes in the rate of returns may results from measurement
errors. This is contrary to the volume of human capital, as given in Figure 2, which shows
no noticeable break in growth during the socialist period.

16
Figure 4
Per capita human capital index using the rate of returns based Mincerian method (h1)
Note: In case of the smoothed per capita human capital stock we used a centred MA(3) filter on the rate of
returns to education series before calculating h. After 1985 we used the Flabbi et al (2008) estimates. For
the years 2003-2006 we used the 2002 estimates of 11.1%.
Looking at Figure 4, it is inevitable that one has doubts whether the series indeed
reflect the value of the stock of human capital, even though the methodology we used is
widely employed in the economic literature. It seems questionable that the per capita
human capital stock indeed dropped during socialism, since there was a large scale
physical capital accumulation in this period and that should have ceteris paribus

17
increased the rate of returns to education and so the value of human capital stock. Also
this measure has already led to quite surprising results in cross-country comparisons (van
Leeuwen and Földvári, 2008), indicating that in its current form it is too sensitive to
changes or differences in rate of returns while obviously it does not (or just in an indirect
way) take other factors into consideration like expected lifespan, prospects of economic
growth, or technological development. Obviously, the rate of returns to education may
reflect the effect of biased technological change (change of skill premium) but will not
necessarily be affected by a neutral, unbiased technological development (since this
increases all wages proportionally). To sum up, even though the first type of criticism
could be dismissed by pointing out that socialism brought about a fundamental change in
institutions, and seemingly this is reflected by the dropping rate of returns, the results are
sensitive to outliers and do not capture neutral technological development. Therefore, we
we choose to use a similar, but in our view more reliable estimation procedure of human
capital stock.
In developing a new stock, our point of departure is the way how human capital is
defined in prospective measurement methods. In those methods, human capital is
understood in parallel with investments: the price of an asset, like a bond or stock, will
tend to equal the present value of all expected future flows of income from it. Since when
one invests in human capital, one expects a higher wage, the present value of the
individual human capital can be seen as the present value of the future expected wages,
corrected for the individual chance of survival. This is exactly how the Dagum-Slottje
(2000) method works, but that is basically developed for use in household surveys. We
seek to derive a similar formula, but for macro-level usage.

18
We first define human capital as the sum of all discounted expected future wage
flows (we assume continuous time for convenience and use real wages):
( )65
, ,
0
x
qt
i x i t
t
h E w e dt
−
−
=
= ∫ (6)
where x and E(wi,x) is age and the expected real wage of individual i, and q is a discount
factor. The formula above assumes that the individual remains in the labor force until his
age 65. Since we are interested in the human capital stock of the average individual, the
formula can be simplified:
( )65
0
x
qt
t
t
h E w e dt
−−
=
= ∫ (7)
Where x denotes the average age in the population. Now by assuming that the average
individual expects that his/her real wage is going to grow at a constant rate g, the formula
further simplifies:
( )( )65
( ) 65( )
0
1x
g q xg q t
t
wh we dt e
g q
−− −−
=
= = −−∫ (8)
Now, if we have some assumptions regarding g-q, with the average age and wage of the
population, we can express the average (per capita) stock of human capital in monetary
units, which is an improvement over the previous method in (4).5 We assume in this
paper that q-p=0.02, that is people expect that there utility resulting from higher wages
5 We can establish a relationship between the two methods. Since the average wage can be expressed as
the product of the wage of an unschooled individual times the effect of schooling on wages as
follows:rS
uw w e= equation (19) can easily be rewritten as:
65( )
0
x
rS g q t
u
t
h w e e dt
−−
=
= ∫ . It is
straightforward that if we assume that the unschooled wages remain constant (no productivity growth in
the long-run), and the discount factor and the expected growth of real wages are equal (g-q=0), and r and
S are constant, we revert to equation (4). That is the first method is equivalent with the prospective
method suggested by us only under some very strict assumptions. Pritchett (2001) also acknowledges that
the measure in equation (4) fails to capture changes in the unskilled wages.

19
will increase with time. Applying (8) on the data, we obtain the following series of
human capital stock for Hungary:
Figure 5
The stock of human capital in Hungary 1920-2007 with prospective method in millions
of HUF, constant 2000 prices (h2)
Figure 5 reflect a clear upward trend, not without breaks, though. After 1975, the per
capita human capital stock seems to fall which continues until the end of transition. In
comparison with the first measure in Figure 4, we find that the first measure, because of
the reduction in the rate of returns to education, indicates a much lower per capita human
capital stock relative to the interwar years, than the second method. The drop in human
capital stock also occurs with the second measure, but only after 1975. Both measures
lead to the conclusion that the human capital stock rose sharply after 1995.

20
While the relationship between formal education in the form of “average years of
education” and the Mincerian human capital measure is straightforward (see equation 4),
its relation with our second human capital measure is more complex. In Figure 6 we plot
the second human capital series against average years of education.
Figure 6
Relationship between formal education (average years of schooling) and the human
capital stock
The relationship is mostly positive, but not monotonous, which can be attributed to the
economic problems of the eighties and the transition itself. If we assume that there is
dynamic relationship between formal education and human capital, we can model this
relationship with a partial adjustment model:
1
(37.3) (12.6) (7.68) (2.49) (2.34)
ln 2 9.81 0.863 ln 2 0.230 0.151 0.107 trans
t t t t
soc
thc hc S D D−
= + + ⋅ ⋅+ +
2
R 0.98, N=83, Q(2)=0.557, Q(5)=9.21=
(9)
Where Dtrans is a dummy capturing the effect of transition during 1990-94. The results
from the above regression suggest that an additional year of formal education has an

21
immediate 23% impact on our income based human capital measure, with the long-run
impact 171.6%. The half-life (that is the time needed for 50% of the effect to wear out) is
about five years. Since (9) is a dynamic specification, the DW statistics would be
misleading, so we report Ljung-Box statistics instead for the second and fifth lag.
4. Growth accounting and regression analysis for Hungary 1920-2006
4.1 Growth accounting
Now that we have annual estimates of physical-and human capital for Hungary before,
during, and after socialism, it is possible to employ them in a growth accounting analysis.
Growth accounting, that is the estimation of the share of economic growth that cannot be
explained by the accumulation of the observed production factors, is a frequently used
technique, suggested by Solow (1957) and made popular by Dennison (1974). In most
cases it is assumed that the factor shares in aggregate income remain constant, which is in
accordance with unit elasticity of substitution (a Cobb-Douglas type production
function). Even though this is obviously a simplification, it is generally very difficult to
have accurate data on factor shares. On the income sides of National Accounts Statistical
Bureaus report categories that are fundamentally different from their theoretical
counterparts: the compensation of employees’ category contains just a part of total labour
income, while the category labelled as “mixed income” contains the labour and capital
income of entrepreneurs, making these practically inseparable. Also, the reported
category of “gross operating surplus” is far too aggregate to give us any clue what is paid
to capital owners, what is deducted as rents, and what can be deemed as economic profit.
This problem is especially evident in Hungary, where the share of private entrepreneurs

22
gradually increased from the 1960s as a result of the relatively liberal economic policy of
the regime. Therefore, even though using the National Accounts of the HSO for different
years, we get the impression that the share of labour in aggregate income gradually
decreased in the second half of the 20th century, this might be caused by the increasing
share of private enterprises, and hence the increasing measurement problems. This seems
to be supported by the implausibly low share of employee compensation in the 1990s.
Figure 7
Share of compensation of employees in aggregate income
Note: the HSO National Accounts reported Net National Product prior to the 1970s, which is not equivalent
with GDP. The observations for the 1960s are therefore just indicative.
Also, one should not forget, that the wage bill reflects not only the share of labour in total
income, but also that of human capital. Even though practically these are inseparable,
theoretically it is usually done (see Mankiw, Romer and Weil 1992). We find it therefore
23
safer to assume that all factors of production in our model (physical capital, human
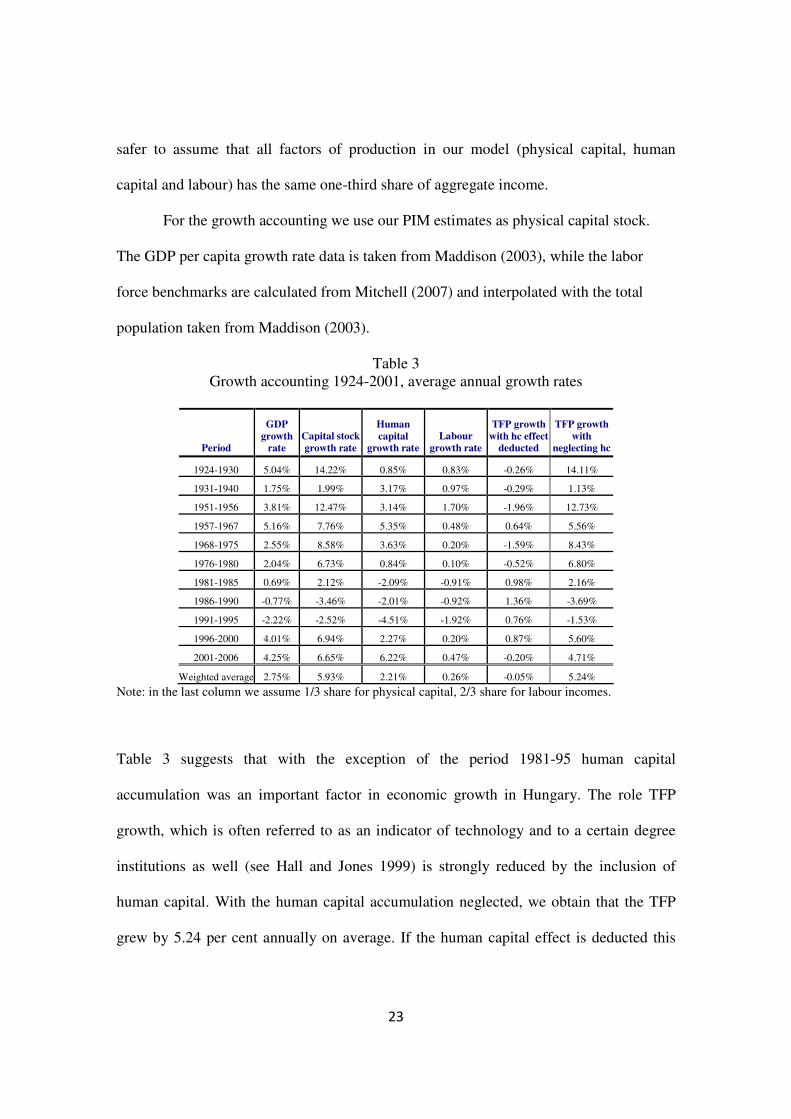
capital and labour) has the same one-third share of aggregate income.
For the growth accounting we use our PIM estimates as physical capital stock.
The GDP per capita growth rate data is taken from Maddison (2003), while the labor
force benchmarks are calculated from Mitchell (2007) and interpolated with the total
population taken from Maddison (2003).
Table 3 Growth accounting 1924-2001, average annual growth rates
Period
GDP
growth
rate
Capital stock
growth rate
Human
capital
growth rate
Labour
growth rate
TFP growth
with hc effect
deducted
TFP growth
with
neglecting hc
1924-1930 5.04% 14.22% 0.85% 0.83% -0.26% 14.11%
1931-1940 1.75% 1.99% 3.17% 0.97% -0.29% 1.13%
1951-1956 3.81% 12.47% 3.14% 1.70% -1.96% 12.73%
1957-1967 5.16% 7.76% 5.35% 0.48% 0.64% 5.56%
1968-1975 2.55% 8.58% 3.63% 0.20% -1.59% 8.43%
1976-1980 2.04% 6.73% 0.84% 0.10% -0.52% 6.80%
1981-1985 0.69% 2.12% -2.09% -0.91% 0.98% 2.16%
1986-1990 -0.77% -3.46% -2.01% -0.92% 1.36% -3.69%
1991-1995 -2.22% -2.52% -4.51% -1.92% 0.76% -1.53%
1996-2000 4.01% 6.94% 2.27% 0.20% 0.87% 5.60%
2001-2006 4.25% 6.65% 6.22% 0.47% -0.20% 4.71%
Weighted average 2.75% 5.93% 2.21% 0.26% -0.05% 5.24%
Note: in the last column we assume 1/3 share for physical capital, 2/3 share for labour incomes.
Table 3 suggests that with the exception of the period 1981-95 human capital
accumulation was an important factor in economic growth in Hungary. The role TFP
growth, which is often referred to as an indicator of technology and to a certain degree
institutions as well (see Hall and Jones 1999) is strongly reduced by the inclusion of
human capital. With the human capital accumulation neglected, we obtain that the TFP
grew by 5.24 per cent annually on average. If the human capital effect is deducted this

24
reduces to -0.05% p.a.. What is more, there are periods when the TFP growth is negative:
during the first half of the 20th century (until the fifties).
Should the reduction of the role of TFP by including human capital worry us? If
one believed that institutions and technological development is independent of the value
of the factors of production, it should certainly should. Nevertheless, that would be a
point of view very difficult to defend: better allocation of resources, more productive
technologies, should all result in higher returns to factors of production thereby
increasing their value. Hence what we find here is by no means that institutions or
technology did not play a role in economic development in Hungary, but rather that their
effect is through factor accumulation (e.g. Eicher, García Peñalosa, and Teksoz 2006).
We find Abramovitz’s (1993) view on the Solow residual, “lower-bound measure of
ignorance about the sources of growth” much more fitting. From that perspective, having
a TFP growth close to zero in the long-run is the best we could have hoped to find.
Growth accounting is however the least challenging task when one is about to
find out how human capital contributes to economic growth. Since it is already assumed
that human capital plays a role in the production process, it is guaranteed that one has
some results. The rest is usually a question of narrative. It is much more difficult to have
human capital included in some growth regressions, and see that the human capital
variable ultimately behaves as expected. Benhabib and Spiegel (1994) find that education
has seemingly no role in the growth process. The lack of success resulted in two different
kind of reactions. Pritchett (2001) in his famous article basically accepts the lack of
macroeconomic relationship between growth and education and tries to find an
economic-social answer why education does not turn out to be a key of economic

25
success. Kreuger and Lindhal (2001), similarly to Cohen and Soto (2007), claim that data
and measurement error is mainly responsible for the insignificant or even negative
coefficients. Our point of view is closer to this latter strand of the literature, with the
major difference that while they still rely on educational attainment or closely related
data, we believe that the strange empirical results are due to the wrong indicators. Human
capital should be expressed in terms of monetary units, similarly to physical capital stock
and not proxied by an indirectly related educational indicator. In order to prove this point,
we estimate a simple, Cobb-Douglas type production function with our measure of
human capital employed.
Table 4
Results from regression analysis
1 2 constant 7.261
(13.9) 5.328 (4.33)
lnK 0.228 (15.7)
0.215 (14.6)
lnH 0.314 (6.26)
0.302 (6.38)
lnL 0.241 (1.70)
0.514 (2.84)
trend 0.007 (10.12)
0.008 (10.9)
Dsoc - -0.053 (-1.86)
Dtrans - -0.118 (-5.39)
R2 0.992 0.995 N 71 71 DW 0.694 1.030
Note: Dependent variable is the log of GDP. Robust t-statistics in parentheses
We find that all factors of production yield the expected coefficients in Table 4. We can
also safely reject the possibility that the regression is spurious, since the Durbin-Watson
statistics are much higher than null, indicating that the residual has no unit-root.
26
6. Conclusion
In this paper we had two objectives. First, we estimated the physical and human capital
stocks for Hungary, for the period 1924-2006. We used two measures to estimate the
value of the human capital stock in Hungary. The first one, based on rate of returns to
education, indicates a reduction in the value of human capital stock in the Socialist
period. The second method on the other hand results in different results, with the human
capital stock starting to decline only after 1975. That the value of human capital stock
decreased during the last two decades of Socialism, we attribute to the much less efficient
allocation mechanisms when compared to market economy. As in an earlier work for the
transition period (Földvári and van Leeuwen 2009), we find that the Solow residual’s
contribution to economic growth significantly reduces when one subtracts the effect of
human capital accumulation. Letting go the growth accoutinga ssumption that human
capital must affect economic growth, we also find that the prospective measure labelled
(h2) yields a positive and significant coefficient in regression analysis.
References
Abramovitz , M. 1993, The Search for the Sources of Growth: Areas of Ignorance, Old and New , The Journal of Economic History, Vol. 53, No. 2 (Jun., 1993), pp. 217-243 Altug, S., Filiztekin, A., Pamuk, S. (2008), ‘Sources of Long-Term Economic Growth for Turkey, 1880-2005’, European Review of Economic History, Vol. 12, No. 3, 393-430. Aukrust, Odd (1957), ‘Trends and cycles in Norwegian income shares,’ Review of Income and Wealth, vol.6 (1), 283-305. Barro, R. W. and J.-W. Lee, (2003) “International Data on Educational Attainment: Updates and Implications”, Oxford Economic Papers 53, no.3, 541-563.

27
Benhabib, J. and Spiegel, M. M. (1994) "The Role of Human Capital in Economic Develop-ment: Evidence from Aggregate Cross-Country Data," Journal of Monetary Economics 34(2), 143-174. Campos, N. and Coricelli, F., 2002, “Growth in Transition: What We Know, What We Don’t, and What We Should” Journal of Economic Literature 40, no. 3 , 793-836. Cohen, D. and Soto, M. 2007. Growth and human capital: good data, good results, Journal of Economic Growth, 12(1), 51-76. Dagum, C. and Slottje, D.J., 2000, A new method to estimate the level and distribution of the household human capital with applications, Journal of Structural Change and
Economic Dynamics 11 (2000), pp. 67–94. Darvas, Zs. and Simon, A., 2000, “Capital stock and economic development in Hungary”
Economics of Transition 8, no. 1., 197-223. Darmstadter, Joel, Teitelbaum, P.D and Polach, J.G., 1971, Energy in the World
Economy A
Statistical Review of Trends in Output, Trade, and Consumption since 1925
Dennison , E. F. (1974): Accounting for United States Economic Growth, 1929 to 1969. Washington, D.C.: the Brookings Institution
Doyle, P., Kuijs, L., Jiang, G., (2001). Real Convergence to EU Income Levels: Central Europe from 1990 to the Long Term. IMF Working Paper No 01/146. Eckstein, Alexander, (1955), ‘National income and capital formation in Hungary, 1900-1950,’ S. Kuznets (ed.), Review of Income and Wealth, Series V, International Association for Research in Income and Wealth, London, 152-223. Easterly, W., Fisher, S. (1995) The Soviet Economic Decline, World Bank Economic
Review, Vol. 9, No. 3,341-371. Eicher, Theo S., Cecilia García-Peñalosa, and Utku Teksoz, ‘How Do Institutions Lead Some Countries to Produce So Much More Output per Worker than Others?, Theo S. Eicher and Cecilia García-Peñalosa (eds.), Institutions, Development, and Economic
Growth, The MIT Press 2006, 65-80 Enflo, Kerstin, and Joerg Baten, Growth Accounting in Times of Turbulence: Efficiency, Technology, Capital Accumulation and Human Capital 1929-1950 Flabbi, L., Paternostro, S. and Tiongson E. R. (2008), Returns to education in the economic transition: A systematic assessment using comparable data, Economics of Education Review 27, 724–740

28
Földvári, Péter and Leeuwen, Bas van (2009), Average years of education in Hungary: annual estimates 1920-2006. Eastern European Economics Vol. 47 No. 2, 5-20. Ganev, K., “Can Educational Attainment Explain Total Factor Productivity? Growth Accounting Evidence from Seven Transition Countries for the Period 1991-2000”, paper
has been prepared for the 2005 edition of the Conference for Medium-Term Economic
Assessment (CMTEA), held in Sofia, September 29-30 2005. Gregory, Paul, R., 1975, Some Indirect Estimates of Eastern European Capital Stocks and Factor Productivity, Soviet Studies, Vol. 27 (1) 1975, 71-85. Hall, Robert E., and Jones, C. I. 1999, Why Do Some Countries Produce So Much More Output Per Worker Than Others?, The Quarterly Journal of Economics, MIT Press, vol. 114 (1), 83-116. Hernandez, Jose A., ‘Econometric Estimation of the Physical Capital Stock’. IMF (1999), “Hungary Selected Issues”, SM/99/28. International Labour Office, Bulletin of Labour Statistics, 1965-…, Geneva: ILO various issues. International Labour Office, International Labour Review, 1921-…, Geneva: ILO various issues. International Labour Office, LABORSTA (http://laborsta.ilo.org/). International Labour Office, Year Book of labour statistics, Geneva: ILO, various issues. Kander, Astrid, and Lennart Schön, 2005, The energy – capital relation -Sweden 1870-
2000, Paper for the Sixth Conference of the European Historical Economics Society,
Istanbul 9-10 September, 2005. Krueger, A. B. and Lindahl, M. (2001) Education for Growth: Why and For Whom? Journal of Economic Literature, Vol. 39, No. 4., 1101-1136. KSH, “Az állóeszközállomány és a termelés növekedése 1950-1968 (the capital stock and growth of production 1950-1968)” (in Hungarian), Budapest: KSH, 1969 KSH, “A nemzeti vagyon és az állóeszközállomány 1960-1973 (National wealth and the capital stock 1960-1973)” (in Hungarian), Budapest: KSH, 1974

29
KSH, “Az állóeszközállomány és a termelés növekedése 1970-1978 (the capital stock and growth of production 1970-1978)” (in Hungarian), Budapest: KSH, 1979 KSH, “Az állóeszközállomány és a termelés növekedése 1979 (the capital stock and growth of production 1979)” (in Hungarian), Budapest: KSH, 1980a KSH, “Az állóeszközállomány és a termelés növekedése 1980 (the capital stock and growth of production 1980)” (in Hungarian), Budapest: KSH, 1980b KSH, “Az állóeszközállomány és a termelés növekedése 1981 (the capital stock and growth of production 1981)” (in Hungarian), Budapest: KSH, 1981 Központi Statisztikai Hivatal (Magyarország), Annuaire statistique hongrois (Statistical
Yearbook of Hungary), Budapest : Athenaeum, 1903-1931 Központi Statisztikai Hivatal (Magyarország), Magyar statistikai évkönyv (Statistical
Yearbook of Hungary), Budán : Magyar Királyi Egyetemi Nyomdában, 1872-[ca. 1892]. Lains, P. (2003), ‘Catching up to the European core: Portuguese economic growth, 1910-1990’, Explorations in Economic History, Vol. 40, No. 4, 369-386. Leeuwen, Bas van and Földvári, Péter (2008), ’How much human capital does Eastern Europe have? Measurement methods and results’, Post-Communist Economies Vol. 20, No. 2, 189-201. Lucas, R., 1988, On the Mechanics of Economic Development. Journal of Monetary
Economics, 22, pp. 3-42. Maddison, Angus, The World Economy: Historical Statistics, Paris: OECD 2003. Mankiw, N. Gregory, David Romer, and David N. Weil, ‘A Contribution to the Empirics of Economic Growth,’ Quarterly Journal of Economics, Vol. 107 (2) 1992, 407-437. Mincer, J., “Schooling, Experience and Earnings”, New York: NBER, 1974. Mitchell, Brian R. (2007), International historical statistics. Europe, 1750-2005,
Basingstoke : Palgrave Macmillan, 2007. Portela, M., R. Alessie, and C. Teulings, “Measurement Error in Education and Growth Regressions”, Tinbergen Institute Discussion Paper, TI 2004-040/3 (2004). Psacharopoulos, George, Patrinos, Harry Anthony, 2002. ‘Returns to investment in education : a further update’, Policy Research Working Paper Series 2881 Prucha, Ingmar R., 1995, ‘On the Econometric Estimation of a Constant Rate of Depreciation,’ Empirical Economics, Vol. 20, 299-302.
30
Prados de la Escosura, Leandro, and Joan R. Rosés (2008), "Capital Accumulation in the Long-Run: The Case of Spain, 1850-2000" (under review) Prados de la Escosura, Leandro, and Joan R. Rosés (2008), "The Sources of Long-run Growth in Spain, 1850-2000", Journal of Economic History 69, 4 (2009). Pritchett, L. (2001) Where has all the education gone? The World Bank Economic Review, 15(3), 367-391. Pryor, Frederic L., 1985, ‘Growth and Fluctuations of Production in OECD and East-European Countries,’ World Politics, Vol. 37 (2), 204-237. Pula, G., “Capital Stock Estimation in Hungary: a Brief Description of Methodology and Results”, MNB Working Paper 2003/7, The National Bank of Hungary Roman, Zoltan, 1982, Productivity and Economic Growth. Budapest: Akademiai Kiado. Romer, P., 1990, Endogenous Technological Change. Journal of Political Economy, 98, part 2, pp. 71-102. Schulze, Max-Stephan, Felipe Tamega Fernandes, 2009, Human capital formation in Austria-Hungary and Germany: time series estimates of educational attainment, 1860-1910,’ in: Halmos Károly, Klement Judit, Pogány Ágnes, Tomka Béla (szerk.): A
felhalmozás míve. Történeti tanulmányok Kövér György tiszteletére, 2009, 275-290. Simkus, A., Andorka, R. (1982) Inequalities in educational attainment in Hungary, 1923-1973, American Sociological Review, Vol. 47, No. 6, 740-751. Solow, R. M., 1956, A Contribution to the Theory of Economic Growth. Quarterly
Journal of Economics, 70, pp. 65-94. Solow, R. M., 1957, Technical Change and the Aggregate Production Function. Review
of Economics and Statistics. 39, 312-20. Swan, T. W., 1956, Economic Growth and Capital Accumulation. Economic Record, 32, pp. 334-61.
United Nations. Statistical Office, various issues, Statistical Yearbook-Annuaire
Statistique, New York [etc.], United Nations. Wöβmann, Ludger, ‘Specifying Human Capital,’ Journal of Economic Surveys, Vol. 17 (3) 2003, 239-270.