Capcom Co., Ltd. (Tokyo Stock Exchange, 131 142 11 63 82 95 13 280 213 237 24 24 29 34 5 56 42 37 -5...
33
0 Capcom Public Relations & Investor Relations Section Capcom Public Relations & Investor Relations Section Capcom Co., Ltd. (Tokyo Stock Exchange, First Section, 9697) 3rd Quarter Report Fiscal year ending March 31, 2018
Transcript of Capcom Co., Ltd. (Tokyo Stock Exchange, 131 142 11 63 82 95 13 280 213 237 24 24 29 34 5 56 42 37 -5...

0Capcom Public Relations & Investor Relations SectionCapcom Public Relations & Investor Relations Section
Capcom Co., Ltd.(Tokyo Stock Exchange,First Section, 9697)
3rd Quarter ReportFiscal year ending March 31, 2018

1Capcom Public Relations & Investor Relations Section
Strategies, plans, outlooks and other statements that are not historical facts are based on assumptions that use information currently available and reasonable judgments. Actual performance may be significantly different from these statements for a number of reasons.
In the entertainment industry, which includes Capcom, performance may be highly volatile because of diverging user needs and other changes in market conditions.
Factors that can affect Capcom’s performance include: (1) the number of hit titles and sales volume in the Home Video Game Business, which accounts for the majority of sales; (2) progress in developing home video games; (3) consumer demand for home video game consoles; (4) sales outside Japan; (5) changes in stock prices and exchange rates; (6) alliances with other companies concerning product development, sales and other operations; and (7) changes in market conditions. Please note that this is not a complete list of factors that can influence Capcom’s operating results.
Forward-looking Statements

2Capcom Public Relations & Investor Relations Section
4. Additional Information 30
page
1. Forecasts for FY3/18 3
Contents
3. FY3/18 Segment Plans & Forecasts 20
2. Financial Highlights 5
Summary of Major Financial Information

3Capcom Public Relations & Investor Relations Section
1. Forecasts for FY3/18

4Capcom Public Relations & Investor Relations Section
2017/3 2018/3 Plan Difference
Net sales 87,170 93,000 5,830
Operating income 13,650 14,500 850
Operating margin 15.7% 15.6% -
Ordinary income 12,589 14,000 1,411
Net income attributable to
owners of the parent 8,879 9,500 621
1. Forecasts for FY3/18
Targeting 5 consecutive years of increased operating income
driven by launch of major titles and growth of catalog sales
Overall in line with plans as of Q3 end
Earnings per share forecast: ¥173.53 (as per plan)
Dividend forecast: interim dividend of ¥25 and year-end dividend of ¥25 resulting in a ¥50
dividend for the fiscal year
(millions of JPY)

5Capcom Public Relations & Investor Relations Section
2. Financial Highlights

6Capcom Public Relations & Investor Relations Section
2016/12 2017/12 Difference
Net sales 53,507 47,740 -5,767
Operating income 5,119 7,009 1,890
Ordinary income 4,147 7,099 2,952
Net income attributable to
owners of the parent 2,762 4,439 1,677
2-1. Financial Highlights – Consolidated Business Results (1)
Despite smaller lineup of pachislo models impacting sales,
profit up due to Digital Contents profitability improvements
9 Months Results in FY3/17 vs. FY3/18
Sales lower primarily due to reducing lineup of models in PS following changes to the
market environment
Increased profit due to profitability improvements in Digital Contents
Quarterly net income per share: ¥81.09
(millions of JPY)

7Capcom Public Relations & Investor Relations Section
2-1. Financial Highlights – Consolidated Business Results (2)
12/2017 Net Sales: Increases and Decreases
• Sales in the Amusement Equipments business lower primarily due to reducing
lineup of models in PS following changes to the market environment
• Sales grew in Digital Contents business, driven by both new and catalog titles
60
(billions of JPY)
50
40
¥53.5billion
Dec. 2016 Dec. 2017
Amusement Equipments
Arcade Operations
Other Businesses
Digital Contents
-¥8.8billion
¥0.5billion
¥0.1billion
¥2.4billion
¥47.7billion
• PS sales down35 k units
(57 k → 22 k)
• Release schedule revised due torule changes
• YoY sales growth for existing stores: 2%
• Growth in catalog sales
• YoY sales of new titles also healthy

8Capcom Public Relations & Investor Relations Section
2-1. Financial Highlights – Consolidated Business Results (3)
12/2017 Operating Income: Increases and Decreases
(billions of JPY)
10
8
Dec. 2016 Dec. 2017
¥5.1billion
Amusement Equipments
¥4.7billion
Arcade Operations
¥0.2billion
Other Businesses
¥0.2billion
Digital Contents
-¥3.2billion
• Lower profit on decrease in sales
¥7.0billion
• Increased Consumer unit sales
• Licensing revenue in Mobile
• Depreciation progress in PC Online
• Increased profit in Digital Contents business due primarily to Consumer growth
• Decreased profit in Amusement Equipments business year-over-year due to
launch of hit PS title in the same period of the previous fiscal year
0
4
6
2
• Increased same-store sales

9Capcom Public Relations & Investor Relations Section
Assets 2017/3 2017/12 Difference
Notes and accounts receivable -
trade 20,175 6,137 -14,038
Work in progress for
game software 30,150 40,604 10,454
Liabilities 2017/3 2017/12 Difference
Short-term borrowings and
Long-term borrowings 16,111 13,363 -2,748
2-1. Financial Highlights – Balance Sheet
Major Changes in Balance Sheet Items
1. Notes and accounts receivable - trade• Collected accounts receivable for titles released in Q4 of FY16
2. Work in progress for game software• Increase accompanying development progression in Consumer
3. Short-term borrowings and Long-term borrowings• Decrease due to repayment of ¥2 billion in short-term borrowings
(millions of JPY)
(millions of JPY)

10Capcom Public Relations & Investor Relations Section
-2.1
+7.0
-1.6
+0.1
-4.1
+0.9
-0.7
-2.0
+3.5
-10.3
+14.1
-3.1
-0
-2.7
-0.4
0
2-1. Financial Highlights – Consolidated Cash Flows
12/2017 Consolidated Cash Flows: Increases and Decreases
50
45
40
35
30
25
¥24.3 bn. ¥22.8
bn.
CF from Operating Activities¥5.5 bn.
CF fromInvesting Activities- ¥2.0 bn.
CF fromFinancing Activities
- ¥5.8 bn.
Depreciation and amortization
Quarterly net income before income taxes
Decrease in notes and accounts
payable - trade
Increase in work in progress for game software
Income taxes paid
Decrease in accounts receivable -trade
Other
Payments for
acquisition of tangible
fixed assets
Payments for acquisition of intangible assets
Other
Net decrease in short-term
borrowings
Dividends paid by parent
company
Repayments of long-term borrowings
Other
Effect of exchange rate changes on cash and cash equivalents
(billions of JPY)
20
11Capcom Public Relations & Investor Relations Section
Digital Contents
12Capcom Public Relations & Investor Relations Section
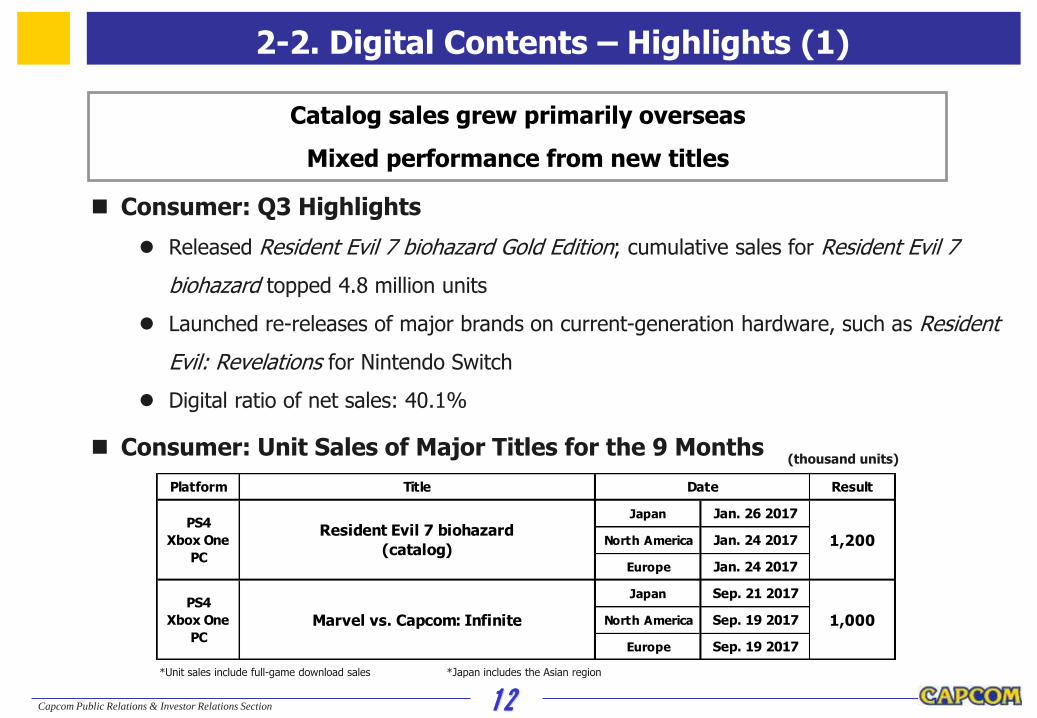
Consumer: Q3 Highlights
Released Resident Evil 7 biohazard Gold Edition; cumulative sales for Resident Evil 7
biohazard topped 4.8 million units
Launched re-releases of major brands on current-generation hardware, such as Resident
Evil: Revelations for Nintendo Switch
Digital ratio of net sales: 40.1%
Consumer: Unit Sales of Major Titles for the 9 Months
2-2. Digital Contents – Highlights (1)
Catalog sales grew primarily overseas
Mixed performance from new titles
*Unit sales include full-game download sales *Japan includes the Asian region
(thousand units)
Platform Title Result
Japan Jan. 26 2017
North America Jan. 24 2017
Europe Jan. 24 2017
Japan Sep. 21 2017
North America Sep. 19 2017
Europe Sep. 19 2017
1,200
PS4
Xbox One
PC
Marvel vs. Capcom: Infinite 1,000
Date
PS4
Xbox One
PC
Resident Evil 7 biohazard
(catalog)

13Capcom Public Relations & Investor Relations Section
2015/12 2016/12 2017/12 Difference
28 33 41 8
Package
Japan 4,000 1,450 1,300 -150
North America 1,100 2,700 2,450 -250
Europe 500 900 1,750 850
Asia 200 150 250 100
Package Total 5,800 5,200 5,750 550
Full-game download 4,000 6,500 8,100 1,600
9,800 11,700 13,850 2,150
Titles (SKU)
Digital download contents
Total
2-2. Digital Contents – Highlights (2)
Digital downloads strong, driven by catalog sales
Stable growth for unit sales year-over-year
Consumer: Unit Sales for the 9 Months(thousand units)

14Capcom Public Relations & Investor Relations Section
2-2. Digital Contents – Highlights (3)
Pursued mobile game alliances aimed at growth in the medium term
while continuing stable operations of in-house titles
Mobile Contents: Q3 Highlights
Monster Hunter Explore contributed stable revenue and profit
Launched Puzzle Fighter for Android and iOS in November in Europe, North
America and Asia
PC Others: Q3 Highlights
Monster Hunter Frontier Z performing steadily
Released Dragon’s Dogma Online 3.1 update in December

15Capcom Public Relations & Investor Relations Section
2015/12 2016/12 2017/12 Difference
360 284 308 24
97 14 62 48
26.9% 5.1% 20.3% -Breakdown of Net Sales
217 131 142 11
63 82 95 13
280 213 237 24
24 29 34 5
56 42 37 -5
Mobile Contents
Operating margin
Digital Download Contents
Package
PC Other
Net sales
Operating income
Consumer total
2-2. Digital Contents – Highlights (4)
Revenue and profit up primarily due to stable growth in Consumer,
with licensing revenue from Mobile also contributing
■ 9 Months Digital Contents Performance(hundreds of millions of JPY)

16Capcom Public Relations & Investor Relations Section
Arcade Operations

17Capcom Public Relations & Investor Relations Section
2015/12 2016/12 2017/12 Difference
Net sales 65 70 76 6
Operating income 4 6 8 2
Operating margin 7.0% 8.6% 10.7% -Y/Y Ratio of sales for
existing stores -6% 3% 2% -
2016/3 2017/3 2017/12 2018/3 Plan
New stores 4 3 2 5
Closing stores 3 1 1 2
Total 34 36 37 39
2-3. Arcade Operations – Highlights
Revenue and profit up due to promoting efficient operations
Same store sales continue to be strong
9 Months Highlights
YoY sales growth for existing stores: +2% (1H: +3%, Q3: +2%)
No stores opened or closed this quarter
9 Months Business Results
Number of Stores
(hundreds of millions of JPY)
(facilities)

18Capcom Public Relations & Investor Relations Section
Amusement Equipments

19Capcom Public Relations & Investor Relations Section
2015/12 2016/12 2017/12 Difference
Net sales 130 165 77 -88
Operating income 28 54 21 -33
Operating margin 22.1% 32.7% 27.6% -
2-4. Amusement Equipments – Highlights
Revenue and profit down due to revising new model launch
schedule on change in Pachinko & Pachislo market environment
Pachinko & Pachislo: 9 Months Highlights
Revised new model release schedule in light of changes in the market
environment following the October rule change
9 months cumulative unit sales for two models: 22 thousand units
(sales for 3 models in same period of the previous year: 57 thousand units)
Arcade Games Sales: 9 Months Highlights
Continued sales of existing products
9 Months Business Results
*Net Sales Ratio of Pachinko & Pachislo to Arcade Games Sales: 9:1
(hundreds of millions of JPY)

20Capcom Public Relations & Investor Relations Section
3. FY3/18 Segment Plans & Forecasts

21Capcom Public Relations & Investor Relations Section
Digital Contents

22Capcom Public Relations & Investor Relations Section
3-1. Digital Contents – Full-year Plans (1)
Focusing on sale of major titles in Consumer
Work to ensure stable performance of PC Online and Mobile titles
Consumer: Outlook for FY3/18
Will launch Monster Hunter: World
In addition to Japan, strengthen roll-out across the world, aiming to grow
Monster Hunter into a global brand
→Jan. 26 2018 global simultaneous release
Mobile Contents: Outlook for FY3/18
Promote development of new titles for the next fiscal year via both alliances
and in-house development
PC Others: Outlook for FY3/18
Continue regular updates for major domestic titles

23Capcom Public Relations & Investor Relations Section
2016/3 2017/3 2018/3 Plan Difference
45 42 53 11
Package
Japan 4,700 3,500 2,750 -750
North America 2,600 4,300 4,700 400
Europe 1,200 2,200 2,650 450
Asia 400 400 400 0
Package Total 8,900 10,400 10,500 100
Full-game download 6,100 9,000 12,500 3,500
15,000 19,400 23,000 3,600Total
Digital download contents
Titles (SKU)
3-1. Digital Contents – Full-year Plans (2)
Anticipate increase in digital unit sales due to expanding
lineup of current-generation re-releases
Consumer: FY3/18 Unit Sales Plan for Major Titles(thousand units)
*”Titles” includes download-only titles

24Capcom Public Relations & Investor Relations Section
2015/3 2016/3 2017/3 2018/3 Plan
Consumer
33 45 42 53
7,000 8,000 10,600 10,300
Monster Hunter 4G
Resident Evil: Revelations 2
Resident Evil HD Remaster
Monster Hunter X (Cross)
Street Fighter V
Resident Evil 0 HD Remaster
Resident Evil 7
Monster Hunter XX (Double Cross)
Resident Evil 5 (Re-release)
Resident Evil 4 (Re-release)
Marvel vs. Capcom: Infinite
Monster Hunter: World
others
6,000 7,000 8,800 12,700
Dead Rising 3Resident Evil: Revelations 2
Monster Hunter 4G
Monster Hunter X (Cross)
Resident Evil 6 (Re-release)
Resident Evil 7
Monster Hunter XX (Double Cross)
(for 3DS)
Dead Rising series
others
13,000 15,000 19,400 23,000
New Titles
(SKU)
New Unit Sales
Total
major titles
Catalog Unit Sales
major titles
*Titles released within a given fiscal year calculated as new titles; titles released prior to a given fiscal year calculated as catalog titles.
3-1. Digital Contents – Full-year Plans (3)
Despite slightly soft performance of new titles up to Q3, Expect unit
sales increase primarily due to growth of catalog titles
Breakdown of FY3/18 New and Catalog Consumer Unit Sales
(thousands of units)
25Capcom Public Relations & Investor Relations Section
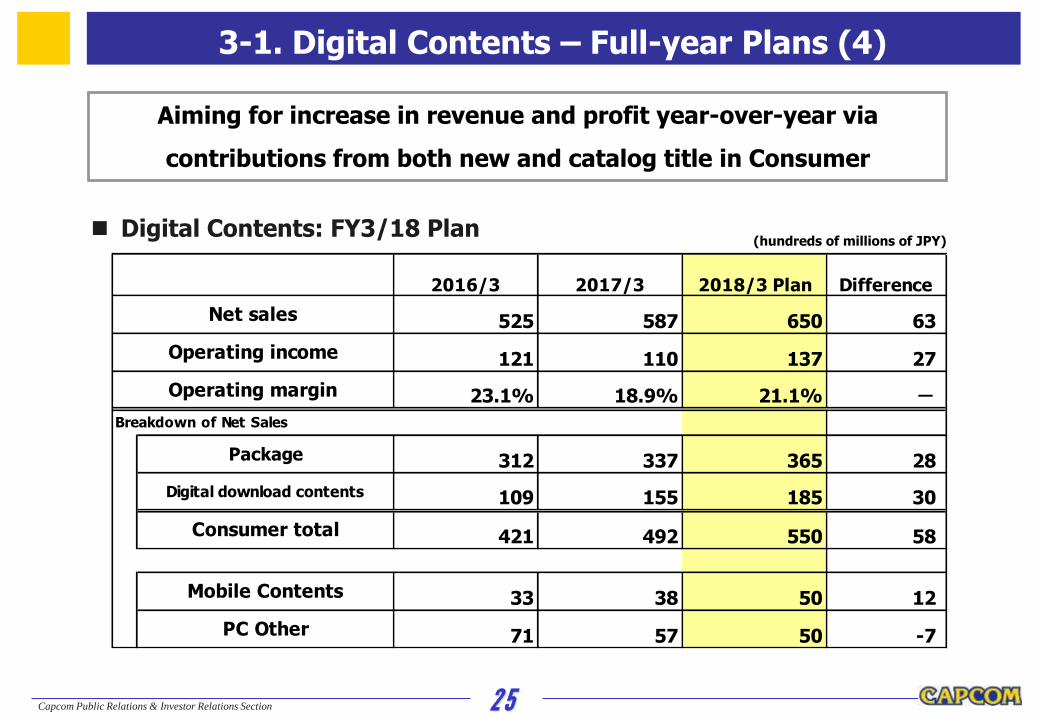
2016/3 2017/3 2018/3 Plan Difference
525 587 650 63
121 110 137 27
23.1% 18.9% 21.1% -
312 337 365 28
109 155 185 30
421 492 550 58
33 38 50 12
71 57 50 -7
Package
Digital download contents
Consumer total
Mobile Contents
PC Other
Net sales
Operating income
Operating margin
Breakdown of Net Sales
3-1. Digital Contents – Full-year Plans (4)
Aiming for increase in revenue and profit year-over-year via
contributions from both new and catalog title in Consumer
Digital Contents: FY3/18 Plan(hundreds of millions of JPY)

26Capcom Public Relations & Investor Relations Section
Arcade Operations
27Capcom Public Relations & Investor Relations Section
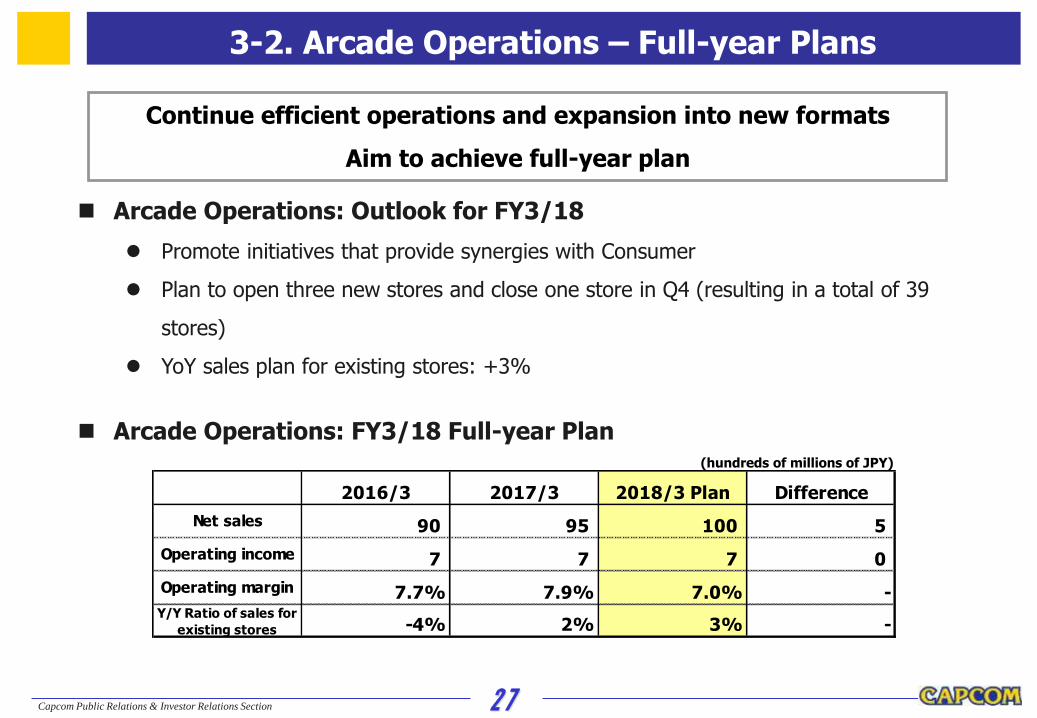
2016/3 2017/3 2018/3 Plan Difference
Net sales 90 95 100 5
Operating income 7 7 7 0
Operating margin 7.7% 7.9% 7.0% -Y/Y Ratio of sales for
existing stores -4% 2% 3% -
3-2. Arcade Operations – Full-year Plans
Continue efficient operations and expansion into new formats
Aim to achieve full-year plan
Arcade Operations: Outlook for FY3/18
Promote initiatives that provide synergies with Consumer
Plan to open three new stores and close one store in Q4 (resulting in a total of 39
stores)
YoY sales plan for existing stores: +3%
Arcade Operations: FY3/18 Full-year Plan(hundreds of millions of JPY)

28Capcom Public Relations & Investor Relations Section
Amusement Equipments

29Capcom Public Relations & Investor Relations Section
Pachinko & Pachislo: Outlook for FY3/18
Review launch timing of 2 fully-compliant models scheduled for 2H release, giving
due consideration to market environment
Proceed with development of new models for next fiscal year and beyond
Arcade Game Sales: Outlook for FY3/18
Continue sales of existing products
Amusement Equipments: FY3/18 Full-year Plan
3-3. Amusement Equipments – Full-year Plans
Review launch timing of 2H models, giving consideration to
market environment following rule changes
*Net Sales Ratio of Pachinko & Pachislo to Arcade Games Sales: 9:1
(hundreds of millions of JPY)
2016/3 2017/3 2018/3 Plan Difference
Net sales 133 168 155 -13
Operating income 28 51 38 -13
Operating margin 21.1% 30.3% 24.5% -
30Capcom Public Relations & Investor Relations Section
Additional Information
Summary of Major Financial Information

31Capcom Public Relations & Investor Relations Section
●Profit and Loss Sheet (millions of JPY)
2016/3 2017/3 2018/3 Plan % 2017/12 Net Sales 77,021 87,170 93,000 106.7% 47,740
Gross Profit 29,846 30,731 33,000 107.4% 19,054Profit margin (%) 38.8% 35.3% 35.5% - 39.9%
Sales and G&A Expenses 17,816 17,080 18,500 108.3% 12,044Operating Income 12,029 13,650 14,500 106.2% 7,009Profit margin (%) 15.6% 15.7% 15.6% - 14.7%Ordinary Income 11,348 12,589 14,000 111.2% 7,099Profit margin (%) 14.7% 14.4% 15.1% - 14.9%
Net income attributable to owners of the parent 7,745 8,879 9,500 107.0% 4,439Profit margin (%) 10.1% 10.2% 10.2% - 9.3%
●Sales by Business Segments (millions of JPY)
2016/3 2017/3 2018/3 Plan % 2017/12 Net Sales 52,577 58,704 65,000 110.7% 30,844
Operating Income 12,167 11,096 13,700 123.5% 6,257Operating Margin 23.1% 18.9% 21.1% - 20.3%
Net Sales 9,056 9,525 10,000 105.0% 7,632Operating Income 699 752 700 93.1% 815Operating Margin 7.7% 7.9% 7.0% - 10.7%
Net Sales 13,343 16,856 15,500 92.0% 7,711Operating Income 2,812 5,106 3,800 74.4% 2,128Operating Margin 21.1% 30.3% 24.5% - 27.6%
Net Sales 2,043 2,083 2,500 120.0% 1,552Operating Income 511 969 1,000 103.2% 758Operating Margin 25.0% 46.5% 40.0% - 48.8%
●Sales by Geographic Area (millions of JPY)
2016/3 2017/3 2018/3 Plan % 2017/12
57,737 55,804 52,600 94.3% 30,24512,384 20,018 28,000 139.9% 10,3635,221 9,007 10,000 111.0% 5,4721,681 2,340 2,400 102.6% 1,658
Digital Contents
Amusement
Equipment
Others
Arcade Operations
Other territories
Europe
North America
Japan
3-1. Summary of Major Financial Information (1)

32Capcom Public Relations & Investor Relations Section
●Sales Units Shipped <platform> (thousand units)
2016/3 2017/3 2018/3 Plan Difference 2017/12
Playstation 3 Titles(SKU) 19 16 - - 9
Playstation 4 Units 3,500 4,700 - - 3,250
PSP Titles(SKU) 8 5 - - 1
PS Vita Units 300 150 - - 0
Wii / wii U Titles(SKU) - - - - 7
Nintendo Switch Units 100 0 - - 1,050
NintendoDS Titles(SKU) 7 5 - - 8
Nintendo 3DS Units 4,100 3,200 - - 400
Xbox 360 Titles(SKU) 6 9 - - 7
Xbox One Units 650 2,100 - - 700
PC & Others Titles(SKU) 4 6 - - 2
Units 250 250 - - 350
Package total Titles(SKU) 44 41 45 4 34
Units 8,900 10,400 10,500 101.0% 5,750
Titles(SKU) 1 1 8 7 7
Units 6,100 9,000 12,500 138.9% 8,100
Total Titles(SKU) 45 42 53 11 41
Units 15,000 19,400 23,000 118.6% 13,850
●Sales Units Shipped <Distribution/Catalog> (thousand units)
2016/3 2017/3 2018/3 Plan Difference 2017/12
750 600 700 116.7% 250
7,000 8,800 12,700 144.3% 9,600
●Sales Units Shipped <geographic> (thousand units)
2016/3 2017/3 2018/3 Plan Difference 2017/12
Full-game
download
Distribution titles
Catalog titles
Japan 4,700 3,500 2,750 78.6% 1,300
North America 2,600 4,300 4,700 109.3% 2,450
Europe 1,200 2,200 2,650 120.5% 1,750
Asia 400 400 400 100.0% 250
Full-game download (global) 6,100 9,000 12,500 138.9% 8,100
Total 15,000 19,400 23,000 118.6% 13,850
3-1. Summary of Major Financial Information (2)
*Full-game download are digital download-only titles