Canopy 2.1 User Guide - Discovery in · PDF filePNNL-21903 Prepared for the U.S. Department of...
40
PNNL-21903 Prepared for the U.S. Department of Energy under Contract DE-AC05-76RL01830 Canopy 2.1 User Guide R Burtner September 2012
Transcript of Canopy 2.1 User Guide - Discovery in · PDF filePNNL-21903 Prepared for the U.S. Department of...

PNNL-21903
Prepared for the U.S. Department of Energy under Contract DE-AC05-76RL01830
Canopy 2.1 User Guide R Burtner September 2012


PNNL-21903
Canopy User Guide
R Burtner
September 2012
Prepared for
the U.S. Department of Energy
under Contract DE-AC05-76RL01830
Pacific Northwest National Laboratory
Richland, Washington 99352


iii
Abstract
Canopy is a visual analytic software suite, developed by researchers at the Pacific Northwest National
Laboratory (PNNL), to support intelligence analysts’ ability to efficiently analyze massive amounts of
multimedia data. Canopy incorporates state-of-the-art computer vision algorithms and interactive
visualizations so that analysts can comprehend and articulate the big picture, thereby reducing their
workload and ultimately the effort of identifying the critical intelligence for decision makers.
Abstract Figure 1. Canopy 2.1 application

iv
Introduction to Multimedia Analytics
The science of analysis of multimedia content is applying skills, technologies, applications, and
practices for continuous iterative exploration and investigation of vast datasets containing multimedia to
gain insight and understanding and to drive well-informed decision making.
Multimedia is media and content that use a combination of different content forms. The term can be
used as a noun (a medium with multiple content forms) or as an adjective describing a medium as having
multiple content forms. The term is used in contrast to media, which only use traditional forms of printed
or hand-produced material. Multimedia includes a combination of text, audio, still images, animation,
video, and interactivity content forms. (Wikipedia)
Analysts who work with collections of multimedia in their analytic activities and process understand
how difficult it is to see relationships across diverse sets of mixed media. The wealth of information from
blogs, social media, news sites, and other collections often can provide actionable intelligence; however,
many of the tools used on these sources of content are not capable of multimedia analysis. As such,
analysts are taxed to keep a mental model of the relationships among each of the media types when
generating the broader content picture. To address this need, we have developed Canopy, a novel visual
analytic tool for analyzing multimedia. Canopy provides insight into the multimedia data relationships by
exploiting the linkages found in text, images, and video co-occurring in the same document and across the
collection. Canopy connects derived and explicit linkages and relationships through multiple connected
visualizations to aid analysts in quickly summarizing, searching, and browsing collected information to
explore relationships and align content. It incorporates state-of-the-art computer vision algorithms and
interactive visualizations so that analysts can comprehend and articulate the big picture, thereby reducing
their workload and ultimately the effort of identifying the critical intelligence for decision makers.
Canopy Application
The Canopy application contains multiple visualizations that both span media types for holistic
understanding and silo individual media types for more media-specific analysis. However, even in the
visualizations silos, the application maintains media connections through selection, relationships, and
highlighting of information context. Canopy has not achieved full data fusion of multimedia but the
ability for you to see the data in its various views at the same time allows you to bridge the various types
of multimedia to derive relationships beyond the silos.
Canopy’s goal is to create a natural, intuitive user interface that delivers seamless and approachable
discovery and interaction. The visualizations within Canopy enable insight and discovery through
contextual awareness. Dynamic and immersive data visualizations allow cognitive management of
diverse data and rich environments.

v
Contents
Abstract ................................................................................................................................................. iii
1.0 Getting Started .............................................................................................................................. 1
1.1 Project Creation .................................................................................................................... 1
1.2 Importing Data ..................................................................................................................... 2
1.2.1 File Types Supported ................................................................................................ 3
1.2.2 Adding More Files to a Project ................................................................................. 3
1.2.3 Project Import Summary ........................................................................................... 3
1.3 Processing a Project ............................................................................................................. 5
1.3.1 File Extraction and Feature Identification ................................................................. 6
1.3.2 Unprocessing a Project .............................................................................................. 8
2.0 Workspace and Workflow ............................................................................................................ 8
2.1 Window Management .......................................................................................................... 8
2.2 Selection ............................................................................................................................... 9
2.3 Highlighting ......................................................................................................................... 10
2.4 Tagging ................................................................................................................................ 10
3.0 Features ......................................................................................................................................... 11
3.1 Dashboard ............................................................................................................................ 12
3.2 List........................................................................................................................................ 13
3.3 Summary .............................................................................................................................. 14
3.4 Text Galaxy .......................................................................................................................... 14
3.5 Image Grid ........................................................................................................................... 16
3.6 Filmstrip ............................................................................................................................... 17
3.7 Arc Weld .............................................................................................................................. 19
3.8 Selection Preview ................................................................................................................. 21
3.9 Preview ................................................................................................................................. 22
3.10 Search ................................................................................................................................... 24
4.0 Tips and Tricks ............................................................................................................................. 24
4.1 Docking and undocking views ............................................................................................. 25
4.2 Unprocessing Projects .......................................................................................................... 25
4.3 Canopy Server Administration Tool .................................................................................... 25
4.4 Visualization Combinations ................................................................................................. 25
5.0 Troubleshooting ............................................................................................................................ 25
Appendix A - File Format ..................................................................................................................... 1

vi
Figures
Abstract Figure 1. Add caption here .................................................................................................... iii
1 Creating a New Project through the File Menu ............................................................................ 1
2 Importing Files into a project ........................................................................................................ 2
3 Importing Files into a Project ....................................................................................................... 3
4 Dashboard View Showing Imported Files .................................................................................... 4
5 List View Showing Imported Files ............................................................................................... 4
6 Processing a Project from the Right-click Menu .......................................................................... 5
7 Processing Status on the Dashboard ............................................................................................. 6
8 File Extraction and Feature Identification Process for Canopy .................................................... 7
9 Canopy Showing Dashed Line Box when Docking a View to a New Location ........................... 9
10 Canopy showing selection and highlight in the Image Grid and List ........................................... 10
11 Creating Tags or Assigning Tags is Done through a Simple-to-use Tag Dialog .......................... 11
12 The Canopy Dashboard Summarizes the Project by Showing the Types of Files Extracted,
its Metadata and Some of the Top Themes Found in its Files ...................................................... 12
13 The List View Shows all the Files in a Project in a Sortable Tabular List ................................... 13
14 The Summary Summarizes All the Files in the Project and its Corresponding Tags and
Metadata........................................................................................................................................ 14
15 Text Galaxy Shows Common Topics Across All the Text Elements as Document Clusters ....... 15
16 The Image Grid Shows Image Thumbnails in a Horizontal Grid; Select an Image to Find
Related Images .............................................................................................................................. 16
18 The Arc Weld’s Outer Rings Represent the Abstract Structure Defined by the Data, while
the Inner Ring is a 1:1 Representation of the Elements and Files ................................................ 19
19 The Arc Weld Makes it Easy to Drill into Data to Get More Details ........................................... 20
20 Multiple Arcs are Open, Revealing More Details......................................................................... 20
21 Canopy with the Selection Preview Open on the Right ................................................................ 21
22 Preview Showing an Image, its Parents and Siblings, and Corresponding Metadata ................... 22
23 Video preview Showing Player Controls, Timeline, Parents and Sibling, and Corresponding
Metadata........................................................................................................................................ 23
24 Canopy Search Queries all Text Content, Metadata, and Tags in the Project .............................. 24
vii
Tables
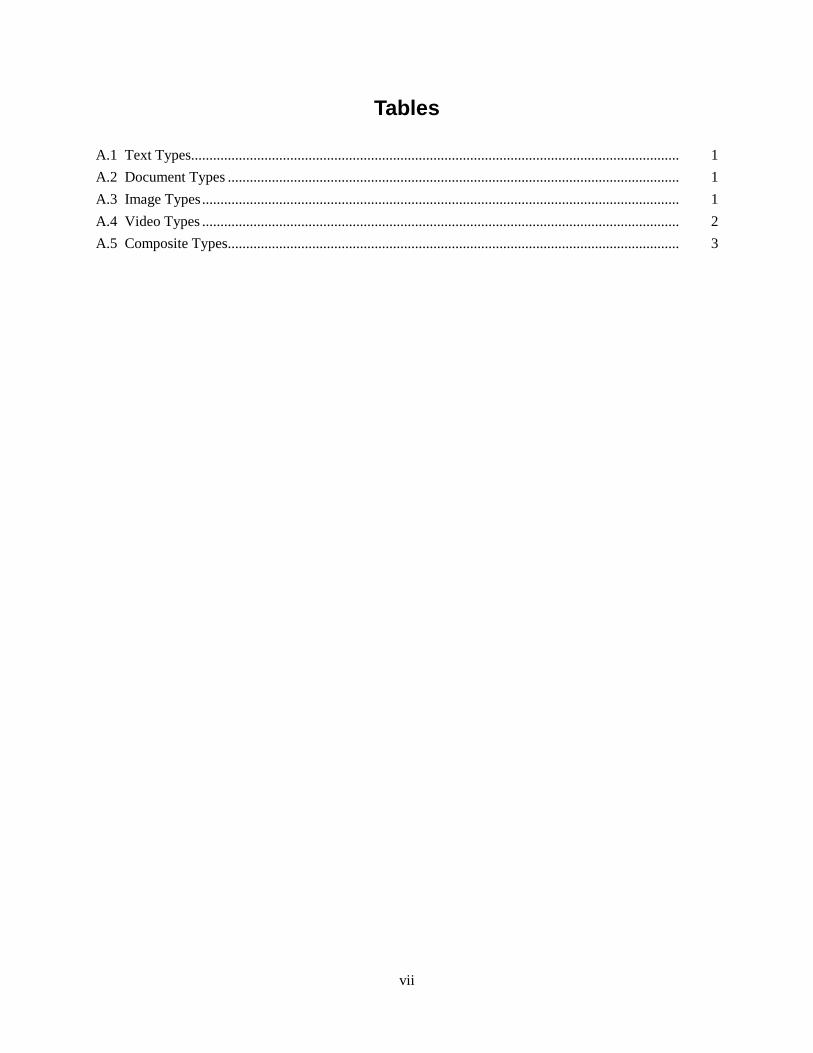
A.1 Text Types..................................................................................................................................... 1
A.2 Document Types ........................................................................................................................... 1
A.3 Image Types .................................................................................................................................. 1
A.4 Video Types .................................................................................................................................. 2
A.5 Composite Types ........................................................................................................................... 3


1
1.0 Getting Started
In this section, we will walk you through how to get started using Canopy from project creation, data
selection, import to project processing—essentially everything you need to begin using the visualizations
inside Canopy for true multimedia analysis.
1.1 Project Creation
Canopy organizes collections of files through projects. You can build projects around data sets,
sources, area of interest, analytic question, or any other organization method. When you first create a
project, it will show up as a folder, waiting for you to import content or files.
To create a new project, from the File menu select “New Project” or press Ctrl+N on the keyboard
(Figure 1). A new “untitled” project will be created in the project pane. You can type a name for your
project or just click enter to accept “untitled” for the project name. You can rename the project at any
time by selecting the project and then selecting “Rename Project” from the File menu (or right-click the
project name and select “Rename Project). It’s advisable at project creation to name the project
something that has meaning to you—Canopy does not limit the number of projects that you can create, so
your project list could get long.
Figure 1. Creating a New Project through the File Menu

2
1.2 Importing Data
Canopy works with a collection of files that must be imported into a project. These files can exist on
a share, document repository, or your hard drive. Canopy supports projects containing up to 30,000
extracted elements from imported media files. An element is text, images and video shots that Canopy
extracts from multimedia files, more about that later in this guide.
To import files, first select the un-processed project that you want to add files to in the Projects pane.
Next, from the File menu, click “Import Files…” (Figure 2) (or press Ctrl+0).
Figure 2. Importing Files into a project
You can also import entire directories or folders by selecting “Import Directory…”
A dialog box will open, allowing you to browse and select the files that you want to import into the
unprocessed project (Figure 3). You can select files from multiple directories, but you will have to import
from each directory separately.

3
Figure 3. Importing Files into a Project
1.2.1 File Types Supported
Canopy supports a variety of multimedia formats—PDF, Word, HTML, any video format supported
by FFMPEG, and any image format. A complete list of supported file types can be found in the appendix
of this document. Unsupported formats are still imported and represented in the Canopy application as
“UNKNOWN” types, but current visualizations will not show or support them analytically.
1.2.2 Adding More Files to a Project
You can continue to add files to a project as long as it hasn’t been processed. Processed projects are
locked when processing has been completed. To unprocess a project, see “Unprocessing a project”
below. Please remember that there is a limit of 30,000 elements per project; projects above that limit may
not perform optimally.
1.2.3 Project Import Summary
When files are imported, they are visually represented in the Dashboard view of the project
(Figure 4). Most of the Dashboard view is unavailable in an unprocessed project, and the file histogram
will significantly change during extraction (for details, see “Processing a project” below).

4
Figure 4. Dashboard View Showing Imported Files
You can also see a list of imported files by selecting “List” from the View menu. The List view is a
sortable tabular list of all the files imported (Figure 5). It can be sorted by Name, Type, and Size. You
can also do some preliminary tagging before processing to help organize the collection (see “Tagging”
below).
Figure 5. List View Showing Imported Files
5
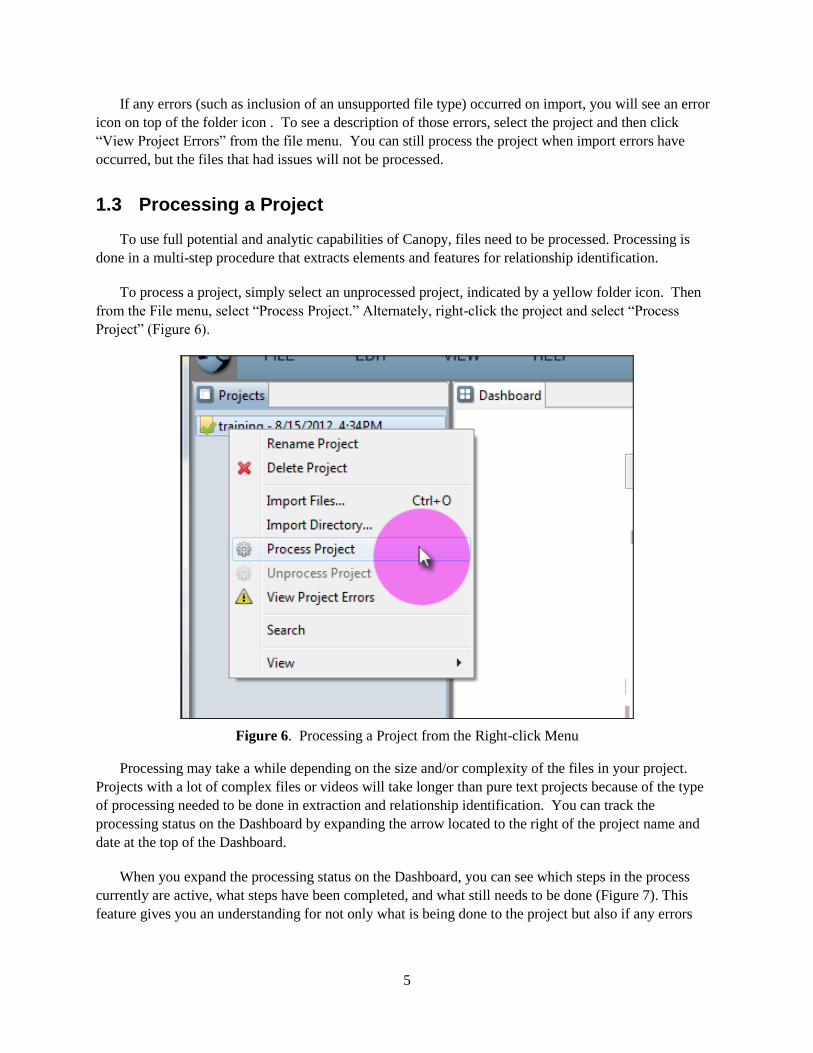
If any errors (such as inclusion of an unsupported file type) occurred on import, you will see an error
icon on top of the folder icon . To see a description of those errors, select the project and then click
“View Project Errors” from the file menu. You can still process the project when import errors have
occurred, but the files that had issues will not be processed.
1.3 Processing a Project
To use full potential and analytic capabilities of Canopy, files need to be processed. Processing is
done in a multi-step procedure that extracts elements and features for relationship identification.
To process a project, simply select an unprocessed project, indicated by a yellow folder icon. Then
from the File menu, select “Process Project.” Alternately, right-click the project and select “Process
Project” (Figure 6).
Figure 6. Processing a Project from the Right-click Menu
Processing may take a while depending on the size and/or complexity of the files in your project.
Projects with a lot of complex files or videos will take longer than pure text projects because of the type
of processing needed to be done in extraction and relationship identification. You can track the
processing status on the Dashboard by expanding the arrow located to the right of the project name and
date at the top of the Dashboard.
When you expand the processing status on the Dashboard, you can see which steps in the process
currently are active, what steps have been completed, and what still needs to be done (Figure 7). This
feature gives you an understanding for not only what is being done to the project but also if any errors

6
have occurred, at which step they occurred, and how long each step took. Because processing is very
complex, Canopy can’t accurately assess how long a project will take to process.
Figure 7. Processing Status on the Dashboard
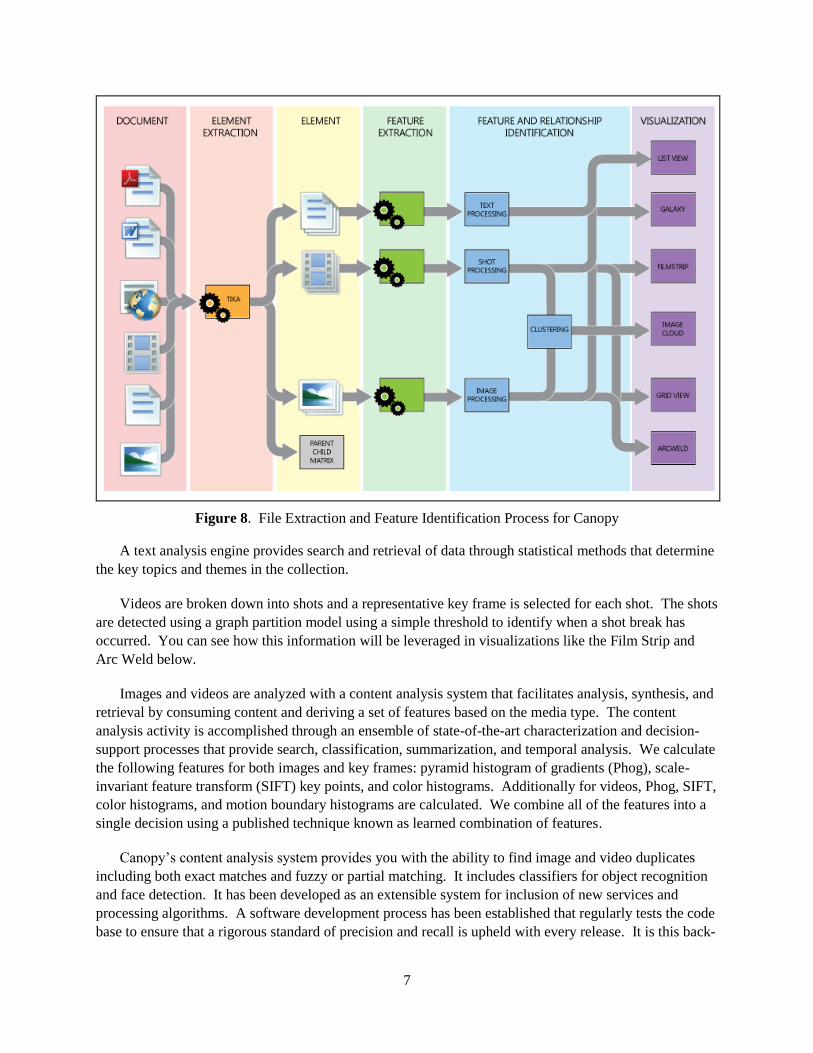
1.3.1 File Extraction and Feature Identification
Users submit multimedia documents in their original format: PDF, Word, HTML, any video format,
or any image format. The first step of Canopy’s extraction and feature identification process is to employ
the Apache Tika™ toolkit to detect and extract metadata, structured text, unstructured text, image, and
video content from documents (Figure 8). Canopy retains information about the source files of extracted
data, which is stored in a parent/child matrix. Canopy then applies type-specific analysis on the extracted
elements.
7
Figure 8. File Extraction and Feature Identification Process for Canopy
A text analysis engine provides search and retrieval of data through statistical methods that determine
the key topics and themes in the collection.
Videos are broken down into shots and a representative key frame is selected for each shot. The shots
are detected using a graph partition model using a simple threshold to identify when a shot break has
occurred. You can see how this information will be leveraged in visualizations like the Film Strip and
Arc Weld below.
Images and videos are analyzed with a content analysis system that facilitates analysis, synthesis, and
retrieval by consuming content and deriving a set of features based on the media type. The content
analysis activity is accomplished through an ensemble of state-of-the-art characterization and decision-
support processes that provide search, classification, summarization, and temporal analysis. We calculate
the following features for both images and key frames: pyramid histogram of gradients (Phog), scale-
invariant feature transform (SIFT) key points, and color histograms. Additionally for videos, Phog, SIFT,
color histograms, and motion boundary histograms are calculated. We combine all of the features into a
single decision using a published technique known as learned combination of features.
Canopy’s content analysis system provides you with the ability to find image and video duplicates
including both exact matches and fuzzy or partial matching. It includes classifiers for object recognition
and face detection. It has been developed as an extensible system for inclusion of new services and
processing algorithms. A software development process has been established that regularly tests the code
base to ensure that a rigorous standard of precision and recall is upheld with every release. It is this back-

8
end processing providing extraction, text analysis, and image and video analysis that empowers
multimedia analysis by connecting relationships across the various modalities
1.3.2 Unprocessing a Project
Once a project is processed, you cannot add files to it or remove files from it. It’s essentially locked
from additional file editing. If you want to add or remove files from a project, you first need to unprocess
it. Unprocessing a project is only available for those projects that have fully completed processing. To
unprocess a project, select the project and click “Unprocess Project” from the File menu. This will
remove all processing information, including extraction and relationship mapping. This unlocks the
project and allows you to add new files to it. To use the project for analysis and visualization, you will
need to process it again.
2.0 Workspace and Workflow
The Canopy workspace is a configurable environment with multiple views and visualizations that can
be opened, closed, and moved based on the current question you are asking or task you are performing.
Canopy supports many analytic activities like collection, summarization, read and extract, search, and
relationship insight through its workflow using window management techniques, selection scrubbing,
highlighting points of interest, and tagging.
As an example, say you are working predominantly with video content. You may want to use views
and visualizations that are video focused in combination with shot breakdowns and previews to do the
majority of your content and similarity analysis; however, during understanding and collection tasks, you
prefer the List, Summary, and Tagging features. Canopy allows you to easily customize the workspace to
use the views and visualization that best fit the analytic activity you are currently performing.
2.1 Window Management
Canopy lets you decide the best view placement and visualizations that suit your current activity or
task through simple drag-and-drop window management techniques commonly used in software today.
All views and visualizations can be accessed through the View menu. When you open a
visualization, it is placed in the top of the center view as a new tab. You can toggle through the tabs by
simply clicking the tab you want to see, and the most recently clicked tab will be moved to the top of the
stack.
Each view can be maximized to fill the full application or minimized to make room for the other
views. You can also close a view or visualization by clicking the “X” or close button at the right of the
tab.
To move a view or visualization to a new docked location, simply click and drag the tab for that view
or visualization on top of an existing view or edge of Canopy. When you drag on top of an existing view,
it will add it as a new tab. You can also dock to a new location by dragging to an edge in the application;

9
you will see a dashed box line illustrating where it will appear (Figure 9). Additionally, you can open a
new window by dragging the tab outside of Canopy.
Figure 9. Canopy Showing Dashed Line Box when Docking a View to a New Location
2.2 Selection
Selection is global across all views and visualizations inside Canopy—that is, selecting a file in one
view will automatically select it in another. This allows you to see how files co-occur in different
visualizations but also allows you to see different patterns and relationships based on the view or
visualization. Each view can be sorted and grouped in different ways, allowing the selection to be
interacted with differently.
Left-clicking any element or file in any of the visualizations performs selection. It will show up with
a blue stroke or blue shade on or around the selection. Blue is the common selection color inside Canopy.
You can add more files by holding down the control (Ctrl) key and clicking additional files. Ctrl-clicking
a previously selected file will deselect it. Holding down the shift key will select a string of files between
the first selection and the second.
For example, selecting a file in the Filmstrip shows you shots related to the selected shot. Seeing that
same selected shot in the Image Grid shows you how it relates to other shots and also images in your
collection. In the Image Grid, it can also be sorted by different attributes like color and faces; for more
information, see “Features” below.

10
2.3 Highlighting
Canopy can also globally highlight a file’s parent, child, and sibling relationships to give insight into
where other files are that were extracted from common documents (Figure 8). Select a file, in any
visualization, that was extracted from a complex document. From the Actions or Edit menu, select
“Highlight Parent,” “Highlight Children,” or “Highlight Siblings.”
Selecting “Parent” will highlight the original document in the List and Arc Weld visualizations;
parent documents don’t have a visual representation in many of the visualizations (Figure 10). Selecting
a child will highlight complex document files that were extracted during processing of the files. Selecting
siblings will highlight other files that were extracted, but this only works if the selection is also a child of
a complex document.
Figure 10. Canopy showing selection and highlight in the Image Grid and List
2.4 Tagging
Tagging is used as a method for grouping and collecting files and elements. Canopy has two forms of
tags: user-created and system-generated. These tags allow you to select files based on metadata or user-
created files to see relationships across the various visualizations inside Canopy.
User-created tags are a group of selected files that you manually annotate in order to group files of
interest. To tag a group of files, select the files of interest, and then right-click the selection (or from the
Edit or Actions menu) and click “Tag Selection.” In the resulting Tag File window, type the new “tag” in
the text box and click “Add” or select an existing tag in the tag cloud (Figure 11). Click “Save.” The files

11
will be added to the tag and in the Summary. Alternatively, you can select files from a tag by clicking a
tag in the Summary. The same interactions outlined in “Selection” apply with tags; Ctrl-click to select
more than one tag, etc.
Figure 11. Creating Tags or Assigning Tags is Done through a Simple-to-use Tag Dialog
A System-generated tag is metadata that is automatically pulled from the system level metadata from
each file by Canopy during processing. These tags contain file level objects like file size, author, creation
date and modification date. They also contain file type specific data like EXIF data and Canopy extraction
information like color and image cluster information. System-generated tags are not editable by the user
but can be used to aide in selection and additional grouping.
3.0 Features
Canopy contains multiple visualizations that both silo the media types and attempt to cross them
through selection, relationships, and highlighting of information context. Canopy has not achieved full
data fusion of multimedia, but the ability for users to see the data in its various views at the same time
allows them to bridge the various types of multimedia to derive relationships beyond the silos. In this
section, we will present the key Canopy visualizations and discuss their analysis strengths independently.
The following section will discuss how we bring these visualizations together to support analysis across
multimedia through comparison selection and co-occurrence. In these visualizations, Canopy enables you
to summarize the data and topics/themes as well as illustrate various relationships through similarity and
the context of the content.

12
3.1 Dashboard
The Dashboard is a summarization of the project (Figure 12). It’s a collection of information and
visualizations that break down and give you a high-level insight into what the project contains, its status,
and metadata about the project itself.
Figure 12. The Canopy Dashboard Summarizes the Project by Showing the Types of Files Extracted, its
Metadata and Some of the Top Themes Found in its Files
At the top of the Dashboard is a bar containing the project name, creation date, and process date. The
bar can be expanded to display the project’s processing status by clicking the arrow to the right. This is
especially useful to understand how long each step in the process took and if there were any errors or
problems in extraction.
The top left of the Dashboard contains information on the number of files imported, how many files
were extracted from those files, and a histogram that displays the various file types and the amount that
were extracted. This tells you how the project breaks down and can give you insight into what types of
multimedia you are dealing with in the analysis process.
The top right is a Tag Cloud displaying gray system-generated tags, which were extracted from the
files, and blue user-created tags. The metadata is information embedded in many files, such as dates,
authors, and camera types. The user-created tags are the same tags discussed earlier in the “Tagging”
section of this guide. The larger the term is in the Tag Cloud, the more files have the same tag. The Tag
Cloud is another way of summarizing the content within the project.
The lower left corner is reserved for a thumbnail version of the Text Galaxy that will be discussed
later. The Text Galaxy gives a macro view of how text content is associated and uses terms extracted
13
from each file as labels. Each dot represents a text document. Each label represents a term that is similar
to the documents clustered around it. The Text Galaxy on the Dashboard gives you a summarization of
the terms and the amount of documents that are related to that term inside your project. Clicking the Text
Galaxy on the Dashboard will open the full Text Galaxy visualization.
The lower right is an Image Cloud that summarizes the images found in your project. It behaves very
similar to the Tag Cloud in that it groups similar images together and presents you with a single image
that represents that cluster. The larger the image, the more images are represented by it. Clicking the
Image Cloud will launch the Image Grid visualization described below (Figure 16).
The various information and visualization components in the Dashboard are combined to give you an
overall summary of the project. Every time you open a project or switch to another project, the
Dashboard gives you insight into the project without having to open additional visualizations for that
information. If you create many projects, this will help you differentiate them from each other and
essentially preview the project before going into deeper analysis.
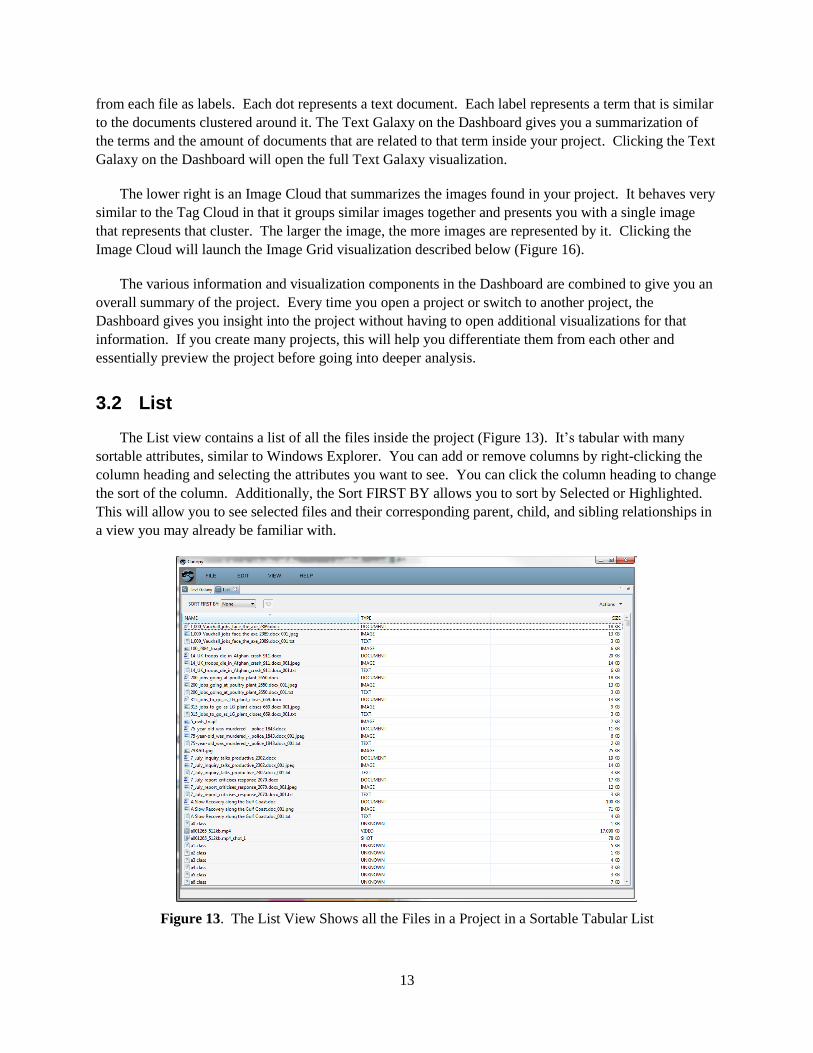
3.2 List
The List view contains a list of all the files inside the project (Figure 13). It’s tabular with many
sortable attributes, similar to Windows Explorer. You can add or remove columns by right-clicking the
column heading and selecting the attributes you want to see. You can click the column heading to change
the sort of the column. Additionally, the Sort FIRST BY allows you to sort by Selected or Highlighted.
This will allow you to see selected files and their corresponding parent, child, and sibling relationships in
a view you may already be familiar with.
Figure 13. The List View Shows all the Files in a Project in a Sortable Tabular List

14
Some files are not supported for Canopy processing. The List view is one of the only views that you
can use to see which files are not supported; they will be displayed as “UNKNOWN.” Although these
files may not have been extracted and cannot be viewed in Preview, they can still add analytic value in
context of the other files inside Canopy.
The List view is also one of the simplest tools in Canopy for finding a file by name, especially when
you know what the file is called, where it came from, or the type of file it is.
3.3 Summary
The Summary is similar to the Dashboard in that it summarizes the files, tags, and metadata of the
project by file or element count. It’s designed to be displayed next to other visualizations as a way of
saving and selecting elements during analysis. The top displays imported and extracted files and their
counts. The bottom displays user-created tags and system-generated tags extracted during processing.
The system-generated tags are grouped into categories for each type of metadata in an expanding list.
Each tag can be used with the other tags to add and remove selections inside Canopy and then retagged
and grouped as a collection for further analysis and exploration (Figure 14).
Figure 14. The Summary Summarizes All the Files in the Project and its
Corresponding Tags and Metadata
3.4 Text Galaxy
In the Text Galaxy visualization, dots represent elements that group around terms that represent
central topics, like constellations in the sky (Figure 15). Insight into the text information is gained
through the representation of the term clusters and how close the documents are to those clusters; the
more related to the terms the documents are, the closer they are to the terms center point. The terms are

15
extracted from the text content through algorithms that calculate the frequency and proportion of each
term in context of other terms in the document. Those terms are combined to become the labels in the
Text Galaxy.
Figure 15. Text Galaxy Shows Common Topics across All the Text Elements as Document Clusters
The term labels produced by Canopy can overwhelm the visualization by making it hard to see the
text elements. The Label Granularity slider was developed to allow you to control the number of labels
displayed. Slide the Label Granularity Slider from left to right to increase the number of labels, from
right to left to decrease them.
The files inside a Text Galaxy can overlap and become so dense that it’s hard to differentiate them.
The Text Galaxy is a zoomable user interface or ZUI. It works similar to many of the map applications
seen on the web; use the magnifying glass icons to zoom in and out. Use the hand icon to pan vertically
and horizontally.
Selection inside the Text Galaxy can be passed from other visualizations and views, or you can
manually select files of interest. Using the arrow cusor, you can select files by just clicking on them—
Shift-click adds more, while Ctrl-click adds and removes them. Use the rectangle icon to select multiple
areas of files. Selection is represented as a blue dot.
Highlighting of parent, children, and siblings can be done in the Text Galaxy as well by simply
selecting Highlight Parents, Highlight Children or Highlight Siblings from the Actions menu. Highlight is
represented as a yellow dot. Highlighting can be passed from other visualizations and give insight on text
topics used in documents that contain images; see below under “Tips and Tricks.”
The Text Galaxy is a proven visualization for representing text relationships through topic clusters.

16
3.5 Image Grid
The Image Grid represents the images in the data using thumbnails for display in a horizontal grid.
Images can be directly imported or extracted from multimedia sources such as video and complex
documents like PDFs (Figure 16). The grid can be sorted by various attributes of the data such as File
Name, Size, and Color as well as derived and extracted relationship data computed with in Canopy. You
can summarize the data through the sort capabilities, but the real power of the grid is in the illustration of
similar or related images through selection. When an image is selected, the grid highlights other images
that are related in the grid—as an example; an image of a seagull over water could highlight other images
of seagulls or water. The visual relationships shown in the Image Grid are calculated by Canopy’s
content analysis system based on several image feature extraction/detection techniques.
Figure 16. The Image Grid Shows Image Thumbnails in a Horizontal Grid; Select an Image to Find
Related Images
Click and drag inside the Image Grid to move it left to right. You can also click the “<” key to slide it
left and click the “>” to slide it right.
Directly above the Image Grid is a heads-up display (HUD) that operates like a traditional horizontal
scroll bar. Color hash marks are displayed on the bar indicating where related and highlighted files
reside, along with an indication of where the current view is located. As you move up and down the Grid,
the HUD slides to display the current view. You can also click directly on the HUD to jump to that
location.
You can sort the Image Grid by many different attributes using the Sort drop-down list at the top of
the visualization. File Size is an interesting sort as it moves the small logo, transparent gif, and other web
“junk” images to the far right of the visualization. Color is effective when you want to see images
grouped by their predominant color; from left to right, it cycles through the rainbow. Sorting by Faces

17
Detected is interesting when you are looking for images with headshots or crowds of people. You also
can sort by related and highlighted. Sorting by related sorts selected first, followed by related, and then
by the least related. Sorting by highlighted moves the siblings, parents, and children after the selected
images. If you select more files after applying these sorts, the Refresh button becomes active, allowing
you to move new selected, related, and highlighted with the rest of the sort.
The Image Grid contains both images and shot thumbnails that were extracted during the import
process. Shots are marked with a small video icon overlaid on the thumbnail. Shots are described below
in “Filmstrip.”
Selection works the same in the Image Grid as it does in the other views and visualizations. Clicking
an image selects it and outlines it in blue. Shift-click adds more files, and Ctrl-click toggles the selections
on and off.
Related images to a selection are outlined in white. Images can be related by a number of attributes
like texture, color, shape, and number of faces. Related images have varying degrees of “relatedness”;
some are direct matches or very similar, while others have less in common. The Relationship slider at the
top of the Image Grid is a common interaction metaphor across a number of visualizations and can be
used to control the amount of related content shown. It essentially allows you to filter the amount of
related content to just the most or least in common. Images in Canopy, even in small projects, can have
extremely large sets of related content. The slider shows a spark line illustrating where the least to most
related images fall from left to right respectively. You can use that spark line to find peaks or edges in the
amount of related files. You also can slide the slider from left to right to see only the most related files.
You can change the amount of files shown by dragging the edges of the slider together or apart.
The Image Grid gives focus and insights on images in a project by allowing you to quickly see
images in thumbnail form, sorted by various attributes, and then see how they are related.
3.6 Filmstrip
The Filmstrip view visualizes each video through equal time segment thumbnails and sorts them
vertically by various attributes, such as title, size, and length (Figure 17). This thumbnail view provides
you with a quick synopsis of each video without having to watch the entire video. We strengthen this by
extracting shots and displaying them in the timeline visualization below each video strip—the longer the
segment, the longer the shot in the video. Each shot can be selected and related shots are highlighted in
the visualization. Relationships are extracted similar to relationship extraction in the Image Grid but are
an aggregate of the images in each shot. The ability to sort, select, and compare videos in a timeline and
in thumbnail gives you powerful analytic capabilities to summarize and find similar shots and videos.

18
Figure 17. Image Grid Showing Equal Time Segment Images Above the Shot Timeline
On the right side of the Filmstrip is a HUD that operates like a traditional vertical scroll bar. Color
hash marks are displayed on the bar indicating where related and highlighted files reside along with an
indication of where the current view is located. As you move up and down the Filmstrip, the HUD slides
to show the current view. You can also click directly on the HUD to jump to that location.
The Filmstrip, similar to the Image Grid, is sortable by many different attributes through the Sort
drop-down list at the top of the visualization including video size and length. You also can sort by
related, which sorts selected first followed by related, and then by least related. If you select more files
after applying these sorts, the Refresh button becomes active, allowing you to move new selected, related,
and highlighted videos with the rest of the sort.
Selection works the same in the Filmstrip as it does in the other views and visualizations. Clicking a
shot selects it and outlines it in blue. Shift-click adds more files, and Ctrl-click toggles the selections on
and off. You can’t select the image-based time segments, only their shots as defined on the timelines.
Related shots to a selection are outlined in white on the timeline. Just like images in the Image Grid,
shots can be related by a number of attributes like texture, color, and shape. Related shots have varying
degrees of “relatedness.” Use the Relationship slider at the top of the Filmstrip to control the amount of
related content shown. The slider shows a spark line illustrating how related all the shots are in the
project from least to the most related. You can change the amount of files shown by dragging the edges
of the slider together or apart. Dragging the slider to the left will highlight less related shots; dragging it
to the right will highlight more related shots.
The Filmstrip summarizes video information in easy-to-read time segment images and an extracted
shot timeline. The Filmstrip also gives insight through power sorting and shot similarity capabilities.

19
3.7 Arc Weld
The Arc Weld view is one of our first attempts at displaying all media types in the same visualization.
It is based on previous research on radial visualizations where multiple relationships span diverse
categories of data using curve weighted lines and abstracted graph representations similar to pie diagrams
(Figure 18). The Arc Weld provides an overview of relationships among all of the modalities of a project.
Each segment or Arc of the radial visualization represents a corresponding sortable structure to the data
such as media type or file name. The outer rings represent the abstract structure defined by the data. The
inside ring is a 1:1 representation of the elements and files themselves.
Figure 18. The Arc Weld’s Outer Rings Represent the Abstract Structure Defined by the Data, while the
Inner Ring is a 1:1 Representation of the Elements and Files
The Arc Weld makes it easy to drill into the data within the visualization to gather more detail by
opening Arcs into their own nodes (Figure 19).

20
Figure 19. The Arc Weld makes it Easy to Drill into Data to Get More Details
This breaks larger segments into smaller ones but also gives more real estate for additional
relationship lines. The more nodes or Arcs that are opened, the more detail can be represented into the
elements, their parents, and the relationships between the files (Figure 20).
Figure 20. Multiple Arcs are Open, Revealing More Details

21
The Arc Weld is a zoom-able user interface similar to the Text Galaxy. You can zoom and pan using
the mouse and mouse wheel or leverage the magnifying glass icon at the top left of the visualization.
Click and drag left, right, up, and down in the grey area to pan the visualization.
Selection is similar to the other visualizations inside Canopy. Selected segments are blue, related are
white, and highlighted are yellow. When nothing is selected in the Arc Weld, the relationship lines are
high-level relationships set by the slider. However, when a selection is made or passed into the
visualization, the relationship lines are more detailed and specific to the selected elements.
The Relationship slider applies to the Arc Weld with the same interaction and rules from the Image
Grid and the Filmstrip. Sliding the slider from right to left will show lines for more similar content, while
right to left will show less similar content.
The Arc Weld visualization uses all the modalities in the multimedia content of your project. It will
cross the boundaries of the media silos by showing similarities between the files and highlighting parent,
child, and sibling relationships.
3.8 Selection Preview
Every selection made in Canopy can be seen in the Selection Preview (Figure 21). The Selection
Preview works as a temporary collection, giving you a small thumbnail of everything you select. This is
extremely powerful for those visualizations that don’t have a preview like the Text Galaxy and Arc Weld.
Figure 21. Canopy with the Selection Preview Open on the Right
The top of the Selection Preview summarizes the type of content selected and its corresponding tags.
You can also refresh the selection to force Canopy to update the Preview.

22
Combine the Selection Preview with Canopy’s Tagging capability and you can quickly tag and view
previous tags in easy-to-understand thumbnails representing the files of the project.
3.9 Preview
The Preview works in conjunction with the Preview Selector and allows you to see a larger preview
of the file, its metadata, and its children, siblings, and parents (Figure 22). You can use the Preview to
read text documents, view images, and watch videos without leaving Canopy (Figure 23).
Figure 22. Preview Showing an Image, its Parents and Siblings, and Corresponding Metadata

23
Figure 23. Video preview Showing Player Controls, Timeline, Parents and
Sibling, and Corresponding Metadata
Preview has three views: Preview, Element Gallery, and Metadata.
Preview shows a scalable full size version of what is currently selected and active. Player controls
and a shot timeline similar to the Filmstrip visualization are displayed when a Video has been selected for
Preview.
The Element Gallery shows the other extracted elements from the same parent file. The first element
in the gallery will be the parent followed by its children. The active element or file will be 100% opaque
while the others are grayed out. In the case of a video, the Element Gallery shows a thumbnail for every
shot extracted (Figure 24). You can select other elements from the gallery to preview without effecting
the Canopy selection.

24
Figure 24. Canopy Search Queries all Text Content, Metadata, and Tags in the Project
The Metadata shows file and element specific metadata like imported and modified date, author, size,
and EXIF data for images. The metadata also shows the hash code for the element.
The Preview is used to see more detailed information at the file and element level. One of its more
powerful features is that it allows you to review all extracted thumbnails based on the parent file.
3.10 Search
Canopy’s Search capability makes a selection based on a text query. To open Search, from the File
menu, select “Edit” (Figure 24). Enter your search term in the Search text box and click Search to query
against all the text content, metadata, and tags in the project you are working in. You can enter multiple
terms by using commas to differentiate them.
Search on its own is a powerful tool for finding text content of interest in the documents of a project.
Combine that with the ability to highlight parents, children, and siblings and you can potentially find
images that also match the query through the context of the text content.
4.0 Tips and Tricks
Canopy contains views and visualizations that allow you to organize your analysis and tasks into
projects. You can do basic operations such as create, open, edit, rename and delete projects or, for more
complex operations, use visualization combinations like Arc Weld and Image Grid to solve a critical

25
problem. For a good place to start, watch the “How to Videos.” In Canopy, from the Help menu, select
“Videos.” Other suggested tips and tricks are below:
4.1 Docking and undocking views
Canopy views and visualizations can be docked and undocked to assist you with easier analysis of the
data. To undock a view from Canopy, simply click the icon of a view like the Image Grid and drag it out.
When Canopy is closed and a new session is started, the Image Grid will be docked in its default position.
4.2 Unprocessing Projects
Unprocessing projects can be useful if you’d like to import additional files to an existing project. To
unprocess a project, right-click the project and select “Unprocess Project” or select the project and from
the File menu select “Unprocess Project.”
4.3 Canopy Server Administration Tool
A Canopy Server Administration Tool is available for system administrators to use for monitoring
and managing user-created projects. To launch the administration tool, open a browser and enter your
Canopy server’s URL (for example, https://servername:port/canopyadmin).
4.4 Visualization Combinations
Arc Weld and Image Grid – Undock the Image Grid (click the Image View icon)and place it beside the
Arc Weld to help you visually compare relationships in the project through arcs, relationship lines, and
image thumbnails. Selected and related images are abstracted but easily understood in the Arc Weld,
while images themselves are easily understood in the Image Grid. The two visualizations combined work
together through selection scrubbing and in context of parent, children, and sibling relationships.
Arc Weld and Filmstrip – Similar to the Arc Weld and Image Grid combination described above,
place the Filmstrip and Arc Weld side by side to gain additional insight into the files of your project. The
Filmstrip visualization shows the time and shot structure through previews and timelines. The Arc Weld
shows the relationships those shots have across multiple videos through relationship lines. The two
combined give you easily understood relationship lines for many-to-many relationships and shot preview
images that are easily scanned for better pattern awareness visually and temporally.
5.0 Troubleshooting
Current file sizes for Canopy are limited to a maximum of 30,000 elements where the elements can be
text elements (text documents and text extracted from compound documents); image elements (image
files and images extracted from compound documents), and videos with shots (shots are the extracted
elements from videos where one shot is a contiguous set of frames filmed with a single camera
without pausing). Use of the system beyond this is not supported and may cause unpredictable
behavior.

26
A client cannot connect to a server that does not have a hostname in DNS (or a local host file). The
protocols used within the server will cause it to send its name back to the client, and the client must
be able to resolve this name in order to complete the handshake process between the client and server.
Depending on network configurations, this could also cause issues if the client tries to connect to the
server using the server’s IP address, because the server will answer with its name, and the client must
be able to resolve the name. For more information, ask your PNNL contact for the Canopy Client
Admin Guide.
For installation help, ask your PNNL contact for the Canopy Installation Guide.

1
- File Format
This appendix lists the file types supported in Canopy. We are continually adding to this list, so your
version of Canopy may support more files than the ones listed below.
Table A.1. Text Types
File Extension Friendly Name Mime Type
txt, text, conf, def, list, log, in plain text text/plain
Table A.2. Document Types
File Extension Friendly Name MimeType
csv comma dillineated text/csv
doc, dot Microsoft word formats application/msword
docx Microsoft word formats application/vnd.openxmlformats-
officedocument.wordprocessingml.doc
ument
docm Microsoft word formats application/vnd.ms-
word.document.macroenabled.12
dotx Microsoft word formats application/vnd.openxmlformats-
officedocument.wordprocessingml.tem
plate
xps Microsoft word formats application/vnd.ms-xpsdocument
htm, html web page text/html
pdf Acrobat application/pdf
rss really simple syndication file application/rss+xml
rtf rich text file application/rtf
xml, xsl, xsd XML markup application/xml
eml, mime, mht, mhtml web page message/rfc822
xhtml, xht web page application/xhtml+xml
ppt, pps, pot Microsoft Power Point formats application/vnd.ms-powerpoint
pptx Microsoft Power Point Open Office
XML
application/vnd.openxmlformats-
officedocument.presentationml.presenta
tion
Table A.3. Image Types
File Extension Friendly Name MimeType
gif graphics interchange format image/gif
jpg, jpeg, jpe, jif, jfif, jfi image file format image/jpeg
bmp, dib bitmap image image/x-ms-bmp
ai, ps, eps, epsf, epsi encapsulated postScript (illustrator) application/postscript
raw, rw2 camera raw data file image/x-raw-panasonic
pcx image format image/x-pcx
png poratble network graphic file image/png
tif, tiff aldus tagged image file format image/tiff
pic, pct image format image/x-pict

2
File Extension Friendly Name MimeType
psd Adobe Photoshop Bitmap file image/vnd.adobe.photoshop
ico Microsoft Icon image/x-icon
pbm Portable Bitmap Format image/x-portable-bitmap
pgm Portable Graymap Format image/x-portable-graymap
ppm Portable Pixmap Format image/x-portable-pixmap
crw, cr2 Cannon Digital Camera Raw Image
Format
image/x-raw-canon
orf Olympus Digital Camera Raw Image
File
image/x-raw-olympus
raf Fuji CCD-RAW Graphic File image/x-raw-fuji
x3f Sigma Camera RAW Picture File image/x-raw-sigma
mrw Sony (Minolta) Raw Image File image/x-raw-minolta
xbm X Windows system bitmap image/x-xbitmap
xcf GIMP image image/x-xcf
Table A.4. Video Types
Canopy currently supports all FFmpeg types as seen here: http://ffmpeg.org/general.html#Video-Codecs
File Extension Friendly Name MimeType
3gp 3gp2 format video/3gpp
3g2 3gp format video/3gpp2
h261 raw H.261 video/h261
h263 raw H.263 video/h263
h264 Raw H.264 video/h264
jpm ,jpgm video/jpm
mj2, mjp2 video/mj2
mp4, mp4v, mpg4 video/mp4
mpeg, mpg, mpe, m1v, m2v video/mpeg
ogv video/ogg
qt, mov video/quicktime
flc video/x-flc
fli video/x-fli
flv video/x-flv
m4v raw MPEG-4 video format video/x-m4v
asf, asx video/x-ms-asf
wm video/x-ms-wm
wmv Windows Media video/x-ms-wmv
wmx video/x-ms-wmx
wvx video/x-ms-wvx
avi video/x-msvideo
movie video/x-sgi-movie
rm Real Media application/vnd.rn-realmedia

3
Table A.5. Composite Types
File Extension Friendly Name Mime Type
zip zip file application/zip
tgz, gz, -gz, emz gzip application/x-gzip
bz, tbz bzip application/x-bzip
bz2, tbz2, boz bzip2 application/x-bzip2
ar Archive application/x-archive
cpio cpio application/x-cpio
gtar GNU Tar application/x-gtar
tar TAR (tape archive) application/x-tar
jar Java Archive (JAR) application/java-archive